Ryerson University Ted Rogers School of Management€¦ · student at Ryerson University. He has...
32
Ryerson University Ted Rogers School of Management Goodman Gold Challenge
Transcript of Ryerson University Ted Rogers School of Management€¦ · student at Ryerson University. He has...

Ryerson University
Ted Rogers School of Management
Goodman Gold Challenge

Team
2
Dmitry Zaytsev
Jacob Newman is a 3rd year economics and finance student. He has internship experience in Private Wealth Management and as a Data Analyst. Jacob is currently the President of the Ryerson Investment Group and covers the Consumer Staples & Discretionary sector. He enjoys camping and playing hockey and golf on his spare time.
George Tasevski Jacob Newman Adrian Parisotto
George Tasevski is a 3rd year finance student at Ryerson University. He has internship experience in financial advisory as well as capital markets and is actively involved with the Ryerson Investment Group, student run buy-side fund where he presently serves as Portfolio Manager.
Dmitry Zaytsev is a final year student. He has interned as analyst in a boutique investment bank, in structured finance at a credit rating agency and most recently, he worked as Treasury at a senior gold producer. He leads the Ryerson Investment Group as the fund’s Chief Strategy Officer.
Adrian Parisotto is a 3rd year Finance & Marketing student. He has internship experience as an Investment Banking Analyst, and as a Financial Analyst. He is also involved with the Ryerson Investment Group where he is an Analyst within the Metals & Mining sector. Adrian has played competitive hockey for 17 years.

Presentation Outline
3
•Case and Company Overview
• Industry Analysis
•Macroeconomic Analysis
•Comparable Analysis
•Valuation

4
Risk AverseDisciplined, Stable Cash Flows, Mid-Large Cap
Long Term HorizonCompounded Value, Proven Business Model, Long Mine Life
GovernanceSeasoned Executive Team, Environmental Sustainability
Goodman Pension Fund Overview

Company Overview
5
0%
50%
100%
150%
200%
250%
300%
350%
400%
450%
January February March April May June July August September October November December January
12 Month Share Price Performance
111%
331%
369%
Performance as of February 17th, 2017 2017
Company Overview Industry Analysis Macro Analysis Comparable Analysis Valuation Conclusion

Recommendation: Detour Gold TSX: DGC Price Target:$23
6
Simulated 1 Year Simulated Stock Price
Market Data Class AClosing Price (February 15, 2017) CAD 17.07
Market Cap ($bn) $3.04
Shares Outstanding (mm) 174.55
Average Daily Volume 1,414,371
Enterprise Value ($mm) $3.26
52 Week High $35.93
52 Week Low $15.36
$21.06
$7.10
$36.21
$0
$10
$20
$30
$40
12/11 05/13 09/14 01/16 06/17
DGC Price Median low High
Source: Company Filings, Company Bloomberg
70%/$24
30%/$20
NAV
Multiples
Company Overview Industry Analysis Macro Analysis Comparable Analysis Valuation Conclusion

DGC Company Overview
7
P&P – West Detour Mine
Second-largest Canadian intermediate gold producer
Founded in 2006 by former CEO Hunter Dickinson
Focus on gold production and exploration activities in Northeastern Ontario
Largest gold reserves among the producing Canadian gold mines
Currently constructing the Detour West Lake Mine
Dedicated to responsible mining and growing cash flows organically
123
4
5
6
Entity’s Structure
Source: Company Filings, Company Bloomberg
Detour Gold Corp
Trade Winds Venture, Inc.
PDX Resources, Inc.
4%
96%
Proven
Probable
Overview Summary P&P – Detour Lake Mine
20%
79%
1%
Proven
Probable
Stockpiles
Company Overview Industry Analysis Macro Analysis Comparable Analysis Valuation Conclusion

DGC Company Overview Cont’d
8Source: Company Filings, Company Bloomberg
EBITDA GrowthAsset Breakdown
Cost of Revenue (Millions of USD)
$154
$536 $563$661 $711
$0
$200
$400
$600
$800
2013 2014 2015 2016E 2017E
Revenue Growth (Millions of USD)
$165
$541 $550 $528 $550
$0
$200
$400
$600
2013 2014 2015 2016E 2017E
-$32
$113$142
$223 $232
-$50
$0
$50
$100
$150
$200
$250
2013 2014 2015 2016E 2017E
Detour Lake Mine
West Detour Mine
Company Overview Industry Analysis Macro Analysis Comparable Analysis Valuation Conclusion

Governance: Environmental Sustainability
Full Time Employees
797Wages Paid
78MDonated to Hospitals
1.5MSpent on ON Businesses
220MAboriginal Employment Rate
24%
Mining Essentials Program, Women in Mining, Aboriginal Economic Development
No process water was discharged to the environment in the 3 years of operation
Proven land management practices to help minimize land disturbance
Leading The Way leadership program
Source: Company Filings, Company Bloomberg
Company Overview Industry Analysis Macro Comparable Analysis Valuation Conclusion
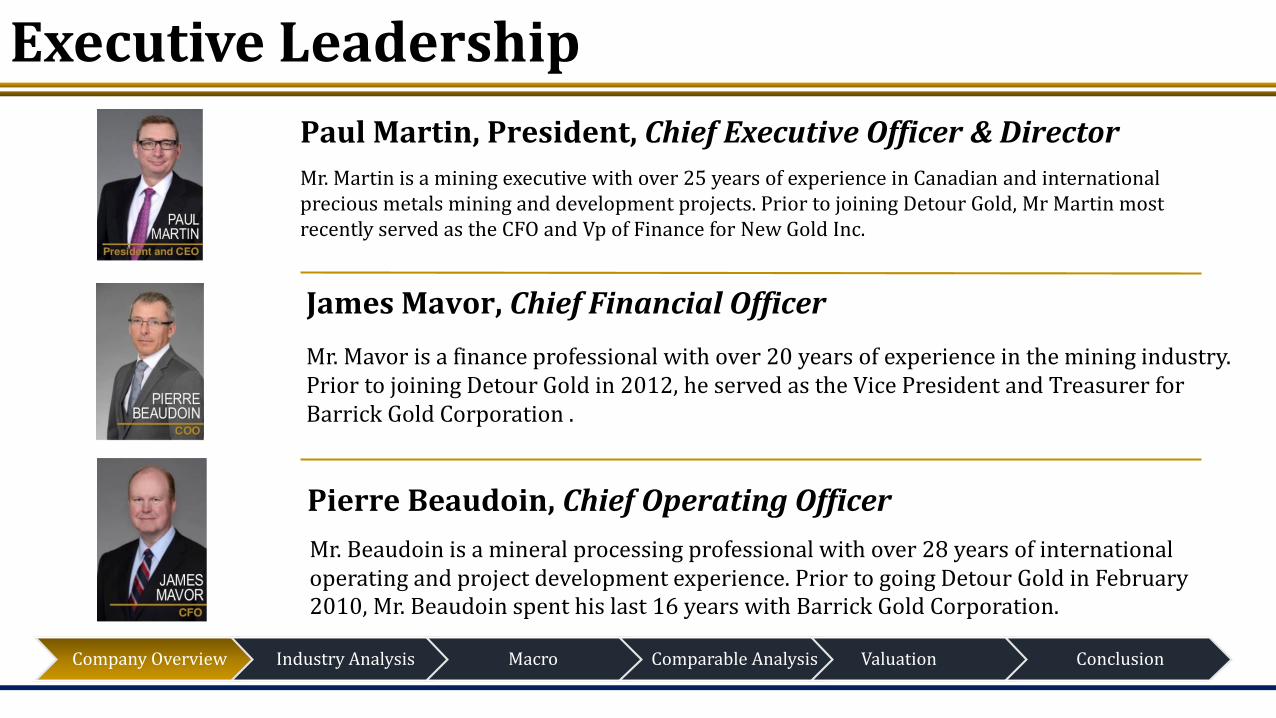
Executive Leadership
Paul Martin, President, Chief Executive Officer & Director
Mr. Martin is a mining executive with over 25 years of experience in Canadian and international precious metals mining and development projects. Prior to joining Detour Gold, Mr Martin most recently served as the CFO and Vp of Finance for New Gold Inc.
James Mavor, Chief Financial Officer
Mr. Mavor is a finance professional with over 20 years of experience in the mining industry. Prior to joining Detour Gold in 2012, he served as the Vice President and Treasurer for Barrick Gold Corporation .
Pierre Beaudoin, Chief Operating Officer
Mr. Beaudoin is a mineral processing professional with over 28 years of international operating and project development experience. Prior to going Detour Gold in February 2010, Mr. Beaudoin spent his last 16 years with Barrick Gold Corporation.
Company Overview Industry Analysis Macro Comparable Analysis Valuation Conclusion

11
Industry Overview

Industry Overview
12
800
1000
1200
1400
1600
1800
2012 2013 2014 2015 2016AISC Gold Price
Gold Price vs AISC
NYSE Arca GDM: Net Debt Per Share
Gold Asset Acquisition
Cost Cutting
Asset Divestment
B/S Repair
Key Industry Themes
1.1
1.2
1.3
1.4
1.520
30
40
50
60
70
Feb-15 Oct-15 Jun-16
Crude Oil (WTI) USDCAD
Canadian Dollar & Crude Oil
Company Overview Industry Analysis Macro Comparable Analysis Valuation Conclusion
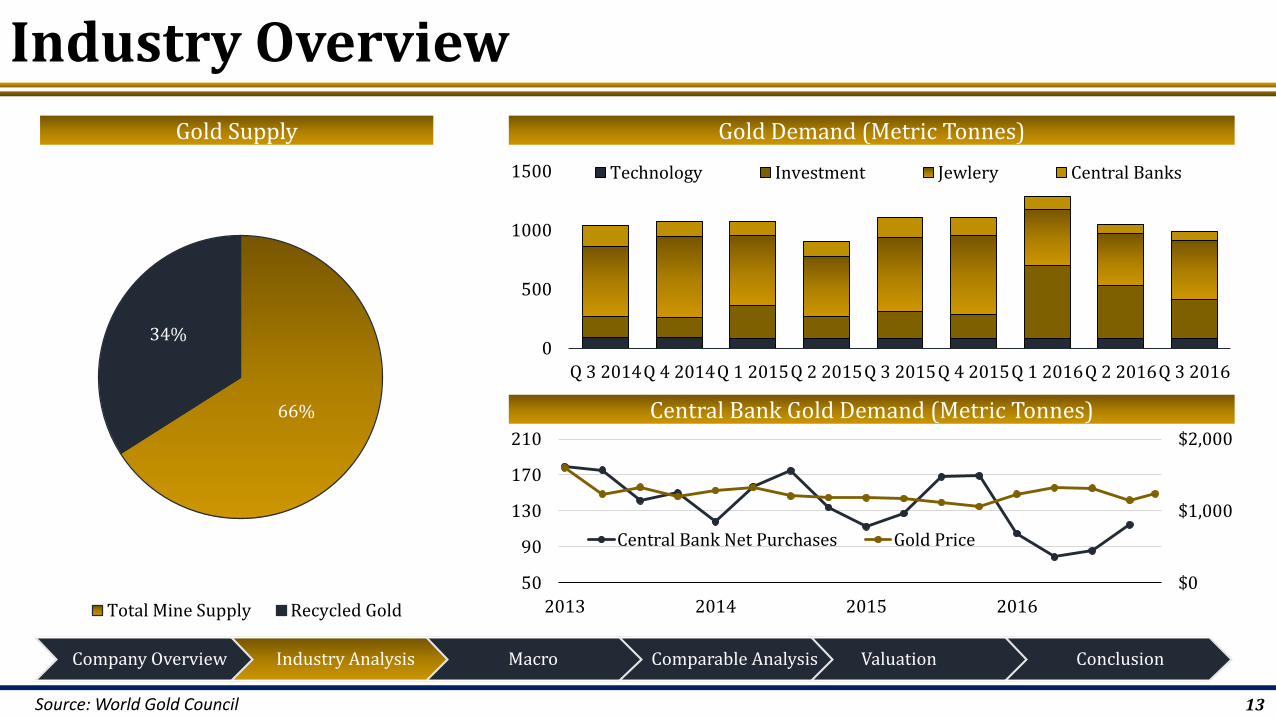
Industry Overview
13
66%
34%
Total Mine Supply Recycled Gold
Gold Supply Gold Demand (Metric Tonnes)
0
500
1000
1500
Q 3 2014Q 4 2014Q 1 2015Q 2 2015Q 3 2015Q 4 2015Q 1 2016Q 2 2016Q 3 2016
Technology Investment Jewlery Central Banks
Source: World Gold Council
$0
$1,000
$2,000
50
90
130
170
210
2013 2014 2015 2016
Central Bank Net Purchases Gold Price
Central Bank Gold Demand (Metric Tonnes)
Company Overview Industry Analysis Macro Comparable Analysis Valuation Conclusion

Industry Overview
14
Quarterly Global Jewelry Demand (Tones)
624
844
639613617590595
679
599
516
621653
478449
492
622
400
500
600
700
800
900
03
/13
06
/13
09
/13
12
/13
03
/14
06
/14
09
/14
12
/14
03
/15
06
/15
09
/15
12
/15
03
/16
06
/16
09
/16
12
/16
3,1143,0512,8692,8412,7402,6132,4302,4992,4962,5622,5042,6312,6252,6462,6202,6022,5742,5282,3752,2912,2852,2912,2372,162
201420132012201120102009200820072006200520042003200220012000199919981997199619951994199319921991
Gold Supply Mine Production (Tonnes)
Source: World Gold Council
Company Overview Industry Analysis Macro Comparable Analysis Valuation Conclusion
M&A/IPO Volume
700
550
395
480
28
2018
21
15
20
25
30
350
450
550
650
750
2013 2014 2015 2016
IPO
Vo
lum
e
M&
A V
olu
me
M&A IPO

15
Macro Analysis

Near Term Catalysts
16
$0
$200
$400
$600
$800
$1,000
$1,200
$1,400
$1,600
$1,800
$2,000
0
20
40
60
80
100
120
2007 2009 2011 2013 2015
Mil
lio
ns
of
Go
ld t
roy
ou
nce
s
Total Gold ETF Holdings Gold COT Disaggregated Gold Price [RHS]
Bull
Bear
Bull?
Net Short
Source: Bloomberg, CFTC
Gold Financial Flows New Bull Market?
Source: Bloomberg, CBT
Company Overview Industry Analysis Macro Analysis Comparable Analysis Valuation Conclusion

17
$1,000
$1,050
$1,100
$1,150
$1,200
$1,250
$1,300
$1,350
$1,4000.0%
0.5%
1.0%
1.5%
2.0%
2.5%
January-15 July-15 January-16 July-16 January-17
Fed Funds Rate Expected Fed Funds Rate at End of 2017 Expected Fed Funds Rate at End of 2018 Gold
1 Hike
4 Hikes
3 Hikes
2 Hikes
Near Term Catalysts
Fed Rate Hike Path & Gold
Company Overview Industry Analysis Macro Analysis Comparable Analysis Valuation Conclusion

Near Term Catalysts
18
$1,100
$1,150
$1,200
$1,250
$1,300
$1,350
$1,400
0.2%
0.4%
0.6%
0.8%
Feb-16 Jul-16 Dec-16
French-German 10 year spread GoldFed Meeting
French Political Risk
$1,000
$1,100
$1,200
$1,300
$1,400
-1
-0.5
0
0.5
1
Jan-16 Apr-16 Jul-16 Oct-16 Jan-17
3 Week Correlation Gold
Trump Frexit?
Brexit
Gold & European Political Risk Gold & Real Rates Diverge
$1,000
$1,100
$1,200
$1,300
$1,400-1
-0.5
0
0.5
Feb-16 May-16 Aug-16 Nov-16 Feb-17
Inve
rted
Rea
l yie
ld
5Y US Treasury Note Real Yield Gold
Real Rate & Gold Divergence
Company Overview Industry Analysis Macro Analysis Comparable Analysis Valuation Conclusion

Long Term Macro
19
0
0.25
0.5
0.75
1
-5
-2.5
0
2.5
5
7.5
19
67
19
72
19
77
19
82
19
87
19
92
19
97
20
02
20
07
20
12
Stagnant Real Productivity Growth US Budget
US Federal Debt cost will NEVER get cheaper
7000B
12000B
17000B
22000B
0
2
4
6
2005 2007 2009 2011 2013 2015 2017 US
Fe
de
ral
De
bt
Pu
bli
c D
eb
t IR
US Weighted Average Interest Rate US Public Debt
1000B
2000B
3000B
4000B
5000B
6000B
202120112001199119811971
Discretionary Mandatory Net Interest
Higher Gold Price
Financial Inevitability
Stagnant Productivity
Lack of Political Wall
Inevitable Higher Prices
Company Overview Industry Analysis Macro Analysis Comparable Analysis Valuation Conclusion

Comparable Analysis
20
• Single Asset Mine Producer • Diversified Asset Mine Producer
• Non-Producing Assets
• Gold Producer • Gold & Copper Producer • Mineral Exploration
• Northern Ontario• Canada, Serbia, Bulgaria,
Namibia• Northern Ontario & Quebec
Ass
ets
Spe
csSi
tes
Company Overview Industry Analysis Macro Analysis Comparable Analysis Valuation Conclusion

Comparable Analysis Cont’d
21Source: Company Filings, Company Bloomberg
Gold Reserves Among Peers (M Oz)
16.3 15.9
24.9
7.713.5
0.0
10.0
20.0
30.0
DetourGold
SEMAFO YamanaGold
EldoradoGold
IAMGOLD New Gold
21.3
5.9
55.9
47.0
35.8
20.7
0.0
10.0
20.0
30.0
40.0
50.0
60.0
DetourGold
SEMAFO YamanaGold
EldoradoGold
IAMGOLD New Gold
Gold Resources Among Peers (M Oz) Free Cash Flow / Total Debt
-100.0%-50.0%
0.0%50.0%
100.0%150.0%200.0%250.0%
DetourGold
SEMAFO YamanaGold
EldoradoGold
IAMGOLD New Gold
Comparable Analysis
Operating Profile
Gold Leverage
Financial Profile
Valuation
Investment Risks
Company Overview Industry Analysis Macro Analysis Comparable Analysis Valuation Conclusion

Comparable Analysis
22Source: Company Filings, Company Bloomberg
Comparable Analysis
Operating Profile
Gold Leverage
Financial Profile
Valuation
Investment Risks
0%
200%
400%
600%
800%
$1,235$1,300$1,400$1,500$1,600$1,700$1,800$1,900$2,000$3,000
% R
etu
rn
Gold Price
MVGDXJTR GDMNTR DGC DPM OSK
Graphical Representation of Gold LeverageRegression Analysis
y = 0.0866x - 84.396R² = 0.7596
$15
$20
$25
$30
$35
$40
$1,100 $1,150 $1,200 $1,250 $1,300 $1,350 $1,400
DGC (LHS)GOLD (Horizontal)
Gold ($) 1235 1300 1400 1500 1600 1700 1800 1900 2000 3000
MVGDXJTR 1001.1 853 981 1179 1377 1575 1773 1971 2169 2367 4346
GDMNTR 768.0 726 824 976 1128 1280 1432 1584 1736 1888 3408
DGC $17.8 $22.6 $28.2 $36.8 $45.5 $54.2 $62.8 $71.5 $80.1 $88.8 $175
DPM $3.62 $2.6 $3.1 $3.9 $4.7 $5.5 $6.3 $7.0 $7.8 $8.6 $16
OSK $3.83 $2.2 $2.3 $2.4 $2.5 $2.6 $2.8 $2.9 $3.0 $3.1 $4.2
Gold Leverage ($) return based on change in Gold Price
*1-year daily regression, gold price as independent x-variable, DGC has the highest correlation coefficient among its peer group and
Company Overview Industry Analysis Macro Analysis Comparable Analysis Valuation Conclusion

Comparable Analysis Cont’d
23Source: Company Filings, Company Bloomberg
35.3%
49.0%
34.1% 31.2%25.7%
40.5%
0.0%10.0%20.0%30.0%40.0%50.0%60.0%
DetourGold
SEMAFO YamanaGold
EldoradoGold
IAMGOLD New Gold
1.52
4.80
1.35
3.57
1.160.001.002.003.004.005.006.00
DetourGold
SEMAFO YamanaGold
EldoradoGold
IAMGOLD New Gold
EBITDA Margin Cash Ratio
13.8%
30.5%
12.8%
22.1%
1.4%8.0%0.0%
10.0%
20.0%
30.0%
40.0%
DetourGold
SEMAFO YamanaGold
EldoradoGold
IAMGOLD New Gold
Gross MarginComparable Analysis
Operating Profile
Gold Leverage
Financial Profile
Valuation
Investment Risks
Company Overview Industry Analysis Macro Analysis Comparable Analysis Valuation Conclusion

Comparable Analysis Cont’d
24Source: Company Filings, Company Bloomberg
0.00x
0.10x
0.20x
0.30x
2012 2013 2014 2015 2016
Precious Metal Peer Average DGC
Historical EV/Reserves Ratio vs Peer Group
EV to EBITDA Price to Cash Flow Multiple
7x 8x 8x 9x 10x 17x 18x
Median 9.04x
0x
4x
8x
12x
16x
20x
DGC SMF ELD TRI IMG NGD BTO
Median 8.22x
0x
5x
10x
15x
20x
25x
30x
DGC SMF ELD TRI IMG NGD BTO
Comparable Analysis
Operating Profile
Gold Leverage
Financial Profile
Valuation
Investment Risks
Company Overview Industry Analysis Macro Analysis Comparable Analysis Valuation Conclusion

Comparable Analysis Cont’d
$413 $426 $425 $431 $447$400
$333 $305
$0
$100
$200
$300
$400
$500
2015 Q1 2015 Q2 2015 Q3 2015 Q4 2016 Q1 2016 Q2 2016 Q3 2016 Q4
Debt Cash
10.0%
22.8%67.1%
LOC
Amount Available
Bond Principal
Debt Breakdown
2% 3% 3%
14%16% 17% 18%
22%
28% 32% 34%
-5%
5%
15%
25%
35%
THO IVN PAAS EDV ELD AGI DGC IMG NG BTO YRI
Average = 17.1%
D/E Peer Average
Ability to Refinance Debt
Company Overview Industry Analysis Macro Analysis Comparable Analysis Valuation Conclusion
Comparable Analysis
Operating Profile
Gold Leverage
Financial Profile
Valuation
Investment Risks

Investment Risks Cont’d
232287
456634505558 537765
0
100,000
200,000
300,000
400,000
500,000
600,000
2013 2014 2015 2016
Expected
Expected VS. Actual Gold Production Gold Price / VIX Correlation
$1,100
$1,200
$1,300
$1,400
10
15
20
25
02
-16
03
-16
04
-16
05
-16
06
-16
07
-16
08
-16
09
-16
10
-16
11
-16
12
-16
01
-17
02
-17
VIX Index Gold Price
Company Overview Industry Analysis Macro Analysis Comparable Analysis Valuation Conclusion
Comparable Analysis
Operating Profile
Gold Leverage
Financial Profile
Valuation
Investment Risks
2. Behind on Expected Production & Tonnage
In 2016, Detour Lake only mined 66.4 million tonnesof the targeted 95 million tonnes
3. Operational Risk
• Increasing AISC• Increasing Cost of Sales• Fluctuating Gold Price
2
3

Key Metric 2: Gold Leverage
Private & Confidential 27
Strengths Risks
Low Cash Cost Producer
High Grade Ore
Low cost jurisdiction
Mining Friendly
Jurisdiction
Strong Initial Drill Results
High Grade Ore
Significant Property
ownership
Country RiskOperational
Risk
Non-Producing Asset
Drilling Disappoints
Multiple Contraction
Shareholder Dilution

28
Valuation Target Price:$23

Valuation Target Price:$23
29Source: Company Filings, Company Bloomberg
70%/$24
30%/$20
NAV Multiples
Company Overview Industry Analysis Macro Analysis Comparable Analysis Valuation Conclusion

Valuation: NAV
30Source: Company Filings, Company Bloomberg
Key Assumptions Projected FCF – Life of Mine ($mm)
NAV Target Price $24.18 Net Asset Valuation
Net Present Value (millions) $4336.06
- Total Debt $334.00
+ Cash & Equivalents $115.60
+ Inventory $103.70
Net Asset Value (millions) $4,221.36
Shares o/s (millions) 174.6
NAV per share (Base Case) $24.18
Gold Operations
Realized Price ($/Oz) $1,231.75
Cash Costs ($/Oz) (without Maintenance/Expansion) $850
Capex(Maintenance/ Expansion) $100
AISC per Oz $950-$1050 -500
0
500
1000
1500
20
13
20
14
20
15
20
16
E
20
17
E
20
18
E
20
19
E
20
20
E
20
21
E
20
22
E
20
23
E
20
24
E
20
25
E
20
26
E
20
27
E
20
28
E
20
29
E
20
30
E
20
31
E
20
32
E
20
33
E
20
34
E
20
35
E
NAV 70%/$24
Company Overview Industry Analysis Macro Analysis Comparable Analysis Valuation Conclusion

Valuation: Multiple Analysis
31Source: Company Filings, Company Bloomberg
WA Target Price from Multiple Analysis Bear, Base Bull Case Scenarios
Multiples Target Price $20 P/NAV Sensitivity Table
33%/$21
33%/$19
33%/$21
EV/EBITDA EV/Reserves P/NAV
18.2x 21.0x 23.8x18.0x 19.1x 20.2x18.6x 21.0x 23.4x0.0x
5.0x
10.0x
15.0x
20.0x
25.0x
Bear Case Base Case Bull Case
EV/EBITDA EV/Reserves P/NAV
NAV
P/N
AV
$3809.77 $4010.29 $4221.35 $4432.42 $4654.04
0.7x $14.46 $15.29 $16.16 $17.03 $17.94
0.8x $16.64 $17.58 $18.57 $19.57 $20.61
0.9x $18.82 $19.88 $20.99 $22.10 $23.27
1.0x $21.01 $22.18 $23.41 $24.64 $25.94
1.1x $23.19 $24.47 $25.83 $27.18 $28.60
Company Overview Industry Analysis Macro Analysis Comparable Analysis Valuation Conclusion

32
Gold Leverage
Acquisition Target
Valuation Buy $23Stable Investment
Conclusion: Investment Recommendation
Company Overview Industry Analysis Macro Analysis Comparable Analysis Valuation Conclusion