
ry.CULVERT DESIGN STUDY: PET{TICTOD{ FOREST€¦ · PEAK F'LO\ry.CULVERT DESIGN STUDY:...
77
PEAK F'LO\ry.CULVERT DESIGN STUDY: PET{TICTOD{ FOREST DISTRICT Prepøredfor: Weyerhaeuser Company Limited B.C. Timberlands 668 St. Anne Road Armstrong, B.C. VOE 1BO F'INAL REPORT Prepared by: Summit Environmental Consultants Ltd. 174 - 100 Kalamalka Lake Road Vemon, B.C. VlT 7M3 Project 042-13.00 October 2000 4 gl
Transcript of ry.CULVERT DESIGN STUDY: PET{TICTOD{ FOREST€¦ · PEAK F'LO\ry.CULVERT DESIGN STUDY:...
PEAK F'LO\ry.CULVERTDESIGN STUDY: PET{TICTOD{FOREST DISTRICT
Prepøredfor:
Weyerhaeuser Company LimitedB.C. Timberlands668 St. Anne RoadArmstrong, B.C.VOE 1BO
F'INAL REPORT
Prepared by:
Summit Environmental Consultants Ltd.174 - 100 Kalamalka Lake RoadVemon, B.C. VlT 7M3
Project 042-13.00
October 2000
4gl

October 18,2000Reference: 042-13.00
Mr. Nick Kleyn, R.P.F.Weyerhaeuser Company Limited. - B.C. Timberlands668 St. Anne RoadArmshong, B.C.VOE 1BO
Dear Mr. Kleyn:
Re: Peak Flow - Culvert Design Study for Penticton Forest District
Summit Environmental Consultants Ltd. is pleased to provide you with two copies of theFinal Report on the above-noted study. The report presents our peak flow regionalisationfor the Penticton Forest District, and discusses the features, assumptions and limitationsof the computer program CULVERT (Ver. 6.1) that uses the results of this regionalisationfor estimating required culvert sizes.
We have enjoyed working on this project, and would be pleased to provide any additionalassistance you may require. Please call me at 545-3672 if you have any questions or wishto discuss any aspect ofthe report.
Yours truly,
Summit Environmental Consultants Ltd.
Brian T. Guy, Ph.D., P.Geo., P.H.PresidentSenior Geoscientist
Enclosures: 2 copies of Final Report

TABLE OF CONTENTS
LETTER OF TRANSMITTAL.... .................. i
TABLE OF CONTENTS.............. ................ ii
LIST OF TABLES ....................iii
LrsT oF FTGURES.. ................. iiiLrsT oF ATTACHMENTS ............. ........... iii1.0 rNTRODUCTrON......... ........................1
2.0 DESTGN PEAK FLOW r{YDROLOGY............ ........................32.1 Background ....................32.2 Index Flood Method...... ....................42.3 Rational Formula Method...... ...........72.4 Recommended Design Peak Flow Curves ...........72.5 Guidance for Selection of Peak Flow Zone .........82.6 Guidance for Model Use in Areas Affected by Hydrologic Storage. .........9
3.0 CULVERT HYDRAULTC ANALYSTS ............ .......................193.1 Overview... ...................193.2 Circular CMP and Pipe Arch Culverts..... ..........193.3 Rectangular Structures and Bridges Over Trapezoidal Channels ............22
4,0 CULVERT COMPUTER PROGRAM .......,..,,,......24
5.0 LTMITATIONS OF PEAK FLOW MODEL AND CULVERT (VER. 6.1) COMPUTERPROGRAM ............26
6.0 REFERENCES ............. ......................28
Appendix A
Appendix B
Design Peak Flow Analysis: Penticton Forest District.
Culvert Sizing Checklist.
Summit Environmental Consultants Ltd.Project#042-13.00 ii
FINAL REPORTl8-October-2000

LIST OF TABLES
Table2.l. Relationship between design culvert size and watershed area for 400 mm and
2000 mm CMPs. .........................8
Table2.2. Ratio of actual to predicted 100-year design flows for streams affected by naturallakes. ............10
Table 3.1. Standard pipe arch si2es........... ...................2I
LIST OF FIGTIRES
Figure 1.1. PentictonForestDishict. ...........2
Figure 2.1. Recommended design curves for the 50-year return period annual maximuminstantaneous discharge - Zone 1: Southem Okanagan Basin.......... ....................11
Figure 2.2. Recommended design curves for the 5O-year retum period annual maximuminstantaneous discharge - Zone 2: Northern Okanagan 8asin.......... ....................I2
Figure 2.3. Recommended design curves for the 50-year return period annual maximuminstantaneous discharge-Zone 3: Eastern Okanagan Highland and Okanagan Range. .........13
Figure 2.4. Recommended design curves for the 5O-year return period annual maximuminstantaneous discharge - Zone 4: Upper Kettle River.......... ............14
Figure 2.5. Recommended design curves for the 100-year return period annual maximuminstantaneous discharge-Zone 1: Southern Okanagan 8asin.......... ....................15
Figure 2.6. Recommended design curves for the 100-year return period annual maximuminstantaneous discharge - Zone 2: Northern Okanagan Basin......... .....................16
Figure 2.7. Recommended design curves for the 100-year return period annual maximuminstantaneous discharge-Zone 3: Eastern Okanagan Highland and Okanagan Range. .........17
Figure 2.8. Recommended design curves for the 100-year retum period annual maximuminstantaneous discharge -Zone 4: Upper Kettle River.......... ............18
Figure 3.1. Schematic diagram of rectangular and trapezoidal structures... ........24
LIST OF ATTACHMENTS
Map l: Peakflow zoîemap forPentictonForestDistrict...... .Pocket 1
Installation CD-ROM for CULVERZVersion 6.1............. ......Pocket 2
Summit Environmental Consultants Ltd.Proiect #042-13.00 lll
FINAL REPORTl8-October-2000
1.0 INTRODUCTION
The Forest Practices Code of British Columbia Act (the Code) and Regulations provide
design criteria for bridges and culverts. Culvert and bridge sizing is based on calculating the
minimum opening required to pass the 100-year retum periodl peak flow for all stream
culverts and permanent and semi-permanent bridges, and the 5O-year return period peak flow
for temporary bridges and all other culverts.
The Forest Road Engineering Guidebook (MoFil\4ELP, 1995) provides a simple default
method of estimating the diameters of circular comrgated metal pipes (CMPs) needed to
safely pass 100-year design flows. However, experience in some parts of British Columbia
has suggested that the simple guidebook method tends to overestimate the required pipe
sizes. In addition, there is little guidance for estimating 5O-year design flows, or for sizing
structures other than circular CMPs. The Community Watershed Guidebook (MoF/\4ELP,
1996) presents a method for estimating 100-year design flows which is based on an earlier
hydrologic study of the entire province. However, this method does not reflect local or
regional variations in peak flows, nor does it provide any information on the uncertainty of
the design flow estimate.
The objectives of the present project are to develop a reliable method for estimating 5O-year
and 100-year design peak flows within the Penticton Forest District (Figure 1.1), based on
local information and accepted techniques, and for sizing the structures necessary to safely
pass these design flows.
' Return period is a way of expressing the exceedance probability. The probability ofthe 100-year peak flowbeing equalled or exceeded in any given year is l/100 or 0.01. In other words, in any year the odds that thisflow will be equalled or exceeded are 1 in 100.
Summit Environmental Consultants Ltd.Proiect#042-13.00 I
FINAL REPORTl8-October-2000

Figure 1.1. Penticton Forest District.
=tlld$t'
tl¡
qFrnliËttrr! HlFlst
Summit Environmental Consultants Ltd.Proiect #042-13.00 2
F'INAL REPORTl8-October-2000

1.
2.
The study involved two components:
a peak flow hydrology study, and
development of Version 6.1 of computer program CULVERT, in which the design flow
hydrology for the Penticton Forest Dishict (PFD) and an analysis of culvert hydraulics are
combined to simpli$r the process of estimating design peak flows and culvert sizes.
This report provides a summary of the hydrology study, reviews the culvert hydraulic
analysis, and introduces the computer program (CULVERT, Ver. 6.1). The hydrologic
methodology is described in more detail in Appendix A, and a Users Manual for program
CULVERT (Ver. 6.1) is provided in a separate report (Summit, 2000).
The hydrologic analysis and the CULVERZ (Ver. 6.1) program reported herein have been
developed specihcally for use within the boundaries of the Penticton Forest District.
CULVERT (Ver. 6.1) is protected by copyright and its use is governed by a licence
agreement. The program cannot be used by any party not holding a valid licence
agreement, and cannot be used for any purpose other than the estimation of design
flows and culvert sizes for locations within the boundaries of the Penticton Forest
District.
DESIGN PEAK F'LOW HYDROLOGY
BacrcnouNo
This section presents a summary of the design peak flow study. A detailed presentation is
included in Appendix A. The peak flow hydrology study included two components:
review of existing dat4 information, reports, and analyses relevant to the hydrology of the
Penticton Forest District, and
development of an appropriate methodology for estimating the required design flows,
which comprises both the Index Flood Method and the Rational Formula Method.
2.1
l.
2.
Summit Environmental Consultants Ltd.Project #042-13.00 3
FINAL REPORTl8-October-2000
2.2 Inonx Fr,oon METHoD
The Index Flood method has been used to estimate design discharges for ungauged
watersheds larger than 10 km2 in area within the Penticton Forest District (the study area).
This method is consistent with the methodology presented in the Communþ Watershed
Guidebook (MoF/I\4ELP, 1996). All of the streamflow gauging stations2 in the southern
interior of British Columbia (and several in Washington State) that were operational during
the past century were examined for relevance to the project and the study area. Streamflow
data from 62 of these stations was used for the analysis. These 62 stations were selected
because they are not regulated and their watersheds contain no major lakes or wetlands that
could significantly moderate the annual flood hydrograph. The locations of the relevant
stations within and adjacent to the Penticton Forest District are indicated on Map 1, attached.
The data for each station was used to calculate the mean annual peak daily discharge for the
period of record. The estimate was then adjusted to a long term mean based on the flow
records for several stations with records extending back to near the beginning of the 20th
century. The adjusted mean annual peak daily discharges for the 62 stations are the "index
floods" for those stations. These values were then transformed to a scale-independent
estimate of the discharge per square kilometre3, and plotted onal:250,000 scale base map.
Spatial relationships between the streamflow gauging stations were then examined, and four
zones homogeneous with respect to peak flows were delineated within the study area (Map
1). The zones are statistically different from each other at the 90Yo confidence level. The
zones are:
1. Zone l: Southern Okanagan Basin,
2. Zone2: Northern Okanagan Basin,
3. Zone3; Eastern Okanagan Highland and Okanagan Range, and
' Maintained by Environmenl Canada
3 Peak discharge per unit area (Qo2/A) is known to be a function of drainage area (A). This effect must be
removed before basins of different size can be compared. For the purpose of zone delineation, we have donethis by calculating and mapping ¡ : qor/Ao 75, where Qo2 is the index flood. The exponent 0.75 is approximatelycorrect throughout B.C.
Summit Environmental Consultants Ltd.Proiect#042-13.00 4
FINAL REPORTl8-October-2000

4. Zone 4: Upper Kettle River.
The driest part of the Penticton Forest District is located in the valley bottoms of the
Okanagan and Similkameen River valleys and has been designated Zone l. This zone
extends from Summerland at the northern end to Osoyoos at the south. The main water
bodies in this zone include Okanagan River, Similkameen River and Trout Creek, as well as
Skaha Lake, Osoyoos Lake and the southern end of Okanagan Lake. The dominant
biogeoclimatic zones include Bunchgrass, Ponderosa Pine and Interior Douglas Fir.
Zone 2 includes the Okanagan valley north of Zone l, around Kelowna. It also forms a
narrow band east and west of Zone I along the upper valley sides of the Okanagan and
Similkameen River valleys, reflecting the rapid climatic transition from valley bottom to
plateau in the southern part of the Penticton Forest District. The larger water bodies in Zone
2 include Trepanier Creek, Powers Creek, Lambly Creek and the lower reaches of Mission
Creek. The Interior Douglas Fir biogeoclimatic zone is dominant, though the Ponderosa Pine
zone is found along the valley bottom.
Zone 3 is comprised primarily of the plateau east of the Okanagan valley, but also includes
the mountainous terain west of Penticton and Osoyoos. The main water bodies include the
headwaters of Ellis Creek, Penticton Creek, Mission Creek, Vaseau Creek and McNulty
Creek, as well as the Ashnola River. The dominant biogeoclimatic zones in Zone 3 are
Montane Spruce and Engelmann Spruce - Subalpine Fir.
Zone 4 is limited to the eastern-most part of the Penticton Forest District. It includes the
relatively wet headwaters of the West Kettle River. The biogeoclimatic zone is typically
Interior Cedar Hemlock, with Engelmann Spruce - Subalpine Fir at higher elevations.
Using the daily peak flow data from the gauged streamflow stations, three separate analyses
were undertaken for each peak discharge zone.
Summit Environmental Consultants Ltd.Project #042-13.00 5
F'INAL REPORTl8-October-2000

1. Regression-fit curves relating mean annual peak daily dischargeo (Qpz) to drainage area
(A) were derived.
2. Representative ratios of the 5O-year (Qpso) and 100-year (Qproo) return period peak daily
discharge to the mean annual peak daily discharge (Qpz) were estimated.
3. A representative estimate of the ratio between peak instantaneous and peak daily
discharge was determined.
Mean estimates of the 5O-year and 100-year retum period design peak flows for a given
location are determined using the results of each of the three analyses, as follows:
Qpsoi : (I/DXQpso/QpzXQpz)
Qplooi : (I/D)(Qpr oo/QpzXQpz)
where:
o Qpsoi : 50-year return period annual maximum instantaneous discharge to be
estimated ¡m3/s1,
. Qpl6ot : 100-year retum period annual maximum instantaneous discharge to be
estimated ¡m3/sl,
o IlD: representative ratio of instantaneous to daily peak discharge,
. Qpz : index flood (mean annual maximum daily discharge) based on the peak flow
zone and the drainage area upstream of the proposed bridge or culvert ¡m3/s1,
. Qpso/Qr2 : representative ratio of 50-year return period annual maximum daily
discharge to the index flood, and
. Qproo/Qp2 : roprosentative ratio of 100-year return period annual maximum daily
discharse to the index flood.
- This is the "index flood".
(1)
(2)
Summit Environmental Consultants Ltd.Project #042-13.00 6
F'INAL REPORTl8-October-2000
2.3
Values of IiD, Qpso/Qpz and Qproo/Qpz for each peak flow zone were determined from a subset
of the available data. Uncertainty in the design flow estimate is quantified by computing a
one standard error confidence interval about the mean estimate. The standard error is based
on the combined enors in the mean annual peak daily discharge, instantaneous to daily peak
discharge ratio, and the ratios of the 5O-year and 100-year return period to the mean annual
peak daily discharge.
Rnrroxar, Fonuura Mnrnoo
It is generally accepted that the Index Flood Method (as described in section 2.2) is not
reliable for estimating peak flows in watersheds smaller than about 10 km2 in area.
Accordingly, the Rational Formula Method (as presented by Reksten and Davies, unpub.)
was applied to the four peak flow zones. Precipitation data from Oliver, Vernon and
Revelstoke were used. The results were used to modifu the slope of the design curves
derived by the Index Flood Method for areas smaller than l0 km2. Standard error estimates
for watersheds less than 10 km2 in size are assumed to be equivalent to those derived using
the Index Flood Method for drainase areas sreater than 10 km2.
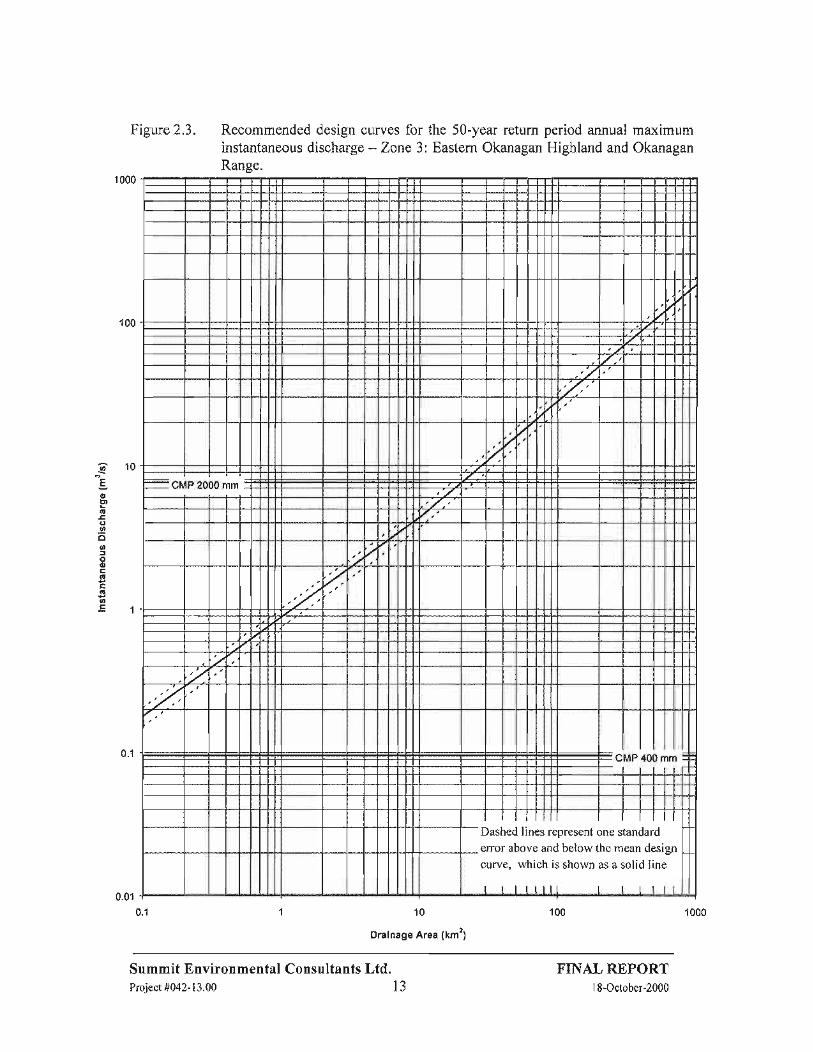
RncolrunNDED DESTcN PEAK FLow Cunvns
Recommended design peak flow curves, developed using the methods described in Sections
2.2 and2.3, are presented in Figures 2.1 through 2.8. Dashed lines indicate the estimated one
standard error (68%) confidence interval about the mean design flow estimate. For new
installations, the recommended design curve is the upper dashed line in each figure. Using
this curve, there is an 84%o chance that the "true" design flow is less than the recommended
value. This is considered a reasonable level of design conservatism. The suitability of
existins installations can be evaluated by assuming that the "true" design flow falls within the
one standard error confidence interval about the mean design curye. On each curve, the
discharge passable by single 400 mm and 2000 mm CMPs are indicated, which facilitates
identification of required culvert sizes according to watershed area, as outlined in Table 2.1.
2.4
Summit Environmental Consultants Ltd.Project #042-13.00 7
F'INAL REPORTl8-October-2000

2.5
Table2.1. Relationship between design culvert size andwatershed area for 400 mm and
2000 mm CMPs.
ZoneReturnPeriod
Watershed area upstream of ne\ry'culverts of thefollowins diameter:
400 mm 2000 mm
I 50 0.152krn'115.2 ha) 72.2l<rn"100 0.116 km' (11.6 ha) 57.1 km
250 0.087 km'18.7 ha) 42.4km"100 0.072km'(7.2ha\ 35.6 km'
350 0.040 km'14.0 ha) 19.9 km100 0.033 km'13.3 ha) 16.9 km
450 0.028 km'12.8 ha) I2.l krn"100 0.025 km' Q5ha\ 11.0 km'
1: data based on "recommended" design flow (mean design flow plusstandard error)
GunaNcB FoR SELECTToN oF Pnar Fr,ow Zouo
The boundaries of the homogeneous peak flow zones shown on Map I have been drawn to
represent as closely as possible the hydrologic variations indicated by the data and, where
data are sparse, have been infened based on experience and professional judgement. Despite
the fact that the zones are statistically different from each other, hydrologic conditions vary
continuously, grading from drier zones to wetter ones along a continuum. Conditions do not
change instantaneously along precisely identifiable boundaries, as suggested by a line drawn
on a map. This fundamental spatial variability of hydrologic properties must be considered
when choosing which zone to use for design discharge estimation, especially at or near zone
boundaries.
The key consideration is the location of the drainage basin upstream of the proposed (or
existing) installation, not the location of the installation itself. For drainage basins
completely within one peak flow zone and well away from a zone boundary, one can be
confident that that zone represents the drainage basin, and no other zones need be considered.
For basins within one peak flow zone but close to a zone boundary, it is still likely that that
zone represents the basin. However, it may also be appropriate to calculate a design discharge
Summit Environmental Consultants Ltd.Proiect #042-13.00 8
FINAL REPORT1 8-October-2000

based on the adjacent peak flow zone, and to consider the suitability of both design discharge
estimates based on knowledse of the site conditions.
Drainage basins that cross zone boundaries must be addressed carefully. Since snowmelt
dominates peak flow hydrographs in the Penticton Forest District, a zoîe covering the higher
elevations is more appropriate that a zone covering the lower elevations of a basin. As a
general rule basins that have more than about 40Yo of the area within an upstream zone
should be represented by the upstream zone. However, it is appropriate to calculate the design
discharge based on both zones and choose the most appropriate one, based on the site
conditions. Basins that have less than 40Yo of their area in the upstream zoîe will most likely
be best represented by the downstream zone, but this should be confirmed based on the site
conditions. In some cases, site conditions may not help identiff which zone is most
representative of a drainage basin close to or crossing a peak flow zone boundary. The
recommended course of action in these circumstances is to choose the larger design discharge
(i.e. the wetter hydrologic zone). This is a considered to be a conservative approach, and
should prevent unintentional under-sizing of an installation.
Gumxcn FoR MoDEL UsE rN AREAS Arrncrno By IIyDRoLocrc
Sronlcn
Storage in lakes and wetlands tends to attenuate the peak of the flood hydrograph, generating
lower but longer floods. Because the data set used to develop the peak flow models presented
herein excludes stations significantly influenced by lake and wetland storage, the design
flows produced by the model will overestimate the design discharge for installations
downstream of significant lake and wetland storage. The magnitude of this effect on Qloo
was estimated by analysing data for 13 gauged rivers that have lakes affecting one third or
more of their watershed but are not regulated by dams. Table 2.2 presents the ratio of the
actual 100-year design flow (Qu"¡uu1) to that predicted by the model (Qp.eaicteo) for each of the
13 stations.
2.6
Summit Environmental Consultants Ltd.Proiect #042-13.00 9
F'INAL REPORTl8-October-2000
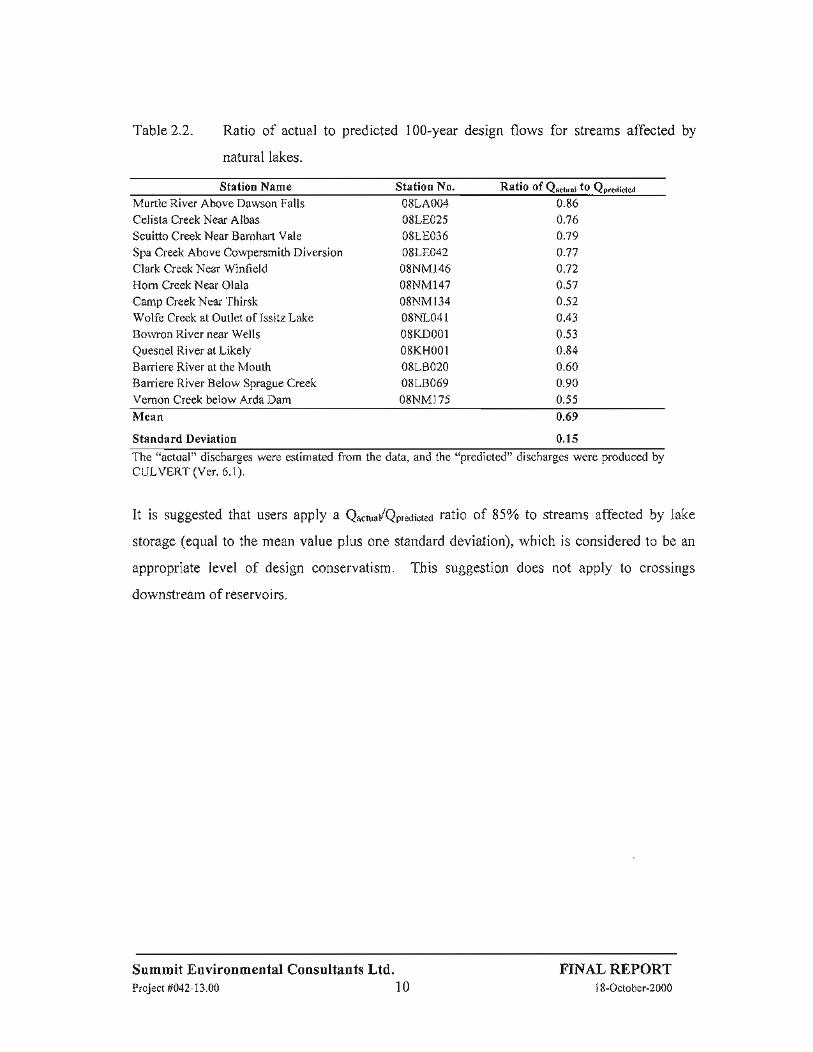
TableZ.2. Ratio of actual to predicted 100-year design flows for streams affected by
natural lakes.
Station Name Station No. Ratio of Q".6at to Qpred¡cted
Murtle River Above Dawson FallsCelista Creek Near AlbasScuitto Creek Near Barnhart ValeSpa Creek Above Cowpersmith DiversionClark Creek Near WinfieldHorn Creek Near OlalaCamp Creek Near ThirskWolfe Creek at Outlet of Issitz LakeBowron River near Wells
Quesnel River at LikelyBarriere River at the MouthBarriere River Below Sprague Creek
Vemon Creek below Arda Dam
08L400408LE02508LE036
08L804208NM14608NM147
08NMl3408NL04108KD00l08KH00l08L802008L8069
08NMl75
0.86
0.76
0.79
0.77
0.72
0.57
0.52
0.43
0.53
0.84
0.60
0.90
U.]J
Mean
Standard Deviation
0.69
0.15
The "actual" discharges were estimated from the data, and the "predicted" discharges were produced byCULVERT (Ver. 6.1).
It is suggested that users apply a Qu.tou/Qp."¿¡.66 ratio of 85yo to streams affected by lake
storage (equal to the mean value plus one standard deviation), which is considered to be an
appropriate level of design conservatism. This suggestion does not apply to crossings
downstream of reservoirs.
Summit Environmental Consultants Ltd.Proiect #042-13.00 10
F'INAL REPORTl8-October-2000
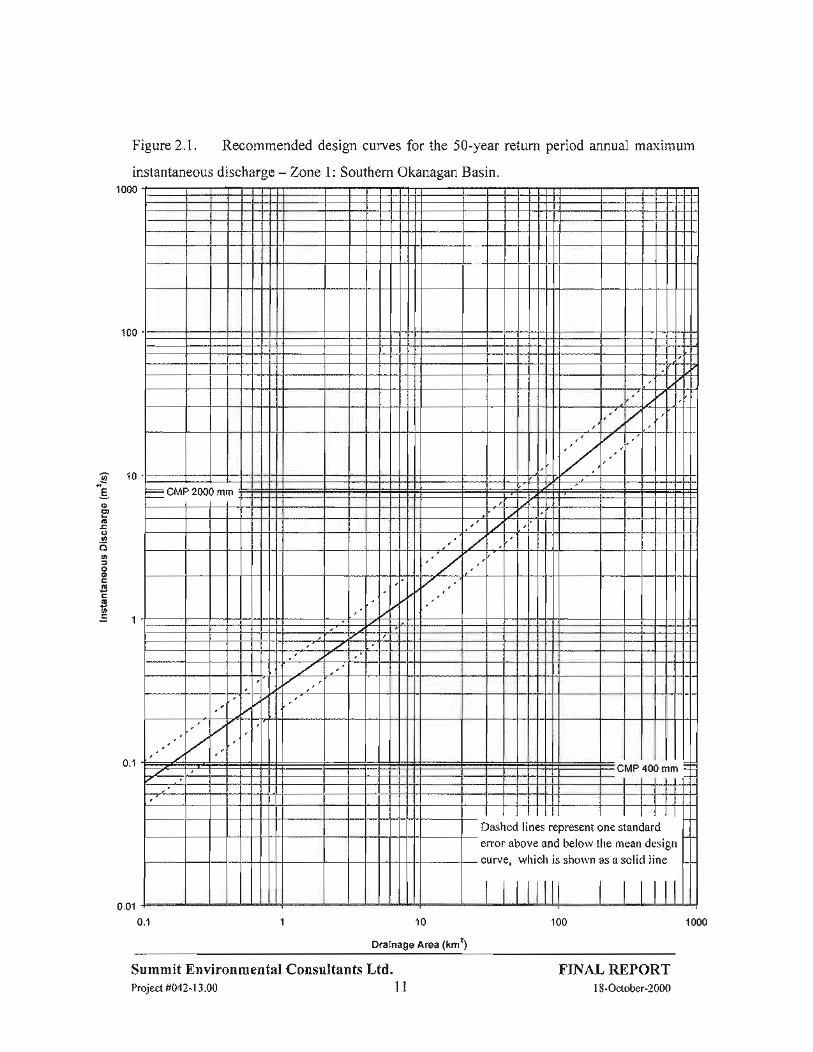
Figure 2.1. Recommended design curves for the 5O-year return period annual maximum
instantaneous discharge - Zone l: Southem Okanagan Basin.
G10
oEt(!oøôo=o(,(E
Ê(!U'E4
1 000
0.01
01 10
Drainage Area (km2)
100 1000
CMP 2000 mm
ô VIP 40( ìn
D asÌ
TOI
ed
at o
nes
leerresent
belowchnr¡¡n
ne sl
1e ml
anc
lannli¡
ard
des
lin
tt
Summit Environmental Consultants Ltd.Project #042-13.00 1 1
FINAL REPORTl8-October-2000
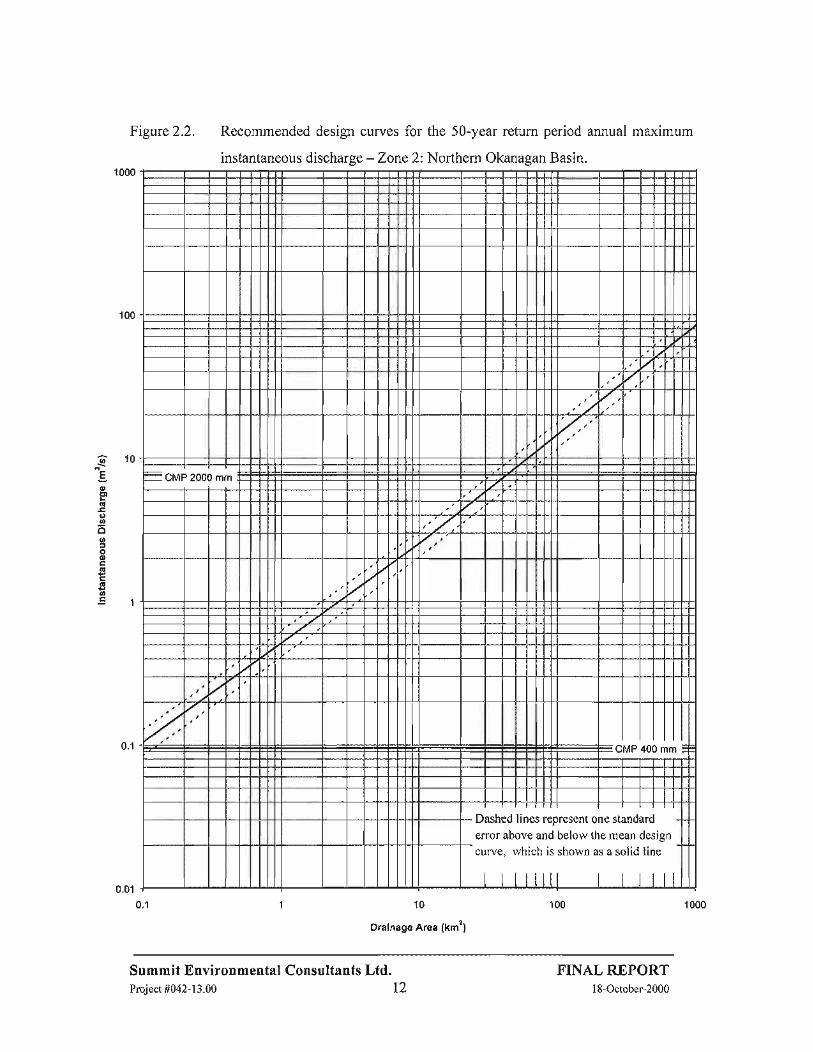
Figure2.2. Recommended design curyes for the 5O-year return period annual maximum
instantaneous discharge -Zone 2: Northern Okanagan Basin.1 000
G10E
o(!
e.!)oat
=o0,
(!
(E
an
100
-T
lf+.T ff
II.l
T
.ll():fi -
- cMP 2001 mm l
+
T I + -T
I
l+ +T --r =UMP 4U( 1n +T
error above and below the mean de¡ lgncurve, which is
t t||thown as a solid li
ttte
't0 100 1000
Drainage Area (km2)
01
Summit Environmental Consultants Ltd.Project#042-13.00 12
FINAL REPORTl8-October-2000
I 000
Figure 2.3. Recommended design curves for the 5O-year retum period annual maximuminstantaneous discharge - Zone 3: Eastern Okanagan Highland and OkanaganRange.
u-Tr
'7-
,/,'
+1
l1IITf
,/,7,
l_f .l
,/
,,/, I
MP 40 ìn
t t l||t t t t t|Dashed lines represent one standard
emor above and below the mean desisn
curve, which is shown as a solid line
t t tttt| t t r rrr
100
o tu
(,E'oo.2c¡U'
ootrtftrõoÊ4
01
001
10 100 1000
Drainage Area (km2)
Summit Environmental Consultants Ltd.Project #042-13.00 I 3
F'INAL REPORTl8-October-2000

100
Figure2.4. Recommended design curves for the 5O-year retum period annual maximum
instantaneous discharge - Zone 4: Upper Kettle River.
2
,,/,,'
t
/4
CMP 2000 mmttt
,
.,1u
= CIV P 00 m
t tttt|Dashed lines r<
error above an<
rtttttt:present one standard
I below the mean design
curve, which
t ttt|
shown as a solid line
tttttt10 100 1000
Drainage Area (km2)
G10E
0)cttIEEo.12ooooÉoGanÊ4
00101
Summit Environmental Consultants Ltd.Proiect#042-13.00 14
FINAL REPORTl8-October-2000
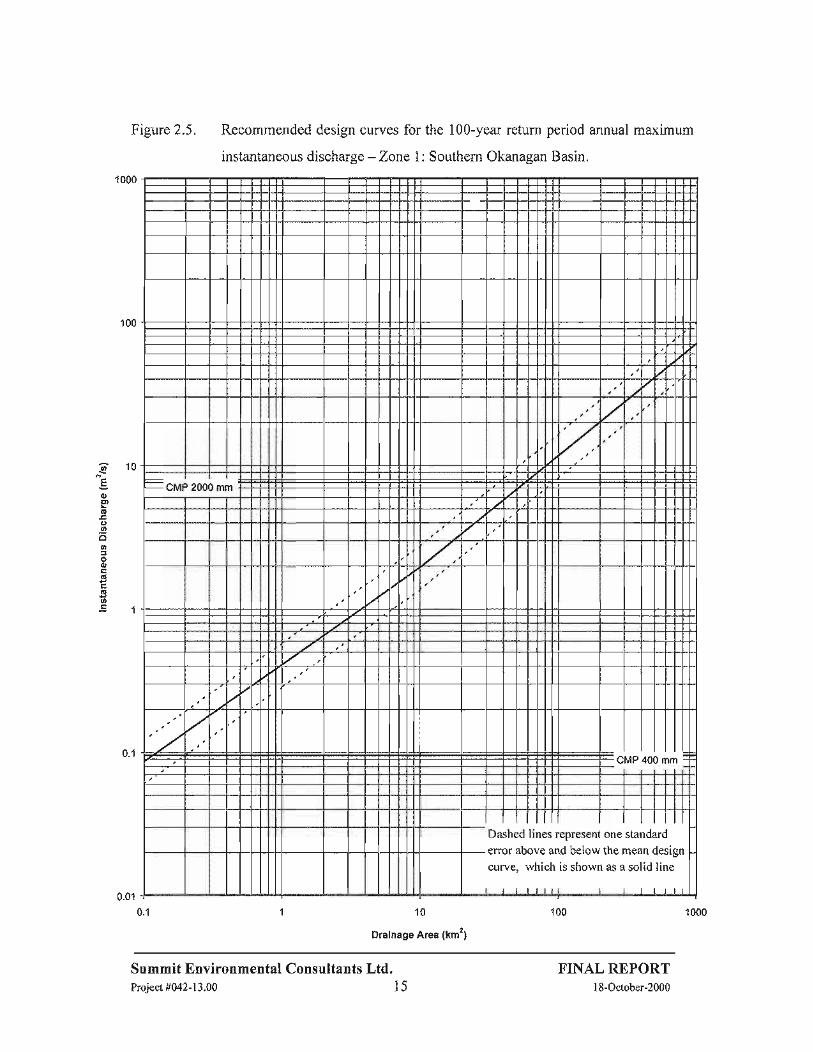
Figure 2.5. Recommended design curves for the 100-year return period annual maximum
instantaneous discharee - Zone 1: Southem Okanasan Basin.
1 000
+
t¿_ cMP 200( mt
It
I
I
P
ï
-c VIP 40( ìn
t t||tlDashed lines represent one stal
ennr qhnr¡c enrl helnr¡¡ lhe mcç
||rdardn ¡lecion
curue, which is shown as a sol id line
l0 100 1000
Drainage Area (km2)
100
J¿ IU
E
o(t)(!oøc¡oootrGtr(E
Ø
=4
01
001
0l
Summit Environmental Consultants Ltd.Project #042-13.00 1 5
FINAL REPORTl8-October-2000
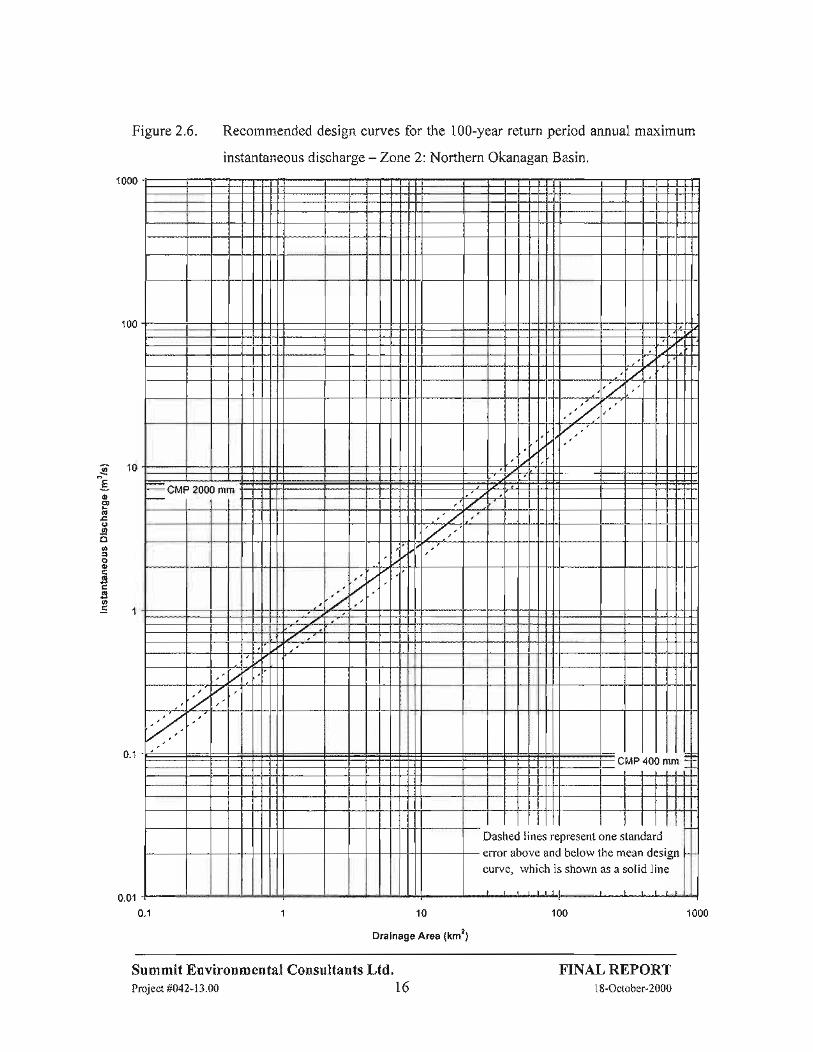
Figure2.6. Recommended design curves for the 1OO-year retum period annual maximum
instantaneous discharse - Zone 2: Northern Okanasan Basin.
I 000
,'7
cMP 200t m n Tï
'./
IrÞ 40 ìn
t t||| t l t|tDashed lines represent one standard
error above and below the mean design
curve, which is shown as a solid line
10
Drainage Area (km2)
100 1000
100
G10
oE)Lõo.!)oooC'Ê(E
E(!UtÊ4
0'l
Summit Environmental Consultants Ltd.Project #042-13.00 1 6
FINAL REPORTl8-October-2000

gruÈ6)E'tú
o.2ott,
oooÊooÊ4
Figure2.7. Recommended design curves for the 100-year return period annual maximuminstantaneous discharge - Zone 3: Eastern Okanagan Highland and OkanaganRanse.
a,
CMP 2001 mm
,z
MP 40 ìft
t || t
Dashed lines ret t||
lresent one standardL^l^,,, +l^^ *^^- ¡^.i^-
curve, which is shown as a solid line
10
Drainage Area (km2)
100 1000
0.01
01
Summit Environmental Consultants Ltd.Project #042-13.00 17
FINAL REPORTI 8-October-2000

I 000
Figure 2.8. Recommended design curves for the 100-year return period annual maximum
instantaneous discharge - Zone 4: Upper Kettle River.
,/,
J
1
t I-
cÀilP 2nrìr
/
l'1
/
/
- CMP 400 mn
t | ||tDashed lines relatr^f 4h^.¡a ôñ,1
t t||rresent one standard}.aln." +L^ * --- ¡-.: ^-
curve, which i shown as a solid line
l0
Drainage Area (km2)
o tut
octtG
o.12c¡tt3ooß
GtnÉa
1000l
Summit Environmental Consultants Ltd.Proiect #042-13.00 1 8
F'INAL REPORTl8-October-2000
3.0
3.1
CULVERT HYDRAULIC ANALYSIS
Ovnnvrnw
The procedures used to determine the culvert sizes required to pass design peak flows are
outlined in this section. Section 3.2 addresses flow through circular Corrugated Metal Pipes
(CNæ) and Pipe Arch culverts. The equations for flow through a single, double andpartially
buried CMP installation are provided, as is an equation for flow through a single pipe arch
{equations (3), (4), (5) and (6)}. The assumptions made during the derivation of these
equations are listed. Section 3.3 addresses flow through simple rectangular and trapezoidal
structures with natural bottoms. The equation from which the rectangular structure
dimensions are calculated is provided {equation (7)}.
3.2 Crncur,rn CMP axo Prpn Ancn Cur,vnnrs
The flow equations for the design of circular CMP and pipe arch installations have been
derived using simpliffing assumptions that apply to most forest road culvert installations, as
listed below:
The culvert protrudes from the road fill on both the upstream and downstream sides of the
road.
The culvert flows under inlet control (i.e. the downstream end is free flowing).
The water depth at the culvert inlet during the design flow does not exceed the top of the
culverts.
The upstream end of the culvert is square to the flow, and has no sidewalls.
Under these conditions, the CMP culvert size, D [mm] required to pass a given design flow,
Q [m3ls] is:
5 The Forest Practices Code of B.C Acl states that stream culverts in community watersheds must be designed topass the design discharge without the depth of water at the culvert inlet exceeding the top of the culvert (Section9(3), Part 2 of the Forest Road Regulation (March l, 2000). CULVERT (Ver. 6.1) meets this requirement for allculvert installations.
1.
2.
3.
4"
Summit Environmental Consultants Ltd.Project#042-13.00 19
FINAL REPORTl8-October-2000

D : looo(Q n.l4t)o'367
If two identical CMP culverts are installed side-by-side atthe location of interest, the size of
each culvert required for both culverts together to pass the design flow is given as:
D : looo(Q t2.282)o367
If a CMP is installed partially full of sediment at the location of interest, the size of the entire
CMP required to pass the design flow is given as:
D : 1000(Q lt.l4D}zøt(t -FlD¡-o'+sz (5)
where F is the depth to which the culvert is to be filled and D is the culvert diameter (e.g. ifthe culvert were one quarter full of sediment, F/D : 0.25). The user specifies the value of
F/D during the operation of the program CULVERT (Ver. 6.1).
The equation to size a pipe arch considers both the span (S) and the rise (R) of the pipe arch.
A characteristic length6 (L) is used in the equation.
L : (sR)t/2 L : looo(e to.g73)o3eo
(6)
Using the above equations, the program CULVERT (Ver. 6.1) is able to compute required
culvert sizes for single, double and partially buried circular culvert installations, as well as
single pipe arch installations.
Note that especially in non-mountainous tercain, there may be locations at which the
assumption of inlet control is invalid. In these cases, culvert sizing should be referred to a
Professional Engineer (P. Eng.).
(3)
(4)
Summit Environmental Consultants Ltd.Project#042-13.00 20
FINAL REPORT18-October-2000

Span (mm) Rise (mm) L (mm)
7620 x 4240
7040 x 4060
6250 x 3910
5890 x 37105490 x 3530
5050 x 3330
4720 x 3070
4370 x 2870
3890 x 2690
3730 x 2290
3400 x 2010
3100 x 1980
2690 x 2080
2590 x 1880
5684
5346
4943
4675
4402
4101
3807
3541
32352923
26142477
2365
2207
The CULVERT'(Ver. 6.1) program provides CMP culvert sizes for design flows to the nearest
millimetre. For pipe arch installations, the program rounds the computed size up to the next
largest standard pipe arch size. Standard pipe arch sizes are provided in Table 3.1.
Table 3.1. Standard pipe arch sizes.
Span (mm) Rise (mm) L (mm)
2440 x 1750
2240 x 1630
2060 x 1520
2130 x 1400
1880 x 1260
1630 x 1120
1390 x 970
ll50 x 820
1030 x 740910 x 660
800 x 580
680 x 500
560 x 420
450 x 340
2066
191 1
1770
1727
1539
135 1
I 161
971
873
tt)681
583
485
391
The CULVERZ (Ver. 6.1) program also calculates the culvert sizes conesponding to a one
standard error confidence interval using a flow equal to one standard error above and one
standard error below the mean design flow. For new installations, the recommended culvert
size is that calculated for the upper limit of this confidence interval. Use can be made of the
one standard error confidence interval for evaluating the suitability of existing installations.
Note that, since the program rounds pipe arch culvert sizes to the next highest standard size,
there may be instances where the mean design culvert size is the same as the size at either the
mean plus one standard error or the mean minus one standard error.
Equations (3), (4), (5) and (6) provide openings big enough to pass design flows, but not to
pass debris. A final selection of culvert size should only be made after a site visit to assess
local channel geometry and the potential for sediment and debris accumulation. A checklist
identiffing some of the issues to be considered in the field has been developed by Gary
6 The characteristic length (L) is equivalent to the diameter of a CMP of equal cross-sectional area.
Summit Environmental Consultants Ltd.Proiect#042-13.00 2l
FINAL REPORTl8-October-2000

McClelland of the Kamloops Forest Region and is presented in Appendix B. If necessary, a
larger size than specified by CULVERT(Ver. 6.1) should be selected.
The partially buried culvert is a design focussed on improving fish passage through the
culvertto upstream areas. As such, the culvert size requiredto pass the 5O-year or 100-year
design discharge is only one consideration in selecting an appropriate culvert size. In
addition, one must identifu the species requiring passage (including information on the life
stage and swimming ability) and the time of year during which passage is required.
Typically, the installation is designed to maintain an average velocity low enough to allow
fish passage for the species (and ages) present during high flows in the spring, and to
maintain a water depth sufÍicient to allow fish passage for the species (and ages) present
during low flows. The design of this type of culvert must also consider the hydraulics and
sediment transport dynamics within the culvert over a range of flows. Specifìcally, partially
buried culverts should be desisned with consideration of:
1. velocities in the culvert barrel and at the culvert outlet,
2. degree of turbulence within the culvert and atthe culvert outlet,
3. stability of the bed within the culvert at the design discharge, and
4. porosity of the bed within the culvert (to prevent subsurface flow during low flows).
During the design of a partially buried culvert installation, the culvert size calculated by
CULVERT (Ver. 6.1) should be adjusted to account for these additional design
considerations. Information on designing culverts to provide fish passage is provided in the
Stream Crossing Guidebook for Fish Streams (Poulin and Argent, 1998), and in Fish
Passage Design at Road Culverts (Washington Department of Fish and V/ildlife, 1999).
3.3 RncrnxculAR SrRUcruREs AND BRTDGES OvER Trupnzortal CHANNELS
The procedure for estimating required sizes for rectangular structures and bridges over
trapezoidal channels (Figure 3.1) is based on a solution of the Manning equation:
Summit Environmental Consultants Ltd.Project#042-13.00 22
FINAL REPORTl8-October-2000

Q: A
¡(rz Strzn
where:
Q: design discharge ¡m3/s1
A : cross-sectional area of the structure [m2]
R: hydraulic radius of the structure [m]
S : slope of the channel bed [m/m]
n: Manning's roughness coeff,tcient [t --t"]
When solving for the rectangular structure dimensions, a user must speciff the slope of the
channel (S), the channel bottom material (from which Manning's n is derived), and the
required spant lwidth; for the structure. Given these parameters CULVERZ(Ver. 6.1) solves
a re-arranged form of equation (7) using the calculated design discharge to obtain the
structure height necessary to pass the design flow. Because the solution is valid for
rectangular structures, it is useful for sizing log culverts and bridges for rectangular cross-
sections. A user-specified freeboard allowance (with a default value of 0.6 meters) is added
to the design height to account for debris and sediment accumulation at the upstream side of
the structure.
A bridge over a natural channel (Figure 3.1) is different from that ofa rectangular structure in
that the channel has natural banks (assumed trapezoidal), and crossing construction can take
place outside the wetted perimeter. When solving for the design dimensions, a user must
specifi the top width, bottom width and channel depth ofthe existing natural channel, as well
as the channel slope and channel bottom material. The program iteratively solves for the
design height (including a user-specified freeboard allowance) to pass the design discharge,
based on the information provided. When the design height is greater than the channel depth
(Case 1, Figure 3.1), the program also calculates the height of the abutments required to
7 According to the Forest Road Engineering Guidebook (Sept. 1995), log culverts should have an opening with a
minimum width of 1.5 m and a minimum heieht of 0.5 m.
(7)
Summit Environmental Consultants Ltd.Project#042-13.00 23
F'INAL REPORT18-October-2000
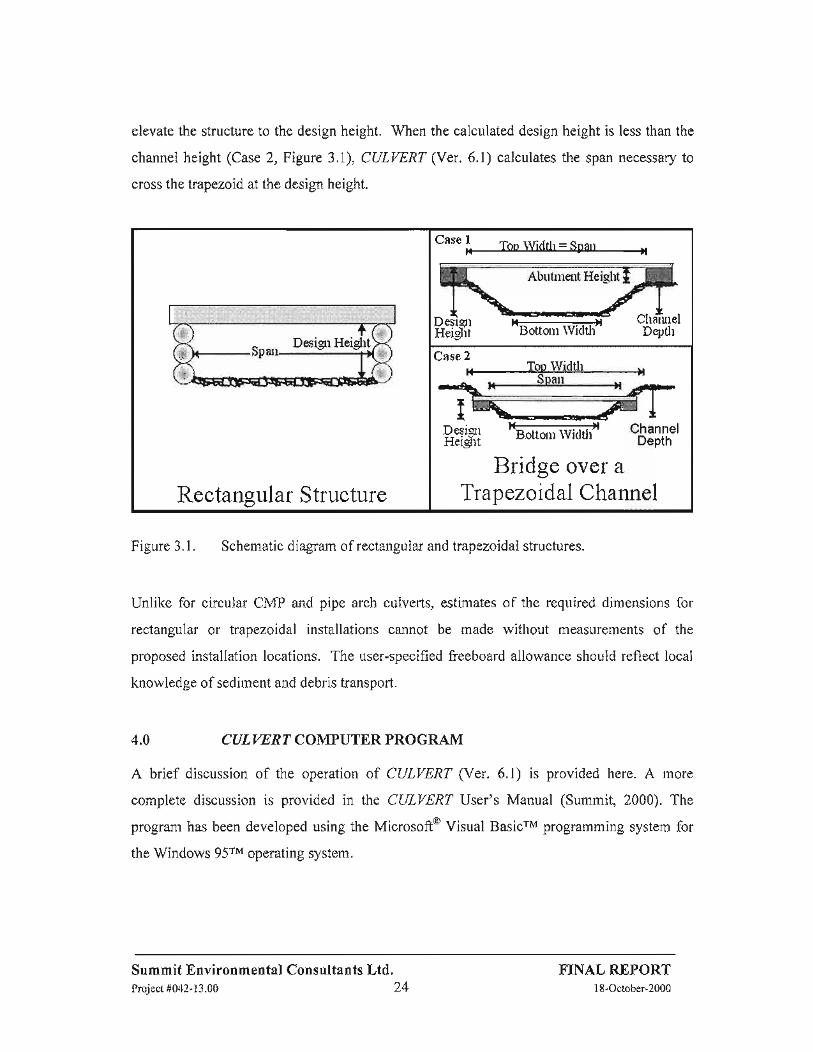
elevate the structure to the design height. When the calculated design height is less than the
channel height (Case2, Figure 3.1), CULVERT(Ver.6.1) calculates the span necessary to
cross the trapezoid at the design height.
Figure 3.1. Schematic diagram of rectangular and trapezoidal structures.
Unlike for circular CMP and pipe arch culverts, estimates of the required dimensions for
rectangular or trapezoidal installations cannot be made without measurements of the
proposed installation locations. The user-specified freeboard allowance should reflect local
knowledge of sediment and debris transport.
CULVERT COMPUTER PROGRAM
A brief discussion of the operation of CULVERZ (Ver. 6.1) is provided here. A more
complete discussion is provided in the CULVERT User's Manual (Summit, 2000). The
program has been developed using the Microsoft@ Visual BasicrM programming system for
the Windows 95rM operating system.
4.0
Summit Environmental Consultants Ltd.Project#042-13.00 24
FINAL REPORT1 8-October-2O00
,* I^ Desiqr Heisht:in 2rì
Ç
Ë
II +
case@
Case2.. Tou Width ,
DH
trresiqeigT
EIilrt
Rectangular Structure Trapezoidal Channel

In order for the CULVERT (Ver. 6.1) program to calculate the design discharge for a
proposed crossing, the user must select the appropriate return period (either the 50-year or
100-year return period), the appropriate peak flow zone (Map 1), and specifr the drainage
area of the watershed upstream of the proposed crossing. The program then calculates the
mean design flow estimate, plus a range in design flows corresponding to the upper and
lower limits of a one standard error (68%) confidence interval about the mean design flow
estimate.
The user then selects the desired type of installation; either:
single, double or partially buried CMP culvert,
single pipe arch culvert,
rectangular structure, or
bridge over trapezoidal channel.
The program computes a design installation size plus a range in sizes, based on the range in
the design flow estimates. A recommended size for new installations is also provided, based
on the upper limit of the one standard error confidence interval.
When the analysis for a given site is complete, the user has the option of saving the data,
returning to the start, or exiting the program. At each stage of the process, the user has the
option of returning to the previous screen or to the start of the program. It is possible to
report and print results from any of the forms within the program, except the form requiring
the user to specifr the site code and drainage area. Two output options are possible: printing
a hard copy table, and exporting the data to a Microsoft ExcelrM spreadsheet file.
Summit Environmental Consultants Ltd.Project#042-13.00 25
F'INAL REPORT18-October-2000

5.0 LTMTTATTONS OF PEAK FLOW MODEL AND CULVERT (VER. 6.1)
COMPUTER PROGRAM
Important considerations related to the use of the peak flow model and computer program are
described here:
1. The peak flow model and CULVERZ (Ver. 6.1) are valid only within the Penticton Forest
District.
2. CULVERT (Ver. 6.1) can only be used by parties holding a valid licence agreement for
this software.
The program is designed to estimate 50-year and 100-year return period peak
instantaneous discharges in locations which are not affected by significant upstream flow
regulation and which are not situated downstream of significant lake, wetland or reservoir
storage. For crossings downstream of natural lakes or wetlands, we suggest that a design
flow of 85% of the value provided by CULVERZ(Ver. 6.1) is appropriate.
The peak flow model and CULVERZ (Ver. 6.1) have been developed using data from
drainage basins that are less than 5,000 krn2 in size. The peak flow model and computer
program should not be used to calculate design discharges for drainage areas larger than
5,000 km2.
The design flow methodology is intended to predict the 5O-year and 100-year retum
period design flows for ungauged locations. However, there may be instances where
design peak flow estimation based on specifìc gauged records is more appropriate.
To account for uncertainty, the program uses the upper 68Yo confidence limit on the mean
design flow as the recommended design discharge.
Common hydraulic assumptions which are generally valid for forest roads have been
made in order to simplifr the calculation of required circular CMP culvert sizes: inlet
control, ponded depth at design flow does not exceed the level of the culvert top, the
culvert entrance is square to the flow and has no sidewalls, and the culvert protrudes from
the fill at both ends.
J.
4"
5.
6.
7.
Summit Environmental Consultants Ltd.Project#042-13.00 26
F'INAL REPORTl8-October-2000

8. The program is intended to provide consistent estimates of opening sizes required to
hydraulically pass design flows. Sizes may be modified by particular field conditions
such as locations where sediment andlor debris loading is expected. Site inspections are
recommended for all proposed culvert installations before a final culvert size is chosen.
Finally, it should be noted that the Forest Practices Code of British Columbia Act stipulates
several provisions related to crossing design in part 2 of the Forest Road Regulation. Some
of the key provisions are listed here:
1. All majors culverts must be designed by a Professional Engineer (P.Eng.). During
operation of CULVERI (Ver. 6.1), the user is cautioned whenever a major culvert is
encountered. Although the estimated design discharge provided by the program will be
valid, the design elements of such installations should be refered to a Professional
Engineer. In these cases, culvert recommendations provided by the program must be
viewed with caution. The program is not intended to replace a proper design by a
Professional Engineer (P.Eng.).
2. The minimum design peak flow for stream culverts and for permanent bridges is the 100-
year return period annual maximum instantaneous discharge. The minimum design peak
flow for temporary bridges is the 5O-year return period annual maximum instantaneous
discharge.
3. With some exceptionse, all bridges must be designed by a Professional Engineer (P.Eng.).
Users of the program are advised to become familiar with these and other relevant provisions
of the Code.
o A major culvert is defìned under Part 1 of the Forest Road Regulation (March 1, 200^0) to be "a stream culverthaving a pipe diameter of 2,000 mm or greater, or a maximum design discharge of 6 m'ls or greater."
eSeeSectionl0,PartloftheForestRoadRegulationunderthe ForestPracticesCodeofBritishColumbiaActlBritish Columbia Provincial Government. March 1. 2000).
Summit Environmental Consultants Ltd.Project#042-13.00 27
FINAL REPORTl8-October-2000

6.0 REF'ERENCES
British Columbia Provincial Government. 1998. Forest Practices Code of British ColumbiaAct. Victoria, B.C.
Ministry of Forests and Ministry of Environment, Lands, and Parks. 1995. Forest RoadEngineering Guidebook. September 1995.
Ministry of Forests and Ministry of Environment, Lands, and Parks. 1996. CommunityWatershed Guidebook. October 1996.
Poulin, V.A. and Argent, H.W. 1998. Stream Crossing Guidebook for Fish Streams - AWorking Draft for 199711998. Prepared for: B.C. Ministry of Forests, B.C. Ministryof Employment and Investment, B.C. Ministry of Environment, Lands and Parks andFisheries and Oceans Canada.
Reksten, D. E. and J. Davies. Unpublished. Guide For Drainage Design in SmallWatersheds in the Blank Forest District (Incomplete study providing guidelines forapplication of the rational formula to estimating flows in small basins in BritishColumbia).
Summit Environmental Consultants Ltd. 2000. CULVERT lJser's Manual - Version 6.1
Prepared for Weyerhaeuser Company Limited. - B.C. Timberlands.
Washington Department of Fish and Wildlife.1999. Fish Passage Design at Road Culverts -A design manual for fìsh passage at road crossings. Washington Department of Fishand Wildlife. Habitat and Lands Program. Environmental Engineering Division.
Summit Environmental Consultants Ltd.Project#042-13.00 28
FINAL REPORT18-October-2000

Appendix A
DESIGN PEAK FLOW AI\ALYSIS:
PENTICTON FOREST DISTRICT

TABLE OF'CONTENTS
TABLE OF CONTENTS.............. ................. i
LIST OF TABLES ...................... i
LIST OF FTGURES.. .................. ii4.1 INTRODUCTrON......... ....................1
4.2 PREVIOUS INFORMATION ......."..1
4.3 DESIGN PEAK FLOW METHODOLOGY ..........................34.3.1 Index Flood Method...... ................3
4.3.1.1 Overview of the Method ........3A.3.1.2 Regional Model for Index F1ood......... .........................44.3.1.3 Return Period Ratios........ .........................64.3.1.4 Instantaneous to Daily Peak Flow Ratio......... .............84.3.1.5 Index Flood Method Design Equations .....................184.3.1.6 Enor Analysis .............. ........18
A32 Rational Formula Method...... ........................20
4.4 DESIGN PEAK FLOV/ CURVES .....,.....,,..,....23
4.5 GUIDANCE FOR SELECTION OF PEAK FLOW ZONE ....................35
4.6 GUIDANCE FOR MODEL USE IN AREAS AFFECTED BY HYDROLOGICsToRAcE ....................36
4.7 LIMITATIONS OF TI{E PEAK FLOW MODEL .........,.....37
4.8 COMPARISON WITH PREVIOUS ESTIMATES................. ................38
4.9 REFERENCES ............. ..................40
LIST OF TABLES
TableA.l. Least-squares regression equations and diagnostics for the index flood vs.drainage area............ .................6
Table A.2. Discharge gauging stations used in regional peak flow analysis. ......................."10
Table 4.3. Return period ratio analysis. .............. .........12
Table 4.4. Instantaneous to daily peak flow ratios. ......I4
Table 4.5. Summary of mean and standard error statistics used in equations (2) to (5). ......20
Table 4.6. Rational Formula method parameters and estimates. .............. .........22
Table 4.7. Rational Formula method equations. ..........22
Table 4.8 Relationship between design culvert size and watershed area for 400 mm and2000 mm CMPs. .....................24
Summit Environmental Consultants Ltd.Project#042-13.00 -Appendix A i
FINAL RT,PORTl8-October-2000
Table 4.9. Design peak flow equation summary. .........24
Table 4.10. Example design peak flow estimates: 5O-year return period. ...........25
Table 4.11. Example design peak flow estimates: 100-year return period. .........26
Table 4.12. Ratio of actual vs. predicted 100-year design peak flows for streams affected bylakes.......... "..........37
Table 4.13 Design discharge comparisons with previous estimates. ..................39
LIST OF FIGT]RES
Figure 4.1. Penticton Forest District study area. .............2
Figure 4.2. Mean annual peak daily discharge vs. drainage area. .......... ...............7
Figure 4.3. Recommended design curves for the 5O-year return period peak discharge - Zone1: Southern Okanagan Basin. ....................27
Figure 4.4. Recommended design curves for the 5O-year return period peak discharge - Zone2: Northern Okanagan 8asin......... .............28
Figure 4.5. Recommended design curves for the 50-year return period peak discharge - Zone3: Eastem Okanagan Highland and Okanagan Range. ....................29
Figure 4.6. Recommended design curves for the 5O-year retum period peak discharge - Zone4: Upper Kettle River.......... .......................30
Figure 4.7. Recommended design curves for the 100-year return period peak discharge -Zone 1: Southern Okanagan Basin. .".........31
Figure 4.8. Recommended design curves for the 100-year return period peak discharge -Zone2: Northern Okanagan Basin. ...........32
Figure 4.9. Recommended design curves for the 100-year return period peak discharge -Zone3; Eastern Okanagan Highland and Okanagan Plateau. .........33
FigureA.l0.Recommended design curves for the 100-year return period peak discharge -Zone 4: Upper Kettle River. ......................34
Summit Environmental Consultants Ltd.Project#042-13.00-AppendixA ii
F'INAL REPORTl8-October-2000
A..1 INTRODUCTION
A peak flow hydrology study was conducted for the Penticton Forest District (Figure A.l).
The purpose of the study was to develop a reliable and consistent methodology for estimating
design flows within the Penticton Forest District. The study was a component of a larger
scale project to develop a user-friendly method to derive consistent estimates of required
culvert sizes within the Penticton Forest District. The results of the hydrology study have
been incorporated into the computer program CULVERT (Ver. 6.1) which is a Windows 95rM
compatible computer program that has been customised specifically for the Penticton Forest
District. The program CULVERT (Ver. 6.1) performs the required calculations - its
operation is summarised in a separate report (Summit,2000).
The peak flow hydrology study included two major components:
t. review of existing data, information, reports, and analyses relevant to the hydrology of the
Penticton Forest District (Figure 4.1), and
development of an appropriate methodology for estimating the required design peak
flows, which comprises both the Index Flood Method and the Rational Formula Method.
This Appendix describes the methods employed during the study, and the results obtained.
A.2 PREYIOUS INF'ORMATION
Relevant information includes discharge data collected at many gauging stations - operated
by Environment Canada and by the United States Geological Survey (USGS) - during the
past 100 years in the interior of British Columbia and in Washington State. Data for the
present study were extracted from the Hydat CD-ROM published by Environment Canada
(Environment Canada, 1996) and downloaded from the USGS web page
(h|tp:llwaterdata.usgs.gov/nwis-w/us). These gauging stations have operated over periods
ranging from 4 to 54 years. Intensity-duration-frequency curves for precipitation records,
2.
Summit Environmental Consultants Ltd.Project#042-13.00-AppendixA 1
F'INAL REPORT18-October-2000

Figure 4.1. Penticton Forest District study area.
Fr*rüËfüffi &þikl Fuq4rU
-È
ÀEAtÀ*
Summit Environmental Consultants Ltd.Project#042-13.00-AppendixA 2
FINAL REPORTl8-October-2000

collected by the Atmospheric Environment Service were also used (Environment Canada
1991). Another useful data source was an unpublished report presenting a methodology for
applying the Rational Formula to discharge estimation (Reksten and Davies, unpub.).
A.3 DESIGN PEAK FLOW METHODOLOGY
The methodology chosen to estimate design peak flows for the Penticton Forest District (the
study area) is the Index Flood Method for drainage areas greater than 10 km2, and a modified
version of the Rational Formula for drainage areas less than l0 km2 (after Reksten and
Davies, unpub.). The methodology is consistent with the estimation procedure recommended
by Reksten (1987) for the estimation of peak flows at ungauged locations in B.C.
The intent of the hydrologic analysis is to provide a reliable and consistent estimate of the 50-
and 100-year return period peak flows for ungauged locations within the study area. Given
statistical uncertainty in the design peak flow estimate, a one standard error (68%) confidence
interval in the design peak flow estimate is computed, the upper limit of which is adopted as
the recommended design peak flow for new installations.
A..3.1
A..3.1.1
Iruonx Fr,oon Mnruoo
Overview of the Method
The Index Flood Method is commonly used for estimation of peak discharges at ungauged
locations in Canada (National Research Council of Canada, 1989) and is entirely consistent
with the methodology presented in the Community Watershed Guidebook (p. 70-72,
MoFA4ELP, 1996). Relevant data from gauged locations in the vicinity of the locations
where estimates are required is used to derive an appropriate model for calculating the annual
maximum daily discharge (the index flood). Ratios of higher return period (e.g. 5O-year and
Summit Environmental Consultants Ltd.Project#042-13.00-AppendixA 3
FINAL REPORT18-October-2000
100-year) annual maximum daily discharges to the index flood are then determinedl. Finally,
an average ratio of the peak instantaneous to the peak daily discharge is determined2.
The maximum instantaneous discharge {calculated using equations (2) and (3), Section
4.3.1.5) is used as the basis for crossing design. In the present application of the Index
Flood Method, a one standard error (68%) confidence interval is provided for the design
discharge estimate. The confidence interval is based upon the combined standard errors of
the index flood, the instantaneous-to-daily peak discharge ratio, and the ratios of the 5O-year
and 10O-year return period flows to the index flood.
^.3.1.2Regional Model for Index Flood
Historic streamflow data from hydrometric stations in the interior of British Columbia and
northern Washington State were examined for relevance to the study area. Data ftom 62
gauging stations were selected for use in developing the appropriate models for the index
flood. This data set does not include stations on streams that are regulated or that are
downstream of major lakes or wetlands, nor does it include stations with less than 4 years of
peak flow record. All of the gauging stations have drainage areas less than 5,000 km2.
Stations larger than this typically integrate the hydrologic characteristics ofseveral zones, and
therefore cannot be used.
The data for each station was used to calculate the mean annual peak daily discharge for the
period of record. The estimate was then adjusted to a long term mean based on the flow
records for several stations with records extending back to near the beginning of the 20th
century. This reduces the effect of an individual station's particular period of record. The
adjusted mean annual peak daily discharges for the 62 stations are the "index floods" for
those stations.
t These ratios are used to scale the index flood upwards to the desired retum period.2 This ratio is used to scale peak daily discharges to peak instantaneous discharges.
Summit Environmental Consultants Ltd.Project#042-13.00-AppendixA 4
FINAL REPORTl8-October-2000
These values were then transformed to a scale-independent estimate of the discharge per
square kilometre3, and plotted on a l:250,000 scale base map. Spatial relationships between
the streamflow gauging stations were then examined, and four zones homogeneous with
respect to peak flows were delineated within the study area. Both the peak flow zones and
the gauge locations are shown on Map 1 of the main report. The zones are:
1. Zone l; Southern Okanagan Basin,
2. Zone2; Northern Okanagan Basin,
3. Zone3: Eastern Okanagan Highland and Okanagan Range, and
4. Zone 4: Upper Kettle River.
The index flood values (annual maximum daily discharge) for hydrometric stations relevant
to each of the four homogeneous peak flow zones are plotted against drainage area in Figure
A.2. Lines drawn on Figure 4.2 represent least-squares regression lines through the data;
dashed lines represent a 90Yo confidence interval about the mean. Table ,{.1 presents the
equations represented by the least-squares lines, as well as regression diagnostic parameters.
As data presented on Figure A.2 and the sample calculation presented in Table 4.1
demonstrates, the zones are distinct from one another. Estimates of the index flood made for
a drainage area of50 krn2 for each ofthe zones are different from each other at a confidence
level of 90%. Summaries of relevant data for the stations used within each peak flow zone are
provided in Table 4.2.
3 Peak discharge per unit area (Qo2/A) is known to be a function of drainage area (A). This effect must beremoved before basins of different sizes can be compared. For the purpose of zone delineation, we have donethis by calculating and mapping ¡ : qo2/40 75, where Qo2 is the index flood. The exponent 0.75 is approximatelycorrect throughout B.C.
Summit Environmental Consultants Ltd.Project#042-13.00-AppendixA 5
FINAL REPORT1 8-October-2000

TableA.l. Least-squares regression equations and diagnostics for the index flood vs.
drainase area.
1:Qo2 is the mean annual maximum daily discharge [m'ls]2: A is the drainage area [km']3: equal to + 1.65 standard errors from the mean.
4.3.1.3 Return Period Ratios
For stations with appropriately long records4, return period analysis has been performed and
the 50- and 100-year return period annual peak daily discharges have been calculated. Four
different distribution types were fit to the data: Pearson Type III, Log Pearson Type III, Log
Normal and Gumbel distributions. Each distribution type was qualitatively assessed for
goodness of fit, and where the fit was questionable, the Kolmogorov-Smimov test was
applied. Additionally, the expected value of the skew of the distribution was assessed for the
Log Normal and the Gumbel distributions. For a Log Normal distribution, the expected skew
of the log of discharge is 0.0 {i.e. Log(Qp) is normally distributed}. The expected skew for
the Gumbel distribution is given by:
y: 1.14(1 + 8.5/n)
" For estimating the 50-year return period a minimum record length of 14 years was selected. For the 100-yearretum period, a minimum record length of 20 years was selected. These are based on guidelines for floodfrequency analysis in 8.C., presented in Reksten (1987).
t The Pearson Type III and Log Pearson Type III include skew as a parameter ofthe distribution, andthereforeskew has no fixed expected value.
(1)
Summit Environmental Consultants Ltd.Project#042-13.00-AppendixA 6
F'INAL REPORTl8-October-2000
Zone Regression Equationl' 2 R, Standard error
of estimate
[in log units]
Sample Calculation lA:50 km')
Estimate
t#trl90% Confidence Intervalr
Upper Limitlmlsl
Lower Limitlm3/s.l
1 LOG(Q,z) :0.779LOG(A) - 1,230 0.830 0.152 1.24 2.ll 0.642
2 LOG(Q"?) : 0.760LOG(A) - 0.756 0.962 0.088 3.43 4.79 2.45
J LOG(Q,2) : 0.81 ILOG(A) - 0.573 0.992 0.063 6.37 8.08 5.01
4 LOG(O",) : 0.802LOGíA) - 0.293 0.995 0.037 It.7 13.3 10.3
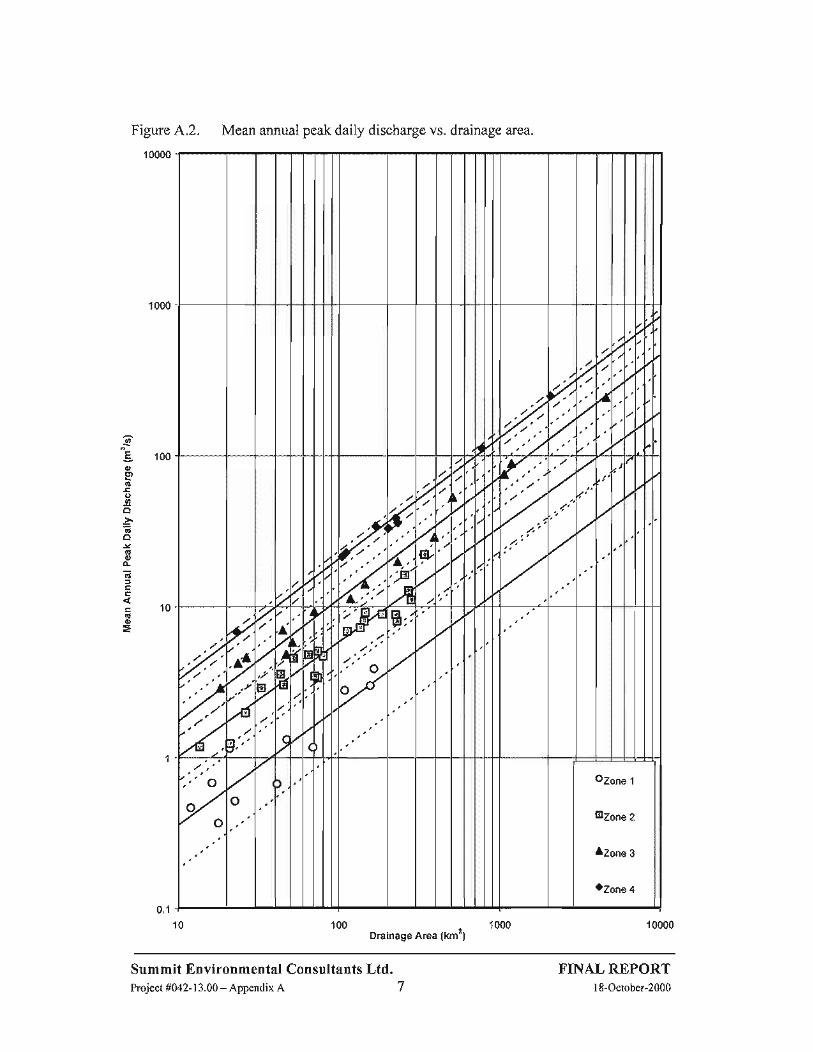
Figure 4.2. Mean annual peak daily discharge vs. drainage area.
't 0000
10
tn
e -^^
octtr!E().12oÈGoJn¡oo-rú
tc 10ño
=
100 - 1000Drainage Area (km')
Ø
a
,4
I
a
?
/
I,,F.
.E
2'/,
P
,.
I
/,
Et--/
A
/BÉ
(
,/
\,1å
:
4'.1
frfl
',1,
I
4
q
o, ozone 1
Elzone 2
AZone 3
alZone 4
Summit Environmental Consultants Ltd.Project#042-13.00-AppendixA 7
F'INAL REPORTI 8-October-2000
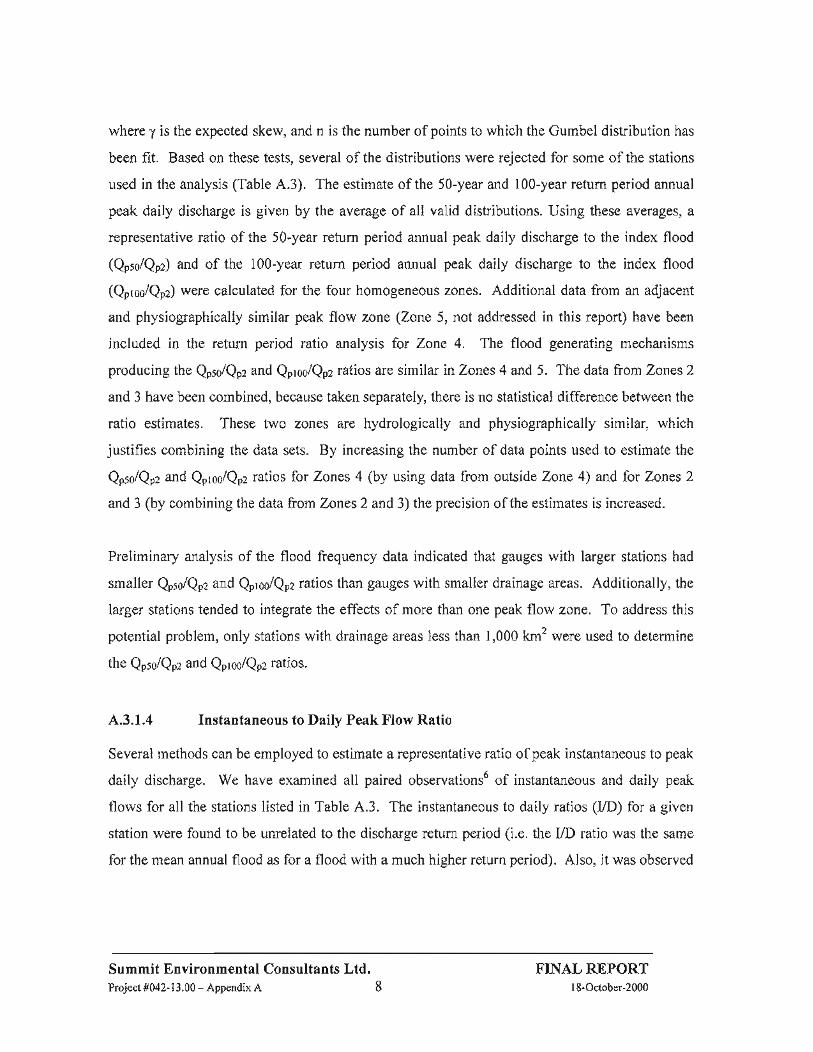
where y is the expected skew, and n is the number of points to which the Gumbel distribution has
been fit. Based on these tests, several of the distributions were rejected for some of the stations
used in the analysis (Table 4.3). The estimate of the 50-year and 100-year return period annual
peak daily discharge is given by the average of all valid distributions. Using these averages, a
representative ratio ofthe 50-year return period annual peak daily discharge to the index flood
(QpsoiQpz) and of the 100-year return period annual peak daily discharge to the index flood
(Qproo/Qpz) were calculated for the four homogeneous zones. Additional data from an adjacent
and physiographically similar peak flow zone (Zone 5, not addressed in this report) have been
included in the return period ratio analysis for Zone 4. The flood generating mechanisms
producing the Qpso/Qp2 and Qproo/Qpz ratios are similar in Zones 4 and 5. The data ftom Zones 2
and 3 have been combined, because taken separately, there is no statistical difference between the
ratio estimates. These two zones are hydrologically and physiographically similar, which
justifres combining the data sets. By increasing the number of data points used to estimate the
Qpso/Qpz and Qproo/Qpz ratios for Zones 4 (by using data from outside Zone 4) and for Zones 2
and 3 (by combining the data from Zones 2 and 3) the precision of the estimates is increased.
Preliminary analysis of the flood frequency data indicated that gauges with larger stations had
smaller Qpso/Qnz and Qroo/Qpz ratios than gauges with smaller drainage areas. Additionally, the
larger stations tended to integrate the effects of more than one peak flow zone. To address this
potential problem, only stations with drainage areas less than 1,000 km2 were used to determine
the QpsoiQn2 and Qp16s/Qpz ratios.
A..3.1.4 Instantaneous to Dailv Peak Flow Ratio
Several methods can be employed to estimate a representative ratio of peak instantaneous to peak
daily discharge. We have examined all paired observations6 of instantaneous and daily peak
flows for all the stations listed in Table 4.3. The instantaneous to daily ratios (I/D) for a given
station were found to be unrelated to the discharge return period (i.e. the I/D ratio was the same
for the mean annual flood as for a flood with a much higher return period). Also, it was observed
Summit Environmental Consultants Ltd.Project#042-13.00-AppendixA 8
F'INAL REPORT18-October-2000

that the I/D ratios were higher and more variable for drainage basins smaller than 300 km' than
for basins larger than 300 km2. Based on these findings, we have calculated the average I/D ratio
using all paired observations of instantaneous and daily peak flows from only the stations with
drainage areas less than 300 km2. There are 14 stations and 188 total observations suitable for
this calculation. The data and the mean I/D ratios are presented in Table 4.4. We have applied
IiD ratios of:
o 1.16 to Zone 1, based on 58 observations from four stations inZone I,
o 1.16 to Zone 4, based on 35 observations from three stations in Zones 4 and 5, and
o 1.15 to Zones 2 and3. based on 95 observations from seven stations in Zones 2 and3.
6 A paired observation is comprised of a daily peak discharge and an instantaneous peak discharge from the same
flood event (i.e. within the same 24 hour period).
Summit Environmental Consultants Ltd.Project#042-13.00- Appendix A 9
FINAL REPORTl8-October-2000

Table 4.2. Discharge gauging stations used in regional peak flow analysis.
Peak flowzone
Station Name Station No.Drainage
Arealkm2ì
Period ofRecord
RecordLengthlvears)
Adjusted'mean annualmaximum dailv discharse
m'ls L/skm'I BL]LL CREEKNEAR CRUMP 08NM133 46.9 1965-1986 21 1.30 27.7I GREATA CREEKNEAR THE MOUTH 08NM173 40.7 r97r-r998 26 0.660 t6.2I HAYNES CREEK NEAR OSOYOOS 08NM126 r7.6 19s9-1964 4 0.362 20.61 INKANEEP CREEK NEAR OLI\'ER 08NM0l2 t64 1920-1950 l8 3.82 zt .5
I KEREMEOS CREEK ABOVE MARSEL CREEK 08NL014 68.6 920- 927 I 1.15 16.8
t MCLEAN CREEKNEAR OKANAGAN FAILS 08NM00s 20.7 t92t- 926 6 l.r4 s4.9I SINLAHEKIN CREEK ABOVE BLUE LAKE NEAR LOOMIS ' t244000 108 1924-1930 2.748 25.4I SOUKUP CREEK NEAR HEDLEY 08NL035 22.3 t965-1979 t4 0.509 22.81 SPECTACLE LAKE TRIB NEAR LOOMIS t2443700 11.9 r96t-r976 l6 0.4s8 38.5I TONASKET CREEK AT OROVILLE' t2439300 156 1950-1991 26 2.957 r9.0I TREHEARNE CREEK NEAR PRINCETON 08NL037 16.1 1965-r979 t4 0.671 41.72 ASP CREEKNEAR PRINCTON 08NL0l5 51.8 960- 969 10 4.48 86.42 BELVE\'IJE CREEK NEAR OKANAGAN 08NM035 I J.t 92t- 986 28 s.00 68.32 BOLEAN CREEK AT FALKLAND 08LE00l 228 911- 964 t5 7.92 34.72 BOLEAN CREEK NEAR THE MOUTH 08LE094 224 975- 986 ll 8.71 38.92 BRASH CREEK NEAR ENDERBY 08LC004 32.6 916- 967 l0 2.86 87.62 ANOE CREEK NEAR SALMON ARM 08LE005 279 911- 962 t2 r0.9 39.22 DRY CREEK TRIB NEARMOLSON' 12439200 4.35 958- 977 20 0.515 il82 EAST CANOE CREEKABO\IE DAM 08LE108 20.8 983- 998 l4 t.l2 53.82 FERRY CREEKNEARLUMBY 08LC034 145 959- 977 18 9.06 62.52 FISHTRAP CREEK NEAR MCLURE 08L8024 lJ) 9 15- 998 )z 6.89 51.02 TNKANEEP CREEK NEAR OLIVER 08NM082 70.4 942- 94s 4 3.42 48.62 LOUIS CREEK AT BOI-INDARY OF RAILWAY BELT 08LB0l0 269 9t2- 980 6 t2.6 46.8z MONTE CREEK ABOVE MONTE LAKE DIVERSION 08LEl03 64.3 982- 994 t2 4.74 73.82 MOODY CREEK NEAR CHRISTINA 08NN02l 13.5 972- 984 l3 t.l6 86.22 SALMON RIVER ABOVE SALMON LAKE 08LE075 143 966- 998 31 7.86 55.02 SHINGLE CREEK ABOVE KALEDEN DIVERSION 08NM038 44.8 920- 971 t4 2.99 66.72 ]ILVER CREEKNEAR SALMON ARM 08LE043 25.9 923- 948 11 r.95 75.42 SIWASH CREEK TRIB NEAR TONASKET, 12444400 t.7l 957- 977 20 0.331 r93.52 rOATS COULEE CREEK NEAR LOOMIS' t2442000 55t 920- 979 31 21.8 64.62 TRINITY CREEK ABOVE DIVERSION 08LC048 42.9 98 l- 984 4 3.51 81.9z VANCE CREEK BELOW DEFIES CREEK 08LC040 T'.J 970- 998 25 3.29 44.92 VASEAUX CREEKABOVE DUTTON CREEK 08NM015 255 920- 982 27 I6.0 62.7
10
Summit Environmental Consultants Ltd.Project#042-13.00 - Appendix A
FINAL REPORTl8-October-2000

Table 4,.2. Discharge gauging stations used in regional peak flow ana continued
Peak flowZone
Station NameStation
No.
DrainageArealkm2)
Period ofRecord
RecordLength(years)
Adjusted'mean annualmaximum dailv discharse
m-/s Llskm"2 WATCHING CREEK NEAR KAMLOOPS 08LF049 79.5 950- 974 l3 4.65 58.52 WHIPSAV/ CREEK BELOV/ LAMONT CREEK 08NL036 185 965- 998 32 8.71 47.12 WHITEMAN CREEK ABOVE BOULEAU CREEK 08NMl74 lt2 971- 998 26 6.87 61.3
3 ASHNOLA RIVER NEAR KEREMEOS 08NL004 1050 915- 998 54 74.1 70.6J CHERRY CREEKNEAR CHERRYVILLE 08LC049 503 982- 990 9 52.1 104J CORNING CREEK NEAR SOUILAX 08L8077 26.2 979- 998 t7 4.53 173J DENNIS CREEKNEAR I78O METRE CONTOUR 08NM242 J.TJ 98s- 998 t2 0.7Q2 188
HEDLEY CREEK NEAR THE MOUTH 08NL050 389 974- 998 ZJ 28.1 72.1J HELLER CREK ABOVE DIVERSIONS 08LF091 46.6 983- 994 n 4.s6 97.8J HIUHILL CREEK ABOVE DIVERSIONS 08LD002 69.7 917- 998 22 8.39 120J IAMIESON CREEK ABOVE DIVERSIONS 08LB083 230 990- 993 4 19.5 84.6J KETTLE RIVERAT KETTLE VALLEY 08NN004 4560 941- 921 8 238 52.35 MANN CREEK NEAR BLACKPOOL 09L8050 295 927-2981 20 30 102J MARA CREEK NEAR SICAMOUS 08LC024 zJ -3 946-t949 4 4.16 t79J MIDDLE FORK TOATS COULEE CREEK NEAR LOOMIS' 12441700 44.3 965-t975 10 6.86 155
J ONYX CREEK NEAR MAGNA 08LE028 50.8 9ts-r92s 4 5.72 113
J POOLEY CREEK ABOVE POOLEY DITCH 08NM210 l8.t 974-1979 5 2.84 157
J IRAPPING CREEKNEAR THE MOUTH 08NN019 t44 966-1998 31 14.l 97.7J IWO FORTY-ONE CREEK NEAR PENTICTON 08NM24l 4.5 984-1998 13 0.90s 201J VASEAUX CREEK ABOVE SOLCO CREEK 08NMl7l l17 97r-1998 26 10.9 93.1J WEST KETTLE zuVERBELOW CARMI CREEK 08NN022 tt70 1974-1995 22 87.3 74.6n BARNES CREEK NEAR NEEDLES 08NE077 20r 195 r-1998 46 32.4 161
4 BURRELL CREEK ABOVE GLOUCESTER CREEK 08NN023 aaA 1974-1998 ZJ 38.3 t7t4 GRANBY RIVERAT GRAND FORKS 08NN002 2050 l9 l4-1998 36 244 119
4 FIARPER CREEKNEAR THE MOUTH 08L8076 168 r973-1998 z) J J.J 198
4 RAFT RIVER NEAR CLEARV/ATER 08LB0t7 764 t9t5-1957 tl 110 t44A ROSS CREEK NEAR ANGLEMONT 08LE029 104 19t5-1925 4 2t.l 2034 TRAPPING CREEK AT I22O M CONTOUR 08NN020 22.8 l97l-1981 l1 6.72 29s
^ WEST KETTLE RIVERNEAR MCCULLOCH 08NN0l5 230 1965-1998 31 35.7 155
l: These values have been adjusted to the08LF022 & 08LF05l; Kettle River nearVy'ashington State, U.S.A.
long-term mean of one of the following stations, depending on location (ThompsonLaurier, station 08NN0l2; or Columbia River at Nicholson, station 08N4002).
River at Spences Bridge, station2: These stations are located in
Summit Environmental Consultants Ltd.Project#042-13.00 - Appendix A u
F'INAL REPORTl8-October-2000
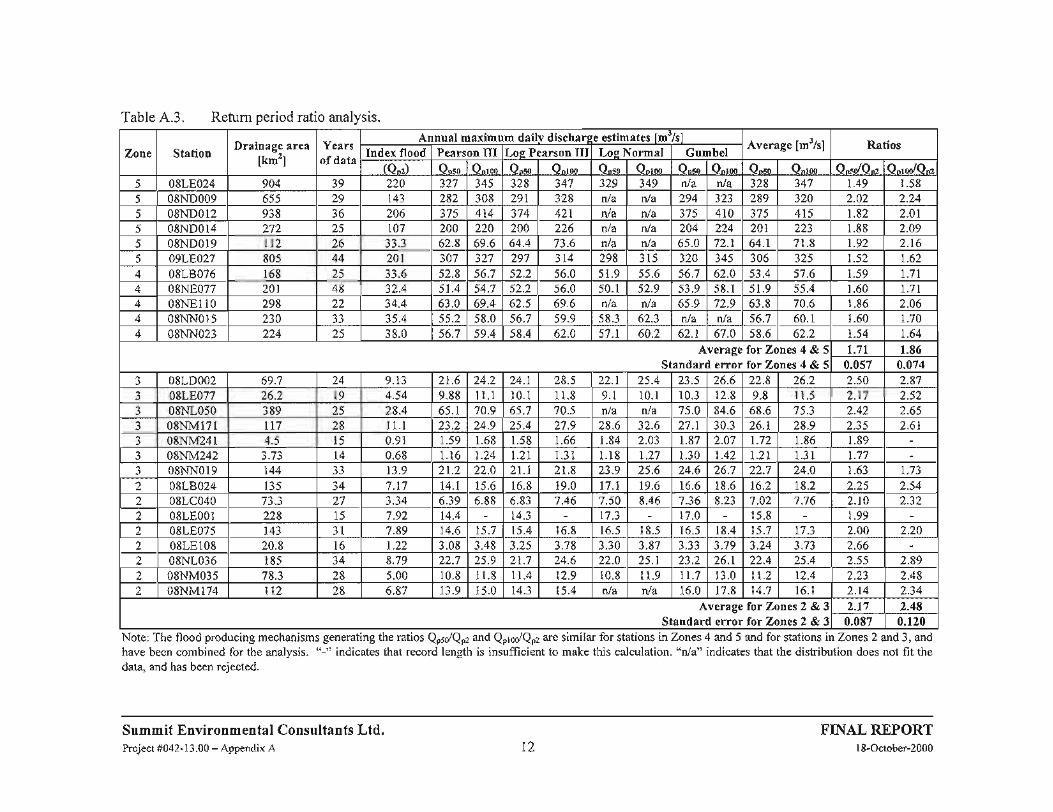
Table 4.3. Return period ratio analysis.
Note: The flood producing mechanisms generating the ratios Qpso/Qpz and Q0166/Qo2 are similar for stations in Zones 4 and 5 and for stations in Zones 2 and3, and,
have been combined for the analysis. "-" indicates that record length is insufficient to make this calculation. "n/a" indicates that the distribution does not fit thedata, and has been rejected.
Summit Environmental Consultants Ltd.Project #042-13.00 - Appendix A
FINAL REPORTl8-October-2000
Zone StationDrainage area
Ik-']Yearsof data
Annual maximum dailv discharse estimates fm'/sìAverage [m3/s] Ratios
Index flood Pearson III Loc Pearson III Los Normal GumbellO-,) O-.n O-rnn O^.n O-r* O-.n O^t- O-.n O^t- O-"n O-' O-.JO-r O-'JO-"
) 08LE024 904 39 220 tz I 345 328 347 329 349 nla rua 328 347 1.49 1.58
08ND009 655 29 t43 282 308 291 328 n/a nla 294 )23 289 320 2.02 2.24
5 08ND012 938 36 206 37s 4t4 374 421 nla n/a Jt) 410 375 415 r.82 2.01
5 08ND0l4 272 25 r07 200 220 200 226 nla nla 204 224 201 zz) 1.88 2.095 08ND019 lt2 26 JJ.J 62.8 69.6 64.4 /J.O nla n/a 65.0 72.1 64.1 7r.8 r.92 2.t65 09L8027 805 44 201 JUI JZ I 297 314 298 315 320 345 306 325 1.52 1.62
4 08L8076 168 25 33.6 s2.8 s6.7 52.2 s6.0 51.9 55.6 56.7 62.0 53.4 s7.6 1.59 t.7l4 08NE077 201 48 32.4 ) r.4 54.7 s2.2 56.0 50.1 52.9 s3.9 58.1 51.9 55.4 1.60 t.7t4 08NE110 298 22 34.4 63.0 69.4 62.5 69.6 n/a nla 65.9 72.9 63.8 70.6 1.86 2.064 08NN015 230 JJ 35.4 55.2 58.0 56.7 59.9 58.3 62.3 nla nla 56.7 60.1 1.60 1.70/l 08NN023 'r1,1 25 3 8.0 56.7 59.4 58.4 62.0 57.t 60.2 62.1 67.0 58.6 62.2 1.54 t.64
Average for Zones 4 & 5
Standard error for Zones 4 & 5
t.7t 1.860.057 0.074
J 08LD002 69.7 'r^ 9.13 2r.6 24.2 24.1 28.5 22.t 25.4 23.5 26.6 22.8 26.2 2.50 2.87J 08LE077 26.2 t9 4.54 9.88 11.1 10.1 I 1.8 9.1 l0.l 10.3 12.8 9.8 I 1.5 2.17 2.52J 08NL050 389 25 28.4 65.1 70.9 65.7 70.5 nla nla 75.0 84.6 68.6 75.3 2.42 2.6sJ 08NM17r tt7 28 ll.1 23.2 24.9 25.4 27.9 28.6 32.6 27.1 30.3 26.1 28.9 2.35 2.61J 08NM241 4.5 15 0.91 1.59 r.68 L58 r.66 1.84 2.03 1.87 2.07 1.72 1.86 1.89
J 08NM242 J.IJ t4 0.68 l.l6 t.24 T.2I 1.31 1.1 8 1.27 1.30 1.42 r.21 1.3 I t.77J 08NN0l9 r44 JJ 13.9 21.2 22.0 2r.l 21.8 23.9 25.6 24.6 26.7 22.7 24.0 1.63 t.732 08L8024 IJf 34 7.17 14.l 15.6 r6.8 19.0 17.1 19.6 r6.6 18.6 t6.2 t8.2 2.25 2.542 08LC040 TJ.J 27 3.34 6.39 6.88 6.83 7.46 7.50 8.46 t.50 8.23 7.02 7.76 2.10 2.322 08LE001 228 t5 7.92 14.4 t4.3 17.3 t7.0 r5.8 t.992 08LEo75 t43 3l 7.89 14.6 15.7 1<
^ r6.8 16.5 18.5 r6.5 18.4 15.7 17.3 2.00 2.20
2 08LE108 20.8 l6 1.22 3.08 3.48 3.25 3.78 3.30 3.87 J.JJ 3.79 3.24 J./J 2.662 08NL036 185 J1 8.79 22.7 25.9 21.7 24.6 22.0 25.1 23.2 26.1 22.4 25.4 2.55 2.89
2 08NM035 78.3 28 5.00 10.8 I 1.8 11.4 t2.9 10.8 11.9 tt.7 13.0 tt.2 12.4 2.23 2.48
2 08NMl74 tt2 28 6.87 13.9 1s.0 14.3 15.4 nla nla 16.0 17.8 14.7 16.1 2.14 2.34
AStandarr
verage for Zones 2 &I error for Zones 2 &
2.17 2.480.087 0.120
t2

Table 4.3. Return period ratio analysis (continued).
Note: The flood producing mechanisms generating the ratios Qpso/Qpz and Qo1¡e/Qo2 are similar for stations in Zones 4 and 5 and for stations in Zones 2 and 3, andhave been combined for the analysis. "-" indicates that record length is insufficient to make this calculation. "n/a" indicates that the distribution does not fìt thedata- and has been reiected.
Zone StationDrainage area
Ik-']Yearsof data
Annual peak dailv discharse estimates [m'/slAverage [m3/s] RatiosIndex flood Pearson III Los Pearson III Loe Normal Gumbel
(O"') Q,.n Q.tnn O'.n O.tnn O..n O^t* O-.n O-t* O-.n O^t- Q"sry'Q"' Q"'*y'Q",I 08NL035 22.3 t4 0.51 1.8 2.1 2.t 3.t 1.9 2.4 1.9 2.2 2.( 2.4 3.89 4.77I 08NL037 16.1 t4 0.6i 2.6 3.0 nla nla nla nla 2.9 3.4 2.E 3.2 4.15 4.82I 08NM012 164 t8 3.82 14.6 17.4 l5.t 18.t t5.É t9.6 14.6 t6.s 15.( 18.1 3.92 4.75I 08NM133 46.9 2l 1.3( 4.1 4.7 A'
4.c, 4.8 5.9 4. 4.t 4.3 5.1 3.34 3.91I 08NMt64 13.0 t4 0.2t 0.7 | 0.81 09 l.l 0.98 r.26 0.7t 0.91 0.8s 1.04 4.06 4.94I 08NM173 40.7 28 0.6( 2.4 2.7 2.9 3.5 3.5 4.6 2.5 2.5 2.8 3.4 4.27 5.19
Average for ZonelStandard error for Zone I
3.94 4.730.133 0.177
Summit Environmental Consultants Ltd.Project #042-13.00 -Appendix A
FINAL REPORTl8-October-2000l3

Zone Station Area Year Instantaneous Discharse Daily Discharse I/D ratio1 08NM012 164 t923
192419251927
1944t94519461948
t9491950
3.341.23
1.s92.536.347.937.087.423.626.03
2.971.10
t.472.214.765.956.065.833.t45.07
.12
.t2
.08
.14
.JJ
.JJ
.17
.27
.15
.20I 08NMl33 46.9 7965
1968
t969t97019711972197319741975t976t977t97819791980
1981
1983
19841985
1986
0.9s 1
2.140.9090.3992.775.38
0.6433.341.63
l s3
0.2412.16
0.6511.702.22
0.934r.371.02
2.40
0.900r.45
0.8160.3451.92
4.360.5473.031.47
l 18
0.2211.86
0.5821.241.86
0.883t.l2
0.8502.05
.061.4
.11
.16
.44
.¿.)
.18
.10
.l I
.30
.09
.16
.12
.r9
.06
.22
.20
.t7I 08NM164 13.0 t97t
r9731975t976t9781981
1986
0.4300.0450.2150.1780.3480.3310.202
0.3 82
0.0420.2040.1220.2610.1980.179
.13
.07
.tr)
.46
.JJ
.67
.13
I 08NM173 40.7 t97t197419751976t977197819791980
198 I
1.23
r.691.20
0.8980.r760.9600.2120.2660.258
1.07
1.57r.ll
0.8s20.1610.9430.1980.2580.241
.15
.08
.08
.05
.09
.02
.07
.03
.07Note: Area refers to the drainase area instantaneous discharge and daily discharge refer to the annual
Table 4.4. Instantaneous to daily peak flow ratios.
discharge and daily discharge
maxima (m3ls), and I/D is the ratio of the instantaneous and daily annual maxima for data occurring within one
day of each other.
Summit Environmental Consultants Ltd.Project#042-13.00-AppendixA 14
F'INAL REPORTl8-October-2000
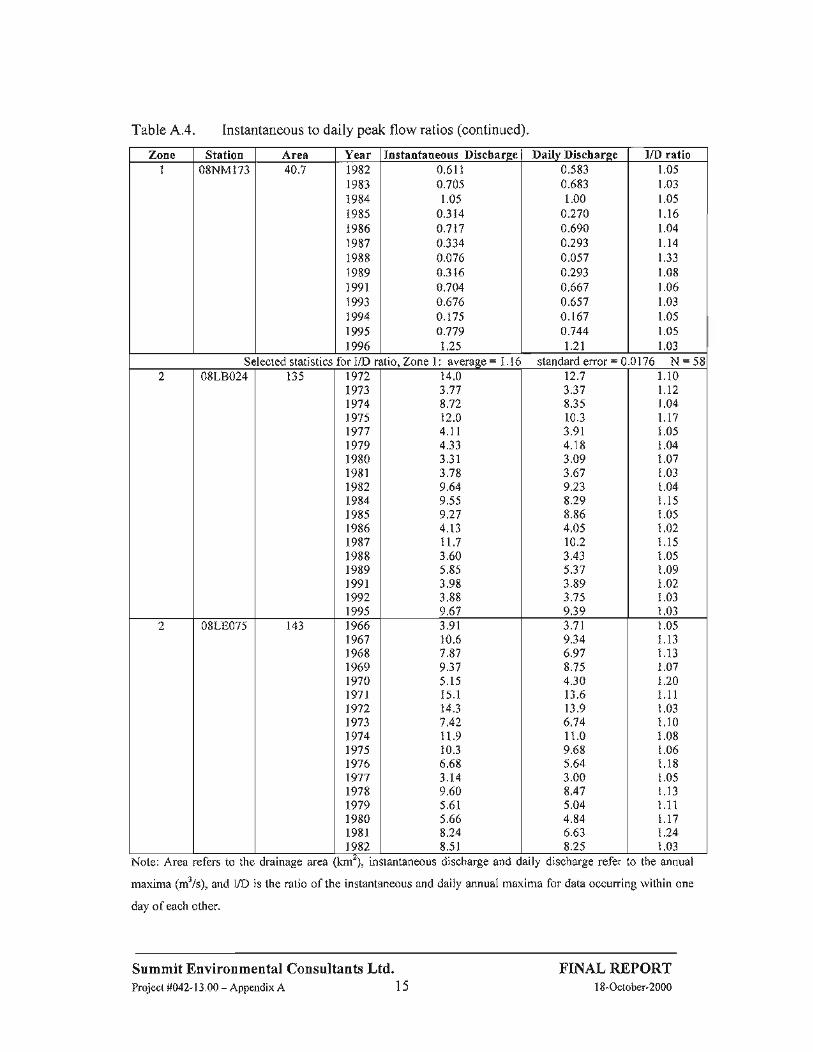
Table 4.4. Instantaneous to daily peak flow ratios (continued).
Zone Station Area Year Instantaneous Discharce Dailv Discharse I/D ratioI 08NM173 40.7 1982
1983
19841985
198619871988
19897991799379941995
1996
0.61I0.7051.05
0.3140.7 t70.3340.0760.3160.7040.6760.1750.779l.2s
0.5830.6831.00
0.2700.6900.2930.0s70.2930.6670.6570.t670.744t.2t
.05
.03
.05
.16
.04
.74
.08
.06
.03
.05
.0s
.03
Selected statistics for I/D rtio. Zone 1: averaee: 1 16 standard error: 0.0176 N :5t2 08L8024 135 1972
19731974r975t977t9791980l98lt982198419851986198719881989t99t19921995
14.0J.I T
8.7212.04.tl+.J J
3.313.789.649.559.274.13tt.73.605.853.983.889.67
12.7
8.3510.33.9t4.183.093.679.238.298.864.0510.23.435.373.893.759.39
l.t0t.t21.04t.t71.051.041.071.031.041.151.051.021.151.051.091.021.031.03
2 08LEO75 t43 1966196719681969r970t97t197219731974197519761977t978t9791980198 It982
3.9r10.67.879.375.1515.114.37.4211.9r0.36.683.149.605.6t5.668.248.51
3.7t9.346.978.754.3013.613.96.7411.09.68s.643.008.475.044.846.638.25
1.051.131.13t.071.201.1 I1.031.101.081.061.181.051.131.11t.t71.241.03
Note: Area refers to the drainase area km'), in stantaneous discharge and daily discharge refer to the annual
maxima (m'/s), and I/D is the ratio of the instantaneous and daily annual maxima for data occurring within one
day ofeach other.
Summit Environmental Consultants Ltd.Project#042-13.00-AppendixA 15
FINAL REPORTl8-October-2000

Table 4.4. Instantaneous to daily peak flow ratios (continued).
Zone Station Areâ Year Instantaneous I)ischarse Dailv Discharse I/D ratio2 08L8075 143 1983
1984198519871988198919901997t9921993199419951996
9.768.757.678.237.695.6810.68.313.5313.14.536.35t5.4
8.728.167.547.165.485.5710.37.803.2972.14.20s.4913.1
l.t21.071.021.151.401.021.037.071.071.081.081.161.18
z 08LEl08 20.8 19831984198519861987198819891990t99tt9931994r9951996
J.)J0.5910.4920.7271.18
0.9890.877t.7 t
0.997l.6r1.26
0.886t.4t
2.990.5280.4650.6961.01
0.8180.8391.32
0.964r.461.22
0.8591.28
t.t9t.t21.06t.04t.t7t.2t1.051.301.031 l01.031.03l l0
2 08LF049 79.5 196319651967196819691970197 I197219731974
4.053.6s5.217.317.423.5 r10.010.15.106.40
3.653.313.886.636.40
9,008.584.135.58
l.ll1.10t.34l l0l l61.09l.l Il.l81.231. l5
z 08LG064 85 198319841985198619881989t99l19921993t994t996
3.517.224.814.872.632.768.661.318.744.6817.5
3.306.554.334.6t2.342.637.307.177.7t4.1912.5
1.06l.l01.1 I1.06Lt21.051.19t.721,13Lt2t.40
08L8083 230 1990l99t1992t993
33.517.312.434.7
24.710.810.026.8
1.361.60t.24r.29
Note: Area refers to the drainage area instantaneous discharge and daily discharge refer to the annualmaxima (nt'/s), and I/D is the ratio of the instantaneous and daily annual maxima for data occurring within oneday of each other.
Summit Environmental Consultants Ltd.Project#042-13.00-AppendixA 16
F'INAL REPORTl8-Octobe¡-2000

Table 4.4. Instantaneous to daily peak flow ratios (continued).
Zone Station Area Year Instantaneous Discharce Dailv Discharse I/D ratio08LE,077 26.2 7982
19831986198719881989r99tt9921994
8.154.827.457.r87.695.543.813.073.05
6.253.28).J)4.885.753.782.882.292.39
.30
.47
.39
.47
.34
.47
.32
.34
.28
Selected statistics for I/D ratio. Zones 2 and3: average: l l5 standard error: 0 0t26 N:94 08LB076 168 t974
r97719781980198119821983198419851986t98719881990l99tt992t99319941996
54.920.936.53l.l44.737.s46.042.737.645.833.442.432.434.039.135.625.437.5
48.717.430.928.333.532.139.037.434.839.13t.436.024.729.33 1.3
3t.422.63r.7
.13
.20
.18
.10
.JJ
.17
.18
.t4
.08
.17
.06
.18
.31
.t6
.25
.13
.12
.18
5 08L8038 280 198519861988198919901992r9941995r996
79.598.565.274.060.579.873.16r.868.s
72.484.861.967.355.067.657.655.865.9
.10
.76
.u)
.10
.10
.18
.27
"11.04
5 08LE086 253 r9731974197 5
19761977t978t9791980
69.995.779.979.070.860.662.953.6
60.679.07t.l65.460.053.255.848.2
152t122t18t413
11
Se lected statistics for I/D ratio. Zone 4: averase: I.16 standard error : 0.0112 N : 3:Note: Area refers to the drainaee area nstantaneous discharee and aily discharge refer to the annualdrainage area (km'), instantaneous discharge and daily discharge
maxima (m3ls), and I/D is the ratio of the instantaneous and daily annual maxima for data occurring within one
day ofeach other.
Summit Environmental Consultants Ltd.Project#042-13.00- AnpendixA 17
FINAL REPORT18-Octobe¡-2000

A'.3.1.s Index Flood Method Design Equations
Design peak flows using the Index Flood Method for
determined as follows:
Qpsoi : (YOXQps/QpzXQpz)
Qplooi : (VD)(Qproo/QpzXQpz)
where:
watersheds larser than 10 km2 are
Qpsoi : 50-year return period annual maximum instantaneous discharge
estimated ¡m3/sl,
Qp100i : 100-year return period annual maximum instantaneous discharge
estimated ¡m3/s1,
o IID: representative ratio of instantaneous to daily peak discharge,
. Qp2: index flood (mean annual maximum daily discharge¡7 ¡m3/s1,
. Qpso/Qn2 : ropresontative ratio of 5O-year retum period annual maximum daily
discharge to the index flood, and
Qproo/Qpz: representative ratio of 100-year return period annual maximum daily discharge to
the index flood.
4.3.1.6 Error Analysis
Uncertainty in the estimated design peak flow derives from possible errors in the raw peak
flow hydrometric data (associated primarily with gauge locations and rating curves),
differences in the value of data from each station due to differences in the length and the
period of record, and possible effors due to the nature of the gauging station (manual or
recording). Furthermore, while we have attempted to account for major differences in
location, elevation and aspect in defining homogeneous peak flow zones, differences in these
7 The index flood is calculated based on the drainage area upstream ofthe proposed stream crossing.
(2)
(3)
to be
to be
Summit EnvÍronmental Consultants Ltd.Project#042-13.00-AppendixA 18
F'INAL REPORT18-October-2000

and other factors (such as forested area, degree ofland-use development, soils and geology)
persist within each zone.
To account for this source of uncertainty, a one standard enor (68%) confidence interval is
provided around the mean design peak flow estimate. The true value of the design peak flow
is estimated to fall within the upper and lower confidence limits 68% of the time. Standard
enors in the design peak flow estimates are based on the combined standard effors in the
annual maximum daily discharge, the instantaneous to daily peak flow ratio, and the ratios of
the 50- and 100-year return period to the mean annual peak daily discharge. The standard
effors of the 50- and 100-year retum period design discharge are estimated as:
(,sn(epnt): e,,oil t +91' +( suo"*',"'\' .( ryl'1"'-"[ rtD ) -la",J%)-l%
) )(4)
(5)
where SÐ(Qpsot)and SE(Qprooi)are the estimated standard effors in the 50- and 100-year
retum period maximum instantaneous discharge; SEoo'oten,andSF,e,rcotepzàra the estimated
standard effors in the mean ratio of the 50- and 100-year return period peak daily discharge to
the mean annual peak daily discharge; SEt t o is the standard error in the mean instantaneous
to daily ratio; and SEø, is the standard error in the mean annual peak daily discharge. The
standard error in the mean annual peak daily discharge is assumed to be a constant percentage
of the mean annual peak daily discharge. Since the relation of mean annual peak daily
discharge to drainage area is log-transformed, standard errors in mean annual peak daily
discharge must be transformed back into linear form before equations (4) and (5) are applied.
A summary of mean and standard error values used in equations (4) and (5) is provided in
Table 4.5.
Summit Environmental Consultants Ltd.Project#042-13.00-AppendixA 19
FINAL REPORTl8-October-2000

The one standard enor (68%) confidence interval about the mean design peak flow estimate
is equivalent to the mean discharge estimate plus or minus the standard error in the design
peak flow estimate.
Table 4.5. Summary of mean and standard error statistics used in equations (2) to (5).
A. Zonel: Southern Okanagan Basin.
Parameter Mean Standard error lo/ol n
TID Lt6 r.52 58
Q"srlQ"z 3.94 3.38 6
Qrr*/Q", 4.t3 3.74 6
B. Zone 2: Northern Okanagan Basin and Zone 3: Eastern Okanagan Highland and OkanaganRange.
Parameter Mean Standard error [7ol ntlD 1.15 1.10 95
Q"s,/Q"z 2.t7 4.0t l5O.tnr/O., 2.48 4.84 l1
C. Zone 4: Upper Kettle River.
Parameter Mean Standard error f7oì nUD 116 0.966 J)
Q's/Q'z t.71 J.JJ l1Q"ror/Q"z 186 3.98 1l
D. Index flood (Qpz) for all zones.
ZoneMean
1m3/s¡ I
Standard errorabove the mean
Im3/sl lI%12
Standard errorbelow the mean
Im3lsl lI%12n
I 1.06 0.450 / 42.s 0.3t0 I 29.2 lt2 4.33 0.970 / 22.4 0.800 / 18.5 25
J 10.8 t.70 I 15.7 t.42 / 13.1 t74 36.9 3.0018.13 2.80 I 7.58 9
1: This value is based on the data presented in Table 4.2, representing different ranges in drainage areas for thedifferent zones. These values are therefore not directly comparable, however the standard errors reported inpercent are directly comparable.
2: Because the index flood is estimated based on a logarithmic relation, the standard error of the estimate isgiven in Log units which, when back-transformed to arithmetic units, produces asymmetrical standard errorsabout the mean.
^.3.2 Rarroxrr,Fonvrur,aMpruoo
Although the data set includes four stations with drainage areas less than 10 km2, the regional
methodology is generally considered suspects for watersheds smaller than about 10 krn2.
t There are two reasons for this: first, most gauges are on streams larger than 10 km2, and second, small basinsbehave differently, hydrologically, than larger ones (this a function ofthe typical size and/or intensity offlood-generating precipitation events).
Summit Environmental Consultants Ltd.Project#042-13.00 -Appendix A 20
F'INAL REPORTl8-October-2000

Therefore, the Rational Formula Method of estimating flows (as presented in Reksten and
Davies, unpublished) was applied to each of the peak flow zones for watersheds less than 10
km2 in area. This involved analysis of precipitation records from climate stations at Oliver,
Vernon and Revelstoke (Environment Canada,199l). The precipitation records were used in
conjunction with the Rational Formula, which is commonly used to estimate design peak
flows for small watersheds in B.C. The equation used to calculate the mean annual
maximum instantaneous discharge is:
Qpzi =O.28CPA
(6)T"
Where:
Qpzi
C
A
T"
P
: mean annual maximum instantaneous discharge ¡m3/s1
: runoff coeffi cient [dimensionless]
: drainage area [km2]
: time-of-concentrationn [tttr]: total precipitation occurring within the time-of-concentration [mm] during
the mean annual maximum precipitation event.
We have made calculations of Qpzi for a number of drainage basin sizes ranging from 0.1 krn2
to 10 km2. The values of C were taken from Table 1 in Reksten and Davies (unpublished)
which expresses C as a function of the surface cover (impermeable, forested, agricultural,
rural or urban) and physiography (mountain, steep slope, moderate slope, rolling terrain or
flaÐ. The table also suggests that the contribution of melting snow to the runoff event be
accounted for by adding a constant (0.10) to the runoff coeffìcient. Similarly, values of T"
were taken from Figure 1 in Reksten and Davies; in which curves relating T. to A are
presented for different physiographic classifications. The values of P were taken from
intensity-duration-frequency (IDF) curves for three climate stations that are representative of
e This is the time required for surface runoff generated at the most distant point in the drainage basin to reach thepoint-of-interest (i.e. the potential crossing location)
Summit Environmental Consultants Ltd.Project#042-13.00-AppendixA 21
FINAL REPORTl8-October-2000

the study area: Vernon, Oliver and Revelstoke. The parameters used and the estimated
discharges are presented in Table 4.6.
Table 4.6. Rational Formula method parameters and estimates.
l. assumes steep slope physiography.2. assumes moderate slope physiography.3. assumes steep slope physiography.4. based on time-of-concentration.5. using the intensity-duration-frequency curve for Oliver.6. using the intensity-duration-frequency cuve for Vemon.7. using the intensity-duration-frequency curve for Revelstoke.
Once the estimates had been made, a power equation relating Qpz¡ and A was derived using a
log-log regression of the same form as used for the index flood method (see Table 4.1). The
equations and R2 for each zone ate presented in Table 4.7.
Table 4.7. Rational Formula method equations.
Zone Equation Rf
I Qpzi: l.77Ao67e 0.999
2&3 Qpzi:0'891406e3 0.999
4 Qpzi:2.13A012o 0.999
These equations were used in the present study only as a guide; specifically, the exponents of
the Rational Formula method equations were used to extrapolate the index flood-derived
Summit Environmental Consultants Ltd.Project#042-13.00-AppendixA 22
FINAL REPORTl8-October-2000
Runoff Coefflrcient(c)
Time-of-concentration (T")
[hrs]
Total Precipitation(P)
[mmlo
Mean Annual Max.Inst. Discharge (Qpz¡)
1m3/s¡
Zone# 1r 2&32 43 1r 2&32 43 1s 2&36 47 I 2&3 4
10 km2 0.90 U. /J 0.90 J.)U 7.20 3.50 tt.2 t4.7 t4.9 8.04 4.30 10.71
7 km2 0.90 0.75 0.90 2.80 600 280 10.5 13.9 t3.7 6.60 3.40 8.62
5 km2 0.90 u. t) 0.90 2.40 5.00 2.40 10.0 r3.1 t2.9 5.27 a,tÀ 678
3 km2 0.90 0.75 0.90 1.80 4.00 1.80 92 12.1 11.6 3.88 r.91 4.86
1km2 0.90 0.75 0.90 l.l5 2.35 1.15 81 10.2 9.79 1.78 0.908 2.14
0.7 km2 0.90 0.75 0.90 0.9ó 2.00 0.96 7.7 9.63 9.14 r.42 0.708 r.68
0.5 km2 0.90 0.75 0.90 0.83 1.70 0.83 7.4 9.73 8.66 l. l3 0.564 1.3 I
0.3 km2 0.90 0.75 0.90 0.68 7.40 0.68 7.0 8.56 8.03 0.78 0.385 0.893
0.1 km2 0.90 075 0.90 0.44 0.88 0.44 6.2 7.34 6.82 0.35 0.175 0.391
4.4
best-fit lines down to drainage areas smaller than 10 km2. Standard error estimates derived
from the Index Flood Method were assumed to be similar in maenitude for drainase areas
less than l0 krn2.
DESIGN PEAK FLOW CTIRVES
The recommended design peak flow curves for the study area, developed according to the
methodology outlined in section 4.3, are presented in Figures 4.3 to 4.10. A 68%
confidence interval about the design peak flow estimate is indicated by the dashed lines in the
above figures. On each curve, the discharge passable by 400 mm and 2000 mm corrugated
metal pipes (CMPs) are indicated, which facilitates identihcation of required culvert sizes
according to watershed area, as outlined in Table 4.8. The equations used to generate the
mean, 68% upper confìdence limit, and 68% lower confidence limit design discharges are
presented in Table 4.9. Example design peak flow estimates are presented in Tables 4.10
and 4"11. When designing new culvert or bridge installations, it is recommended to base the
design peak flow on the upper conf,rdence interval curve. When evaluating the suitability of
existing installations, the upper and lower confidence intervals can be used to provide
reasonable bounds around the "true" design peak flow.
Summit Environmental Consultants Ltd.Project#042-13.00-AppendixA 23
FINAL REPORT18-October-2000

Table 4.8 Relationship between design culvert size and watershed area for 400 mm and
2000 mm CMPs.
ZoneReturnPeriod
Watershed area upstream of new' culverts of thefollowins diameter:
400 mm 2000 mm
I 50 0.l52krr''(15.2 ha) 72.2km100 0.116 km' 111.6 ha) 57.I l<trt'
) 50 0.087 km'(8.7 ha) 42.4krrf100 0.072km" (7.2ha\ 35.61<rî'
350 0.040 km'14.0 ha) I9.9km"100 0.033 km'(3.3 ha) 16.9 km
450 0.028 km'12.8 ha) l2.l l<rî'100 0.025 km' (2.5 ha\ 11.0 km'
1: data based on "recommended" design peak flow (mean design peak flowplus one standard error)
Design peak flow equation summary.Table 4.9.
Peak flowzone
returnperiod
DrainageArea
tk-1
Design Equations
Standard errorbelow the mean [7o]
Mean value
1m3/sl
Standard errorabove the mean [7o]
I 50-year
100-year
>10
<10
>10
<10
29.5
29.5
29.5
29.5
Qpsoi :0.269A¡077e
Qpsot : 0.3384;067e
Qptoo¡ : 0323A¡077e
Qprooi : 0.406A¡067e
42.6
42.6
42.6
42.6
2 50-year
100-year
>10
<10
>10
<10
18.9
18.9
19.1
19.1
Qpsoi : 0'437A¡o 760
Qpsoi : 0.5094¡0 6e3
Qplooi : 0.499A,0760
Qplooi :0.5824¡06e3
22.8
22.8
22.9
22.9
J 50-year
100-year
>10
<10
>10
<10
14.4
14.4
t4.7
14.7
Qpsoi : 0.666A¡0
8ll
Qpsoi :0.873A¡06e3
Qplooi : 0.7614¡o 8r I
Qplooi :0.9984¡06e3
t5.4
t5.4
15.6
15.6
4 50-year
100-year
>10
<10
>10
<10
8.80
8.80
9.10
9.10
Qpsoi : l'024¡0802
Qpsoi : l'234¡0720
Qprooi : 1.104¡o 802
Qprooi : l.331.io72o
9.58
9.58
9.82
9.82
Summit Environmental Consultants Ltd.Project #042-13.00 -Appendix A 24
F'INAL REPORTl8-October-2000

Table 4.10. Example design peak flow estimates: 50-year return period.
Drainage Arealkm2)
Zone 1 lm'lsl Zone 2lm'ls Zone 3 lm'/s Zone 4lm'lslower mean upDer lower mean upper lower mean upper lower mean upper
1000
500100
50.010.0
s.001.00
0.5000.2500.100
4r.224.06.864.00t.l4
0.7100.2380.r490.0930.050
58.534.t9.73f.o/r.621.01
0.3380.21t0.1320.071
83.448.6
r3.98.092.301.44
0.4820.3010.1880. l0l
67.539.9tt.76.932.04t.26
0.413Q.255
0.1580.084
83.249.1
14.5
8.542.511.55
0.5090.31s0.19s0.103
t0260.317.8
10.5
3.081.91
0.62s0.3870.2390.127
155
88. I23.913.63.692.280.7480.4620.2860.152
l8l103
27.915.9
4.312.660.8730.5400.3340.177
208119
32.218.4
4.973.07l.0l
0.6230.3860.204
235135
37.021.25.843.s41.1 I
0.6750.4100.2t2
257t4740.623.36.403.891.22
0.7410.4s00.232
282162
44.5
25.57.014.26t.34
0.8120.4930.255
Drainage Arealkm2)
Zonel ÍLlslkm'l Zone2llls/km'l Zone3 [L/s/km'l Zone 4 [L/s/km'llower mean upper lower mean upper lower mean UDDET lower mean upper
1000
500100
50.010.0
s.001.00
0.5000.2500.100
4t.248.168.679.9tt4142238298372499
58.568.297.3I lJ
t62202338
^aa528708
83.497.2139
t62230288482602I)J
1,010
67.579.7tr71392042524135ll632837
83.298.3145t7l2513u509630779
1.030
102l2rt782t030838162sI I)
957t.270
155
17623927236945674892s
1,140t.520
181
206279318431533
8731,080
1,340r.770
208238322367497615
1,010t,2501,5402,040
23s269370424584709
1,1 10
1,3s01,6402.120
257295406465640777
1,2201,4801,8002.320
28232344551070r852
1,3401,6201,9702.550
Summit Environmental Consultants Ltd.Project #042-13.00 - Appendix A
F'INAL REPORTl8-October-200025

Table 4.11. Example design peak flow estimates: 100-year return period.
Drainage Arealkm2)
Zone I [m'/sl Zone2lm'lsl Zone 3 [m'/sl Zone 4lm'lsllower mean upper lower mean upper lower mean uÞper lower mean upDer
1000500100
50.010.0
s.001.00
0.5000.2500.100
49.5
28.88.23
4.80r.37
0.8540.2860.1790.1120.060
70.240.9
rt.76.81r.94t.2l
0.4060.2540.1580.085
10058.416.7
9.7t2.76r.73
0.5790.3620.2260.r21
76.945.413.47.902.321.44
0.4710.2910.1800.095
95. I56.2
16.5
9.762.871.77
0.5820.3600.2230.118
tt769.0
20.312.0J.f J
2.r80.7150.4420.2740.145
176100
27.215.5
4.202.60
0.8s 1
0.5270.3260.t73
206118
31.918.24.923.0s0.9980.6170.3820.202
239136
36.921.0s.693.52l.l5
0.7140.4420.234
256t4640.123.06.333.84t.2l
0.7320.44s0.230
281160
44.1
25.36.964.23r.33
0.8060.4890.2s3
309t7648.s27.87.644.64r.46
0.8850.5370.278
Drainage Areaftm2)
Zone I îI-lskm'l Zone2llls¡km'l Zone3lLlslkm'l Zone 4 tlls/km'llower mean upper tower mean upþer lower mean uDper lower mean UDÞCT
1000500100
50.010.0
5.001.00
0.5000.2500.100
49.s57.782.3
96.0137
17r2863s8447599
70.281.8t17136
t94242406507
6348s0
100tt7167
194276345579723
9041.210
76.990.9134158
23228747r582720954
95. Itt2165
195
287355s82720890
1.1 80
tt7138
203240353
43671588s
t,090r,450
1762012723104205198sl
1,0501,300t.730
2062353r9364492609998
1,2401,5302,020
239272369420569704
I,1501,4301,7702-340
256292401460633769
1,2101,4701,7802,300
281321441506696846
1,3301,6101,9602.s30
30935248s556764929
1,4601,7702,1s02,780
Summit Environmental Consultants Ltd.Project #042-13.00 - Appendix A
FINAL REPORTl8-October-200026
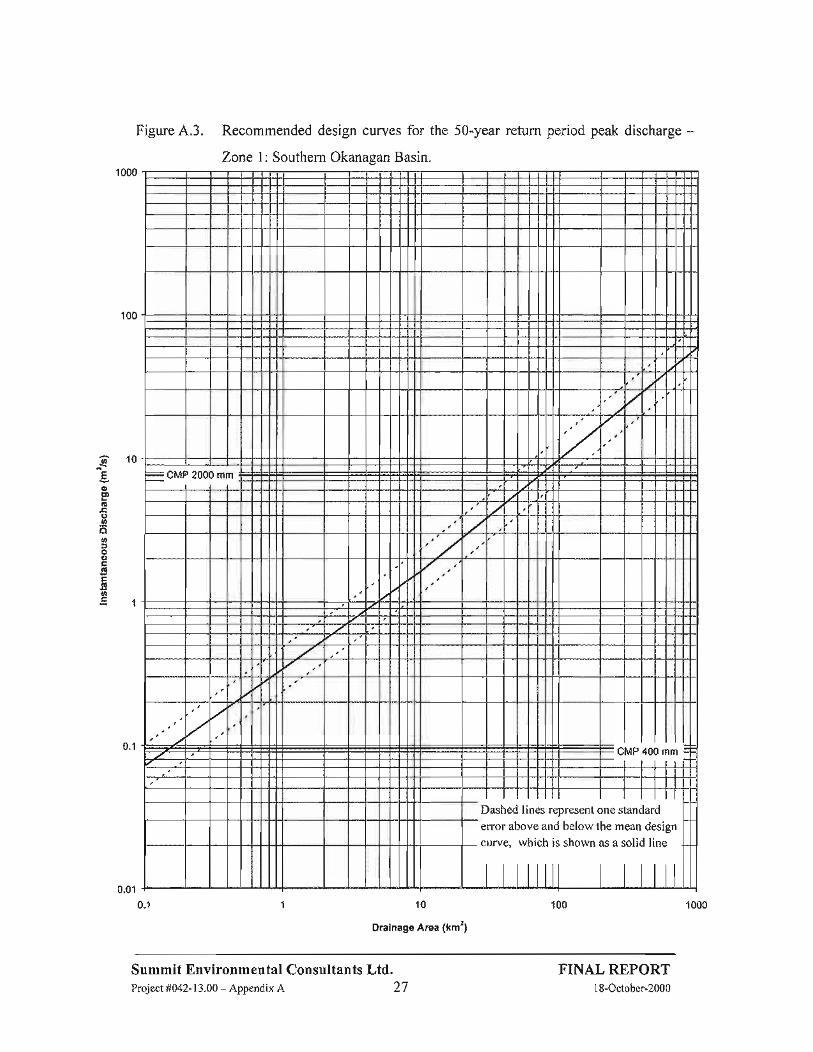
1 000
Figure 4.3. Recommended design curves for the 5O-year return period peak discharge -Zone l: Southern Okanasan Basin.
l0 100 1000
Drainage Area (km2)
o tvE
oC"Loa
.12otoÞoc,
.E
(!thÊ4
01
001
01
/UMI'ZUUU MM
VP 40( ß
fe
c
rasf
nolIrvr
ed
af
ll
)Ol
wl
n(
ri,
)S
a
:1
u
ts
)resent
below
shown
Ine sl
lemNas
,an(
.'an
oli<
lard
des'
I line
I
ln
Summit Environmental Consultants Ltd.Project#042-13.00-AppendixA 27
FINAL REPORTl8-October-2000

1 000
Figure 4.4. Recommended design curves for the 5O-year return period peak discharge -Zone2: Northern Okanasan Basin.
,,/,,
- cf\rP 2nno
'a/
:c N¡P 40 tfr
- Dashed lines represent one standard
error above and below the mean desien
curve, which is shown as a solid line
t t||| t t t|t10 100 1000
Drainage Area (km2)
100
an tv
È(,E¡'
oo.2oan5ooE(!
(!o
01
00r
Summit Environmental Consultants Ltd.Project#042-13.00-AppendixA 28
FINAL REPORTl8-October-2000

1 000
Figure 4.5. Recommended design curves for the 5O-year return period peak discharge -Zone 3; Eastern Okanagan Highland and Okanagan Range.
]L
"/,+1
7 I-
CMP 2000 mm l +ïtLt
1l]L
I,/
,,2,
MP 40 ìn=
tttt|| t ttttlDashed lines represent one standard
error above and below the mean desien
curve, which is shown as a solid line
tttttt|tttttt
10
Drainage Area (km2)
100 1000
100
G '10
È
ú,
6
0.2o!,
o6)tr(!
IE
o
01
0.01
01
Summit Environmental Consultants Ltd.Project#042-13.00-AppendixA 29
FINAL REPORTl8-October-2000

100
Figure 4.6. Recommended design curves for the 5O-year retum period peak discharge -Zone 4: Upper Kettle River.
2
,t4
I 4
- cMP 200r
I
mmI
,
I4
/
,',.t
7'
¡cM P 00 mt
t tttt|- Dashed lines re
error above an<
curve, which ir
tI
tttttttrpresent one standard
lbelow the mean design
i shown as a solid line
I I
10
Drainage Area (km2)
100 1000
4n
Eoctttgso.2oth
ooE(!E(!U'c4
01
Summit Environmental Consultants Ltd.Project#042-13.00-AppendixA 30
F'INAL REPORTl8-October-2000
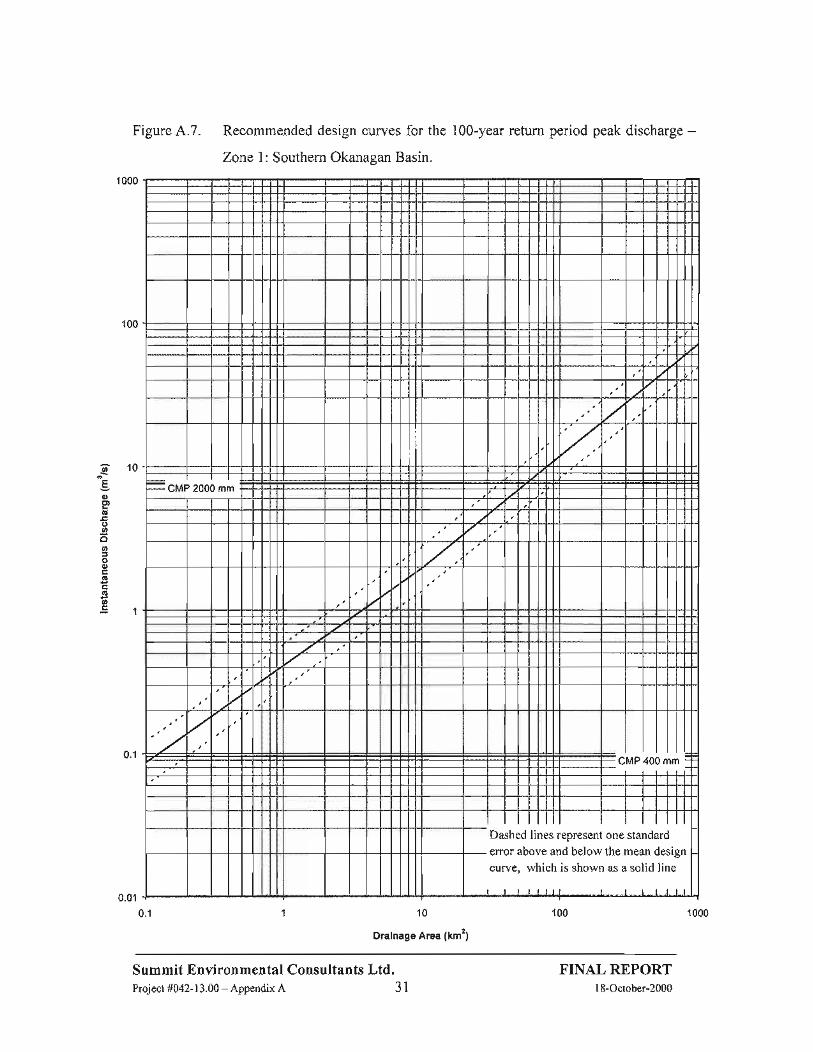
1000
Figure 4.7. Recommended design curves for the 100-year retum period peak discharge -Zone l: Southern Okanasan Basin.
I
cMP 200I
mm
N¡P 40 tn
t t||| t t t||Dashed lines represent one standard
error above and below the mean design
curve. which is shown as a solid line
10 100 1000
Drainage Area (km2)
100
o10tr
c,C"a!
C'.2ôttoG'toc3E
anÊ1
01
Summit Environmental Consultants Ltd.Project#042-13.00-AppendixA 31
FINAL REPORTl8-October-2000

1 000
Figure 4.8. Recommended design curves for the 100-year return period peak discharge -Zone2: Northern Okanasan Basin.
t
L 7
CM 200 mt+TT
-1TI
1 -T
LII
't/ l I
IVIP 40 1n- T ï
t t||| t t ||Dashed lines represent one standard
error above and below the mean design
curve. which is shown as a solid line
10
Drainage Area (km2)
100 1000
100
tt tv
C'Et(!oan
ou,
o{,G
GU'1¡
01
001
Summit Environmental Consultants Ltd.Project#042-13.00-AppendixA 32
FINAL REPORTl8-October-2000

6 '10
È
oE'G
o.12ooãootr(!
(E
!,Êi
Figure 4.9. Recommended design curves for the 100-year return period peak discharge -Zone 3; Eastern Okanagan Highland and Okanagan Plateau.
/.,
/,
:CMP 2000 mm
'z
(,MP 4U ìn
t t l||Dashed lines re
error above and
curve, which is
)resent one standard
below the mean design
shown as a solid line
0.1 1 10 100 1000
Drainage Area (km2)
01
001
Summit Environmental Consultants Ltd.Project#042-13.00 -Appendix A 33
FINAL REPORTl8-October-2000

ølv
(,
o0
.12cloo(,(!
(ú
at
Figure 4.10. Recommended design curves for the 100-year return period peak discharge -Zone 4; Upper Kettle River.
I
I
I
I 4
/
- lìf\¡P 2nnn
,/
+1
,'
N¡P 400 mm
t | ||Dashed lines re
t t t||present one standard
curve, which shown as a solid line
10 100 1000
Dra¡nage Area (kmz)
01
00101
Summit Environmental Consultants Ltd.Project#042-13.00-AppendixA 34
FINAL REPORTl8-October-2000
A'.5 GUIDANCE FOR SELECTION OF PEAK FLOW ZONE
The boundaries of the homogeneous peak flow zones shown on Map I have been drawn to
represent as closely as possible the hydrologic variations indicated by the data and, where
data are sparse, have been infened based on experience and professional judgement. Despite
the fact that the zones are statistically different from each other, hydrologic conditions vary
continuously, grading from dryer zones to wetter ones along a continuum. Conditions do not
change instantaneously along precisely identifiable boundaries, as suggested by a line drawn
on a map. This fundamental spatial variability of hydrologic properties must be considered
when choosing which zone to use for design discharge estimation, especially at or near zone
boundaries.
The key consideration is the location of the drainage basin upstream of the proposed (or
existing) installation, not the location of the installation itself. For drainage basins
completely within one peak flow zone and well away from a zone boundary, one can be
confident that that zone represents the drainage basin, and no other zones need be considered.
For basins within one peak flow zone but close to a zone boundary, it is still likely that that
zone represents the basin. However, it may also be appropriate to calculate a design discharge
based on the adjacent peak flow zone, and to consider the suitability of both design discharge
estimates based on knowledse of the site conditions.
Drainage basins that cross zone boundaries must be addressed carefully. Since snowmelt
dominates peak flow hydrographs in the Penticton Forest District, a zone covering the higher
elevations is more appropriate that a zone covering the lower elevations of a basin. As a
general rule basins that have more than about 40Yo of the area within an upstream zone
should be represented by the upstream zone. However, it is appropriate to calculate the design
discharge based on both zones and choose the most appropriate one, based on the site
conditions. Basins that have less than 40yo of their area in the upstreamzone will most likely
be best represented by the downstream zone, but this should be confirmed based on the site
conditions. In some cases, site conditions may not help identiff which zone is most
representative of a drainage basin close to or crossing a peak flow zone boundary. The
Summit Environmental Consultants Ltd.Project#042-13.00-AppendixA 35
FINAL REPORTl8-October-2000
recommended course of action in these circumstances is to choose the larger design
discharge. This is a more conservative approach, and will prevent unintentional under-sizing
of an installation.
A.6 GUIDANCE FOR MODEL USE IN AREAS AFFECTED BY
ITYDROLOGIC STORAGE
Storage in lakes and wetlands tends to attenuate the peak of the flood hydrograph, generating
lower but longer floods. Because the data set used to develop the peak flow models presented
herein excludes stations significantly influenced by lake and wetland storage, the design peak
flows produced by the model will overestimate the design discharge required for installations
downstream of significant lake and wetland storage.
The magnitude of this effect on Qlee was estimated by analysing data from 13 gauged rivers
(in interior B.C.) that have lakes affecting one third or more of their watershed but that are
not regulated by dams. The records for these 13 stations were used to calculate the index
flood, and - where sufficiently long data records were available - the 100-year floodlo. For
those stations at which only the index flood was calculated, the Qroo/Qz ratio used by
CULVERT (Ver. 6.1) for that zone was applied to derive an estimate the 100-year design
peak flow.
Table 4.12 presents the ratio of the actual 100-year design peak flow (Qu.*ur) to that
predicted by the model (Qpreaicteo) for each of the 13 stations. The mean ratio of
Qactuar/Qpreoicted is 69Yo, and the ratio ranges from 90o/o for Barriere River below Sprague
Creek to 43%o for Wolfe Creek at the outlet of Issitz Lake. The standard deviation is about
15% (i.e. about two thirds of the datafall between about 55% and 85%). It is suggested that
users apply a correction of 85o/o to the design peak flows on streams affected by lake storage,
equal to the mean value plus one standard deviation, which is considered to be an appropriate
to 'Wh... sufhciently long records were available, the Qree was estimated using the Pearson Type III frequency
distribution.
Summit Environmental Consultants Ltd.Project#042-13.00-AppendixA 36
F'INAL REPORT18-October-2000

level of design conservatism. For example, a crossing immediately downstream of a lake for
which the model predicts a 100-year design discharge of 10.0 m3/s should be designed to a
100-year discharge of about 8.5 m3ls (i"e.85% of Qp,.¿i"t ¿). This suggestion does not apply
to crossings downstream of reservoirs.
Table 4.12. Ratio of actual vs. predicted 100-year design peak flows for streams
affected by lakes.
Station Name Station No. Ratio of Qr.lud to Qpre¿¡cte¿
Murtle River Above Dawson FallsCelista Creek Near Albas
Scuitto Creek Near Bamhart ValeSpa Creek Above Cowpersmith DiversionClark Creek Near Vy'infield
Hom Creek Near OlalaCamp Creek Near Thirsk
V/olfe Creek at Outlet of Issitz LakeBowron River near Wells
Quesnel River at LikelyBarriere River at the MouthBarriere River Below Sprague Creek
Vemon Creek below Arda Dam
08LA004
08LE02508LE03608L804208NMl4608NMl4708NM13408NL04l08KD00l08KHO01
08LB020
08L806908NMl75
0.86
0.76
0.79
0.77
0.72
0.57
0.52
0.43
0.53
0.84
0.60
0.90
u.))Mean
Standard Deviation0.69
0.15
The "actual" discharges were estimated from the data, and the "predicted" discharges were produced byCULVERT (Ver. 6.1).
LIMITATIONS OF' THE PEAK FLOW MODEL
It is important to note that the data set presented in Table 4.2 is a subset of the data
available within the broader B.C. interior region, and has been selected specifically for its
relevance to discharge estimation within the study area. Thus the results of the analysis
cannot be used to estimate design peak flows for streams beyond the boundaries of the
Penticton Forest District (Map 1).
The model is designed to estimate 5O-year and 100-year return period peak instantaneous
discharges in locations that are not affected by significant upstream flow regulation and
that are not situated downstream of signif,rcant lake, wetland or reservoir storage. For
4.7
l
2.
Summit Environmental Consultants Ltd.Project#042-13.00-AppendixA 37
F'INAL REPORTl8-Octobe¡-2000

3.
4.
crossings downstream of natural lakes or wetlands, we suggest that a design peak flow of
85% of the value provided by the model is appropriate.
The peak flow model has been developed using data from drainage basins that are less
than 5,000 km2 in size. The peak flow model and computer program should not be used
to calculate design discharges for drainage areas larger than 5,000 km2.
The design peak flow methodology is intended to predict the 5O-year and 100-year return
period design peak flows for ungauged locations. However, there may be instances where
design peak flow estimation based on specific gauged records is more appropriate.
5. To account for uncertainty, the model uses the upper 68% confidence limit on the mean
design peak flow as the recommended design discharge.
A.8 COMPARISON WITH PREVIOUS ESTIMATES
Previous peak flow studies in the southern interior have been made by Ministry of
Environment, Lands and Parks (MELP) using similar regionalization procedures (MELP,
1988). The peak instantaneous discharge corresponding to a 100-year retum period flood has
been estimated for Echo Lake, McDougal Creek, Shingle Creek, and Blue Springs Creek.
The instantaneous discharge corresponding to a 5O-year return period flood has been
estimated for Corral Creek, Echo Lake, and Texas Creek. These design discharge estimates
are provided in Table 4.13 along with the design estimates from the models presented in this
report.
For all streams except Blue Springs Creek, the estimates presented by MELP are within the 1
standard error bounds for the models presented herein. For these 6 pairs of estimates, the
design discharges produced by the present models are ll%o higher, on average, than the
design discharges estimated by MELP. Careful analysis of MELP's estimate for Blue
Springs Creek indicates that a calculation error occurred and that the estimate is too high.
Summit Environmental Consultants Ltd.Project#042-13.00-AppendixA 38
F'INAL REPORTl8-October-2000

Table 4.13 Design discharge comparisons with previous estimates.
l: the lower bound is equal to I standard error below the design Q (i.e 8a% ofthe data lies above this value).2: the upper bound is equal to I standard error above the design Q (i.e 84% ofthe data lies below this value).3: MELP has presented two estimates for this creek, the smaller of which is more reasonable than the larger.
Stream Drainagearea
ftm1
RetumPeriod(vr.)
MELP'sDesign Q
(m3ls)
O estimated usine the Dresent regional modelsZone Design Q
lm3ls)Lower bound
lm3ls)Upper bounú
lm3ls)
Corral Creek 16.0 50 5.80 J 6.30 5.43 t)t
Echo Lake 3.56 50 1.00 2 1.23 0.995 1.51
Echo Lake 3.56 100 1.10 2 1.40 l.l3 1.72
McDougalCreek
38.6 100 8.28 2 8.02 6.49 9.8s
Shinele Creek 308 100 32.1 2 38.9 31.4 47.8
Texas Creek 45 5081.5 /20.03
4 2t.5 19.7 23.4
Blue SpringsCreek
32.5 100 16.7 z 7.03 5.69 8.65
Summit Environmental Consultants Ltd.Project#042-13.00-AppendixA 39
FINAL REPORTl8-October-2000
,{.9 REFERENCES
Environment Canada. 1996. Hydat CD-ROM: Surface Water and Sediment Data. WaterSurvey of Canada. Ottawa, Canada.
Environment Canada. 1991. Short duration rainfall intensþ duration frequency tables and
curves: Version 91. Atmospheric Environment Service. Canadian Climate Centre.Downsview, Ontario, Canada.
Ministry of Environment, Lands and Parks. 1988. Guide to peak flow estimation forungauged watersheds in the Okanagan Region (Penticton). Prepared by D.E. Rekstenand L.J. Barr. Victoria.
Ministry of Forests and Ministry of Environment, Lands, and Parks. 1996. CommunþWatershed Guidebook. October 1996.
National Research Council of Canada. 1989. Hydrology of Floods in Canada: A Guide toPlanning and Design. V/.E. Watt (ed.) Ottawa, Canada.
Reksten, D.E. 1987. A Procedure for Regionalizalion of Peak Flows in B.C. Ministry ofEnvironment and Parks, Water Management Branch, Hydrology Section. Victoria,B.C.
Reksten, D. E. and J. Davies. Unpublished. Guide For Drainage Design in SmallWatersheds in the Blank Forest District. (Incomplete study containing preliminarydesign flow graphs for two zones within Sunshine Coast Forest District.)
Summit Environmental Consultants Ltd. 2000. CULVERT User's Manual - Version 6.1.Prepared for Weyerhaeuser Company Limited. - B.C. Timberlands.
Summit Environmental Consultants Ltd.Project#042-13.00-AppendixA 40
FINAL REPORT18-October-2000
Appendix B
CT]LVERT SIZING CHECKLIST

CULVERT SIZING CHECKLIST
(by: Gary McClelland, Kamloops Forest Region)
(l) Is fish passage required? If so, is the stream slope under 6%? Il so increase diameter to stream
bankfull. lJse Stream Crossing Guidebookfor Fish Streams-. If the stream slope is greater than
6%o oblainprofessional advice or look at altematives.
(2) Is the stream gradient less than 0.5o/o? Ifso, check to ensure there is not outlet control. Ifoutletcontrolled, obtain professional advice.
(3) When the culvert is running full at the inlet, what is the area .of the resulting impoundmentpond? If the area of the impoundment pond is greater than 100 m', increase pipe diameter or use
different pipe configuration to lower impoundment pond elevation such that it is less than 100
m-.
(4) \Mill the culvert control the water level of an existing pond and will water level fluctuations willexceed the natural fluctuations? Ifyes, increase culvert diameter until the resulting fluctuationsare equal to the natural fluctuations. Consider professional advice.
(5) Will the consequences of failure (fill washout) affect life or propefy of downslope
stakeholders? Ifso (or ifthere are other unacceptable consequences) obtain professional advice.
(6) Is there a safe overflow? If yes, items (7) & (8) can be ignored.
(7) Is the stream subject to floating debris? If small debris is an issue, increase diameter to bankfullstream width. If large debris is an issue obtain professional advice.
(8) Is the stream subject to debris torrents? Ifyes, obtain professional advice.
(9) Is the stream slope steeper than l5Yo? Ifyes, obtain professional advice.
(10) Is the value of the crossing high (i.e. >$5000) or the height of fill greater than 4m at roadway
C/L? If so consider increasing culvert diameter.
(1 1) Is there a drainage plan for the area? Ifyes, check to ensure upslope activities (large cut blocksor drainage pattem alteration) will not affect stream hydrology. If upslope activities will affecthydrology, consider larger culverts or small bridge.
(12) Are there upslope alterations to the watercourse (e.g. old roads/trails diverting water into/out ofthe drainage)? Is there potential for upstream crossings to fail creating surges in the flow? If so
consider increasing culvert diameter.
(13) Is the road or watercourse on, downslope of, or upslope of a Terrain Stability Class 4 or 5
polygon? If yes consider larger culverts or small bridge and consider obtaining professional
advice.
Source: digital file provided by G. McClelland (1310412000)
' V.A. Poulin and H.A. Argent. 1997. Stream Crossing Guidebook for Fish Streams: A Working Draft for199711998. Victoria.