
Ryan McMullan- Metrics Directing the Zero Waste Journey
18
Metrics: Directing the Zero Waste Journey Ryan McMullan
Transcript of Ryan McMullan- Metrics Directing the Zero Waste Journey
Metrics:
Directing the Zero Waste
Journey
Ryan McMullan
Directing the Journey
What gets measured gets managed.
~ Peter Drucker

Overview
• ZWBC Waste Hierarchy
• Difficulties of Waste Metrics
• Moving Up the Hierarchy

ZWBC Waste Hierarchy
Zero Waste Hierarchy
• Reduce (incl Redesign)
• Reuse (incl Repair, Reman)
• Recycle (incl Compost/ReEarth)
• Recover Clean Energy (incl Digest)
• Disposal (Recover Dirty Energy, Landfill, Incineration)
• Dumping in the Environment
• Reduce > Reuse > Recycle > Recover Clean > Disposal
• Dumping
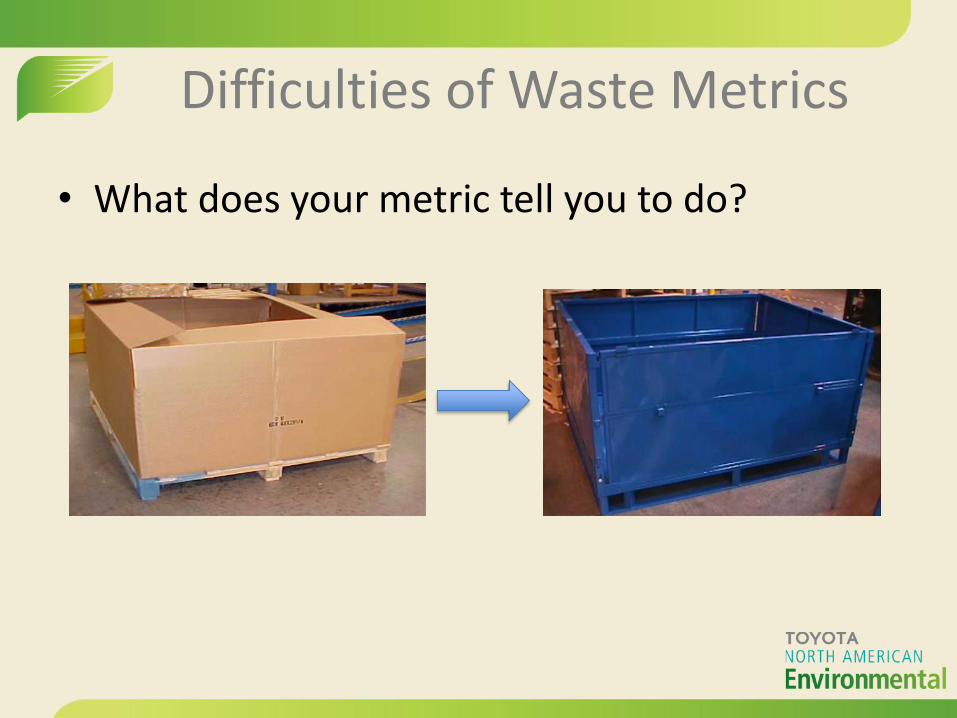
Difficulties of Waste Metrics
• What does your metric tell you to do?

Difficulties of Waste Metrics
• All Metrics are imperfect
– Use several
– Metrics must change over time
– Example
• Policy: Pursue production activities that do not generate waste (= 100% Reduce/Reuse)
• 1st Stage: 95% Reduction to Landfill from Baseline
• 2nd Stage: 100% Reduction to Landfill from Baseline
• 3rd Stage: Reduction of Non-salable Waste
• 4th Stage: Waste Avoidance? Diversion?
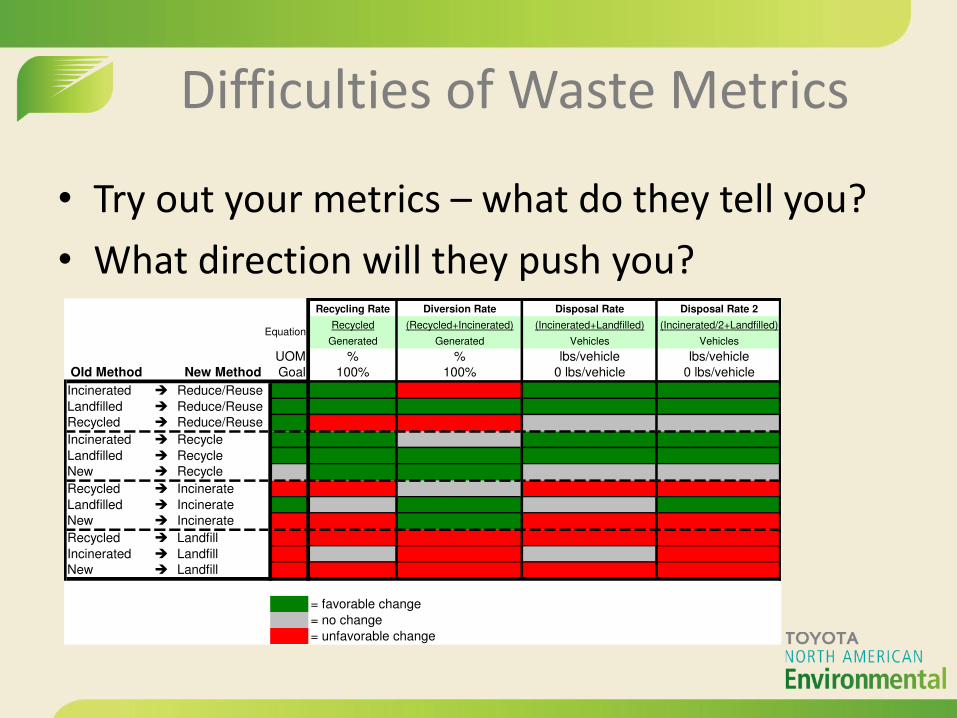
Difficulties of Waste Metrics
• Try out your metrics – what do they tell you?
• What direction will they push you? Recycling Rate Diversion Rate Disposal Rate Disposal Rate 2
Recycled (Recycled+Incinerated) (Incinerated+Landfilled) (Incinerated/2+Landfilled)
Generated Generated Vehicles Vehicles
UOM % % lbs/vehicle lbs/vehicle
Old Method New Method Goal 100% 100% 0 lbs/vehicle 0 lbs/vehicle
Incinerated Reduce/Reuse
Landfilled Reduce/Reuse
Recycled Reduce/Reuse
Incinerated Recycle
Landfilled Recycle
New Recycle
Recycled Incinerate
Landfilled Incinerate
New Incinerate
Recycled Landfill
Incinerated Landfill
New Landfill
= favorable change
= no change
= unfavorable change
Equation
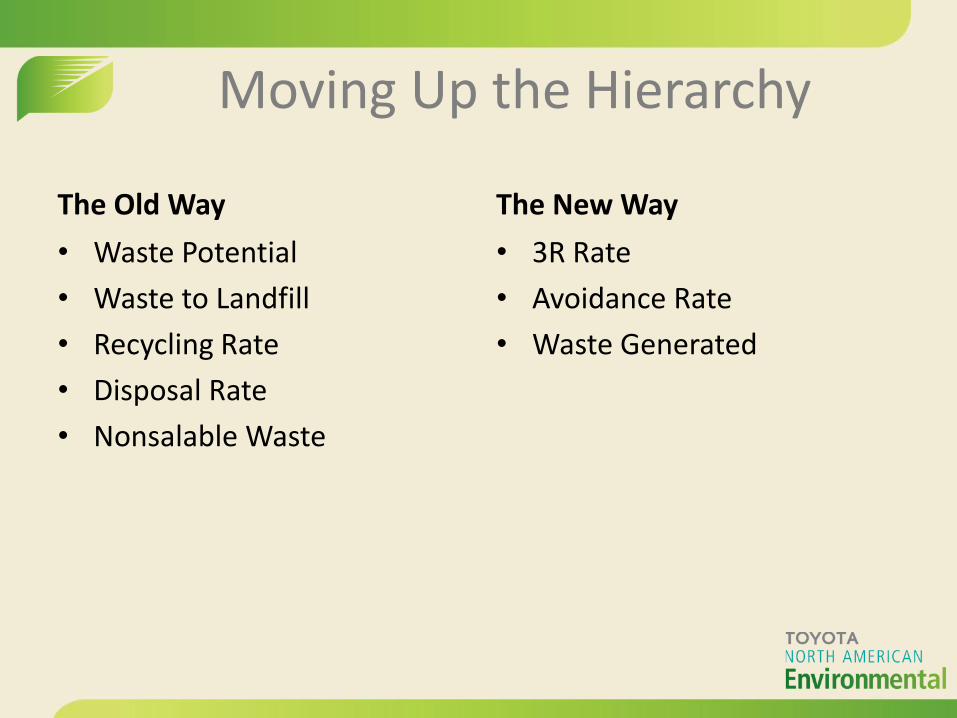
Moving Up the Hierarchy
The Old Way
• Waste Potential
• Waste to Landfill
• Recycling Rate
• Disposal Rate
• Nonsalable Waste
The New Way
• 3R Rate
• Avoidance Rate
• Waste Generated
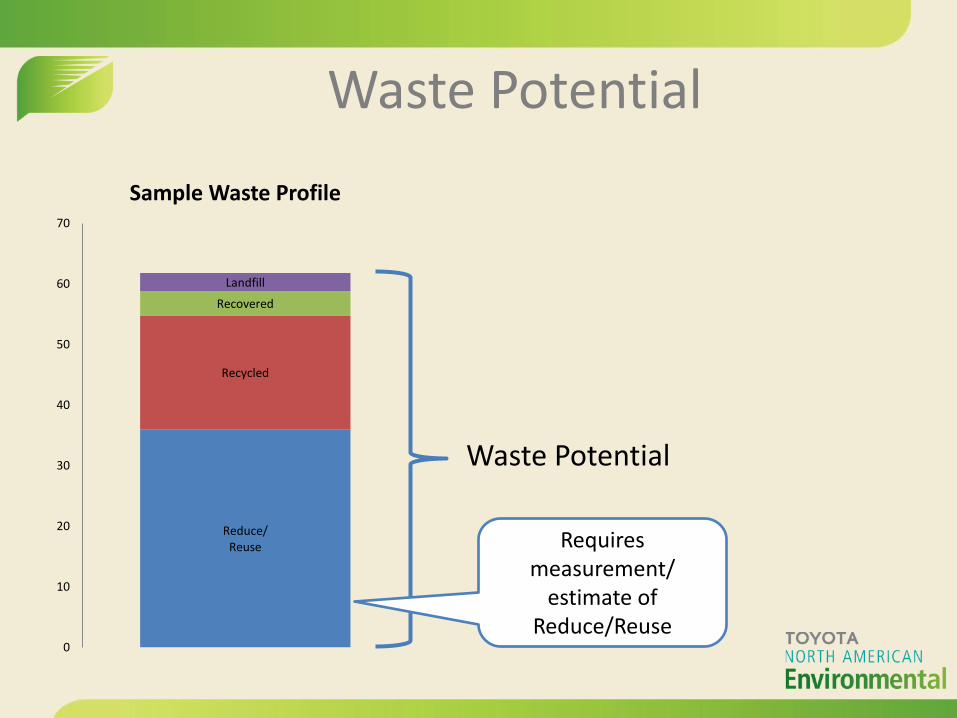
Waste Potential
Reduce/
Reuse
Recycled
Recovered
Landfill
0
10
20
30
40
50
60
70
Sample Waste Profile
Waste Potential
Requires
measurement/
estimate of
Reduce/Reuse

Old: Waste to Landfill
Reduce/
Reuse
Recycled
Recovered
Landfill
0
10
20
30
40
50
60
70
Sample Waste Profile
Pounds to Landfill
Per unit of activity
Where did it go
instead of landfill?
Reduce/
Reuse
Recycled
Recovered
Landfill
0
10
20
30
40
50
60
70
Sample Waste Profile
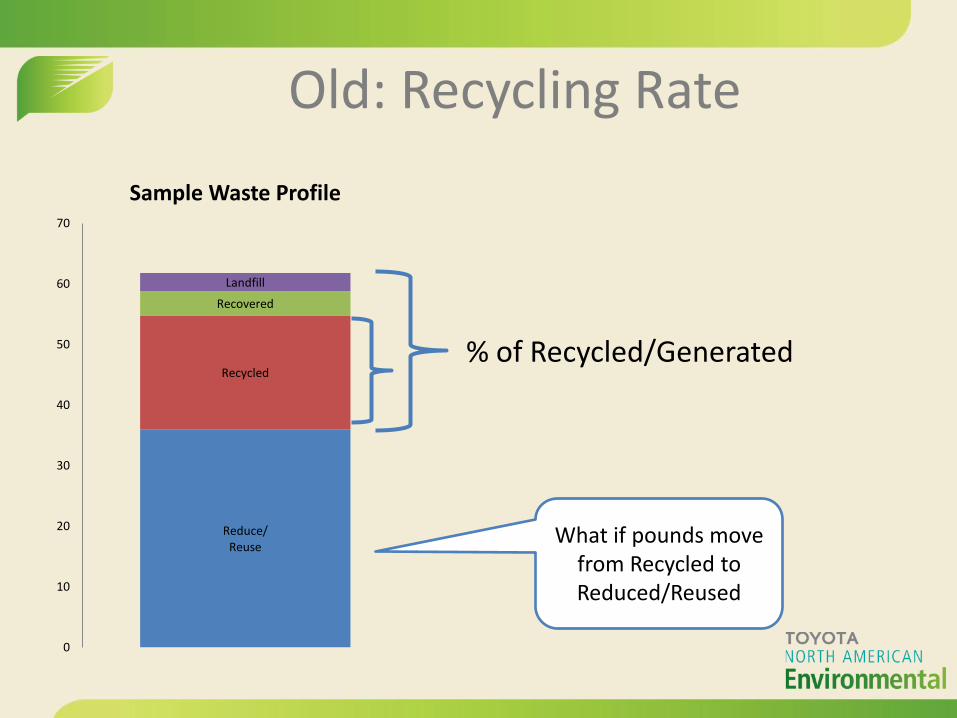
Old: Recycling Rate
% of Recycled/Generated
What if pounds move
from Recycled to
Reduced/Reused

Old: Disposal Rate
Reduce/
Reuse
Recycled
Recovered
Landfill
0
10
20
30
40
50
60
70
Sample Waste Profile
Landfill + ½ Recovered
Per unit of activity
What’s the difference between Recycled
and Reduced?
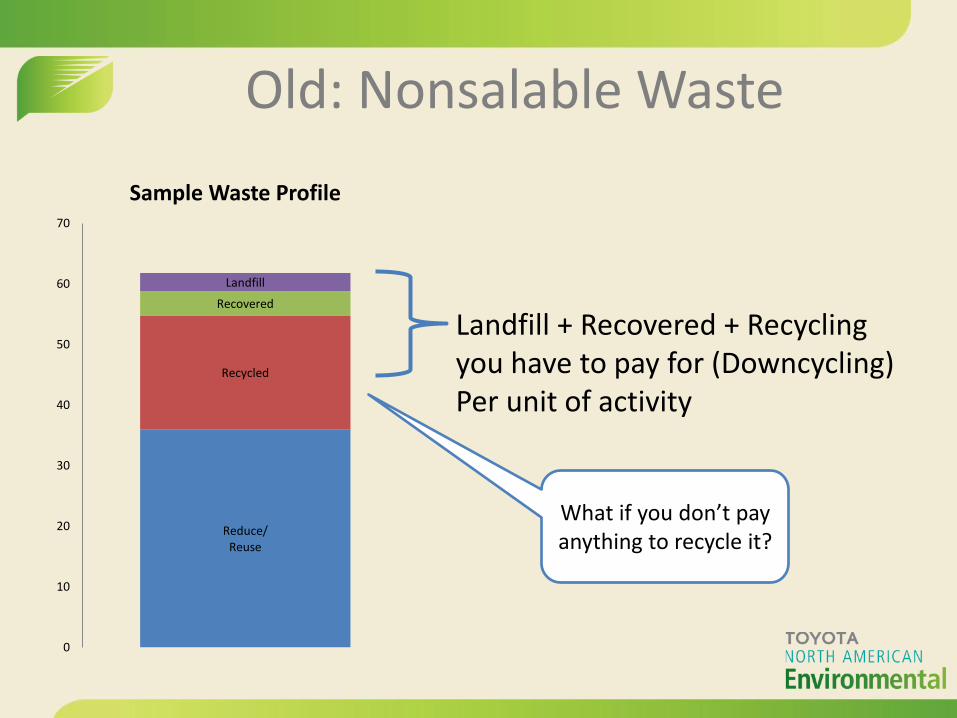
Old: Nonsalable Waste
Reduce/
Reuse
Recycled
Recovered
Landfill
0
10
20
30
40
50
60
70
Sample Waste Profile
Landfill + Recovered + Recycling
you have to pay for (Downcycling)
Per unit of activity
What if you don’t pay anything to recycle it?
Reduce/
Reuse
Recycled
Recovered
Landfill
0
10
20
30
40
50
60
70
Sample Waste Profile
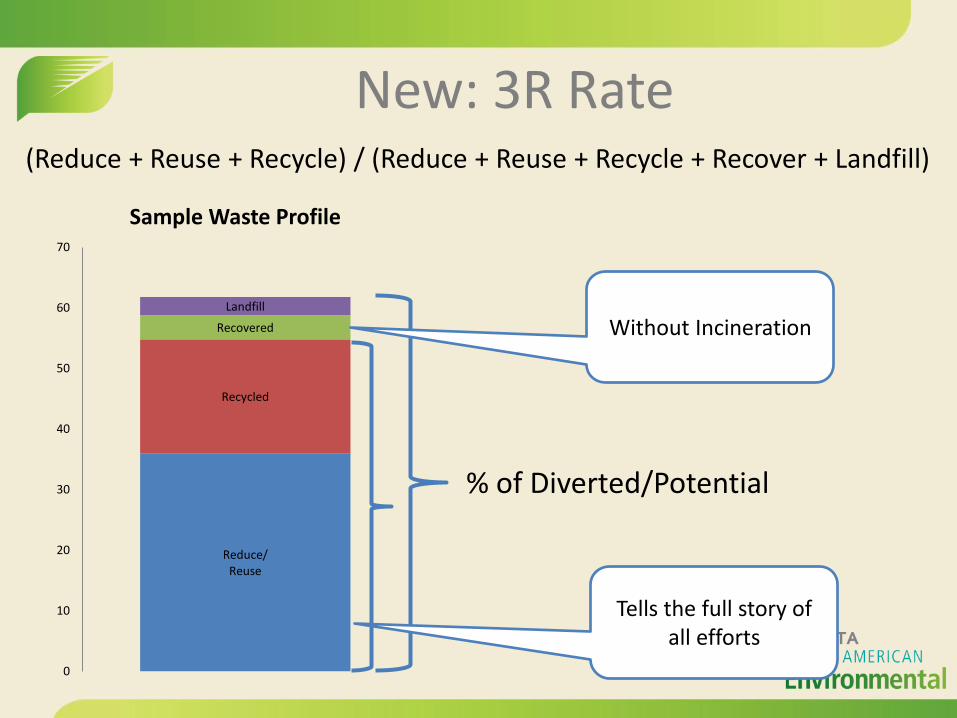
New: 3R Rate
% of Diverted/Potential
Tells the full story of
all efforts
Without Incineration
(Reduce + Reuse + Recycle) / (Reduce + Reuse + Recycle + Recover + Landfill)
Reduce/
Reuse
Recycled
Recovered
Landfill
0
10
20
30
40
50
60
70
Sample Waste Profile
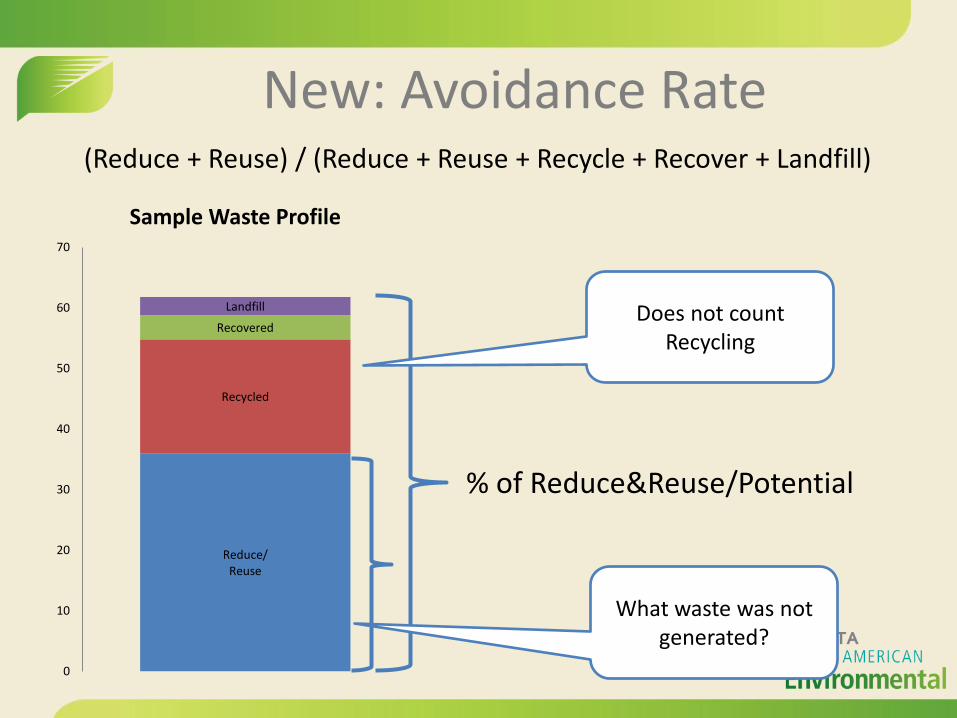
New: Avoidance Rate
% of Reduce&Reuse/Potential
What waste was not
generated?
Does not count
Recycling
(Reduce + Reuse) / (Reduce + Reuse + Recycle + Recover + Landfill)
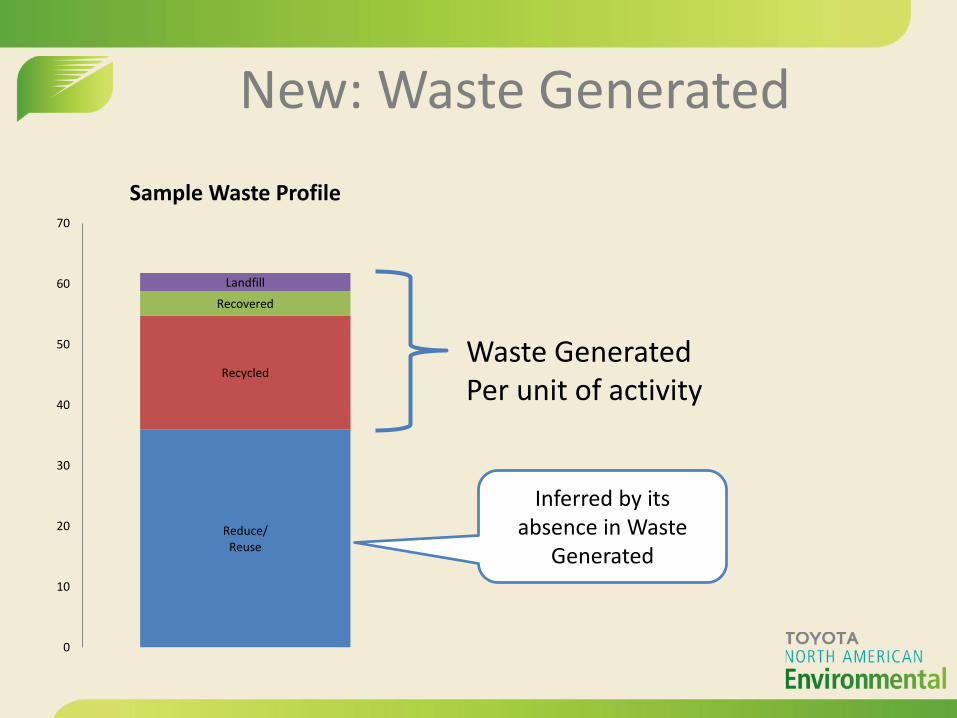
New: Waste Generated
Reduce/
Reuse
Recycled
Recovered
Landfill
0
10
20
30
40
50
60
70
Sample Waste Profile
Waste Generated
Per unit of activity
Inferred by its
absence in Waste
Generated
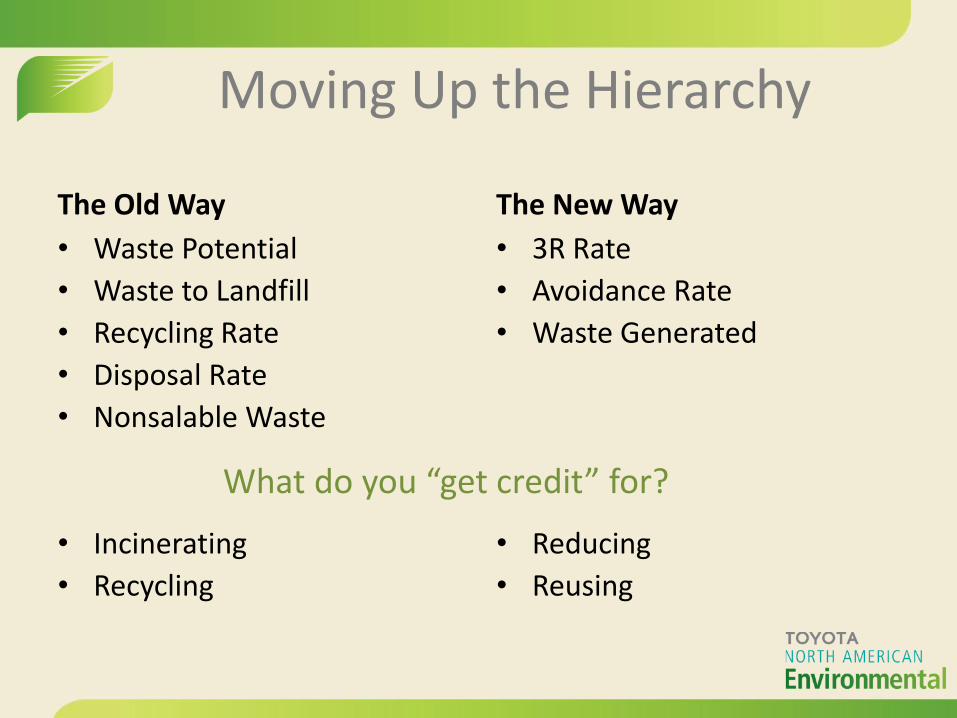
Moving Up the Hierarchy
The Old Way
• Waste Potential
• Waste to Landfill
• Recycling Rate
• Disposal Rate
• Nonsalable Waste
• Incinerating
• Recycling
The New Way
• 3R Rate
• Avoidance Rate
• Waste Generated
• Reducing
• Reusing
What do you get credit for?