Russian Labor Market: Recent Trends - World...
37
1 Russian Labor Market: Recent Trends Monitoring Update: May 2009 Moscow June 2009
Transcript of Russian Labor Market: Recent Trends - World...
1
Russian Labor Market:
Recent Trends
Monitoring Update: May 2009
Moscow
June 2009
Russian Labor Market: Recent Trends June 2009
2
The Russian Labor Market: Recent Trends periodic update seeks to improve the awareness of the authorities, experts and business leaders of the situation and trends in the labor market to contribute to informed and effective decision-making. The update has been jointly prepared by the World Bank and the Federal Service for Labor and Employment.The update presents indicators produced using various statistical sources, including the Federal Service for Labor and Employment, the Federal Service for Statistics, and the Ministry for Education and Science. It presents main findings on current labor market conditions, including trends in employment and unemployment, use of working hours, wages and regional labor market disparities.. A special focus of the June update is employment prospects of 2009 education system graduates.
Contents
Main Findings ...................................................................................................................3
Macroeconomic Environment ...........................................................................................5
Employment and Unemployment .....................................................................................6
Working Hours................................................................................................................16
Wages ............................................................................................................................18
Regional Differentiation of Labor Market Conditions ......................................................21
Regional Programs to Address Labor Market Tensions.................................................26
Vocational and professional school graduates in the labor market ................................32
Tables.............................................................................................................................37
Russian Labor Market: Recent Trends June 2009
3
Main Findings
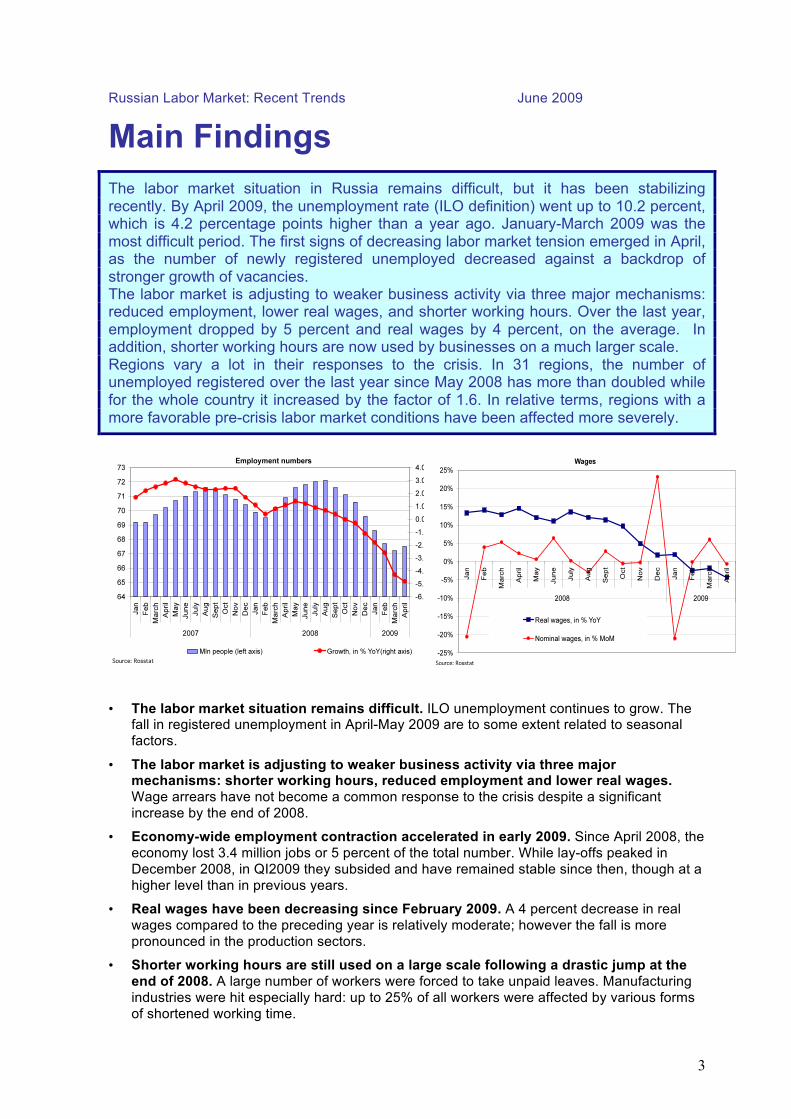
The labor market situation in Russia remains difficult, but it has been stabilizing recently. By April 2009, the unemployment rate (ILO definition) went up to 10.2 percent, which is 4.2 percentage points higher than a year ago. January-March 2009 was the most difficult period. The first signs of decreasing labor market tension emerged in April, as the number of newly registered unemployed decreased against a backdrop of stronger growth of vacancies. The labor market is adjusting to weaker business activity via three major mechanisms: reduced employment, lower real wages, and shorter working hours. Over the last year, employment dropped by 5 percent and real wages by 4 percent, on the average. In addition, shorter working hours are now used by businesses on a much larger scale. Regions vary a lot in their responses to the crisis. In 31 regions, the number of unemployed registered over the last year since May 2008 has more than doubled while for the whole country it increased by the factor of 1.6. In relative terms, regions with a more favorable pre-crisis labor market conditions have been affected more severely.
• The labor market situation remains difficult. ILO unemployment continues to grow. The fall in registered unemployment in April-May 2009 are to some extent related to seasonal
factors.
• The labor market is adjusting to weaker business activity via three major mechanisms: shorter working hours, reduced employment and lower real wages.
Wage arrears have not become a common response to the crisis despite a significant
increase by the end of 2008.
• Economy-wide employment contraction accelerated in early 2009. Since April 2008, the
economy lost 3.4 million jobs or 5 percent of the total number. While lay-offs peaked in
December 2008, in QI2009 they subsided and have remained stable since then, though at a
higher level than in previous years.
• Real wages have been decreasing since February 2009. A 4 percent decrease in real
wages compared to the preceding year is relatively moderate; however the fall is more
pronounced in the production sectors.
• Shorter working hours are still used on a large scale following a drastic jump at the
end of 2008. A large number of workers were forced to take unpaid leaves. Manufacturing
industries were hit especially hard: up to 25% of all workers were affected by various forms
of shortened working time.
Russian Labor Market: Recent Trends June 2009
4
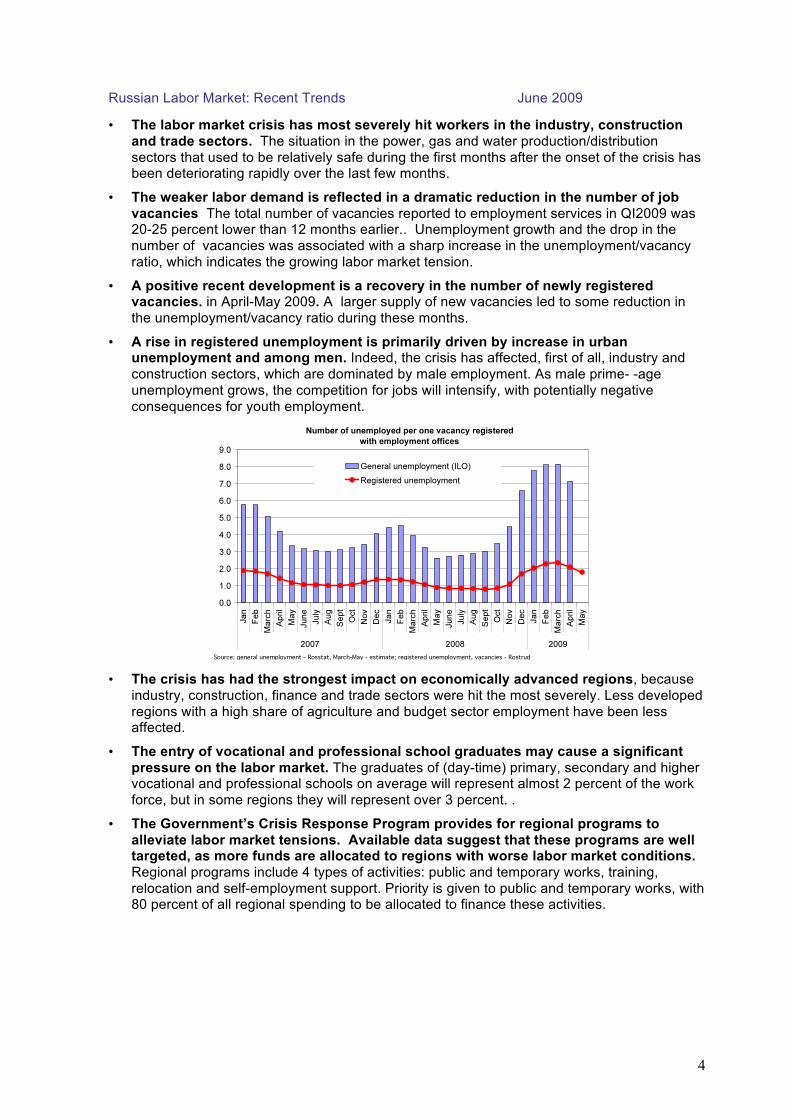
• The labor market crisis has most severely hit workers in the industry, construction
and trade sectors. The situation in the power, gas and water production/distribution
sectors that used to be relatively safe during the first months after the onset of the crisis has been deteriorating rapidly over the last few months.
• The weaker labor demand is reflected in a dramatic reduction in the number of job
vacancies The total number of vacancies reported to employment services in QI2009 was 20-25 percent lower than 12 months earlier.. Unemployment growth and the drop in the
number of vacancies was associated with a sharp increase in the unemployment/vacancy
ratio, which indicates the growing labor market tension.
• A positive recent development is a recovery in the number of newly registered vacancies. in April-May 2009. A larger supply of new vacancies led to some reduction in
the unemployment/vacancy ratio during these months.
• A rise in registered unemployment is primarily driven by increase in urban unemployment and among men. Indeed, the crisis has affected, first of all, industry and
construction sectors, which are dominated by male employment. As male prime- -age
unemployment grows, the competition for jobs will intensify, with potentially negative
consequences for youth employment.
• The crisis has had the strongest impact on economically advanced regions, because
industry, construction, finance and trade sectors were hit the most severely. Less developed
regions with a high share of agriculture and budget sector employment have been less affected.
• The entry of vocational and professional school graduates may cause a significant
pressure on the labor market. The graduates of (day-time) primary, secondary and higher vocational and professional schools on average will represent almost 2 percent of the work
force, but in some regions they will represent over 3 percent. .
• The Government’s Crisis Response Program provides for regional programs to
alleviate labor market tensions. Available data suggest that these programs are well targeted, as more funds are allocated to regions with worse labor market conditions.
Regional programs include 4 types of activities: public and temporary works, training,
relocation and self-employment support. Priority is given to public and temporary works, with 80 percent of all regional spending to be allocated to finance these activities.
Russian Labor Market: Recent Trends June 2009
5
Macroeconomic Environment
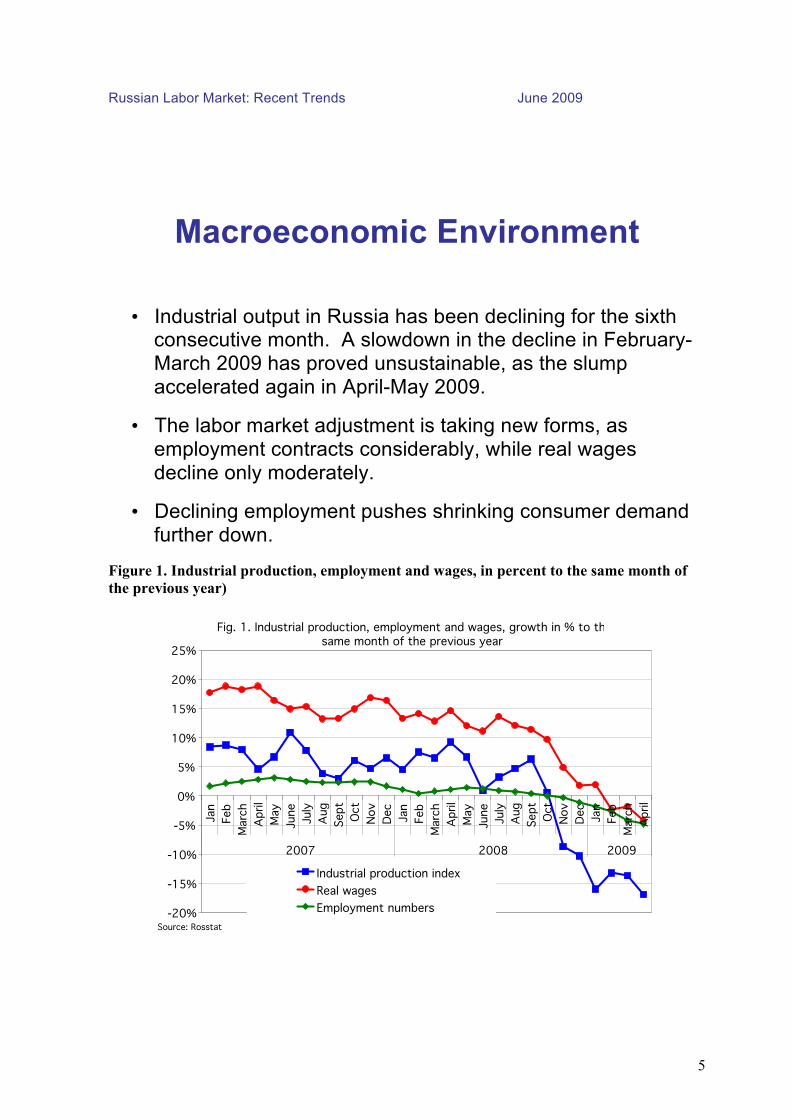
• Industrial output in Russia has been declining for the sixth consecutive month. A slowdown in the decline in February-March 2009 has proved unsustainable, as the slump accelerated again in April-May 2009.
• The labor market adjustment is taking new forms, as employment contracts considerably, while real wages decline only moderately.
• Declining employment pushes shrinking consumer demand further down.
Figure 1. Industrial production, employment and wages, in percent to the same month of
the previous year)
Russian Labor Market: Recent Trends June 2009
6
Employment and Unemployment
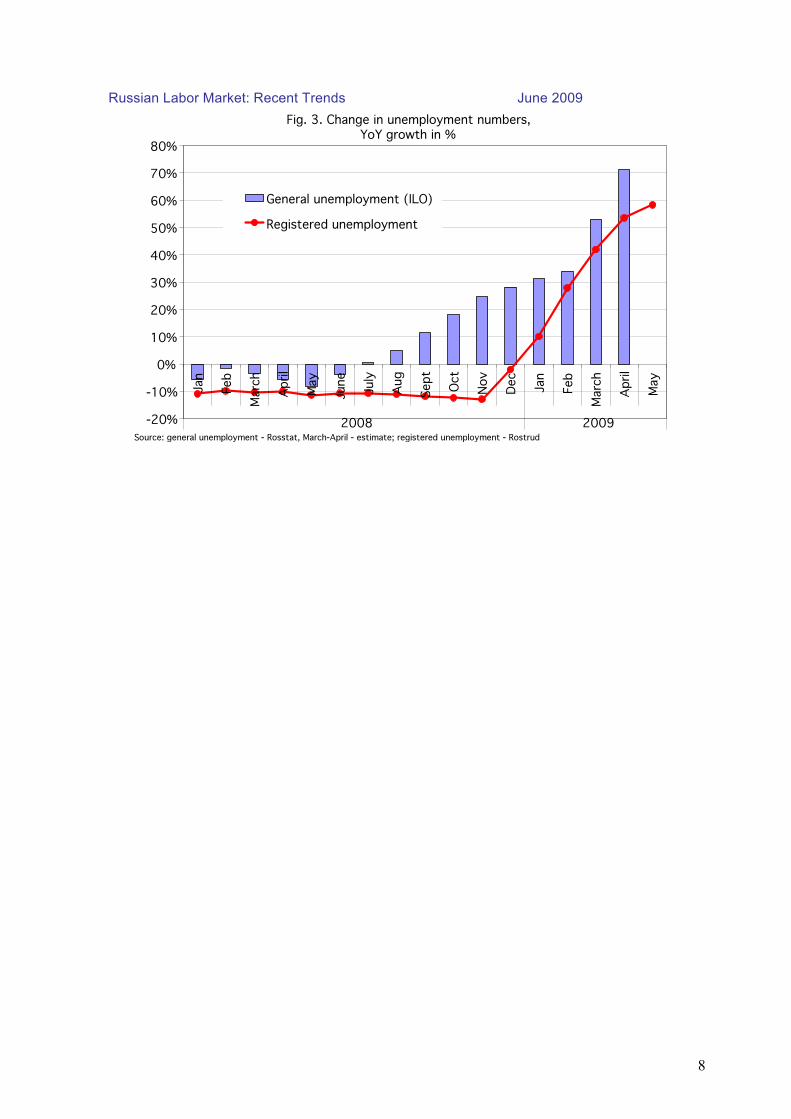
• A noticeable rise in unemployment, started in autumn 2008, continues. Growth rates of registered unemployment became closer to growth of general unemployment.
• A seasonal drop in new unemployment numbers, observed in April 2009, is less pronounced than in the previous years.
• A peak in lay-offs was observed in December 2008. Their intensity decreased in the following months, while employment continued declining.
Russian Labor Market: Recent Trends June 2009
7
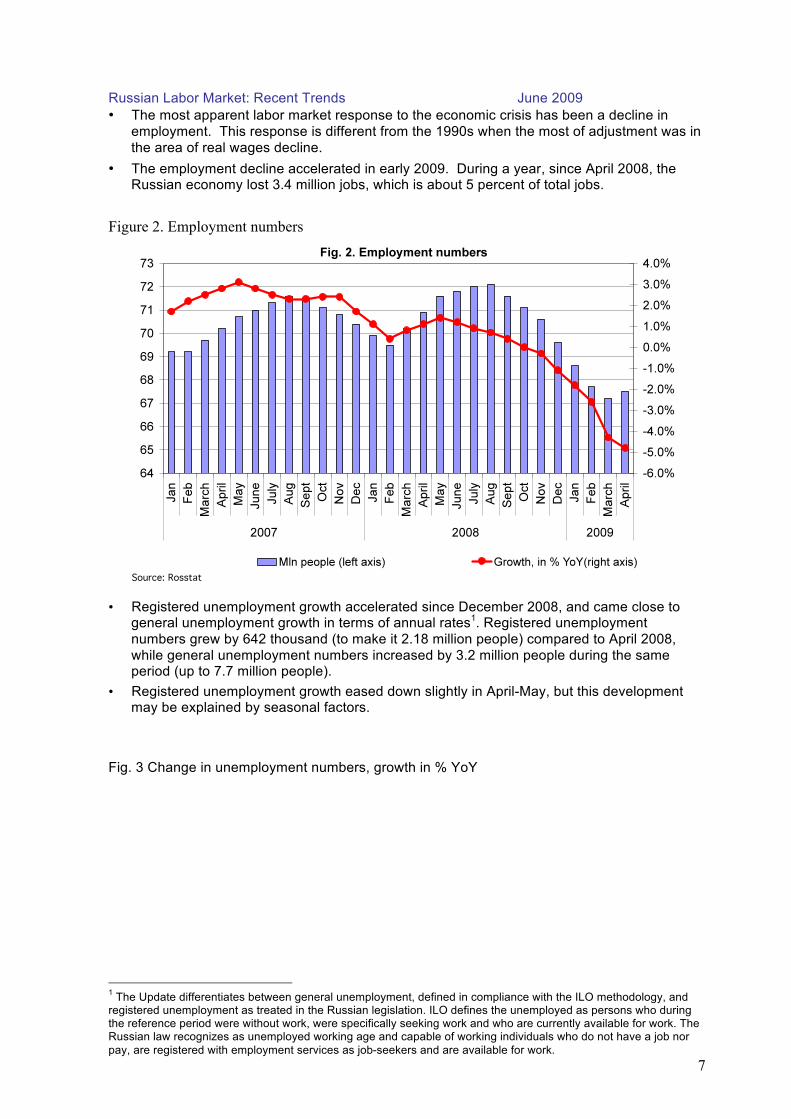
• The most apparent labor market response to the economic crisis has been a decline in
employment. This response is different from the 1990s when the most of adjustment was in
the area of real wages decline.
• The employment decline accelerated in early 2009. During a year, since April 2008, the Russian economy lost 3.4 million jobs, which is about 5 percent of total jobs.
Figure 2. Employment numbers
• Registered unemployment growth accelerated since December 2008, and came close to general unemployment growth in terms of annual rates1. Registered unemployment
numbers grew by 642 thousand (to make it 2.18 million people) compared to April 2008,
while general unemployment numbers increased by 3.2 million people during the same period (up to 7.7 million people).
• Registered unemployment growth eased down slightly in April-May, but this development may be explained by seasonal factors.
Fig. 3 Change in unemployment numbers, growth in % YoY
1 The Update differentiates between general unemployment, defined in compliance with the ILO methodology, and
registered unemployment as treated in the Russian legislation. ILO defines the unemployed as persons who during the reference period were without work, were specifically seeking work and who are currently available for work. The Russian law recognizes as unemployed working age and capable of working individuals who do not have a job nor
pay, are registered with employment services as job-seekers and are available for work.
Russian Labor Market: Recent Trends June 2009
8
Russian Labor Market: Recent Trends June 2009
9
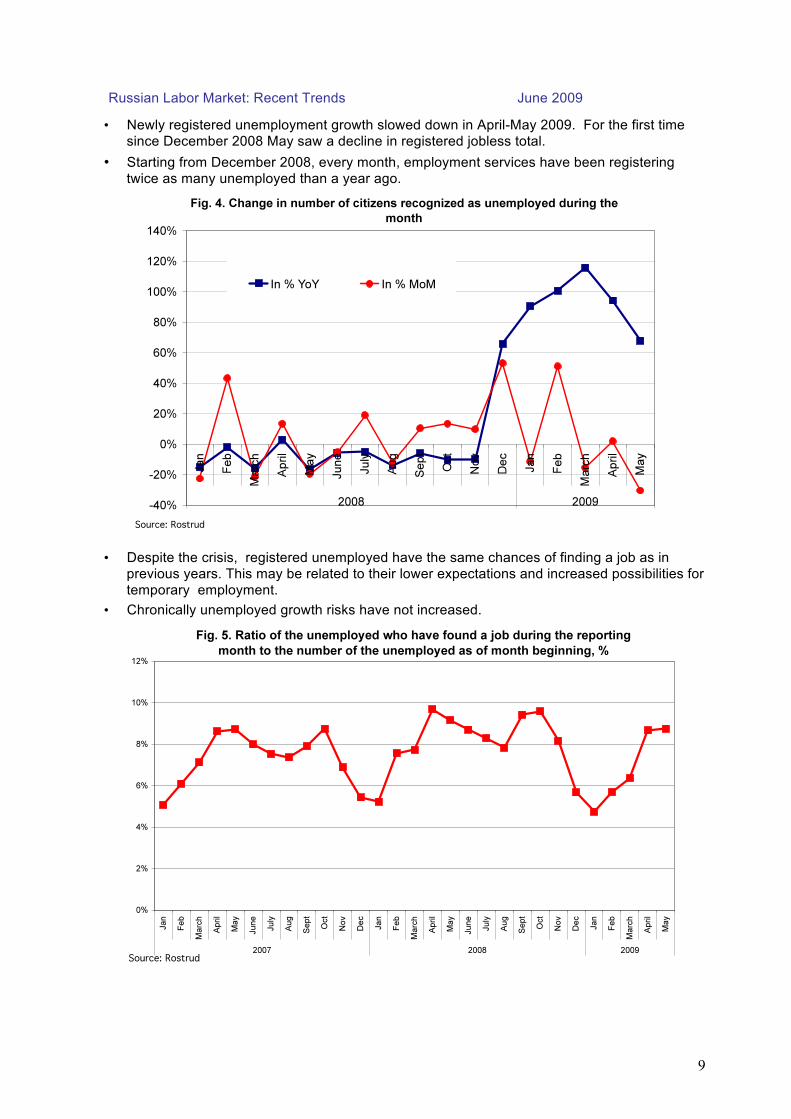
• Newly registered unemployment growth slowed down in April-May 2009. For the first time
since December 2008 May saw a decline in registered jobless total.
• Starting from December 2008, every month, employment services have been registering
twice as many unemployed than a year ago.
• Despite the crisis, registered unemployed have the same chances of finding a job as in
previous years. This may be related to their lower expectations and increased possibilities for
temporary employment.
• Chronically unemployed growth risks have not increased.
Russian Labor Market: Recent Trends June 2009
10
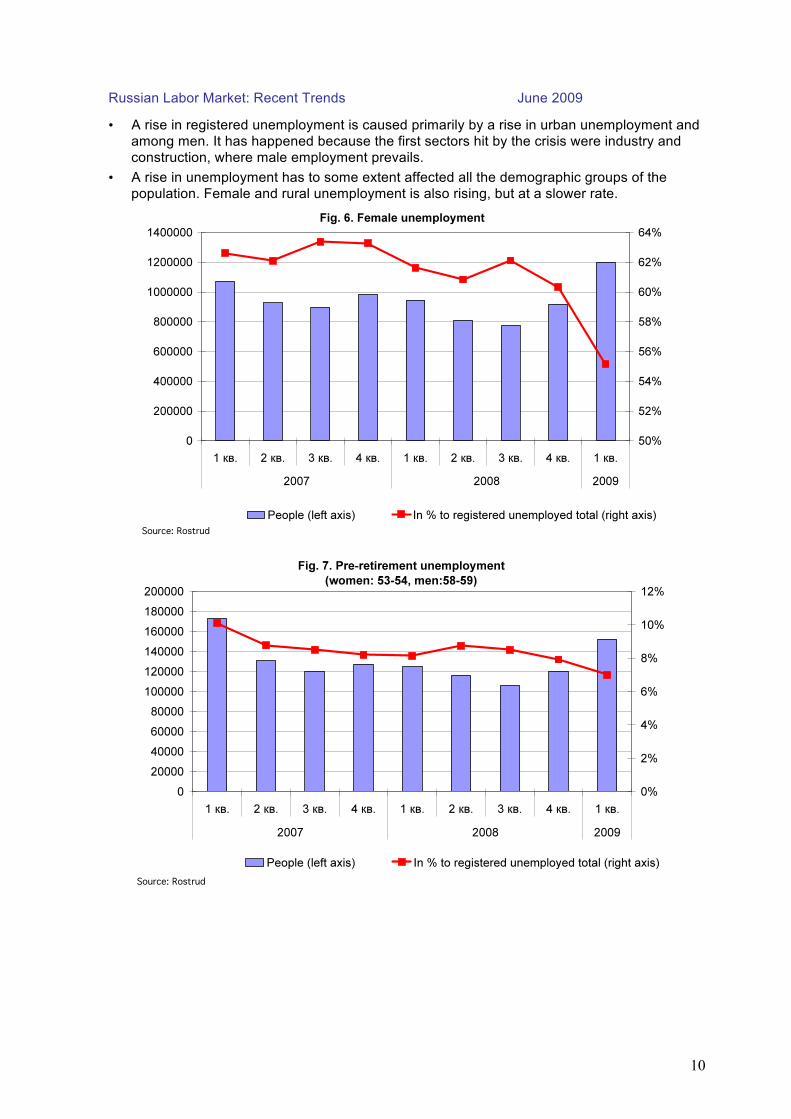
• A rise in registered unemployment is caused primarily by a rise in urban unemployment and
among men. It has happened because the first sectors hit by the crisis were industry and
construction, where male employment prevails.
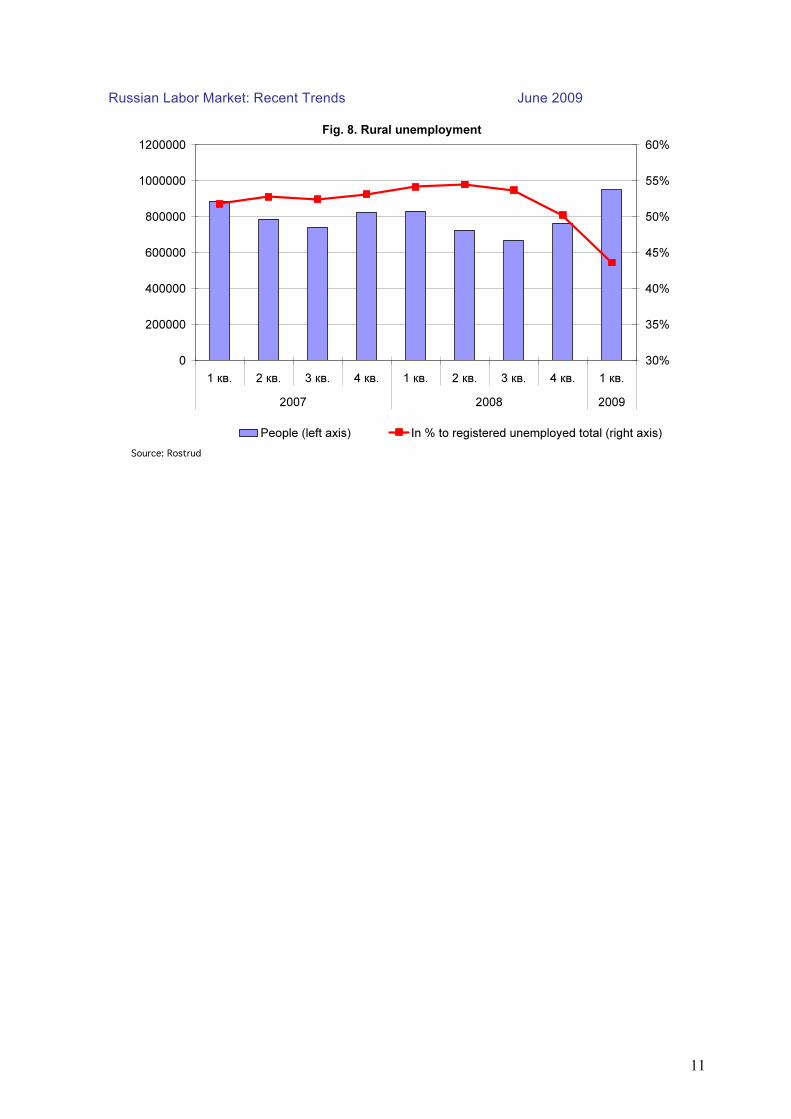
• A rise in unemployment has to some extent affected all the demographic groups of the
population. Female and rural unemployment is also rising, but at a slower rate.
Russian Labor Market: Recent Trends June 2009
11
Russian Labor Market: Recent Trends June 2009
12
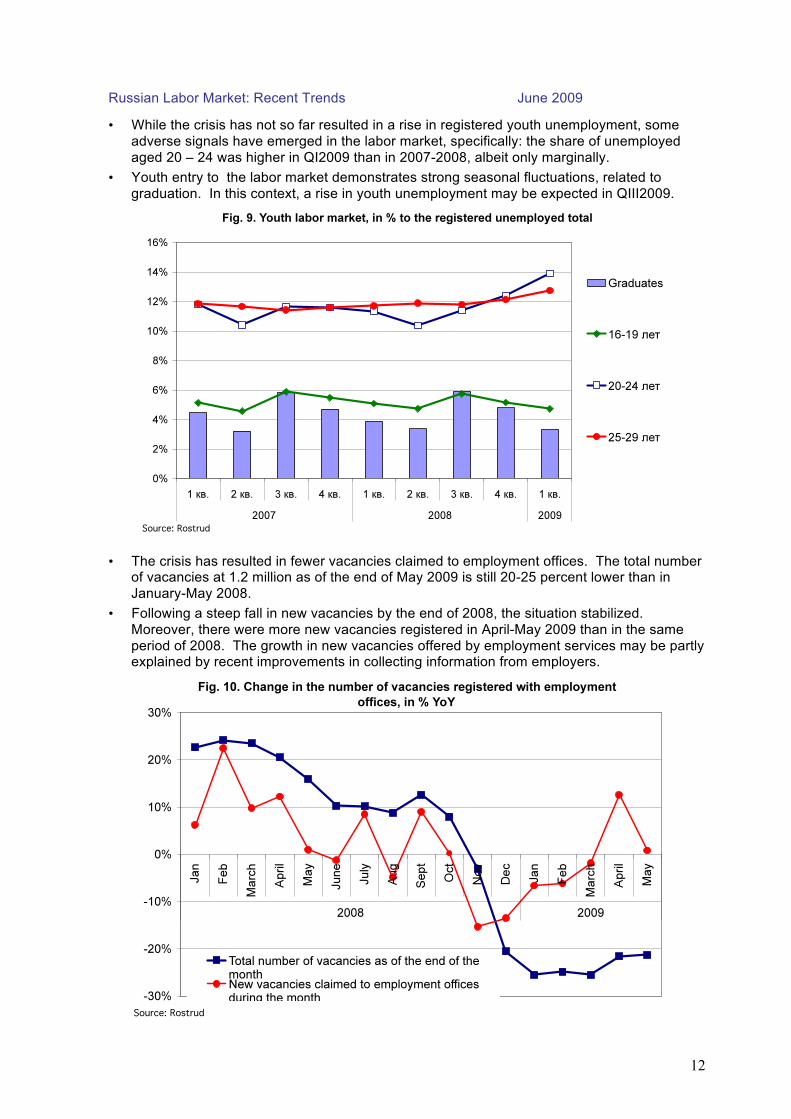
• While the crisis has not so far resulted in a rise in registered youth unemployment, some
adverse signals have emerged in the labor market, specifically: the share of unemployed
aged 20 – 24 was higher in QI2009 than in 2007-2008, albeit only marginally.
• Youth entry to the labor market demonstrates strong seasonal fluctuations, related to
graduation. In this context, a rise in youth unemployment may be expected in QIII2009.
• The crisis has resulted in fewer vacancies claimed to employment offices. The total number of vacancies at 1.2 million as of the end of May 2009 is still 20-25 percent lower than in
January-May 2008.
• Following a steep fall in new vacancies by the end of 2008, the situation stabilized.
Moreover, there were more new vacancies registered in April-May 2009 than in the same
period of 2008. The growth in new vacancies offered by employment services may be partly explained by recent improvements in collecting information from employers.
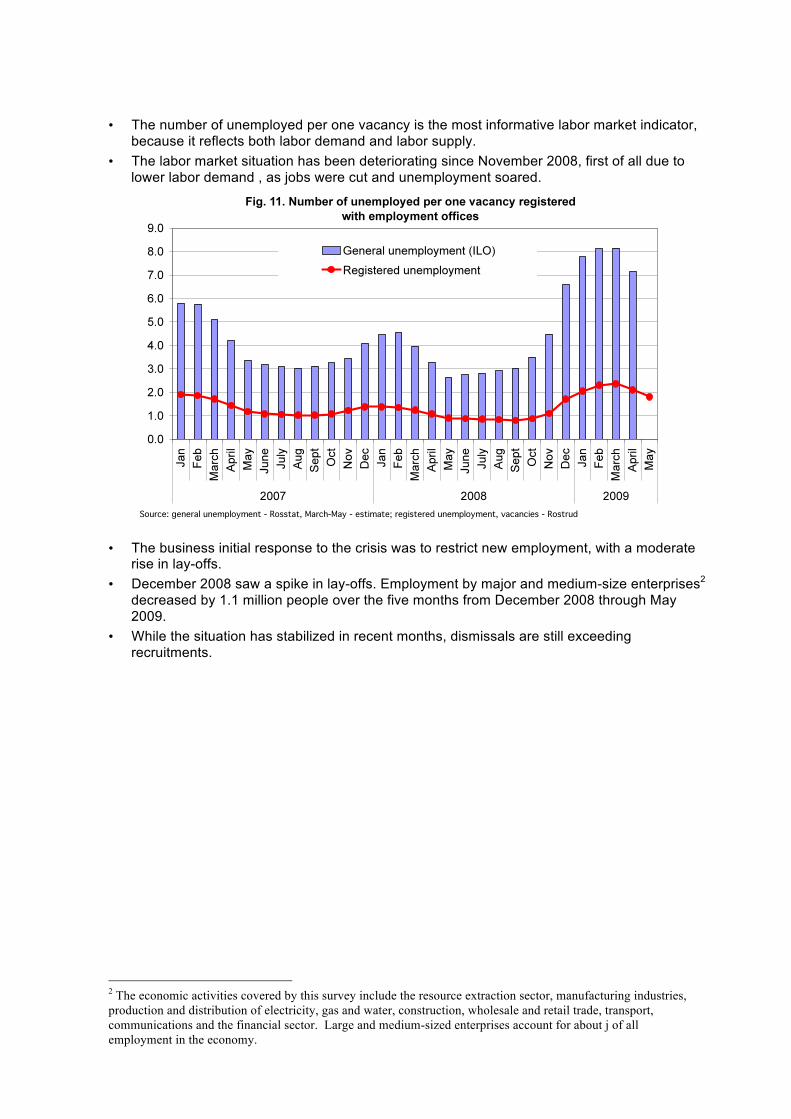
• The number of unemployed per one vacancy is the most informative labor market indicator,
because it reflects both labor demand and labor supply.
• The labor market situation has been deteriorating since November 2008, first of all due to
lower labor demand , as jobs were cut and unemployment soared.
• The business initial response to the crisis was to restrict new employment, with a moderate rise in lay-offs.
• December 2008 saw a spike in lay-offs. Employment by major and medium-size enterprises2
decreased by 1.1 million people over the five months from December 2008 through May
2009.
• While the situation has stabilized in recent months, dismissals are still exceeding
recruitments.
2 The economic activities covered by this survey include the resource extraction sector, manufacturing industries,
production and distribution of electricity, gas and water, construction, wholesale and retail trade, transport,
communications and the financial sector. Large and medium-sized enterprises account for about j of all
employment in the economy.
Russian Labor Market: Recent Trends June 2009
14
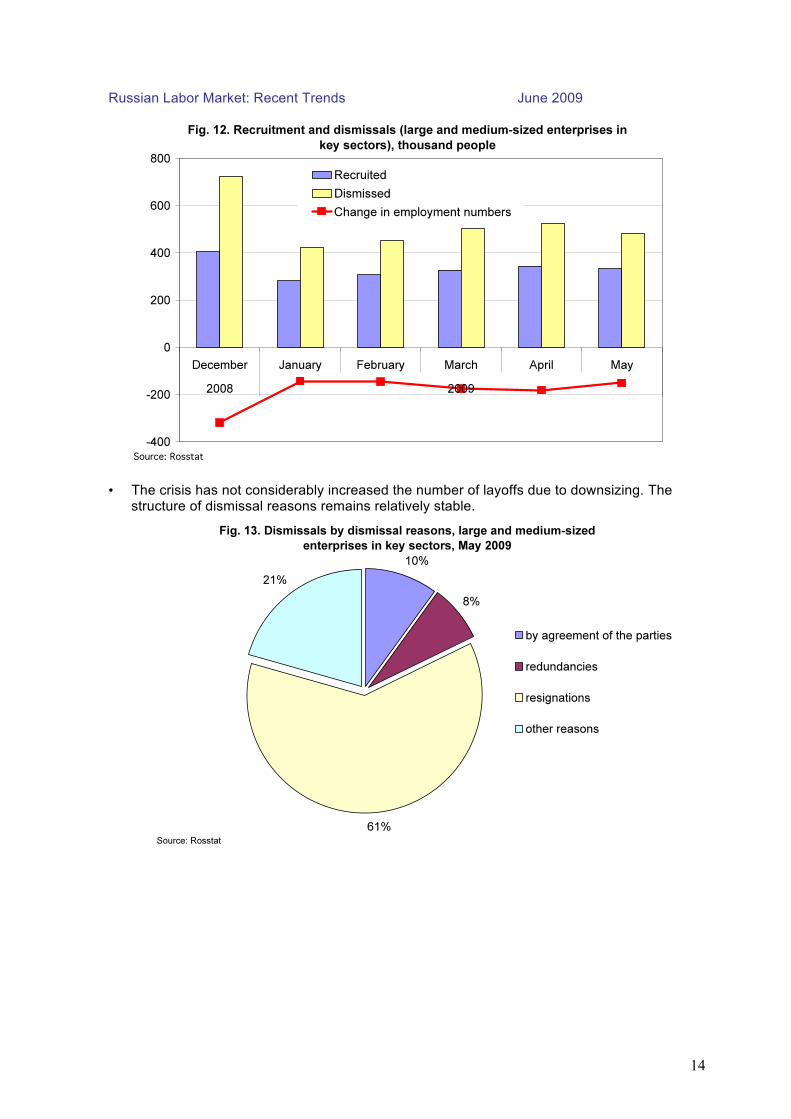
• The crisis has not considerably increased the number of layoffs due to downsizing. The
structure of dismissal reasons remains relatively stable.
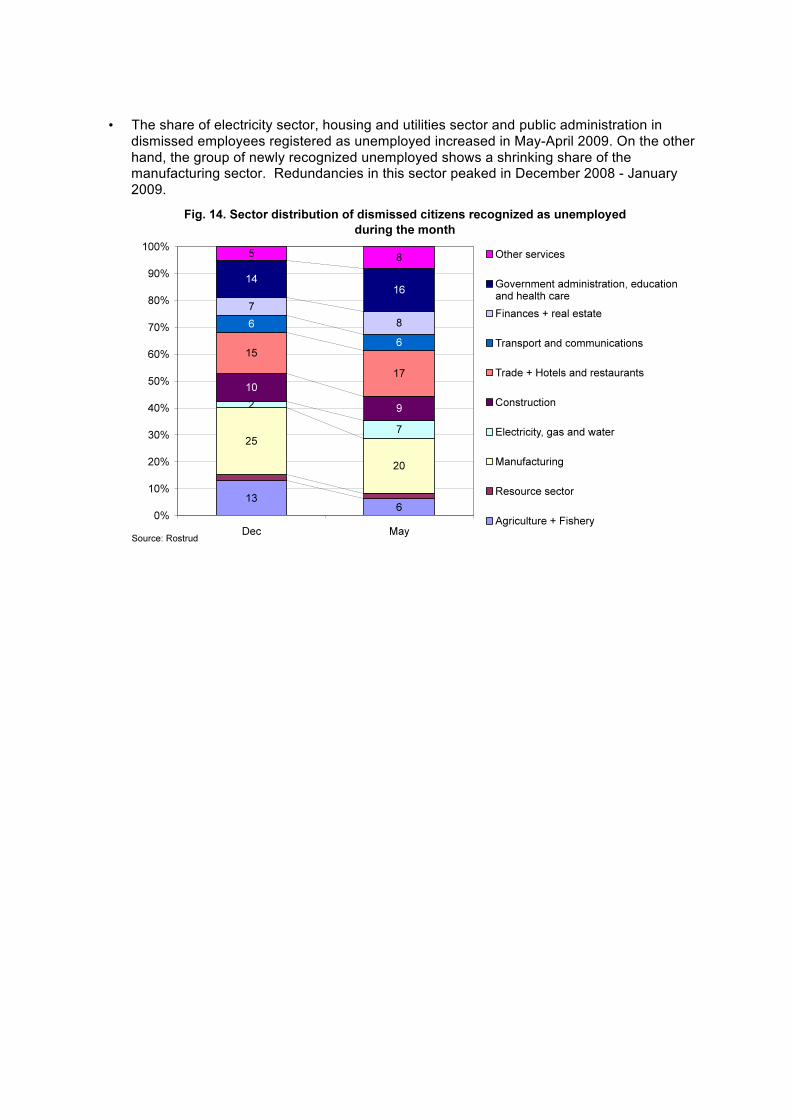
• The share of electricity sector, housing and utilities sector and public administration in
dismissed employees registered as unemployed increased in May-April 2009. On the other
hand, the group of newly recognized unemployed shows a shrinking share of the manufacturing sector. Redundancies in this sector peaked in December 2008 - January
2009.
Working Hours
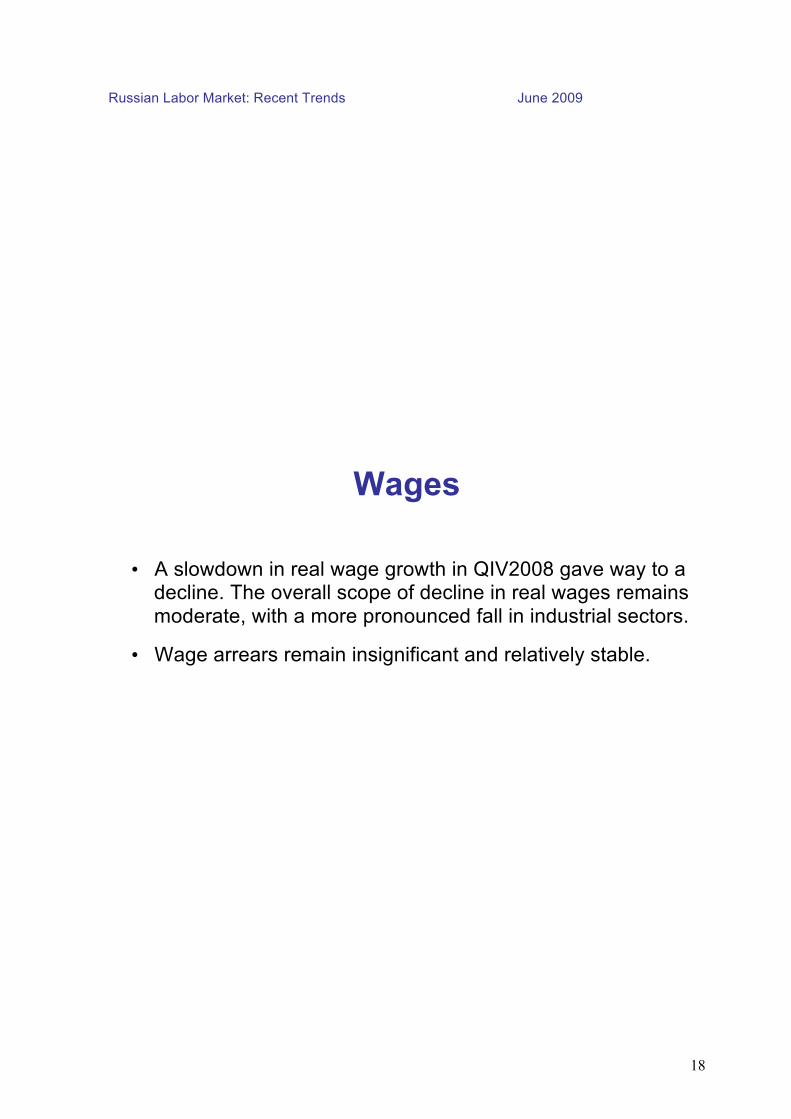
• Enterprises continue to use underemployment as an important form of adaptation to the crisis.
• The use of underemployment stabilized in the spring of 2009 following a rapid growth in QIV2008.
• Industry and construction show the highest share of employees on shortened hours.
Russian Labor Market: Recent Trends June 2009
17
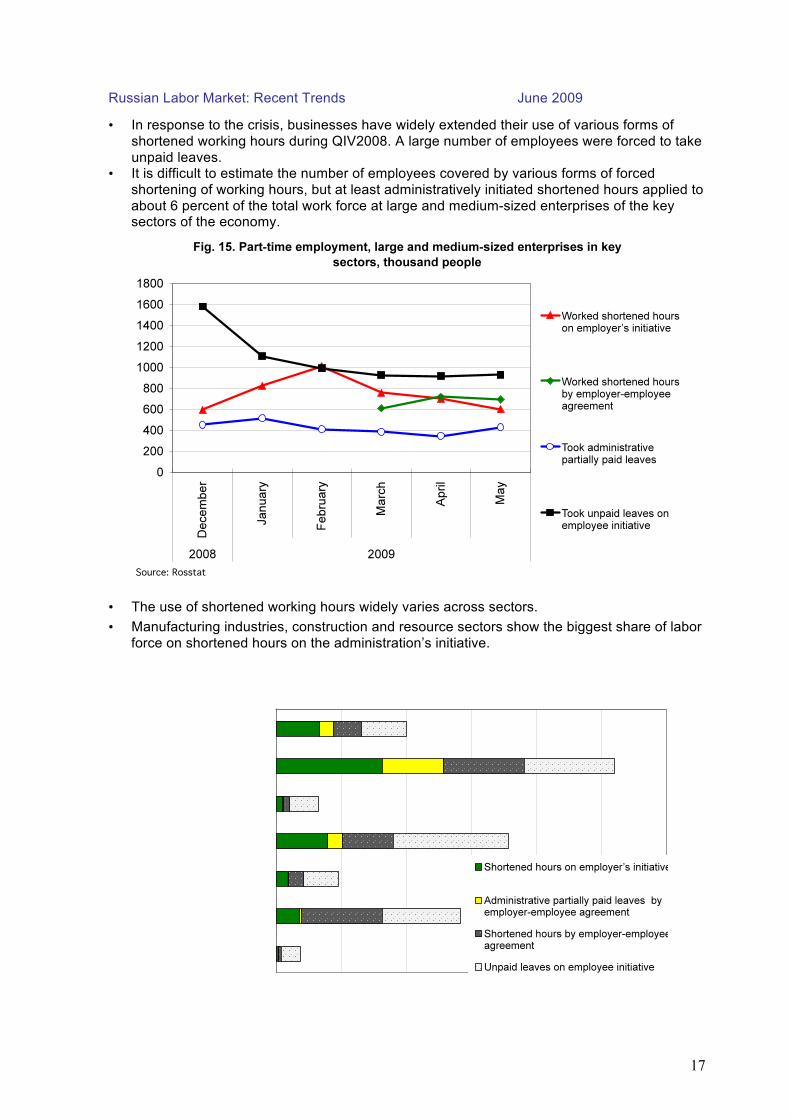
• In response to the crisis, businesses have widely extended their use of various forms of
shortened working hours during QIV2008. A large number of employees were forced to take
unpaid leaves. • It is difficult to estimate the number of employees covered by various forms of forced
shortening of working hours, but at least administratively initiated shortened hours applied to
about 6 percent of the total work force at large and medium-sized enterprises of the key sectors of the economy.
• The use of shortened working hours widely varies across sectors.
• Manufacturing industries, construction and resource sectors show the biggest share of labor
force on shortened hours on the administration’s initiative.
Russian Labor Market: Recent Trends June 2009
18
Wages
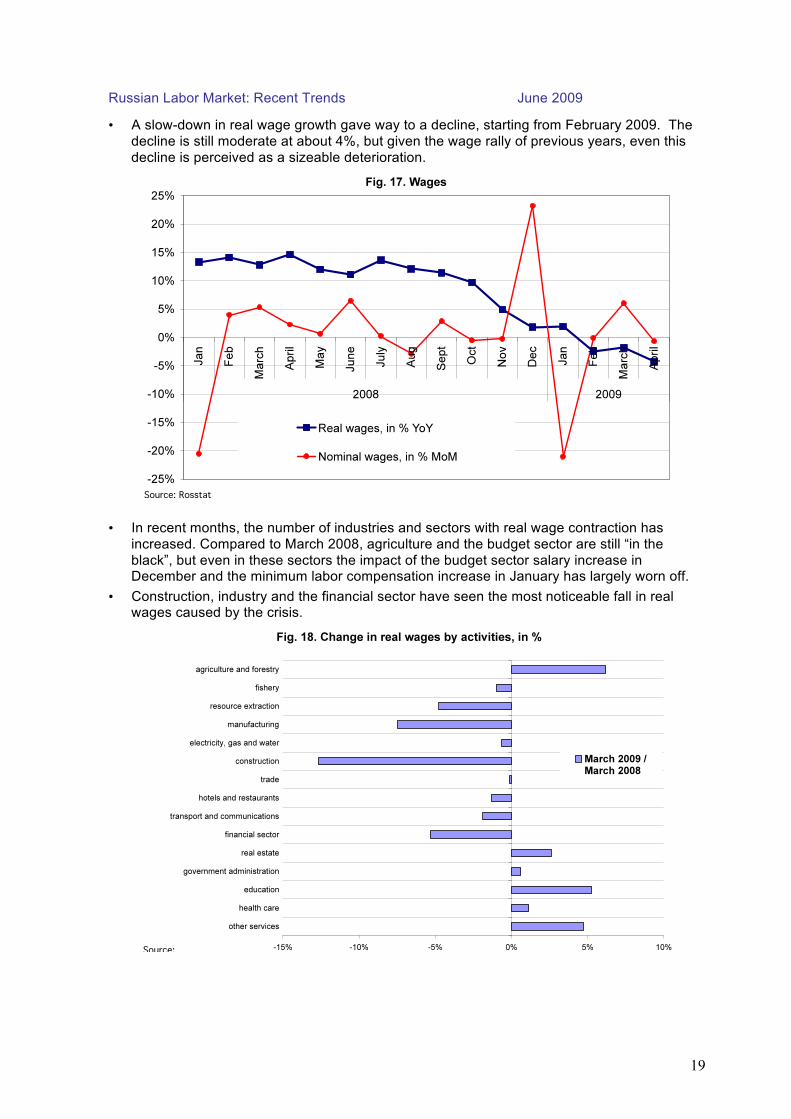
• A slowdown in real wage growth in QIV2008 gave way to a decline. The overall scope of decline in real wages remains moderate, with a more pronounced fall in industrial sectors.
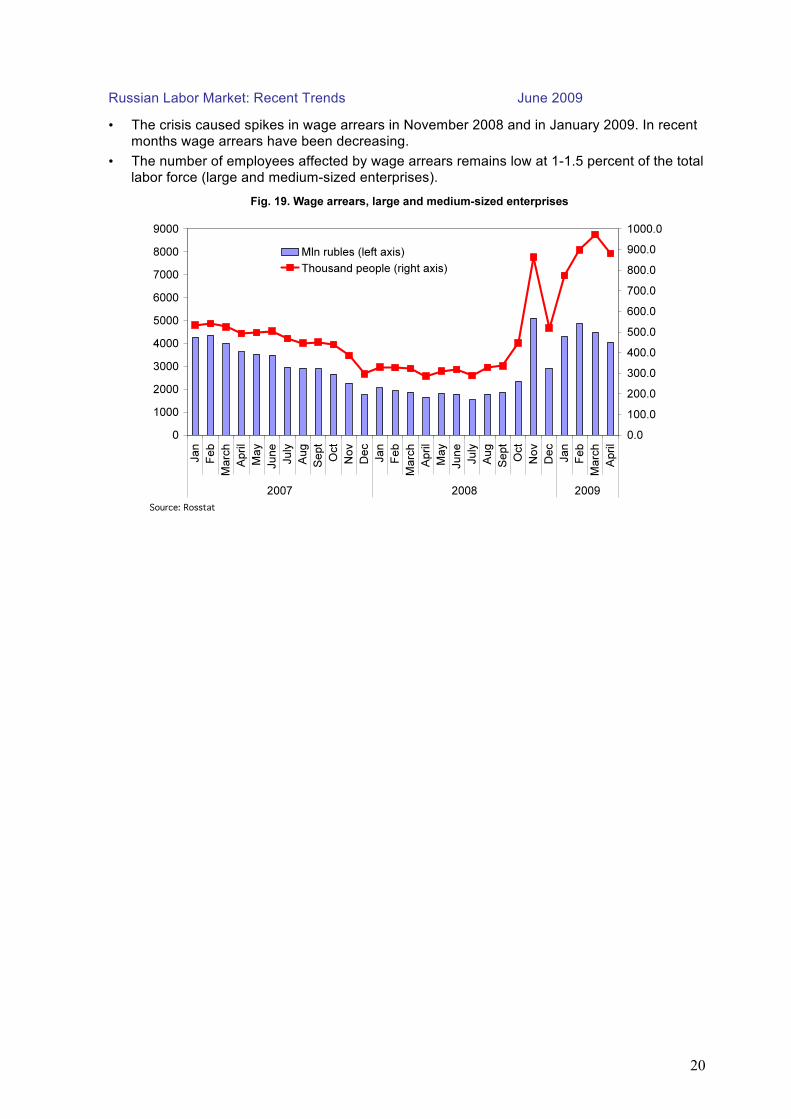
• Wage arrears remain insignificant and relatively stable.
Russian Labor Market: Recent Trends June 2009
19
• A slow-down in real wage growth gave way to a decline, starting from February 2009. The
decline is still moderate at about 4%, but given the wage rally of previous years, even this
decline is perceived as a sizeable deterioration.
• In recent months, the number of industries and sectors with real wage contraction has
increased. Compared to March 2008, agriculture and the budget sector are still “in the
black”, but even in these sectors the impact of the budget sector salary increase in December and the minimum labor compensation increase in January has largely worn off.
• Construction, industry and the financial sector have seen the most noticeable fall in real wages caused by the crisis.
Russian Labor Market: Recent Trends June 2009
20
• The crisis caused spikes in wage arrears in November 2008 and in January 2009. In recent
months wage arrears have been decreasing.
• The number of employees affected by wage arrears remains low at 1-1.5 percent of the total
labor force (large and medium-sized enterprises).
Russian Labor Market: Recent Trends June 2009
21
Regional Differentiation of Labor Market Conditions
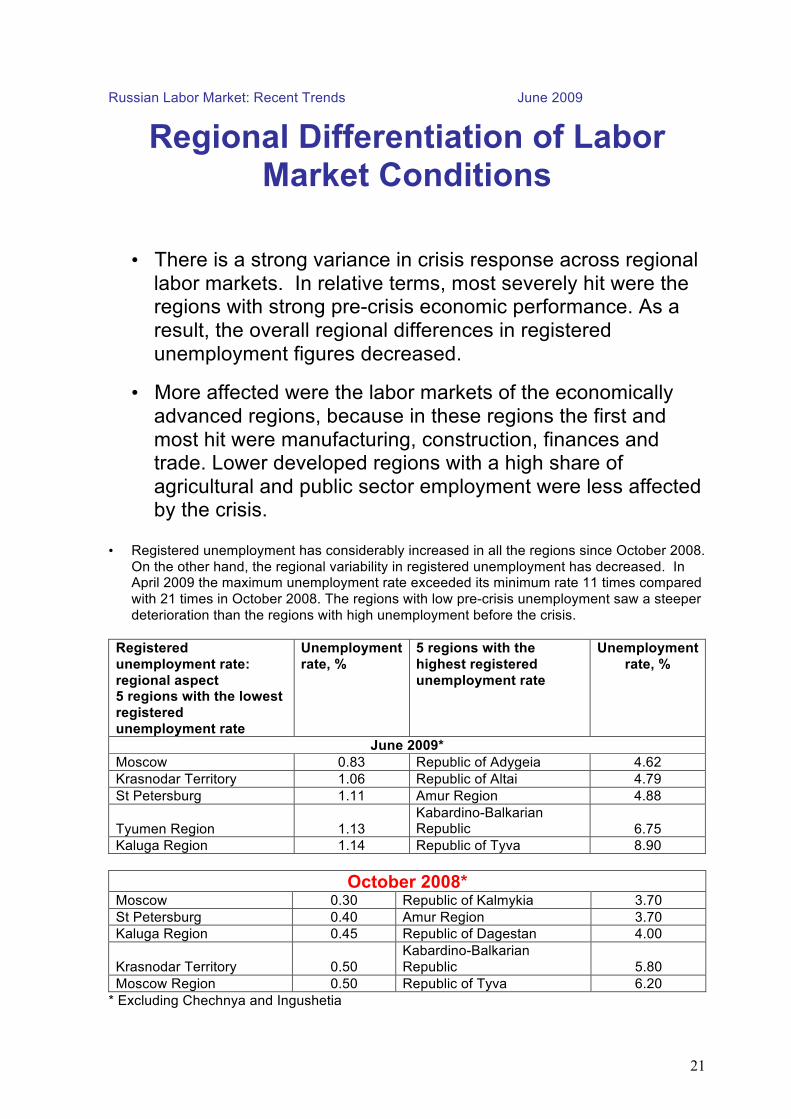
• There is a strong variance in crisis response across regional labor markets. In relative terms, most severely hit were the regions with strong pre-crisis economic performance. As a result, the overall regional differences in registered unemployment figures decreased.
• More affected were the labor markets of the economically advanced regions, because in these regions the first and most hit were manufacturing, construction, finances and trade. Lower developed regions with a high share of agricultural and public sector employment were less affected by the crisis.
• Registered unemployment has considerably increased in all the regions since October 2008.
On the other hand, the regional variability in registered unemployment has decreased. In April 2009 the maximum unemployment rate exceeded its minimum rate 11 times compared
with 21 times in October 2008. The regions with low pre-crisis unemployment saw a steeper
deterioration than the regions with high unemployment before the crisis.
Registered
unemployment rate:
regional aspect 5 regions with the lowest
registered
unemployment rate
Unemployment
rate, %
5 regions with the
highest registered
unemployment rate
Unemployment
rate, %
June 2009*
Moscow 0.83 Republic of Adygeia 4.62
Krasnodar Territory 1.06 Republic of Altai 4.79
St Petersburg 1.11 Amur Region 4.88
Tyumen Region 1.13
Kabardino-Balkarian Republic 6.75
Kaluga Region 1.14 Republic of Tyva 8.90
October 2008* Moscow 0.30 Republic of Kalmykia 3.70
St Petersburg 0.40 Amur Region 3.70
Kaluga Region 0.45 Republic of Dagestan 4.00
Krasnodar Territory 0.50
Kabardino-Balkarian
Republic 5.80
Moscow Region 0.50 Republic of Tyva 6.20
* Excluding Chechnya and Ingushetia
Russian Labor Market: Recent Trends June 2009
22
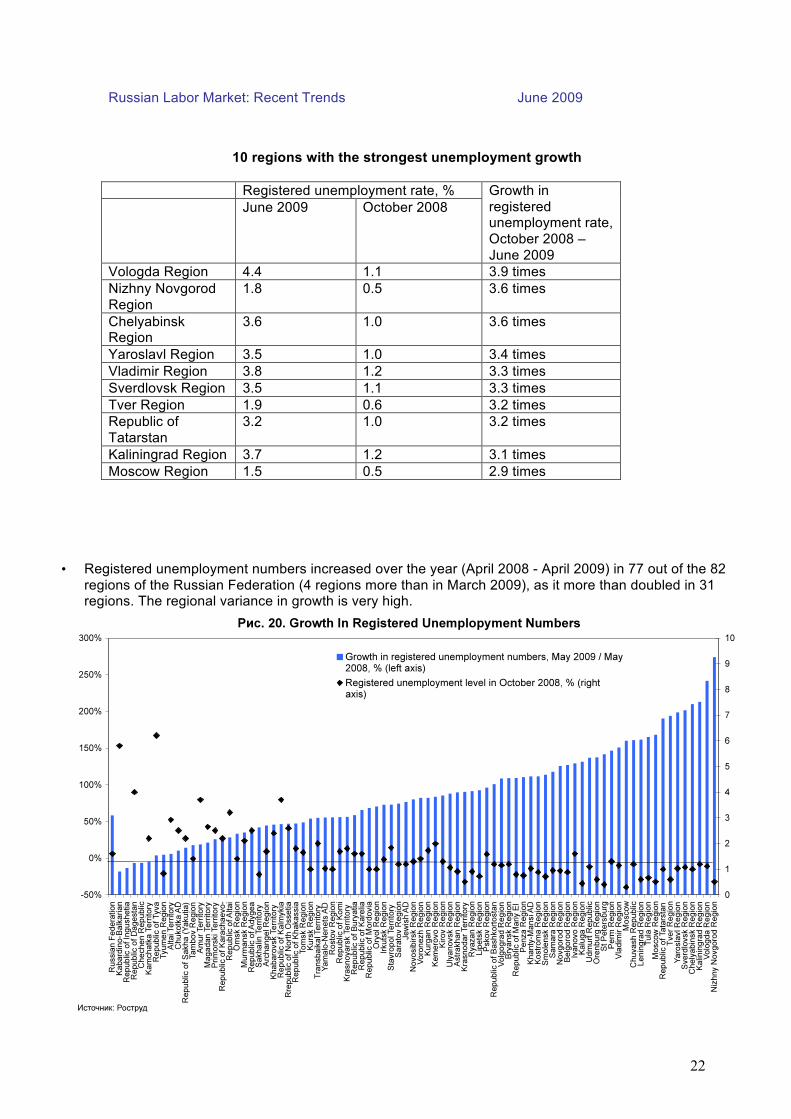
10 regions with the strongest unemployment growth
Registered unemployment rate, %
June 2009 October 2008
Growth in
registered unemployment rate,
October 2008 –
June 2009
Vologda Region 4.4 1.1 3.9 times
Nizhny Novgorod
Region
1.8 0.5 3.6 times
Chelyabinsk Region
3.6 1.0 3.6 times
Yaroslavl Region 3.5 1.0 3.4 times
Vladimir Region 3.8 1.2 3.3 times
Sverdlovsk Region 3.5 1.1 3.3 times
Tver Region 1.9 0.6 3.2 times
Republic of
Tatarstan
3.2 1.0 3.2 times
Kaliningrad Region 3.7 1.2 3.1 times
Moscow Region 1.5 0.5 2.9 times
• Registered unemployment numbers increased over the year (April 2008 - April 2009) in 77 out of the 82
regions of the Russian Federation (4 regions more than in March 2009), as it more than doubled in 31 regions. The regional variance in growth is very high.
Russian Labor Market: Recent Trends June 2009
23
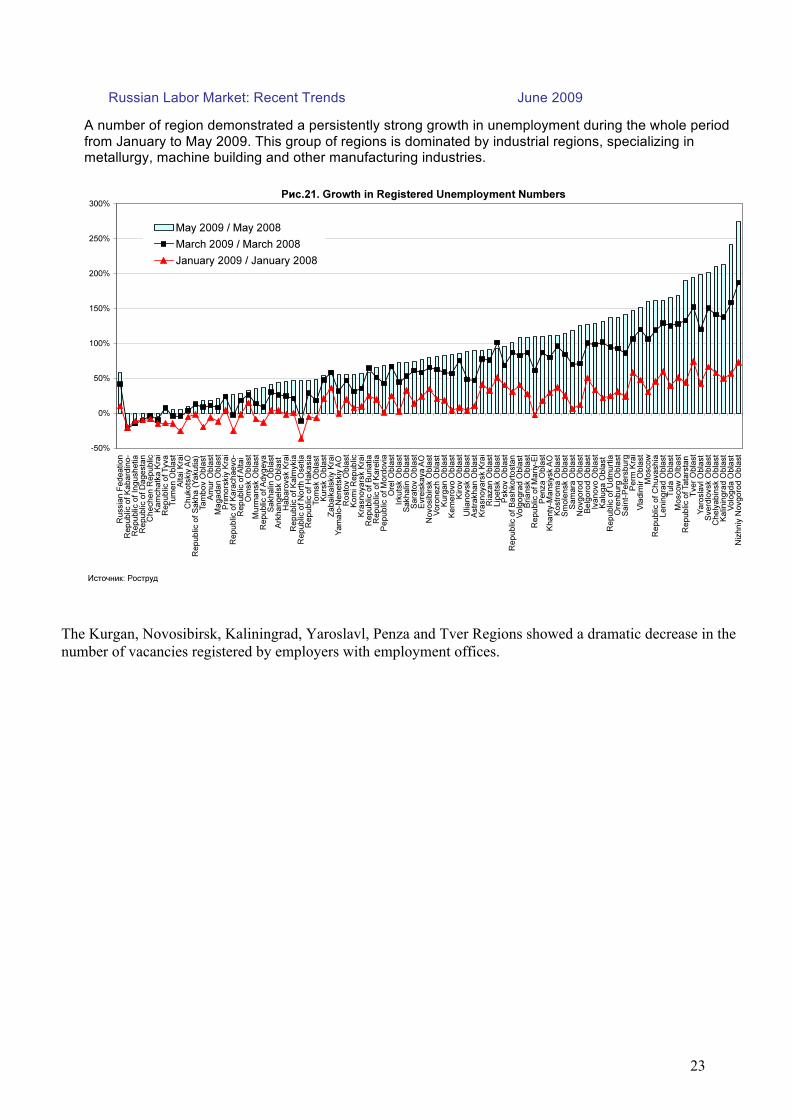
A number of region demonstrated a persistently strong growth in unemployment during the whole period
from January to May 2009. This group of regions is dominated by industrial regions, specializing in metallurgy, machine building and other manufacturing industries.
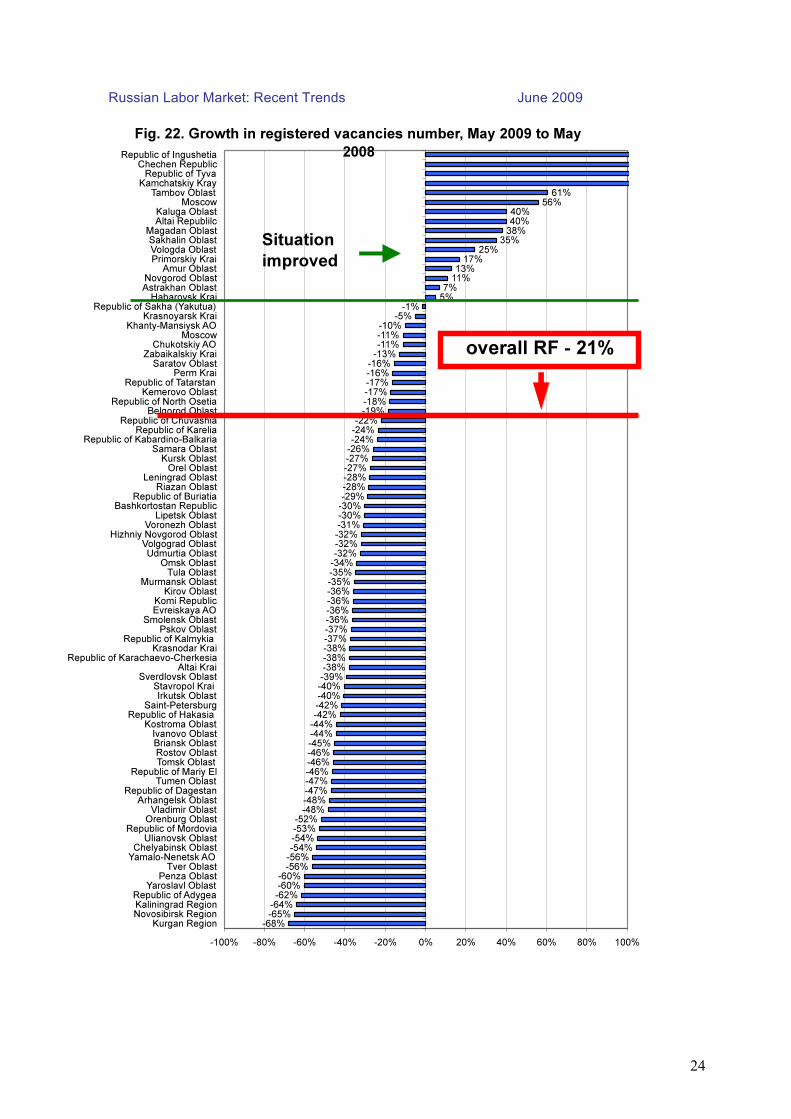
The Kurgan, Novosibirsk, Kaliningrad, Yaroslavl, Penza and Tver Regions showed a dramatic decrease in the
number of vacancies registered by employers with employment offices.
Russian Labor Market: Recent Trends June 2009
24
Russian Labor Market: Recent Trends June 2009
25
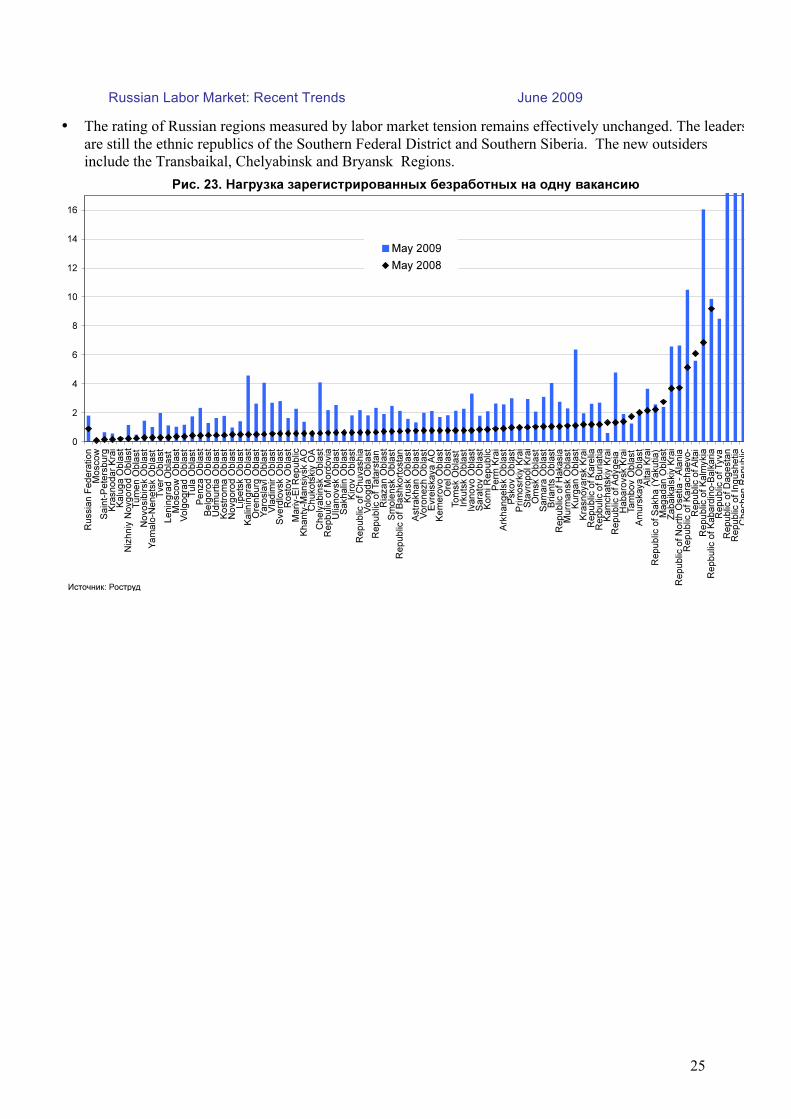
• The rating of Russian regions measured by labor market tension remains effectively unchanged. The leaders
are still the ethnic republics of the Southern Federal District and Southern Siberia. The new outsiders
include the Transbaikal, Chelyabinsk and Bryansk Regions.
Russian Labor Market: Recent Trends June 2009
26
Regional Programs to Address Labor Market Tensions
• More budget funds are earmarked for implementation of regional programs with more difficult underlying labor market conditions.
• In most regions public and temporary works is the biggest program in terms of coverage and size of budget funding.
• Various types of employment support are considerably different in terms of costs per one participant.
• All the employment support forms demonstrate visible regional per capita cost variance.
Russian Labor Market: Recent Trends June 2009
27
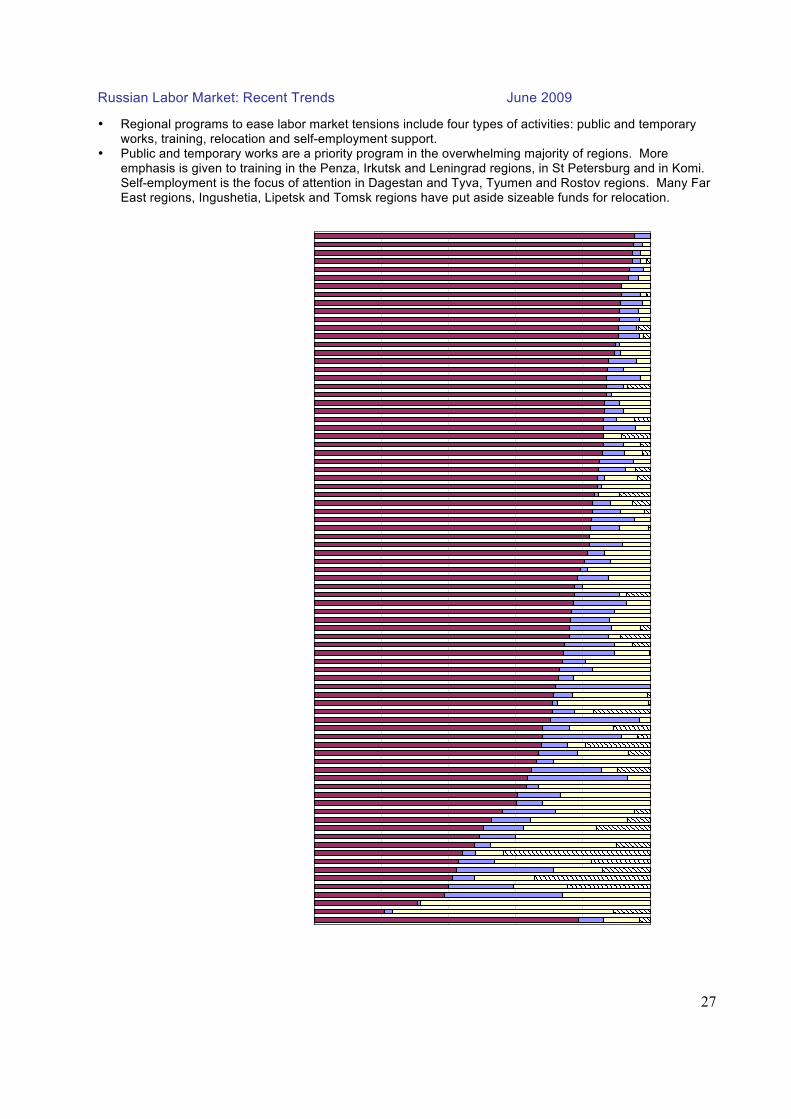
• Regional programs to ease labor market tensions include four types of activities: public and temporary works, training, relocation and self-employment support.
• Public and temporary works are a priority program in the overwhelming majority of regions. More emphasis is given to training in the Penza, Irkutsk and Leningrad regions, in St Petersburg and in Komi. Self-employment is the focus of attention in Dagestan and Tyva, Tyumen and Rostov regions. Many Far East regions, Ingushetia, Lipetsk and Tomsk regions have put aside sizeable funds for relocation.
Russian Labor Market: Recent Trends June 2009
28
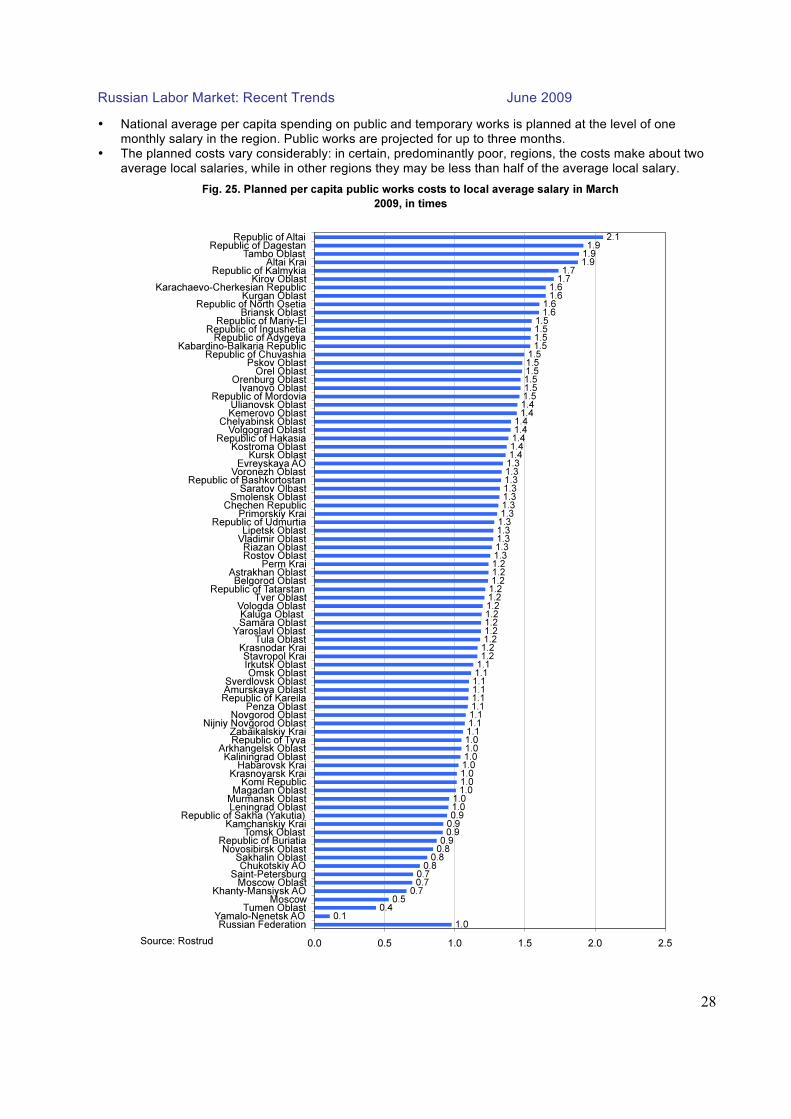
• National average per capita spending on public and temporary works is planned at the level of one monthly salary in the region. Public works are projected for up to three months.
• The planned costs vary considerably: in certain, predominantly poor, regions, the costs make about two average local salaries, while in other regions they may be less than half of the average local salary.
Russian Labor Market: Recent Trends June 2009
29
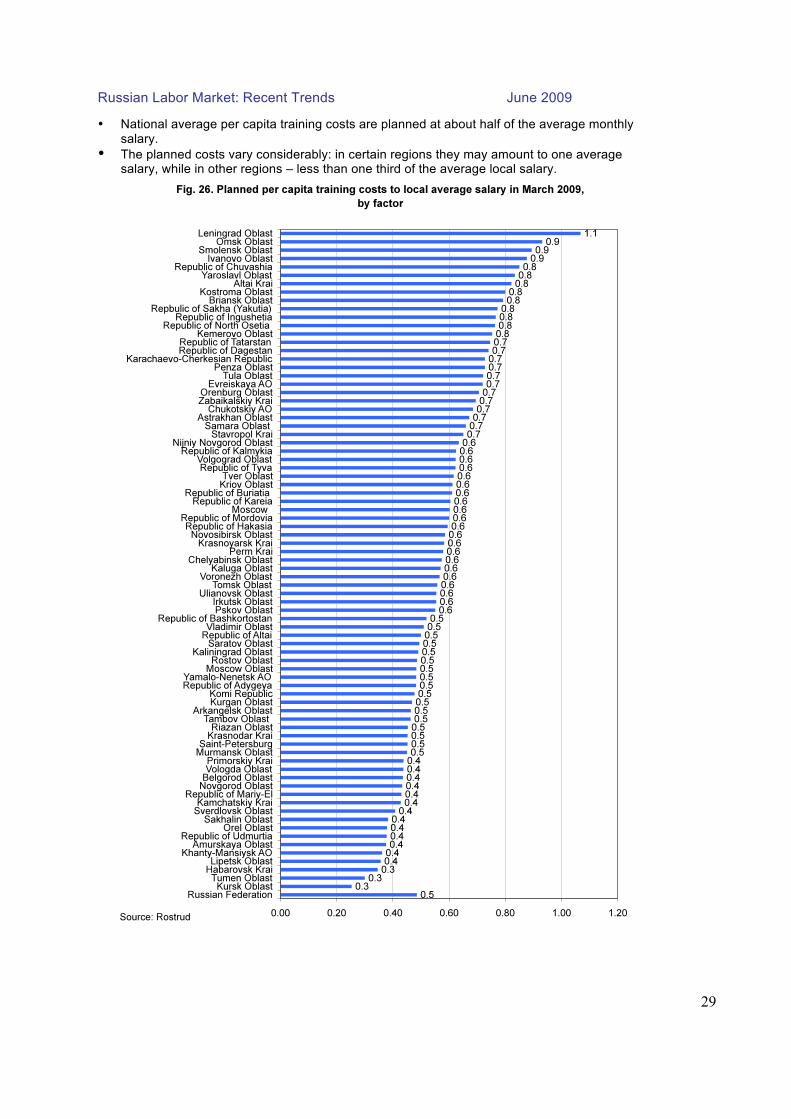
• National average per capita training costs are planned at about half of the average monthly salary.
• The planned costs vary considerably: in certain regions they may amount to one average salary, while in other regions – less than one third of the average local salary.
Russian Labor Market: Recent Trends June 2009
30
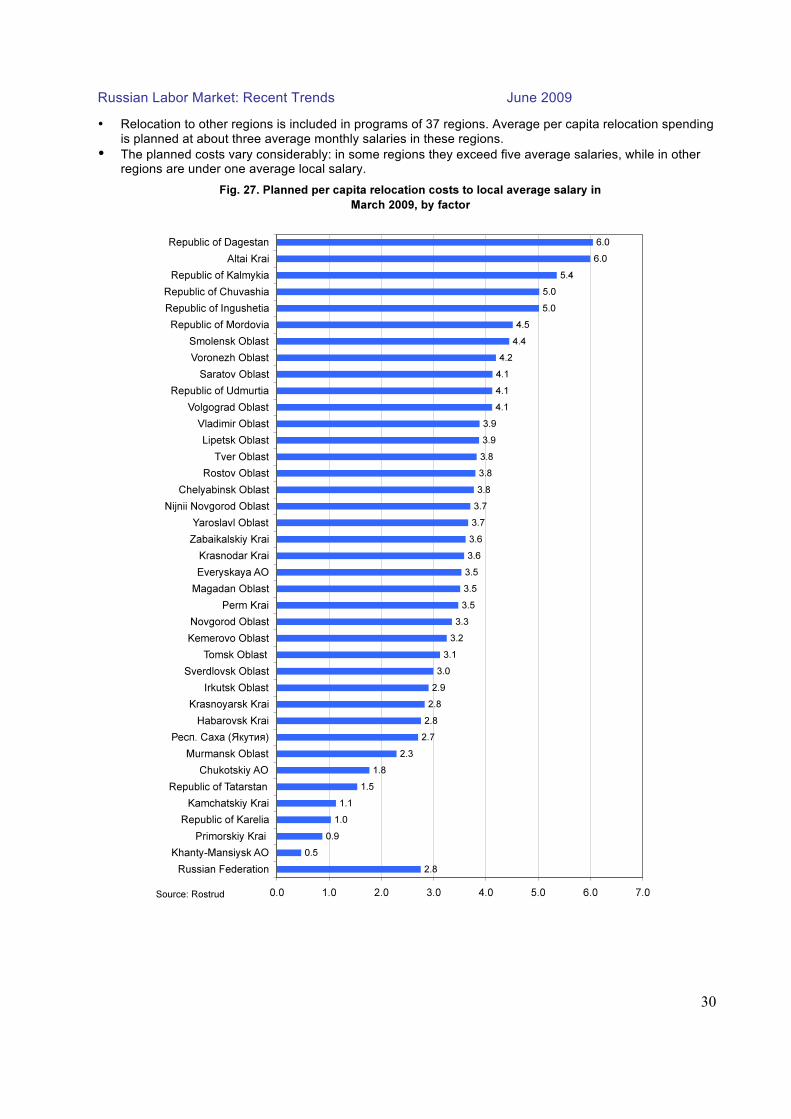
• Relocation to other regions is included in programs of 37 regions. Average per capita relocation spending is planned at about three average monthly salaries in these regions.
• The planned costs vary considerably: in some regions they exceed five average salaries, while in other regions are under one average local salary.
Russian Labor Market: Recent Trends June 2009
31
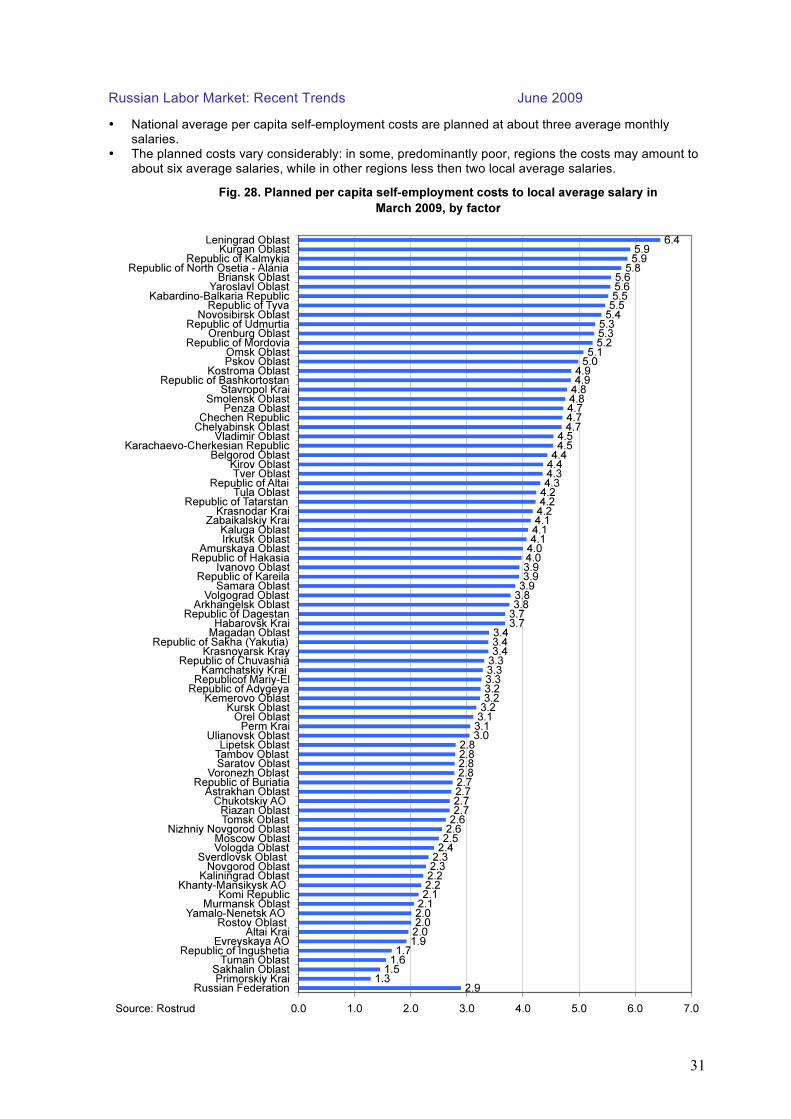
• National average per capita self-employment costs are planned at about three average monthly salaries.
• The planned costs vary considerably: in some, predominantly poor, regions the costs may amount to about six average salaries, while in other regions less then two local average salaries.
Russian Labor Market: Recent Trends June 2009
32
Vocational and professional school graduates in the labor market
• Graduates of 2009 represent considerable potential pressure on regional labor markets. The level of possible pressure has high regional differentiation.
• Higher education implies a lower risk of unemployment. Lack of vocational or professional training increases risks of unemployment.
Russian Labor Market: Recent Trends June 2009
33
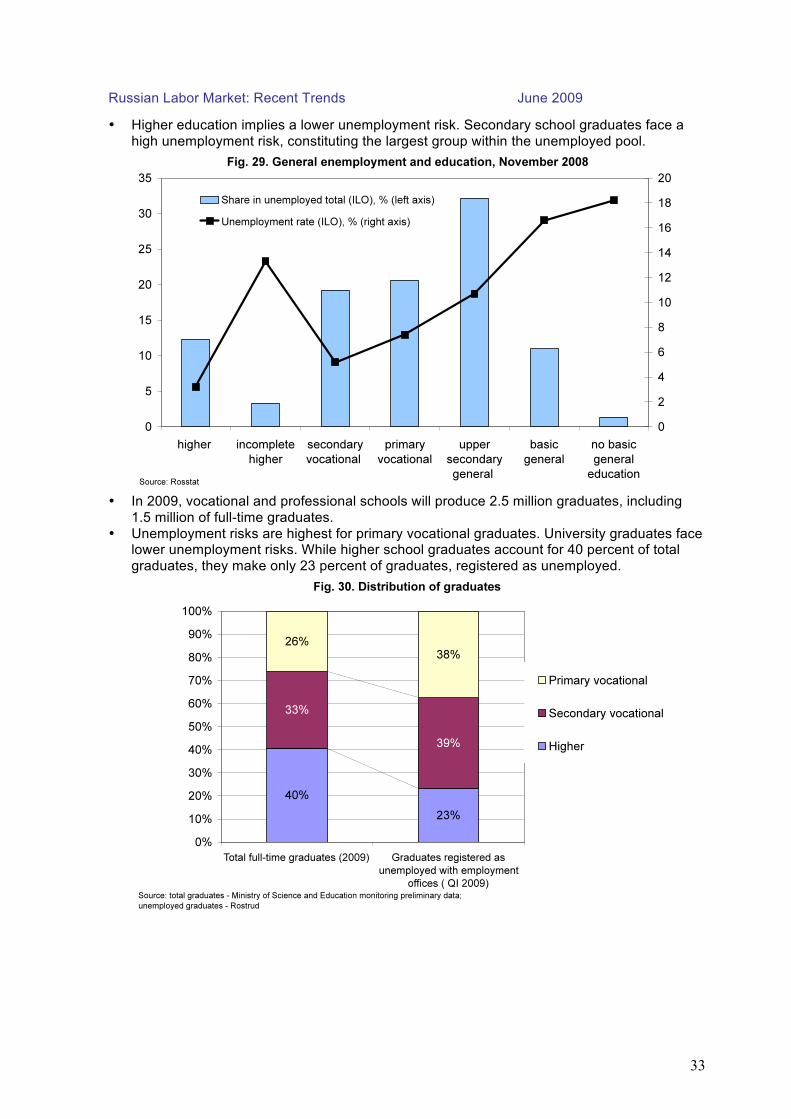
• Higher education implies a lower unemployment risk. Secondary school graduates face a
high unemployment risk, constituting the largest group within the unemployed pool.
• In 2009, vocational and professional schools will produce 2.5 million graduates, including
1.5 million of full-time graduates.
• Unemployment risks are highest for primary vocational graduates. University graduates face lower unemployment risks. While higher school graduates account for 40 percent of total
graduates, they make only 23 percent of graduates, registered as unemployed.
Russian Labor Market: Recent Trends June 2009
34
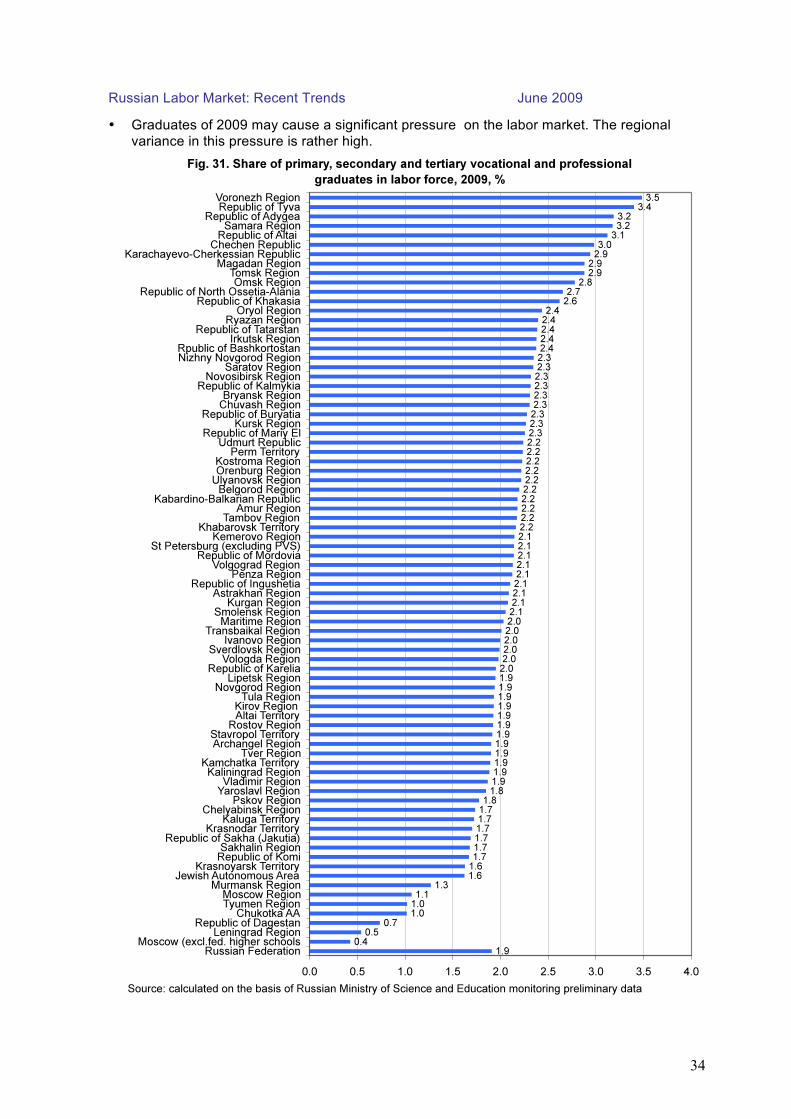
• Graduates of 2009 may cause a significant pressure on the labor market. The regional
variance in this pressure is rather high.
Russian Labor Market: Recent Trends June 2009
35
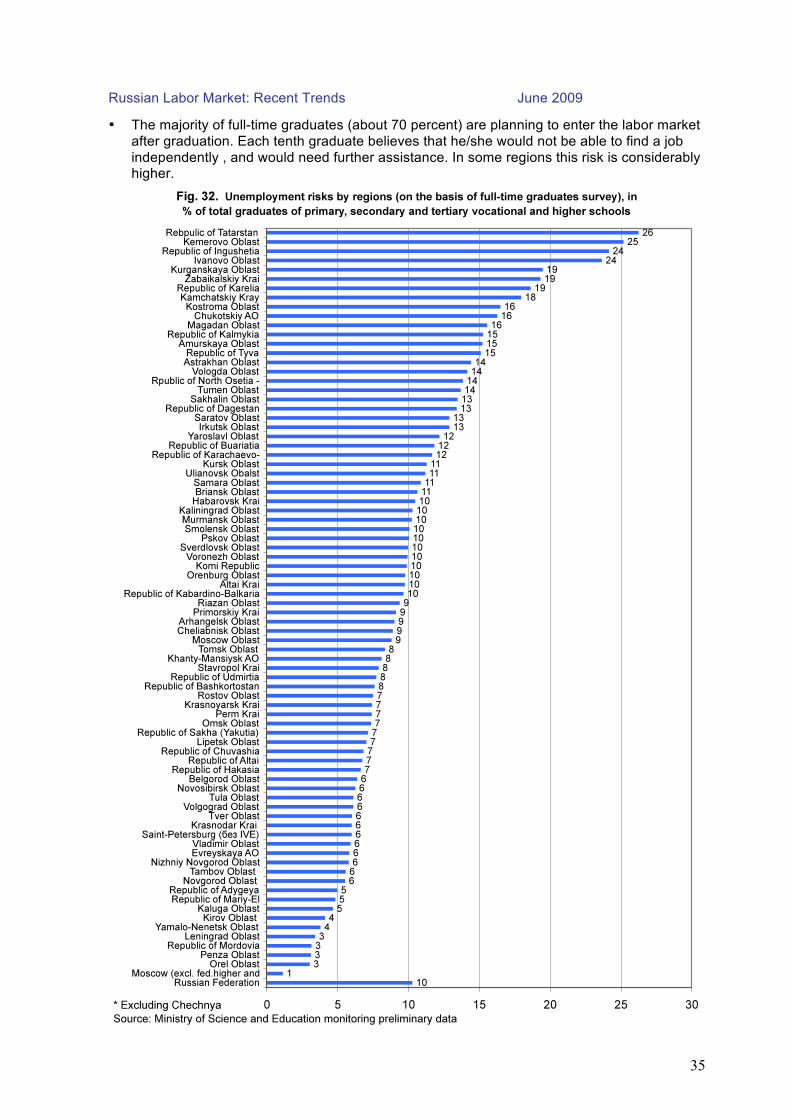
• The majority of full-time graduates (about 70 percent) are planning to enter the labor market
after graduation. Each tenth graduate believes that he/she would not be able to find a job
independently , and would need further assistance. In some regions this risk is considerably higher.

Russian Labor Market: Recent Trends June 2009
36
Russian Labor Market: Recent Trends June 2009
37
Tables
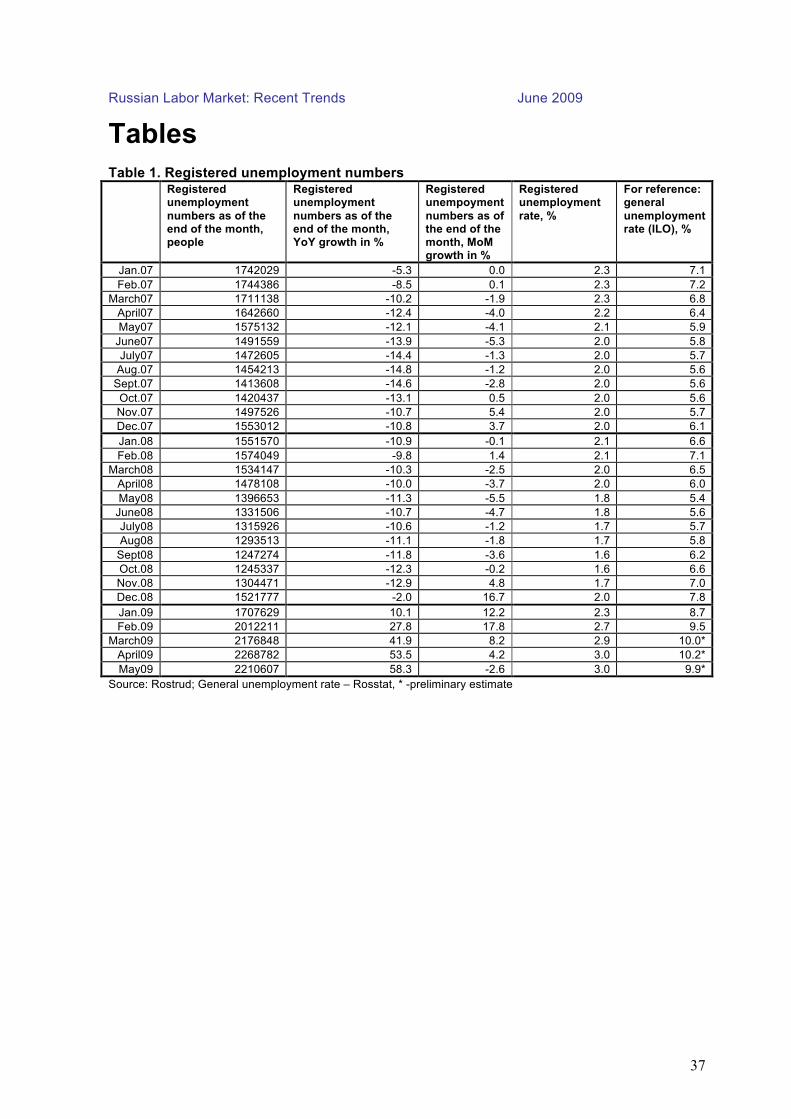
Table 1. Registered unemployment numbers Registered
unemployment
numbers as of the end of the month, people
Registered unemployment
numbers as of the end of the month, YoY growth in %
Registered unempoyment
numbers as of the end of the month, MoM growth in %
Registered unemployment
rate, %
For reference: general
unemployment rate (ILO), %
Jan.07 1742029 -5.3 0.0 2.3 7.1
Feb.07 1744386 -8.5 0.1 2.3 7.2
March07 1711138 -10.2 -1.9 2.3 6.8
April07 1642660 -12.4 -4.0 2.2 6.4
May07 1575132 -12.1 -4.1 2.1 5.9
June07 1491559 -13.9 -5.3 2.0 5.8
July07 1472605 -14.4 -1.3 2.0 5.7
Aug.07 1454213 -14.8 -1.2 2.0 5.6
Sept.07 1413608 -14.6 -2.8 2.0 5.6
Oct.07 1420437 -13.1 0.5 2.0 5.6
Nov.07 1497526 -10.7 5.4 2.0 5.7
Dec.07 1553012 -10.8 3.7 2.0 6.1
Jan.08 1551570 -10.9 -0.1 2.1 6.6
Feb.08 1574049 -9.8 1.4 2.1 7.1
March08 1534147 -10.3 -2.5 2.0 6.5
April08 1478108 -10.0 -3.7 2.0 6.0
May08 1396653 -11.3 -5.5 1.8 5.4
June08 1331506 -10.7 -4.7 1.8 5.6
July08 1315926 -10.6 -1.2 1.7 5.7
Aug08 1293513 -11.1 -1.8 1.7 5.8
Sept08 1247274 -11.8 -3.6 1.6 6.2
Oct.08 1245337 -12.3 -0.2 1.6 6.6
Nov.08 1304471 -12.9 4.8 1.7 7.0
Dec.08 1521777 -2.0 16.7 2.0 7.8
Jan.09 1707629 10.1 12.2 2.3 8.7
Feb.09 2012211 27.8 17.8 2.7 9.5
March09 2176848 41.9 8.2 2.9 10.0*
April09 2268782 53.5 4.2 3.0 10.2*
May09 2210607 58.3 -2.6 3.0 9.9*
Source: Rostrud; General unemployment rate – Rosstat, * -preliminary estimate