Russia’s growth problem · Zsolt Darvas, Maria Demertzis, Sergey Guriev, Elina Ribakova, André...
20
Marek Dabrowski (marek.dabrowski@ bruegel.org) is a Non- Resident Fellow at Bruegel, a Professor at the Higher School of Economics in Moscow and a Fellow at CASE – Centre for Social and Economic Research Antoine Mathieu Collin is a former research assistant at Bruegel The Policy Contribution was prepared between August 2018 and January 2019. e authors would like to thank Yana Myachenkova for research assistance, and Sergey Aleksashenko, Anders Aslund, Uri Dadush, Zsolt Darvas, Maria Demertzis, Sergey Guriev, Elina Ribakova, André Sapir, Nicholas Véron and Guntram Wolff for their comments. Executive summary Between 2014 and 2016, the Russian economy suffered from a currency crisis caused by the collapse of oil prices and the country’s engagement in the conflict with Ukraine. Although the crisis was overcome in the second half of 2016 thanks to prudent fiscal and monetary policies and higher oil prices, economic recovery remains weak and Russia’s medium-term growth prospects look rather disappointing. The weak growth prospects are caused by several factors including: (i) adverse demo- graphic trends – a declining working-age population and ageing of the population; (ii) a poor business and investment climate; (iii) difficulty in diversifying away from the dominant role of the hydrocarbon sector; (iv) Western sanctions on Russia in response to the annexation of Crimea and Russian support for separatists in the eastern Ukraine Donbas region, and Russian countersanctions. To increase potential growth, Russia needs comprehensive economic and institutional reforms that, in turn, will be conditioned by political reforms and by improved economic and political relationships with the United States, the European Union and Russia’s neighbours. Policy Contribution Issue n˚4 | February 2019 Russia’s growth problem Marek Dabrowski and Antoine Mathieu Collin
Transcript of Russia’s growth problem · Zsolt Darvas, Maria Demertzis, Sergey Guriev, Elina Ribakova, André...
Marek Dabrowski
(marek.dabrowski@
bruegel.org) is a Non-
Resident Fellow at Bruegel,
a Professor at the Higher
School of Economics in
Moscow and a Fellow at
CASE – Centre for Social and
Economic Research
Antoine Mathieu Collin
is a former research
assistant at Bruegel
The Policy Contribution
was prepared between
August 2018 and January
2019. The authors would like
to thank Yana Myachenkova
for research assistance,
and Sergey Aleksashenko,
Anders Aslund, Uri Dadush,
Zsolt Darvas, Maria
Demertzis, Sergey Guriev,
Elina Ribakova, André
Sapir, Nicholas Véron and
Guntram Wolff for their
comments.
Executive summary
Between 2014 and 2016, the Russian economy suffered from a currency crisis caused by
the collapse of oil prices and the country’s engagement in the conflict with Ukraine. Although
the crisis was overcome in the second half of 2016 thanks to prudent fiscal and monetary
policies and higher oil prices, economic recovery remains weak and Russia’s medium-term
growth prospects look rather disappointing.
The weak growth prospects are caused by several factors including: (i) adverse demo-
graphic trends – a declining working-age population and ageing of the population; (ii) a poor
business and investment climate; (iii) difficulty in diversifying away from the dominant role
of the hydrocarbon sector; (iv) Western sanctions on Russia in response to the annexation
of Crimea and Russian support for separatists in the eastern Ukraine Donbas region, and
Russian countersanctions.
To increase potential growth, Russia needs comprehensive economic and institutional
reforms that, in turn, will be conditioned by political reforms and by improved economic and
political relationships with the United States, the European Union and Russia’s neighbours.
Policy Contribution Issue n˚4 | February 2019 Russia’s growth problem
Marek Dabrowski and Antoine Mathieu Collin
2 Policy Contribution | Issue n˚4 | February 2019
1 IntroductionIn 2014-2015, the Russian economy was hit by a currency crisis, which led to the depreciation
of the Russian ruble (RUR) by more than half, a new wave of inflation, a decline in personal
income and a contraction of output by a cumulative 2.7 percent. The crisis was caused by a
combination of economic and geopolitical factors: the sharp decline in the international price
of oil, which is Russia’s main export item, and the conflict with Ukraine (the annexation of
Crimea and support for separatism in Donbas), which resulted in United States and European
Union sanctions against Russia, and in Russian countersanctions.
Since mid-2016, the macroeconomic situation has stabilised and Russia’s economy has
returned to growth, albeit at a slow pace. The medium-term prospects do not look better
despite the partial recovery of oil prices. This raises the question of which factors are limiting
the Russian economy’s growth potential. And this is the main topic of our analysis.
We start with an overview of growth trends in post-Soviet Russia (section 2). The subse-
quent sections analyse potential causes of the mediocre growth performance. Section 3 is
devoted to the currency crisis of 2014-16, its management and its legacy. In section 4, we
assess the potential impact on Russia’s economic performance of the conflict with Ukraine
and the deteriorating economic and political relationships with the US and EU, including the
US/EU sanctions against Russia and Russia’s countersanctions. Section 5 analyses the struc-
tural characteristics of the Russian economy and trade. Section 6 is devoted to institutional
deficiencies, that is, the poor business climate and its consequences for investment and the
balance of payments. Section 7 deals with demographic issues, which seem to be the most
serious long-term obstacle to growth. Section 8 presents conclusions and recommendations.
2 The post-Soviet growth storyFigure 1 presents the history of economic growth in post-Soviet Russia. The 1990s was marked
by a deep output contraction, the result of structural and institutional distortions that accu-
mulated during several decades of the centrally planned economy, plus huge macroeconomic
disequilibria in the initial period of transition and the slow pace of economic reform. In fact,
the output decline had already started in the late-Soviet period and was preceded by a near
decade of economic stagnation.
Between 1999 and 2008, Russia enjoyed a decade of rapid economic growth facilitated
by structural and institutional changes in the 1990s and the global commodity boom (high
oil prices). The global financial crisis of 2008-09 hit Russia hard, leading to a dramatic GDP
decline of 7.8 percent in 2009. In the next three years (2010-12), however, there was a visible
recovery. In 2013 the growth rate went below 2 percent and the next year Russia was hit by a
currency crisis.
This time, the crisis was not caused by imprudent fiscal and monetary policies, as hap-
pened in the late 1980s, the first half of the 1990s and in 1998-99. Rather it was triggered by
the external shock of the decline in international oil and commodity prices, combined with
domestic structural and institutional vulnerabilities. There was also a geopolitical factor not
present in the previous crises: Russia’s engagement in the territorial conflict with Ukraine,
which resulted in international sanctions against Russia and Russian countersanctions (see
section 4).
The crisis that started in 2014 caused a two-year recession. Real GDP fell by 2.5 percent
in 2015 and additional 0.2 percent in 2016. Although the 2015-16 recession in Russia was
shallower than during the global financial crisis (2008-09) it was deeper than in most other
oil-producing countries (Dabrowski, 2016). This might have been the result of more conserv-
3 Policy Contribution | Issue n˚4 | February 2019
ative fiscal policy in Russia (see section 3), compared to, for example, Saudi Arabia or other
Gulf countries, which launched large-scale fiscal stimulus programmes in 2014-15.
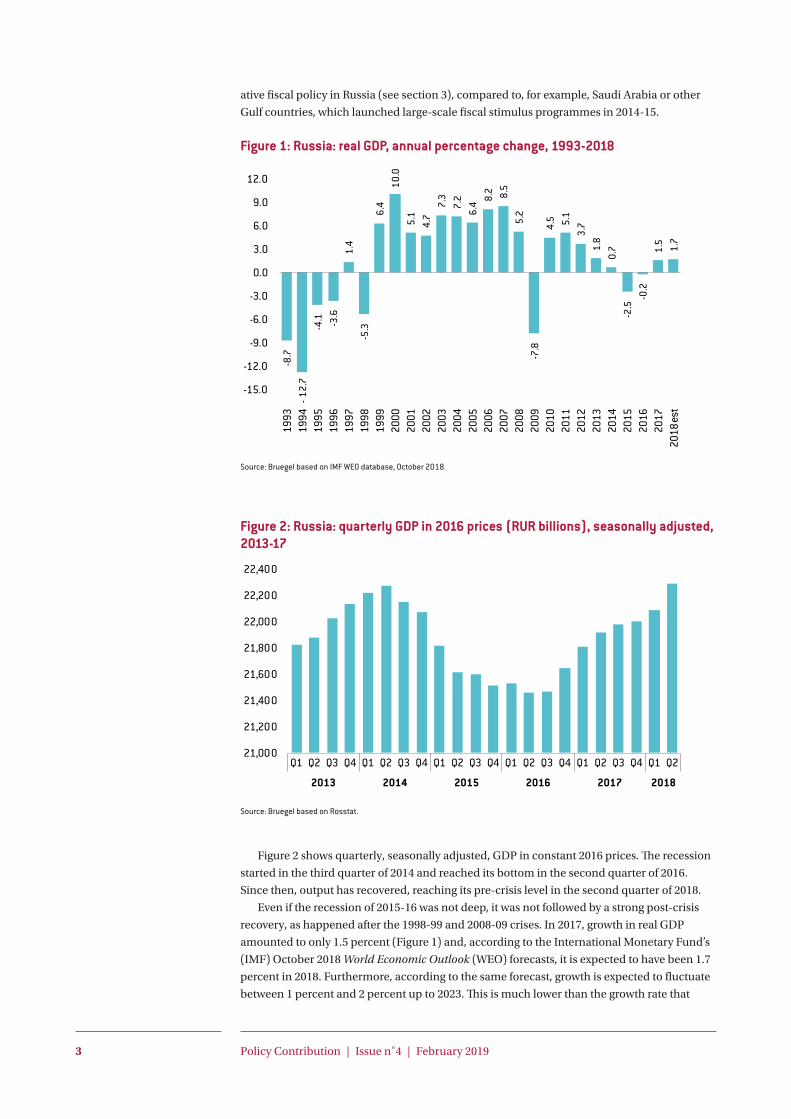
Figure 1: Russia: real GDP, annual percentage change, 1993-2018
Source: Bruegel based on IMF WEO database, October 2018.
Figure 2: Russia: quarterly GDP in 2016 prices (RUR billions), seasonally adjusted, 2013-17
Source: Bruegel based on Rosstat.
Figure 2 shows quarterly, seasonally adjusted, GDP in constant 2016 prices. The recession
started in the third quarter of 2014 and reached its bottom in the second quarter of 2016.
Since then, output has recovered, reaching its pre-crisis level in the second quarter of 2018.
Even if the recession of 2015-16 was not deep, it was not followed by a strong post-crisis
recovery, as happened after the 1998-99 and 2008-09 crises. In 2017, growth in real GDP
amounted to only 1.5 percent (Figure 1) and, according to the International Monetary Fund’s
(IMF) October 2018 World Economic Outlook (WEO) forecasts, it is expected to have been 1.7
percent in 2018. Furthermore, according to the same forecast, growth is expected to fluctuate
between 1 percent and 2 percent up to 2023. This is much lower than the growth rate that
-8.7
-12.
7-4
.1 -3.6
1.4
-5.3
6.4
10.0
5.1
4.7
7.3
7.2
6.4 8.
2 8.5
5.2
-7.8
4.5 5.
13.
71.
80.
7-2
.5-0
.21.
51.
7
-15.0
-12.0
-9.0
-6.0
-3.0
0.0
3.0
6.0
9.0
12.0
1993
1994
1995
1996
1997
1998
1999
2000
2001
2002
2003
2004
2005
2006
2007
2008
2009
2010
2011
2012
2013
2014
2015
2016
2017
2018
est
21,000
21,200
21,400
21,600
21,800
22,000
22,200
22,400
Q1 Q2 Q3 Q4 Q1 Q2 Q3 Q4 Q1 Q2 Q3 Q4 Q1 Q2 Q3 Q4 Q1 Q2 Q3 Q4 Q1 Q2
2013 2014 2015 2016 2017 2018

4 Policy Contribution | Issue n˚4 | February 2019
Russia enjoyed between 1999 and 2008, and looks disappointing for a middle-income country
that still has a long way to go to catch up with the high-income group.
Furthermore, if one compares Russia to other emerging-market economies (Figure 3), its
growth performance since 2007 does not look impressive. Brazil, which experienced an even
deeper recession in 2014-16, and Argentina, which has recorded several recession episodes
since 2010, are the only exceptions. However, it is fair to say that such a comparison of coun-
tries might disregard some important factors, such as different demographic conditions or
different stages of economic development (see section 7 for an analysis of Russia’s unfavoura-
ble demographic trends).
Figure 3: Real GDP in Russia and other emerging-market economies, annual percentage change, 2007-17
Source: Bruegel based on World Bank’s World Development Indicators. Note: EMDE = emerging market and developing economies.
Nevertheless, the questions of why the rate of growth of the Russian economy slowed
down and why Russia’s growth prospects remain disappointing, require in-depth analysis and
this the main purpose of this Policy Contribution. In the following sections, we analyse in turn
five groups of factors that might be responsible for Russia’s mediocre growth record: mac-
roeconomic management of the 2014-16 currency crisis; the costs of the Ukrainian conflict
and the deteriorating economic and political relationships with the US and the EU; structural
characteristics of the Russian economy; institutional shortcomings; and demographic trends.
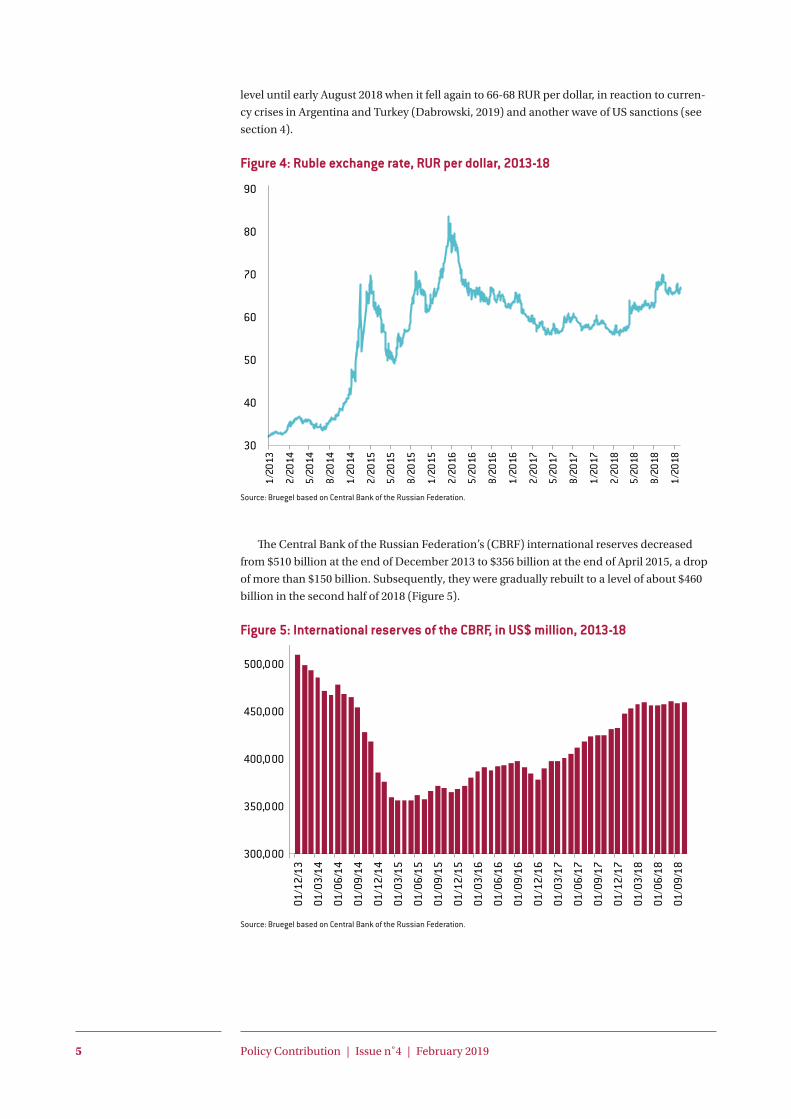
3 Managing the 2014-16 currency crisis In 2014-16, Russia was hit by its fifth currency crisis since the early 1990s (Dabrowski, 2016).
Between December 2013 and December 2015, the RUR depreciated by 55 percent against the
US dollar (it depreciated by less against the euro because of the strengthening of the dollar
against the euro), with depreciation greatest in the period between November 2014 and
February 2015 (Figure 4). There were then two further but shorter periods of RUR decline – in
August 2015 and January-February 2016. After the second quarter of 2016, the RUR gradually
strengthened (as a result of the recovery of the oil price) and remained below 60 RUR per
dollar thorough most of 2017 and the first quarter of 2018. In April 2018, in response to US
sanctions introduced under the Countering America’s Adversaries Through Sanctions Act
(CAATSA) (see section 4) the ruble depreciated to 61-64 RUR to the dollar. It stayed at this
-9.0
-6.0
-3.0
0.0
3.0
6.0
9.0
12.0
15.0
2007 2008 2009 2010 2011 2012 2013 2014 2015 2016 2017
Argentina Brazil ChinaIndia Indonesia MexicoRussia South Africa Turkey
5 Policy Contribution | Issue n˚4 | February 2019
level until early August 2018 when it fell again to 66-68 RUR per dollar, in reaction to curren-
cy crises in Argentina and Turkey (Dabrowski, 2019) and another wave of US sanctions (see
section 4).
Figure 4: Ruble exchange rate, RUR per dollar, 2013-18
Source: Bruegel based on Central Bank of the Russian Federation.
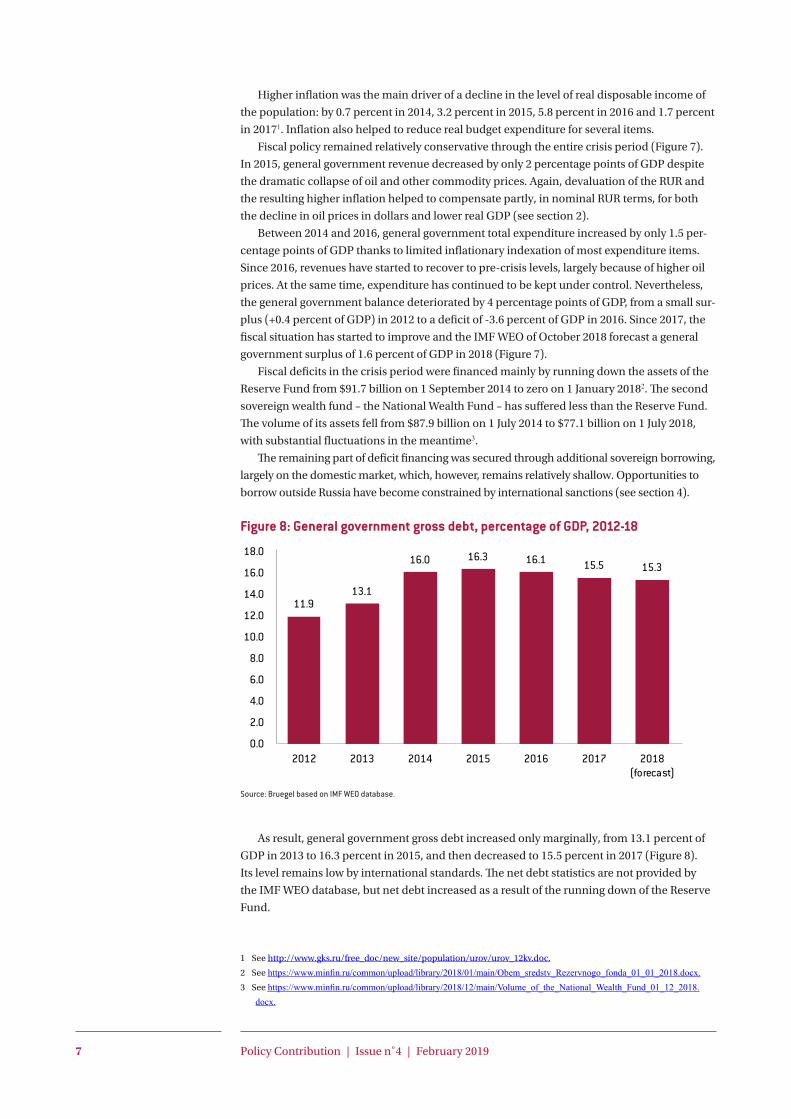
The Central Bank of the Russian Federation’s (CBRF) international reserves decreased
from $510 billion at the end of December 2013 to $356 billion at the end of April 2015, a drop
of more than $150 billion. Subsequently, they were gradually rebuilt to a level of about $460
billion in the second half of 2018 (Figure 5).
Figure 5: International reserves of the CBRF, in US$ million, 2013-18
Source: Bruegel based on Central Bank of the Russian Federation.
30
40
50
60
70
80
90
11/2
013
02/2
014
05/2
014
08/2
014
11/2
014
02/2
015
05/2
015
08/2
015
11/2
015
02/2
016
05/2
016
08/2
016
11/2
016
02/2
017
05/2
017
08/2
017
11/2
017
02/2
018
05/2
018
08/2
018
11/2
018
300,000
350,000
400,000
450,000
500,000
550,000
01/1
2/13
01/0
3/14
01/0
6/14
01/0
9/14
01/1
2/14
01/0
3/15
01/0
6/15
01/0
9/15
01/1
2/15
01/0
3/16
01/0
6/16
01/0
9/16
01/1
2/16
01/0
3/17
01/0
6/17
01/0
9/17
01/1
2/17
01/0
3/18
01/0
6/18
01/0
9/18

6 Policy Contribution | Issue n˚4 | February 2019
The introduction in Russia of inflation targeting and a more flexible exchange-rate regime
helped in both macro- and microeconomic adjustment, and limited international reserve
losses, even if the timing of the introduction of these measures, at the peak of the crisis, was
not optimal (Dabrowski, 2016).
Figure 6: Inflation, end of period, in percent, 2012-18
Source: Bruegel based on IMF WEO database, October 2018 for the period 2012-17; http://www.gks.ru/dbscripts/cbsd/DBInet.cgi for 2018.
Currency depreciation pushed twelve-month inflation up to 11.4 percent in Decem-
ber 2014, 16.9 percent in March 2015 and 12.9 percent in December 2015 (Figure 6). Then
inflation went down to 5.4 percent in December 2016 and 2.5 percent in December 2017, the
lowest ever level in the history of post-Soviet Russia. The inflation-targeting regime helped in
this process. Inflation increased again to 4.3 percent in December 2018.
Figure 7: General government revenue, total expenditure and net lending/borrow-ing, percentage of GDP, 2012-18
34.433.4 33.8
31.8 32.7 33.335.5
34.034.6 34.9 35.1
36.4 34.833.9
0.4
-1.2 -1.1-3.4 -3.6
-1.5
1.6
-5.0
0.0
5.0
10.0
15.0
20.0
25.0
30.0
35.0
40.0
2012 2013 2014 2015 2016 2017 2018(forecast)
GG revenue GG total expenditure GG net lending/borrowing
Source: Bruegel based on IMF WEO database, October 2018.
6.6 6.5
11.4
12.9
5.4
2.53.6
0.0
2.0
4.0
6.0
8.0
10.0
12.0
14.0
2012 2013 2014 2015 2016 2017 2018
7 Policy Contribution | Issue n˚4 | February 2019
Higher inflation was the main driver of a decline in the level of real disposable income of
the population: by 0.7 percent in 2014, 3.2 percent in 2015, 5.8 percent in 2016 and 1.7 percent
in 20171. Inflation also helped to reduce real budget expenditure for several items.
Fiscal policy remained relatively conservative through the entire crisis period (Figure 7).
In 2015, general government revenue decreased by only 2 percentage points of GDP despite
the dramatic collapse of oil and other commodity prices. Again, devaluation of the RUR and
the resulting higher inflation helped to compensate partly, in nominal RUR terms, for both
the decline in oil prices in dollars and lower real GDP (see section 2).
Between 2014 and 2016, general government total expenditure increased by only 1.5 per-
centage points of GDP thanks to limited inflationary indexation of most expenditure items.
Since 2016, revenues have started to recover to pre-crisis levels, largely because of higher oil
prices. At the same time, expenditure has continued to be kept under control. Nevertheless,
the general government balance deteriorated by 4 percentage points of GDP, from a small sur-
plus (+0.4 percent of GDP) in 2012 to a deficit of -3.6 percent of GDP in 2016. Since 2017, the
fiscal situation has started to improve and the IMF WEO of October 2018 forecast a general
government surplus of 1.6 percent of GDP in 2018 (Figure 7).
Fiscal deficits in the crisis period were financed mainly by running down the assets of the
Reserve Fund from $91.7 billion on 1 September 2014 to zero on 1 January 20182. The second
sovereign wealth fund – the National Wealth Fund – has suffered less than the Reserve Fund.
The volume of its assets fell from $87.9 billion on 1 July 2014 to $77.1 billion on 1 July 2018,
with substantial fluctuations in the meantime3.
The remaining part of deficit financing was secured through additional sovereign borrowing,
largely on the domestic market, which, however, remains relatively shallow. Opportunities to
borrow outside Russia have become constrained by international sanctions (see section 4).
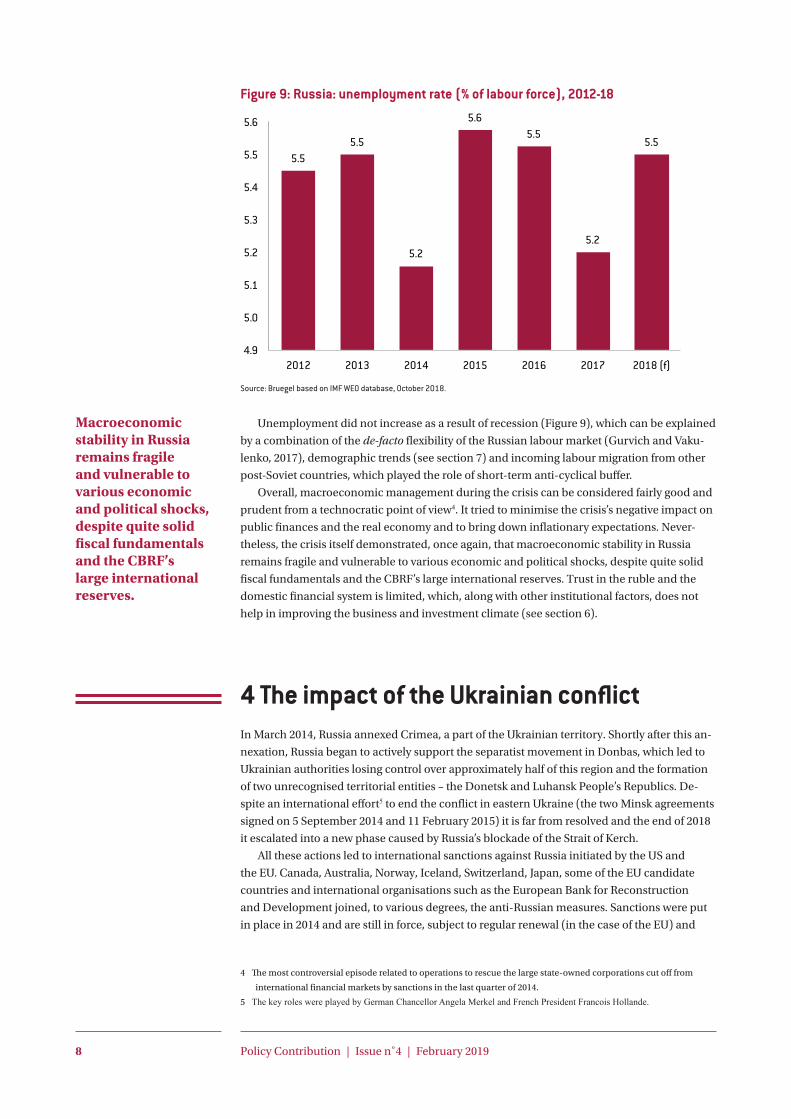
Figure 8: General government gross debt, percentage of GDP, 2012-18
Source: Bruegel based on IMF WEO database.
As result, general government gross debt increased only marginally, from 13.1 percent of
GDP in 2013 to 16.3 percent in 2015, and then decreased to 15.5 percent in 2017 (Figure 8).
Its level remains low by international standards. The net debt statistics are not provided by
the IMF WEO database, but net debt increased as a result of the running down of the Reserve
Fund.
1 See http://www.gks.ru/free_doc/new_site/population/urov/urov_12kv.doc.
2 See https://www.minfin.ru/common/upload/library/2018/01/main/Obem_sredstv_Rezervnogo_fonda_01_01_2018.docx. 3 See https://www.minfin.ru/common/upload/library/2018/12/main/Volume_of_the_National_Wealth_Fund_01_12_2018.
docx.
11.913.1
16.0 16.3 16.1 15.5 15.3
0.0
2.0
4.0
6.0
8.0
10.0
12.0
14.0
16.0
18.0
2012 2013 2014 2015 2016 2017 2018(forecast)
8 Policy Contribution | Issue n˚4 | February 2019
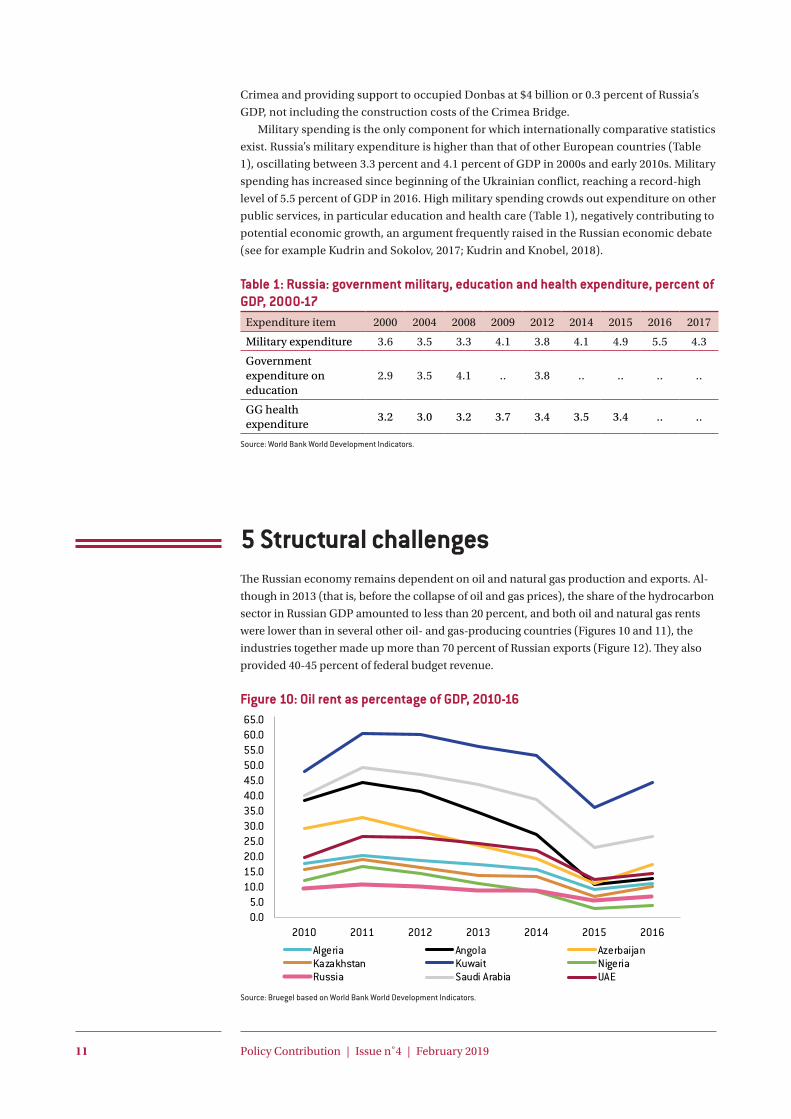
Figure 9: Russia: unemployment rate (% of labour force), 2012-18
Source: Bruegel based on IMF WEO database, October 2018.
Unemployment did not increase as a result of recession (Figure 9), which can be explained
by a combination of the de-facto flexibility of the Russian labour market (Gurvich and Vaku-
lenko, 2017), demographic trends (see section 7) and incoming labour migration from other
post-Soviet countries, which played the role of short-term anti-cyclical buffer.
Overall, macroeconomic management during the crisis can be considered fairly good and
prudent from a technocratic point of view4. It tried to minimise the crisis’s negative impact on
public finances and the real economy and to bring down inflationary expectations. Never-
theless, the crisis itself demonstrated, once again, that macroeconomic stability in Russia
remains fragile and vulnerable to various economic and political shocks, despite quite solid
fiscal fundamentals and the CBRF’s large international reserves. Trust in the ruble and the
domestic financial system is limited, which, along with other institutional factors, does not
help in improving the business and investment climate (see section 6).
4 The impact of the Ukrainian conflict In March 2014, Russia annexed Crimea, a part of the Ukrainian territory. Shortly after this an-
nexation, Russia began to actively support the separatist movement in Donbas, which led to
Ukrainian authorities losing control over approximately half of this region and the formation
of two unrecognised territorial entities – the Donetsk and Luhansk People’s Republics. De-
spite an international effort5 to end the conflict in eastern Ukraine (the two Minsk agreements
signed on 5 September 2014 and 11 February 2015) it is far from resolved and the end of 2018
it escalated into a new phase caused by Russia’s blockade of the Strait of Kerch.
All these actions led to international sanctions against Russia initiated by the US and
the EU. Canada, Australia, Norway, Iceland, Switzerland, Japan, some of the EU candidate
countries and international organisations such as the European Bank for Reconstruction
and Development joined, to various degrees, the anti-Russian measures. Sanctions were put
in place in 2014 and are still in force, subject to regular renewal (in the case of the EU) and
4 The most controversial episode related to operations to rescue the large state-owned corporations cut off from
international financial markets by sanctions in the last quarter of 2014.
5 The key roles were played by German Chancellor Angela Merkel and French President Francois Hollande.
5.55.5
5.2
5.65.5
5.2
5.5
4.9
5.0
5.1
5.2
5.3
5.4
5.5
5.6
2012 2013 2014 2015 2016 2017 2018 (f)
Macroeconomic stability in Russia remains fragile and vulnerable to various economic and political shocks, despite quite solidfiscal fundamentals and the CBRF’s large international reserves.

9 Policy Contribution | Issue n˚4 | February 2019
updates (concerning the list of sanctioned individuals and companies).
The US and EU sanctions have a multipronged character6, involving four groups of meas-
ures (Russell, 2016): political/diplomatic (Tier 1), sanctions against individuals and entities
(Tier 2), economic sanctions (Tier 3) and those related to Crimea.
The Tier 1 sanctions involve, non-exhaustively, exclusion of Russia from the G8, suspen-
sion of negotiations on Russia’s accession to the Organisation for Economic Cooperation and
Development and the International Energy Agency, suspension of the semi-annual EU-Russia
summits, suspension of negotiations on a new EU-Russia treaty and EU-Russia visa liberal-
isation, suspension of NATO-Russia cooperation, and suspension of the voting rights of the
Russian delegation to the Parliamentary Assembly of the Council of Europe.
The Tier 2 sanctions are targeted against named individuals and companies, for example,
those engaged in doing business in Crimea. Measures include visa bans and asset freezes.
Some of the affected companies have been supported by Russian public money to compen-
sate for sanction-related losses.
In the economic sphere (Tier 3), sanctions have concentrated on three areas:
• A ban on medium- and long-term financing of the largest state-owned banks and companies;
• A ban on trade in military and dual-use equipment, and in some oil exploration and pro-
duction equipment and services;
• A ban on trade, including tourism, travel and communication services, with the annexed
Crimea, prohibition on the use of Crimean ports and involvement in investment activity
in this territory.
In April 2018, the US adopted CAATSA, which partly codified the existing sanctions
but also introduced new ones against selected Russian business people and companies, in
response to Russia’s alleged interference in the US 2016 presidential election. Another wave
of US sanctions followed in August 2018, this time in response to the attempted assassina-
tion in the United Kingdom of a former Russian intelligence officer.
In August 2014, the Government of the Russian Federation responded to the sanctions
with a ban on imports of most food products from countries that adopted sanctions against
Russia. Since 2014, Russia has also started to introduce a series of economic sanctions
against Ukraine, the most significant being the revoking of the bilateral free trade agree-
ment (FTA) on 1 January 2016 (in response to the entry into force of the EU-Ukraine FTA).
Between November 2015 and June 2016, Russia also adopted a ban on food imports from
Turkey and several other economic sanctions against this country in response to the down-
ing of a Russian fighter jet by the Turkish air force in the Syria-Turkey border area.
Russia has also extended restrictions on non-resident ownership in some sectors, for
example, the media.
Assessing the impact on the Russian economy of these sanctions and countersanctions
is not an easy task because of the difficulty of disentangling the effects of sanctions and
countersanctions from other factors, such as the collapse of the oil price and other com-
modity prices in mid-2014 (see Korhonen et al, 2018). Furthermore, most of the quantita-
tive assessments were done during the early stage of sanctions implementation (2014-16)
and are based on ex-ante forecasting rather ex-post analysis. Nevertheless, the approximate
extent of the damage done to Russia’s potential growth by sanctions can be given.
Most available estimates found an annual negative impact ranging from 1 percent to 2
percent of GDP. For example, econometric analysis by Kholodilin and Netsunajev (2016)
estimated a direct negative impact of sanctions and countersanctions between mid-2014
and the third quarter of 2015. According to their estimate, annualised quarterly growth of
6 See https://www.state.gov/e/eb/tfs/spi/ukrainerussia/ for the list and content of US sanctions and https://europa.eu/newsroom/highlights/special-coverage/eu-sanctions-against-russia-over-ukraine-crisis_en for the list and content of EU
sanctions.

10 Policy Contribution | Issue n˚4 | February 2019
real GDP was, on average, lower by 1.98 percentage points compared to the counterfactual
scenario (without sanctions). The impact on the euro area’s quarterly growth rate was also
negative but marginal (in the range of 0.02 percentage points).
Dreger et al (2016) in their econometric analysis assessed the impact of sanctions and
oil prices on RUR depreciation in 2014-2015 and found that the second factor played a
decisive role.
IMF (2015, p.5) estimated the initial negative impact of sanctions at between 1 percent and
1.5 percent of Russian GDP, with a long-term cumulative effect of up to 9 percent of GDP.
Gurvich and Prilepskiy (2015) estimated the cumulative loss of Russian GDP arising
from Western financial sanctions at 6 percent of GDP for the period 2014-17. A similar
result (cumulative 6 percent) for the period 2014-18 was obtained by Bloomberg Economics
(Doff, 2018).
World Bank (2016, p. 40) estimated that removing sanctions would increase forecast
GDP growth in 2017 by 0.9 percentage points (from 1.1 percent to 2 percent) because of the
boost to investment and consumer confidence. However, in subsequent years the forecast
growth rate would remain unchanged because of other factors, unrelated to sanctions,
limiting Russia’s growth potential.
Regarding the Russian countersanctions, Volchkova et al (2018) estimated that they
are responsible for average annual loss of 2,000 RUR (about $30) per Russian consumer, or
0.00036 percent of Russian GDP per capita in 2014. Russian producers captured 63 percent
of this amount and non-sanctioned exporters, in particular from Belarus took 26 percent.
The remaining 10 percent constituted a deadweight loss.
None of the available studies measured the potential impact of the 2018 US CAATSA sanctions.
Overall, sanctions and countersanctions aggravated the 2014-16 currency crisis and the
2015-16 recession. In 2014-15, financial sanctions were particularly painful. By suddenly
closing off the international financial market to large state-controlled companies such as
Rosneft, Novatek and Gazprom, the sanctions forced the Russian authorities, including the
CBRF, to rescue them, causing additional diminution of the CBRF’s international reserves
and depletion of the National Wealth Fund assets. Financial sanctions also triggered large-
scale capital outflows from Russia in 2014-15 (Figure 16) and, therefore, added to market
panics and the collapse of the RUR exchange rate in December 2014 and early 2015.
In the longer term, financial and sectoral sanctions limit Russia’s growth potential by
discouraging investment, both domestic and foreign. The negative effects apply not only to
directly-sanctioned sectors such the defence and oil industries. Indirectly, sanctions, coun-
tersanctions and deteriorating economic and political relationships with the US and EU
negatively affect the entire framework of economic and research cooperation with the west,
increase the role of military and security agencies, and limit civil liberties. On the economic
front, sanctions and countersanctions strengthen protectionism and economic national-
ism7. All these phenomena contribute to the deterioration of the already poor business and
investment climate in Russia (see section 6).
As well as sanctions, the Ukrainian conflict has involved other direct and indirect costs
for Russia, such as higher military spending (Table 1), human losses, the social costs of ref-
ugee flows, aid of various kinds to rebel-controlled territories and so on. In addition, there
have been the substantial costs of the integration of Crimea into the Russian economy. The
costliest investment project was the construction of the Crimea Bridge over the Strait of
Kerch, between the Kerch Peninsula (part of the Crimean Peninsula) and Taman Peninsula
in the Krasnodarsky krai (part of the Russian mainland), which was opened in May 2018. Its
length is over 18 kilometres and the total construction cost was in the region of $4 billion.
Aslund (2018) estimated the cost to the Russian federal government of administrating
7 Korhonen et al (2018) argue that the ban on food imports from the EU, US and other countries introduced by
Russia in August 2014 as a countersanction measure was, in fact, implementation of much earlier demands from
an agriculture lobby for stronger protection against imports, justified on the grounds of the country’s food security.
11 Policy Contribution | Issue n˚4 | February 2019
Crimea and providing support to occupied Donbas at $4 billion or 0.3 percent of Russia’s
GDP, not including the construction costs of the Crimea Bridge.
Military spending is the only component for which internationally comparative statistics
exist. Russia’s military expenditure is higher than that of other European countries (Table
1), oscillating between 3.3 percent and 4.1 percent of GDP in 2000s and early 2010s. Military
spending has increased since beginning of the Ukrainian conflict, reaching a record-high
level of 5.5 percent of GDP in 2016. High military spending crowds out expenditure on other
public services, in particular education and health care (Table 1), negatively contributing to
potential economic growth, an argument frequently raised in the Russian economic debate
(see for example Kudrin and Sokolov, 2017; Kudrin and Knobel, 2018).
Table 1: Russia: government military, education and health expenditure, percent of GDP, 2000-17
Expenditure item 2000 2004 2008 2009 2012 2014 2015 2016 2017
Military expenditure 3.6 3.5 3.3 4.1 3.8 4.1 4.9 5.5 4.3
Government expenditure on education
2.9 3.5 4.1 .. 3.8 .. .. .. ..
GG health expenditure
3.2 3.0 3.2 3.7 3.4 3.5 3.4 .. ..
Source: World Bank World Development Indicators.
5 Structural challengesThe Russian economy remains dependent on oil and natural gas production and exports. Al-
though in 2013 (that is, before the collapse of oil and gas prices), the share of the hydrocarbon
sector in Russian GDP amounted to less than 20 percent, and both oil and natural gas rents
were lower than in several other oil- and gas-producing countries (Figures 10 and 11), the
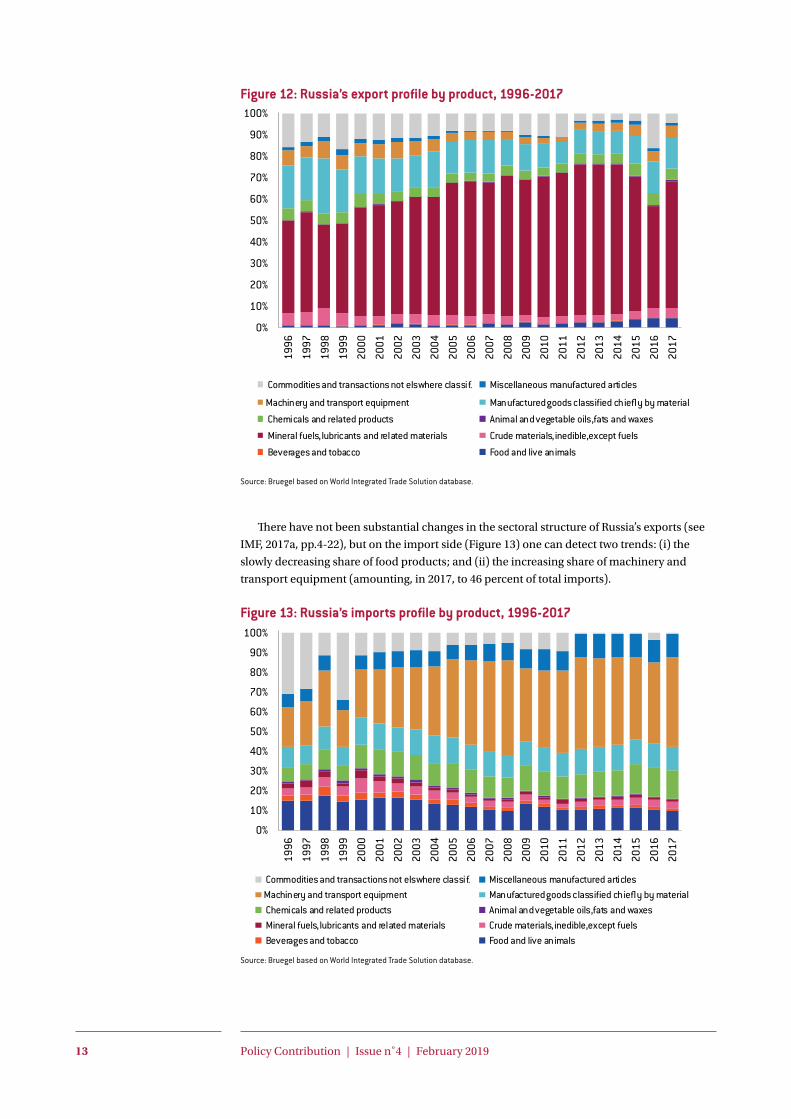
industries together made up more than 70 percent of Russian exports (Figure 12). They also
provided 40-45 percent of federal budget revenue.
Figure 10: Oil rent as percentage of GDP, 2010-16
0.05.0
10.015.020.025.030.035.040.045.050.055.060.065.0
2010 2011 2012 2013 2014 2015 2016
Algeria Angola AzerbaijanKazakhstan Kuwait NigeriaRussia Saudi Arabia UAE
Source: Bruegel based on World Bank World Development Indicators.

12 Policy Contribution | Issue n˚4 | February 2019
Obviously, the period of low oil and gas prices (2014-15) brought these shares down, but
since mid-2016, when oil prices started to recover, they have increased again. Furthermore,
the drop in oil and gas prices was partly compensated for by an increase in their production
and in exports, except for 2017 (GIEP, 2018, p. 247) when Russia joined the countries of the
Organisation of Petroleum Exporting Countries in their effort to limit the oil supply to the
global market. Thus, if oil and natural gas prices further recover, the role of hydrocarbon
exports and revenue in Russia will become even more important than before crisis.
Excessive reliance on hydrocarbon production and exports could create a serious eco-
nomic challenge in the long-term if the development of low-carbon energy sources results in
a smaller global demand for oil.
Figure 11: Natural gas rent as percentage of GDP, 2010-16
Source: Bruegel based on World Bank World Development Indicators.
For this and other reasons, the Russian economy requires structural diversification away
from the hydrocarbon dominance. Most economists inside and outside of Russia accept this.
However, in an economy that enjoys unquestionable comparative advantage in production of
mineral resources, including hydrocarbons, policies aimed at structural diversification are not
easy to conceptualise and implement. The first, macroeconomic obstacle comes from the real
exchange rate of the national currency, which appreciates in periods of high hydrocarbon/
commodity prices – the so-called Dutch disease. Since the early 2000s, the Russian authori-
ties have tried to neutralise partly this effect through cumulating oil-related fiscal surpluses
in sovereign wealth funds. A new budgetary rule introduced in 2017, based on an assumed
oil price of $40 per barrel and capping government expenditure (GIEP, 2018, p. 63), might be
helpful in both sterilising the Dutch disease effect and creating more room for countercyclical
fiscal policy.
In principle, deep depreciation of the RUR in 2014-15 should have created room for the
expansion of domestic manufacturing industries and other non-oil-dependent activities.
Unfortunately, there is little evidence of this happening. Between 2014 and 2017, agriculture,
food processing, textiles, cellulose and paper production, the chemical and pharmaceutical
industries and a few others recorded continuous output growth despite the overall recession
(GIEP, 2018, pp.173-175). However, the entire manufacturing sector was in recession, mean-
ing other industries recorded output losses. The share of what the Russian statistics classifies
as ‘high-technology and science-intensive’ sectors in GDP remains unchanged, in the range
of 21-22 percent since 20138.
8 https://fedstat.ru/indicator/43526.
-9.0
-6.0
-3.0
0.0
3.0
6.0
9.0
12.0
15.0
2007 2008 2009 2010 2011 2012 2013 2014 2015 2016 2017
Argentina Brazil ChinaIndia Indonesia MexicoRussia South Africa Turkey
13 Policy Contribution | Issue n˚4 | February 2019
Figure 12: Russia’s export profile by product, 1996-2017
Source: Bruegel based on World Integrated Trade Solution database.
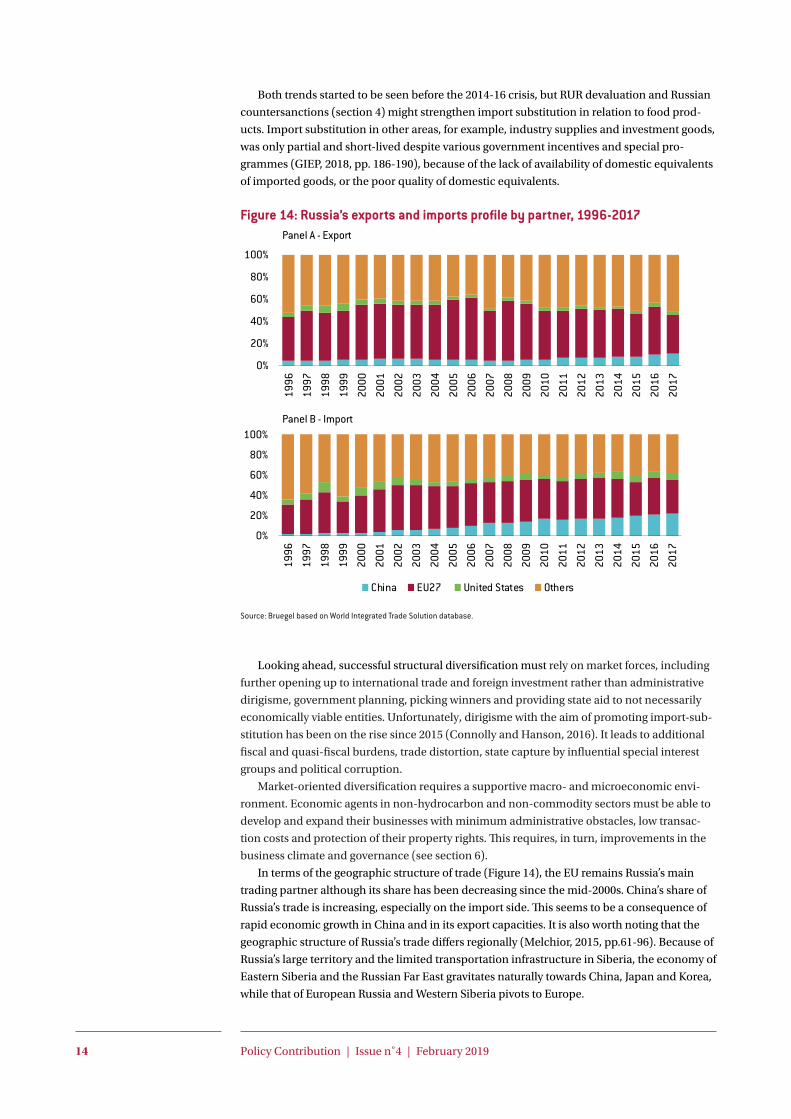
There have not been substantial changes in the sectoral structure of Russia’s exports (see
IMF, 2017a, pp.4-22), but on the import side (Figure 13) one can detect two trends: (i) the
slowly decreasing share of food products; and (ii) the increasing share of machinery and
transport equipment (amounting, in 2017, to 46 percent of total imports).
Figure 13: Russia’s imports profile by product, 1996-2017
Source: Bruegel based on World Integrated Trade Solution database.
0%
10%
20%
30%
40%
50%
60%
70%
80%
90%
100%
1996
1997
1998
1999
2000
2001
2002
2003
2004
2005
2006
2007
2008
2009
2010
2011
2012
2013
2014
2015
2016
2017
Commodities and transactions not elswhere classif. Miscellaneous manufactured articles
Machinery and transport equipment Manufactured goods classified chiefly by material
Chemicals and related products Animal and vegetable oils,fats and waxes
Mineral fuels,lubricants and related materials Crude materials,inedible,except fuels
Beverages and tobacco Food and live animals
0%
10%
20%
30%
40%
50%
60%
70%
80%
90%
100%
1996
1997
1998
1999
2000
2001
2002
2003
2004
2005
2006
2007
2008
2009
2010
2011
2012
2013
2014
2015
2016
2017
Commodities and transactions not elswhere classif. Miscellaneous manufactured articlesMachinery and transport equipment Manufactured goods classified chiefly by material Chemicals and related products Animal and vegetable oils,fats and waxes Mineral fuels,lubricants and related materials Crude materials,inedible,except fuels Beverages and tobacco Food and live animals
14 Policy Contribution | Issue n˚4 | February 2019
Both trends started to be seen before the 2014-16 crisis, but RUR devaluation and Russian
countersanctions (section 4) might strengthen import substitution in relation to food prod-
ucts. Import substitution in other areas, for example, industry supplies and investment goods,
was only partial and short-lived despite various government incentives and special pro-
grammes (GIEP, 2018, pp. 186-190), because of the lack of availability of domestic equivalents
of imported goods, or the poor quality of domestic equivalents.
Figure 14: Russia’s exports and imports profile by partner, 1996-2017
Source: Bruegel based on World Integrated Trade Solution database.
Looking ahead, successful structural diversification must rely on market forces, including
further opening up to international trade and foreign investment rather than administrative
dirigisme, government planning, picking winners and providing state aid to not necessarily
economically viable entities. Unfortunately, dirigisme with the aim of promoting import-sub-
stitution has been on the rise since 2015 (Connolly and Hanson, 2016). It leads to additional
fiscal and quasi-fiscal burdens, trade distortion, state capture by influential special interest
groups and political corruption.
Market-oriented diversification requires a supportive macro- and microeconomic envi-
ronment. Economic agents in non-hydrocarbon and non-commodity sectors must be able to
develop and expand their businesses with minimum administrative obstacles, low transac-
tion costs and protection of their property rights. This requires, in turn, improvements in the
business climate and governance (see section 6).
In terms of the geographic structure of trade (Figure 14), the EU remains Russia’s main
trading partner although its share has been decreasing since the mid-2000s. China’s share of
Russia’s trade is increasing, especially on the import side. This seems to be a consequence of
rapid economic growth in China and in its export capacities. It is also worth noting that the
geographic structure of Russia’s trade differs regionally (Melchior, 2015, pp.61-96). Because of
Russia’s large territory and the limited transportation infrastructure in Siberia, the economy of
Eastern Siberia and the Russian Far East gravitates naturally towards China, Japan and Korea,
while that of European Russia and Western Siberia pivots to Europe.
0%
20%
40%
60%
80%
100%
1996
1997
1998
1999
2000
2001
2002
2003
2004
2005
2006
2007
2008
2009
2010
2011
2012
2013
2014
2015
2016
2017
Panel B - Import
0%
20%
40%
60%
80%
100%
1996
1997
1998
1999
2000
2001
2002
2003
2004
2005
2006
2007
2008
2009
2010
2011
2012
2013
2014
2015
2016
2017
China EU27 United States Others
Panel A - Export

15 Policy Contribution | Issue n˚4 | February 2019
6 The unfavourable business and investment climate
Global surveys dealing with various aspects of the business and investment climate provide a
contradictory picture of the Russian economy. The World Bank Doing Business (WBDB) 2019
survey, which deals with administrative aspects of business activity in 191 countries, gives
Russia a high 31st place in its ranking and score of 77.37 on the scale from 0 to 100. Further-
more, Russia’s score and position in the ranking have systematically improved, at least since
20139. Disaggregated scores (Table 2) inform us that Russia performs best in ‘Getting electrici-
ty’ (94.00), ‘Starting a business’ (93.04) and ‘Registering property’ (88.74), while scoring worst
on ‘Protecting minority investors’ (61.67) and ‘Resolving insolvency’ (58.61).
Table 2: Russia: WBDB 2019 ranks and scoresCategory Rank Score
Starting a business 32 93.04
Dealing with construction permits 48 74.61
Getting electricity 12 94.00
Registering property 12 88.74
Getting credit 22 80.00
Protecting minority investor 57 61.67
Paying taxes 53 79.77
Trading across borders 99 71.06
Enforcing contracts 18 72.18
Resolving insolvency 55 58.61
Overall 31 77.37
Source: http://www.doingbusiness.org/en/data/exploreeconomies/russia.
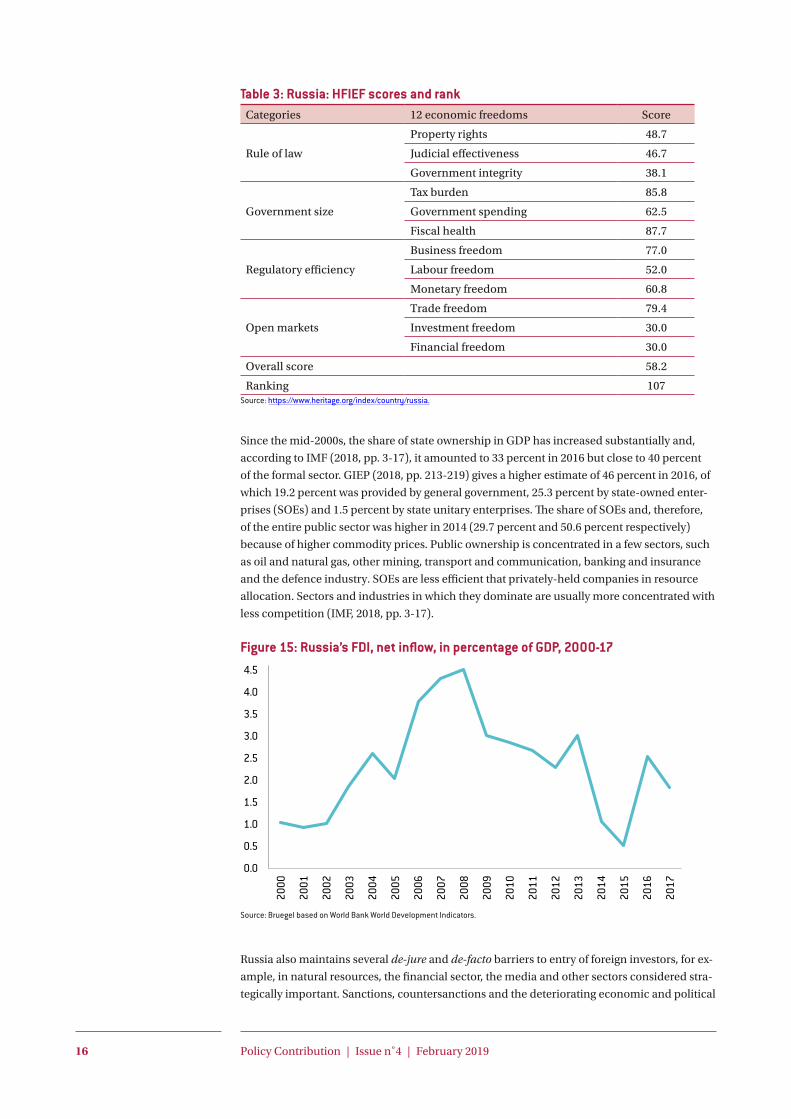
Two other global surveys – the Heritage Foundation Index of Economic Freedom (HFIEF)
and Transparency International Corruption Perception Index (TICPI) – offer less optimistic
pictures. In the 2018 HFIEF, Russia was ranked 107 out of 180 countries analysed, with a score
of 58.2 (on a scale from 0 to 100), the best result since 200510. However, this was not enough for
Russia to escape the category of ‘mostly unfree’ countries. HFIEF scored Russia best on ‘Fiscal
health’ (87.7), ‘Tax burden’ (85.8) and ‘Trade freedom’ (79.4), and worst on ‘Investment free-
dom’ (30.0), ‘Financial freedom’ (30.0) and ‘Government integrity’ (38.1) (Table 3).
Finally, according to the TICPI 2017 survey, Russia ranks 135 out of 183 countries, with a score
of 29, the same as the Dominican Republic, Honduras, Kyrgyzstan, Laos, Mexico, Papua New
Guinea and Paraguay. The ranking scores countries from 0 (most corrupt) to 100 (free from
corruption). Russia’s score has practically not changed over the last couple of years.
Overall, the main factors behind Russia’s poor investment climate seem to be insecure prop-
erty rights, including politically motivated expropriations (examples include Yukos in 2003-06
and Bashneft in 2014-17), weak rule of law and the parasitic attitude towards business of a
substantial part of the public administration, in particular law-enforcement agencies (known
by the Russian business community as ‘state racketeering’). These factors are not always fully
taken into account by the above-mentioned surveys, in particular, the WBDB.
9 However, the methodology of the WBDB survey has changed several times, limiting the comparability of WBDB
scores and ranking from different years.
10 Major improvement was recorded in the 2017 survey with substantial upgrade in categories ‘Property rights’ and
‘Government integrity’.
16 Policy Contribution | Issue n˚4 | February 2019
Table 3: Russia: HFIEF scores and rankCategories 12 economic freedoms Score
Rule of law
Property rights 48.7
Judicial effectiveness 46.7
Government integrity 38.1
Government size
Tax burden 85.8
Government spending 62.5
Fiscal health 87.7
Regulatory efficiency
Business freedom 77.0
Labour freedom 52.0
Monetary freedom 60.8
Open markets
Trade freedom 79.4
Investment freedom 30.0
Financial freedom 30.0
Overall score 58.2
Ranking 107Source: https://www.heritage.org/index/country/russia.
Since the mid-2000s, the share of state ownership in GDP has increased substantially and,
according to IMF (2018, pp. 3-17), it amounted to 33 percent in 2016 but close to 40 percent
of the formal sector. GIEP (2018, pp. 213-219) gives a higher estimate of 46 percent in 2016, of
which 19.2 percent was provided by general government, 25.3 percent by state-owned enter-
prises (SOEs) and 1.5 percent by state unitary enterprises. The share of SOEs and, therefore,
of the entire public sector was higher in 2014 (29.7 percent and 50.6 percent respectively)
because of higher commodity prices. Public ownership is concentrated in a few sectors, such
as oil and natural gas, other mining, transport and communication, banking and insurance
and the defence industry. SOEs are less efficient that privately-held companies in resource
allocation. Sectors and industries in which they dominate are usually more concentrated with
less competition (IMF, 2018, pp. 3-17).
Figure 15: Russia’s FDI, net inflow, in percentage of GDP, 2000-17
Source: Bruegel based on World Bank World Development Indicators.
Russia also maintains several de-jure and de-facto barriers to entry of foreign investors, for ex-
ample, in natural resources, the financial sector, the media and other sectors considered stra-
tegically important. Sanctions, countersanctions and the deteriorating economic and political
0.0
0.5
1.0
1.5
2.0
2.5
3.0
3.5
4.0
4.5
2000
2001
2002
2003
2004
2005
2006
2007
2008
2009
2010
2011
2012
2013
2014
2015
2016
2017
17 Policy Contribution | Issue n˚4 | February 2019
relationships with the US and the EU only added to this list. These fundamental shortcomings
in the business environment cannot be compensated for by prudent macroeconomic policies,
low and relatively simple taxation or several reform measures aimed at simplification in areas
including business registration, property registration and court procedures.
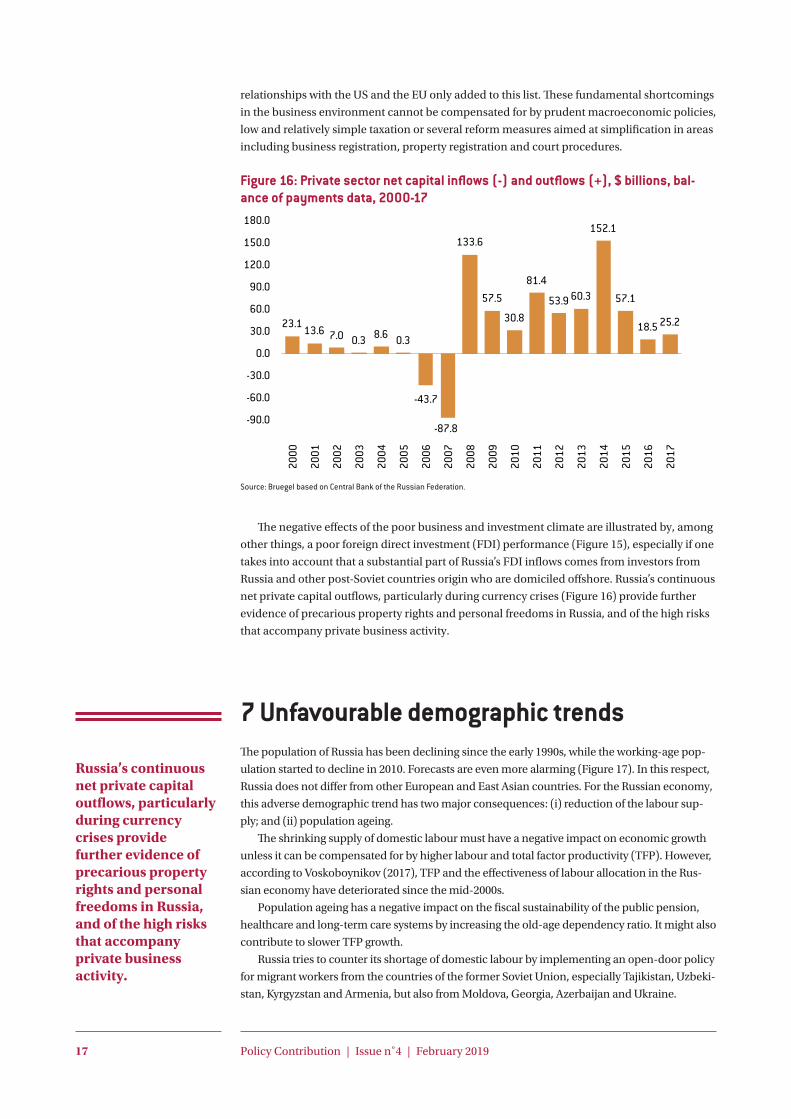
Figure 16: Private sector net capital inflows (-) and outflows (+), $ billions, bal-ance of payments data, 2000-17
23.1 13.6 7.0 0.3 8.6 0.3
-43.7
-87.8
133.6
57.5
30.8
81.4
53.9 60.3
152.1
57.1
18.5 25.2
-90.0
-60.0
-30.0
0.0
30.0
60.0
90.0
120.0
150.0
180.0
2000
2001
2002
2003
2004
2005
2006
2007
2008
2009
2010
2011
2012
2013
2014
2015
2016
2017
Source: Bruegel based on Central Bank of the Russian Federation.
The negative effects of the poor business and investment climate are illustrated by, among
other things, a poor foreign direct investment (FDI) performance (Figure 15), especially if one
takes into account that a substantial part of Russia’s FDI inflows comes from investors from
Russia and other post-Soviet countries origin who are domiciled offshore. Russia’s continuous
net private capital outflows, particularly during currency crises (Figure 16) provide further
evidence of precarious property rights and personal freedoms in Russia, and of the high risks
that accompany private business activity.
7 Unfavourable demographic trendsThe population of Russia has been declining since the early 1990s, while the working-age pop-
ulation started to decline in 2010. Forecasts are even more alarming (Figure 17). In this respect,
Russia does not differ from other European and East Asian countries. For the Russian economy,
this adverse demographic trend has two major consequences: (i) reduction of the labour sup-
ply; and (ii) population ageing.
The shrinking supply of domestic labour must have a negative impact on economic growth
unless it can be compensated for by higher labour and total factor productivity (TFP). However,
according to Voskoboynikov (2017), TFP and the effectiveness of labour allocation in the Rus-
sian economy have deteriorated since the mid-2000s.
Population ageing has a negative impact on the fiscal sustainability of the public pension,
healthcare and long-term care systems by increasing the old-age dependency ratio. It might also
contribute to slower TFP growth.
Russia tries to counter its shortage of domestic labour by implementing an open-door policy
for migrant workers from the countries of the former Soviet Union, especially Tajikistan, Uzbeki-
stan, Kyrgyzstan and Armenia, but also from Moldova, Georgia, Azerbaijan and Ukraine.
Russia’s continuous net private capital outflows, particularly during currency crises provide further evidence of precarious property rights and personal freedoms in Russia, and of the high risks that accompany private business activity.

18 Policy Contribution | Issue n˚4 | February 2019
In September and October 2018, the Federal Assembly adopted a law on pension reform,
under which the retirement age for women was increased from 55 to 60, and for men from 60
to 65. The reform will be implemented over a 10-year period, during which, in each calendar
year, the retirement age will by increased by half a year. This should help improve the financial
balance of the public pension system and will partly mitigate the decreasing supply of labour.
Figure 17: Population of Russia aged 15-64, thousands, 1960-2100
Source: Bruegel based on https://data.worldbank.org/indicator/SP.POP.1564.TO.ZS?locations=RU&view=chart (historical data); https://population.un.org/wpp/Download/Standard/Population/ (projection).
Opening the Russian labour market to migrants from other former Soviet Union coun-
tries and pension reform can both help to reduce the expected labour shortage but are
insufficient to compensate entirely for negative demographic trends. This means Russia
will be unable to return to the rate of growth recorded in the early and mid-2000s when
its demographic situation looked better (the working-age population continued to grow
albeit at slow pace) and there were available labour resources freed by the transition related
restructuring in the 1990s.
Instead, Russia’s economic policy should focus on faster per-capita growth, which would
allow continuation of income convergence with advanced economies, which stopped after
the 2008-09 global financial crisis. This requires increase in TFP, which in turn depends on
progress in structural diversification towards high-tech industries, an upgrade to Russia’s
human capital, improvement in the business and investment climate and closer coopera-
tion with the leading advanced economies including the US and the EU.
8 The way aheadGiven the adverse demographic trends facing Russia, boosting TFP is the only way to increase
potential growth and return to gradual GDP-per-capita convergence with high-income coun-
tries. However, this requires far-reaching institutional and structural reforms that, in turn,
depend on political reform. The IMF (2017b) recommends five areas in which such reforms
can be implemented:
• Improving the investment climate, including strengthening property rights and contract
enforcement, reduction of burdensome business operating and licensing standards,
which discourage foreign investors;
• Investing in infrastructure to improve connectivity, reducing transportation costs and
ensuring better access to domestic and foreign markets;
0
20,000
40,000
60,000
80,000
100,000
120,000
1960
1970
1980
1990
2000
2010
2020
2030
2040
2050
2060
2070
2080
2090
2100
Historical Projected
Given the adverse demographic trends facing Russia, boosting TFP is the only way to increase potential growth and return to gradual GDP-per-capita convergence with high-income countries. However, this requires far-reaching institutional and structural reforms that, in turn, depend on political reform.
19 Policy Contribution | Issue n˚4 | February 2019
• Creating a more efficient goods market, among others, by simplifying customs proce-
dures;
• Strengthening trade relationships beyond Russia’s immediate neighbours;
• Supporting innovation by allocating more resources to research and development.
In our opinion, several other measures should be added to this list.
First, Russia needs a new privatisation programme based on transparent procedures.
It should be open to both domestic and foreign investors on equal terms. This would allow
reduction of what the IMF (2018) calls “the state’s footprint in the economy”, more efficient
use of available resources and their higher productivity, an increase in domestic competi-
tion, a reduction in the involvement of SOEs in performing non-economic functions (such as
non-transparent financing of various political activities) and in political corruption, bringing
in of more FDI (not only FDI of offshore origin) and the inclusion of Russian companies in
global value chains. In parallel to privatisation, some sectors need de-monopolisation and
internal restructuring. For example, natural gas production could be unbundled from trans-
mission networks and retail distribution, similarly to what was done in the Russian electricity
sector in 2006-08.
Second, improving the business and investment climate requires far-reaching institutional
and political reforms. For example, strengthening property rights and contract enforcement
will be impossible without genuine independence of the judiciary. Fighting corruption and
business extortion will be impossible without democratic oversight of public administration,
law enforcement and public security agencies, and without media freedom.
Third, deeper integration of Russia in the global economy must go beyond the strength-
ening of trade relationships in their narrow sense (although this is also important). It requires
far-reaching economic and technological partnerships and cooperation with leading
advanced economies, including the EU and the US. Furthermore, the future economic devel-
opment of Russia will depend, to a great degree, on global economic growth and the stability
of international commodity and financial markets. In other words, Russia should be an active
player in defending the global liberal economic order and in strengthening it through relevant
reforms.
Fourth, closer economic and political cooperation with the EU and the US and conflict
resolution in its neighbourhood would allow Russia to shift part of its budget resources that
are currently targeted at military and security spending to infrastructure, education, research
and public health programmes.
Fifth, political reforms and better guarantees of civil liberties can help increase economic
freedom, innovation and business initiative.
Overall, given Russia’s increasing labour-supply constraints, the development of innova-
tive business activity and high-value added manufacturing and services is the only realistic
long-term strategy that would enable an upper-middle-income economy such as Russia to
diversify away from the hydrocarbon monoculture.
20 Policy Contribution | Issue n˚4 | February 2019
ReferencesAslund, A. (2018) ‘The Toll of Putin’s Wars’, Project Syndicate, 3 September, available at https://www.project-syndicate.
org/commentary/cost-of-wars-for-russia-by-anders-aslund-2018-09
Connolly, R. and P. Hanson (2016) ‘Import Substitution and Economic Sovereignty in Russia’, Research Paper, Russia and Eurasia Programme, Chatham House, available at https://www.chathamhouse.org/sites/default/files/publications/research/2016-06-09-import-substitution-russia-connolly-hanson.pdf
Dabrowski, M. (2015) ‘The systemic roots of Russia’s recession’, Policy Contribution, Issue 2015/15, Bruegel, available at http://bruegel.org/wp-content/uploads/2015/10/pc_2015_15.pdf
Dabrowski, M. (2016) ‘Currency crises in post-Soviet economies — a never ending story?’ Russian Journal of Economics 2(3): 302-326, available at http://dx.doi.org/10.1016/j.ruje.2016.08.002
Dabrowski, M. (2018) ‘Is this time different? Reflections on recent emerging-market turbulence’, Bruegel Blog, 14 November, available at http://bruegel.org/2018/11/is-this-time-different-reflections-on-recent-emerging-market-turbulence/
Doff, N. (2018) ‘Here’s One Measure That Shows Sanctions on Russia are Working’, Bloomberg, 16 November, available at https://www.bloomberg.com/news/articles/2018-11-16/here-s-one-measure-that-shows-sanctions-on-russia-are-working
Dreger, C., K.A. Kholodilin, D. Ulbricht and J. Fidrmuc (2016) ‘Between the hammer and the anvil: The impact of economic sanctions and oil prices on Russia’s ruble’, Journal of Comparative Economics 44(2): 295-308
GIEP (2018) Russian Economy in 2017. Trends and Outlooks, Gaidar Institute for Economic Policy, Moscow, available at https://www.iep.ru/files/text/trends/2017-eng/Book.pdf
Gurvich, E. and I. Prilepskiy (2015) ‘The impact of financial sanctions on the Russian economy’, Russian Journal of Economics 1(4): 359-385, available at https://rujec.org/article/27956/
Gurvich, E. and E. Vakulenko (2017) ‘Macroeconomic and structural properties of the Russian labor market: A cross-country comparison’, Russian Journal of Economics 3(4): 411-424, available at https://rujec.org/article/28001/download/pdf/
IMF (2015) ‘Russian Federation: Staff Report for the 2015 Article IV Consultation’, IMF Country Report, No. 15/211, Washington DC: International Monetary Fund, available at https://www.imf.org/~/media/Websites/IMF/imported-full-text-pdf/external/pubs/ft/scr/2015/_cr15211.ashx
IMF (2017a) ‘Russian Federation. Selected Issues’, IMF Country Report, No. 17/198, Washington DC: International Monetary Fund, available at https://www.imf.org/~/media/Files/Publications/CR/2017/cr17198.ashx
IMF (2017b) ‘Russia: Five Reforms to Increase Productivity, Diversify Growth’, IMF News, 10 July, available at https://www.imf.org/en/News/Articles/2017/07/05/na070717-russia-five-reforms-to-increase-productivity-diversify-growth
Kholodilin, K.A. and A. Netsunajev (2016) ‘Crimea and Punishment: The Impact of Sanctions on Russian and European Economies’, DIW Berlin Discussion Papers No. 1569, German Institute for Economic Research, available at http://www.diw.de/documents/publikationen/73/diw_01.c.530645.de/dp1569.pdf
Korhonen, I., H. Simola and L. Solanko (2018) ‘Sanctions and countersanctions – effects on economy, trade and finance’, Focus on European Economic Integration, Q3 2018, pp.68-76, Oesterreichische Nationalbank, available at https://www.oenb.at/dam/jcr:d45f7129-94eb-48f4-b4d7-e715d88c224a/06_Sanctions_and_countersanctions_feei_2018_q3.pdf
Kudrin, A. and A. Knobel (2018) ‘Russian budget structure efficiency: Empirical study’, Russian Journal of Economics 4(3): 197-214, available at https://rujec.org/article/30163/download/pdf/
Kudrin, A. and I. Sokolov (2017) ‘Fiscal maneuver and restructuring of the Russian economy’, Russian Journal of Economics 3(3): 221–239, available at https://rujec.org/article/27990/download/pdf/
Melchior, A. (2015) ‘Post-Soviet Trade, Russia’s Far East and the Shift to Asia’, in J. Huang, J. and A. Korolev (eds): International Cooperation in the Development of Russia’s Far East and Siberia, Palgrave Macmillan UK
Russell, M. (2016) ‘Sanctions over Ukraine: Impact on Russia’, Members’ Research Service, European Parliamentary Research Service, PE 579.084, available at http://www.europarl.europa.eu/RegData/etudes/BRIE/2016/579084/EPRS_BRI(2016)579084_EN.pdf
Vishnevsky, A. and E. Scherbakova (2018) ‘A new stage of demographic change: A warning for economists’, Russian Journal of Economics 4(3): 229-248, available at https://rujec.org/article/30166/download/pdf/
Volchkova, N., P. Kuznetsova and N. Turdyeva (2018) ‘Losers and Winners of Russian Countersanctions: A welfare analysis’, Free Network Policy Brief Series, October, available at https://freepolicybriefs.org/2018/10/01/losers-and-winners-of-russian-countersanctions-a-welfare-analysis/
Voskoboynikov, I.B. (2017) ‘Sources of long run economic growth in Russia before and after the global financial crisis’, Russian Journal of Economics 3(4): 348-365, available at https://www.sciencedirect.com/science/article/pii/S2405473917300582/pdfft?md5=657aa277289e848751877d77d938f2a0&pid=1-s2.0-S2405473917300582-main.pdf
World Bank (2016) Russia Economic Report: The Long Journey to Recovery, No. 35, April, Washington, DC: The World Bank Group, available at http://documents.worldbank.org/curated/en/657991467989516696/pdf/104825-NWP-P156290-PUBLIC-WB-RER-No-35-FINAL-ENG.pdf