Russ College of Engineering and Technology Human Factors ... · EVALUATION OF GROUND MOUNTED...
82
EVALUATION OF GROUND MOUNTED DIAGRAMMATIC ENTRANCE RAMP APPROACH SIGNS Russ College of Engineering and Technology Human Factors and Ergonomics Laboratory Ohio Research Institute for Transportation and the Environment Final Report October 2000
Transcript of Russ College of Engineering and Technology Human Factors ... · EVALUATION OF GROUND MOUNTED...
EVALUATION OF GROUND MOUNTED DIAGRAMMATIC ENTRANCE RAMP APPROACH SIGNS
Russ College of Engineering and Technology
Human Factors and Ergonomics Laboratory Ohio Research Institute for Transportation and the Environment
Final Report October 2000

ii
Report No. FHWA/OH-2000/018
2. Government Accession No. 3. Recipient’s Catalog No.
5. Report Date October, 2000 6. Performing Organization Code
4. Title and Subtitle EVALUATION OF GROUND MOUNTED DIAGRAMMATIC ENTRANCE RAMP APPROACH SIGNS
7. Author(s) Helmut. T. Zwahlen, Thomas Schnell
8. Performing Organization Report No.
10. Work Unit No. (TRAIS)
11. Contact or Grant No. State Job No. 14674(0)
9. Performing Organization Name and Address Human Factors and Ergonomics Laboratory Ohio Research Institute for Transportation and the Environment Ohio University Athens, Ohio 45701-2979
13. Type of Report and Period Covered Final Technical Report
12. Sponsoring Agency Name and Address Ohio Department of Transportation 1980 West Broad Street Columbus, OH 43223
14. Sponsoring Agency Code 14612(0)
15. Supplementary Notes Prepared in cooperation with the Ohio Department of Transportation and the U.S. Department of Transportation, Federal Highway Administration 16. Abstract Highway-freeway interchanges can be a source of confusion to unfamiliar drivers. Typically, freeway entrance ramp information is provided by means of trailblazer assemblies (interstate or highway shield, cardinal direction, and a small white arrow on a blue shield). Trailblazer assemblies are generally located right at the interchange location, giving unfamiliar drivers very little advance notification as to the proper lane choice needed to gain access to the freeway entrance. Advance located ground mounted diagrammatic guide signs provide this much needed information well in advance of the interchange entrance, thus giving drivers more time to change lanes, if needed. Diagrammatic signs have been used in Europe for many years with great success. The present study investigated the effectiveness of ground mounted diagrammatic signs in the context of urban multi-lane arterials leading to a freeway. The diagrammatic sign layout was designed as part of this project in collaboration with ODOT. Six highway-freeway interchanges were selected in the Greater Columbus, Ohio, area to determine the effectiveness of the diagrammatic signs in the field. Traffic flow video footage was collected at the selected sites before the diagrammatic signs were installed. The finalized diagrammatic sign designs were then installed and the traffic flow videotaping was repeated. The collected video footage was automatically analyzed with Mobilizer PC. The resulting vehicle count, speed, and headway data was used as input to a closed form analytical model to determine the probability that drivers could successfully change lanes as needed, prior to reaching the gore of the freeway entrance. The theoretical analysis indicated a much higher probability that an unfamiliar driver could execute a required lane change when diagrammatic signs are used. ODOT/FHWA evaluators visited the six interchange sites and provided their input and opinions as to the use of diagrammatic signs. The vast majority of the evaluators fully embraced the idea of diagrammatic signs. Eye movement recordings were performed at night at the six sites in order to determine if the presence of the diagrammatic signs was distracting. The results of the eye movement analysis indicate that the diagrammatic signs are not looked at excessively often or excessively long. The overall median first look distance to the diagrammatic signs was found to be 125m. An evaluation with unfamiliar test drivers corroborated the findings of the theoretical model analysis, in that drivers were able to execute a needed lane change much earlier when diagrammatic signs were provided. A set of application guidelines for diagrammatic signs is provided. 17. Key Words Diagrammatic guide signs, eye movements, Mobilizer PC, traffic flow, entrance ramps, freeway interchanges
18. Distribution Statement No Restrictions. This document is available to the public through the National Technical Information Service, Springfield, Virginia 22161
19. Security Classif. (of this report) Unclassified
20. Security Classif. (of this page) Unclassified
21. No. of Pages 82
22. Price

iii
ACKNOWLEDGEMENTS A number of research associates, research assistants, graduate and undergraduate students have assisted in performing the research presented in this report. Although it is not possible to adequately recognize and credit the many individuals and all the students who contributed to the research presented in this report, the following individuals are singled out for their major contributions. Mike Keller and Arthur Garrett, ODOT Office of Traffic, for their help in determining the feasibility of using the video vans to record video footage for the Mobilizer PC video analysis system. James Bergandine and field personnel in ODOT District 6, for their assistance in the organization of traffic control, and the installation of two poles on SR 315. Tony Acker of ODOT District 6, for his help in setting up and removing the video cameras. James Roth, ODOT Office of Traffic, for his help in the selection of the test sites, insight and contributions in the design of the diagrammatic entrance ramp approach signs. The ODOT Sign Shop personnel and field crew, for help in the manufacture and field installation of the experimental signs. Frank Nichols, Columbus Division of Police, for his assistance in traffic control. Steve Jewel, Traffic Engineer, City of Columbus, for coordinating the use of traffic signal poles for the set up of the video cameras. James McQuirt and Darren Swingle, Office of Technical Services, for their detailed traffic volume data that was used to initially select candidate test sites. Timothy Wheeler, Ohio Department of Highway Safety, for providing crash data that was used in the initial selection of candidate test sites. Ryan Smith, for his involvement throughout all phases of the project: the selection and documentation of the test sites; the setup and monitoring of the video equipment; conducting the entire eye movement analysis and test driver runs; and finally, his assistance with the ODOT/FHWA evaluator task. Martin Pawlowski, Research Assistant, for his help in setting up the instrumented vehicles and conducting many of the test driver evaluations. Juerg Tschirren, Research Associate, for his help in, mastering the Mobilizer PC software program. Marrut Pimmarat, Graduate Student, for his help in documenting the test sites and for obtaining the traffic videos in the field. Jeff Mohror, for his efforts in programming the Mobilizer PC software; extracting the traffic flow information out of all the video records that were taken in the field; analyzing the eye movement video records; and finally, for his help in writing the final report. Last, but not least, thanks to all subjects, test drivers, and evaluators, whose names we cannot disclose.

iv

v
EVALUATION OF GROUND MOUNTED DIAGRAMMATIC ENTRANCE RAMP APPROACH SIGNS
Prepared in cooperation with the
Ohio Department of Transportation and the U.S. Department of Transportation, Federal Highway Administration
Prepared by
Helmut T. Zwahlen
Human Factors and Ergonomics Laboratory Ohio Research Institute for Transportation and the Environment
Russ College of Engineering and Technology Ohio University
Athens, Ohio 45701-2979
And
Thomas Schnell Operator Performance Laboratory
Department of Industrial Engineering The University of Iowa
Iowa City, Iowa 52242-1527
The contents of this report reflect the views of the authors who are responsible for the facts and the accuracy of the data presented herein. The contents do not necessarily reflect the official views or policies of the Ohio Department of Transportation or the Federal Highway Administration. This report does not constitute a standard, specification or regulation.
Final Report October 2000

vi
TABLE OF CONTENTS 1 INTRODUCTION..............................................................................................................................................1
1.1 STATEMENT OF THE PROBLEM .........................................................................................................................4
2 LITERATURE ...................................................................................................................................................6
3 DETAILED DESCRIPTION OF THE INTERCHANGES STUDIED ......................................................12
3.1 SR 315 SOUTHBOUND INTERCHANGE WITH I 270 ..........................................................................................13 3.2 BRICE ROAD NORTHBOUND WITH I 70...........................................................................................................16 3.3 GEORGESVILLE ROAD WESTBOUND WITH I 270 ............................................................................................19 3.4 ROBERTS ROAD EASTBOUND WITH I 270.......................................................................................................23 3.5 HILLIARD ROME ROAD (SOUTHBOUND) INTERCHANGE WITH I 70.................................................................26 3.6 PLAIN CITY GEORGESVILLE ROAD (SR 142) SOUTHBOUND WITH I 70 ..........................................................29
4 TRAFFIC FLOW VIDEO ANALYSIS .........................................................................................................32
4.1 DATA ANALYSIS.............................................................................................................................................33 4.2 RESULTS ........................................................................................................................................................34
5 ODOT/FHWA EVALUATOR FIELD SURVEY OF THE EXPERIMENTAL GUIDE SIGNING SYSTEMS (AFTER CONDITION).........................................................................................................................46
6 EVALUATION OF THE EXPERIMENTAL GUIDE SIGNING SYSTEMS USING 20 UNFAMILIAR DRIVERS IN AN EXPERIMENTAL INSTRUMENTED VEHICLE.................................................................52
7 EYE SCANNING BEHAVIOR ......................................................................................................................57
7.1 SUBJECTS AND APPARATUS ...........................................................................................................................57 7.2 DATA ACQUISITION AND ANALYSIS...............................................................................................................57 7.3 RESULTS ........................................................................................................................................................59
8 THEORETICAL LANE CHANGE PROBABILITIES...............................................................................64
8.1 METHOD ........................................................................................................................................................64 8.2 RESULTS ........................................................................................................................................................67
9 DISCUSSION, CONCLUSIONS, AND APPLICATION GUIDELINES...................................................70
10 REFERENCES.................................................................................................................................................73

vii
LIST OF FIGURES FIGURE 1. EXAMPLES OF ENTRANCE RAMP SIGNING .......................................................................................2 FIGURE 2. DIAMOND INTERCHANGE, FREEWAY OVER RURAL EXPRESSWAY (FIGURE REPRODUCED FROM [1], FIGURE
GS-20)....................................................................................................................................................3 FIGURE 3. EXAMPLE OF TYPICAL OVERHEAD MOUNTED DIAGRAMMATIC FREEWAY GUIDE SIGNS ................4 FIGURE 4 A. VISUAL ANGLE AS A FUNCTION OF AVERAGE W/H RATIO FOR POSITIVE CONTRAST (WHITE ON DARK
BACKGROUND) .......................................................................................................................................8 FIGURE 5 A. MODEL 1 FOR A SPEED OF 48KM/H AND FOR A SPEED OF 96KM/H....................................................9 FIGURE 6. CUMULATIVE FREQUENCY AS A FUNCTION OF MRLD FOR MODEL 1 AND MODEL 2 ....................10 FIGURE 7. INTERNATIONAL USE OF GROUND MOUNTED DIAGRAMMATIC GUIDE SIGNS ...............................11 FIGURE 8. MAP VIEW OF THE SR 315 (SOUTHBOUND) INTERCHANGE SITE WITH I 270..................................13 FIGURE 9. AERIAL VIEW OF THE SR 315 (SOUTHBOUND) INTERCHANGE SITE WITH I 270 .............................14 FIGURE 10. SR 315 (SOUTHBOUND) INTERCHANGE SITE WITH I 270..............................................................15 FIGURE 11. MAP VIEW OF THE BRICE ROAD (NORTHBOUND) INTERCHANGE SITE WITH I 70.........................16 FIGURE 12. AERIAL VIEW OF THE BRICE ROAD (NORTHBOUND) INTERCHANGE SITE WITH I 70....................17 FIGURE 13. BRICE ROAD (NORTHBOUND) INTERCHANGE WITH I 70 ..............................................................18 FIGURE 14. MAP VIEW OF THE GEORGESVILLE ROAD (WESTBOUND) INTERCHANGE SITE WITH I 270 ..........19 FIGURE 15. AERIAL VIEW OF THE GEORGESVILLE ROAD (WESTBOUND) INTERCHANGE SITE WITH I 270......20 FIGURE 16: DIMENSIONS OF GROUND MOUNTED DIAGRAMMATIC SIGNS AT GEORGESVILLE ROAD (WESTBOUND)
INTERCHANGE WITH I 270.....................................................................................................................21 FIGURE 17. GEORGESVILLE ROAD (WESTBOUND) INTERCHANGE WITH I 270 ................................................22 FIGURE 18. MAP VIEW OF THE ROBERTS ROAD (EASTBOUND) INTERCHANGE SITE WITH I 270.....................23 FIGURE 19. AERIAL VIEW OF THE ROBERTS ROAD (EASTBOUND) INTERCHANGE SITE WITH I 270 ................24 FIGURE 20. ROBERTS ROAD (EASTBOUND) INTERCHANGE WITH I 270...........................................................25 FIGURE 21. MAP VIEW OF THE HILLIARD ROME ROAD (SOUTHBOUND) INTERCHANGE SITE WITH I 70.........26 FIGURE 22. AERIAL VIEW OF THE HILLIARD ROME ROAD (SOUTHBOUND) INTERCHANGE SITE WITH I 70 ....27 FIGURE 23. DIMENSIONS OF GROUND MOUNTED DIAGRAMMATIC SIGNS AT HILLIARD ROME ROAD (SOUTHBOUND)
INTERCHANGE WITH I 270.....................................................................................................................27 FIGURE 24. HILLIARD ROME ROAD (SOUTHBOUND) INTERCHANGE WITH I 270.............................................28 FIGURE 25. MAP VIEW OF THE PLAIN CITY GEORGESVILLE ROAD (SOUTHBOUND) INTERCHANGE SITE WITH I 70
.............................................................................................................................................................29 FIGURE 26. AERIAL VIEW OF THE PLAIN CITY GEORGESVILLE ROAD (SOUTHBOUND) INTERCHANGE SITE WITH I 70
.............................................................................................................................................................30 FIGURE 27. PLAIN CITY GEORGESVILLE ROAD (SOUTHBOUND) INTERCHANGE SITE WITH I 70 .....................31 FIGURE 28. MOBILIZER PC GEOMETRY DEFINITION AT THE FIRST CAMERA LOCATION, BRICE ROAD ..........33 FIGURE 29. MOBILIZER PC VEHICLE TRACKING AT FIRST CAMERA LOCATION OF BRICE ROAD ...................34 FIGURE 30. BRICE ROAD INTERCHANGE WITH I 70, SIGNING DURING THE BEFORE CONDITION. ...................35 FIGURE 31. BRICE ROAD INTERCHANGE WITH I 70, SIGNING DURING THE AFTER CONDITION. .....................36 FIGURE 32. BRICE ROAD INTERCHANGE WITH I 70, CAMERA LOCATIONS. ....................................................37 FIGURE 33. GEORGESVILLE ROAD INTERCHANGE WITH I 270, SIGNING DURING THE BEFORE CONDITION....38 FIGURE 34. GEORGESVILLE ROAD INTERCHANGE WITH I 270, SIGNING DURING THE AFTER CONDITION......39 FIGURE 35. GEORGESVILLE ROAD INTERCHANGE WITH I 270, CAMERA LOCATIONS.....................................40 FIGURE 36. CUMULATIVE PERCENTAGE AS A FUNCTION OF SPEED, BRICE INTERCHANGE, LOCATION ONE. .41 FIGURE 37. CUMULATIVE PERCENTAGE AS A FUNCTION OF SPEED, BRICE INTERCHANGE, LOCATION TWO..42 FIGURE 38. CUMULATIVE PERCENTAGE AS A FUNCTION OF SPEED, BRICE INTERCHANGE, LOCATION THREE.42 FIGURE 39. CUMULATIVE PERCENTAGE AS A FUNCTION OF HEADWAY GAP, BRICE INTERCHANGE, LOCATION ONE.
.............................................................................................................................................................43 FIGURE 40. CUMULATIVE PERCENTAGE AS A FUNCTION OF HEADWAY GAP, BRICE INTERCHANGE, LOCATION TWO
.............................................................................................................................................................44 FIGURE 41. CUMULATIVE PERCENTAGE AS A FUNCTION OF HEADWAY GAP, BRICE INTERCHANGE, LOCATION THREE.
.............................................................................................................................................................44 FIGURE 42. QUESTION NUMBER 1, ODOT/FHWA EVALUATOR RESPONSES .................................................49 FIGURE 43. QUESTION NUMBER 2, ODOT/FHWA EVALUATOR RESPONSES .................................................49 FIGURE 44. QUESTION NUMBER 3, ODOT/FHWA EVALUATOR RESPONSES .................................................50 FIGURE 45. QUESTION NUMBER 4, ODOT/FHWA EVALUATOR RESPONSES .................................................50 FIGURE 46. QUESTION NUMBER 5, ODOT/FHWA EVALUATOR RESPONSES .................................................51

viii
FIGURE 47. SR 315 SOUTHBOUND INTERCHANGE WITH I 270, LANE CHANGE DISTANCE TO GORE...............53 FIGURE 48. BRICE ROAD NORTHBOUND INTERCHANGE WITH I 70, LANE CHANGE DISTANCE TO GORE........53 FIGURE 49. GEORGESVILLE ROAD INTERCHANGE WITH I 270, LANE CHANGE DISTANCE TO GORE...............54 FIGURE 50. ROBERTS ROAD INTERCHANGE WITH I 270, LANE CHANGE DISTANCE TO GORE ........................54 FIGURE 51. HILLIARD ROME ROAD INTERCHANGE WITH I 270, LANE CHANGE DISTANCE TO GORE .............55 FIGURE 52. PLAIN CITY GEORGESVILLE ROAD (SR 142) SOUTHBOUND INTERCHANGE WITH I 70, LANE
CHANGE DISTANCE TO GORE ...............................................................................................................55 FIGURE 53. LANE CHANGE DISTANCE TO GORE, COMBINED FOR ALL INTERCHANGES USED IN STUDY.........56 FIGURE 54. EXPERIMENTAL VEHICLE AND EYE SCAN EQUIPMENT USED IN THE PRESENT STUDY.................57 FIGURE 55. VIRTUAL BOUNDARY USED FOR ANALYSIS OF EYE FIXATION VIDEO RECORDS .........................58 FIGURE 56. AVERAGE NUMBER OF EYE FIXATIONS PER DIAGRAMMATIC SIGN. ............................................60 FIGURE 57. AVERAGE DURATION OF EYE FIXATION [SECONDS] AT THE FIRST DIAGRAMMATIC SIGN OF EACH
INTERCHANGE. .....................................................................................................................................60 FIGURE 58. AVERAGE DURATION OF EYE FIXATION AT THE SECOND DIAGRAMMATIC SIGN (WHERE PRESENT) OF
EACH INTERCHANGE. ............................................................................................................................61 FIGURE 59. BOX PLOTS OF LOOK (FIXATION) DISTANCES, DIAGRAMMATIC SIGN #1 ....................................62 FIGURE 60. BOX PLOTS OF LOOK (FIXATION) DISTANCES, DIAGRAMMATIC SIGN #2. ...................................63 FIGURE 61. MODEL USED TO DETERMINE THE THEORETICAL LANE CHANGE PROBABILITY .........................65 FIGURE 62. TYPICAL SCATTER PLOT OF SUCCESSIVE HEADWAY GAPS..........................................................66 FIGURE 63. PROBABILITY OF MAKING A SUCCESSFUL LANE CHANGE DURING BEFORE AND AFTER CONDITIONS AT
GEORGESVILLE ROAD...........................................................................................................................68 FIGURE 64. PROBABILITY OF MAKING A SUCCESSFUL LANE CHANGE DURING BEFORE AND AFTER CONDITIONS AT
BRICE ROAD. ........................................................................................................................................69

ix
LIST OF TABLES TABLE 1. TEST OF HYPOTHESIS THAT THE BEFORE AND AFTER MEAN SPEEDS ARE EQUAL AT BRICE ROAD
INTERCHANGE. .....................................................................................................................................43 TABLE 2. TEST OF HYPOTHESIS THAT THE BEFORE AND AFTER MEAN HEADWAY GAPS ARE EQUAL AT THE BRICE
ROAD INTERCHANGE. ...........................................................................................................................45 TABLE 3. ODOT/FHWA EVALUATOR RESPONSES TO FIVE QUESTIONS REGARDING THE APPLICATION AND
PLACEMENT OF DIAGRAMMATIC ENTRANCE RAMP APPROACH SIGNS .................................................47 .

1
1 INTRODUCTION The present study was conducted to investigate the effects of ground mounted diagrammatic entrance ramp approach signs on driver behavior. Typically, drivers need the aid of guide signs to navigate on the urban road network. This is especially true for drivers in an unfamiliar road environment. Highway-freeway interchanges represent an area of confusion in the road system where unfamiliar drivers may benefit from the use of guide signs. Currently, trailblazer assemblies (Figure 1a) are used in Ohio to guide drivers approaching a freeway-highway interchange on an urban arterial. These trailblazer assemblies are located relatively close to the interchange, and due to their small size and limited information content, they do not give a driver much advance information about the lane alignment in the entrance ramp area. Additional non-diagrammatic guide signing is typically located along the interchange approach as indicated in Figure 2. Conventional Road Guide Signs are described in the OMUTCD [1] section 2R. Road Guide Signs generally display a destination and the distance in miles to this destination. Freeway and Expressway signs are described in section 2U of the OMUTCD [1]. Figure 3 shows two typical overhead diagrammatic freeway guide signs.
Ground mounted diagrammatic entrance ramp approach signs (Figure 1b) are another type of guide sign, intended to give drivers information as early as possible during approaching a highway-freeway interchange. The use of ground mounted diagrammatic entrance ramp approach signs will provide a lower cost alternative to the use of overhead span type sign bridges. This field study was sponsored by the Ohio Department of Transportation (ODOT) and the Federal Highway Administration (FHWA) to determine if there are any driver benefits if some of the advance guide information at highway-interchanges is displayed in diagrammatic fashion as shown in Figure 1b.
While over the years, the expressway guide signing concept has been somewhat
optimized for visibility, legibility, and easy information processing to allow for efficient and correct motorist decision making, the Route Marker and Conventional Guide Signing concept has not been improved to the same degree. Thus, the conventional guide signing system does not fully address the ever-increasing information acquisition and information processing demands imposed upon the motorist operating his/her vehicle in an urban freeway interchange setting. In fact, multiple variations in interchange design and inadequate signing make it often difficult for an unfamiliar motorist approaching a freeway or expressway interchange to determine which way to turn in order to enter the freeway entrance ramp in the desired direction of travel. This is especially true on multi-lane approaches to freeway interchanges. Considering the increased driver workload on multi-lane freeway interchanges and the relatively poor conspicuity, visibility, and legibility of the current conventional guide signing concept, timely and safe lane changes are often not possible since the relevant information may not be processed in due time. This may
• compromise driver safety (erratic last moment lane changes), • reduce interchange throughput due to slowing and/or stopping, and/or • cause additional traffic (and additional fuel consumption) due to drivers who cannot
merge as required and must therefore turn around some distance away from the interchange and approach again from the other side.

2
The Federal Manual on Uniform Traffic Control Devices (MUTCD) [2] states in section 2F-24 that “diagrammatic signs have been shown to be superior to conventional guide signs for some interchanges”. Figure 3 shows typical freeway guide signs as described in [2]. The MUTCD encourages the highway agencies to continue with further experimentation using diagrammatic signs. Thus, the research shown herein was aimed at improving the conventional guide signing concept with regard to its application along freeway/expressway interchange approaches. Figure 2 shows the application of the Conventional Guide Signing System at a typical diamond freeway interchange. It seems that the Conventional Guide Signing System used in an interchange approach as shown in Figure 2 does not provide as much advance information about appropriate lane changes as would be possible and desirable from a human factors and ergonomics point of view.
a. Trailblazer assembly. b. Diagrammatic sign.
Figure 1. Examples of Entrance Ramp Signing

3
Figure 2. Diamond Interchange, Freeway Over Rural Expressway (Figure reproduced from [1],
Figure GS-20)

4
Figure 3. Example of Typical Overhead Mounted Diagrammatic Freeway Guide Signs
This research was conducted in the greater Columbus, Ohio, area and involved the following studies: 1. Collection of video flow data under the before condition (preexisting guide signing). 2. Collection of video flow data under the after condition (supplemental diagrammatic guide
signs). 3. Analysis of the video flow data using the automated traffic analysis and classification
software package Mobilizer PC. This task was used to unobtrusively determine the headway maintenance behavior, vehicle speeds, and interchange throughput under the before and after condition.
4. Driver eye movement recording and analysis during approaches to the test interchanges. This task was used to determine the first look distances, number of looks, and the last look distances to diagrammatic and other guide signing.
5. Test driver behavior was recorded with video cameras to determine when an unfamiliar test driver would recognize that he or she had to change lanes in order to enter a specified freeway.
6. Expert evaluation questionnaire to determine the opinions of ODOT traffic engineers regarding the use of diagrammatic guide signs
1.1 Statement of the Problem The current trailblazer assemblies give the approaching drivers little advance indication of which lane should be used to complete the entrance onto the freeway in the desired direction of travel. Interchanges may require right turns for both available directions of travel (cloverleaf interchange), a left turn to travel left and a right turn to travel right (diamond interchange), or other combinations of right and left turns. This lack of consistency can cause problems if drivers do not recognize a necessary lane change soon enough. Late recognition of the required entrance ramp lane may cause drivers to perform risky weaving maneuvers to gain access to the desired

5
lane. This type of maneuver causes disturbances in the traffic flow and increases the potential for collisions. If drivers determine that there is not enough time to make a weaving maneuver, they must continue in the same direction of travel until they can locate an acceptable gap to change lanes. Drivers must then exit the roadway, turn around (e.g. at a gas station), and try to find the interchange from the opposite direction. This causes an increase in traffic volume as well as emissions. Signs can be mounted on overhead span type sign bridges to provide additional guidance to the motorist. This type of signing is very effective, but quite costly. Ground mounted diagrammatic signing may be able to give drivers more information about the proper lane for each available direction of travel well in advance of the interchange, at a more cost-effective level.

6
2 LITERATURE Opland [4] and the state of Michigan Department of Transportation conducted a Positive Guidance Demonstration project on a major freeway split off of I-96. The site experienced a high accident rate as well as a high incidence of erratic maneuvers and lane changes. As a result of an implementation of the Positive Guidance procedure, changes were made to the information system. The major feature of the change was a diagrammatic treatment. A “before/after” evaluation showed a statistically significant reduction of two of the four measures of effectiveness. These were erratic maneuvers and brake applications. Accident reports were positive from this treatment, also. It was concluded that the positive Guidance principles and the Diagrammatic treatment were encouraging.
Berger [5] studied and tested several signing designs for better communication of
interchange information and route guidance. Most important consideration was in the area of map signing and graphical communication. Considerations of the study were: laboratory testing methods, graphic concepts and characters, determination of what types of intersections need the new signs, and the presentation method for the audience of highway designers. Opland [6] produced a paper which dealt with the same situation as in [4].
The Wyoming State Highway Department conducted a study [7] to evaluate the
diagrammatic signing system and to compare it with the current highway signing system. The main point of this investigation focused around diagrammatic sign comprehension and motorist response time behavior. This study used visual observations and motorist interviews to compare the situations before and after the change to the diagrammatic road signs. This study showed only slight improvements in the erratic movement metric.
Hanscom [8] reported that diagrammatic signs were a success on a location on the
Beltway around Washington D.C. The conditions before and after were evaluated by the type and frequency of ‘erratic maneuvers’. Erratic maneuvers were subdivided into weaving, hesitations, stops and backups, and partial weaving. The findings were: a large reduction in the amount of weaving, more consistent patterns of traffic and no accidents in the experimental area in 4 months, (a significant decrease). There was also an increase in the number of weaves, but much fewer stops and backups. Another conclusion is that the diagrammatic signing may be initially confusing due to being so different from the signing of the time of the study.
Shepard [9] used video segments in a laboratory environment to simulate road conditions.
The use of diagrammatic signs was recommended for the sites included in the study. When the signs were put into the field, the results were not significant in the number of erratic maneuvers metric.
Roberts [10] concluded that a significant reduction in the rates of erratic maneuvers was
obtained when diagrammatic signs were used in a test site in New Jersey. This study concerns the application in left-hand exits. TV cameras were used for surveillance and to obtain the responses. Much data was presented in this report including information on the time, type of maneuvers, number of axles, and the traffic volume at the time. The results showed the good potential for this signing method in this application.

7
King [11] studied the applications of highway signing methods to urban areas and how
and what modifications are needed in the urban areas. The current methods of urban guidance were investigated along with questionnaire surveys of motorist perceived problems of the current system. One of the possible improvements suggested was the use of persons not professionally involved with traffic engineering to check the entire system for accuracy and functionality.
Mast and Kolsrud [12] conducted a study that was to set the standards for the use of
freeway diagrammatic guide signs. Vol. 1 is a summary of the diagrammatic signing research sponsored by the Federal Highway Administration. Vol. 2 investigates the research of diagrammatic and conventional signing done both in laboratory experiments and in the field using vehicles with instrumentation. Research completed by state highway departments and an extensive survey is included. Vol. 3 contains the details of the field studies of the earlier volumes. The results showed slight improvements with the new signing methods in some areas and no worsening of the situation in any of the sites included.
Shepard [13] investigated ways of increasing the legibility of signs. The signs
investigated had backgrounds that were relatively bright. The results of this study indicated that the legibility can be increased by modifying the font or shape of the characters on the sign.
Gordon [14] investigated the informational load on motorist due to highway guide signs.
Of importance in this investigation was faulty lane choices and response delays. The main experiment used 50 people to look at new signings and then they had to select the correct lane for a destination using highway situations. Results showed that as the number of signs are increased, the time required to find the correct route increased. Another result was that when a place (a destination) was listed on the sign, the response was fast. When a route number by itself was listed on the sign, the response time was increased.
Fenno [15] researched the legibility of Texas highway guide signs with particular interest
with older drivers. Static and dynamic tests were performed. Recommendations for letter height and cardinal direction markers are provided. The increased sign legibility is needed for the older driver because the older driver’s legibility distances were observed to be 12-17 percent shorter than their younger counterparts.
Zwahlen, Sunkara, and Schnell [16] conducted an extensive review of the relevant
legibility literature in order to provide normalized legibility performance data for a comparison and consolidation of past legibility research. The data was normalized by expressing the legibility performance in terms of visual angle subtended by the character height. The data revealed large variations in visibility performance among the reviewed studies, despite similar or even identical experimental treatments. These variations may be attributed to the large range of applied experimental protocols and experimental boundary conditions such as the display luminances etc. The normalized data was grouped into sets, relating the visual angle to the width to height ratio W/H, the inter- character spacing to height ratio S/H, and the stroke width to height ratio SW/H, for both negative and positive contrast. Second order polynomial least squares functions such as the ones shown in Figure 4 were established to obtain a proposed and tentative functional relationship between the visual angle and W/H, S/H, and SW/H.

8
1.25
1.20
1.15
1.10
1.05
1.00
0.95
0.90
0.85
0.80
0.75
0.70
0.65
0.60
0.55
0.50
0.45
0.40
0.35
0.30
0.25
0123456789
101112131415161718192021222324252627282930
y = 19.11 - 35.63x + 21.37x^2spacing/height = 0.19 optimal spacing/height = 0.28
y = 18.38 - 35.63x + 21.37x^2
y = 21.11 - 35.63x + 21.37x^2
Forbes, 1951 (words viewed for the second time)Forbes, 1951 (words viewed for the first time)Forbes, 1951 (scrambled letters)Solomon, 1956Mace, 1993Snellen Block Capital Letter EZwahlen, 1991 (Arizona License Plates)
Average Width to Height Ratio
Vis
ual A
ngle
(min
. of a
rc)
For meaningful words (traffic signs)
For unrelated letters and numbers in groups of 3 (license plates)
spacing/height = 0.14y = 19.36 - 35.63x + 21.37x^2optimal spacing/height = 0.28
S/H Ratio of 0.19 is the normal and S/H of 0.28 is the optimum obtained from Figure 3.
Minimum Visual Angle at a W/H of 0.83
Solid sections indicate adequate fit Dashed Sections represent proposed relationship
1.00.90.80.70.60.50.40.30.20.10.00
1
2
3
4
5
6
7
8
9
10
11
12
13
14
15
16
17
18
19
20
y = 11.65 - 49.76x + 88.74x^2
y = 10.51 - 49.76x + 88.74x^2For single letters or meaningful words (traffic signs)
For unrelated letters and numbers in groups of 3 (license plates)
Average Spacing Between Characters to Height Ratio
Vis
ual A
ngle
(min
. of a
rc)
y = 15.65 - 49.76x + 88.74x^2
y = 11.24 - 49.76x + 88.74x^2
Baerwald et al., 1960
Solomon, 1956 Series CSolomon, 1956 Series E
Based on Series C and Series E data from Solomon, 1956
Adjusted to coincide with the min. visual angle for the lowest curve in Figure 1
Adjusted to coincide with the min. visual angle of the second to the top curve in Figure 1
Zwahlen, 1991 (Arizona License Plates)
Minimum Visual Angle at a S/H of 0.28
Solid sections indicate adequate fit Dashed Sections represent proposed relationship
Figure 4 a. Visual Angle As A Function Of Average W/H Ratio For Positive Contrast (White on Dark Background)
Figure 4 b. Visual Angle as a Function of Average Inter-Character S/H Ratio within a Word for Positive Contrast (White on Dark Background)
Overall, it was found that single characters/numerals or meaningful words (typically
found on traffic signs) are more legible than unrelated groups of characters/numerals (typically found on license plates). Further, the data indicated that positive contrast characters generally require smaller stroke-widths SW than negative contrast characters and that more widely spaced characters show an increased legibility over closely spaced characters. The data the authors compiled provides display designers with proposed analytical functional relationships between legibility performance (visual angle) and typographical properties, thus allowing for display optimization with regard to legibility. The authors conclude that future legibility research should be based upon a standardized set of experimental protocols and a systems design approach.
Zwahlen [17] analyzed video taped eye fixations and saccades (30 frames per second) for
32 young, healthy unfamiliar drivers, along rural two lane highways in Ohio under low beam illumination conditions at night for the approach to a curve/turn warning sign (curve/turn symbol) for two selected curves. The first-look distance (longitudinal distance measured from the sign to a driver's eyes at which a driver foveally fixates the sign for the first time), last-look distance (the distance measured from the sign to a driver's eyes where he/she moves the eyes away from the sign for the last time before reaching the sign), number of looks and durations of looks at the warning sign were of main interest in this study. The obtained eye scanning data was used to formulate two models that provide the Minimum Required Legibility Distance (MRLD).

9
Figure 5a and Figure 5b illustrate the MRLD for model 1 (last look time independent of speed) and model 2 (last look distance independent of speed) respectively.
Figure 5 a. Model 1 for a Speed of 48km/h and for a Speed of 96km/h
Figure 5 b. MRLD Model 2 for a Speed of 48km/h and for a Speed of 96km/h
Cumulative last-look distance, first-look duration and last-look duration graphs were
established. The results of this study and a previous similar study indicate that drivers look on the average about two times at a warning sign during a night time low beam approach. It was found that between the first-look (information acquisition) and the last-look (confirmation) at a sign there was usually at least one eye fixation on the roadway ahead. Using cumulative eye fixation duration data obtained for straight road driving under low beam nighttime conditions published in another study and an average saccade duration of about .03 seconds, a sign reading distance model was developed which determines the distance (minimum required legibility distance, MRLD) at which a simple bold symbol on a warning sign must be recognized.

10
Figure 6. Cumulative Frequency as a Function of MRLD for Model 1 and Model 2
The model provides for a given speed the overall cumulative probability distribution
function for the MRLD in terms of distance or in terms of time. The advantage of this model, which is applicable to warning signs with simple symbols under low beam illumination at night, is that it is totally based upon observed, recorded, and analyzed driver eye scanning and information-seeking behavior in the field.
Ground mounted diagrammatic guide signs are commonplace in Europe. The FHWA
conducted a scan tour of innovative technologies in Europe [18]. Figure 7 shows diagrammatic guide signs applied in Germany, France, and England.

11
a. Diagrammatic Guide Sign in Germany
b. Diagrammatic Guide Sign in Germany
c. Diagrammatic Guide Sign in France
d. Diagrammatic Guide Sign in the UK
Figures reproduced from [18]
Figure 7. International Use of Ground Mounted Diagrammatic Guide Signs

12
3 DETAILED DESCRIPTION OF THE INTERCHANGES STUDIED The following section shows maps, aerial views, and surface approach views of the test sites used in this study. The test sites were selected based upon ODOT traffic crash reports and traffic congestion reports. With the exception of the test site at Plain City Georgesville (SR 142) that was added later by the ODOT panel, all test interchanges were selected as typical examples of various interchange configurations. The following test interchanges were used: 1. SR 315 Southbound with I 270 (See Figure 8 through Figure 10). 2. Brice Road Northbound with I 70 (See Figure 11 through Figure 13). 3. Georgesville Road Westbound with I 270 (See Figure 14 through Figure 17). 4. Roberts Road Eastbound with I 270 (See Figure 18 through Figure 20). 5. Hilliard Rome Road (Southbound) Interchange with I 70 (See Figure 21 through Figure 24). 6. Plain City Georgesville Road (SR 142) Southbound with I 70 (See Figure 25 through Figure
27).

13
3.1 SR 315 Southbound Interchange with I 270
270WESTKEEPLEFT
EASTKEEPRIGHT
Dublin 7
270
WEST
N
Figure 8. Map View of the SR 315 (Southbound) Interchange Site with I 270

14
270WEST
270EAST
N
Figure 9. Aerial View of the SR 315 (Southbound) Interchange Site with I 270

15
a. Dimensions of Sign ½ Mile Ahead of Gore
b. Dimensions of Sign ¼ Mile Ahead of Gore
c. Actual Diagrammatic Sign ½ Mile Ahead of Gore
d. Cantilever Overhead Sign 0.38 Miles Ahead of Gore
e. Actual Diagrammatic Sign ¼ Mile Ahead of Gore
f. Trailblazer Assembly at First Gore
Figure 10. SR 315 (Southbound) Interchange Site with I 270

16
3.2 Brice Road Northbound with I 70
N
Figure 11. Map View of the Brice Road (Northbound) Interchange Site with I 70

17
N
70WEST
70EAST
Figure 12. Aerial View of the Brice Road (Northbound) Interchange Site with I 70

18
a. Dimensions of Sign ½ Mile Ahead of Gore b. Shoulder Mounted Diagrammatic Sign ½
Mile Ahead of Gore, Located just ahead of Chantry Rd
c. Sign Bridge, Just after Tussing Rd d. Cantilever Sign for 70 EAST at Gore
e. Cantilever Sign for 70 WEST at Gore
Figure 13. Brice Road (Northbound) Interchange with I 70

19
3.3 Georgesville Road Westbound with I 270
N
Figure 14. Map View of the Georgesville Road (Westbound) Interchange Site with I 270

20
270NORTH
270EAST
N
Figure 15. Aerial View of the Georgesville Road (Westbound) Interchange Site with I 270

21
a. Dimensions of Diagrammatic at ½ Mile b. Dimensions of Diagrammatic Sign at ¼ Mile
Figure 16: Dimensions of Ground Mounted Diagrammatic Signs at Georgesville Road (Westbound) Interchange with I 270

22
a. Actual Diagrammatic Sign at ½ Mile b. Actual Diagrammatic Sign at ¼ Mile
c. Trailblazer Assembly d. Cantilever Overhead Signs Before and at
First Gore
e. Ground Mounted Sign at Second Gore
Figure 17. Georgesville Road (Westbound) Interchange with I 270

23
3.4 Roberts Road Eastbound with I 270
N
2 Figure 18. Map View of the Roberts Road (Eastbound) Interchange Site with I 270

24
N
270NORTH
270SOUTH
Figure 19. Aerial View of the Roberts Road (Eastbound) Interchange Site with I 270

25
a. Actual Diagrammatic Sign Used
b. JCT 270 0.3 Miles Ahead of First Gore
c. Destination Sign 0.08 Miles Ahead of Gore d. Trailblazer Assembly at First Gore
e. Trailblazer Assembly on Bridge Prior to Second Gore
f. Trailblazer Assembly at Second Gore
Figure 20. Roberts Road (Eastbound) Interchange with I 270

26
3.5 Hilliard Rome Road (Southbound) Interchange with I 70
N
Figure 21. Map View of the Hilliard Rome Road (Southbound) Interchange Site with I 70

27
70WEST
70EAST
N
Figure 22. Aerial View of the Hilliard Rome Road (Southbound) Interchange Site with I 70
a. Dimensions of Sign at ¼ Mile
Radius
8"33"
132"
b. Dimensions of Sign at 121 m (400 ft)
Figure 23. Dimensions of Ground Mounted Diagrammatic Signs at Hilliard Rome Road (Southbound) Interchange with I 270

28
a. Actual Diagrammatic Sign at ¼ Mile
b. Trailblazer Assembly 0.2 Miles Ahead of Gore
c. Actual Sign Diagrammatic Sign
d. Shoulder Destination Sign and Cantilever Sign
e. Cantilever Sign
Figure 24. Hilliard Rome Road (Southbound) Interchange with I 270

29
3.6 Plain City Georgesville Road (SR 142) Southbound with I 70
N
Figure 25. Map View of the Plain City Georgesville Road (Southbound) Interchange Site with I
70

30
N
70WEST
70EAST
Figure 26. Aerial View of the Plain City Georgesville Road (Southbound) Interchange Site with I
70

31
a. Shoulder Mounted Diagrammatic Sign ½ Mile Ahead of Interchange
b. Shoulder Mounted Diagrammatic Sign ¼ Mile Ahead of Interchange
c. JCT 70, East West Guide Sign, and Cantilever Overhead Sign at First Gore
d. Trailblazer Assemblies on Bridge to Second Gore
e. 70 East and Cantilever Overhead Sign at Second Gore
Figure 27. Plain City Georgesville Road (Southbound) Interchange Site with I 70

32
4 TRAFFIC FLOW VIDEO ANALYSIS One particular concern when introducing novel guide signing techniques such as diagrammatic signs centers around the effects on traffic flow. Considering that the target interchanges for diagrammatic signing are usually at or near capacity, and exhibit tremendously high traffic volumes (ADT), one has to ensure that any new sign design does not disrupt, in any way, shape, or form, the traffic flow at the interchanges. In this study, we elected to use unobtr`usive video cameras in the approach area to determine the traffic flow conditions during the before and during the after condition. The goal of the video data acquisition for the before condition was to obtain detailed data of the traffic characteristics along three selected (unidirectional) freeway interchange approaches equipped with conventional, preexisting guide signs. The following interchanges were studied in this fashion:
1. Brice Road and I-70 2. SR 315 and I-270 3. Georgesville and I-270
The following traffic characteristics (measures of effectiveness, MOE) were quantified in this task:
1. Traffic volume 2. Interchange throughput 3. Vehicle speeds 4. Number of vehicles per lane 5. Headway gaps
Multiple overhead video cameras (three per approach direction) were used to cover a
substantial portion of the approach zones. Cameras were installed in aluminum boxes with plexiglass viewports for weather and vandal proofing. The cameras were installed at the interchange site using existing poles (lamp poles, utility poles, etc.). A separate utility pole had to be installed at SR 315 due to a lack of adequate existing poles. Note: all camera support posts were breakaway or behind a guardrail. The cameras were aimed downward to obtain a top-down view that minimized obstruction of traffic lanes by large vehicles.
After the cameras were installed, the video data was collected for three days at each interchange. The cameras recorded their respective scenes on 8 mm cassette tapes from approximately 8:00 AM until 8:00 PM. Because of capacity limits of the cassettes, new cassettes had to be inserted in each camera every two hours. All cassettes were labeled with the following information: cassette number, camera box number, interchange location, date, and time. A total of three spreadsheets, one for each intersection, were created. These spreadsheets contained information on camera location, time interval, additional information regarding cassette condition, and remarks.
The goal of the data acquisition for the after condition was to obtain detailed data of the traffic characteristics along the same three selected (unidirectional) freeway interchange approaches observed in the before condition. During the after condition the interchanges were equipped with the experimental diagrammatic guide signs along with the existing guide signs.

33
4.1 Data analysis The data, stored on 8 mm video tapes, was analyzed in the laboratory using MOBILIZER-PC, a software-based traffic classification and counting system. Intersections were analyzed at each of the three camera locations for the before and after conditions during three, two-hour time periods: • Morning (8:00AM-10:00AM) • Afternoon (11:00AM-1:00PM) • Evening (4:00PM-6:00PM)
Note: The above times served as an analysis guideline, because of technical difficulty
actual analysis times differed slightly. Only daytime video footage was analyzed because Mobilizer PC could not handle the multiple reflections of the car headlamps on the pavement during nighttime. Figure 28 shows a screen shot of the Mobilizer PC geometry definition module for the first camera location at Brice Road. The geometry defines the outline of the individual traffic lanes and specifies measurement lines (lines horizontally across the street) for Mobilizer PC to be able to determine the distance a vehicle travels in the perspective view of the video image. The size of typical vehicles can be entered in this definition also, so that Mobilizer PC can automatically classify vehicles based upon their overall length.
Figure 28. Mobilizer PC Geometry Definition at the First Camera Location, Brice Road

34
Figure 29 shows five vehicles being tracked as they enter the tracking area at the first camera location of the Brice Road interchange.
Figure 29. Mobilizer PC Vehicle Tracking at First Camera Location of Brice Road
The MOBILIZER-PC system uses video inputs from a camera or VCR. The system has
three major components: a digitizer board, the TN Detection Module, and the Data Association Tracking Module. The digitizer board is a hardware component, installed in the PC to allow digitizing of the video stream. The TN Detection Module is a software component, which detects vehicles on the roadway. The Data Association Tracking Module is a software component, which tracks vehicles detected by the TN Detection Module and removes false alarms. As the system processes the video, it provides displays of detected and tracked vehicles as well as aggregated statistics, which are stored in a data file. The vehicles are tracked throughout the defined field of view, and tracking boxes are displayed around the vehicles. The data files generated by the MOBILIZER-PC system were converted to Microsoft Excel format for analysis purposes.
4.2 Results At each of the videotaped interchanges (SR 315, Brice Road, Georgesville Road) data was gathered at three locations, with location one being farthest from the gore and location three being closest to the gore. At each location, separate data was collected for each of the individual lanes with regard to headway gaps, speed, and lane changes. For each lane at the defined locations, data was summarized in cumulative distributions, probability density functions, and

35
correlation scatter plots. The three interchanges were videotaped and analyzed during the before condition (preexisting guide signing only) and the after condition (preexisting signing plus diagrammatic signs). Figure 30 to Figure 35 show the schematic layout of the two interchanges.
I-70 W
I-70 E
Traffic Sig./Tussing Rd.Intersection
GreenOverhead
Guide Signs
GreenOverhead
Guide Sign
Traffic Sig./I-70 3-WayIntersection
GreenOverhead
Guide Sign
OverheadSign Bridge
Bric
e R
d.
N
150 m
275 m
580 m
150 m
30 m
Figure 30. Brice Road Interchange with I 70, Signing During the Before Condition.

36
I-70 W
I-70 E
Traffic Sig./Tussing Rd.Intersection
GreenOverheadGuide Sign
Traffic Sig./I-70 3-WayIntersection
GreenOverheadGuide Sign
OverheadSign Bridge
Bric
e R
d.
N
150 m
275 m
580 m
150 m
30 m
100 mDiagrammaticApproach Sign
Figure 31. Brice Road Interchange with I 70, Signing During the After Condition.

37
I-70 W
I-70 E
Traffic Sig./Tussing Rd.Intersection
GreenOverhead
Guide Sign
Traffic Sig./I-70 3-WayIntersection
GreenOverhead
Guide Sign
OverheadSign Bridge
Bric
e R
d.
N
150 m
275 m
580 m
150 m
30 m
100 mDiagrammaticApproach Sign
CameraLocation #3
CameraLocation #2
CameraLocation #1
Figure 32. Brice Road Interchange with I 70, Camera Locations.

38
I-270 E
I-270 N
Traffic Sig./Holt Rd.
Intersection
Geo
rges
ville
Rd.
N
GreenOverhead
Guide Sign
GreenOverhead
Guide Sign
GreenGround Mtd.Guide Sign
Traffic Sig./3-Way
Intersection
275 M
100 M
335 M
120 M
Traffic Sig./3-Way
Intersection
Figure 33. Georgesville Road Interchange with I 270, Signing During the Before Condition

39
I-270 E
I-270 N
Traffic Sig./Holt Rd.
Intersection
Geo
rges
ville
Rd.
N
GreenOverhead
Guide Sign
GreenOverhead
Guide Sign
GreenGround mounted
Guide Sign
Traffic Sig./3-Way
Intersection
275 M
100 M
335 M
120 M
DiagrammaticApproach Sign
DiagrammaticApproach Sign
50 M
400 M
Traffic Sig./3-Way
Intersection
Figure 34. Georgesville Road Interchange with I 270, Signing During the After Condition.

40
I-270 E
I-270 N
Traffic Sig./Holt Rd.
Intersection
Geo
rges
ville
Rd.
N
GreenOverhead
Guide Sign
GreenOverhead
Guide Sign
GreenGround mounted
Guide Sign
Traffic Sig./3-Way
Intersection
275 M
100 M
335 M
120 M
DiagrammaticApproach Sign
DiagrammaticApproach Sign
50 M
400 M
CameraLocation #3
CameraLocation #2
CameraLocation #1
Traffic Sig./3-Way
Intersection
Figure 35. Georgesville Road Interchange with I 270, Camera Locations

41
Only data for the Brice Road interchange is shown, since the resulting data looked very similar for the three test interchanges. Cumulative percentages as a function of speed are shown in Figure 36, Figure 37, and Figure 38 for camera locations one, two, and three respectively. Graphically, the after condition distributions tend to show a shift to the left in both lanes, indicating a decrease in the vehicle speed. Also, the average speed in each lane at each camera location decreased in the after condition. Further, Table 1 shows that each of the differences in average speed are statistically significant at α = 0.05.
0%
10%
20%
30%
40%
50%
60%
70%
80%
90%
100%
0 5 10 15 20 25 30 35 40 45 50 55 60 65 70
Speed [mph]
Cum
ulat
ive
Perc
enta
ge [%
]
After (right), Average= 33 mph,Std.dev= 12 mph, N= 5502vehiclesAfter (left), Average= 35 mph,Std.dev= 11 mph, N= 5490vehiclesBefore (right), Average= 34mph, Std.dev= 14 mph, N= 4975vehiclesBefore (left), Average= 39 mph,Std.dev= 12 mph, N= 5313vehicles
Brice InterchangeLocation 1
`Before-3/11/98 (W ednesday)8:45-10:45AM,11:00AM-1:00PM, 3:15-5:15PMAfter-5/1/99 (Saturday)7:50-9:50AM, 12:00-2:00PM, 3:40-5:40PM
Figure 36. Cumulative Percentage as a Function of Speed, Brice Interchange, Location One.

42
0%
10%
20%
30%
40%
50%
60%
70%
80%
90%
100%
0 5 10 15 20 25 30 35 40 45 50 55 60 65 70
Speed [mph]
Cum
ulat
ive
Perc
enta
ge [%
]
After (right), Average= 37 mph,Std.dev= 8 mph, N= 6680vehiclesAfter (left), Average= 39 mph,Std.dev= 9 mph, N= 5995vehiclesBefore (right), Average= 40mph, Std.dev= 10 mph, N= 4999vehiclesBefore (left), Average= 42 mph,Std.dev= 10 mph, N= 5201vehicles
Brice InterchangeLocation 2
`Before-3/11/98 (Wednesday)8:45-10:45AM,11:00AM-1:00PM, 3:15-5:15PMAfter-5/1/99 (Saturday)7:50-9:50AM, 12:00-2:00PM, 3:40-5:40PM
Figure 37. Cumulative Percentage as a Function of Speed, Brice Interchange, Location Two.
0%
10%
20%
30%
40%
50%
60%
70%
80%
90%
100%
0 5 10 15 20 25 30 35 40 45 50 55 60 65 70
Speed [mph]
Cum
ulat
ive
Perc
enta
ge [%
]
After (right), Average= 39 mph,Std.dev= 10 mph, N= 3972vehiclesAfter (left), Average= 36 mph,Std.dev= 12 mph, N= 4496vehiclesBefore (right), Average= 43mph, Std.dev= 9 mph, N= 3702vehiclesBefore (left), Average= 43 mph,Std.dev= 10 mph, N= 3865vehicles
Brice InterchangeLocation 3
` Before-3/11/98 (Wednesday)8:45-10:45AM,11:00AM-1:00PM, 3:15-5:15PMAfter-5/1/99 (Saturday)7:50-9:50AM, 12:00-2:00PM, 3:40-5:40PM
Figure 38. Cumulative Percentage as a Function of Speed, Brice Interchange, Location Three.

43
Table 1. Test of Hypothesis that the Before and After Mean Speeds are Equal at Brice Road Interchange.
Location 1 Right Lane Left Lanet-value 3.5084 15.7715P-value 0.0005 0.0000
Conclusion Reject Reject
Location 2t-value 14.5987 15.8733P-value 0.0000 0.0000
Conclusion Reject Reject
Location 3t-value 20.7922 29.4333P-value 0.0000 0.0000
Conclusion Reject Reject
A similar comparison was conducted with respect to headway gap. Figure 39, Figure 40, and Figure 41 illustrate the cumulative percentages as a function of headway gap for camera locations one, two, and three, respectively. Again, the after condition distributions appear to be shifted to the left. The average headway gap in each lane at each location decreased, with all but one difference showing statistical significance as indicated in Table 2.
0%
10%
20%
30%
40%
50%
60%
70%
80%
90%
100%
0 10 20 30 40 50 60 70 80 90 100
Headway Gap [m]
Cum
ulat
ive
Perc
enta
ge [%
]
After (right), Average= 33 m, Std.dev=21 m, Median=29.14, N= 4920 vehicles
After (left), Average= 36 m, Std.dev=21 m, Median=32.01, N= 4808 vehicles
Before (right), Average= 34 m,Std.dev= 24 m, Median=29.21, N= 4227vehiclesBefore (left), Average= 37 m, Std.dev=22 m, Median=32.67, N= 4415 vehicles
Brice InterchangeLocation 1
`
Before-3/11/98 (Wednesday)8:45-10:45AM,11:00AM-1:00PM, 3:15-5:15PMAfter-5/1/99 (Saturday)7:50-9:50AM, 12:00-2:00PM, 3:40-5:40PM
Figure 39. Cumulative Percentage as a Function of Headway Gap, Brice Interchange, location
one.

44
0%
10%
20%
30%
40%
50%
60%
70%
80%
90%
100%
0 10 20 30 40 50 60 70 80 90 100
Headway Gap [m]
Cum
ulat
ive
Perc
enta
ge [%
]
After (right), Average= 36 m, Std.dev=22 m, Median=31.16, N= 5983 vehicles
After (left), Average= 38 m, Std.dev=22 m, Median=33.05, N= 5114 vehicles
Before (right), Average= 43 m,Std.dev= 23 m, Median=39.36, N= 4030vehiclesBefore (left), Average= 41 m, Std.dev=23 m, Median=36.99, N= 4189 vehicles
Brice InterchangeLocation 2
`
Before-3/11/98 (Wednesday)8:45-10:45AM,11:00AM-1:00PM, 3:15-5:15PMAfter-5/1/99 (Saturday)7:50-9:50AM, 12:00-2:00PM, 3:40-5:40PM
Figure 40. Cumulative Percentage as a Function of Headway gap, Brice Interchange, Location Two
0%
10%
20%
30%
40%
50%
60%
70%
80%
90%
100%
0 10 20 30 40 50 60 70 80 90 100
Headway Gap [m]
Cum
ulat
ive
Perc
enta
ge [%
]
After (right), Average= 35 m, Std.dev=23 m, Median=28.87, N= 3494 vehicles
After (left), Average= 38 m, Std.dev=24 m, Median=32.59, N= 3165 vehicles
Before (right), Average= 39 m,Std.dev= 25 m, Median=34.13, N= 2540vehiclesBefore (left), Average= 41 m, Std.dev=25 m, Median=35.57 N= 2690 vehicles
Brice InterchangeLocation 3
`
Before-3/11/98 (Wednesday)8:45-10:45AM,11:00AM-1:00PM, 3:15-5:15PMAfter-5/1/99 (Saturday)7:50-9:50AM, 12:00-2:00PM,3:40-5:40PM
Figure 41. Cumulative Percentage as a Function of Headway gap, Brice Interchange, Location Three.

45
Table 2. Test of Hypothesis that the Before and After Mean Headway Gaps are Equal at the Brice Road Interchange.
Location 1 Right Lane Left Lanet-value 1.3858 2.9043P-value 0.1658 0.0037
Conclusion Fail to Reject Reject
Location 2t-value 14.9315 6.5651P-value 0.0000 0.0000
Conclusion Reject Reject
Location 3t-value 6.6326 4.8298P-value 0.0000 0.0000
Conclusion Reject Reject
Overall, for the three interchange sites that were videotaped, it was found that under the after condition (diagrammatic signs present), the vehicle speeds were statistically significantly reduced, the vehicle headway gaps were shorter, and the vehicle throughput was statistically significantly higher.
These findings suggest that the diagrammatic entrance ramp approach signs did not hamper
the throughput of vehicles at the experimental interchanges. In fact, an increase in throughput was observed. However, caution must be given when making conclusions about differences in flow from the before and the after conditions. The observed fluctuations in traffic volume or vehicle speeds may be only partially due to the effectiveness of the diagrammatic signs. It is well possible that factors such as for example the day of the week or road construction on nearby roads may have affected driver behavior in the observed areas. The primary use of the data obtained with the help of Mobilizer PC is to have some assurance that the diagrammatic signs did not disrupt traffic flow and to provide headway gap information for use in the theoretical calculations made in section 8.

46
5 ODOT/FHWA EVALUATOR FIELD SURVEY OF THE EXPERIMENTAL GUIDE SIGNING SYSTEMS (AFTER CONDITION)
A total of 13 ODOT/FHWA traffic engineering personnel were recruited to critically evaluate the design, application, and placement of the diagrammatic entrance ramp approach signs at the sites described in section 3. The passenger evaluators were driven through the test sites along the approach on the multilane arterial, and their task was to concentrate on the application and placement of all guide signing, trailblazer assemblies, lane alignment arrows, etc. The vehicles with the evaluators were parked on the shoulder or on a nearby parking lot, after the pass through the interchange along the multilane arterial. The evaluators were then given enough time to complete a questionnaire consisting of the five following questions: 1. In your opinion, how helpful is the information provided by the diagrammatic entrance ramp
approach signs that are installed in addition to the existing signing at this site? □ Very helpful □ Helpful □ Somewhat helpful □ Marginally helpful □ Not helpful, existing signing is sufficient □ Other
2. How many diagrammatic entrance ramp approach signs should be used for this approach and what are the best advance distances?
□ None, existing signing is sufficient □ One □ Two □ Three □ More □ Other
3. Keeping in mind space and cost considerations, is the right road shoulder the most appropriate lateral location at this particular approach?
□ No diagrammatic entrance ramp approach signs needed, existing signs are sufficient □ Yes, the right road shoulder is the most appropriate lateral installation location at this
approach □ Yes, but where space is available an additional sign should also be installed on the
median □ No, where space is available the signs should be installed on the median only □ Other
4. In what situations do you think will the benefits of the diagrammatic entrance ramp approach signs be greatest at this site?
□ No benefits □ In light traffic □ In moderate traffic that is still flowing □ In heavy bumper-to-bumper traffic □ During daytime □ During nighttime □ In situations where large vehicles may obstruct some traffic signs

47
□ Other 5. From how far ahead could you recognize all features on the ground mounted diagrammatic
entrance ramp approach signs at this approach? □ Well from far enough □ From far enough □ Just barely from far enough □ Just barely from not far enough □ Clearly not from far enough □ Other Six of the evaluators visited the test sites in the order of Brice Road, SR 315, Roberts
Road, Hilliard Rome Road, Plain City Georgesville Road (SR 142), and Georgesville Road. The remaining seven evaluators visited the test sites in the reverse order. The evaluator responses were compiled into a frequency count that is shown in Table 3 and Figure 42 to Figure 46.
Table 3. ODOT/FHWA Evaluator Responses to Five Questions Regarding the Application and Placement of Diagrammatic Entrance Ramp Approach Signs
Question Choices Plain City, SR 142
Hilliard Rome
Roberts Road SR 315 Brice Road Georgesville
RoadVery helpful 2 4 6 9 3 6Helpful 5 6 5 3 6 4Somewhat helpful 2 0 2 0 4 1Marginally helpful 0 2 0 1 0 2Not helpful, existing signing is sufficient 3 1 0 0 0 0Other 0 0 0 0 0 0None, existing signing is sufficient 4 1 0 0 0 0One 3 6 9 7 7 6Two 5 6 4 6 4 7Three 0 0 0 0 0 0More 0 0 0 0 0 0Other 0 0 0 0 2 0No diagrammatic entrance ramp approach signs needed, existing signs are sufficient 5 1 0 0 1 1Yes, the right road shoulder is the most appropriate lateral installation location at this approach 8 12 13 11 12 12Yes, but where space is available an additional sign should alo be installed on the median 0 0 0 2 0 0No, where space is available the signs should be installed on the median only 0 0 0 0 0 0
Other 0 0 0 0 0 0
No benefits 5 1 1 1 1 1In light traffic 4 2 4 4 2 5In moderate traffic which is still flowing 5 9 9 9 7 8In heavy bumper-to-bumper traffic 4 4 7 6 7 5During daytime 4 7 6 7 5 7During nighttime 6 10 10 9 9 9In situations where large vehicles may obstruct some traffic signs 2 4 4 3 4 4
Other 1 1 1 2 1 1Well from far enough 6 2 2 3 2 3From far enough 5 8 9 6 7 7Just barely from far enough 1 3 2 4 3 3Just barely from not far enough 0 0 0 0 0 0Clearly not from far enough 0 0 0 0 1 0Other 0 0 0 0 0 0
Sites
Q4: In what situations do youthink will the benefits of thediagrammatic entrance rampapproach signs be greatest atthis site ?
Q5: From how far ahead couldyou recognize all features onthe ground mounteddiagrammatic entrance rampapproach signs at thisapproach ?
Q3: Keeping in mind spaceand cost considerations, is theright road shoulder the mostappropriate lateral location atthis particular approach ?
Q1: In your opinion, howhelpful is the informationprovided by the diagrammaticentrance ramp approach signsthat are installed in addition tothe existing signing at this site?
Q2: How may diagrammaticentrance ramp approach signsshould be used for thisapproach and what are the bestadvance distances ?

48
Figure 42 shows the evaluator responses to question 1. This question focused on the overall usefulness of diagrammatic entrance ramp approach signs on each of the test sites evaluated. Generally, the evaluators considered the diagrammatic signs to be very helpful or helpful. Only few evaluators thought that the diagrammatic signs would be helpful on Plain City Georgesville (SR 142), and Brice Road. The Plain City Georgesville Road (SR 142) installation is unsuitable for diagrammatic signs, because the approach has a very low traffic volume, and is essentially a rural two-lane road. The Brice Road diagrammatic sign installation was considered to be only somewhat helpful, because the preexisting guide signing was already excellent (overhead sign bridge). The SR 315 fared very well because this approach is quite counterintuitive for an unfamiliar driver. Figure 43 indicates that most evaluators think that one or two diagrammatic guide signs are sufficient. The placement of ½ mile and ¼ mile in advance of the interchange (first gore) was generally considered to be adequate, as long as no major cross streets exist between the diagrammatic sign and the first gore of the interchange. Figure 44 shows the evaluator questionnaire responses for question 3, which focused on the lateral placement of the diagrammatic guide signs. Generally, for those evaluators who thought that diagrammatic guide signs are useful, it can be seen that the right road shoulder was considered to be the most appropriate sign location. No clear opinion crystallized regarding the most appropriate traffic situation that would call for the deployment of diagrammatic guide signs (Figure 45). Figure 46 shows that most evaluators felt that the guide sign designs were visible and legible enough for the intended application. Overall, it seems that ground mounted diagrammatic guide signs should not be used in situations where low traffic volumes exist, in situations that are essentially two lane rural approaches with lane extensions only in the immediate interchange area, and in situations where the preexisting guide signing is already about ½ to ¼ mile in advance of the interchange and conveys unambiguous guide information. Ground mounted diagrammatic guide signs are best suited in approaches that are counterintuitive to unfamiliar drivers. The application of two right shoulder mounted diagrammatic guide signs located ½ mile and ¼ mile prior to the first gore of the interchange seems to be a reasonable use of resources for the evaluators who participated in this study.

49
0123456789
10111213
Very helpful Helpful Somewhathelpful
Marginallyhelpful
Not helpful,existing
signing issufficient
Other
Choices
Cou
nt (N
tota
l = 1
3 E
valu
ator
s)
Plain City, SR 142Hilliard RomeRoberts RoadSR 315Brice RoadGeorgesville Road
Q1: In your opinion, how helpful is the information provided by the diagrammatic entrance ramp approach signs that are installed in addition to the existing signing at this site ?
Figure 42. Question Number 1, ODOT/FHWA Evaluator Responses
0
1
2
3
4
5
6
7
8
9
10
11
12
13
None, existingsigning issufficient
One Two Three More Other
Choices
Cou
nt (N
tota
l = 1
3 E
valu
ator
s)
Plain City, SR 142Hilliard RomeRoberts RoadSR 315Brice RoadGeorgesville Road
Q2: How may diagrammatic entrance ramp approach signs should be used for this approach and what are the best advance distances ?
Figure 43. Question Number 2, ODOT/FHWA Evaluator Responses

50
0123456789
10111213
No diagrammaticentrance rampapproach signsneeded, existing
signs aresufficient
Yes, the rightroad shoulder is
the mostappropriate lateral
installationlocation at this
approach
Yes, but wherespace is availablean additional sign
should alo beinstalled on the
median
No, where spaceis available thesigns should beinstalled on the
median only
Other
Choices
Cou
nt (N
tota
l = 1
3 E
valu
ator
s)
Plain City, SR 142Hilliard RomeRoberts RoadSR 315Brice RoadGeorgesville Road
Q3: Keeping in mind space and cost considerations, is the right road shoulder the most appropriate lateral location at this particular approach ?
Figure 44. Question Number 3, ODOT/FHWA Evaluator Responses
0123456789
10111213
No benefits In light traff ic In moderatetraff ic w hich
is stillf low ing
In heavybumper-to-
bumpertraff ic
Duringdaytime
Duringnighttime
In situationsw here largevehicles may
obstructsome traff ic
signs
Other
Choices
Cou
nt (N
tota
l = 1
3 E
valu
ator
s)
Plain City, SR 142Hilliard RomeRoberts RoadSR 315Brice RoadGeorgesville Road
Q4: In what situations do you think will the benefits of the diagrammatic entrance ramp approach signs be greatest at this site ?
Figure 45. Question Number 4, ODOT/FHWA Evaluator Responses

51
0
1
2
3
4
5
6
7
8
9
10
11
12
13
Well from farenough
From farenough
Just barelyfrom farenough
Just barelyfrom not far
enough
Clearly notfrom farenough
Other
Choices
Cou
nt (N
tota
l = 1
3 E
valu
ator
s)
Plain City, SR 142Hilliard RomeRoberts RoadSR 315Brice RoadGeorgesville Road
Q5: From how far ahead could you recognize all features on the ground mounted diagrammatic entrance ramp approach signs at this approach ?
Figure 46. Question Number 5, ODOT/FHWA Evaluator Responses

52
6 EVALUATION OF THE EXPERIMENTAL GUIDE SIGNING SYSTEMS USING 20 UNFAMILIAR DRIVERS IN AN EXPERIMENTAL INSTRUMENTED VEHICLE
A total of 21 and 19 unfamiliar test drivers were recruited under the before and after condition, respectively, to further evaluate the usefulness of the diagrammatic entrance ramp approach signs for unfamiliar drivers. Approximately half of the subjects visited the test sites in the order of Brice Road, SR 315, Roberts Road, Hilliard Rome Road, Plain City Georgesville Road (SR 142), and Georgesville Road. The remaining subjects visited the test sites in the reverse order.
A screening questionnaire was designed to determine the familiarity of the subjects with
the Greater Columbus area. Care was taken in the design of the questionnaire to ensure that the subjects did not detect the actual objective of the experiment. None of the questions directly addressed issues of familiarity with the Greater Columbus area, however, the questionnaire revealed enough information about each subject for us to be reasonably sure that the subjects were not familiar with the Greater Columbus area. An exit interview that was administered after the experiment then probed fairly deeply into the familiarity of the subjects with the interchanges they had just visited. None of the subjects had to be excluded due to familiarity. Also, the reader should note, that for reasons of familiarity, none of the subjects who were recruited for the before condition were allowed to participate in the after condition, or in any other test driving tasks in this study.
The subjects were staged on parking lots well in advance of the interchanges. A passenger experimenter was present in the vehicle at all times to give instructions. After the subjects completed their consent form paperwork, they were allowed to start driving and to merge with the traffic on the multi lane arterials leading to the corresponding freeway interchanges. Typically, this occurred about three miles in advance of the corresponding interchange. The experimenter told the subjects to find their way to a specific freeway entrance ramp, for example to I 270 Northbound. The experimenter made sure that the subjects always started out in the wrong lane for accessing the freeway in the direction given by the experimenter.
The vehicle was equipped with a forward-looking video camera, a Distance Measuring
Instrument (DMI), and with an audio recording system. The variable of interest was the distance to the first gore at which the subject realized that he or she was in the wrong lane and a lane change had to be performed. All runs were performed at night because this allowed for more efficient driving as the selected interchanges often experience massive travel time delays during the daytime.
Figure 47 to Figure 52 show the cumulative distributions of the lane change occurrences
for each one of the interchanges used in the study. The positive effect of the diagrammatic signs that were located in advance of the interchanges is quite striking. With the exception of the Plain City Georgesville (SR 142) interchange (Figure 52), all distributions clearly show that the lane change from the wrong lane to the correct lane was initiated much earlier under the after condition. The Plain City Georgesville (SR 142) interchange is simply not suited for diagrammatic entrance ramp approach signs located in advance of the interchange, because the approach to this interchange is a two-lane rural road.

53
0%
10%
20%
30%
40%
50%
60%
70%
80%
90%
100%
0 100 200 300 400 500 600 700 800 900 1000Lane Change Distance from Gore [m]
Cum
ulat
ive
%
Before, Average= 413 m,Stdev= 180 m, N= 20After, Average= 675 m,Stdev= 138 m, N= 21
SR 315 Interchange with I 270
Figure 47. SR 315 Southbound Interchange with I 270, Lane Change Distance to Gore
0%
10%
20%
30%
40%
50%
60%
70%
80%
90%
100%
0 500 1000 1500 2000Lane Change Distance from Gore [m]
Cum
ulat
ive
%
Before, Average= 720 m,Stdev= 256 m, N= 19 (Datafor one subject lost)After, Average= 1064 m,Stdev= 169 m, N= 21
Brice Road Northbound Interchange with I 70
Figure 48. Brice Road Northbound Interchange with I 70, Lane Change Distance to Gore

54
0%
10%
20%
30%
40%
50%
60%
70%
80%
90%
100%
0 500 1000 1500 2000Lane Change Distance from Gore [m]
Cum
ulat
ive
%
Before, Average= 253 m,Stdev= 73 m, N= 19 (Data forone subject lost)After, Average= 987 m,Stdev= 360 m, N= 15 (Datalost for 6 subjects)
Georgesville Interchange with I 270
Figure 49. Georgesville Road Interchange with I 270, Lane Change Distance to Gore
0%
10%
20%
30%
40%
50%
60%
70%
80%
90%
100%
0 500 1000 1500 2000
Lane Change Distance from Gore [m]
Cum
ulat
ive
%
Before, Average= 208m, Stdev= 165 m, N= 17(3 Subjects did notswitch lane)After, Average= 1053m, Stdev= 125 m, N= 21
Roberts Road Interchange with I 70
Figure 50. Roberts Road Interchange with I 270, Lane Change Distance to Gore

55
0%
10%
20%
30%
40%
50%
60%
70%
80%
90%
100%
0 100 200 300 400 500 600 700 800 900 1000Lane Change Distance from Gore [m]
Cumulative%
Before, Average= 214 m,Stdev= 130 m, N= 20After, Average= 538 m,Stdev= 254 m, N= 21
Hilliard Romje Road Interchangewith I 270
Figure 51. Hilliard Rome Road Interchange with I 270, Lane Change Distance to Gore
Figure 52. Plain City Georgesville Road (SR 142) Southbound Interchange with I 70, Lane Change Distance to Gore
0%
10%
20%
30%
40%
50%
60%
70%
80%
90%
100%
0 100 200 300 400 500 600 700 800 900 1000
Distance from Gore, (m)
Cumulative %
Before, Average=296 m, Stdev=215m, N=19(one subject did not change lanes)
Before, Average=296 m,Stdev=215m, N=19
Plain City Georgesville (SR142) Interchange with I 70

56
Figure 53 shows the combined lane change distances for all interchanges. Again, the after condition (diagrammatic signs present), clearly shows a substantial, statistically highly significant (t0.025,215=10.1, P < 0.0001) improvement in terms of lane change distance.
Overall, for the test driver experiment, it can be concluded that the diagrammatic entrance ramp approach signs located in advance of the interchange are excellent tools to convey lane choice information to unfamiliar motorists approaching a highway-freeway interchange.
0%
10%
20%
30%
40%
50%
60%
70%
80%
90%
100%
0 500 1000 1500 2000
Lane Change Distance from Gore [m]
Cum
ulat
ive
Per
cent
age
Before, Average= 353 m,Stdev= 251 m, N= 114After Average= 757 m,Stdev= 354 m, N= 120
Figure 53. Lane Change Distance to Gore, Combined for All Interchanges used in Study
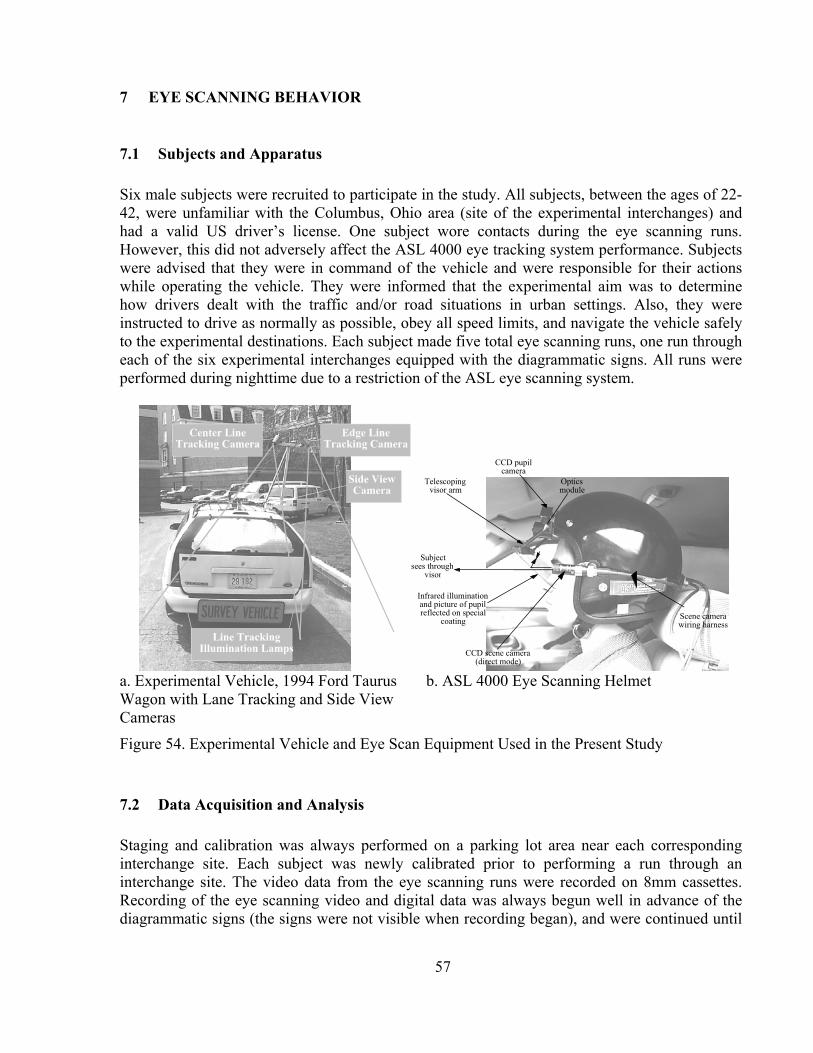
57
7 EYE SCANNING BEHAVIOR
7.1 Subjects and Apparatus Six male subjects were recruited to participate in the study. All subjects, between the ages of 22-42, were unfamiliar with the Columbus, Ohio area (site of the experimental interchanges) and had a valid US driver’s license. One subject wore contacts during the eye scanning runs. However, this did not adversely affect the ASL 4000 eye tracking system performance. Subjects were advised that they were in command of the vehicle and were responsible for their actions while operating the vehicle. They were informed that the experimental aim was to determine how drivers dealt with the traffic and/or road situations in urban settings. Also, they were instructed to drive as normally as possible, obey all speed limits, and navigate the vehicle safely to the experimental destinations. Each subject made five total eye scanning runs, one run through each of the six experimental interchanges equipped with the diagrammatic signs. All runs were performed during nighttime due to a restriction of the ASL eye scanning system.
Opticsmodule
CCD pupilcamera
Telescopingvisor arm
Subjectsees through
visor
Infrared illuminationand picture of pupilreflected on special
coating
CCD scene camera(direct mode)
Scene camerawiring harness
a. Experimental Vehicle, 1994 Ford Taurus Wagon with Lane Tracking and Side View Cameras
b. ASL 4000 Eye Scanning Helmet
Figure 54. Experimental Vehicle and Eye Scan Equipment Used in the Present Study
7.2 Data Acquisition and Analysis Staging and calibration was always performed on a parking lot area near each corresponding interchange site. Each subject was newly calibrated prior to performing a run through an interchange site. The video data from the eye scanning runs were recorded on 8mm cassettes. Recording of the eye scanning video and digital data was always begun well in advance of the diagrammatic signs (the signs were not visible when recording began), and were continued until

58
the driver exited the vehicle back at the staging area. No clues as to the exact nature of the study, whatsoever, were given to the subject prior to, during, and after the experiment.
The analysis focused on the looking behavior of the subjects in the vicinity of the
diagrammatic entrance ramp approach signs. A separate analysis was conducted for each diagrammatic sign location and for each subject. The first look and last distance to each diagrammatic sign was carefully extracted from the video records. Also, looking behavior was analyzed with regard to number and duration of looks to each diagrammatic sign.
The initial step of the data analysis was to determine the relative location of each
diagrammatic sign in question with respect to the mileage counter shown on the video record. The exact longitudinal location of each diagrammatic sign thus became the origin of the longitudinal coordinate system for each video record. The distances at which looks to the diagrammatic signs were performed always related to the origin of the corresponding diagrammatic sign. Once the origin of a diagrammatic sign for a given video record (subject) was found, the video was stepped back and paused at the point, where the diagrammatic sign came into the field of view for the first time, at a long distance ahead. The looks during the approach were analyzed frame by frame. Each sign of interest had a virtual boundary (Figure 55) that extended the sign dimensions by approximately 15% in each direction. A fixation to a diagrammatic guide sign was defined as the duration from when the gaze crosshairs entered the virtual boundary to when the gaze crosshairs exited the virtual boundary. One or two frames where the crosshairs were outside the virtual boundary did not terminate a fixation, provided that the crosshairs immediately returned to the inside of the boundary. In most cases, a fixation ends in an unambiguous saccade away from the sign (virtual boundary) to another object (usually the road environment).
DiagrammaticSign
Virtual Boundaryof Sign, ExtendingSign Dimensionsby 15% in each
Direction
Figure 55. Virtual Boundary Used for Analysis of Eye Fixation Video Records

59
An automatic analysis was not possible, because the head movements were not tracked and thus, the eye tracker coordinate system was constantly moving with the subject’s head. However, even if head movements were tracked, one could still not perform a completely automatic analysis, because the ASL proprietary algorithm that determines the begin and end of a fixation does not consider moving objects such as a traffic sign seen from a moving car. The x,y gaze coordinates constantly change during an approach to a sign, even during a definite fixation of the sign. This coordinate change is due to smooth pursuit eye movements that are necessary to keep the sign fixated. With present technology, there seems to be no better way than to analyze the video record frame by frame.
When a look began the numbers from the mileage counter and the frame counter were
recorded. In addition, these same observations were made when the look ended. This procedure was repeated for each look the driver made while approaching the signs. The total duration of each look was calculated by subtracting the beginning frame count from the ending frame count and converting this number (total frames associated with the look) into seconds. Also, the distances at which each look began were calculated by subtracting the number on the mileage counter when the look began from the determined location of the sign. This data was recorded separately for each interchange in Microsoft Excel format.
7.3 Results Because the diagrammatic entrance ramp approach signs were novel and different in appearance from the traditional trailblazer assemblies, particular interest was given to the number of looks that drivers made to the diagrammatic signs, the distance at which the first and last looks occurred, and the duration of the first and last looks. Traffic signs that elicit more than about four looks may be considered distractive to an unacceptable extent.
The average number of looks for each diagrammatic sign is shown in Figure 56. Overall,
the average number of looks to the first diagrammatic sign of the approaches was 2.82 and 2.02 for the second diagrammatic sign (where present) of the approaches. This average number of looks indicates that the diagrammatic signs are noticed, and that they do not unduly distract a driver.
The average look duration to the diagrammatic signs is illustrated in Figure 57 for the
first diagrammatic sign in each approach, and Figure 58 for the second diagrammatic sign (where present) in the approaches. Overall, the average first look durations were 0.74 seconds and 0.66 seconds for the first and second diagrammatic signs, respectively. The average last look durations were 0.68 seconds and 0.62 seconds for the first and second diagrammatic signs, respectively. These look durations fall well within the range of acceptance, and compare well with the sign reading times given by Zwahlen in [17]. The observed sign reading times indicate a normal level of information processing and do not appear to be unduly long.

60
3.00
3.50
2.17
2.83
2.40
3.002.75
1.33
2.80
1.20
0.00
0.50
1.00
1.50
2.00
2.50
3.00
3.50
4.00
Brice, n=6 Georgesville,n=4
Roberts, n=6 US315, n=6 SR142, n=6 Hillard, n=6
Interchange
Num
ber o
f Loo
ks
Diagrammatic Sign #1, Ave.=2.82Diagrammatic Sign #2, Ave.=2.02
(Note: not all interchanges contained two diagrammatic signs.)
Figure 56. Average Number of Eye Fixations Per Diagrammatic Sign.
0.73
0.96
0.46
0.57
1.01
0.70
0.44
0.72
0.51
0.94
0.740.71
0
0.2
0.4
0.6
0.8
1
1.2
BriceFirst N=5Last N=6
GeorgesvilleFirst N=4Last N=4
RobertsFirst N=6Last N=6
US315First N=5Last N=5
SR142First N=5Last N=5
HillardFirst N=6Last N=6
Interchange
Ave
rage
Dur
atio
n of
Loo
ks
Diagrammatic Sign #1, First Look, Ave.=0.74s
Diagrammatic Sign #1, Last Look, Ave.=0.68s
Figure 57. Average Duration of Eye Fixation [seconds] at the First Diagrammatic Sign of each
Interchange.

61
0.42
0.55
0.63
1.05
0.58
0.67
0.53
0.67
0
0.2
0.4
0.6
0.8
1
1.2
Brice GeorgesvilleFirst N=4Last N=4
Roberts US315First N=5Last N=5
SR142First N=5Last N=5
HillardFirst N=4Last N=4
Interchange
Ave
rage
Dur
atio
n of
Loo
ks
Diagrammatic Sign #2, Firs t Look, Ave.=0.66s
Diagrammatic Sign #2, Las t Look, Ave.=0.62s
Figure 58. Average Duration of Eye Fixation at the Second Diagrammatic Sign (Where Present)
of each Interchange.
The first and last look distances are important dependent variables. With the help of the
first look distance, one can determine, approximately where a driver starts to extract visual information provided by a diagrammatic guide sign. The last look distance indicates, approximately where a driver no longer pays attention to the sign. A diagrammatic sign must be designed and placed in such a way as to become completely visible and legible between the first look distance and the last look distance. The box plots shown in Figure 59 and Figure 60 give a graphical representation of the first and last look distances for the experimental interchanges and the overall look behaviors.
Figure 59 shows that the overall median first look to the first diagrammatic sign of the
approaches occurs 123m prior to reaching the diagrammatic sign, and that the last look occurs 48m prior to the sign. The overall median first look distance to the second sign in the approaches (Figure 60) is 104m, somewhat shorter than the corresponding distance at the first sign. The second diagrammatic sign of the approach serves, most likely, as a confirmation to the first sign. Thus, less processing is expected and also quantitatively observed (second sign has shorter average fixation durations and lower average number of looks).

62
0 50 100 150 200 250 300 350Units
FLD-1:BriceRoad
FLD-1:Georgesville
FLD-1:Hillard
FLD-1:Roberts
FLD-1:SR142
FLD-1:US315
FLD-1:z
LLD-1:BriceRoad
LLD-1:Georgesville
LLD-1:Hillard
LLD-1:Roberts
LLD-1:SR142
LLD-1:US315
LLD-1:z
Box PlotGrouping Variable(s): IntersectionRow exclusion: summary.svd
Meters
Georgesville, N=4 (4 Subjects Total)
Hillard, N=6
Roberts, N=6
SR142, N=5 (1 Video Problem)
US315, N=4 (1 No Looks, 1 Video Problem)
Overall, N=31
Brice, N=6
Overall, N=31
SR142, N=5 (1 Video Problem)
Roberts, N=6
Hillard, N=6
Georgesville, N=4 (4 Subjects Total)
Brice, N=6
Last Look Distances,Diagrammatic Sign #1
Diagrammatic Sign isExample Only
US315, N=4 (1 No Looks, 1 Video Problem)
First Look Distances,Diagrammatic Sign #1
Lower limit: Q1 – 1.5(Q3 – Q1)
Upper limit: Q1 + 1.5(Q3 – Q1)
Median
Outlier
Q1
Q3
Figure 59. Box Plots of Look (Fixation) Distances, Diagrammatic Sign #1
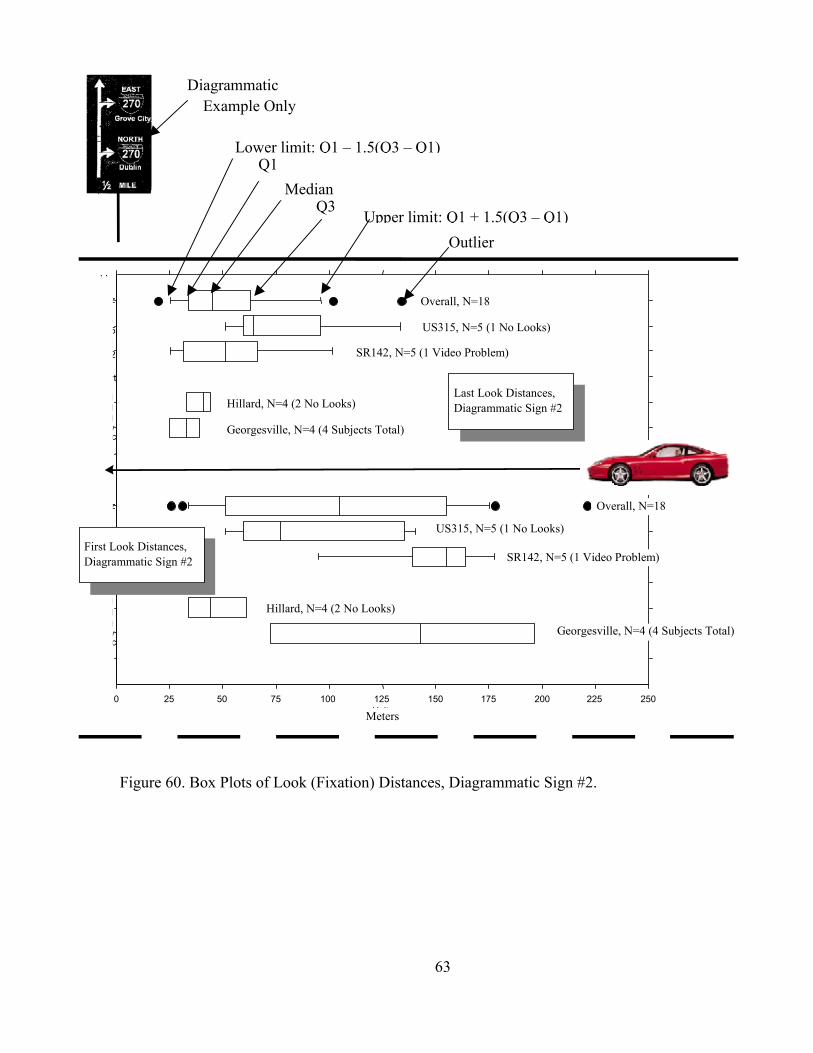
63
0 25 50 75 100 125 150 175 200 225 250Units
FLD-2:BriceRoad
FLD-2:Georgesville
FLD-2:Hillard
FLD-2:Roberts
FLD-2:SR142
FLD-2:US315
FLD-2: z
LLD-2:BriceRoad
LLD-2:Georgesville
LLD-2:Hillard
LLD-2:Roberts
LLD-2:SR142
LLD-2:US315
LLD-2: z
Box PlotGrouping Variable(s): IntersectionRow exclusion: summary.svd
Meters
Last Look Distances,Diagrammatic Sign #2
Overall, N=18
US315, N=5 (1 No Looks)
SR142, N=5 (1 Video Problem)
Hillard, N=4 (2 No Looks)
Georgesville, N=4 (4 Subjects Total)
Overall, N=18
SR142, N=5 (1 Video Problem)
Hillard, N=4 (2 No Looks)
First Look Distances,Diagrammatic Sign #2
Georgesville, N=4 (4 Subjects Total)
US315, N=5 (1 No Looks)
DiagrammaticExample Only
Lower limit: Q1 – 1.5(Q3 – Q1)
Upper limit: Q1 + 1.5(Q3 – Q1)
Median
Outlier
Q1
Q3
Figure 60. Box Plots of Look (Fixation) Distances, Diagrammatic Sign #2.

64
8 THEORETICAL LANE CHANGE PROBABILITIES The main goal of a diagrammatic entrance ramp approach sign is to give unfamiliar drivers adequate advance guidance information to select the proper lane on a multi-lane arterial leading to a freeway entrance. The main purpose of this analysis was to investigate the probabilities of making a successful lane change during the before condition (without diagrammatic signs) and the after condition (with diagrammatic signs). It is evident, that the advance location of the diagrammatic signs, combined with their fairly long legibility distances, will allow unfamiliar drivers to initiate a lane change much earlier than would be possible with preexisting trailblazer assemblies that are located in the interchange area. Assuming very heavy traffic conditions at or near capacity, an unfamiliar driver needs every bit of advance guidance information to make his or her way across the lanes towards the desired freeway entrance. The increased lane change opportunity distance (LCOD) for making a required lane change when diagrammatic signs are used, translates in an increased probability that the lane change can actually be accomplished. Unfamiliar drivers will appreciate this.
8.1 Method An analytical model was developed, assuming an unfamiliar driver who is approaching a freeway interchange in the wrong lane (similar to the test drivers used in section 5). This situation is depicted in Figure 61. The unfamiliar driver (vehicle A) is faced with the dilemma of the freeway entrance lane blocked by vehicles moving nearly at the same speed. The unfamiliar driver needs to find an acceptable gap to merge with the stream of blocking vehicles prior to reaching the desired freeway entrance ramp gore. However, the unfamiliar driver in vehicle A cannot initiate the lane change attempt before he or she has read the diagrammatic entrance ramp approach sign. The distance from the point, where the diagrammatic sign is completely legible to the freeway entrance gore is called the Lane Change Opportunity Distance (LCOD). The goal of this analysis is to find the probability that the unfamiliar driver in vehicle A can locate an acceptable gap in the stream of blocking vehicles, prior to reaching the gore. Obviously, this probability will be much higher when guide signs are placed well in advance of the interchange than when only trailblazer assemblies at the interchange are used. The model was based on headway gap and speed data obtained from the Mobilizer PC video observation task (see section 2). Any simple analytic model like the one discussed above requires that the headways between the blocking vehicles in the real world are not serially autocorrelated. That is, the headway of vehicle i needs to be independent of the headway of vehicle i+1, i+2, etc. The independence of successive headway gaps was tested for the data obtained from the Mobilizer PC. A typical plot of the headway generated by vehicle i and the vehicle i+1 is shown in Figure 62. All data obtained from Mobilizer PC at the interchanges where the video cameras were deployed, indicates that successive headways were indeed independent and not serially autocorrelated. Therefore, it was possible to perform the closed form analytical analysis of the lane change probability under the before and after condition without the need for stochastic simulation.

65
Blocking vehiclesmoving at V withMedian Headway
Vehicle A that needsto merge to left,
moves at V + Delta V
Location of FirstDiagrammatic Sign,
When Legible,Initiates Lane Change
of Vehicle A
SignLegibilityDistance
Signbecomes
legible here,Vehicle Ainitiates
LaneChange
LaneChange
OpportunityDistance
LCOD
Entrance to FreewayVehicle A Intends to
Take
Figure 61. Model Used to Determine the Theoretical Lane Change Probability

66
0
20
40
60
80
100
120
0 20 40 60 80 100 120
Headway Gap i (m)
Hea
dway
Gap
i+1
(m)
Brice InterchangeLocation 1Before Condition, Left Lane
Figure 62. Typical Scatter Plot of Successive Headway Gaps.
The length of the roadway system in the model was based on the lane change opportunity
distance (LCOD), the sum of the distance from the gore to the first guide sign of the approach and the legibility distance of the corresponding sign. The roadway model, consisting of two lanes moving in the same direction of travel, was split into two separate groups:
• Goal lane, the lane which merging drivers were attempting to gain access to • Start lane, the lane where merging drivers began the approach
As previously noted, the headway behavior of the drivers in the goal lane was based on
actual observed data from Mobilizer PC. The goal lane consisted of automobiles separated by the median observed headway gap, traveling at the observed median speed. The start lane consisted of a single automobile traveling at a given speed, which was in the range of plus/minus ten MPH of the speed of automobiles in the goal lane. The number of lane change opportunities, the number of gaps in the LCOD, was found by first computing the lane change opportunity time (LCOT), defined as
VVLCODLCOTT ∆+
=
where TV is defined as the speed of the automobiles in the goal lane and V∆ is defined as the difference in speed of the automobile in the start lane from the automobiles in the goal lane.

67
The LCOT represents the time available to the driver in the start lane to complete a merge into the goal lane. LCOT is the time from the instance the diagrammatic sign becomes legible to reaching the entrance ramp gore. The number of lane change opportunities will differ from the number of gaps in the LCOD because the automobiles in both lanes are moving toward the gore at nearly identical speeds. To find the number of lane change opportunities available to the driver in the start lane we must find the Adjusted LCOD (the distance that the automobile in the start lane gains or loses, relative to the adjacent automobiles in the goal lane prior to reaching the gore). Dividing the Adjusted LCOD by the sum of the given car lengths and the median headway gap and truncating, yields the number of lane change opportunities. Further, each individual driver in the merging vehicle has a threshold for an acceptable gap to attempt a merging maneuver. This acceptable gap was defined as a function of car lengths, ranging from one car length to four car lengths. From the headway gap data, obtained from Mobilizer PC, cumulative headway gap distributions were created. For each defined acceptable gap length, the cumulative distributions were used to find the probability that any headway gap in the roadway system will be smaller than this value. This probability raised to the power equals to the number of lane change opportunities yields the total probability that an acceptable gap will not be available to the driver in the start lane. Finally, subtracting this value from one yields the probability that a driver will find an acceptable merging gap based on the drivers speed and threshold of acceptable gaps.
8.2 Results To compare the probabilities of making a successful lane change during each condition, graphs were created for Brice Road (one diagrammatic sign) and Georgesville Road (two diagrammatic signs). The graphs shown in Figure 63 and Figure 64 illustrate the probabilities associated with the before and after conditions at Georgesville and Brice Road, respectively. In each figure, the speed of the automobiles in the goal lane is 11.3ms-1 (25 MPH). The relative speed difference between the vehicles in the goal lane and the merging vehicle is given along the abscissa of the graphs. Looking at both graphs, it is easy to see that the probability of a successful lane change is smallest if the vehicles in the goal lane and the merging vehicle are driving at the same speed (middle of the graphs). The advance location of the diagrammatic signs represents a major benefit in terms of raising the probability that a lane change can be successfully made. This theoretical quantification of a benefit for unfamiliar drivers corroborates very well the findings of the eye movement experiment and the experiment with the unfamiliar test drivers.

68
0.00
0.20
0.40
0.60
0.80
1.00
1.20
4.5 2.2 0.9 0.4 0.0 -0.4 -0.9 -2.2 -4.5Velocity Difference From VT of Merging Vehicle (m/sec.)
Prob
abili
ty o
f Lan
e C
hang
e
Georgesville, After Condition, Daylight, LCOD=845m, Acc. Gap=20mGeorgesville, Before Condition, Daylight, LCOD=305m, Acc. Gap=20mGeorgesville, After Condition, Daylight, LCOD=845m, Acc. Gap=15mGeorgesville, Before Condition, Daylight, LCOD=305m, Acc. Gap=15m
VT=11.3m/sec., Vehicle Length=5m, Median Gap(After)=24mMedian Gap(Before)=29m
a. Daytime Condition, VT of Vehicles in Goal Lane 11.3ms-1 (25 MPH)
0.00
0.20
0.40
0.60
0.80
1.00
1.20
4.5 2.2 0.9 0.4 0.0 -0.4 -0.9 -2.2 -4.5Velocity Difference From VT of Merging Vehicle (m/sec.)
Prob
abili
ty o
f Lan
e C
hang
e
Georgesville, After Condition, Night, LCOD=803m, Acc. Gap=20mGeorgesville, Before Condition, Night, LCOD=152m, Acc. Gap=20mGeorgesville, After Condition, Night, LCOD=803m, Acc. Gap=15mGeorgesville, Before Condition, Night, LCOD=152m, Acc. Gap=15m
VT=11.3m/sec., Vehicle Length=5m, Median Gap(After)=24mMedian Gap(Before)=29m
b. Nighttime Condition, VT of Vehicles in Goal Lane 11.3ms-1 (25 MPH)
Figure 63. Probability of Making a Successful Lane Change During Before and After Conditions at Georgesville Road.

69
0.00
0.20
0.40
0.60
0.80
1.00
1.20
4.5 2.2 0.9 0.4 0.0 -0.4 -0.9 -2.2 -4.5
Velocity Difference From VT of Merging Vehicle (m/sec.)
Prob
abili
ty o
f Lan
e C
hang
e
Brice, After Condition, Daylight, LCOD=1405m, Acc. Gap=20mBrice, Before Condition, Daylight, LCOD=305m, Acc. Gap=20mBrice, After Condition, Daylight, LCOD=1405m, Acc. Gap=15mBrice, Before Condition, Daylight, LCOD=305m, Acc. Gap=15m
VT=16.6m/sec., Vehicle Length=5m, Median Gap(After)=32mMedian Gap(Before)=35m
a. Daytime Condition, VT of Vehicles in Goal Lane 11.3ms-1 (25 MPH)
0.00
0.20
0.40
0.60
0.80
1.00
1.20
4.5 2.2 0.9 0.4 0.0 -0.4 -0.9 -2.2 -4.5
Velocity Difference From VT of Merging Vehicle (m/sec.)
Prob
abili
ty o
f Lan
e C
hang
e
Brice, After Condition, Night, LCOD=1363m, Acc. Gap=20mBrice, Before Condition, Night, LCOD=152m, Acc. Gap=20mBrice, After Condition, Night, LCOD=1363m, Acc. Gap=15mBrice, Before Condition, Night, LCOD=152m, Acc. Gap=15m
VT=16.6m/sec., Vehicle Length=5m, Median Gap(After)=32mMedian Gap(Before)=35m
b. Nighttime Condition, VT of Vehicles in Goal Lane 11.3ms-1 (25 MPH)
Figure 64. Probability of Making a Successful Lane Change During Before and After Conditions at Brice Road.

70
9 DISCUSSION, CONCLUSIONS, AND APPLICATION GUIDELINES
Ground mounted diagrammatic signs as studied in this research are located on urban multi-lane arterials, well in advance of highway freeway interchanges. These diagrammatic signs provide unfamiliar drivers with more adequate advance navigational information than small trailblazer assemblies located at the interchange. Ground mounted diagrammatic signs should be used in addition to preexisting guide signs where the cost of overhead span type sign bridges cannot be justified and additional guidance to the motorist is desired. The literature review indicated that ground mounted diagrammatic guide signs have been used successfully in Europe for a long time. This research used several measures of effectiveness to determine the merit of similar diagrammatic signs in the US.
Three interchanges (SR 315 interchange with I 270, Georgesville Road interchange with I
270, Brice Road interchange with I 70) were videotaped under the before condition (preexisting guide signing) and under the after condition (preexisting guide signing plus ground mounted diagrammatic signs). The video streams were automatically analyzed using Mobilizer PC. The analysis indicated, that under the after condition (ground mounted diagrammatic signs present), the vehicle speeds were statistically significantly reduced, the vehicle headway gaps were shorter, and the vehicle throughput was statistically significantly higher. These findings suggest that the ground mounted diagrammatic entrance ramp approach signs did not hamper the throughput of automobiles at the experimental interchanges. In fact, an increase in throughput was observed.
A total of 13 ODOT/FHWA Traffic Engineering personnel were recruited to critically
evaluate the design, application, and placement of the ground mounted diagrammatic entrance ramp approach signs at the sites used in this study. Overall, the vast majority of the evaluators considered these diagrammatic signs to be very helpful or helpful. Most evaluators felt that two right shoulder mounted diagrammatic signs (½ mile and ¼ mile advance placement) were desirable.
A total of 21 and 19 unfamiliar test drivers were recruited under the before and after
condition, respectively, to further evaluate the usefulness of the ground mounted diagrammatic entrance ramp approach signs for unfamiliar drivers. The unfamiliar test drivers approached the interchanges in a vehicle that was equipped with an onboard video camera. At the beginning of each approach, the test drivers were set up in the lane farthest away from the lane that allowed access to the freeway in the desired direction. The dependent variable was the distance from the gore at which the unfamiliar drivers completed the lane change to access the entrance ramp to the freeway. Under the after condition (with ground mounted diagrammatic signs), the unfamiliar drivers were able to initiate the lane changes much earlier than under the before condition. Overall, for the test driver experiment, it can be concluded, that the ground mounted diagrammatic entrance ramp approach signs located in advance of the interchange are an excellent tool to convey lane choice information to unfamiliar motorists approaching a highway-freeway interchange.
Eye movement behavior was recorded for six unfamiliar subjects approaching the
interchanges used in this study. The eye movement recordings were performed only under the

71
after condition. The number of eye fixations and the fixation duration to the ground mounted diagrammatic signs were extracted from the eye scanning records. The analysis indicated that the ground mounted diagrammatic signs are noticed by the drivers and that the presence of these diagrammatic signs does not unduly distract them. The first diagrammatic sign in an approach is usually looked at somewhat longer and somewhat more often than the subsequent diagrammatic sign in the approach. This looking behavior is expected, because the second sign, in most cases, serves as confirmation of guidance information that was already conveyed by the first sign.
The theoretical probability that an unfamiliar motorist could complete a required lane
change to access a freeway entrance was calculated using a simple closed form analytical model. The advance location of the ground mounted diagrammatic signs, combined with their fairly long legibility distances, will allow unfamiliar drivers to initiate a lane change much earlier than would be possible with preexisting trailblazer assemblies that are located in the interchange area. Assuming very heavy traffic conditions at or near capacity, an unfamiliar driver needs every bit of advance guidance information to make his or her way across the lanes towards the desired freeway entrance. The increased lane change opportunity distance (LCOD) for making a required lane change when ground mounted diagrammatic signs are used translates into an increased probability that the lane change can actually be accomplished. With little surprise, it was found that the advance location of the ground mounted diagrammatic signs represents a major benefit in terms of raising the probability that a lane change can be successfully made. This theoretical quantification of a benefit for unfamiliar drivers corroborates very well the findings of the eye movement experiment and the experiment with the unfamiliar test drivers.
Based on the results presented in this report, the use of ground mounted diagrammatic
entrance ramp approach signs is recommended on multi-lane arterials leading up to a freeway interchange. Special consideration should be given where one or more of the following conditions exist:
1. An above average percentage of trucks or other large vehicles prevails. To further reduce the
possibility of sign obstruction due to large vehicles, use two staggered (½ mile, ¼ mile) ground mounted diagrammatic signs.
2. An above average percentage of unfamiliar drivers is to be expected. 3. Where the upcoming interchange may be obstructed from direct view during the approach. 4. Where an above average percentage of lane change accidents and/or an above average
percentage of accidents due to erratic last minute maneuvers exists. 5. For interchanges with an unconventional and/or confusing entrance ramp layout.
On two-lane crossroads (one lane in each direction), ground mounted diagrammatic
entrance ramp approach signs are generally not necessary, but can be used if desired without any expected detrimental effects. The Plain City Georgesville interchange used in this study may serve as an example of such an interchange. Intermediate intersections existed at 4 of the 6 locations. This did not affect results. Signs actually performed in spite of this.
On multi-lane arterials where overhead span type sign bridges are in place, the use of
ground mounted diagrammatic entrance ramp approach signs is generally not necessary. The sings on the sign bridge would usually be expected to provide adequate advance information to the motorist regarding entrance ramp configuration, but could be supplemented with ground

72
mounted diagrammatic signs if desired. The Brice Road interchange is an example of an interchange with a sign bridge in place.
Regarding installation location of ground mounted diagrammatic signs, we recommend
that two signs be used during a typical length approach. These diagrammatic signs should be located ½ mile and ¼ prior to the last point of the first gore, where a driver can still gain access to the freeway entrance ramp. Both ground mounted diagrammatic signs should be unobstructed and legible from a distance corresponding to a true preview time of 4.95 seconds (preview time of 3.0 seconds plus 2 fixations of 0.65 seconds duration plus 0.65 seconds for a fixation to the road between the sign fixations). At 45 MPH (72 km/h), this would require an unobstructed legibility distance of approximately 100m (328 ft). If possible, the sign should be legible at this distance. Also, if possible, the driver should have an unobstructed view of the ground mounted diagrammatic sign at 125m (median first look distance). However, the ground mounted diagrammatic signs need not be legible at that distance.
In situations where a very high percentage of large vehicles exists, ODOT may consider
two ground mounted diagrammatic signs per longitudinal location (½ mile, ¼ mile), with one sign being installed on the right road shoulder and the other sign being installed on the median.

73
10 REFERENCES [1] Ohio Department of Transportation, Ohio Manual of Uniform Traffic Control Devices for
Streets and Highways, Division of Operations, Bureau of Traffic, Columbus, Ohio, 1972 [2] US Department of Transportation, Manual of Uniform Traffic Control Devices for Streets
and Highways, Federal Highway Administration, 1988 [3] Ohio Department of Transportation, Standard Sign Design Manual, Bureau of Traffic,
Columbus, Ohio, 1994 [4] Opland, William H., Application of Positive Guidance at a Freeway Split in Michigan,
Michigan Report No. TSD-473-81, Prepared for the Michigan Department of Transportation, October 1981.
[5] Berger, Wallace G., Criteria for the Design and Deployment of Advanced Graphic Guide Signs, Report for U.S. Dept. of Transportation, Sept. 1970.
[6] Opland, William H., A Positive Guidance Evaluation of a Diagrammatic Signing System, Report to the State of Michigan State Transportation Commission, 1981.
[7] Wyoming State Highway Department, Evaluation of Diagrammatic Signing, Internal Report. [8] Hanscom, Fred R., Evaluation of Diagrammatic Signing at Capital Beltway Exit No. 1,
Report to the Virginia highway Research Council, Sept. 1971. [9] Shepard, Frank D., The Effect of Diagrammatic Signing at High Speed Interchanges, Report
for the Virginia Highway Research Council, May 1974. [10] Roberts A. W., Diagrammatic Sign Study, Report for the Bureau of Safety and Traffic of the
New Jersey Dept. of Transportation, March 1971. [11] King G.F., Urban Area Highway Guide Signing, Summary of Unpublished Reports,
NCHRP, 1973. [12] Mast, Truman M. and Kolsrud, Gretchen S., Diagrammatic Guide Signs for Use on
Controlled Access Highways Vol. 1, 2, 3. Report for Traffic Systems Division, Office of Research, Federal Highway Administration, 1972.
[13] Shepard, Frank D., Sign Legibility for Modified Messages, Report for the Virginia Highway Research Council, June 1987.
[14] Gordon, Donald A., The Informational Load of Highway Guide Signs, Report for The Department of Transportation, Federal Highway Administration, July 1981.
[15] Fenno, David W., Hawkins, H. Gene Jr., Three Methods Used to Evaluate Texas Highway Guide Sign Legibility, A Paper Submitted for Presentation at the Annual Meeting of the Transportation Research Board, August 1996.
[16] Zwahlen H.T., Sunkara M., Schnell T., Review of Legibility Relationships Within the Context of Information Presentation, Transportation Research Record 1485, pp. 61-70, Transportation Research Board, National Research Council, Washington, DC., 1995
[17] Zwahlen H.T., Traffic Sign Reading Distances And Sign Reading Times When Driving At Night, Transportation Research Record 1495, pp. 140-6, Transportation Research Board, National Research Council, Washington, DC., 1995
[18] Tignor, S., et al., Innovative Traffic Control Technology and Practice in Europe, FHWA Report Number FHWA-PL-99-021, US Department of Transportation, Federal Highway Administration, 1999