
Rural/Urban Divides in Mobile Coverage Expansion · · 2016-09-22Rural/Urban Divides in Mobile...
20
Evans School Policy Analysis and Research Group (EPAR) Rural/Urban Divides in Mobile Coverage Expansion Pierre Biscaye & C. Leigh Anderson Evans School Policy Analysis & Research Group (EPAR) Evans School of Public Policy & Governance, University of Washington, Seattle, USA June 14, 2016 2016 APPAM International Conference Inequalities: Addressing the Growing Challenge for Policymakers Worldwide
Transcript of Rural/Urban Divides in Mobile Coverage Expansion · · 2016-09-22Rural/Urban Divides in Mobile...

Evans School Policy Analysis and Research Group (EPAR)
Rural/Urban Divides in Mobile Coverage Expansion
Pierre Biscaye & C. Leigh AndersonEvans School Policy Analysis & Research Group (EPAR)
Evans School of Public Policy & Governance,University of Washington, Seattle, USA
June 14, 2016
2016 APPAM International ConferenceInequalities: Addressing the Growing Challenge for Policymakers Worldwide

Evans School Policy Analysis and Research Group (EPAR)
• Research Questions
• Background
• Global and Regional Mobile Coverage Estimates
• Mobile Coverage and Market Liberalization
• Results
• Discussion
http://www.farmafrica.org/kenya/cassava-farming
Presentation Plan
http://www.icrisat.org/newsroom/latest-news/happenings/1548/1.jpg

Evans School Policy Analysis and Research Group (EPAR)
• Hypothesized commercial benefits of mobile phone coverage:
• Reduces price heterogeneity across markets (Aker, 2010; Aker & Fafchamps, 2010; Jensen, 2007; Rashid & Elder, 2009)
• Provides direct price, weather and other valuable information to farmers (Aker & Mbiti, 2010; Dillon,
2011; Gakuru, Winters, & Stepman, 2009; Fafchamps, & Minten, 2010; Camacho & Conover, 2012; Nakasone, 2014)
• Facilitates financial transactions through mobile money (Kendall & Voorhies, 2014; Blumenstock, Eagle, &
Fafchamps, 2014; Aker, 2014; Must & Ludewig, 2010; Scott, Batchelor, Ridley, & Jorgensen, 2004)
Benefits of Mobile Coverage
• The World Bank (2012) details evidence of
benefits from mobile technology in agriculture,
health, finance, economic development,
governance, education, and gender equalityhttp://www.agriculturesnetwork.org/magazines/india/education-
for-change/e-arik-center/fieldrecordingwithmobile.jpg

Evans School Policy Analysis and Research Group (EPAR)
• Demand factors: population density, per capita income (Aker & Mbiti, 2010; Buys et al., 2009;
World Bank, 2012)
• Cost drivers: difficult geography (e.g., higher elevation), remoteness - distance
from main roads, urban centers, and electricity grids (Williams, Mayer, & Minges, 2011; Bhavnani
et al., 2008)
• Several studies contend that market liberalization and increased competition
between network providers is needed to expand mobile coverage (World Bank, 2012;
Williams, Mayer, & Minges, 2011; Aker & Mbiti, 2010; Buys et al., 2009; Bhavnani et al., 2008; Donner, 2008; Stovring, 2004;
Varoudakis & Rossotto, 2004; Ibarguen, 2003; Wallsten, 2001)
• Market liberalization alone is likely not sufficient to achieve universal mobile
coverage (GSMA, 2015; Williams, Mayer, & Minges, 2011; Buys et al., 2009; World Bank, 2006; Dymond & Oestmann,
2003)
• Coverage expansion will likely be concentrated in areas with relatively dense
populations (Buys et al., 2009), leaving a “true access gap” for populations that will not be
served even under optimal, efficient, and liberalized market conditions (Dymond & Oestmann, 2003)
Drivers and Barriers of Mobile Coverage Expansion
http://www.ukmobilereview.com/wp-
content/uploads/2012/07/mobile-mast.jpg

Evans School Policy Analysis and Research Group (EPAR)
Estimates of Mobile Coverage
• An estimated 90% of the overall global population had mobile coverage in 2010 (World Bank, 2012)
• Significant gains in coverage in low- and middle-income countries surveyed, from 82% in 2005 to 91% in 2010
• Continued coverage expansion in developing countries
• Annual growth in unique mobile phone subscriptions below 1% in Europe and North America, but nearly 12% in sub-Saharan Africa in 2014 (GSMA, 2015)
• Estimated 60% of the population with mobile coverage in sub-Saharan Africa in 2008, compared to 10% in 1999 (Center
for Global Development, 2010)https://yali.state.gov/wp-content/uploads/sites/4/2014/12/cell-
tower.jpg

Evans School Policy Analysis and Research Group (EPAR)
1. What is the current extent of global mobile coverage?
2. What are the trends in global and regional mobile coverage expansion, and how do they differ for rural and urban populations?
3. Is market liberalization associated with higher levels of mobile coverage?
http://www.cimmyt.org/global-maize-research/
Research Questions
http://siteresources.worldbank.org/INTAFRICA/Images/cell-phone-
toilet.jpg

Evans School Policy Analysis and Research Group (EPAR)
Methods: 2012 Mobile Coverage Estimates
• Spatial analysis provided by SpatialDev (2014)
• Private 2012 mobile coverage data from Collins Bartholomew
• GSMA coverage data supplemented by data obtained directly from telecommunications companies and regulators
• LandScan 2012 High Resolution Global Population Data Set and Global Rural-Urban Mapping Project (GRUMPv1) data on population densities
• Layer population density over the coverage data to estimate the number and proportion of people living inside and outside of mobile coverage areas

Evans School Policy Analysis and Research Group (EPAR)
Global Population Densities of Areas With and Without Mobile Coverage
Source: SpatialDev, 2014

Evans School Policy Analysis and Research Group (EPAR)
Covered88%
Uncovered12%
Global Coverage Snapshot
• 12% of the world’s population lives in areas without mobile coverage.
• Of the 88% that live within mobile coverage, 44% live in rural areas.
• Of those that are uncovered, 92% live in rural areas.
Rural44%Urban
56%Rural92%
Urban8%

Evans School Policy Analysis and Research Group (EPAR)
Regional Mobile Coverage Estimates
Region Percent of
World’s
Population
Living Outside
Coverage
Number of
People in Region
Living Outside of
Coverage
(Millions)
Percent of
Population in
Region
Outside
Coverage
Percent of
Rural
Population in
Region
Outside
Coverage
Percent of
Urban
Population in
Region
Outside
Coverage
West Africa 9.7% 79.2 24.6% 34.2% 1.4%
Southern Africa 1.7% 13.7 14.7% 26.7% 0.5%
Central Africa 8.1% 66.2 45.6% 61.7% 4.7%
East Africa 14.6% 119.4 39.5% 44.5% 13.2%
North Africa 1.1% 8.9 4.4% 11.3% 0.4%
Central America & Caribbean 1.1% 9.4 11.1% 20.0% 4.0%
South America 5.4% 44.4 11.2% 33.5% 2.4%
South Asia 17.0% 139.3 8.0% 12.0% 1.4%
Southeast Asia 11.1% 90.8 14.7% 22.0% 3.7%
Total, Selected Regions 69.6% 571.3 - - -

Evans School Policy Analysis and Research Group (EPAR)
Trends in Mobile Coverage Expansion
0
10
20
30
40
50
60
70
80
90
100
1999 2000 2001 2002 2003 2004 2005 2006 2007 2008 2009 2010 2011 2012
% o
f Popula
tion w
ith M
obile C
overa
ge
Global Sub-Saharan Africa Sub-Saharan Africa, Urban Sub-Saharan Africa, Rural
Note: In the graph, values for
years with no coverage data were
estimated using the average
change in mobile coverage
between the years where
coverage data estimates were
available.
Sources:a Buys et al., 2009b Williams et al., 2010c World Bank, 2012d Bhavnani et al., 2008e Aker & Mbiti, 2010f Original estimates
Estimates of the
Percentage of the
Population with Mobile
Coverage, 1999-2012
Year 1999 2003 2006 2008 2009 2010 2012
Global 61 c 80 d 90 c 88.3 f
Sub-Saharan Africa 9.1 a,b 54.5 a 60 e 61 b 67.7 f
Sub-Saharan Africa, Urban 17 b 90 b 95.7 f
Sub-Saharan Africa, Rural 5 b 48 b 57.8 f

Evans School Policy Analysis and Research Group (EPAR)
• Number of mobile network operators (MNOs):• Nationwide “licensed mobile cellular service providers that have their own network
infrastructure as opposed to other mobile service providers who lease it” (World Bank, 2012)
• Herfindahl-Hirschman Index (HHI) for the Mobile Industry:• Measures the size of firms in relation to a particular industry
• A higher HHI indicates greater market concentration, or lower levels of competition
• CPIA Business Regulatory Environment (BRE) Rating:• Assesses “the extent to which the legal, regulatory, and policy environments help or
hinder private businesses in investing, creating jobs, and becoming more productive”
• A higher BRE rating indicates a highly supportive regulatory environment for business activity
Correlates of Mobile Network Coverage
Indicators of Market Liberalization

Evans School Policy Analysis and Research Group (EPAR)
• Gross National Income (GNI) per capita:
• Wealthier populations likely have greater willingness to pay for mobile
coverage
• Countries with higher GNI per capita may also have more supporting
infrastructure, reducing costs of coverage expasion
• Rural Proportion of the Population:
• Costs of expanding coverage in rural areas is greater due to distance from supporting infrastructure
• Increases in geographic area covered lead to smaller increases in the proportion of the population that is covered
Indicators of Demand Factors and Cost Drivers
Correlates of Mobile Network Coverage
Evans School Policy Analysis and Research Group (EPAR)
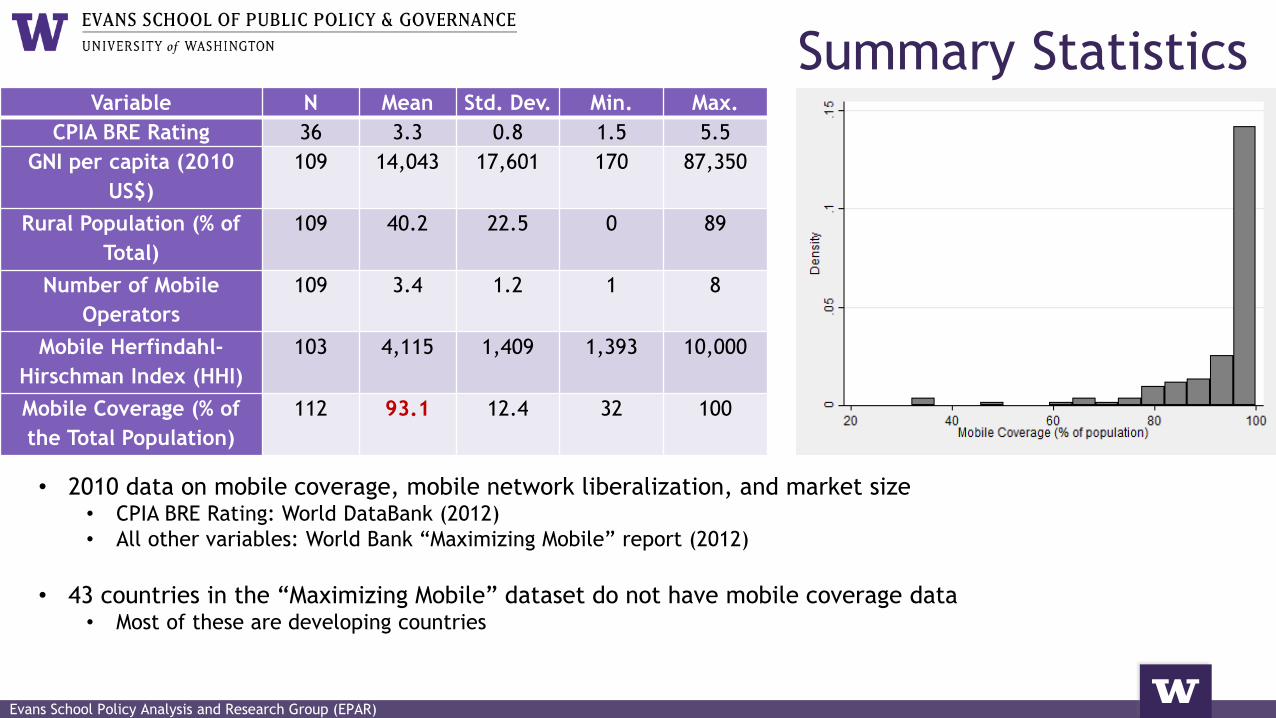
• 2010 data on mobile coverage, mobile network liberalization, and market size• CPIA BRE Rating: World DataBank (2012)
• All other variables: World Bank “Maximizing Mobile” report (2012)
• 43 countries in the “Maximizing Mobile” dataset do not have mobile coverage data • Most of these are developing countries
Summary StatisticsVariable N Mean Std. Dev. Min. Max.
CPIA BRE Rating 36 3.3 0.8 1.5 5.5
GNI per capita (2010
US$)
109 14,043 17,601 170 87,350
Rural Population (% of
Total)
109 40.2 22.5 0 89
Number of Mobile
Operators
109 3.4 1.2 1 8
Mobile Herfindahl-
Hirschman Index (HHI)
103 4,115 1,409 1,393 10,000
Mobile Coverage (% of
the Total Population)
112 93.1 12.4 32 100
Evans School Policy Analysis and Research Group (EPAR)
• Qualitatively analyze the
relationship between mobile
coverage and each of our indicators
of market liberalization
• Pairwise correlations
• One-way analysis of variance
(ANOVA)
Methods: Correlates of Mobile Network Coverage
http://stech3.firstpost.com/tech2images/640x359/proportional/jpeg/2013/09/Mob
ile-India-rural-Reuters2.jpg

Evans School Policy Analysis and Research Group (EPAR)
Indicators of Market Liberalization at
Different Levels of Mobile CoverageLevel of Mobile
Coverage
Number of
Countries
Average Mobile
Coverage
Number of MNOs (n=109)
Minimum Maximum Median Mean
100 % 40 100 1 5 3 3.2
95-99 % 35 97.9 2 7 3 3.5
90-94 % 14 91.4 1 5 3 3.4
80-89 % 11 83.2 2 8 4 4.2
<80 % 9 60.0 1 5 3 3.2
Level of Mobile
Coverage
Number of
Countries
Average Mobile
Coverage
Mobile Herfindahl-Hirschman Index (HHI) (n=103)
Minimum Maximum Median Mean
100 % 39 100 2,495 6,429 3,780 3,921
95-99 % 34 97.9 2,354 6,800 3,718 3,907
90-94 % 12 91.5 2,282 10,000 3,655 4,955
80-89 % 11 83.2 1,393 5,625 3,871 2,899
<80 % 7 57.1 3,242 10,000 4,826 5,141
Level of Mobile
Coverage
Number of
Countries
Average Mobile
Coverage
CPIA BRE Rating (n=36)
Minimum Maximum Median Mean
100 % 2 100 4 4 4 4
95-99 % 6 98.2 3.5 5.5 4 4.2
90-94 % 9 91.3 2 4 3.5 3.3
80-89 % 11 83.2 2 4.5 3.5 3.2
<80 % 8 58.3 1.5 4.5 3 2.8

Evans School Policy Analysis and Research Group (EPAR)
Results: Pairwise Correlation
Variables Mobile
Coverage (%
of the total
population)
Number
of MNOs
Herfindahl
-Hirschman
Index (HHI)
CPIA
BRE
Rating
GNI per
capita
Rural
Population
(% of Total
Mobile Coverage (% of
the Total Population)
1
Number of MNOs -0.0509
(109)
1
Herfindahl-Hirschman
Index (HHI)
-0.1565
(103)
-0.6919
(103)
1
CPIA BRE Rating 0.4671
(36)
0.1860
(35)
-0.2804
(33)
1
GNI per capita 0.3781
(109)
-0.1210
(106)
-0.1657
(100)
0.4769
(36)
1
Rural Population (% of
Total)
-0.4558
(109)
0.2220
(106)
0.1605
(103)
-0.3278
(34)
-0.5753
(106)
1

Evans School Policy Analysis and Research Group (EPAR)
Results: One-way ANOVA
Variable SS df MS F Prob >
F
Number of
MNOs
1072.7 4 268.2 1.83 0.128
Mobile HHI 1274.9 4 318.7 2.27 0.068
CPIA BRE
Rating
3778.8 4 944.7 5.06 0.003
GNI per capita 5715.8 4 1429.0 13.37 0.000
Rural
Population (%
of Total)
3695.9 4 924.0 7.95 0.000
Results of one-way ANOVA for mobile coverage and indicators of
market liberalization, demand factors, and cost drivers
http://farm9.staticflickr.com/8525/8671657757_a18cd
9927f_z.jpg

Evans School Policy Analysis and Research Group (EPAR)
Conclusions
• Mobile coverage is most strongly associated
with potential financial returns (incomes of
populations) and costs of coverage expansion
(remoteness of populations)
• In the absence of significant increases in rural
income or decreases in the costs of reaching
rural populations, some form of government
support or subsidy may be required (Williams, Mayer,
& Minges, 2011) http://s1.ibtimes.com/sites/www.ibtimes.com/files/styles/md/public/2015/10/07/
mobile-phones.jpg
• Mobile coverage expansion rates are slowing; of the 11.7% of the world’s
population without mobile coverage, 91.8% are located in rural areas
• Mobile-specific market liberalization will likely not be sufficient to achieve full
mobile coverage
• More general market liberalization to promote competitiveness in both the mobile
industry and in complementary industries may support coverage expansion

Evans School Policy Analysis and Research Group (EPAR)
Evans School Policy Analysis & Research Group (EPAR)
Professor C. Leigh Anderson, Principal Investigator
Professor Travis Reynolds, co-Principal Investigator Pierre Biscaye
EPAR uses an innovative student-faculty team model to
provide rigorous, applied research and analysis to
international development stakeholders. Established in
2008, the EPAR model has since been emulated by other UW
schools and programs to further enrich the international
development community and enhance student learning.
Please direct comments or questions about this research to Principal Investigators C. Leigh Anderson and Travis Reynolds at


