Rural Roads and Local Market Development in Vietnam
47
Policy Research Working Paper 4340 Rural Roads and Local Market Development in Vietnam Ren Mu Dominique van de Walle e World Bank Development Research Group Human Development and Public Services Team August 2007 Impact Evaluation Series No. 18 WPS4340
Transcript of Rural Roads and Local Market Development in Vietnam

Policy Research Working Paper 4340
Rural Roads and Local Market Development in Vietnam
Ren Mu Dominique van de Walle
The World BankDevelopment Research GroupHuman Development and Public Services TeamAugust 2007
Impact Evaluation Series No. 18
WPS4340
Produced by the Research Support Team
Abstract
The Impact Evaluation Series has been established in recognition of the importance of impact evaluation studies for World Bank operations and for development in general. The series serves as a vehicle for the dissemination of findings of those studies. Papers in this series are part of the Bank’s Policy Research Working Paper Series. The papers carry the names of the authors and should be cited accordingly. The findings, interpretations, and conclusions expressed in this paper are entirely those of the authors. They do not necessarily represent the views of the International Bank for Reconstruction and Development/World Bank and its affiliated organizations, or those of the Executive Directors of the World Bank or the governments they represent.
Policy Research Working Paper 4340
The authors assess impacts of rural road rehabilitation on market development at the commune level in rural Vietnam and examine the variance of those impacts and the geographic, community, and household factors that explains it. Double difference and matching methods are used to address sources of selection bias in identifying impacts. The results point to significant average impacts
This paper—a product of the Human Development and Public Services Division, Development Economics Department—is part of a larger effort in the department to rigorously evaluate the impacts of development programs. Policy Research Working Papers are also posted on the Web at http://econ.worldbank.org. The author may be contacted at [email protected].
on the development of local markets. They also uncover evidence of considerable impact heterogeneity, with a tendency for poorer communes to have higher impacts due to lower levels of initial market development. Yet, poor areas are also saddled with other attributes that reduce those impacts.
Rural Roads and Local Market Development in Vietnam
Ren Mu and Dominique van de Walle*
World Bank
* For helpful comments, we thank Kathleen Beegle, Hai Anh Dang, Emanuela Galasso, Shahidur Khandker, John Strauss and Martin Ravallion. We gratefully acknowledge funding support from CIDA (TF034859), the World Bank’s East Asia and Pacific Transport Unit and the Poverty and Social Unit in the Vietnam Resident Mission Office, and the DFID trust fund for Poverty Analysis and Policy Advice. The findings, interpretations, and conclusions expressed in this paper do not necessarily represent the views of the World Bank, its Executive Directors, or the countries they represent. Address for correspondence: World Bank, 1818 H ST, NW, Washington, DC 20433. [email protected]

2
1 Introduction
The literature on rural roads and economic development has emphasized impacts
on transport costs and prices, and the consequent welfare impacts. For example, rural
roads may allow farmers in remote (and often poor) rural areas to get higher prices for
their output, and/or reduce the prices they face for inputs and consumer goods.1 However,
this way of thinking about the impacts of rural roads says little or nothing about how rural
roads might also influence the geography of economic activity and, in particular, what role
road improvements might play in local market and market-related institutional
development. Initial conditions in remote poor areas are often characterized by highly
geographically incomplete and non-existent markets. The goods concerned are simply not
available in these areas, given high transport costs. Advocates of rural road projects often
point to their potential benefits in stimulating market development (Gannon and Liu,
1997). Rigorous evidence appears to be non-existent.
Here it can be important to distinguish two ways in which access to markets can
improve due to better transport infrastructure. One is through reduced travel costs to
existing markets and institutions. The other is through the induced relocation of markets
and institutions. The rural road impacts literature appears to have the first in mind, at least
implicitly. But markets are mobile ─ not least so in developing countries. One response
to road improvements could be the development of local markets defined as fixed places
where villagers and outsiders gather at set times to buy and sell goods.
Why should we care about whether the residents of a poor area have goods
commercially transported to their community and available in a local market, rather than
1 For example see Gannon and Liu (1997); Khandker, Bakht and Koolwal (2008); Escobal and Ponce (2004); Dercon, Gilligan, Hoddinott and Woldehanna (2006); and Lokshin and Yemtsov (2005).
3
travel themselves to an outside market? At a purely descriptive level it may be of interest
to know how road improvements affect the geography of economic activity. Does
economic activity become more geographically concentrated or less so as roads improve?
There may also be important instrumental reasons. While it should not be presumed that
local market development is welfare enhancing, supportive arguments for that view can be
made. One possible reason is that there could be large external benefits to having a local
market.
There are two relevant literatures here. The economic geography literature has
postulated that externalities ─ agglomeration economies ─ play a crucial role in the spatial
concentration of economic activity.2 A local market’s physical presence and facilitation
of trade could be an instigating factor in a process of shifting production structures to
more diversified and higher value activities, improved access to various services, and
broader economic development in an area. Such benefits are external in the sense that
decisions by the commercial carrier to transport goods to the community or not will not
take them into account. Local market development may then create a virtuous circle
whereby the stimulation of off-farm development and new income earning opportunities
result in higher perceived returns to education and in time, higher schooling. We will dub
this the hypothesis of “transport-induced local-market development (TILD).”
A second set of reasons for believing that local market development brings local
benefits is found in the (largely non-economics) literature on the role of local markets as
fora for the exchange of ideas and learning, recreation and social interactions (Skinner
2 The now classic contribution is Krugman’s (1991) “new economic geography” model in which one sector of the economy is subject to increasing returns to scale and is (hence) non-competitive. At the same time the new economic geography literature doesn’t pay much attention to rural transport improvements and there has been little effort to link these literatures.

4
1964, 1985; Liu 2007; Masschaele 2002, among others). This literature emphasizes local
markets’ role in social change and in connecting isolated rural peasant communities to the
external social and economic system. Others have written about the importance of trust
and relationships in exchange as might be expected to be fomented in local rural markets
(for example, Fafchamps and Minten 1999). These are about both production
consequences as well as non-economic benefits of social development.
However, it is far from clear that public investments in transport improvements
will actually promote local market development in poor areas. In its analysis of where
economic activities take place and why, the new economic geography insists on increasing
returns to scale leading to agglomeration economies. This may make it hard for markets
to develop in poor areas even with large reductions in transport costs. And as we show
later with a simple model, theoretical arguments can be made that road improvements
could either be good or bad for local market development. Under certain conditions, they
will encourage local market development; under others, road improvements could
discourage it as local residents in the targeted areas can now more easily reach established
markets.
Do new roads linking poor isolated rural areas to the outside world promote local
market development and under what conditions? Despite a general consensus on the
importance of rural roads, there is surprisingly little hard evidence, for or against, TILD.
We know rather little about the size and nature of the impacts of transport improvements
on local market development, about the contextual factors that influence such outcomes,
or the conditions that encourage TILD.
5
This paper aims to test TILD by assessing the impacts of a World Bank-financed
rural road rehabilitation project implemented in Vietnam between 1997 and 2001.3
Numerous observers of the rural Vietnam setting have remarked on the correlations
between road infrastructure, local markets, and off-farm income diversification (for
example, see various chapters in Kerkvliet and Porter 1995; Bryceson et al. 2006; Minot
et al. 2006 ). And indeed, the project’s objectives were to develop local market activity
and hence economic development through targeting road improvements in poor
communes. The pre-project setting can be described as one of isolated subsistence-
oriented villages with generally poor market related infrastructure ─ a legacy of the
communist period that suppressed markets, and of their slow development since the State
and the farming collectives relinquished control of the economy in the late 1980s (Fforde
and de Vylder, 1996). Continuing restrictions on mobility, the lack of safety nets and the
threat of losing land that is left uncultivated, render households in these areas relatively
immobile. In similar areas of China local markets have been described as providing a
meeting place to engage in trade, business and social interactions for small scale
cultivating households scattered over large areas (Skinner 1985; Liu 2007). Itinerant
traders and assemblers can buy small quantities from peasants while the latter find needed
outside goods and services (Luu 2003). Yet, unlike similar rural areas in China where
village and township enterprises have played a vital role in rising off-farm diversification,
rural Vietnam has had no such tradition. The role of local markets may be
commensurately more important there.
The paper focuses on whether the road improvements lead to the development of
local markets and whether there are also impacts on off-farm development that may be
3 The Vietnam Rural Transport Project I, see World Bank (1996) for details.

6
consistent with the idea of a virtuous cycle as discussed above. Our data and methods
allow us to assess this in a methodologically rigorous way ─ controlling for how road sub-
projects are allocated to specific communes and for initial conditions that may affect
subsequent outcome trends, and monitoring communes long enough to capture impacts.
The paper concentrates on three sets of questions. The first concerns average
impacts on local market development of the rehabilitation of rural roads. The World Bank
project coincided with a period of rapid economic development in Vietnam. Access to
markets of various kinds increased substantially over the study period. How much of the
change observed in communes covered by the project can be attributed to the road
intervention? A further, related issue is how impacts vary over time. If the transport cost
saving is large enough and the types of expenditures and agglomeration effects noted
above are present, then we would expect impacts of the roads project to increase over
time. Existing evidence on this point is scarce.4 Our data allow us to test if that is the
case.
Our second set of questions concern cross-commune differences in the project’s
impacts on local markets and what explains those differences.5 Heterogeneity of impacts
can be expected to arise according to the economic, social and political characteristics of
the community where the road intervention is placed. We aim to test for heterogeneity
and try to identify the key contingent factors relevant to impacts.
In this context, a potentially important issue for project design is whether higher
levels of initial development enhance or diminish impacts. Should we be targeting places
4 In one of the few cases in which impacts of a poor area development project (including rural roads) were tracked over time, the impacts declined over time rather than showing cumulative gains (Chen, Mu and Ravallion, 2007).

7
that are well endowed and have the market institutions necessary for further economic
development on the grounds that impacts will be higher there, or focus our resources on
the places without such attributes? In practice, it appears that project selection often tries
to favor poor areas with poor road conditions. Poor places tend to have less market
development to begin with. This alone would suggest greater potential for roads to have
impacts on market development in poor areas. But poor areas are typically also saddled
with attributes that may well prevent markets from being attracted to those areas. The
degree to which poor road conditions coincide with other important bottlenecks to
increased development and market activity ─ such as poor agro-climactic endowments,
low population density, low education levels, high risk, and less well functioning credit
and other markets ─ will clearly mediate impacts of road improvements across
communities. There is no obvious reason why placement in poor areas with poor roads
will maximize TILD. Depending on precisely how road benefits depend on initial
conditions, project design may also need to consider complementary inputs and policies to
achieve the full potential benefits from the road.
This leads to our third set of questions, which concern the structure of the cross-
commune differences in impacts. It is well recognized, in principle at least, that the same
intervention can have different impacts on different places and households, depending on
their characteristics. However, when there are multiple outcomes of interest and they
cannot be aggregated into a single outcome (as is often the case in project evaluation) the
policy implications of such heterogeneity depend crucially on whether it shares a common
structure across different outcome variables. For example, if communes with better
5 While impact heterogeneity has received surprisingly little attention in the context of rural roads, it has been emphasized in social sector programs; see, for example, Galasso and Ravallion (2005).
8
educated households tend to derive larger impacts for improved access across all kinds of
markets, then a robust conclusion can be drawn about the gains from targeting such
commune covariates. If the relevant sources of cross-commune differences in impacts
vary greatly across multiple outcomes then it will clearly be hard to exploit heterogeneity
to assure better projects.
Section 2 develops a simple model to show that the impacts of better roads on
local markets are theoretically ambiguous. Section 3 then provides a brief description of
the project being evaluated, our data and initial conditions in our sample of rural
communes. Section 4 discusses our methods for evaluating impacts and exploring cross-
commune differences in impacts. Section 5 discusses our results, while Section 6 offers
some conclusions.
2 Roads and local market development
When will a local market exist and when not? How will this differ between poor
areas and non-poor areas? How will the presence of a local market be affected by a road
improvement project? Before we address these questions empirically, it helps to outline a
simple theoretical model.
We assume that trade exists but that whether or not a market exists in a specific
rural area (“commune”) depends on the difference between the cost of freighting traded
goods to that area from a central market and the cost to residents of the commune going
instead to the central market to shop, and bringing the goods back themselves. The two
costs will differ if the value of travel time for commune residents differs from the wage
rate for the commercial freight carrier for the traded goods. There can also be differences

9
in the non-labor cost, notably when there are economies of scale, such that the unit
transport cost is lower for the commercial carrier given the bulk of the goods transported.
To formalize these ideas in a simple model, let w be the wage rate for the
commercial carrier and v be the value of time for local residents; we can think of value of
time as a function of various characteristics (x) of local residents, as v(x). Also let t denote
travel time from the commune to the central market. Travel time is a strictly increasing
function of the straight-line distance from the commune center to the central market d, and
whether the road improvement project (D=0, 1) is implemented; travel time with the
project is )1,(dt and it is )0,(dt without the road project, and of course )0,()1,( dtdt .6
The project also lowers the non-wage cost of transport for the commercial carrier; the road
improvement reduces wear and tear on transport equipment and may also allow cheaper
modes of transport to be feasible. The non-wage cost to the commercial carrier is )1(ck
with the project and )0(ck without it, with )0()1( cc kk .7 Local residents who travel to
the central market also incur a non-wage cost, rk , but this is assumed to be small
( )1(cr kk ) and to be unaffected by the road improvement.
The market exists in a given commune if (and only if) the commercial carrier has
the cost advantage; otherwise it would be cheaper for the local residents to travel to the
central market. The roads project reduces labor costs for both the carrier and the local
6 Note that t will of course also be a function of terrain and typology such as location in mountainous areas. 7 In a more general model, one could also allow ck to vary with d. This could stem from wear and tear on
transport equipment ( ck rises with d) or economies of scale ( ck falls with d). One might also allow for an
interaction effect between d and D in influencing ck . As long as the marginal effect of d on ck is small, the
above results will still hold.

10
residents, and it reduces non-labor cost for the commercial carrier. The cost advantage of
the commercial carrier is:
)(),(])([),,( DkkDdtwxvxDdC cr (D=0, 1) (1)
When 0),,( xDdC the commercial carrier can transport goods more cheaply than local
residents and so the local market will exist; the opposite is true when 0),,( xDdC . Let
d* denote the critical distance at which 0),*,( xDdC ; d* is a function of D and x. The
impact of the project on the cost advantage of the commercial carrier is:
)1()0()]0,()1,(][)([),0,(),1,( cc kkdtdtwxvxdCxdC (2)
Now consider three cases:
(i) A “low-income commune”, defined as one in which wxv )( : the cost
advantage of the commercial carrier falls with distance ( 0),,( xDdCd ), so that local
markets are found up to distance d*, but not at more remote places. It can be seen from
equation (2) that the road project will increase the cost advantage of the commercial
carrier, so it will increase the probability of having a local market at any given distance.
The value of d* will rise and the project will promote local market development.
(ii) A “middle-income commune”, defined as one in which
)]0,()1,(/[)]0()1([)( dtdtkkwxvw cc . The fact that wxv )( implies that the cost
advantage of the carrier rises with distance ( 0),,( xDdCd ); local markets will tend to be
found at higher distances from the central market. Given that
)]0,()1,(/[)]0()1([)( dtdtkkwxv cc , the project will increase the cost advantage of
the commercial carrier at any given distance. Thus the value of d* will fall and the project
will promote local market development.
11
(iii) A “high-income commune”, defined as one in which
wdtdtkkwxv cc )]0,()1,(/[)]0()1([)( . Again the cost advantage of the carrier
rises with distance, so that local markets are not found close to the central market, but now
the project reduces the cost advantage, d* increases and local markets retreat. The project
displaces markets at middle distances and leads to fewer local markets.
We can summarize the empirical implications of these observations as follows.
The poorer the commune the more likely the project will promote local market
development. There is also likely to be a potentially complex interaction effect between
how poor the commune is and its distance from the central market. Among poor and
middle-income communes the impacts on local market development will tend to be at
middle distances, while among the relatively high income communes, it is the negative
impacts that will tend to be higher at middle distances. In all three cases above, the
outcome will depend on the characteristics of local residents (x), as these determine the
value of their travel time.
3 The project, data and setting
3.1 The rural road project intervention
The Vietnam Rural Transport Project I (RTPI) aimed to link commune centers to
markets, stimulate market development and reduce poverty through the rehabilitation of
5,000 kilometers of rural roads (World Bank 1996). The project was implemented
between 1997 and 2001 in communes located in 18 provinces scattered around Vietnam.
Participating provinces were responsible for choosing communes for inclusion in RTP1,
as well as the road links to be rehabilitated within them. On paper, road links were
12
identified through least cost techniques, and eligible if the road’s zone of influence had a
population of over 300 per kilometer, and average rehabilitation costs were below $15,000
per kilometer.8 In mountainous communes with a high density of ethnic minority
households, provisions were made for the possible waiving of the population and cost
criteria. In practice these eligibility criteria identify considerably more road links than
could be covered by the project. How the included links were selected among these is
unclear. It should be noted that the selection of project communes was complete prior to
the project start date and based on conditions in early 1997.
Many of the targeted roads were in very bad condition, some with impassable
sections year round. A rehabilitation standard of ‘reliable access’ was enforced that
provides relatively consistent and safe access with only short-term road closures (due to
bad weather). The project expressly stipulated that no ‘new’ roads would be built.
Aid or central government spending for road projects may substitute for local
government spending intended for the same purpose, by being diverted to other sectors or
to neighboring non-project areas. Elsewhere we have ascertained that the project did
produce differential impacts on the kilometers of improved roads in project compared to
non-project comparison communes (van de Walle and Mu 2007). We found no evidence
that resources were diverted to non-project communes for roads or other basic
infrastructure. However, we also showed that project funds were used not only to
rehabilitate roads as intended by the project, but also to build new roads. Therefore, the
impacts we study in this paper are due to both types of improvements.
8 Least cost techniques refer here to the minimum cost engineering solution that ensures a certain level of motorized passability.
13
Using the methods to be described in Section 5 we have also checked to see
whether the period under analysis was marked by differences in the implementation of
other development projects in the project and non-project communes. For a long list of
potential interventions for which information is available in our data, we find no evidence
that project or non-project communes were treated differently.9 Based on the findings, we
are confident in attributing any differences in outcome changes over time to rural road
rehabilitation and construction.
3.2 The SIRRV data
Collected specifically for evaluating the impacts of the rural roads rehabilitated
under RTPI, the "Survey of Impacts of Rural Roads in Vietnam" (SIRRV) consists of a
panel of 200 communes and 3000 households. The survey design implicitly takes the
commune as the project’s zone of influence. This is justified by the project objectives ─
namely to link commune centers (where key social, economic and administrative facilities
are located) with road and market networks ─ and because the commune is an
enumeration level at which data is commonly collected in Vietnam.
The baseline was collected pre-project starting in June 1997, while subsequent
rounds followed in the summers of 1999, 2001 and 2003, tracing the implementation
process and schedules of prior rounds. The analysis for this paper makes use primarily of
the first and last rounds, though we will also test impact dynamics using the 2001 round.
Project (“treatment”) and non-project (“comparison”) communes, and households
within them, were surveyed in six of the 18 provinces participating in the project ─ Lao
9 We looked at education, health care, family planning, child nutrition, reforestation, opening up new land, anti-opium, job creation and TV and radios distribution programs, as well as various schemes that are part of the Hunger Elimination and Poverty Reduction Program, including credit loans, school fee and health care exemptions, free land allocation and new infrastructure.

14
Cai and Thai Nguyen in the north, Nghe An and Binh Thuan in the center, and Kon Tum
and Tra Vinh in the south of the country.10 Project communes were randomly selected for
inclusion in the survey from province-specific lists of all communes with road links
proposed for rehabilitation. Another list was drawn up of remaining communes in
districts with proposed road links from which a random sample of non-project communes
was drawn. The eventually sampled communes (100 project and non-project each) were
located in 29 of 38 potential survey districts.
Non-project communes located in the same districts as the treatment communes
will share many of the same characteristics as the project communes. But we additionally
use matching techniques to ensure selection of the most appropriate comparison
communes. Districts are large and the distances between project and non-project
communes tend also to be large.11 Contamination from project to non-project communes
is unlikely for the type of small localized road improvements under study.
The commune data were acquired in part by drawing on annually collected
commune records. Each commune appoints a ‘statistician’ who collects and maintains
commune-level information such as pertaining to vital statistics, land use and distribution,
production activities and finances. There is some concern that the reliability of these data
varies according to average commune income and education, and local pressures to
compile statistics that conform to pre-determined ‘plans.’ To minimize such potential
problems, we focus on variables likely to be less vulnerable to these biases. Our analysis
focuses on commune level impacts and uses primarily the commune data.
10 Lao Cai, Thai Nguyen or Nghe An are located in what was previously known as North Vietnam or the Democratic Republic of Vietnam. 11 Early on during data collection, we mapped many of the non-project communes and judged them to be sufficiently far from our road links to be confident that contamination is unlikely.

15
Fifteen households in each sampled commune also answered a household
questionnaire. A welfare ranking implemented by commune authorities was used to
divide households into the poorest, middle and richest thirds of each commune’s
households. Five were then randomly selected from each of these equal sized groupings.12
The household ranking is undoubtedly subjective, but stratified sampling on this basis
should ensure a sample that is reasonably representative of each commune’s socio-
economic groups.
The household survey does not attempt to measure household income or
consumption expenditures. However, using extensive information on household
characteristics common to the SIRRV and the nationally representative Vietnam Living
Standards Survey (VLSS) of 1998, we use regression techniques to predict consumption
expenditures for SIRRV households in 1997.13 This variable is then aggregated to form a
commune level welfare indicator which we use in Figure 1 (Section 3.3) and to divide
communes into those below and above median mean predicted consumption, which we
will refer to as poor and non-poor communes, respectively.14
Finally, a project level database detailing what the project did, when and how, was
also constructed for each surveyed project area. Project differences can then be taken into
account in determining impacts.
3.3 Initial conditions of poor and non-poor communes
Pre-project, 48 percent of all sample communes had a market whose frequency
12 Since the groups were equal and equal-sized samples were drawn from each, weights are not required for constructing commune level variables from the household data. 13 The consumption model includes 80 explanatory variables (not counting 58 province dummies) and has an R2 of 0.687. Mean consumption for the 1998 VLSS rural sample is 2515.605 thousand dongs (with a standard deviation of 1467.065), and mean predicted consumption for 1997 SIRRV households is 2332.896 (with a standard deviation of 1110.707). Full details are available from the authors. 14 This is the only variable used in the paper that is built up from household level information.

16
averaged once a week. 67% were open air with no building; a quarter of the market
buildings were of brick, while the rest were described as “temporary.” The market areas
ranged from 72 to 2500 square meters. The vast majority had been built recently and
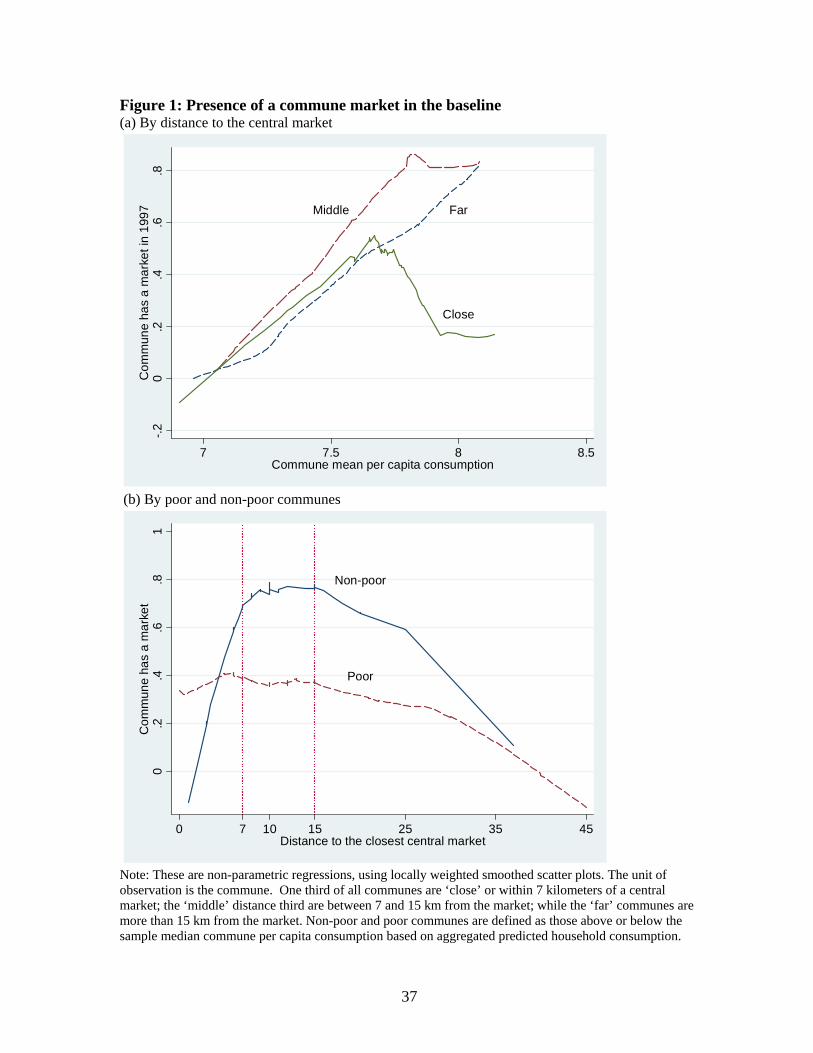
since the collapse of the collective farming system. Figure 1 shows how the initial
presence of a commune market was related to both the commune’s distance to the closest
central market town and its average living standards as measured by mean predicted
household per capita consumption in the baseline.15 16 Panel (a) plots the relationship
between having a market (vertical axis) and commune mean consumption on the
horizontal axis for communes classified into three equal groups based on distance to the
closest large market town ─ within 7 kilometers (“close”), between 7 and 15 km
(“middle”) and further than 15 km (“far”). Panel (b) places distance on the horizontal axis
instead and plots the relationship separately for communes above (“non-poor”) and below
(“poor”) median consumption.
Figure 1 suggests a clear relationship between these three variables, corroborating
elements of the theoretical model outlined in Section 2.17 Local markets are most often
present at middle distances (Figure 1, Panels a and b). They are an increasing function of
predicted consumption except at very close distances and high consumption levels (Panel
a). For better-off communes the relationship with distance is a pronounced inverted U,
while it is much flatter for poor communes although starting out at a somewhat higher
level for those at very close distances (Panel b). Poorer communes are less likely to have
markets than better-off communes at all distances beyond short distances (Panels a and b).
15 Distance to the closest market town is defined as the distance to the closest large town. 16 These are non-parametric regressions, using locally weighted smoothed scatter plots, in which the unit of observation is the commune.
17
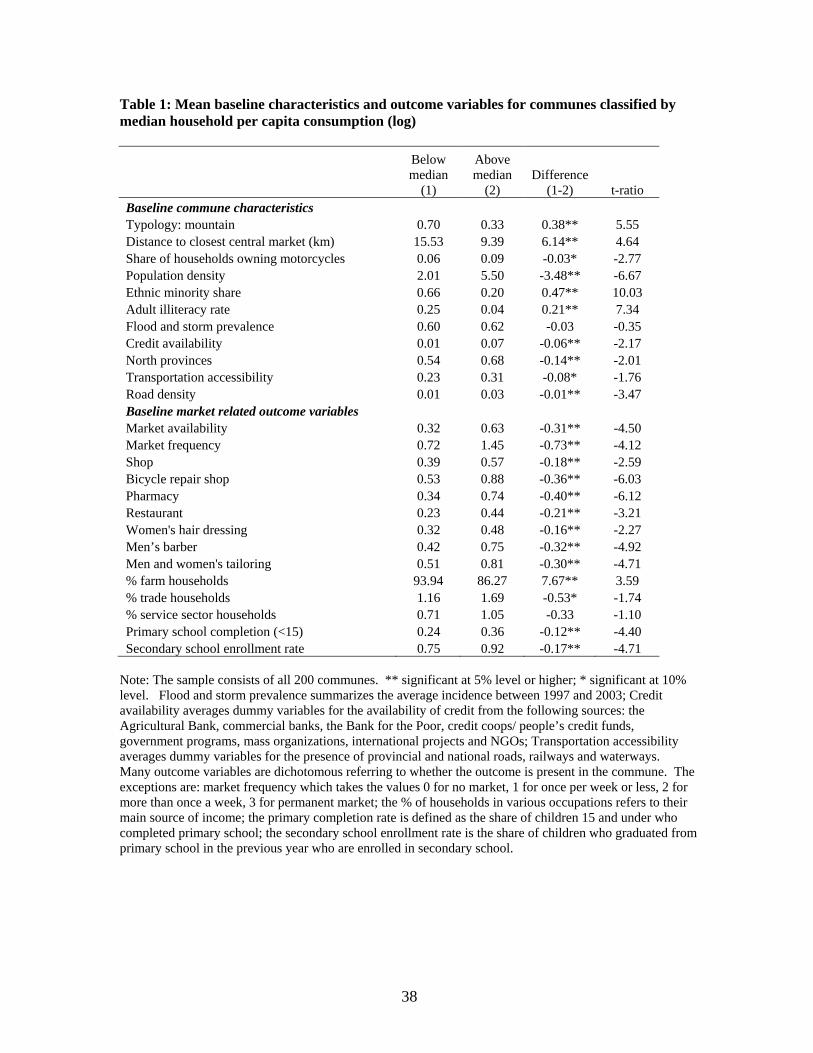
Table 1 examines how communes below and above median consumption
expenditures differ in their initial characteristics ─ including (in the bottom half of the
table) the market and market-related development outcome indicators that we will focus
on.18 The table reveals considerable and highly significant differences in attributes across
communes disaggregated in this way. Poorer communes are associated with
characteristics that are typically assumed to be disadvantageous, including higher
illiteracy, worse access to transportation and credit, larger distances to the closest city and
far lower market presence. They have generally lower levels of population and road
densities, larger minority populations, and are more likely to be in mountainous areas.
Focusing specifically on the baseline values of the outcomes variables, we see that
in addition to having lower market presence, poorer communes typically have
significantly fewer commercial businesses, inferior access to services, less diversified
income sources and worse schooling indicators. For example, only 32% had any kind of
market, and small shops or stalls which typically sell a few basic necessities such as salt,
matches and soap, were present in only 39%. The probabilities that better off communes
had markets and shops were 63 and 57%, respectively. In 1997, an overwhelming
majority of households in these communes relied primarily on agriculture for their
livelihoods (90%) but the lack of income diversification was even more pronounced in the
poorer communes where 94% did so compared to 86%. Finally, less than a quarter of
children completed primary school by age 15 in the poor communes and only three
quarters of these continued on to secondary school. In the non-poor communes it was 36
and 92% respectively.
17 The best fit for these data was obtained from the product of two quadratics ─ in consumption and in distance ─ which gave uniformly significant (at the 5% level) coefficients and an R2 of 0.27.

18
These differences again raise the crucial policy question of whether road
placement in poor areas with poor initial conditions will handicap or stimulate TILD. The
rest of the paper explores whether the project had impacts on these outcome indicators and
how differences in initial conditions may have interacted with road improvements to
affect those impacts.
4 Evaluation methodology
The official project selection criteria detailed in Section 3.1 clearly allow
provinces considerable freedom in choosing communes and road links. Some may aim to
direct the project to poorer communes with important rehabilitation needs, while others
may aim for communes with greater economic potential. Either way, the placement of the
project is unlikely to have been random and may well have been influenced by factors that
also determine outcomes.
A potentially important source of endogeneity bias in this context is that initial
conditions are likely to determine project placement as well as to influence the subsequent
growth path and prospects of the communes (as emphasized by Jalan and Ravallion 1998).
Our evaluation methodology aims to correct for these potential sources of selection bias.
We combine a difference-in-difference (DD) with propensity score methods
(PSM). A conventional DD gives unbiased estimates based on the assumption that the
selection bias is constant over time. However, if there are time varying factors that
influence placement, then road placement is still correlated with the error term in the
differenced equation. To allow for the possibility of time variant selection bias due to
initial observables, we use the predicted probability of participating in the road project
18 The variables are defined in the notes to Table 1 when they are not self-explanatory.

19
(the propensity score) to match the comparison communes in the DD estimate. PSM is
implemented using a logit that includes initial conditions that may affect subsequent
commune trajectories as explanatory variables. Our impact estimates are then constructed
by comparing the before and after project change in outcome measures for the project
communes with those for the matched comparison communes.
Specifically, the average impact for project communes ( DD ) can be written as
PN
Pi NDDDD / (3)
where
)()( 0101 j
NPj
NPjij
Pi
Pii YYWYYDD (4)
is the impact estimate for commune i, P and NP denote project (treatment) and non-
project (comparison) communes respectively, Pi
Pi YY 01 is the change in the outcome
measure for project commune i , NPj
NPj YY 01 is the change in the outcome measure for
comparison commune j , and ijW is the weight given to the j th commune in making a
comparison with the i th project commune. PN in equation (3) is the total number of
project communes. We apply nonparametric kernel matching in which all the non-
participants are used as comparison communes and weights are assigned according to a
kernel function of the predicted propensity score following Heckman, Ichimura, and Todd
(1997). This technique ensures valid bootstrapped standard errors (Abadie and Imbens

20
2006). As a robustness check, we also construct a PS-weighted DD (Hirano, Imbens and
Ridder 2003; Hirano and Imbens 2002).19
The key assumption of PS-matched or weighted DD in this context is that the
selection bias is conditional on the observed placement covariates in the baseline. The
estimates will be biased if there are unobservables that affect both project placement and
outcome changes. Since all project communes were selected prior to the project start date
based on initial conditions as reflected in our baseline, we need not worry about latent
factors that might influence changes both in road placement and outcomes over time. In
the logit model used to calculate the propensity scores, we control for an array of initial
conditions that may subsequently affect changes in the communes. However, we can
never rule out the possibility of omitted initial conditions that are correlated with
placement and outcome changes over time.
To explore whether and how initial commune conditions affect impacts we use a
simple OLS regression of the estimated commune specific impacts against certain key
initial commune characteristics. For this exercise we use the PS matched estimates since
these can be estimated for each specific commune.
5 Impacts on local market development and their heterogeneity
5.1 Participation in the project
The probability of a commune’s participation in the project is estimated using a
logit model. The detailed results, including a list of the initial commune characteristics
included in the logit are reported in an Appendix available from the authors and in van de
19 For the theory of propensity score matching and propensity score weighting, see Rosenbaum and Rubin (1983) and Hirano et al. (2003), respectively. For an empirical application in the same setting, see van de
21
Walle and Mu (2007), so we only summarize them here. We find a number of significant
explanatory variables for program placement. Consistent with official selection criteria,
communes with a higher total population and a larger share of ethnic minority population
were more likely to participate in the project. Communes in Thai Nguyen, Nghe An, and
Binh Thuan were more likely to get the project than communes in Tra Vinh. A few
characteristics that may indicate higher living standards or local development had a
significant negative effect on the probability of participation ─ namely, the share of the
adult population working in private enterprises, the school enrollment rate and having an
Agricultural Bank branch. Yet, other proxies for income had no effect ─ including, the
presence of a market and predicted average commune consumption expenditures. Finally,
among measures of transport and accessibility, a national road passing through the
commune, the presence of passenger transport, a higher density of roads, and a higher
distance to the province center all reduced the probability of participation, while a railroad
passing through the commune improved it. As there is imperfect overlap in the estimated
propensity score for project and non-project communes, we limit the sample to the
common support, ending up with 94 project and 95 non-project communes for the rest of
the analysis. Using the predicted propensity scores to match communes, we achieve a
close balancing of the initial observed commune characteristics for the two samples.20
5.2 Average treatment effects
We assess impacts of the road project on a set of outcome variables (introduced in
Table 1) that we deem relevant to local market development and to testing TILD. In
Walle and Mu (2007). 20 Following Rosenbaum and Rubin (1985), we carried out a balancing test using the standardized mean difference ─ the difference in covariate means in project and non-project communes as a percent of the standard deviation in the full sample. This drops significantly from 14% before to 9% after matching.
22
addition to the presence and frequency of local markets, we examine whether the presence
of other commercial establishments ─ namely shops, bike repair shops, pharmacies, and
restaurants ─ was affected. Such impacts could both be direct or via impacts on local
markets. To test whether there are signs of a process consistent with lower transport costs
and market development stimulating a more diversified local economy we also examine
whether there are effects on the availability of various services and signs of livelihood
diversification, such as away from agriculture and towards trade and service activities.
Finally, we check to see whether school enrollments are affected, as might be the case if
the perceived returns to education have been altered.
Table 2 displays the mean values of these indicators across project and non-project
communes in the baseline and for subsequent survey rounds.21 These generally moved in
the expected direction over time, with a tendency to increase over the period in both
project and non-project communes. The key question then is whether there was a
differential impact attributable to the road improvements in the project communes.
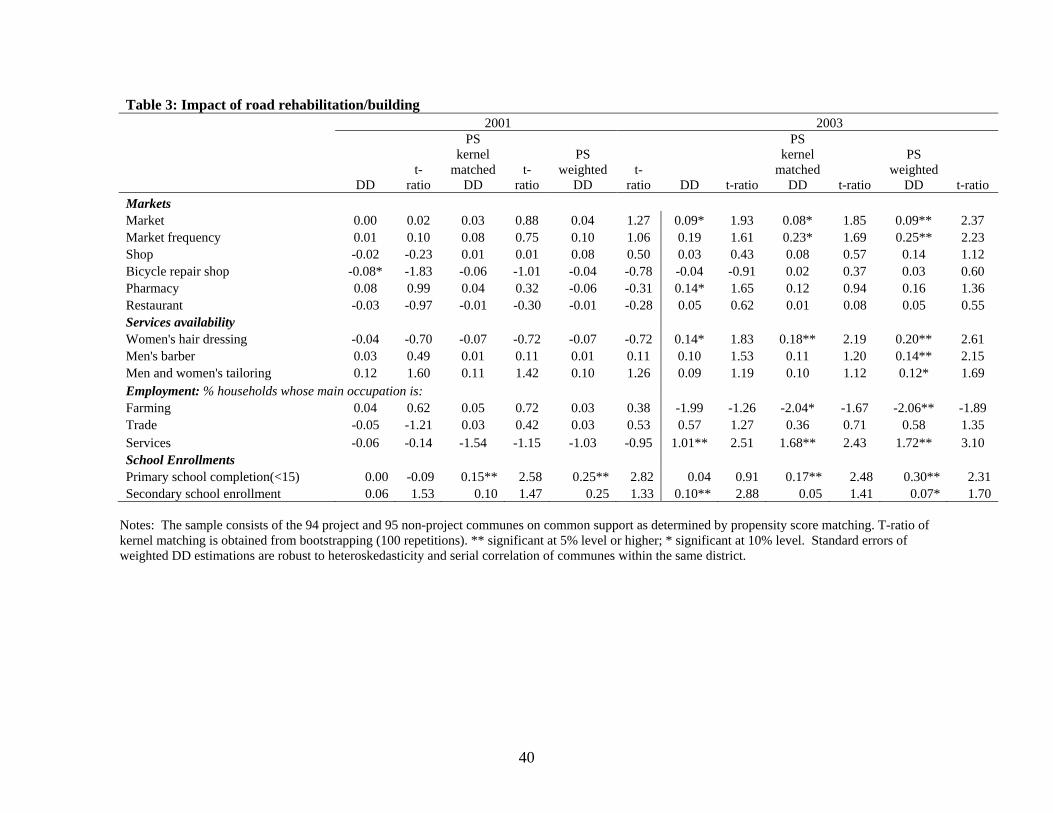
Table 3 presents DD estimates of the mean impacts using the PS-based kernel
matching and weighting methods discussed in Section 4, as well as simple DD estimates.
The estimates are given for two time periods ─ namely, 1997 to 2001 and 1997 to 2003,
referred to as the short and medium term. Under our assumptions, these estimates reflect
causal effects of the road improvements. One or two stars indicate whether each change is
significantly different from zero at the 10 and 5 percent significance levels respectively.
21 With the exception of market frequency, the employment and the school enrollment variables, other variables are dichotomous so that the numbers are interpretable as probabilities that communes have the outcome.

23
By the start of data collection for the 2001 round, 27 months had elapsed on
average since the project work ended.22 How long it takes for impacts to emerge is an
issue that often arises in discussions of road impacts and planning for their evaluation.
Here we are able to ascertain whether local area impacts were different in 2001 from those
in 2003, after two more years had elapsed.
Focusing on the PS-based estimates, and starting with impacts by 2001, we see
that across the examined indicators there is no sign of statistically significant mean
impacts in the short term. The only exception is for the primary school completion rate
which rose by 15 to 25 percent, according to the kernel matched and PS-weighted DD
respectively. Why would better roads affect primary school completion rates? Although
all communes have primary schools, secondary schools are considerably rarer. It is
plausible that a road improvement now allows children to more readily reach a secondary
school which will encourage both primary school completion and post primary
enrollments.
The results change when we track impacts through to 2003. A number of outcome
indicators now exhibit significant impacts. As a result of the road improvements, markets
became newly available in close to 10 percent more project than non-project communes
over the 7 years, and their frequency increased. However, despite small positive impacts
on commercial establishments, none are statistically significant.
By 2003, we also discover significant impacts of the road project on the services
for which we have data ─ the availability of tailoring and hairdressing services. The
weighted DD show that the probability of men and women’s hair dressing services being
22 The 2001survey was fielded about 4 months after all projects were completed. About 11% of project communes had finished their road project less than one year before.
24
available in the communes rose by 14 and 20% respectively in 2003. Consistent with
effects on market and services availability, we find evidence of impacts on employment
and livelihood patterns. Improved roads resulted in a small but significant 2 percent
decline in households relying on farming as their main source of income. A significant
increase in the share of households mainly relying on the service sector (1.7%) hints at
what alternative livelihoods these households may have switched to. This is not a trivial
impact given that only one percent of households were employed in the service sector in
the baseline. The impact on households engaged primarily in trading activities is also
positive but small and statistically insignificant. Finally, impacts on the primary school
completion rate are sustained over time and have even risen slightly. Moreover, small
effects on secondary school enrollments also appear to be emerging.
In sum, we find some support for TILD. Our results indicate significant average
impacts on the development of local markets, both their presence and frequency. The
project resulted in households switching from agriculture to non-agricultural, mostly
service-related activities, and tailoring and hairdressing services became more commonly
available. These impacts were not sharp and short-lived; they took time to emerge, only
appearing in 2003, and are thus rising over time. This is all we can say based on our two
data points. Of note too are the quicker, sustained and robust impacts on primary school
completion rates.
5.3 Heterogeneity in impacts
As implied by our theoretical model, the average treatment effects may hide
significant heterogeneity across communes. Using the PS-matched DD method and
focusing on the 2003 data, we calculate the individual treatment effects for each of the 94

25
project communes. Eyeballing these confirms that they vary substantially across
communes. Furthermore, calculating mean impacts separately for the 47 communes
below and above median predicted household consumption reveals pronounced
differences in impact estimates between relatively poorer and less-poor project
communes. Particularly striking is that impacts are generally larger for the poorer
communes. Normalizing impacts by each group’s mean value of the variable in the
baseline, we find that for 10 out of the 14 outcomes the impacts for the relatively poorer
communes exceed those for the better off ones.23
The characteristics associated with whether a commune is poor or not are likely to
interact with roads to influence their impacts. One popular hypothesis is that benefits are
highly dependent on local human capital endowments needed to take advantage of the
opportunities afforded by new roads. But, our finding that impacts are larger in poorer
communes where, as we saw in Table 1, illiteracy is also typically higher, appears to
contradict this common argument. Other hypotheses can be suggested, such as that
historical discrimination against certain social and economic groups makes it harder for
them to adopt more outward economic orientation, as required to take advantage of new
roads. Our result of generally higher impacts in consumption poor communes that also
tend to have worse attributes begs for analysis of the role of initial conditions in
determining road impacts.
To explore the covariates of road impact estimates, we use OLS regressions where
the dependent variables are the commune level impact estimates and the explanatory
variables are initial pre-project commune characteristics for the sample of 94 treatment
23 Khandker et al. (2008) also find larger impacts for the poor although their analysis is carried out at the household level.

26
communes. Potentially important, mediating physical, social and economic commune
conditions, that we also observe, include most of the variables listed in the top half of
Table 1. To these we add location in the country’s north ─ which has had a far shorter
experience with the market economy. We include the initial value of the dependent
variable/outcome measure, as well as whether the commune had a local market pre-
project, as a test of the virtuous cycle idea. Finally, to represent heterogeneities in the
actual treatment we also include quadratics in the number of months since project
completion and in the length of improved road.24 In principle one can imagine all sorts of
relationships and non-linearities between these project attributes and impacts. Time may
enhance impacts as local providers take time to set up or it may reduce them as customers
come to value access to outside providers. Under increasing returns to scale, one would
expect cumulative impacts with more time leading to higher impacts.
The interpretation of road length is a bit unclear though it is still probably better to
control for it as it represents an important difference in treatment. Typically, the project
rehabilitated what was necessary to make the road link functional. Length is thus likely to
reflect some omitted characteristic about how bad road access was prior to the project. It
is probably not interpretable as road length per se but most likely proxies for the road’s
initial condition and omitted attributes of remoteness.
Tables 4 through 8 report the results.25 For each outcome variable we present two
regressions: one with a full set of the same initial conditions (model 1) and one the result
24 We leave out transportation access and road density as they are highly correlated with other explanatory variables that we judge more important and we are limited in degrees of freedom. We also exclude measures of social services as there is little variance across communes. 25 Note that the fact that the dependent variables are estimated does not invalidate the parameter estimates or their standard errors. The estimated impact is the true impact plus an error term that ends up in the composite regression error. The overall predictive power falls but the estimates are still valid.

27
of a cumulative pruning of the highly insignificant variables (t-statistics below one),
starting with the lowest t-ratio (model 2). This serves to sharpen the picture somewhat,
given multicollinearity.
There are significant interaction effects, indicating that impacts are the result of
how the attributes of places and people interact with what the project does. Some
attributes consistently raise or reduce impacts, while a few are both complements and
substitutes to better roads in inducing local market development.
We note first that impacts are consistently and significantly reduced for communes
with a higher initial value of the outcome variable.26 These are some of the largest effects
both in terms of the magnitude of the coefficients and of their statistical power. This
strongly suggests decreasing impacts ─ whereby marginal returns are higher when
outcomes are initially lower. This is consistent with our earlier finding that impacts tend
to be higher in poorer communes.
As anticipated, several commune attributes that are widely deemed to be
disadvantageous, consistently dampen the impacts of improved roads, although not
significantly across all outcomes. For example, as we would expect, higher adult
illiteracy rates reduce the impacts of road improvements on a number of market related
outcomes ─ the presence of commercial establishments, the availability of services and
secondary school enrollments ─ consistent with human capital and infrastructure being
26 Given the number of commune attributes and outcomes, the discussion here focuses on the estimated coefficient signs rather than their magnitudes. The coefficients indicate how each attribute affects the road project’s impact on the probability of having a market or a related indicator (in the case of dichotomous variables), or its impact on the percentage change in employment or enrollments. For example, in the markets regression (Table 4), the coefficient on the initial value is -0.27 ─ meaning that the probability across communes that better roads lead to new local markets is reduced by 27% by having a market in 1997.
28
complements. On the other hand, illiteracy strengthens road impacts on the share of
households who remain farmers.
A greater distance to the closest market town significantly lowers impact on the
availability of pharmacies, tailoring and women’s hair dressing services, specialization of
households into the service sector and secondary school enrollments. The last probably
reflects the fact that distance to secondary schools is closely correlated with distance to
the market town. As expected, impacts are also generally lower for communes located in
the North where entrepreneurship and markets have been less developed historically.
A high concentration of ethnic minority households, controlling for a mountainous
location and education levels, results in significantly lower impacts on many of the same
outcomes including markets and their frequency, the availability of services and
continuation on to secondary school. This too may reflect the fact that many minorities
have less of a tradition of using markets or relying on public services due to a culture
molded by past discrimination; this is broadly consistent with the arguments and evidence
of van de Walle and Gunewardena (2001) on the sources of ethnic inequality in Vietnam.
Other commune characteristics have almost exclusively positive effects on the
impacts of improved roads. The initial presence of a market in the commune typically
significantly enhances road impacts on other market related development consistent with a
story of external benefits to local markets and the hypothesis of TILD. Unsurprisingly,
initial market presence particularly enhances impacts on the establishment of retail and
other small firms, and trading activities. It also significantly increases impacts on primary
school completion rates.

29
Population density is typically a project placement criteria as indeed it was for
RTP1. Impacts and marginal returns are expected to be higher in more densely populated
communes. We find supportive evidence for this with respect to impacts on shops and
women’s hair dressing services. More households with motorcycles indicate the degree
to which households can rapidly take advantage of the road for their transport needs,
although it may also capture an income effect. Plausibly, we find that it enhances project
impacts on the development of off-farm activities and secondary school enrollments.
A number of other commune attributes interact with road improvements to both
raise and reduce impacts depending on the outcome indicator. An often cited bottleneck
to development is lack of credit. We find evidence for this with respect to the
development of local markets. However, credit availability appears to reduce road
impacts on household diversification into trade and service sector activities. Credit has
been found to be more readily available to landed households engaging in agricultural
pursuits in rural Vietnam (Ravallion and van de Walle 2008, chapter 7). Its availability
may well coincide with other discouragements to trade and service sector activities.
A high prevalence of weather shocks and presumably a higher incidence of
episodes of commune inaccessibility significantly reduce the impacts of road
improvements on the availability of shops and school enrollments at the secondary level.
Against this, it raises impacts on primary completion rates and on the share of households
relying on the service sector for their livelihoods. Location in mountainous areas also
reveals ambiguities in its impacts across outcomes. It significantly increases road impacts
on local market development and the availability of tailoring services, reinforcing our
intuition that, holding other attributes constant, poor road conditions represent a key

30
constraint to market development in mountainous areas. Yet, mountainous location also
interacts with the project to reduce the percentage of households who derive their
livelihoods from farming and services as well as the primary completion rate.
The number of months since project completion has both positive and negative
impacts on a number of service-related indicators. Restaurants are more likely to develop
as more time elapses. More months also have a positive though decreasing impact on the
share of households relying on the service sector. On the other hand, the longer the
period, the lower the impact on the availability of tailoring services. Road impacts on
women’s hair dressing are also first negatively affected by more time passing but this is
reversed after around 50 months have gone by. Finally, the length of improved road is
significant in a number of cases but, as anticipated earlier, its interpretation is unclear.
6 Conclusions
We have studied the impacts of rural road improvements on local markets and
market-related development at the commune level in Vietnam. In particular, we have
endeavored to test whether impacts are consistent with a hypothesis of “transport-induced
local market development (TILD).” A simple theoretical model is first proposed that
suggests that impacts on local markets are a priori ambiguous and will depend on
commune level characteristics. Our empirical methods then combine a double difference
estimator with propensity score matching on pre-intervention covariates. We examine
average impacts, including the time it takes for them to emerge and whether they rise or
fall over time, but also the cross-commune differences in impacts, and the nature of those
differences, including interactions with initial geographic, community and household
31
characteristics. In this context, we focus on two specific questions that are vitally
important from a policy view point, to see what implications there might be for future
project design. Are road impacts enhanced or weakened by initially poor local market
development as is typical in poor areas? Are the covariates of road impacts congruent
across outcomes? These issues have tended to be ignored by the recent literature on
assessing rural road impacts.
There are indications of significant average impacts on the development of local
markets and related indicators. Few outcomes responded rapidly to the new and improved
roads. Most impacts are not apparent 27 months (on average) after project completion,
and only emerge in data collected two years later. We find significant average impacts on
the presence and frequency of markets and on the availability of various services. The
project also resulted in households switching from agriculture to non-agricultural, mostly
service-based, activities. Perhaps most notable, the project had significant, early and
sustained impacts on primary school completion rates. These results give qualified
support for the hypothesis of TILD.
However, it is clear from our findings that TILD oversimplifies the process. Our
findings point to substantial heterogeneity in the effects on market development. The
circumstances of a project’s location influence its impacts. On the whole, poor communes
tend to experience higher impacts on many indicators of market development. This is the
outcome of two broad sets of attributes of poor areas that tend to work in opposite
directions to influence the impacts on local markets of road improvements. On the one
hand, poor areas are less likely to have markets and market-related institutions and
services and this alone means more scope for road improvements to help develop those

32
same institutions and services. On the other hand, poor areas have various other attributes
that tend to discourage TILD. For example, poor communes in Vietnam are more likely
to have a high share of ethnic minorities and high illiteracy rates which are both uniformly
negative in their effects. They are more isolated and have lower population densities,
attributes that also tend to lessen road impacts. They are less likely to initially have a
local market which impedes development of other market-related institutions and services
in response to road improvements (separately to the fact that markets are more likely to
develop in places where they do not exist initially). Hence, we find signs of a virtuous
cycle effect whereby the impacts on small businesses, service availability, trade activities
and primary school completion rates are enhanced by the initial presence of a market.
Our results thus suggest that, on balance, the road project tended to have larger
impacts on market development in poorer communes due largely to the initially lower
market development in these places. This was strong enough to outweigh the fact that
poorer communes have other attributes (besides low initial market development) that
reduce impacts of road improvements.
The structure of the cross-commune heterogeneity in outcomes is driven by the
initial state of market development tempered by a number of commune attributes in a way
that tends to follow distinct and predictable patterns across outcome indicators. Distance
to central markets, low population density and high minority populations, high adult
illiteracy and location in the North all consistently dampen road impacts.
These findings can be exploited by project design to promote larger development
impacts. They suggest that small road improvement projects such as RTP1 could have
vastly larger impacts on local market development if they were targeted to places with

33
initially lower market development, and equally important, accompanied by
complementary social and economic policies aimed at improving certain attributes (e.g.
adult literacy) or reducing the disadvantages of others (policies to reverse the effects of
historical discrimination towards ethnic minority groups) that interact with roads to reduce
their impacts.
34
References Abadie, Alberto, and Guido Imbens. 2006. “On the Failure of the Bootstrap for Matching Estimators.” Unpublished manuscript, University of California, Berkeley. Bryceson, Deborah, Annabel Bradbury and Trevor Bradbury. 2008. “Roads to poverty reduction? Exploring rural roads’ impact on mobility in Africa and Asia,” Development Policy Review, 26(4): 459-482 Chen, Shuahoa, Ren Mu and Martin Ravallion. 2007. “Are There Lasting Impacts of Aid to Poor Areas? Evidence from Rural China.” Policy Research Working Paper 4084, World Bank, Washington, DC. Dercon, Stefan, Daniel Gilligan, John Hoddinott, and Tassew Woldehanna. 2006. “The Impact of Roads and Agricultural Extension on Consumption Growth and Poverty in Fifteen Ethiopian Villages.” CSAE WPS 2007-01, University of Oxford, UK Escobal, Javier and Carmen Ponce. 2004. “The Benefits of Rural Roads: Enhancing Income Opportunities for the Rural Poor.” GRADE Working Paper 40, Lima Peru. Fafchamps, Marcel and Bart Minten. 1999. “Relationships and Traders in Madagascar.” Journal of Development Studies 35(6): 1-35. Fan, S., Pham. L.H. and Trinh. Q.L. (2004) ‘Governing Spending and Poverty Reduction in Vietnam’, mimeo, World Bank, Washington DC. Fforde, Adam and Stefan de Vylder. 1996. From Plan to Market: The Economic Transition in Vietnam. Westview Press: Boulder Colorado. Galasso, Emanuela and Martin Ravallion. 2005. “Decentralized Targeting of an Antipoverty Project.” Journal of Public Economics 89: 705-727. Gannon, Colin and Zhi Liu. 1997. “Poverty and Transport,” TWU discussion papers, TWU-30, World Bank, Washington, DC. Heckman, James, H. Ichimura, and Petra Todd. 1997. “Matching as an Econometric Evaluation Estimator: Evidence from Evaluating a Job Training Program.” Review of Economic Studies 64: 605-654. Hirano, Keisuke and Guido Imbens. 2002. “Estimation of Causal Effects using Propensity Score Weighting: An Application to Data on Right Heart Catheterization.” Health Services and Outcomes Research Methodology 2: 259-278. Hirano, Keisuke, Guido Imbens and Geert Ridder. 2003. “Efficient Estimation of Average Treatment Effects Using the Estimated Propensity Score.” Econometrica 71: 1161-1189.
35
Jalan, Jyotsna and Martin Ravallion. 1998. “Are There Dynamic Gains from a Poor-area Development Program?” Journal of Public Economics 67: 65-86.
Kerkvliet, Benedict and Doug Porter. 1995. Vietnam’s Rural Transformation. Westview Press: Boulder Colorado. Khandker, Shahidur, Zaid Bakht and Gayatri Koolwal. 2008. “The Poverty Impact of Rural Roads: Evidence from Bangladesh.” Economic Development and Cultural Change forthcoming. Krugman, Paul. 1991. “Increasing Returns and Economic Geography.” Journal of Political Economy 99:485-99. Lokshin, Michael and Ruslan Yemtsov. 2005. “Has Rural Infrastructure Rehabilitation In Georgia Helped the Poor?” The World Bank Economic Review 19(2): 311-333. Liu, Shao-hua. 2007. “Emerging Modernity in a Periodic Marketplace of Southwest China.” Taiwan Journal of Anthropology 5(2): 1-30. Luu, Thanh Duc Hai. 2003. The Organization of the Liberalized Rice Market in Vietnam. PhD thesis, University of Groningen, The Netherlands. Masschaele, James. 2002. “The Public Space of the Marketplace in Medieval England”, Speculum 77: 383-421. Minot, Nicholas, Bob Baulch and Michael Epprecht. (2006) ‘Poverty and Inequality in Vietnam” Spatial Pattens and Geographic Determinants’ IPFRI Research Report 148, Washington, DC Ravallion, Martin and Dominique van de Walle. 2008. Land in Transition: Reform and Poverty in Rural Vietnam. Palgrave Macmillan and World Bank. Rosenbaum, Paul and Donald Rubin. 1983. “The Central Role of the Propensity Score in Observational Studies for Causal Effects.” Biometrika 70: 41-55. Skinner, William. 1965. “Marketing and Social Structure in Rural China, Part I,” Journal of Asian Studies 24(1): 3-43. Skinner, William. 1985. “Rural Marketing in China: Repression and Revival.” The China Quarterly 103: 393-413. van de Walle Dominique and Dileni Gunewardena. 2001. “Sources of Ethnic Inequality in Vietnam.” Journal of Development Economics 65(1): 177-207.

36
van de Walle, Dominique and Ren Mu. 2007. “Fungibility and the Flypaper Effect of Project Aid: Micro-evidence for Vietnam.” Journal of Development Economics 84(2): 667-685. World Bank. 1996. “Rural Transport Project Staff Appraisal Report No. 15537-VN.” East Asia and Pacific Region, World Bank, Washington, DC.
37
Figure 1: Presence of a commune market in the baseline (a) By distance to the central market
Middle
Close
Far
-.2
0.2
.4.6
.8C
om
mun
e ha
s a
ma
rke
t in
199
7
7 7.5 8 8.5Commune mean per capita consumption
(b) By poor and non-poor communes
Non-poor
Poor
0.2
.4.6
.81
Co
mm
une
has
a m
ark
et
0 7 10 15 25 35 45Distance to the closest central market
Note: These are non-parametric regressions, using locally weighted smoothed scatter plots. The unit of observation is the commune. One third of all communes are ‘close’ or within 7 kilometers of a central market; the ‘middle’ distance third are between 7 and 15 km from the market; while the ‘far’ communes are more than 15 km from the market. Non-poor and poor communes are defined as those above or below the sample median commune per capita consumption based on aggregated predicted household consumption.
38
Table 1: Mean baseline characteristics and outcome variables for communes classified by median household per capita consumption (log)
Below median
(1)
Above median
(2) Difference
(1-2) t-ratio Baseline commune characteristics Typology: mountain 0.70 0.33 0.38** 5.55 Distance to closest central market (km) 15.53 9.39 6.14** 4.64 Share of households owning motorcycles 0.06 0.09 -0.03* -2.77 Population density 2.01 5.50 -3.48** -6.67 Ethnic minority share 0.66 0.20 0.47** 10.03 Adult illiteracy rate 0.25 0.04 0.21** 7.34 Flood and storm prevalence 0.60 0.62 -0.03 -0.35 Credit availability 0.01 0.07 -0.06** -2.17 North provinces 0.54 0.68 -0.14** -2.01 Transportation accessibility 0.23 0.31 -0.08* -1.76 Road density 0.01 0.03 -0.01** -3.47 Baseline market related outcome variables Market availability 0.32 0.63 -0.31** -4.50 Market frequency 0.72 1.45 -0.73** -4.12 Shop 0.39 0.57 -0.18** -2.59 Bicycle repair shop 0.53 0.88 -0.36** -6.03 Pharmacy 0.34 0.74 -0.40** -6.12 Restaurant 0.23 0.44 -0.21** -3.21 Women's hair dressing 0.32 0.48 -0.16** -2.27 Men’s barber 0.42 0.75 -0.32** -4.92 Men and women's tailoring 0.51 0.81 -0.30** -4.71 % farm households 93.94 86.27 7.67** 3.59 % trade households 1.16 1.69 -0.53* -1.74 % service sector households 0.71 1.05 -0.33 -1.10 Primary school completion (<15) 0.24 0.36 -0.12** -4.40 Secondary school enrollment rate 0.75 0.92 -0.17** -4.71
Note: The sample consists of all 200 communes. ** significant at 5% level or higher; * significant at 10% level. Flood and storm prevalence summarizes the average incidence between 1997 and 2003; Credit availability averages dummy variables for the availability of credit from the following sources: the Agricultural Bank, commercial banks, the Bank for the Poor, credit coops/ people’s credit funds, government programs, mass organizations, international projects and NGOs; Transportation accessibility averages dummy variables for the presence of provincial and national roads, railways and waterways. Many outcome variables are dichotomous referring to whether the outcome is present in the commune. The exceptions are: market frequency which takes the values 0 for no market, 1 for once per week or less, 2 for more than once a week, 3 for permanent market; the % of households in various occupations refers to their main source of income; the primary completion rate is defined as the share of children 15 and under who completed primary school; the secondary school enrollment rate is the share of children who graduated from primary school in the previous year who are enrolled in secondary school.

39
Table 2: Outcome variable means 1997 2001 2003 project non-project project non-project project non-project
Local market development Market 0.51 0.44 0.57 0.51 0.62 0.46 Market frequency 1.13 1.05 1.29 1.20 1.43 1.16 Shop 0.63 0.59 0.82 0.80 0.84 0.77 Bicycle repair shop 0.76 0.65 0.80 0.78 0.87 0.81 Pharmacy 0.62 0.58 0.73 0.62 0.69 0.52 Restaurant 0.35 0.33 0.50 0.41 0.52 0.44 Services availability Women's hair dressing 0.38 0.39 0.46 0.51 0.66 0.53 Men's barber 0.59 0.58 0.72 0.68 0.85 0.75 Men and women's tailoring 0.65 0.66 0.82 0.72 0.84 0.77 Employment: % households whose main occupation is: Farming 89.53 90.67 89.65 91.07 87.02 90.15 Trade 1.45 1.41 1.73 1.75 3.17 2.56 Services 1.12 0.54 1.42 1.52 3.20 1.60 School Enrollments Primary school completion(<15) 0.31 0.31 0.32 0.32 0.39 0.35 Secondary school enrollment 0.80 0.88 0.91 0.94 0.92 0.91 Notes: The sample consists of the 94 project and 95 non-project communes on common support as determined by propensity score matching. Many outcome variables are dichotomous referring to whether the outcome is present in the commune. The exceptions are: market frequency which takes the values 0 for no market, 1for once per week or less, 2 for more than once a week, 3 for permanent market; the % of households in various occupations refers to their main source of income; the primary completion rate is defined as the share of children 15 and under who completed primary school; the secondary school enrollment rate is the share of children who graduated from primary school in the previous year who are enrolled in secondary school.
40
Table 3: Impact of road rehabilitation/building 2001 2003
DD t-
ratio
PS kernel
matched DD
t-ratio
PS weighted
DD t-
ratio DD t-ratio
PS kernel
matched DD t-ratio
PS weighted
DD t-ratio
Markets Market 0.00 0.02 0.03 0.88 0.04 1.27 0.09* 1.93 0.08* 1.85 0.09** 2.37 Market frequency 0.01 0.10 0.08 0.75 0.10 1.06 0.19 1.61 0.23* 1.69 0.25** 2.23 Shop -0.02 -0.23 0.01 0.01 0.08 0.50 0.03 0.43 0.08 0.57 0.14 1.12 Bicycle repair shop -0.08* -1.83 -0.06 -1.01 -0.04 -0.78 -0.04 -0.91 0.02 0.37 0.03 0.60 Pharmacy 0.08 0.99 0.04 0.32 -0.06 -0.31 0.14* 1.65 0.12 0.94 0.16 1.36 Restaurant -0.03 -0.97 -0.01 -0.30 -0.01 -0.28 0.05 0.62 0.01 0.08 0.05 0.55 Services availability Women's hair dressing -0.04 -0.70 -0.07 -0.72 -0.07 -0.72 0.14* 1.83 0.18** 2.19 0.20** 2.61 Men's barber 0.03 0.49 0.01 0.11 0.01 0.11 0.10 1.53 0.11 1.20 0.14** 2.15 Men and women's tailoring 0.12 1.60 0.11 1.42 0.10 1.26 0.09 1.19 0.10 1.12 0.12* 1.69 Employment: % households whose main occupation is: Farming 0.04 0.62 0.05 0.72 0.03 0.38 -1.99 -1.26 -2.04* -1.67 -2.06** -1.89 Trade -0.05 -1.21 0.03 0.42 0.03 0.53 0.57 1.27 0.36 0.71 0.58 1.35 Services -0.06 -0.14 -1.54 -1.15 -1.03 -0.95 1.01** 2.51 1.68** 2.43 1.72** 3.10 School Enrollments Primary school completion(<15) 0.00 -0.09 0.15** 2.58 0.25** 2.82 0.04 0.91 0.17** 2.48 0.30** 2.31 Secondary school enrollment 0.06 1.53 0.10 1.47 0.25 1.33 0.10** 2.88 0.05 1.41 0.07* 1.70
Notes: The sample consists of the 94 project and 95 non-project communes on common support as determined by propensity score matching. T-ratio of kernel matching is obtained from bootstrapping (100 repetitions). ** significant at 5% level or higher; * significant at 10% level. Standard errors of weighted DD estimations are robust to heteroskedasticity and serial correlation of communes within the same district.

41
Table 4: Impact heterogeneity: Market and market frequency Market Market frequency model 1 model 2 model 1 model 2 1997 value -0.26** -0.27** -0.30** -0.30** (-4.85) (-4.81) (-4.92) (-4.86) Distance to central market/100 0.09 -0.54 (0.19) (-0.48) North province -0.04 -0.35* -0.44** (-0.68) (-1.86) (-2.87) Typology: mountain 0.19 0.18** 0.43 0.37 (1.57) (2.27) (1.23) (1.58) Flood and storm prevalence -0.03 -0.31 (-0.20) (-0.65) Population density/100 0.01 -0.25 (0.01) (-0.08) Ethnic minority share -0.35* -0.27** -1.20** -0.94** (-1.86) (-2.28) (-2.22) (-2.50) Adult illiteracy rate 0.15 0.54 (0.91) (1.04) Share of h'holds owning motorcycles/100 0.82 0.85 0.68 (1.46) (1.69) (0.49) Credit availability 0.39** 0.36** 1.16** 1.01** (2.48) (2.11) (2.36) (2.08) Length of road rehabilitated -0.02* -0.02** -0.04 -0.01 (-1.86) (-2.25) (-1.22) (-1.20) Length squared/100 0.04 0.05* 0.08 (1.50) (1.92) (0.93) Months since project completion 0.02 0.03 (0.71) (0.42) Months squared/100 -0.02 -0.04 (-0.82) (-0.49) Constant -0.13 0.22** 0.39 0.85** (-0.19) (2.23) (0.18) (3.65) R-squared 0.37 0.35 0.34 0.30
Note: The dependent variables are the 94 estimated commune specific impacts for 2003. Standard errors are clustered at the district level of which there are 29. T-statistics are given in parentheses. ** significant at 5% level or higher; * significant at 10% level. Market is a zero/one dummy for whether a market exists in the commune. Market frequency takes the value 0 for no market; 1 for once a week or less; 2 for more than once a week and 3 for permanent market.

42
Table 5: Impact heterogeneity: Retail and other commercial establishments Shop Bicycle repair shop Pharmacy Restaurant model 1 model 2 model 1 model 2 model 1 model 2 model 1 model 2 1997 value -0.96** -0.98** -0.84** -0.86** -0.71** -0.72** -0.66** -0.63** (-10.02) (-11.30) (-6.05) (-6.06) (-7.03) (-7.63) (-5.11) (-5.98) Distance to central market/100 0.55 -0.79 -0.87 -0.76 -0.77* -0.70 (0.94) (-1.15) (-1.61) (-1.39) (-1.75) (-1.11) North province -0.32** -0.32** -0.01 0.04 0.07 (-3.04) (-2.90) (-0.08) (0.38) (0.53) Typology: mountain 0.19 0.21 0.04 0.01 0.08 (1.28) (1.65) (0.49) (0.13) (0.63) Flood and storm prevalence -0.38* -0.39* 0.05 -0.11 -0.01 (-1.83) (-2.02) (0.41) (-0.84) (-0.04) Population density/100 3.18* 2.79* 0.26 0.30 -0.57 (1.90) (1.83) (0.36) (0.21) (-0.30) Ethnic minority share 0.21 0.17 -0.09 -0.02 0.09 0.15 (1.30) (1.24) (-0.57) (-0.11) (0.67) (1.41) Adult illiteracy rate -0.52** -0.53** -0.50* -0.63** -0.40 -0.42** -0.37 -0.37* (-2.14) (-3.42) (-1.76) (-2.50) (-1.60) (-2.21) (-1.57) (-1.74) Share of h'holds owning motorcycles/100 0.40 0.45 0.43 0.67 0.69 0.10 (0.73) (1.21) (1.20) (0.97) (1.15) (0.13) Credit availability -0.02 -0.06 0.16 -0.22 (-0.07) (-0.32) (0.75) (-0.70) Commune has a market in 1997 0.22** 0.22** 0.10* 0.10 0.34** 0.36** 0.32** 0.32** (2.44) (2.57) (1.72) (1.58) (3.81) (4.30) (3.29) (3.86) Length of road rehabilitated/100 -0.48 -1.29 -1.75 -1.45 2.23 2.39 (-0.33) (-0.87) (-1.61) (-1.67) (1.45) (1.67) Length squared/104 1.21 2.87 3.57 0.03 -4.56 -0.05* (0.38) (0.63) (1.18) (1.09) (-1.34) (-1.70) Months since project completion/100 0.27 1.50 -0.30 1.03 -0.33 1.13** (0.07) (0.55) (-1.15) (0.32) (-0.09) (3.49) Months squared/104 -0.07 -1.69 -1.09 1.31 (-0.02) (-0.64) (-0.35) (0.38) Constant 0.48 0.70** 0.54 0.94** 0.36 0.59** -0.43 -0.70** (0.53) (4.20) (0.75) (4.50) (0.45) (3.17) (-0.46) (-3.61) R-squared 0.58 0.57 0.56 0.54 0.50 0.48 0.49 0.48
Note: The dependent variables are the 94 estimated commune specific impacts for 2003. Standard errors are clustered at the district level of which there are 29. T-statistics are given in parentheses. ** significant at 5% level or higher; * significant at 10% level. All outcomes refer to availability in the commune.
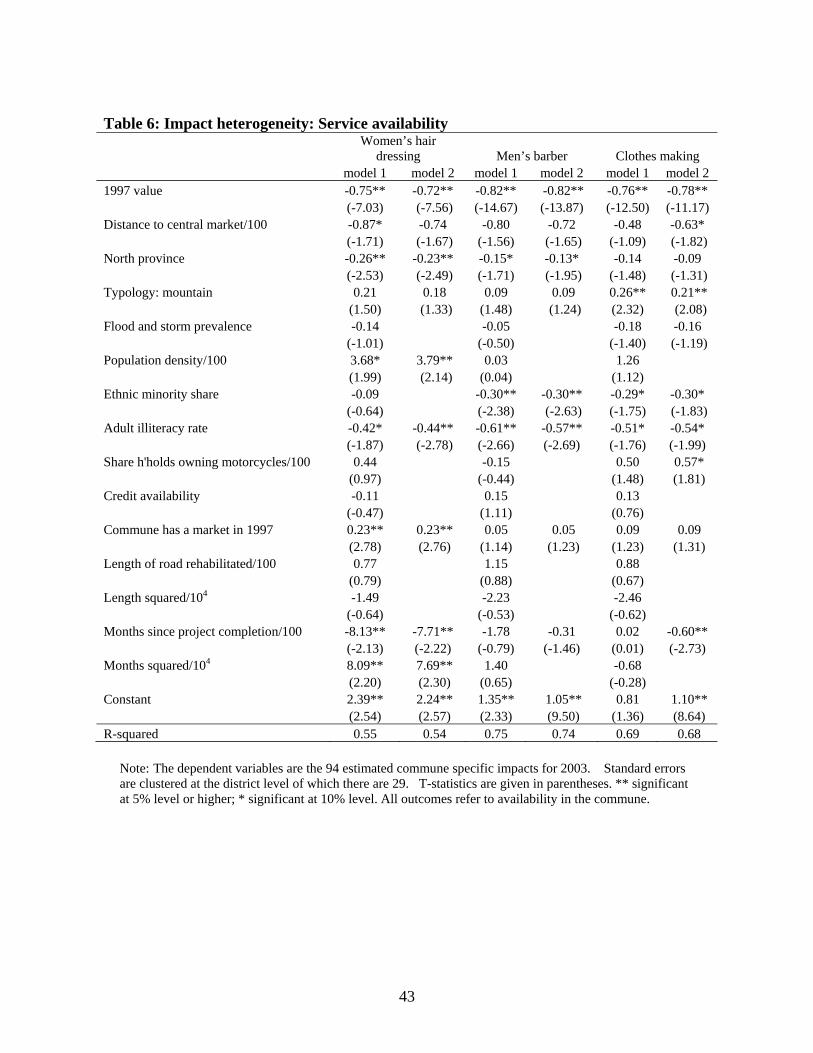
43
Table 6: Impact heterogeneity: Service availability
Women’s hair
dressing Men’s barber Clothes making model 1 model 2 model 1 model 2 model 1 model 2 1997 value -0.75** -0.72** -0.82** -0.82** -0.76** -0.78** (-7.03) (-7.56) (-14.67) (-13.87) (-12.50) (-11.17) Distance to central market/100 -0.87* -0.74 -0.80 -0.72 -0.48 -0.63* (-1.71) (-1.67) (-1.56) (-1.65) (-1.09) (-1.82) North province -0.26** -0.23** -0.15* -0.13* -0.14 -0.09 (-2.53) (-2.49) (-1.71) (-1.95) (-1.48) (-1.31) Typology: mountain 0.21 0.18 0.09 0.09 0.26** 0.21** (1.50) (1.33) (1.48) (1.24) (2.32) (2.08) Flood and storm prevalence -0.14 -0.05 -0.18 -0.16 (-1.01) (-0.50) (-1.40) (-1.19) Population density/100 3.68* 3.79** 0.03 1.26 (1.99) (2.14) (0.04) (1.12) Ethnic minority share -0.09 -0.30** -0.30** -0.29* -0.30* (-0.64) (-2.38) (-2.63) (-1.75) (-1.83) Adult illiteracy rate -0.42* -0.44** -0.61** -0.57** -0.51* -0.54* (-1.87) (-2.78) (-2.66) (-2.69) (-1.76) (-1.99) Share h'holds owning motorcycles/100 0.44 -0.15 0.50 0.57* (0.97) (-0.44) (1.48) (1.81) Credit availability -0.11 0.15 0.13 (-0.47) (1.11) (0.76) Commune has a market in 1997 0.23** 0.23** 0.05 0.05 0.09 0.09 (2.78) (2.76) (1.14) (1.23) (1.23) (1.31) Length of road rehabilitated/100 0.77 1.15 0.88 (0.79) (0.88) (0.67) Length squared/104 -1.49 -2.23 -2.46 (-0.64) (-0.53) (-0.62) Months since project completion/100 -8.13** -7.71** -1.78 -0.31 0.02 -0.60** (-2.13) (-2.22) (-0.79) (-1.46) (0.01) (-2.73) Months squared/104 8.09** 7.69** 1.40 -0.68 (2.20) (2.30) (0.65) (-0.28) Constant 2.39** 2.24** 1.35** 1.05** 0.81 1.10** (2.54) (2.57) (2.33) (9.50) (1.36) (8.64) R-squared 0.55 0.54 0.75 0.74 0.69 0.68
Note: The dependent variables are the 94 estimated commune specific impacts for 2003. Standard errors are clustered at the district level of which there are 29. T-statistics are given in parentheses. ** significant at 5% level or higher; * significant at 10% level. All outcomes refer to availability in the commune.
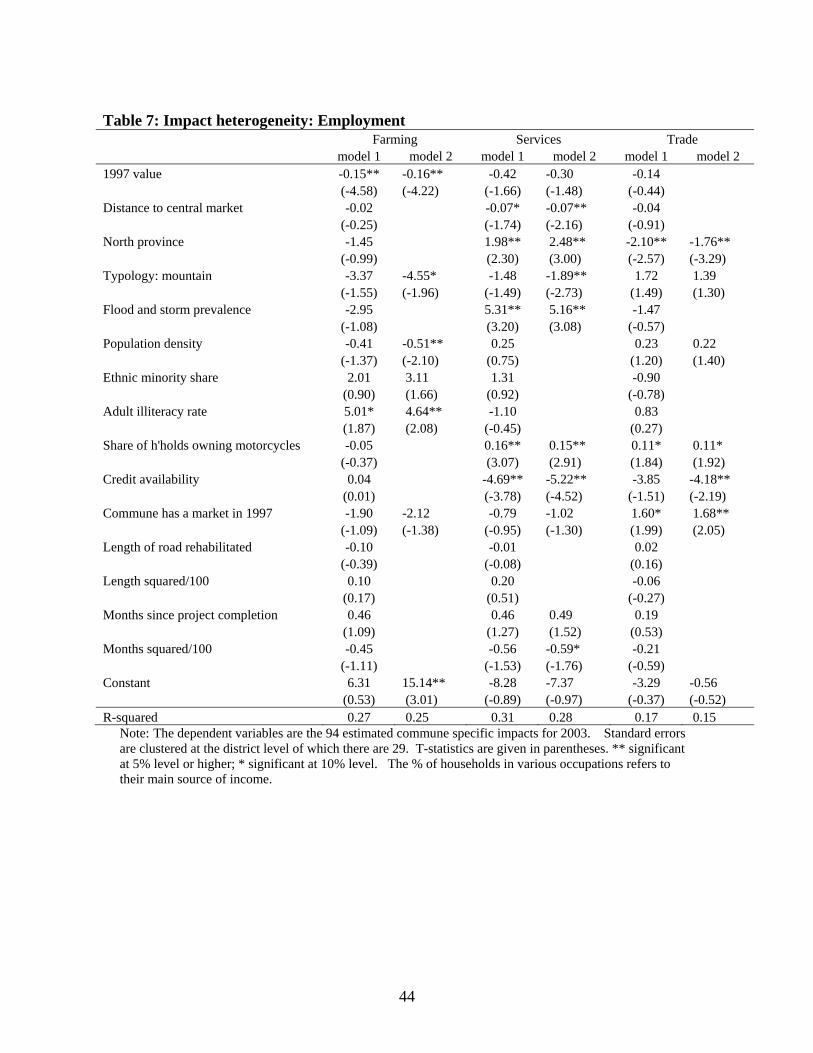
44
Table 7: Impact heterogeneity: Employment Farming Services Trade model 1 model 2 model 1 model 2 model 1 model 2 1997 value -0.15** -0.16** -0.42 -0.30 -0.14 (-4.58) (-4.22) (-1.66) (-1.48) (-0.44) Distance to central market -0.02 -0.07* -0.07** -0.04 (-0.25) (-1.74) (-2.16) (-0.91) North province -1.45 1.98** 2.48** -2.10** -1.76** (-0.99) (2.30) (3.00) (-2.57) (-3.29) Typology: mountain -3.37 -4.55* -1.48 -1.89** 1.72 1.39 (-1.55) (-1.96) (-1.49) (-2.73) (1.49) (1.30) Flood and storm prevalence -2.95 5.31** 5.16** -1.47 (-1.08) (3.20) (3.08) (-0.57) Population density -0.41 -0.51** 0.25 0.23 0.22 (-1.37) (-2.10) (0.75) (1.20) (1.40) Ethnic minority share 2.01 3.11 1.31 -0.90 (0.90) (1.66) (0.92) (-0.78) Adult illiteracy rate 5.01* 4.64** -1.10 0.83 (1.87) (2.08) (-0.45) (0.27) Share of h'holds owning motorcycles -0.05 0.16** 0.15** 0.11* 0.11* (-0.37) (3.07) (2.91) (1.84) (1.92) Credit availability 0.04 -4.69** -5.22** -3.85 -4.18** (0.01) (-3.78) (-4.52) (-1.51) (-2.19) Commune has a market in 1997 -1.90 -2.12 -0.79 -1.02 1.60* 1.68** (-1.09) (-1.38) (-0.95) (-1.30) (1.99) (2.05) Length of road rehabilitated -0.10 -0.01 0.02 (-0.39) (-0.08) (0.16) Length squared/100 0.10 0.20 -0.06 (0.17) (0.51) (-0.27) Months since project completion 0.46 0.46 0.49 0.19 (1.09) (1.27) (1.52) (0.53) Months squared/100 -0.45 -0.56 -0.59* -0.21 (-1.11) (-1.53) (-1.76) (-0.59) Constant 6.31 15.14** -8.28 -7.37 -3.29 -0.56 (0.53) (3.01) (-0.89) (-0.97) (-0.37) (-0.52) R-squared 0.27 0.25 0.31 0.28 0.17 0.15
Note: The dependent variables are the 94 estimated commune specific impacts for 2003. Standard errors are clustered at the district level of which there are 29. T-statistics are given in parentheses. ** significant at 5% level or higher; * significant at 10% level. The % of households in various occupations refers to their main source of income.

45
Table 8: Impact heterogeneity: Schooling
Secondary school enrollment Primary school
completion model 1 model 2 model 1 model 2 1997 value -1.08** -1.09** -1.16** -1.24** (-13.75) (-14.62) (-6.53) (-9.21) Distance to central market/100 -0.28* -0.32** -0.32 (-2.01) (-2.38) (-0.60) North province -0.02 0.03 (-0.53) (0.41) Typology: mountain -0.00 -0.06 -0.11* (-0.04) (-0.82) (-1.85) Flood and storm prevalence -0.20** -0.20** 0.48** 0.45** (-2.13) (-2.38) (3.47) (3.60) Population density/100 -0.71 -0.90 0.65 (-0.76) (-1.23) (0.47) Ethnic minority share -0.12* -0.13** 0.07 (-2.03) (-2.35) (0.58) Adult illiteracy rate -0.41** -0.40** -0.06 (-2.27) (-2.36) (-0.30) Share of h'holds owning motorcycles/100 0.47** 0.54** 1.01 0.89 (3.88) (4.09) (1.67) (1.59) Credit availability 0.04 -0.18 (0.49) (-0.81) Commune has a market in 1997 0.02 0.15 0.15** (0.91) (1.66) (2.16) Length of road rehabilitated -0.01 -0.01 0.02* 0.02* (-1.25) (-1.48) (1.91) (1.81) Length squared/100 0.01 0.02 -0.04* -0.04* (1.12) (1.25) (-1.85) (-1.83) Months since project completion/100 0.44 -3.44 (0.65) (-1.14) Months squared/104 -0.57 3.02 (-0.72) (1.07) Constant 1.07** 1.17** 1.07 0.20** (5.42) (12.41) (1.24) (2.19) R-squared 0.76 0.75 0.50 0.47
Note: The dependent variables are the 94 estimated commune specific impacts for 2003. Standard errors are clustered at the district level of which there are 29. T-statistics are given in parentheses. ** significant at 5% level; * significant at 10% level. The primary completion rate is defined as the share of children 15 and under who completed primary school; the secondary school enrollment rate is the share of children who graduated from primary school in the previous year who are enrolled in secondary school.