Rural Poverty Monitoring Survey in Vietnam - PEP-NET Socio-Economic Development Centre Hanoi -...
47
International Development Research Centre Centre de recherches pour le développement international Rural Poverty Monitoring Survey in Vietnam Vu Tuan Anh Socio-Economic Development Centre Hanoi, Vietnam Paper Presented at the Micro Impacts of Macroeconomic and Adjustment Policies (MIMAP) Third Annual Meeting November 2-6, 1998 Kathmandu, Nepal
Transcript of Rural Poverty Monitoring Survey in Vietnam - PEP-NET Socio-Economic Development Centre Hanoi -...

International Development Research CentreCentre de recherches pour le développement international
Rural Poverty Monitoring Survey in Vietnam
Vu Tuan Anh
Socio-Economic Development CentreHanoi, Vietnam
Paper Presented at the
Micro Impacts of Macroeconomicand Adjustment Policies (MIMAP)
Third Annual Meeting
November 2-6, 1998Kathmandu, Nepal

2
Socio-Economic Development Centre
Hanoi - OCTOBER 1998
RURAL POVERTY MONITORING SURVEY
IN VIETNAM
VU TUAN ANH
INTRODUCTION
Starting in the late 1970's and the early 1980's from numerous adjustments of policytowards liberalisation and marketization in a number of economic domains, Vietnam'seconomic reform has contributed to speeding up economic growth and creating a structuralchange in the state economic sector and in the private one, as well. This has given rise tochanges in social value and structure, and finally to multiple reforms in the system oflegislation, institution and administration. Those changes in policy have led and are leadingto the change in Vietnam's pattern of socio-economic development. In the past decade,one has witnessed a shift from centrally planned economy to an economy operatingaccording to the market mechanism, from an economy in which the state played a decisiverole in nearly all economic activities to a mixed economy in which the state sector is beingrestructured and the private sector is encouraged to develop.
Despite of successes in economic growth and restructuring, poverty still remains one of themost actual problems in the present development process in Vietnam. A significantpercentage of population is still low-income earners with purchasing power below thedesired standard. They also lack capital for production. Underemployment is very serious inboth urban and rural areas. The tendency of increased differentiation in income earningscoupled with the low access capacity of the poor to public services such as education andtraining, medical services are now rendering more tense still the social relations among thepopulation. Poverty is more serious in rural areas where about 80% of Vietnamese areliving.
For policy purposes the foremost issue is the poverty monitoring. There is a great demandof governmental authorities and non-governmental organisations for poverty measurementand assessment. Several living standards monitoring surveys with different methodologieshave been conducted in Vietnam and they have been reaching different statements onpoverty rate.
Initiated in the middle of 1996, the research project on “Rural Poverty Monitoring inVietnam” has been working out a methodology of poverty monitoring in rural areas, whichbased on participatory principles.
This paper will present major research findings relating to the pilot poverty monitoringsurvey conducted by the project in the last year. The paper consists of three parts. The firstpart presents an overview on poverty monitoring surveys in Vietnam. The second partpresents results of MIMAP's poverty survey at the commune level. The third part presentssurvey results at household level.

3
1. POVERTY MONITORING SURVEYS IN VIETNAM
1.1. Types of poverty monitoring surveys:
Theoretically speaking, there are various types of surveys containing information onpoverty. Each type has its advantages and disadvantages for poverty monitoring andassessment.
a/ By the scope of the surveys it could be divided onto case-study surveys and nation-widecensus.
The national census or household survey is usually multi-topic to serve the forming ofmacro-policies, in particular for inventory purposes (such as population, housing, land, etc.).It can absorb much manpower and finance. It may have sparser frequency rate (2-5 years atime) and a relatively small number of samples. The living standard assessment systemmay include statistic indicators formed by complex formulas of calculation or thoserequiring synthesis from many questions and types of observation and measurement.
Case-study surveys are usually used in the research, baseline study, evaluation ofdevelopment projects, and in particular, poverty monitoring.
b/ By the objective of surveys it could be divided onto single-topic and multi-topic surveys.
Multi-topic surveys often contain various information, such as income and expenditures ofhouseholds and individuals, family structure, education, health, employment, income-generating activities, habitat, etc. The advantage of this type of surveys is that the differentvariables can be correlated.
A typical example of the multi-topic surveys is the World Bank's Living StandardMeasurement Survey (LSMS). This very large household survey usually consists of threecomponents: household, community and prices. The household survey component is thelargest and most time-consuming of the three mentioned components. It is aimed to collectcomprehensive information on household's and individual's income (formal and informal,primary and secondary), consumption of food, non-durable and durable goods, andservices, quality of life. Questionnaires cover household composition, spending, savings,employment, income, private transfers, education, health, fertility, nutrition, etc.
The second component of the LSMS - community level survey - focus on conditions of ruralcommunities which are relevant to all households in a given locale, especially access tocommunity infrastructure and basic social services. The questionnaires of this survey isgenerally administered to the community leaders and staff of community facilities such asschool and health clinics.
The third component of the LSMS - price survey - is designed to measure purchasingpower. The questionnaire focuses on price of the most important purchases and sales bylow-income households, including consumer prices from local markets for food and non-food items, prices of main products, services.
The LSMS generally uses a national, random sample. The survey budget decides mostlythe size of samples. The first Vietnam LSMS in 1993 covering 4800 households costUSD2 million. The second Vietnam LSMS is conducted currently (1998) with a doublenumber of household samples.

4
The turn-around time between sample/questionnaire design and analysis of results is long,approximately 1.5 - 2 years.
The LSMS is labour intensive. It involves the staff of national statistical office. However, thedata analysis is done in WB's headquarters. Therefore, almost no national capacity buildingin data analysis and assessment has been occurred. Additionally, although efforts of somedonor agencies to transfer data, software and hardware to national authorities, little ofnational staff use the LSMS data in their policy making process.
c/ By the characteristics of information collected it could be divided onto qualitative andquantitative surveys.
Quantitative methods of surveys are usually used by economics and statisticians. Thequantitative approach has its roots in the exact scientific methods. Quantitative methodscould be used for defining poverty in external terms, such as physical basic needsdeprivation due to consumption shortfalls, and for describing the concepts in terms of theirmeasurable and observable characteristics. In order to reach a representation, quantitativesurveys should cover a enough large size of samples.
Qualitative methods used by anthropologists, sociologists and political scientists. They arebased on interpretative understanding of social meaning. Qualitative approach actuallycontains some qualitative data, but much information collected by this type of survey cannotbe translated into quantitative terms. Qualitative methods tend to use an interactive(internal/external) process to understand both the constituents and their sources of well-being, which precludes their definition by external agents. The qualitative surveys usuallyattempt to emphasize the viewpoint of observed. They have a strong participatory base.
Qualitative surveys often tend to focus on in-depth assessment of small sample sizes andtherefore less costly and have faster turn-around times than large quantitative survey.
A poverty monitoring survey belong has narrow target of assessing poverty of eachcommunity in order to have specific treatment of poverty. By the purpose, it is a single-topicsurvey. By the scope, it is usually a case-study survey. And by characteristics of informationit uses both quantitative and qualitative methods.
This survey type can be done in each community (village, district, region, etc.) according tosome levels: community, household or individual. This survey can be done by cadres on thespot with application of the participatory principle, and its cost will be directly financed bythe local authorities. The data will be gathered and processed without delay uniformly andsimply and used immediately to carry out measures of poverty reduction in the community(e.g. used for the program of preventing malnutrition, raising the educational level, loans forthe poor). By this character, the questionnaire and the process of survey must be simple,the system of indicators must be easy to calculate.
1.2. Poverty related surveys in Vietnam:
In the mid-1980s some institutions and researchers began to study poverty in Vietnam.Some investigations of the real state of the agricultural economy, the peasants life and thepopulation's living standard as a whole were conducted. Following are the noticeable ones:

5
- In 1990 the Central Department of Agriculture and the Ministry of Agriculture and FoodIndustry investigated the real situation of agriculture and the countryside in 5 provinces withabout 5000 household samples. This investigation gathered data on income of peasanthouseholds [The Central Department of Agriculture, 1991].
- In 1991 the Ministry of Agriculture and Food Industry investigated 3057 poor and richhouseholds in the countryside of 7 provinces. A year later, it investigated additional 3046households in 9 provinces. [Nguyen Van Tiem, 1994].
- In 1992-1993 The General Statistics Office and the State Planning Committee conductedthe first Living Standards Survey with the technical assistance of the United NationsDevelopment Programme and the Swedish International Development Agency. It covered4800 households in the whole country.[General Statistics Office - Vietnam Living StandardSurvey, 1994].
- In 1993 the General Statistics Office investigated and assessed the rich and the poor inthe whole country with 93732 sampled households.
- In 1994 the General Statistics Office conducted the multi-targeted investigation of thehousehold in the whole country with 45000 samples.
- In 1995-1996 the General Statistics Office conducted the first national census of theagriculture and countryside covering over 11 million rural households. This was the biggestone so far.
- In 1998 the General Statistics Office conducted the second Living Standards Surveycovering about 9000 households.
According to above mentioned survey types, all conducted surveys were quantitative andmulti-topic. Except the Agricultural and Rural Census which covered nation-wide scope, allother surveys are sampled surveys.
The above surveys have different purposes and methodologies, therefore the comparisonof results as well as through time is impossible. The results have not been dealt withprofoundly and analyzed because researchers' ability to approach the database is limited.
One of the first methodological issues of poverty monitoring is definition of the poverty lineindicators. Qualitative standards for the assessment of poverty is easily agreed upon.However there are many ways to show them by quantitative standards which are everdifferent, resulting in different ratios of the poor.[Vu Tuan Anh, 1997].
Following are some remarks on the definition of the poverty line in Vietnam so far:
First, it is sound to consider the food standard to be the chief one to determine the povertylimit because it is the existence of the poor. However this standard is used with differentextents. The standard brought out by the Ministry of Labour, Invalids and Social Affairs(MOLISA) is 13 kilograms of rice, equivalent to 1500 calories; the General Statistics Officepresented 2100 calories, equivalent to VND 840000 in cities and VND 600000 in thecountryside; in the investigation of the population's living standard, the standard is 2100calories, equivalent to VND 902000 and VND 710000 in cities and the countrysiderespectively.
Second, after the poverty line of food is defined, other needs are calculated with differentratios in the overall poverty line. According to the estimate by the MOLISA, 30 percent of

6
income are used to settle other needs. Other needs are not calculated by the GSO besidesfood. The household living standard survey takes 40 percent of expenditure for other needsbesides food.
Third, the value standard of income and expenditure is used as the main tool (if not the onlyone) to measure poverty. The LSMS relied mainly on the analysis of household expenditure,while the household surveys conducted by Vietnamese institutions have relied on themeasure of income.
Fourth, although other standard on the degree of meeting basic needs are mentioned, theyare not reflected in the poverty line. Poverty level is being assessed mainly by income orexpenditure indicator only.
1.3. Poverty measurement indicators:
There are two methods to assess the poverty, the direct and income ones. According to theformer, one measures the real amount of consumption of some products and services tomeet human basic needs. By the latter they measure either income or expenditure percapita of the household.
These two methods both have good points and defects.
Direct indicators reflect accurately the degree of meeting basic needs, but they havedifferent units of measurement and so cannot be brought together to a synthetic one.Therefore, by the direct method it is difficult to designate a certain limit as the poverty lineand rely on it to calculate the number of poor people. But the certain indicator can be usedin forming policies in each field, for example improving the nutrition state of the poor byincreasing calories and changing the ration structure, elevating the medical service bygiving more sufficient supply of medicines, increasing the number of school children at theirproper age bracket or eliminating illiteracy, etc.
In contrast, the income or expenditure indicator has general significance but it does notimply all aspects of the human basic needs. By the use of this integrated indicator, thepoverty line can be worked out, allowing to find out the number of the poor and poorhouseholds in each locality.
Both the above-mentioned methods have been used in the assessment of poverty; howeverthe degree of using the indicators of the two methods is not the same depending on thepurpose of surveys.
While the World Bank uses mainly the expenditure indicator as poverty line in LSMS, insome poverty-related documents provided by UNDP, both methods of povertymeasurement have been implemented. For example, in a currently prepared for UNDPworking paper, T. McKinley proposed four sets of poverty indicators. They cover capabilitypoverty, consumption poverty, lack of wealth, and lack of empowerment. [T. McKinley,1996].
- The set of indicators of basic human capabilities consists of 15 indicators of 5 groups:
+ Health: life expectancy, under-5 mortality rate, immunization rates.
+ Nutrition: under-5 underweight, stunting (height for age), wasting (weight for height).

7
+ Reproduction: low birth weight, % of anemic mothers, infant mortality rates.
+ Education: adult literacy rate, net primary enrollment ratio, primary completion ratio.
+ Housing: floor area per person, % of dwellings with sanitation, % of dwellings with covered floor.
- Consumption poverty is measured by monetary indicator of absolute poverty line whichincludes the cost of the food bundle necessary for minimal caloric intake and a certainpercentage of non-food consumption items. This indicator is proposed to calculatedsimilarly as poverty line with the World Bank's LSMS methodology.
- As lack of wealth, poverty can be reflected by different kind of wealth, such as: land,physical capital (machinery, equipment, tools), housing, consumer durables, financialsavings, human capital (adult literacy, completion of primary school).
- Empowerment concerns people's qualitative states. Quantitative variables cannot captureall aspects of this features. However, some aspects can be reflected through thequantitative indicators, like freedom of job change and travel, participation in socialactivities, etc.
Poverty measurement indicators have been defined differently in some first MIMAP projectssuch as Philippines, Bangladesh and India projects [R. Medhora, 1996; C.M. Reyes, 1997;M.K. Mujeri,1997]. While all projects have been paying attention to the most fundamentalhuman needs such as food, housing, safe water and sanitary facilities, education, healthcare and income the focus for some other spheres such as means for production and living(land, funds, employment) and social affairs (security, participation of people) has beendifferently paid by different projects.
It seems that there is a certain difference in data gathering approach between theseprojects. While the Bangladesh and India projects have been conducting nation-widestatistical surveys, the Philippines project prefers community-based surveys.
The Bangladesh project has made a clear classification between quantitative andqualitative indicator sets. The indicator set of the Bangladesh project consists of 69indicators, including 24 qualitative indicators and 45 quantitative indicators. The Philippinesproject, has at the same time developed a two-level poverty monitoring system includingbarangay (village) and household level. The total number of indicators is 32, of which 16 atbarangay level and anothe 16 at household level.
1.4. Proposed poverty indicator set and monitoring system in Vietnam:
A specific feature of the data gathering methodology proposed by the research project isthe implementation of participatory principle. As mentioned above, most of the livingstandard surveys use the skilled experts of the national authorities as surveyors. Theadvantage is that the quality of data collection can be ensured. However, disadvantagesare clearly:
- Small survey sample size and no possibility to conduct a poverty monitoring census whichmight be covering every villages and repeated regularly after relatively short periods;

8
- Local governmental authorities, non-governmental organisations and people cannotaccess to data on-time;
- High cost.
A poverty monitoring survey based on the participatory principle will involve local experts,non-governmental organisations and people in the process of data gathering, processingand analysis. It will create opportunity for local people to understand their poverty situationand to encourage them to activate the poverty alleviation measures. At the same time,expenditures of poverty monitoring surveys are relatively low.
The necessary pre-conditions of the implementation of participatory principle in povertymonitoring are:
- Awareness of local governments on their high responsibility in organizing data gatheringand processing procedures.
- Availability of mass organisations which are actively operating for poverty alleviation.
- Self poverty monitoring methodology is enough simple so that every common peoplecould understand and implement.
Two first pre-conditions are available in Vietnam. The task of the research project is toelaborate a suitable indicator set and procedures of data processing and analysis.
a/ Set of indicators:
The administrative system in Vietnam consists of 4 levels: national, provincial, district andcommune. Almost all policies are implementing through these four levels.
The population size of these administrative units is as follows:
- Nation (whole Vietnam): about 80 mil. persons.
- Province: 61 provinces in the whole country, each province has approximately 10 districts.The smallest (by population size) province has about 0.3 million inhabitants, and the largest- about 3 million inhabitants.
- District: there are about 500 districts in the whole country. Each district consists ofapproximately 20 communes and 10 thousands to 30 thousands inhabitants.
- Commune: there are about 10,000 communes in the whole country. Each commune hasapproximately 1000 households and 5000 inhabitants.
Depending on regions and ethnic groups of population, there are some villages or hamletsin each commune. Village and hamlet are not administrative units, but settlement units withdifferent size. In the populated delta areas, a village may have hundreds of households, butin the mountainous or newly opened land a village (hamlet) may consist of less than tenhouseholds.
In Vietnamese statistical system, beside national statistics service (GSO), there arestatistics departments at provinces and districts. They collect data and publish major annualindicators on population, economy and social affairs. These indicators are mainly at macrolevel. Data on micro level (firm, household) are collected through irregular surveys.
In the National Program for Hunger eradication and Poverty Reduction for the period of1996-2000, Vietnamese government focuses on two subjects: commune as the basic

9
administrative unit and household as basic cell of the society. Based on data needs forpoverty alleviation policy implementation, we proposed a poverty monitoring system withindicators reflecting the grade of satisfaction of human basic needs at two level: communeand household.
The commune indicators reflect the satisfaction of basic needs mainly in public goods andservices such as the supply of safe water, electricity, roads and transportation, schools,sanitation and living environment, public order and security, the participation of thepopulation in community decisions and social activities .(Table 1)
The household indicators reflect the minimum norms of the most basic needs in family andindividual life such as food, clothing, dwellings, jobs, health, education. In practice, thesenorms are poverty lines in different spheres of human-being. (Table 2).
Table 1: Poverty monitoring indicators at the community level
Sphere Indicators
I. General livingstandard
1. Percentage of the poor (or poor households).
2. Price of one working day on the local labour market.
II. Land 3. Cultivated area per capita.
4. Percentage of landless households or households having too fewland (under 1/2 of average area per capita in the community).
III. Employment 5. Percentage of under-employees (not having jobs more than 3months in a year).
6. Percentage of labourers in agricultural and non-agricultural sectors.
IV. Health 7. Malnutrition rate of children of 1-5 years old (having the weightunder 80% of standards).
8. Child mortality rate.
9. Availability of community health station.
10. Number of medicine staff (public and private) per 1000 inhabitants.
V. Education 10. Adult illiterate rate.
11. Enrollment of children of primary education age (6-11 years old).
12. Number of teachers per 1000 inhabitants.
VI. Housing andsanitary facilities
13. Percentage of households having temporary houses.
14. Percentage of households supplied with safe water.
15. Percentage of households having bathroom.
16. Percentage of households having sanitary toilet.
17. Percentage of households using electricity as main lighting energysources.
VII. Culture andcommunication
18. Availability of public cultural facilities in the community (theater,library, broadcasting station).
19. Availability of local market.
20. Number of telephones per 1000 inhabitants.

10
VIII. People’participation insocial activities
21. Number of members of political, mass and social organisations per1000 inhabitants.
IX. Gender relations 22. Malnutrition rate of pregnant women.
23. Number of women working as public holders and leaders of socialand mass organisations per 1000 inhabitants.
Table 4: Indicators for household poverty monitoring
Spheres Indicators
I. Food 1. Food poverty line (per capita amount of rice in one month)
2. Value of per day ration (quality of food)
II. Clothing 3. Availability of necessary clothe blankets in cold seasons.
4. Availability of necessary mosquito nets.
III. Employment 5. Un- and under-employment (lacking jobs over three months a year)
IV. Health 6. Children in the 1-5 age bracket malnourished (under 80 percent ofweight necessary for age)
7. Adults in 15-60 age bracket have chronic disease
8. Unable to have medical care in illness
V. Education 9. Adult's illiterate
10. Children in 6-11 age bracket don't go to school
11. Household has no radio or TV
VI. Housing 12. Household lives in tents and huts
b/ The process of gathering and processing data:
The commune data are gathered by a cadre of statistics in the village authorities on thebasis of reports by administrative institutions, schools, and mass organizations. Theacquisition of the above data is quite possible if the cadre of statistics of the commune isentrusted with this task and paid a certain subsidy for the job. In case the level of knowledgeof the village cadre is limited (as in some mountainous areas) the regular gathering ofthese data can be entrusted to teachers working in the local school.
The data at household level are also investigated once in every six-month or one yearperiod.
Most of the indicators are simple, they can be gathered by interviews combined with rapidobservations. Only malnutrition rates requires measurement and this is also a simple jobwhich can be done by anyone. So some investigations can be entrusted to massorganizations as the Women, Peasants, Gardeners' Associations which are activemembers of the Board of hunger eradication and poverty reduction of the village. Here theparticipatory principle should be widely applied.

11
After gathering primary data, the village cadre of statistics will synthesize it according to twosystems the community and household levels. The comparisons of poverty standards of thehousehold level will reveal which ones belong to the category getting priority in support.
Corresponding diagrams of the above data are also made at the district and provincelevels.
In order for the process of poverty monitoring as above to have feasibility, the restoration offunction of the cadre of statistics in communes and enhancement of their capacity are mostimportant.
2. The pilot poverty monitoring survey conducted in 1998
2.1. Methodology of survey:
In the first phase of the research, the project has conducted two surveys. The first surveycovered 600 households in two communes: one of which in Thai Nguyen province(mountainous region) and another in Ha Nam province (Red River delta). This survey wasaimed to define the main characteristics of households and to test the proposedquestionnaires and indicator set. Based on the results of this survey, the research team hasreadjusted the proposed methodology, in particular the questionnaires, the criteria forselection and training methods of local surveyors.
A second survey was conducted with the aim to check the capacity of proposed povertymonitoring system which based on participatory principle.
Survey sample
The surveyed sites are located in three provinces: Bac Kan (Northern Mountains), Nghe An(Coastal Delta) and Ha Tinh (Midlands). All three provinces have higher poverty rate incomparison with other provinces in Vietnam.
The elaboration of survey sample was carried out by method of selecting intendedrepresentative according to levels, ratios with the quantity of administrative units at variouslevels and the population size in each locality. The selection of communes to be included inthe survey samples was made with the account of the disparity in geographical regions(mountain, midland, delta).
The survey was conducted in 40 communes within 16 districts of three provinces, with 8surveyed communes in Bac Kan province representing 20%, 20 communes in Nghe Anprovince, making up 50% and 12 in Ha Tinh province, accounting for 30% of the total.
According to their geographic features, such communes are classified into three types:mountainous, midlands and delta areas. The mountainous communes are the ones whichmeet with the most difficulties in socio-economic development and therefore have moreserious poverty. The number of surveyed mountainous communes accounts for 100% ofBac Kan, 25% of Nghe An and 50% of Ha Tinh.

12
Table 3: Surveyed communes
Total Bac Kan Nghe An Ha Tinh
Total 40 8 20 12
% 100.0 20.0 50.0 30.0
Mountainous 19 8 5 6
% 47.5 100.0 25.0 50.0
Midlands 9 0 7 2
% 22.5 0 35.0 16.7
Delta 12 0 8 4
% 30.0 0 40.0 33.3
Total number of survey samples were 40 communes and 1000 households. 25 householdswere surveyed in each commune. The numbers of households selected in provinces arerather proportionate to the population of such provinces.
In order to check of capacity of the indicators in living standard reflection, by selection ofsurvey samples the research project requested commune's leaders to define three lists ofhouseholds by living standard category: rich, middle and poor households. The structure ofto-be-selected households was defined by proportions of the households in three lists.
Below is the description of the 1,000 household survey samples according to some majornorms.
Table 4: Household sample structure
Number of households %
Province
Bac Kan
Nghe An
Ha Tinh
204
501
301
20,3
49,8
29,9
Region
Mountain
Midland
Delta
531
200
275
52,8
19,9
27,3
Living standards
Poor
Middle
Rich
212
620
173
21,1
61,6
17,2

13
Data gathering:
Applying participatory principle, members of the research project operated in provincesand district in capacity of supervisors. They invited local officials, teachers, members ofmass organisations in districts and communes to participate in the survey in capacity ofsurveyors. The members of research team trained local surveyors and supervised themduring the data collection process.
Data processing and analyzing:
Main independent variants used for processing and analyzing include:
1. Province, district, commune group according to regions.
2. Households: size, occupation, living standards, duration of residence in thelocality.
3. Household masters: ethnicity, sex, occupation, age, education level.
The processing of household questionnaire data and commune questionnaire data wasmade on SPSS/PC softwares. The calculation has yielded statistical values of variantssuch as average, frequency (%), the correlations between dependent variants and mainindependent variants.
2.2. Survey results at commune level:
1/ Characteristics of surveyed communes:
The average land area of a surveyed commune is 3,330 ha. The size of a mountainouscommune is 8.1 times larger than that of a delta commune and 3.4 times larger than amidlands commune. 100% of the communes in Nghe An province are in delta regions;hence the average area of a commune is much smaller there than in Bac Kan and Ha Tinhprovinces. The size of a surveyed commune in Nghe An is about 0.7 times the size of acommune in Bac Kan and 0.4 times that of a commune in Ha Tinh.
Table 5: The average area of a commune
Average area (ha) Comparison(Average area = 100)
Total 3330 100.0
By province:
- Bac Kan 3086 92.7
- Nghe An 2196 65.9
- Ha Tinh 5384 161.7
By region:
Mountainous 5757 172.9
Midlands 1703 51.1
Delta 707 21.2

14
2/ Population and ethnicity
On average, a surveyed commune has 1,212 family households with 5,422 persons. Eachfamily has an average of 4.47 persons.
The population of a delta commune is 1.6 times bigger than that of a mountainouscommune. A midlands commune has the largest population, which is 1.1 times bigger thana delta commune and 1.8 times that of a mountainous commune
According to gender, the male population is smaller than the female population, with theformer representing 93.9% of the latter .
The average population growth rate in the surveyed communes is 1.58%, which is lowerthan the national average (approximately 1.8%). If the statistics on the communes areaccurate, such a trend of population growth rate proves positive.
In the 40 surveyed communes, the inhabitants belong to 10 ethnic groups: Kinh, Tay, Nung,Dao, Thai, Lao, Thanh, Chut, Kho Mu, Hoa.
Most of the ethnic minority groups live in mountainous areas, mainly Bac Kan where residepeople of Tay, Nung, Dao and Thai groups. Meanwhile, residing in Ha Tinh are people ofthe Nung, Lao and Chut groups and in Nghe An, are the people of Thai, Lao, Thanh, Hoaand Kho Mu groups.
3/ Labour resources:
The number of people in the working age group accounts for 41.8% of the total population.This figure is very low in delta communes, being only 39%.
Similar to the national population structure, the number of male labourers is smaller thanthat of the female labourers. This is a common phenomenon in rural areas because: first,the male population is smaller than the female population; and second, a section of themale labourers have moved to work in other fields such as industries and construction,joined the army or State apparatus, or continue to study, etc.
4/ The land resources:
The average per-capita land area for agricultural production, forestry and fisheries in thesurveyed communes is nearly half a hectare (in concrete terms 4,500m2), including 857m2
of agricultural land, representing 19%; 3,446m2 of forestry land, making up 76.5% and198m2 of water surface, accounting for 4.5%.
The per-capita agricultural land area in the mountainous communes is 1.5 times larger thanthat in a midlands commune and 1.8 times than that in a delta commune.
The forestry land funds of the communes in Bac Kan and Ha Tinh provinces are more thanseven times bigger than those of Nghe An province, because all surveyed communes inBac Kan and Ha Tinh are in mountainous regions where forest area remains large whilstthe communes of Nghe An are in the delta areas where “the land is small and people arenumerous”.
The mountainous communes have forestry land areas nineteen times larger than themidlands communes. In delta regions, the forestry areas are not worth mentioning, for theyare insignificant in comparison with other regions.

15
Among the land used for agricultural purpose, the land for short-term (annual) plants onaverage accounts for 78% in the 40 surveyed communes; 41% in communes of Bac Kanprovince; 86% in Nghe An; and 89% in Ha Tinh. In delta areas, almost all agricultural land(98%) is used for the cultivation of short-term plants; while the figure for the midlands regionis 85% and the mountainous region is only 63%. The remainder of the agricultural land is forthe cultivation of perennial trees.
Among the short-term plants, rice still occupies the most important position, accounting for68.5% of the land area cultivated with annual plants in 40 communes. The respectivefigures for Bac Kan, Nghe An and Ha Tinh are 73%, 65% and 74%. According to thegeographic terrain, such figures are 54% in the mountainous regions, 81% in the midlandsregions and 74% in the delta regions.
5/ Infrastructure:
a. Communications and transport:
Communication roads constitute the most important component of infra-structure, whichhelp to narrow the economic, social and cultural gaps between communities.
Of the 40 surveyed communes 39 have sealed roads and only 1 commune in Ky Sondistrict (Nghe An) has no accessible road. This commune centre is 3 km from the nearestsealed road, to travel such a distance is a three hour walk in mountainous conditions.However, 100% of the communes, including that having no sealed roads, held that the mostconvenient way to travel to the nearest urban centre (the provincial city, district town, theprovincial capital, the district capital) is the sealed road, of the 40 communes 39 usesealed roads to travel to the nearest trading centre (the district town, marketplaces). Only 1commune in Bac Kan held that the most convenient way to travel to the market place is towalk on unsealed paths.
Railroads and waterways are not the most convenient means used by the surveyedcommunes. The average distance between the commune and the nearest railway station is54 km, which is 111 km in Bac Kan, 48 km in Nghe An and 27 km in Ha Tinh; or 87 km forthe mountainous area, 35 km for the midlands area and 15 km for the delta.
The average distance from the 40 communes to the nearest wharf or ferry is 33 km, whichis specifically, 46 km for Bac Kan, 29 km for Nghe An and Ha Tinh; or 57 km for themountainous communes, 15 km for the midlands communes and 10 km for the delta.
Generally, traffic in the delta communes is convenient, with distances not too long, and withvarious kinds of communication and transport means. However, in the mountainousregions, communications remains a question of the highest priority.
b. Electricity.
Among the 40 surveyed communes, 6 mountainous communes (5 in Bac Kan and 1 inNghe An) do not yet have a national grid electrical supply, they account for 15% of the total.
Whilst most of the delta and midlands households use electricity from the national grid,many households in the mountainous areas have not been supplied therewith due to thelack of transmission lines linking the national grid to households. This is attributed mainly tothe dispersed distribution of the population. Therefore, in the mountainous communes, aconsiderable number of families use electricity supplied largely by small generators. Forinstance in 7 out of 8 surveyed communes of Bac Kan province, people use electricity from

16
such a source, with an average of 10% of the households in a commune having smallgenerators for the supply of electrical power. The figure of 70 small generators in acommune shows that if the income of the family household is increased, the supply ofelectricity to the mountainous population can be achieved quickly and effectively throughsmall generators, without having to wait for State investment in transmission lines from thenational grid, which is very costly.
c. Schools.
All surveyed communes have at least one primary school. Some have two or even three. Onaverage, each commune has 1.7 primary schools with 26 classrooms.
Of the 40 surveyed communes 35 have junior-high schools (accounting for 87.5%). Eachcommune has 1 junior-high school, not to mention the district and provincial capitals. Eachjunior-high school has 13 classrooms on average, representing only half of the number ofclassrooms of a primary school.
However, the structure of the buildings varies qualitatively and quantitatively from school toschool. Schools in mountainous areas are small and poor in construction quality.
In 16 communes, including 12 mountainous communes and 4 midlands communes, schoolsremain makeshift, made of wood or bamboo and roofed with leaves.
One-storey brick buildings are commonly constructed for schools, these exist in 34communes, including 17 mountainous communes, 7 midlands communes and 10 deltacommunes.
Of the surveyed communes 12 have built multi-storey brick buildings as school-buildings.Among the above-mentioned 12 communes, 1 is in the mountainous, 3 in the midlands and8 in the delta.
d. Medical establishments:
The grassroots medical station (in communes) constitutes one of the importantinfrastructure projects to which the Vietnamese government has attached importance. Anational programme has been formulated for the establishment of at least one medicalstation in a commune in order to meet the fundamental needs of the people for medicalexamination and treatment and to apply measures of primary health care. All surveyedcommunes have their own medical stations though their structural facilities remain verypoor.
In 5 mountainous and midlands communes in Bac Kan and Nghe An, the medical stationsare housed in makeshift buildings made of bamboo and/or wood with thatched roofs. Insuch buildings, it is difficult to ensure the quality of medical examination and treatment. Only2 communes (1 in Nghe An and 1 in Ha Tinh) have built solid brick buildings for theirmedical stations. Commonly seen among the remaining communes are semi-solid onestorey brick buildings used as the medical stations.
e. The media:
For many years now, the Vietnamese Government has made great efforts in buildingcommune-run public address systems with a view to helping the local population,particularly the poor who can not afford their own audio-visual equipment, to have access topolitical, cultural, social, scientific and technical information. Besides relaying major radio

17
programmes from "The Voice of Vietnam", the commune public-address systemsbroadcast information on the internal affairs of the communities in communes, popularisefarming techniques as well as scientific and technical knowledge that is of interest to localpeople. In spite of their shortcomings, the public address systems have proved their valueamong the poor communities, particularly in disseminating knowledge to people.
Yet, the adverse is that such commune public address systems have operated well in deltacommunes where there are few poor people but many opportunities to obtain richinformation, whilst in mountainous and some midlands communes where people areisolated not only in terms of geographic location but also in terms of access to information,public address systems have not yet been set up or no longer exist. The reasons for this arethat communes in such regions are spread widely, and the local cadres have poor technicalknowledge and are unable to operate such systems. As a result, only a few commune (11communes, accounting for 27.5%) public address systems exist so far.
A very popular means of communications at present is the telephone. The number oftelephones per number of persons is an index which shows the socio-economicdevelopment level of communities.
On average, each commune has 5.8 public and 25 private telephones. So, there is 1telephone for every 176 persons. The figure is 1 telephone for every 406 persons in themountainous region, 216 persons in the midlands and 102 persons in the delta; or every557 persons in Bac Kan, 135 in Nghe An and for every 306 persons in Ha Tinh.
f. Conditions for economic exchange:
If the separation from information constitutes one of the causes of poverty, theseparation from economic exchange is a factor obstructing the process of progressingfrom the self-sufficient economy of the rural population to a market economy.
Rural markets constitute a means of economic exchange amongst households and at thesame time reflects the development level of the rural economy. Of the 40 surveyedcommunes, 24 (accounting for 60%) have their own marketplace. 45.8% of the markets areheld daily; 37.5% held several times a week and 16.7% once a week.
For the communes having no market, the average distance therefrom to the nearestmarketplace is 4.5 km, namely it takes more than I hour to walk; or, in real terms, 6 km forthe mountainous and midlands communes and 2 km for the delta communes.
6/ Economic situation of the surveyed communes:
Since the implementation of the “Doi moi ”(renovation) policy, the economic activities inrural areas have been carried out mainly by family households. The community units (suchas co-operatives, village/hamlets, communes) have play a very weak role in such activities.Therefore, in this socio-economic survey, the research group focused on analysingeconomic issues at the household level. At the commune level, the survey aimed at bringingout a general economic picture which cannot be fully reflected through the study of severalsample households. The picture will outline the diversity of rural economic activities, theeconomic resources which can be exploited by communes, the extent, economic efficiencyand the social impact of that exploitation.
a/ The diversity of economic activities:
18
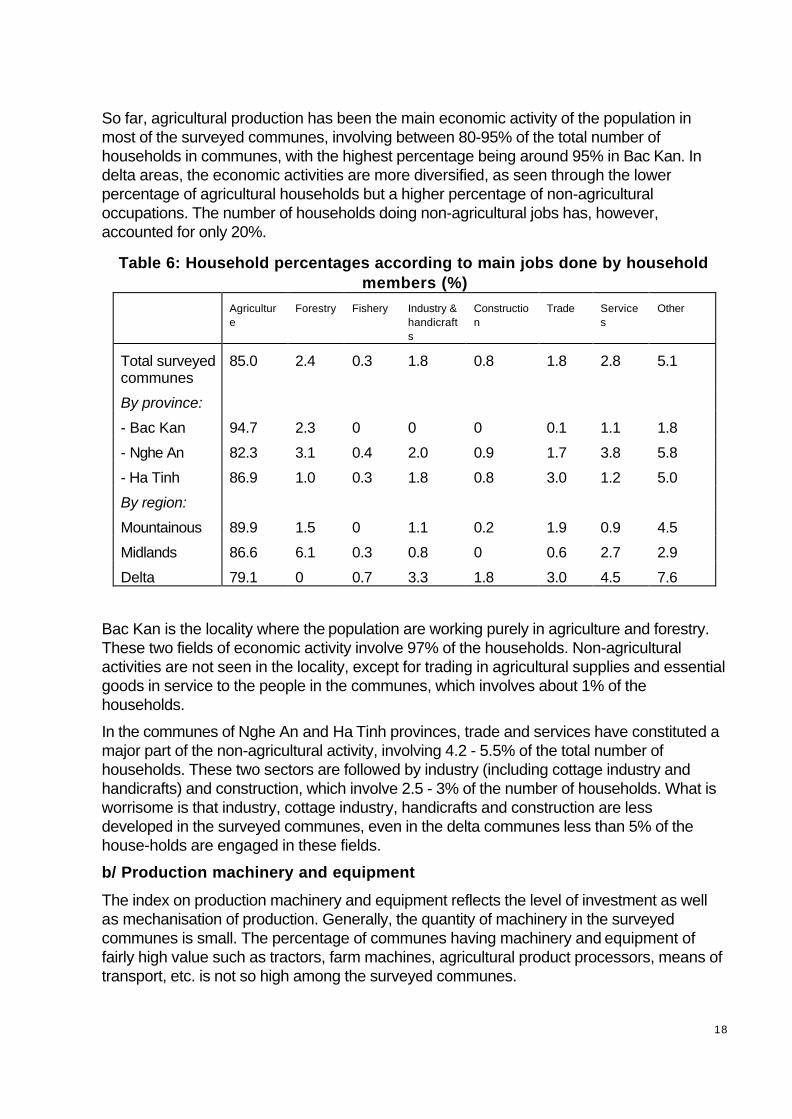
So far, agricultural production has been the main economic activity of the population inmost of the surveyed communes, involving between 80-95% of the total number ofhouseholds in communes, with the highest percentage being around 95% in Bac Kan. Indelta areas, the economic activities are more diversified, as seen through the lowerpercentage of agricultural households but a higher percentage of non-agriculturaloccupations. The number of households doing non-agricultural jobs has, however,accounted for only 20%.
Table 6: Household percentages according to main jobs done by householdmembers (%)
Agriculture
Forestry Fishery Industry &handicrafts
Construction
Trade Services
Other
Total surveyedcommunes
85.0 2.4 0.3 1.8 0.8 1.8 2.8 5.1
By province:
- Bac Kan 94.7 2.3 0 0 0 0.1 1.1 1.8
- Nghe An 82.3 3.1 0.4 2.0 0.9 1.7 3.8 5.8
- Ha Tinh 86.9 1.0 0.3 1.8 0.8 3.0 1.2 5.0
By region:
Mountainous 89.9 1.5 0 1.1 0.2 1.9 0.9 4.5
Midlands 86.6 6.1 0.3 0.8 0 0.6 2.7 2.9
Delta 79.1 0 0.7 3.3 1.8 3.0 4.5 7.6
Bac Kan is the locality where the population are working purely in agriculture and forestry.These two fields of economic activity involve 97% of the households. Non-agriculturalactivities are not seen in the locality, except for trading in agricultural supplies and essentialgoods in service to the people in the communes, which involves about 1% of thehouseholds.
In the communes of Nghe An and Ha Tinh provinces, trade and services have constituted amajor part of the non-agricultural activity, involving 4.2 - 5.5% of the total number ofhouseholds. These two sectors are followed by industry (including cottage industry andhandicrafts) and construction, which involve 2.5 - 3% of the number of households. What isworrisome is that industry, cottage industry, handicrafts and construction are lessdeveloped in the surveyed communes, even in the delta communes less than 5% of thehouse-holds are engaged in these fields.
b/ Production machinery and equipment
The index on production machinery and equipment reflects the level of investment as wellas mechanisation of production. Generally, the quantity of machinery in the surveyedcommunes is small. The percentage of communes having machinery and equipment offairly high value such as tractors, farm machines, agricultural product processors, means oftransport, etc. is not so high among the surveyed communes.

19
The survey collected 3 types of data:
- The absolute number of communes having production machinery and tools
- The percentage of such communes amongst the total number of communes (according toprovinces, regions).
- The average number of machines and equipment of 1 commune that has such types ofmachines and equipment.
Survey data shows that machinery of high value and high capacity which can be used bymany households such as large tractors are few. Small machines and equipment used forone or several households such as small tractors, pumping machines, agricultural productprocessors, boats, etc. are seen in most communes, particularly in the delta and midlandsregions, though their quantities still present a small percentage as compared to the totalnumber of households. Taking an average estimate for all surveyed communes forexample: Every 213 households have 1 large tractor; 116 households have 1 small tractor;7 households have 1 rice thresher, 65 households have 1 rice husker, 148 households have1 animal feed grinder; 11 households have 1 water pump, 25 households have 1 boat and98 households have 1 motorised boat.
c/ Cultivation:
Food plants, first of all rice, constitutes the major crop in all surveyed communes. Theaverage area of land for the cultivation of different kinds of rice in different crops (spring,summer, summer-autumn, autumn crops, terraced field rice...) is 448.7 ha/ a commune, withthe average out put of 1,610 tons and the average yield of 3.6 tons/ha. With such riceacreage and yields, the average per-capita rice output in the 40 surveyed communes hasreached only 300 kg, which is much lower than the national average (400kg) and even thanthe average of the 16 surveyed districts (340kg).
Besides rice, other food-bearing plants (maize, potatoes, manioc..., called collectively,subsidiary food crops) are also planted to supplement food sources for both people anddomestic animals. Similar to rice, the survey collected data on:
- The number of communes which have planted such crops (communes)
- The average commune area under such crop (ha)
- The 1997 yield (ton/ha)
The non-food plants are diversified. In addition to vegetables and fruit trees, groundnut,green bean, soya-bean, sugar cane, tea... have been widely cultivated in many communes.Except for groundnut, which is the traditional crop of Nghe An, other kinds of plant havebeen cultivated mainly to meet local demand.
d/ Animal husbandry
Buffalo, cattle, pigs, ducks, chickens are the main animals raised by households in all of thesurveyed communes. On average, each family raises 1 buffalo or cow. The basic figure is 2for every 3 households in the mountainous areas and 1 for every 2 households in the delta.Buffalo and cattle are raised as draught animals for farm work and transport and also forsale to earn a large sum of money for families. In many areas inhabited by ethnic minoritypeople, the number of buffalo or cattle is considered an evaluation index of the wealth of afamily.

20
Pigs are raised for family consumption and also for sale. Each family raises 1.6-2 pigs onaverage and a flock of several dozen chicken and ducks mainly to supply meat for thefamily.
In addition, people in some localities raise horses for transport (10 communes, an averageof 5 horses per commune), goats and deer for meat (in 29 communes, in average 110head per commune), and bees for honey (14 communes, in average 200 beehives percommune)
Generally, animal husbandry is a sideline which yields income for households and suppliesprotein and lipids for the daily meals in rural households. However, domestic animalsraised in small quantities cannot provide enough protein for the rural population. Aquaticproducts caught in lakes, ponds, fields or raised become a major source of protein for themajority of the rural population, particularly the poor.
e/ Forestry
Of the 40 surveyed communes, 28 have forest land, including 18 mountainous communes,8 midlands communes and only 2 delta communes. Each mountainous commune has morethan 7,000 ha of forest land while a midlands commune has 2,000 ha and a deltacommune, only 65 ha.
Though the State has implemented a policy of assigning forests to individuals and groupsfor care, management and exploitation, the percentage of forests managed by householdsis not so high, particularly in mountainous regions. In order to plant and preserve forests,capital and labour has to be invested in a long-term manner. New forests can only provideinitial yields after at least 7 to 10 years. There is a also a contradiction in that forestrydevelopment potential in a number of surveyed communes is very great but the capability toexploit such potential is limited due to the poverty. Therefore, forestry development hasbeen confronted with more difficulties than other areas where the business cycle is shortersuch as the cultivation of short-term plants, animal husbandry, fish-farming.
g/ Industries and handicrafts.
As remarked in above section on the diversity of the economic activities, in the surveyedcommunes, industries and handicrafts are less developed. Data obtained in surveyedcommunes shows that only 27 of the 40 communes (accounting for 67.5%) have at leastone industry or handicraft. The percentage of communes with industries and handicrafts,according to province, is 12.5% for Bac Kan, 75% for Nghe An and 91.7% for Ha Tinh; or,according to geographic region, 47.4% for the mountainous, 77.8% for the midlands and91.7% for the delta.
Each of the 27 communes mentioned above has, on average, 155 households withmembers involved in industrial or handicraft production. The corresponding figure is 306households for the delta; 50 households for the midlands and the mountainous respectively.
7/ Living conditions:
a/ Residential housing
Most of the residential buildings in the surveyed communes are semi-permanentconstructions: wooden houses, brick houses with thatch or palm-leaf roofs. Such styles ofhousing comprise between 65% and 80%.

21
The second type of housing is brick with tile or concrete (flat) roofs, which account for from10 to 20%.
The number of households living in earthen wall and thatched roof houses, huts or in thehouses others accounts for from 5% to 15%.
The solid multi-storey buildings represent a small percentage, around 1%, largely in deltacommunes, district and provincial capitals.
It can be remarked that the residential housing structure corresponds to the structure of theliving standard of the people. Households with solid houses or brick with tiled-roofs areusually wealthier families; households with average living standards in the countryside oftenhave semi-permanent houses made of wood or one-storey brick houses. The percentageof makeshift huts corresponds to the percentage of poor and hungry families in localities.
Due to the economic renewal policy, the living standards of a number of households hasbeen raised. Therefore, the construction and repair of housing has been thriving in ruralareas. According to survey data, about 9% of the households in the surveyed communeshave built solid or semi-solid housing (multi-storey buildings, brick houses, wooden houses)over the past two years. The corresponding percentages for the localities are: 1.7% in BacKan; 11.5% in Nghe An; 7.2% in Ha Tinh; or 5.7% in the mountainous region, 12.3% in themidlands and 9.9% in the delta.
b/ Clean water
Water, taken from wells sunk by people with rudimentary tools, is the major source ofdrinking water for the people in the surveyed localities. The percentage of households usingsuch sources of water is from over 50% (in Bac Kan and delta communes) to 80-90% (inHa Tinh and the midlands).
Drilled wells which produce clean water from deep underground sources are still rarelyseen in the midlands and mountainous regions, whilst they represent 30% of the total waterwells in the delta.
Drinking water taken from natural sources (rivers, streams, lakes) is seen only in themountainous regions, with about 15% of the households having to use such sources. In fact,these sources produce rather clean water if it is properly transported and stored in ahygienic way. In many delta areas where natural conditions are often harsh, without anysources of underground or surface water, people have to use rain water in their daily needs.This is a good source of water, however, in order to store and use it, a large sum of moneyis required for the construction of storage tanks. This is not easy, particularly for poorpeople.
c/ Sanitation facilities
People in some communes are not accustomed to protecting the hygiene of theirenvironment. Up to 40% of the households discharge garbage into rivers, streams, ponds,lakes without treatment. The percentage is particularly high in the mountainous regionswhere people have had no tradition of using garbage for making compost because of livingin vast areas. In regions where land is limited and people are accustomed to makingcompost from garbage, some two thirds of the local households treat the waste matter(burn, bury, throw into animal stables to make compost).

22
Though campaigns for building toilets which have hygienic systems (decomposition toilet,decomposition privies, double vault compost latrine) have been in action many years, onlyhalf of the households have toilets meeting hygienic standards. The figure is higher in thedelta communes, up to 80%, but lower in the mountainous areas, only about one third of thehouseholds. Worthy of note is that over 10% of the households do not have their own toiletsor privies.
d/ Durables
Bicycles, electric fans, radio cassettes are popular things in households, they satisfy theaesthetic needs in life. Moreover, such things are affordable to average families.
If television sets (black and white or colour) are added to the above items, the number ofhouseholds possessing them accounts for about 40%. There is a gap, though not wide,between the provinces or regions. The percentage of households owning television setsvaries from 30% (for the mountainous communes) to 50% (for the delta communes). Thenumber of households owning expensive items of such as automobiles, motorbikes, etc. isnot high.
Table 7: The percentage of households with durables (%)
Total By province By region
BacKan
NgheAn
Ha Tinh Mountainous
Midlands
Delta
Colour tv set 26.1 7.4 35.4 23.0 14.0 28.2 43.5
White-black TV 13.1 28.7 9.0 9.5 18.7 6.5 9.3
Video player 4.6 1.4 6.3 3.8 3.5 2.3 8.0
Radio cassetteplayer
41.2 25.3 45.9 44.0 31.5 51.5 48.9
Motorcycle 10.5 18.5 9.2 7.2 12.3 7.3 9.9
Bicycle 82.7 65.2 85.1 90.0 72.8 81.5 99.1
Sewingmachine
7.9 8.4 10.6 3.3 6.2 7.8 10.7
Electric fan 62.3 28.5 75.2 66.5 38.1 83.6 87.8
8/ Education in the surveyed communes
As mentioned in the above section (on infrastructure / schools), each commune has 1or 2 primary schools (from 1st to 5th grade) and almost all communes have 1 lowersecondary school (from 6th to 9th grade). The figures presented below will allow us toimagine the primary and junior-high schools in a commune (Table 7).
Though a mountainous commune is large in area but small in population, schools arewidely scattered. Therefore, the number of schools in a mountainous commune is greaterthan that in a delta or midlands commune. But, the mountainous school is much smaller insize than the delta schools.
In surveyed communes, including those in the mountainous regions, the number of

23
teachers is according to the prescribed norm, 1 teacher for every 20-25 pupils.
Table 8: The average number of schools in a commune.
Total By province By region
Bac Kan NgheAn
HaTinh
Mountainous
Midlands Delta
Primary school
Number of schools 1.7 1.3 2.0 1.5 1.9 1.5 1.5
Number of classes 26 18 31 23 25 31 25
Number ofteachers
36 21 46 29 31 43 39
Number ofstudents
876 491 1077 797 724 1160 902
Of which:
Male/Female (%)
92.7 89.5 93.0 92.9 90.5 95.4 92.5
Lower secondaryschool
Number of schools 1.1 1.0 1.0 1.2 1.2 1.0 1.0
Number of classes 13.7 7.5 17.3 11.4 10.7 13.7 17.9
Number ofteachers
24 12 31 20 17 22 36
Number ofstudents
530 264 643 469 365 624 706
Of which:
Male/Female (%)
94.6 90.0 95.1 94.6 93.1 100.0 91.6
Surprisingly, though most surveyed communes are economically underdeveloped andpeople are poor, the number girls in primary and lower secondary school is almost equal toor in some cases, even higher than the number of boys. This ratio is approximately equal tothe ratio between genders in the total population. This shows that the majority of familieshave no or little gender discrimination in sending their children to primary school. However,the percentage of girls is reduced slightly at the lower secondary education level andreduced considerably at the upper secondary education level (from 10th to 12th grade).This reflects the preference of boys to girls which still prevails in the countryside.
Yet, a small number of children are not sent to school. About 2.7% of children in the 6-11age group (namely the age of primary education under the Law on Enforcement of PrimaryEducation) do not go to school. The corresponding figure for the delta areas is 1.9%, themidlands: 2.5% and the mountainous: 3.5%. Almost all such children are in poor or verypoor families. It is not accidental that the percentage of children not in school is almostequal to the percentage of hungry families in localities.
The number of girls not going to school is greater than the number of boys. The ratio is 100

24
girls to 77 boys in the 6-11 age bracket, who do not go to school. In the mountainouscommunes, the ratio is 100/72.
The number of illiterate adults accounts for nearly 2% of the total population; with the highestpercentage being in the mountainous communes, which is about 3.8%. The number ofilliterate females is almost double that of illiterate males.
In 24 communes surveyed for data on illiteracy, literacy classes have been opened over thepast two years. About 1% of the total population joined such classes, of which half arefemale and half are male. In mountainous communes, the number of participants accountsfor about 1.3% of the population, of which two thirds are male and one third are female. Indelta communes, the literacy classes have attracted 0.4% of the population and the ratio istwo thirds male to one third female. So, the number of illiterate women is greater but thenumber of women attending literacy classes is smaller; hence the educational gap betweenthe genders is being widened.
Another aspect in raising the educational level is the availability of access to books andnewspapers. In all communes, people can subscribe to newspapers through the postalnetwork. However, among the 40 surveyed communes, only 15 (representing 37.5%) havebook and newspaper stands in their respective localities, 50% of the communes in BacKan have their own book and newspaper stands, and the figure for Nghe An is 30% and HaTinh, 42%; or according to the geographic area, the figure is 42% for the mountainouscommunes; 33% for the midlands and also for the delta. For communes which do not havebook and newspaper stands, the average distance to the nearest book and newspaperstand is 7.3 km; Ha Tinh 4.9 km; or the mountainous 10.8 km; the midlands: 5.7 km and thedelta, 4 km.
The lack of book and newspaper stands in the countryside can be attributed to the lowpurchasing power of peasant households and to the high price of books and newspaper.Therefore, except for children’s textbooks, other books and newspapers, even dailies, arerarely seen in peasant households. Knowledge is passed through the radio and televisionnetworks or through mutual learning experiences or training courses.
9/ Health care in the surveyed communes:
Of the 40 surveyed communes, 39 have their own medical stations. The only communewhich has no medical station is in Bac Kan and the distance to the nearest medical stationis 5 km.
On average each commune has 7.6 medical doctors and assistant medical doctors. Thespecific figure for Bac Kan is 2.6; for Nghe An: 7.8; and for Ha Tinh 10.8. Such differencesbetween regions can be attributed partly to the population size of a commune, which ismuch greater in the delta and midlands than in the mountainous area, partly to the differentareas, terrain and population distribution of regions, and also to the inclusion of all medicalworkers in both public and private sectors into the survey data. On average, every 1,000people in 40 surveyed communes have 1.4 physicians and assistant doctors. Thecorresponding figure for Bac Kan is 0.7; Nghe An: 1.1 and Ha Tinh: 2.2; or for themountainous areas is 1.8; the midlands: 0.8; and the delta 1.5.
There are in each commune approximately 10.8 nurses. However, the figure variessubstantially: in Bac Kan: 0.6; Nghe An: 15 and Ha Tinh: 10. The corresponding figure forevery 1,000 people is 0.2 in Bac Kan, 2.2 in Nghe An and 2.1 in Ha Tinh. So, clearly, Bac

25
Kan has a serious shortage of nurses.
Similarly, for every 25,000 people there is one pharmacist, whilst the corresponding figurefor Nghe An is 5 and Ha Tinh, 8.8. Additionally, for every 5,000 people in Bac Kan there isone midwife, whilst the figure for Nghe An is 1.8 and Ha Tinh 2.8.
A number of important health care issues such as the mortality rate among children agedunder 1 and from 1 to 5; the death rate of women in childbirth, the rate of malnutritionchildren aged under 5 are calculated as follows (Table 8)
Table 9: Some indicators on health of mothers and children
Total By province By region
BacKan
NgheAn
HaTinh
Mountainous
Midlands Delta
Death rate ofchildren agedunder 1 year (%)
1.5 1.7 1.5 1.6 2.6 1.2 1.3
Death rate ofchildren of 1-5years old (%)
0.33 0.37 0.35 0.29 0.36 0.53 0.15
Death rate ofmother duringchildbirth (%)
0.1 0 0.2 0 0.1 0.08 0
Malnutrition rateof children under5 years old (%)
30.0 17.1 32.7 34.1 25.9 50.9 20.8
10/ The poverty situation and impacts of implementation of the NationalProgram for Hunger Eradication and Poverty Reduction
As mentioned in Section 1, according to the hunger and poverty criteria set by theMinistry of Labour, War Invalids and Social Affairs, communes have determined, annually,the number of poor and hungry households. Generally, 28.2% of the households with 24.8%of the household members have suffered from hunger and poverty. These figures are higherthan the national average (19.3% of the households) and also higher than the averagefigures for the surveyed communes. The reason for this is that the communes selected forthe survey are poorer than other communes in a district.
Worthy of note is that up to 9% of the households and more than 7% of the people incommunes still suffer from chronic hunger. With 28% of the households suffering fromhunger and poverty, in particular, nearly 40% of the mountainous households suffer fromhunger and poverty, the hunger elimination and poverty alleviation programme will facehuge challenges in the coming years.

26
Table 10: The poor and hungry households rate (%)
Total By province By region
BacKan
NgheAn
HaTinh
Mountainous
Midlands Delta
Rate of hungryhouseholds
9.4 5.4 10.5 9.7 14.2 8.3 2.8
Rate of hungrypeople
7.3 6.2 6.1 10.1 10.2 8.2 2.7
Rate of poorhouseholds
18.8 25.3 15.1 20.6 24.6 16.2 11.6
Rate of poorpeople
17.5 27.4 10.8 22.0 23.1 16.2 11.2
Rate of poor andhungryhouseholds
28.2 30.7 25.6 30.3 38.8 24.5 14.4
Rate of poor andhungry people
24.8 33.6 16.9 32.1 33.3 24.4 13.9
Since the middle of the 1980’s, a number of measures have been applied to eliminatehunger and reduce poverty in localities. Some measures have been aimed directly at thepoor, such as the granting of difficulty allowances, exemption or reduction of school feesand medical charges. Meanwhile, some other measures have been aimed not only at poorpeople but also at others, such as capital lending, construction of infrastructure, provision oftechnical training and... Table 10 presents three indices:
• The number of communes having applied measures;
• The percentage of measure-applying communes against the total surveyedcommunes according to locality and region;
• The percentage of households benefiting from the application of measures againstthe total number of households in a commune (average)
Table 11: Application of hunger elimination and poverty alleviation measures
Total By province By region
BacKan
NgheAn
HaTinh
Mountainous
Midlands Delta
Getting loans 33 com.
82.5%
14.2%
6 com.
75.0%
30.4%
15com.
75.0%
12.7%
12com.
100.0%
12.3%
15 com.
78.9%
21.6%
9 com.
100.0%
11.3%
9 com.
75.0%
9.9%
Exemption ofeducation fees forchildren of poor
22 com.
55.0%
2 com.
25.0%
10com.
10com.
7 com.
36.8%
6 com.
66.7%
9 com.
75.0%

27
households2.6% 0 50.0%
2.8%
83.3%
2.9%
1.7% 1.3% 4.4%
Exemption of hospitalfees for the poor
19 com.
47.5%
4.3%
3 com.
37.5%
14.1%
9 com.
45.0%
3.9%
7 com.
58.3%
1.9%
8 com.
42.1%
7.5%
3 com.
33.3%
1.5%
8 com.
66.7%
3.5%
Getting allowancesfrom hunger ordisaster funds
11 com.
27.5%
1.0%
0 6 com.
30.0%
1.0%
5 com.
41.7%
1.1%
5 com.
26.3%
0.6%
3 com.
33.3%
1.7%
3 com.
25.0%
0.8%
Training courses onproduction techniquesand businessmanagement
9 com.
22.5%
2.8%
2 com.
25.0%
10.0%
6 com.
30.0%
2.8%
1 com.
8.3%
0.5%
4 com.
21.1%
4.3%
2 com.
22.2%
2.3%
3 com.
25.0%
1.9%
Allocation of additionalland to the poorhouseholds
2 com.
5.0%
0.2%
0 0 2 com.
16.7%
0.2%
2 com.
10.5%
0.2%
0 0
Benefited by publicinfrastructureconstruction projects
11 com.
27.5%
13.9%
2 com.
25.0%
22.6%
7 com.
35.0%
16.7%
2 com.
16.7%
5.9%
7 com.
36.8%
24.9%
2 com.
22.2%
5.0%
2 com.
16.7%
11.3%
Amongst the hunger elimination and poverty alleviation measures listed above, the indirectmeasures (capital lending, construction of infrastructure, training) have been applied on alarger scale (a greater number of communes) and with a higher percentage of beneficiaries(households). These measures have created a stable and firm foundation for thedevelopment of households as well as communes, as they have raised the economic andsocial capabilities of households, individuals and communities. However, there has beennot enough data to determine how many among such households are poor or how manypoor people have gained benefit so far, to assess any negative impact of the abovementioned measures.
The measures in direct support of poor people (exemption or reduction or school fees,medical charges, allowances... ) have been applied to a smaller number of people. Theyare characterised mainly by direct relief but have not created a firm and stable foundationfor hunger elimination and poverty alleviation.
One of the foremost measures which the Government, as well as private and foreign, hasused for the development of the peasant household economy, elimination of hunger andreduction poverty is the lending of capital to peasant households. As mentioned above, 33of the 40 surveyed communes have applied this measure.
The major lending sources include:
• The Bank of Agriculture and Rural Development (VBA), which lends at a monthlycommercial interest rate of 1-1.2%.
• The Bank for the Poor (VBP), with an interest rate of 0.9%.
• The People’s Credit Fund (PCF), with an interest rate of 1.5%.

28
• A number of the State Development Programmes such as the programme forgreening unused land and bare hills (Programme 327), the job-generation programme(Programme 120), etc., with an interest rate of 0.8%.
• The development projects of the State and International Organisations providingloans through social and mass organisation such as the Women’s Union, the Peasant’sAssociation, the War Veterans’ Association, etc., with interest rates of 0.8-1.0%.
• A number of development projects funded by international organisations, with aninterest rate of 1.2%.
Besides these, there are other lending sources such as the Industrial and CommercialBank, the joint stock commercial banks, which are, however, not common.
Except for the Bank for the Agriculture and Rural Development which has a network ofbranches in all districts and provides loans on a broad scale mainly under a commercialmechanism (with property mortgage, commercial interest rates), the other lending sourceshave provided loans with more or less preferential treatment through low interest rates, themechanism of trust for loans. For poor people, such preferential treatment is positive andnecessary. However, most of such loans are small (not more than 1 million VND for ahousehold) and short-term (not more than 1 year). Therefore, they have not exerted strongand sustainable impact upon hunger elimination and poverty alleviation.
In the survey, the following 4 indexes were collected:
• The number of communes borrowing capital according to sources against the totalsurveyed localities.
• The rates of commune capital borrowing in the total number of surveyed communes.
• The ratio of households being lent capital against the average number of households ina commune.
• The average money volume lent to a household (million VND).
Survey data shows that the Bank of Agriculture and Rural Development and The Bank forthe Poor have operated in almost all localities. Lending capital through social organisationsis also common (Prevalent in about half of the communes in all regions). The provision ofloans by development programmes has been effected in one fifth of the surveyedcommunes. The people’s credit fund, a form of credit co-operative newly set up throughoutthe country over the past three years, are not yet in full operation in the surveyed communes.Finally, only 3 communes have international development projects which support ruralcredit.
The number of households borrowing capital from the Bank of Agriculture and RuralDevelopment accounts for the highest percentage (20-25% of the total households).Meanwhile, the Bank for the Poor has lent capital to only about 10-15% of the households incommunes where it has operated. The percentage of households borrowing from projectsmanaged by social organisations is fairly high, about 15-20% of the households incommunes.
Most of the loans are small, with the largest amount being 2 million VND a household andthe smallest amount being 200,000 VND.
Excluding the lending among family members, relatives and friends, there exist individual

29
money lenders in 18 of the 40 surveyed communes, including 11 communes in Nghe An(55% of the communes) and 7 communes in Ha Tinh (58.3% of the communes). Accordingto geographic region, the mountainous has the lowest percentage of communes withindividual money lenders (21.1% of the communes); the midlands has the highestpercentage (88.9% of the communes), and the delta, 50%.
The interest rates set by individual lenders are higher that those set by the State lendingsources and mass organisations, which fluctuate at around 2 to 3% a month, depending onbusiness seasons, borrowers and demand.
It can be remarked that the small rural credit market is diversified in its lending sources.Such lending sources have not yet met the demand for loans because their operationshave not yet spread to all communes, the percentage of borrowing households is low, theloan amounts are small, and the term is short. The capital-lending activities lack thenecessary co-ordination because each lending source has its own purpose and lendingmechanism.
11/ People's participation in social activities:
Social and mass organisations in Vietnam are characterised by their active role in socialand community activities. The social organisations have been set up with the guidingprinciple of uniting all social groups for the achievement of community and nationaldevelopment. Each social group (according to age , gender, occupation, commoninterest...) has its own organisation: youth, women, elderly, children, peasants, warveterans, gardeners...). If mobilised and given the necessary resources, such organisationscan effectively contribute to acceleration in the process of community development, throughthe management and supervision of projects, the organisation of training and technicaltraining courses. The participatory approach can be fully achieved with an active role ofmass and social organisation in the mobilisation of development and poverty alleviationprojects. This can be clearly seen through the activities of the rural credit systems referredto in the above section. In almost all surveyed communes, the major social organisationssuch as the Peasant’s Association, the Women’s Union, the Youth Union, the Veterans’Association have attracted large numbers of people and have carried out political, socialand economic activities, particularly mutual assistance activities in their social andeconomic life. In addition, professional associations such as the Gardeners Associationhave been organised in 50% of the communes, humanitarian organisations such as theRed Cross in 72.5% of the communes or the Elderly Society in 90% of the communes. Onaverage, the Peasants’ Associations have members in 80% of the households, Women’sUnion in 67%, Youth Union: 31%, the Elderly Association: 37%, Veterans’ Association in18%, Red Cross in 21% and Gardeners Association in 7% of the households.
12/ Budget in the surveyed communes:
The commune is the lowest level in the administration system in Vietnam. The operation ofthe commune administration is reflected through the financial system and budget of thecommune, namely, through the volume, revenue and expenditure structure of the communebudget.
There is a marked difference between communes in budget revenue. If the revenue isalmost equal to the expenditure, the total revenue of the commune against the total per-capita revenue in communes would be as follows (Table 13).

30
Table 13: Comparison between the total revenue and the commune’s per-capitabudget revenue (%, the average of 40 communes = 100% )
Total By province By region
BacKan
NgheAn
HaTinh
Mountainous
Midlands Delta
Total revenue ofcommune's budget
483.7mil. VND= 100
24.4 139.7 84.1 43.1 130.8 166.8
Budget revenue percapita
89.000VND=100
34.8 111.2 93.2 58.4 98.7 126.7
The budget revenue of a commune in Nghe An is 5.7 times higher than that in Bac Kan; ofa delta commune is 3.9 times higher than that of a mountainous commune. According to theper-capita revenue, the difference between communes is not so great: It is 3.2 times higherin a commune of Nghe An than that of a commune in Bac Kan; or 2.2 times higher in thedelta than in the mountainous areas.
In the current financial system of Vietnam, communes are entitled to retain 10% of thecollected amount of agricultural tax, 90% of the animal slaughtering tax, 50% of the land andhouse tax, 20% of the industrial and commercial taxes, 100% of fishery and salt-productiontaxes, and 100% of fees and charges prescribed by law. After the settlement of the finalaccounts of the budget, communes are provided with the necessary amount of funds tomake up for over-spending which has resulted in a budget deficit. In the 40 surveyedcommunes, this was about one third of the commune budget (district, province). The figurefor the mountainous communes is about one half, and in particular for Bac Kan it is 60%.This proves that the surveyed communes are very poor.
The commune budget is spent largely on basic public services such as primary education,health care, infrastructure construction and social activities.
However, with a small budget, most of the expenditure in the commune budget is for wagepayments to managerial officials, medical and educational personnel. More than 20% of thebudget is spent on wage payments to managerial personnel, 8% for education, 3% forhealth care, 25% for physical education and sports, 10% for social activities. Investment inthe construction and maintenance of infrastructure in the commune accounts for about 30-40% of commune budget expenditure. Of course, there is a difference between communesin their expenditure structures.

31
2.3. Survey results at household level
1/ Characteristics of the surveyed households:
The interviewed household heads fall in different age groups, but most of them aged from30 to 50 (accounting for 61.9%), who are “ in their prime ” in term of their strength as well asbusiness experiences.
Table 14: Age of the household head
Age Number of households %
60 +
50 - 59
40 - 49
30 - 39
Under 30
128
180
315
308
74
12,7
17,9
31,3
30,6
7,4
Among the 1,000 surveyed households, the number of households of Kinh ethnic majoritymakes up the leading percentage (75.5%), while other ethnic groups account for smallpercentages: Tay 16.2% ( residing largely in Bac Kan province); Thai 3.6%; Dao 1.7%; KhoMu 1.7%. Though these figures do not give full representativeness, they shall serve asreferences for the analysis and specific comparision of living standards of different ehtnicgroups in localities.
Almost all household's heads are primary and secondary graduated. About a half ofhousehold heads have completed 7th grade and more than 1/5 have completed 10thgrade.
Approximately 80% of household heads have education level at 7th and higher grades.Only 1.7% of household heads are illiterate. The rest 17.7% of the surveyed householdheads have the education level from first grade upto 6th grade.
Table 15: Education level of the household head
Grade Illiterate
Grade(1-6)
Grade7
Grade(8-9)
Grade 10
Grade(11-12)
Intermediate anduniversitylevel
Total
Number ofhousehold
17 177 458 63 224 51 14 1004
Percentage(%)
1.7 17.6 45.5 6.3 22.3 5.1 1.4 100
By main occupation, 81.7% of the household heads are farmers; 11.1% are retired old-aged. The percentage of household heads having other occupations than agricultural isunsignificant; it is only from 0.5% to 2.4% (handicrafts 0.5%, trading and services 1.7%,and state employees 2.4%).

32
The average household size (the number of persons in a household) is 5.5 persons. Thissize is typical in Vietnam's northern and central countryside, largely with households of from4 - 5 - 6 persons (accounting for 68.2% of the total 1,000 surveyed households). Themidland households have the largest size (5.6 persons/household), while it is only 5.2persons/household in the delta communes. The poor households are also characterized bya larger size (5.6 persons/household) than the middle-class households (5.4 persons) andthe better-off or rich households (5.3 persons). This has been confirmed through variousstudies on the rural poverty: one of the cause of poverty is the large-size family with toomany children.
Table 16: Average household size
Number of persons in ahousehold
1 2 3 4 5 6 7 8 9 10+ Total
Number of households 2 24 69 202 256 230 112 63 32 16 1006
% 0,2 2,4 6,9 20,1 25,4 22,9 11,1
6,3
3,2
1,6 100,0
In average, each household has 2.9 persons in working age. There is no significantdifference between poor and other households. In a poor household, there are 2.8 personsin working age, while in a middle household: 2.8 and in a rich household 2.9 persons.
The number of people in working age accounted 52.7% of household's population; thatmeans each breadwinner should earn for feet himself and one another person. Theproportion between working population and not-working are different by living standards: ina poor household it is 1/1, in a middle household: 1/0.93 and in a rich household: 1/0.83.
The number of households having from 2 to 4 eligible labourers has accounted for up to82.7%.
Table 17: Number of people in working age in a household
The number of labourers 0 1 2 3 4 5 6 7-9 Total
The number ofhouseholds
14 37 471 203 158 76 37 10 1006
Percentage ( % ) 1.4 3.7 46.8
20.2
15.7
7.6 3.7 1.0 100
2/ Economic situation of surveyed households:
a/ Economic diversification:
The purely agricultural nature of the households economy in the surveyed communes can beclearly realised through this. About 705 of the 1,000 surveyed households remain to bepurely agricultural ones. The number of households engaged in non-agricultural occupationssuch as trading, service provision, handicraft production, has accounted for a smallpercentage (0.7%).
The agricultural households having members being State officials or employees (includingthe retirees) make up 14.8%. Besides, 3.8% of the households live entirely on being State

33
employees. These two households groups live mainly in suburban communes of cities,provincial capitals, district town
The number of households engaged in agricultural production and trading-service activitieshas accounted for 7.5%, which tend to gradually separate themselves from the group ofpurely agricultural households, diversify rural occupations and approach non-agriculturaleconomic activities in the countryside.
Table 18: Household types by main occupation of the household members
Type of HH Number of HH %
1. Purely agricultural
2. Purely trade and services
3. Purely industry & handicrafts
4. Purely state services
5. Farming + trade, services
6. Farming + industry, handicrafts
7. Farming + state employees
8. Trade, services + state employees
9. Farming + trade, services + state employees
TOTAL
698
7
7
38
75
10
148
5
10
------
1.000
69,8
0,7
0,7
3,8
7,5
1,0
14,8
0,5
1,0
----
100,0
b/ Land resources:
Land is the most important resource and survival conditions for the peasants. Thoughvarious policies have been worked out to encourage and create conditions for ruraldevelopment along the direction of diversification of production and business lines andreduction of the number of purely agricultural households, land has, so for, still played themost important role products. Therefore, the indexes on the land being exploited byhouseholds are important for understanding the real situation of economic development in arural locality. Table 19 provides the average land area of each households.
Panoramically, 94% of the surveyed households have land for annual plant cultivation withan average of 3,795m2/household; 30% have forestry land; 27% have land for perennialtree planting with the average of 3,523m2/household.
It can be realised that the arable land area for each household is not high, just about 1/3 hafor a family with 5.4 persons. This figure is very close to the data obtained from communesurvey questionnaires. Moreover, the surveyed provinces are not categorised as regionswith high rice yield as those in the Red River delta. The potentials for intensive farming,crop increase, yield and output raising here (the 3 surveyed provinces) have beenexhausted.

34
Table 19: Household's land
Land category
Land areaowned bythehousehold(m2)
Land arealeased bythehouseholdin (m2)
Land arealeased bythehouseholdin (m2)
Total land areaused by thehousehold (m2)
Annual crop land 3.643 1.890 1.724 3.795
Perennial crop land 3.591 4.250 3.523
Forestry land 36.369 16.883 27.480
Garden and residentialland
1.507 1.507
Ponds, lakes, watersurface
1.875 4.731 1.606 2.363
Other land categories 4.253 11.503 4.950
Total 13.860 5.245 2.185 16.093
Survey data how that the number of households borrowing or renting arable land for annualplant cultivation makes up 13%. Meanwhile the percentage of households leasing orlending their land (mainly land for annual plant cultivation) and water surface is very low (1-2%).
In the land area under annual plants, there is no marked difference between householdgroups including groups with difference living standards. It can be realised that the arableland area in the countryside is not the most important factor determining the livingstandards of peasant households results of almost all studies on agriculture, peasantry andrural development in recent years in Vietnam have confirmed that the purely agriculturalhouseholds are usually difficult to get rich without diversifying their production and businesslines and developing non-agricultural ones.
The borrowing or renting of land for cultivation is not very common, only by several percentsof the surveyed households in Bac Kan and by 15% of the surveyed households in Nghe Anand Ha Tinh provinces, with about 1,000-2,000 m2 each. This also shows the extent oflabour division and social disintegration in such localities. This may be the initial sign ofland concentration in the process of developing the household economy under the marketmechanism.
c/ Food cultivation
The 1997 average food output (paddy and subsidiary food equivalent in paddy) of thesurveyed households reached 2,151 kg/household. With the household size of 5.4 persons/household as mentioned above, the average per-capital food ration is about 400kg in1997. With such output there will not be any households falling into food shortage. Yet, inreality the food output of households varies from region to region. For instance, householdsin Ha Tinh in average got 1,707 kg/household, in Nghe An: 2,437 kg and in Bac Kan: 2,104kg. The highland households (making up more than half of the surveyed households)achieved only 1,740 kg/household while midland and delta households got 2,600

35
kg/household. Particularly, women-headed households had lower food output than that ofmen-headed households: 1,815 kg/household against 2,169 kg.
A section of the surveyed households has suffered from food shortage. Survey results showthat 21.9% of the households have suffered from food shortage (for several monthsbetween crops). This percentage correspond to the of poor households (21.1%)determined in survey samples. According to geographical areas, Ha Tinh has the highestpercentage of households suffering from food shortage (29.2%). The figure is also high inhigh-land regions (30.7%) and among women-headed households (30.8%).
Excluding 21.9% of the households suffering from food shortage, 43.7% of the householdsgot enough food and 34.4% had surplus food for sale in 1997 with the average of 1.037 kgbeing sold by each household. This has reflected the disintegration among peasanthouseholds as well as the level of development of the agricultural commodity market insurveyed rural localities.
d/ Other economic activities:
The traditional husbandry products of the northern rural areas are manifest throughsurveyed households. Table 20 below shows types of domestic animals raised byhouseholds. Most common are 6 types with the percentage of households raising them andthe average number of animal head per households as follows:
Table 20: Animal husbandry of households
Type of animals Percentage of households havingbeen raising
Average number ofanimal heads per HH
Cattle 33,1 3,2
Horses 0,5 2,0
Buffaloes 46,9 2,0
Pigs 93,7 3,5
Poultry 92,3 40,0
Goats, deers 5,2 7,0
The percentage of households managing forests (natural forests and planted forests) andthe forest acreage varies according to geographical areas. For instance, with regard toplanted forests, Bac Kan has 52.9% of the households with forests, Nghe An: 20.2% andHa Tinh: 7.6%.
Having or not having forests and the forest acreage have not brought about any big changein the living standards of households. Perhaps, forestry and forest products have so far notyet contributed much to the cause of poverty reduction in the countryside. Because the mainforest product is firewood, more than 90% of which are for consumption by households.Two other kinds of products of high value, the sawn wood and other forest products areharvested by only few households though they are sold in fairly large quantities.
It can be realised that both the percentage of households with incomes from forest productsand their income amounts are relatively modest, being only part of the households’ totalrevenues from cultivation, husbandry and other economic activities.

36
The development of non-agricultural crafts in rural areas is mainly through the stepping up ofcottage-industrial and handicraft production as well as trading and services. Yet, insurveyed localities, the percentage of households having members engaged in cottage-industrial and handicraft production activities (bamboo weaving, textile, production ofconstruction materials, smithery, mulberry, etc.) is very low. Only 6.9% of the householdshave 2.5 persons on average engaged in such production activities.
Table 21: Number of people working in cottage industry and handicrafts
Percentage of HH havingactivities
Number of peopleengaged in
Number of HH and people 6,9 2,5
Of which: Male 6,3 1,5
Female 4,9 1,5
Unlike husbandry, cultivation or forest products, the cottage-industrial and handicraftproducts are of high commodity nature because most of them (90%) are turned out for sale.In 1997, 6.9% of the households earned more than 4 million VND each from the sale of theircottage-industrial and handicraft products. The figure is fairly high but only among 6.9% ofthe surveyed households. Poor households engaged in cottage-industrial and handicraftproduction have earned a modest sum, only equal to about 1/5 of the medium householdsand 1/8 of the rich households. Clearly, the development of such production lines requiresinvestment capital, labour and professional skills, which the poor households can not easilyget.
Table 22: Earnings from cottage industry and handicrafts
Percentage of HHhaving income
Average income of one HH
in 1997 (VND)
Total 6,9 4.086.521
By HH's living standards
Poor
Middle
Rich
5,2
8,1
4,6
886.363
4.312.200
7.076.250
As compared to cottage-industrial and handicraft production, trading and service activitieshave attracted a larger number of households : in average 12.6% of the households. Yet,the number of people from such households is smaller, in average 1-2 persons/households(with more female than male labourers).
Households’ earnings from trading and service activities can be calculated easier. In 1997,12.6% of the households engaged in trading and service activities in average earned 3.5million VND each, nearly equal to the amount earned by 6.9% of households engaged incottage-industrial and handicraft production (4 million VND/households/year).

37
Table 23: Households’ earnings from trading and service activities in 1997
Percentage of HHhaving income
Average income of one HH
in 1997 (VND)
Total 12,6 3.460.793
By HH's living standards
Poor
Middle
Rich
5,7
12,1
22,5
3.000.000
2.865.333
4.747.692
By region
Mountain
Midland
Delta
8,1
15,0
19,3
2.210.697
3.776.666
4.296.226
The economic development situation of the localities in the surveyed areas (throughhousehold survey) can be outlined in brief as follows. The purely agricultural content of theeconomic structure of the households remains high. The cultivation and husbandry productsare of traditional characters. The most important input resource, namely land, is verylimited. The yield is still low. Such non-agricultural production lines as cottage industry,handicrafts, trading, services represent low percentage and with small scale.
3/ The living conditions of households
a/ Housing
The structure, types and areas of houses of the surveyed households are shown in theTable 24 below:
Table 24: Types of HH's housing
Type of dwelling % of HH Average area of aHH (m2)
Multi-storey 0,6 83
One-storey permanent (brick-house)
16,7 70
Semi-permanent (wood house) 75,4 66
Temporary (straw/leaf roofedhouse, tent)
7,3 50
b/ Clean water
Only about 10% of the households are still using water from ponds, lakes, rivers, streams orcanals for their daily needs (it is 15% in mountain communes and Bac Kan). Water from

38
hand dug, deep drilled wells have not yet been qualitatively tested; hence, it cannot becategorised as clean water in its true meaning.
Table 25: Drinking water sources of households
Water sources Percentage of households
Private piped 2,4
Public standpipe 1,3
Hand dug well 76,1
Deep drilled well 16,2
Pond, lake, spring, river 8,2
Other sources 1,3
Note: Some households use more than one water sources, therefore total summ ofpercentages is more than 100%.
c/ Latrines
Regarding clean water and latrines in rural areas, much remains to be done. The surveyeddata show that localities in the surveyed areas are no exception. The twin-compartmentlatrines which were once considered the model toilet for the countryside, have been usedonly by nearly 1/ 2 of the households. Simple privies are still very common, particularly in themountain regions or in Bac Kan. 9.9% of the households do not have their own latrines(13.8% in Nghe An; 15.4% in mountain communes) and 4% have built their privies over fishponds (it is 10.9% in delta communes).
d/ Lighting energy sources
The majority of households have used electricity from the national grid (92% of thehouseholds in Nghe An provinces). Yet, the national grid electricity has not yet beenaccessible to 12% of the households in mountain communes, which have to used electricitygenerated from mini hydro-electric power generators or accumulators (it is 57% in Bac Kanprovince). Some 12% have used kerosene for lighting (27.6% in Bac Kan province).
e/ Home appliances and utensils
Most households have 2 or 4 mosquito nets and 1 to 3 electric fans. 13 - 15% of thehouseholds have sewing machines and electric cookers. Worthy of note is that thepercentage of households possessing audio-visual equipment is fairly high: 41.1% havecolour T.V., hi-fi radio compacts and telephones, which are considered high-classappliances, can be affordable to about 1% of the households, largely in provincial or districtcapitals.
Unlike home appliances and utensils, mechanical production instruments are possessed bysmall percentage of households. Only 12.4% have rice threshers, 6.5% have mechanicalpumps and rice huskers; only 3.2% have small tractors (under 12 horse powers). Thisshows that the investment in agricultural production in surveyed localities is still limited.

39
Table 26: Percentage of HH having home appliances and utensils
Home appliances % of HHhaving
Production machinery % of HHhaving
Mosquito net 98,8 Large tractor (over 12 HP) 0,7
Electric fan 79,5 Small tractor (under 12 HP) 3,5
Freezer 1,2 Water pump 6,5
Rice cooker 15,4 Motor rice thresher 12,4
Sewing machine 12,8 Rice milling machine 6,4
Colour television 41,1 Feed milling machine 2,9
White-black television 20,4 Motor insecticide pump 0,6
Radio cassette player 43,6 Generator 3,9
Video player 5,5
Stereo set 1,1
Telephone 1,0
4/ Education:
The number of school-attendants in households is an important index showing people’scare for education. Survey data give a positive picture. Almost all households have school-attendants, with the average of 2 each.
85% of the school-attendants are general education school pupils, including 43% primaryschool children, 38.5% the junior-high school pupils and 13.5% senior-high school pupilsand the remaining 5% are students of intermediate vocational schools, universities,colleges or job-training institutions.
Table 27: The number of school-attendants in a household.
Number of school-attendants per HH
Total number of school-attendants 1,99
Of which: Male 1,06
Female 0,90
Number of students:
Primary school
0,86
Lower secondary school 0,77
Upper secondary school 0,27
College 0,04
University 0,02
Vocational school 0,02

40
The number of school-age children (from 6 to 15 years old) having not going to school isvery small, only 27 (16 girls and 11 boys) in 22 of the total 1,000 households.
Among such 27 children, 11 have never gone to school (4 boys and 7 girls), 11 othersdropped out of primary school (4 boys and 7 girls) and 5 others (3 boys and 2 girls) havequitted their schooling after finishing their primary education.
Table 28: The causes of non-school going by children.
Causes % of responses
Needed for work at home/field 18,2School is too expensive 40,9Bad results at school 18,2School is too far away 9,1School is too hard to reach (bad roads, missing bridges,etc.)
4,5
Child does not need to learn more 9,1Other 27,3
5/ Health and medical service
According to interviews with households, at present 18.5% of the households havediseased/ chronically ill persons. The people’s accessibility to and trustworthiness on localmedical stations can be seen through the following data:
Table 29: Places where people go for medical examination and treatment
% of responses
Commune health clinic 49,0
Inter communal clinic 4,4
District hospital 41,1
Provincial hospital 18,9
Central hospital 2,2
Pharmacy 2,2
Home of person consulted 5,2
Traditional healer 0,5
Self-treatment at home 8,5
Note: One person may have more than one response options.
Besides, over 10% of the households have made self-treatment at their homes or boughtmedicines at the doctors’ prescriptions. They have reasoned that they felt unnecessary togo to hospital for examination, they wanted to save the money, or they did not want o travelfor a long distance.
6/ Living standards self-evaluation and impacts of the poverty alleviation

41
measures :
a/ Living standards self-evaluatuon of the surveyed households:
According to self-evaluation of their living standards by surveyed households, the surveygives the following results:
Living standard % of HHGood 15,7Middle 64,5Poor 17,8Very poor, hungry 2,0
Worthy of note is the percentages of poor and hungry households. Generally, 19.8% of thehouseholds thought they are in the category of poor and hungry families. This is very closeto the percentage evaluated by the commune authorities (19.3%).
Table 30: Percentage of households categorized as “poor” or “hungry” bycommune authorities
Poor Hungry Total
Total 18,0 1,3 19,3By provinceBac KanNghe AnHa Tinh
17,215,422,9
2,00,42,3
19,215,825,2
By regionMountainMidlandDelta
21,515,013,5
1,91,00,4
23,416,013,9
By sex of HH's headMaleFemale
17,123,1
1,4-
18,523,1
By ethnic groupKinhTayNungDaoMongKho MuThanhThai
15,415,450,023,5100,070,650,044,4
0,82,5---5,950,02,8
16,217,950,023,5100,076,5100,047,2
It can be realised through this survey that the percentage of poor and hungry households isoften higher in communes of Ha Tinh province (25.2%), among mountain households(23.4%), households with women as their masters (30.8%) and among the ethnic minorityhouseholds.
Better-off and rich households are seen largely among households engaged in agriculturalproduction, trading and service activities (36%), purely State employees’ households

42
(21.1%). Only 11.7% of purely agricultural households are better-off or rich.
According to their self-assessment the living standards of the majority of population havebeen bettered as compared to two years ago. Only 2.3% of the households said their livingstandards had been lowered.
• Much better : 10.6%• Better : 73.9%• The same : 13.1%• Worse : 2.3%
However, these figures vary according to households groups. The percentage ofhouseholds saying that their living standards were “the same” and “worse” in the mountaincommunes is 18.7%, in Ha Tinh: 17.3%; and among women-headed households: 26.9%.
The self-claimers of their “much better” living standards over the past two years includehouseholds which combine agricultural production with trading and service activities(17.3%) and households which combine agricultural production with being State employees(12.2%).
On major cause of the better living standards, households gave their opinions presented inTable 28.
Table 31: Major causes of the better living standards
Cause Percentageof response
Made the livingstandards better
Climate 38,4 37,5Change in h'hold labor resources (more) 29,8 28,7Change in capital (more) 46,0 44,9Change in land (more) 15,9 15,2
Implementation of new seeds, new technology 68,9 68,0New public infrastructure 33,9 33,3
Governmental support through development project,training, afforestation and rural credit projects
15,4 14,6
Support from other h'holds/outsiders 13,3 12,6Other 4,5 3,2
According to this result, most of the cited causes are positive (making the life better). Thenumber of negative causes (making the life worse) only accounts for around 1%.
Among the positive causes, the “transfer of new technologies” (new seeds, breed andfarming techniques’) was mentioned by 68.9%, which was followed by the cause of “havingmore capital” (46%), favourable weather (38.4%), with new infrastructures (33.9%). Theseare good suggestions for the future implementation of the poverty alleviation program.

43
b/ Impacts of the programme for hunger elimination and poverty alleviation.
Over recent years, the rural population, particularly poor people, have more or less enjoyedsupports/benefits from the Government’s hunger elimination and poverty alleviationprogramme. However, not all households in localities have enjoyed such benefits equally.
Table 32: Benefits enjoyed by households from the hunger elimination andpoverty alleviation programme
Benefits % of HH getting benefit
Credit loan 27,0
Fee exemption for primary school 2,8
Fee exemption for health care 6,6
Free school supplies 1,5
Relief fund for pre-harvest starvation anddisasters
1,0
Free land 1,0
Training 4,2
Cash transfer 0,8
As seen in the above Table, about 1/4 of the households (higher than the percentage ofpoor and hungry household) have received capital support from the programme. Thepercentage of such capital-borrowing households is highest among the poor households(42.9%), in Bac Kan (40.9%) and the mountain communes (33.6%).
In addition, a number of other households have been given free medical treatment (6.6%),training in production techniques (4.2%), school fee exemption or books and notebooks totheir children. The percentage of households being given support in cash or famine relief isvery low (around 1%). This is truly correct with the strategic guiding principle of the hungerelimination and poverty alleviation programme, that is “giving a fishing rod is better thangiving a string of fish”.
3. CONCLUDING REMARK
The results of the pilot survey conducted by MIMAP-Vietnam with the aim to test theproposed methodology of rural poverty monitoring show the followings:
• The proposed two-level (community and household) monitoring system is welcomed byboth governmental authorities who are responsible for poverty alleviation program andlocal people, including local government officials and mass organisations practisingactively anti-poverty measures. The data collected and processed could be used forevaluation of impacts of macroeconomic policies on micro levels (community andhousehold), as well as for designing and implementing community self-managedpoverty alleviation activities.

44
However, the conducted survey showed also that the monitoring system should beextended to higher administrative levels (district and province), because the process ofpolicy making and implementation goes through all administrative levels, from national,provincial, district to commune, and after that to households and individuals, it is neededto develop a monitoring system integrating all these levels. That means that theresearch project should work more to develop a system of indicators, flows and formatsof information, that covers all levels: national, provincial, district, commune, householdand individual.
• The proposed set of indicators in general is suitable for community and householdlevels. There are few indicators which cannot be gathered or meet difficulties withinformation collection. They should be further elaborated and readjusted. They are theindicators that require a exact quantitative measurement. The indicators reflectingnutrition of households or individuals belong to this category.
• Since the poverty assessment based on a basic needs approach, it is necessary todefine more clearly and to measure some basic needs which are different towardgender, age, economic activity and other characteristics of household's members. It isto be defined an operational and relevant age/sex classification of household membersin view of some specific non-monetary indicators. Then, the research should formulateand test individual indicators specific to age/sex groups, particularly on health, nutrition,education, literacy, employment, etc. The ability of different groups of people to besatisfied with several categories of needs should be measured. This means designingquestionnaires filled at the individual level within the household. Recommendationsbased on individual poverty indicators could be elaborated in order to improve publicpolicies concerning different social groups. Not a lot of research work has been done atthe individual level, and the MIMAP team could come out with extremely original resultson this important dimension of poverty.

45
REFERENCES
Atkinson A.B. (1987), "On the measurement of poverty". Econometrica, Vol.55.
Ahmad Mushtaq (1996), Poverty in Pakistan: Concept, measurement, nature, incidenceand review of strategies to alleviate poverty". Pakistan Ministry of Finance, Islamabad.
Beneria Lourdes & Bisnath Savitri (1996), "Gender and Poverty: An Analysis for Action".UNDP. New York.
Bidani B & Ravallion M. (1994), "How robust is a poverty profile". World Bank EconomicReview, Vol. 8.
Bird Richard M., Ltvack Jennie I. & Rao M. Govinda (1995), "Intergovernmental fiscalrelations and poverty alleviation in Viet Nam". World Bank. Washington D.C.
Chu Van Vu ed. (1995), “Rural household economy”. Social Sciences Publisher. Hanoi.
Carvalho Soniya & White Howard (1995), “Performance indicators to monitor povertyreduction”. Education and Social Policy Department, The World Bank.
Dessalien Renata Lok (1995), "Poverty indicators". UNDP. New York.
Dessalien Renata Lok (1996), "From data collection to poverty assessments". UNDP. NewYork.
Dreze Jean & Amartya Sen (1995), "The Political Economy of Hunger: Selected Essays".Oxford University Press.
Glewwe Paul & Van der Gaag Jacques (1990), "Identifying the poor in developingcountries: Do different definitions matter?". World Development, Vol. 18, No. 6. London.
GSO & State Planning Committee (1994), “Vietnam Living Standard Survey”. Hanoi.
Griffin Keith, Khan Azizur Rahman, McKinley Terry, Perrings Charles (1997), "Themacroeconomic framework, human development and elimination of poverty in Viet Nam".UNDP. New York.
Khan Azizur Rahman (1997), "Macroeconomic policies and poverty: An analisis of theexperience in ten Asian countries". UNDP's Regional Bureau for Asia and the Pacific.Bangkok.
Lamberte Mario B., Llanto Gilberto M., Lapar Lucila, Orbeta Aniceto C. (1991), "Microimpacts of macroeconomic adjustment policies (MIMAP): A framework paper andreview of literature". Philippine Institute for Development Studies, Manila.
Lanjouw Jean Olson (1997), "Behind the line: De-mystifing poverty lines". UNDP. New York.
McKinley Terry (1996), "Poverty Indicators". UNDP. New York.
McKinley Terry (1997), "The macroeconomic implications of focussing on povertyreduction". UNDP. New York.
McKinley Terry (1997), "Beyond the line: Implementating complementary methods ofpoverty measurement". UNDP. New York.
MOLISA (1990), “Poverty in Vietnam”. Proceeding of the workshop. Hanoi.

46
MOLISA (1996), “Report on the situation of hunger eradication and poverty reduction 1992-1995 and tasks in the 1996-2000 period. Hanoi.
Ministry of Planning and Investment (1996), “National programme for hunger eradicationand poverty reduction in Vietnam (Draft)”. Hanoi.
Mujeri Mustafa K. (1995), "Monitoring adjustment and poverty: The Bangladeshexperience". Center on Integrated Rural Development for Asia and the Pacific (CIRDAP),Dhaka.
McMahon Gary & Yuste Carlos (1996), "The micro impacts of macroeconomic andadjustment policies (MIMAP): Experience to date and future directions". IDRC, Otawa.
Nguyen Thi Hang & Nguyen Van Thieu (1991), “Poverty in Vietnam: Performance, currentsituation and assessments”. In “Povery in Vietnam”. Hanoi.
Nguyen Thi Hang (1996), “Some orientations and measures for poverty alleviation in ruralareas” M.A. thesis. National Academy of Political Sciences. Hanoi.
Qureshi Sarfraz Khan (1996), "Adjustment programme and poverty in Pakistan".Pakistan Institute of Development Economics, Islamabad.
Qureshi Sarfraz Khan & Malik Sohail J. (1996), "Needs and sources of data for poverty inPakistan". Pakistan Institute of Development Economics, Islamabad.
Reed David & Sheng Fulai (1997), "Macroeconomic policies, poverty and theenvironment". World Wide Fund for Nature. Washington D.C.
Rodgers Gerry, Van de Hoeven Rolph (1995), "The poverty agenda: Trends and policyoptions". International Institute for Labour Studies.
Reyes Celia M. & Alba Isabelita Z. (1994), "Assessment of community-based systemsmonitoring household welfare". Philippine Institute for Development Studies. Manila.
Reyes Celia M. (1996), "Monitoring system for poverty tracking". Philippine Institute forDevelopment Studies. Manila.
Social Watch (1997), "The dimensions of poverty". Instituto del Tercer Mundo.
United Nations (1995), "Poverty elimination in Viet Nam". New York.
United Nations (1995), "The Copenhagen declaration and programme of action: Worldsummit for social development". New York.
United Nations (1995), "The work of the UN system in poverty alleviation: Report of theconsultative committee on programme and operational questions working group onpoverty". Geneva.
UNDP (1995), "Poverty eradication: A policy paper for country strategies". New York.
UNDP (1996), "Progress against poverty: A report on activities since Copenhagen". NewYork.
UNDP (1997), "Human Development Report 1996". New York.
UNDP (1997), "Indicators of sustainable livelihoods". Draft report of the Workshop onIndicators for Sustainable Livelihoods held at UNDP on 21 August 1997. New York.

47
UNDP, UNFPA, UNICEF (1995), “Hunger eradication and poverty reduction in Vietnam”.Hanoi.
UNDP, UNICEF (1996), “Catching up - Capacity development for poverty elimination inVietnam”. Hanoi.
Van de Wall Dominique & Nead Kimberly (1995), "Public Spending and the Poor: Theoryand Evidence". World Bank & Johns Hopkins University Press. Baltimore and London.
Vu Tuan Anh ed. (1994), “Economic reforms and development in Vietnam”. SocialSciences Publisher. Hanoi.
Vu Tuan Anh, Tran Thi Van Anh (1997), “Household economy in Vietnam: History andperspectives of development”. Social Sciences Publisher. Hanoi.
Vu Manh Thien (1996), “Some special characteristics of the Vietnamese people'snutritional stuation 1980-1995”. Report for the reserach project of rural poverty monitoring,The Socio-Economic Development Centre, Hanoi.
Wang Huijiong (1994), "Poverty alleviation and development". Academic CommitteeDevelopment Research Center, The State Council of China.
Watkins Kevin (1997), "Oxfam's report on poverty in the world". Oxfam U.K and Ireland.Hanoi.
Woodward David (1996), "Effects of globalisation and liberalisation on poverty: Conceptsand issues" in "Globalisation and liberalisation: Effects of international economic relationson poverty". United nations Conference on Trade and Development. Geneva.
World Bank (1991), “Development report 1991: Poverty”. Washington D.C.
World Bank (1995), “Vietnam poverty assessment and strategy”. Report No. 13442-VN.Washington D.C.