Rural Livelihood Strategies in the Southern Highlands of ...
56
WAGENINGEN UR, DEVELOPMENT ECONOMICS GROUP Rural Livelihood Strategies in the Southern Highlands of Tanzania An examination of household well-being in the light of economic reforms MSc. Thesis Management, Economics and Consumer Studies Jasmijn Appels June 2015 Supervisor: Marrit van den Berg
Transcript of Rural Livelihood Strategies in the Southern Highlands of ...

WAGENINGEN UR, DEVELOPMENT ECONOMICS GROUP
Rural Livelihood
Strategies in the Southern
Highlands of Tanzania
An examination of household well-being in the
light of economic reforms
MSc. Thesis Management, Economics and Consumer Studies
Jasmijn Appels
June 2015
Supervisor: Marrit van den Berg

i | P a g e
Abstract
Tanzania has changed from a socialist system to a capitalist system since the 1980’s. Market
liberalization has been the key element in the macroeconomic reforms that have taken place, and
reforming the agricultural sector is seen as a priority. This research analyses the degree to which the
current Tanzanian agricultural sector has modernized and commercialized after the implementation of
several economic and agricultural reforms. The analysis is on the micro-level of rural households. The
study uses the Sustainable Livelihoods Framework to assess the livelihood strategies that rural
households in the Southern Highlands are engaged in. The study looks at the determinants of each
livelihood strategy in order to define group characteristics and to discover the differences in levels of
well-being per strategy. The results of the analysis show that commercialized rural livelihood strategies
attain higher levels of well-being than the less commercialized rural livelihood strategies. However, there
is no profound evidence that the economic reforms have changed the agricultural sector into a highly
efficient and productive sector that is focused on market-oriented crops.
Keywords: economic reforms, livelihood strategies, well-being, Southern Highlands Tanzania.
Number of words: 173

ii | P a g e
Acknowledgements I would like to thank my supervisor Marrit van den Berg for her feedback and comments on previous
versions and for her assistance in the process of analysing the data. I am also thankful to Abiud January
Bongole for the work he did to facilitate the survey preparation and the interviews. I would like to thank
all the enumerators who did tremendous amounts of work during the field work. Last but not least I am
thankful to my groupmates Sivan van Leerzem, Romy Appelman and Lavinia Plataroti for their company
in Tanzania, for their helping hands throughout the whole year and for sharing their thoughts with me
during the writing of this report.

iii | P a g e
List of abbreviations
AE Adult Equivalent
AGRA Alliance for a Green Revolution in Africa
CFA Common Factor Analysis
GDP Gross Domestic Product
IIA Independence of Irrelevant Alternatives
MDGs Millennium Development Goals
OECD Organisation for Economic Co-operation and Development
PCA Principal Component Analysis
PCF Principal Component Factoring
iv | P a g e
Table of Contents Abstract .................................................................................................................................... i
Acknowledgements .................................................................................................................... ii
List of abbreviations .................................................................................................................. iii
List of tables and figures ............................................................................................................ vi
1. Introduction ................................................................................................................... 1
2. Economic and agricultural development .............................................................................. 3
2.1 Economic development after independence ...................................................................... 3
2.2 Policy frameworks from the 21st century .......................................................................... 4
2.2.1 The Tanzania Development Vision 2025 ....................................................................... 4
2.2.2 National Strategy for Growth and Reduction of Poverty I and II ....................................... 4
2.2.3 Kilimo Kwanza ......................................................................................................... 5
2.3 Growth scenario’s ........................................................................................................ 6
2.4 The reality check ......................................................................................................... 7
2.5 Agricultural development synthesis ................................................................................. 8
3. Theoretical framework.................................................................................................... 10
3.1 Rural livelihoods ........................................................................................................ 10
3.1.1 Sustainable livelihoods framework ............................................................................ 10
3.1.2 Hanging in, stepping up and stepping out .................................................................. 11
3.2 Markets and transaction costs ...................................................................................... 13
3.3 Well-being ................................................................................................................ 14
4. Project and research area description ............................................................................... 15
4.1 Project description ..................................................................................................... 15
4.2 Area description......................................................................................................... 15
5. Data and methodology ................................................................................................... 20
5.1 Data collection .......................................................................................................... 20
5.2 Cluster analysis ......................................................................................................... 20
5.3 Multinomial logit regression ......................................................................................... 22
5.4 Household well-being indicator ..................................................................................... 24
5.5.1 Possession of household assets .................................................................................... 24
5.1.2 Household consumption expenditures ............................................................................ 25
6. Results ........................................................................................................................ 26
6.1 Livelihood strategy identification .................................................................................. 26
6.1.1 Maize farmer ......................................................................................................... 27
6.1.2 Maize & other crop farmer ....................................................................................... 29
6.1.3 Diversified farmer ................................................................................................... 30
6.1.4 Rice farmer ........................................................................................................... 32
6.1.5 Livelihood strategy synthesis.................................................................................... 33
6.2 Multinomial logit model ............................................................................................... 34
6.3 Livelihood strategies and well-being ............................................................................. 35
6.3.1 Determinants of well-being ...................................................................................... 35
v | P a g e
6.3.2 Well-being levels per livelihood strategy .................................................................... 36
6.4 Influence of economic reforms on livelihood strategies .................................................... 37
6.4.1 Hypothesis 1: Tanzania has managed to transform its agricultural sector to a
commercialized agricultural sector ........................................................................................ 37
6.4.2 Hypothesis 2: Commercialized agriculture is the most attractive rural livelihood strategy for
a rural household in Mbeya .................................................................................................. 38
6.4.3 Tanzanian economic reforms: a well-grounded African success story? ............................ 39
7. Discussion .................................................................................................................... 41
8. Conclusion.................................................................................................................... 44
References .............................................................................................................................. 46

vi | P a g e
List of tables and figures
Table 1 Explanation of the 10 pillars of Kilimo Kwanza ..................................................................... 5 Table 2 Historical (2000-2007) and estimated (2007-2015) yield and production growth estimations for
individual crops in Tanzania ......................................................................................................... 7 Table 3 Percentage of incidence of poverty in Tanzania .................................................................... 8 Table 4 Livelihood strategies for poor and less poor farmers, by market opportunities and natural
resource potential .................................................................................................................... 13 Table 5 Main activity of agricultural household heads by number and percentage per district. .............. 18 Table 6 Major income generating activities divided by district. ........................................................ 18 Table 7 Percentage of households selling their crops per district ...................................................... 19 Table 8 Variables used for the classification of livelihood strategies ................................................. 21 Table 9 Household determinants of livelihood strategies ................................................................ 23 Table 10 Livelihood strategies distribution ................................................................................... 26 Table 11 Summary statistics for each cluster ................................................................................ 27 Table 12 Number of crops cultivated (Livelihood 3) ....................................................................... 30 Table 13 Overview of main features per cluster ............................................................................ 33 Table 14 Multinomial logit coefficients: determinants of livelihood strategies ..................................... 34 Table 15 Determinants of asset index scores ................................................................................ 36 Table 16 Asset index scores and food expenditures per cluster ....................................................... 36 Table 17 Average owned land area in acres .................................................................................. 38 Table 18 Summary statistics for commercial agriculture indicators .................................................. 39 Table 19 Summary statistics about information access and/or use ................................................... 40
Figure 1 Sustainable livelihoods framework .................................................................................. 10 Figure 2 Location of Mbeya region in Tanzania. ............................................................................. 16 Figure 3 Total number of agricultural households by district in Mbeya region ..................................... 17 Figure 4 Median of number of crops cultivated per cluster .............................................................. 27 Figure 5 Distribution of cultivated land of the maize farmer in percentage (Livelihood 1)..................... 28 Figure 6 Distribution of maize farmer households per district (Livelihood 1) ...................................... 28 Figure 7 Distribution of non-farm work in percentage (Livelihood 1) ................................................ 29 Figure 8 Distribution of land per crop (Livelihood 2) ...................................................................... 29 Figure 9 Distribution of land per crop (Livelihood 3) ...................................................................... 31 Figure 10 Use of technology (Livelihood 3) ................................................................................... 32 Figure 11 Number of households per district (Livelihood 4)............................................................. 32 Figure 12 Distribution of land per crop (Livelihood 4)..................................................................... 33
1 | P a g e
1. Introduction
The United Republic of Tanzania is situated in East Africa, immediately south of the Equator. The
population of the country is estimated 49,25 million in 2013 (FAO, 2013; World Bank, 2014). In 2012,
28.8% of the population lived below the national poverty line and 44% of the population had access to
clean water. The life expectancy in Tanzania is 61 years, and the average GNI per capita is $630 (World
Bank, 2015).
In recent years, Tanzania’s economy has grown as a result of sound macroeconomic policies towards
market liberalization. The gross domestic product (GDP) grew at 6,6 percent per year between 1998 and
2007 (Pauw & Thurlow, 2012). Because of these promising numbers, Tanzania is often named as an
example of “African successes” by multilateral institutions (Nord et al., 2009). At the same time, many
scientists and organizations argue that reforms towards market liberalization have failed to bring the
prosperity that is claimed by the government and donor organizations (Cooksey, 2011). The rapid
economic growth didn’t translate into rapid reductions in poverty and malnutrition (Pauw & Thurlow,
2011), and corruption and an authoritarian government are still problematic issues (Edwards, 2014).
Even after economic liberalization, the economy in Tanzania is characterized by high levels of public
control and low private action (Ellis & Mdoe, 2003; Cooksey, 2013). Market liberalization is induced since
the 1990s, but the market environment still doesn’t manage to bring the whole rural population out of
poverty.
At the micro level of individuals and households, there are external and internal factors that impact the
outcomes of economic reforms. The geographical location plays an important role in this. For example,
differences in infrastructure, services, climate and resource base may affect the effectiveness of policy
interventions (Mdoe et al., chapter 29) and macro-economic reforms. The effects of past economic
reforms and interventions towards market liberalization could thus be very diverse per household and
per region.
In this research I will try get insight on how rural households are affected by past policy reforms in the
region Mbeya, located in the Southern Highlands of Tanzania. I will use a livelihood approach in order to
look at the household economic responses. The analysis of livelihood activities and transformations has
proven to be an effective way to see the opportunities for interventions at the micro level, as well as it
can show the effectiveness on previous policy changes towards market liberalization (Scoones, 2009).
Livelihood strategies are characterized by the allocation of assets (physical, natural, social, human and
financial), income generating activities (on farm, off farm), and livelihood outcomes (food, health,
income, security). Rural households participate in a diversity of livelihood activities and strategies.
Together these determine the well-being achieved by the household (Lopez, 2008).
The goal of this study is twofold. First, I want to find out to what extend the economic reforms are
reflected in the livelihood strategies of the rural households in the research area. There is no time series
data involved in the research, so it is not possible to compare the current situation with the situation
before the economic reforms. I can therefore only focus on the question whether the desired outcomes of
the economic reforms are visible in the existing livelihood strategies in the research area.
2 | P a g e
The second goal of the study is to check the assumption that commercialized livelihood strategies
(stimulated by the economic policy reforms) have better perspectives in terms of well-being. In order to
fulfil our goals for the research, I have formulated the following research questions:
1. What are the main rural livelihood strategies of the respondents?
2. What are the determinants of each strategy?
3. What is the impact of livelihoods choice on household well-being?
4. Did the economic reforms have the desired impact on current livelihood strategies?
This research is part of a bigger impact evaluation that will measure the impact of the project entitled
“Increasing Agricultural Productivity in the Breadbasket Area of Southern Tanzania”, conducted by SNV
(Dutch Development Organisation) as the leading partner. The results are based on a broader study
among rural households that have a membership in a farmers organization in the region Mbeya. The
project benefits from this research because it will provide a window into household decision making and
available livelihood strategies. This will increase the understanding of what kind of interventions are the
most likely to be successful per household and per livelihood strategy.
The report is structured as follows. First, background information about the agricultural and economic
development of the past 50 years is provided in Chapter 2. This information is necessary understand the
current economic situation in Tanzania. Chapter 3 presents the theoretical framework that gives a better
understanding of livelihoods concepts. Additionally the theoretical frameworks presents the importance of
markets and transaction costs in agricultural development, and the concept of well-being is discussed.
Chapter 4 is a short analysis of the research area, discussing different social and economic statistics of
the Mbeya region. In chapter 5 the data and methodology is discussed. Chapter 6 reveals the results and
Chapter 7 includes the discussion. Conclusions can be found in Chapter 8.

3 | P a g e
2. Economic and agricultural development
Tanzania is an agriculture-based country, with 72 percent of the population living in rural areas and 75
percent of the labor force working in agriculture (World Bank, 2014). The larger part of the poor live in
rural areas and depend on agricultural livelihoods, which makes the agricultural sector a key sector for
development (Pauw & Thurlow, 2011). An appropriate background on Tanzania’s past reforms and
economic performances is needed in order to understand the current economic situation for the
agricultural sector in Tanzania (Edwards, 2014). This chapter is concerned with the history that shaped
Tanzania’s status quo.
2.1 Economic development after independence
In order to understand the economic challenges in contemporary Tanzania, it is important to be aware of
the social and economic history after independence in 1961. During the first 25 years after independence,
Tanzania was ruled according to the “African Socialism” (Ujamaa, meaning “familihood”) ideas of
president Julius Nyerere. These ideas were based on Nyerere’s philosophy of socialism, with the main
objective the attainment of a self-reliant socialist nation (Ibhawoh & Dibua, 2003). The Ujamaa included
public control over agricultural markets and prices, nationalization of enterprises, and the “villagization
process” that enforced previously scattered peasants to move to villages predesigned by planners (Ellis
& Mdoe, 2003). The socialist policies of Nyerere’s government were not successful, which resulted in a
big black market and shortages of all sorts of goods in the mid-1970s. For the agricultural sector, these
policies resulted in stagnation and consequently a decline in productivity and income (Ministry of
Agriculture, 2013). As a consequence, the Tanzanian government collapsed in the late 1970s and early
1980s (Edwards, 2014). Tanzania was highly supported by foreign donor countries from independence in
1961 to the economic crisis in the early 1980s. The high amounts of aid flows resulted in a high
dependency on foreign assistance. Besides that, the donors supported policies that led to undesirable
outcomes and high corruption rates (Edwards, 2014). Some people even claim that the strong support
from the international aid community was the cause of the economic decline: an example of what critic
W. Easterly and D. Moyo call “dead aid” (Easterly & Easterly, 2006; Moyo, 2009).
Political reforms started mid-1980s, and policy adjustments focused on economic liberalization and
ending a society led by state control (Cooksey, 2011). The main policy adjustments included the
devaluation of the Tanzanian shilling; a cut in parastatal subsidies; import liberalization;
denationalization of banks; removal of price controls; removal of state monopolies and liberalization of
food markets (Ministry of Agriculture, 2013, p.1); (Cooksey, 2011, p.560). In the early 1990s, the
second-generation reforms took place. The main policy adjustments of the second reforms fundamentally
changed the public sector: civil service reform, budget management and privatization (Devarajan, Dollar,
& Holmgren, 2001). The second-generation reforms in the agricultural sector mainly focused on export
crop liberalization. According to Cooksey (2011), these export crop liberalization reforms were earnestly
resisted by powerful political players who argued that there already was sufficient externally-driven
liberalization. Examples that he mentions are: “(i) the re-empowerment of export crop boards which tax
traders and exports (and therefore farmers) and regulate markets in which they are active commercial
players; (ii) the arbitrary and sometimes oppressive treatment of farmers by local government
authorities, inter alia through taxation; (iii) the proliferation of sector policies and strategies that
privilege the state as initiator rather than facilitator at central and local levels, notably through the
vehicle of foreign-aid-funded projects;7 (iv) the continued practice of government-guaranteed bank
lending to certain co-operative unions” (Cooksey, 2011, p. 560).

4 | P a g e
It is highly debated whether the economic transformation that reinterpreted the roles of the public and
private sector was successful. One of the problems in analysing the performances of the transformation
is the unreliable data that are available, which makes it difficult to find causal relationships between
policy variables and growth (Jerven, 2011). Research by Nord et al. (2009) implicates that the reforms
have changed Tanzania from a state controlled economy to a market economy. Cooksey (2011) does not
agree on this, and argues that the degree to which Tanzania has successfully adopted market
liberalization is greatly exaggerated. He puts the statement that “the dominant liberalisation discourse
explains very little of the recent changes in the practice of the Tanzanian state as regards agricultural
markets, and begs the question of the actual content of ‘liberalization’” (Cooksey, 2011, p. 576). Ellis
and Mdoe (2003) state that the major problem lays in the fact that public services and private sector
growth are very intertwined in Tanzania. This is reflected in economic trends and events that show a
difference between stated and actual liberalization actions. The gap between stated and actual
liberalization actions results in contradictory outcomes and interpretations of degree to which Tanzania’s
economy is really liberalized.
2.2 Policy frameworks from the 21st century
From the above paragraph it can be concluded that, despite numerous policy documents and frameworks,
there is no clear answer to whether the past liberalization reforms are fully implemented by the
government. The policy frameworks created by the Tanzanian government are nonetheless important for
economic sector development in the country. Some of the main policy frameworks are discussed here. It
should be noted that this is not the full list of policy documents that design the (agricultural) policies in
Tanzania. I made this selection based on the relevance for this thesis.
2.2.1 The Tanzania Development Vision 2025
The Tanzania Development Vision 2015, formulated in 1999, focuses on the long-term development
vision and sets goals for the country that should be attained by 2025. The five main pillars that the
Vision 2025 focuses on are: (1) high quality livelihood; (2) peace, stability and unity; (3) good
governance; (4) a well-educated and learning society and (5) a competitive economy capable of
producing sustainable growth and shared benefits (Tanzania Planning Commission, 1999). What is
noticeable is that a relatively small part is concerned with (small-scale) agriculture in Tanzania. The main
promise for the agricultural sector in 2025 is that “The economy will have been transformed from a low
productivity agricultural economy to a semi-industrialized one led by modernized and highly productive
agricultural activities which are effectively integrated and buttressed by supportive industrial and service
activities in the rural and urban areas.” (Tanzania Planning Commission, 1999). The focus is on agro-
industries and developing those activities that have a dynamic comparative advantage (Tanzania
Planning Commission, 1999).
2.2.2 National Strategy for Growth and Reduction of Poverty I and II
There are two national strategies written for growth and reduction of poverty. In the first National
Strategy for Growth and Reduction of Poverty, developed in 2009, growth sectors were defined that ,
should become priority areas to reduce poverty and increase economic growth. The growth sectors could
be used as a mechanism to achieve the goals set by the Tanzania Development Vision 2025 and the
Millennium Development Goals (MDGs). The agricultural sector (together with tourism and the
manufacturing industry) is appointed as one of the growth sectors. Agriculture is named as one of the

5 | P a g e
growth sectors because it is seen as a sector with direct impact on overall growth, and furthermore
indirect impact on growth via several multiplier effects. The outlined comparative advantages in
agriculture are the availability of land and the land’s suitability for irrigation (Tanzania Planning
Commission, 2009).
The second National Strategy for Growth and Reduction of Poverty elaborates on the major struggle
within the agricultural sector: productivity. This is especially a concern for smallholder farmers (and thus
the majority of the agricultural sector). The report suggests “drivers” for agricultural growth, designed to
increase agricultural productivity (Ministry of Finance and Economic Affairs, 2010). The following major
drivers are mentioned: (1) supportive physical infrastructure; (2) water and irrigation infrastructure; (3)
financial and extension services; (4) knowledge and information; (5) value addition activities and (6)
trade development services (Ministry of Finance and Economic Affairs, 2010). Furthermore, the National
Strategy for Growth and Reduction of Poverty II is focused on lifting Tanzania to a middle income country
characterized by “(i) high quality livelihood, (ii) peace, stability and unity, (iii) good governance, (iv) a
well-educated and learning society, and (v) a strong and competitive economy” (Ministry of Finance and
Economic Affairs, 2010).
2.2.3 Kilimo Kwanza
The most recent and widely used framework that focuses on agriculture is “Kilimo Kwanza”, meaning
“agriculture first”. Kilimo Kwanza is a central pillar to the Development Vision 2025, emphasizing that
agriculture is the most effective tool to successfully eradicate poverty for the majority of the population.
Kilimo Kwanza is also a strategy closely related to the first National Strategy for Growth and Reduction of
Poverty since it reflects the implementing strategy for one of the growth sectors, namely agriculture.
Modernization and commercialization of agriculture are the main goals for Kilimo Kwanza, and the private
sector should be the leading implementing agent of this strategy. The strategy implementation is guided
by 10 pillars that are outlined in Table 1. Kilimo Kwanza was implemented in 2009 (Government of
Tanzania, 2009), and the aim was to achieve its objectives in 2013 at the end of the “Ministries Medium
Term Strategic Plan” (Ngaiza, 2012).
Table 1 Explanation of the 10 pillars of Kilimo Kwanza
# Kilimo Kwanza Pillar Description
1 Political will to push
agricultural transformation
Foster political will and commitment of all Tanzanians to the Kilimo
Kwanza Resolution for agricultural transformation to
commercialization, to be undertaken by small, medium and large
scale producers.
2 Enhanced financing for
agriculture
Mobilize financial resources from the private sector, public sector,
financial institutions, development partners, NGOs and community
based organizations to implement Kilimo Kwanza.
3 Institutional reorganisation
and management of
agriculture
Emphasis on good governance, better coordination, monitoring and
evaluation. Involvement of the private sector is of great importance.
4 Paradigm shift to strategic
agricultural production
Prioritize production based on market demand and supply. Top
priority for food crops. Produce what is consumed and consume what
is produced.
5 Land availability for
agriculture
Facilitate access to land for agriculture, enhance security of tenure,
promote the harmonious and judicious exploitation of the land
resource and create an enabling environment for using land to access

6 | P a g e
credit.
6 Incentives to stimulate
investments in agriculture
Introduce and review incentive policies and regulations (both fiscal
and non-fiscal) to attract and retain investments in the agricultural
sector.
7 Industrialization for
agricultural transformation
Establish industries to provide backward and forward linkages for the
agricultural sector and increase access to local and foreign markets
for value added products.
8 Science, technology and
human resources to support
agricultural transformation
Promote the use of modern technologies by all producers; increase
government expenditure on research and development to 1% of
GDP; identify, train and effectively utilize agricultural expertise; and
develop farm service centres.
9 Infrastructure development
to support agricultural
transformation
Develop infrastructure for irrigation, rural electrification, storage,
roads, railways, ports, airports, market centres and information
technology to support agriculture.
10 Mobilization of Tanzanians
to support and participate in
implementing Kilimo
Kwanza
Integrate Kilimo Kwanza in governmental bodies, promote it at the
national, regional, district, ward and village level. Monitor and
Evaluate Implementation of Kilimo Kwanza by both private and public
sector.
Source: adapted from Government of Tanzania (2009).
The fourth pillar advocates prioritization of agricultural production based on demand and supply. The
Kilimo Kwanza Implementation Framework of the Government of Tanzania (2009) outlines which food
crops can be seen as “strategic” to cultivate: maize, cassava, rice, wheat, bananas, potatoes, sorghum
and millet. The crops that are seen as “strategic” for international trade are onions, mangoes, bananas,
grapes, avocados, pineapples, tomatoes and spices. Furthermore the Implementation Framework puts
focus on “transformation crops”: cotton, sunflower, safflower, sesame and palm oil (Government of
Tanzania, 2009). The indication of “strategic crops” and “transformation crops” in the implementation
framework is interesting. This suggests that the strategic value for the crops is determined by policy
decisions, and not by their market performances.
Overall, the pillars of Kilimo Kwanza show that the Tanzanian government basically wants to initiate a
green revolution in the country. The government wants to enhance an agricultural revolution through
policies and institutional reforms, infrastructure development especially rural roads, use of modern
technology, extension services, irrigation systems, market access, reform of the land laws and
advocating for investment in agro-processing sector/industry (Swenya, Kabisama, & Shadrack, 2014).
2.3 Growth scenario’s
Tanzania has inserted a progressive policy framework that should drive agriculture to a higher level. The
policy documents however do not include clear growth predictions that should come forward from the
investments in the agricultural sector.
Pauw and Thurlow (2011) have created a model that predicts two growth scenario’s for major crops in
Tanzania (see Table 2). The first scenario is a “baseline scenario”, where growth is expected to continue
at the same pace as recent production trends. The second scenario is the “agriculture scenario”, in which
productivity in agriculture is assumed to increase faster than in the baseline scenario. The growth in the
agriculture scenario is based on a broader range of crops and subsectors that drive the growth process
than in the historical crop production data (Pauw & Thurlow, 2011). Both scenario’s assume that land
area will increase with 2% per year, and that this land area increase is allocated across crops grown in
the region according to the current situation. The gains in yield for the individual crops are based on the

7 | P a g e
broader-based agricultural growth as previously mentioned. This means that the individual crops that
have achieved growth in the past make only small improvements in the agriculture scenario. To the
contrary, the poor performing crops from the past will increase their yields to a larger extend, because of
their underexplored growth potential (Pauw & Thurlow, 2011). For example, the yield growth in rice (well
performing crop) moves from 4.69% per year to 4.92% per year in the agriculture scenario, while maize
(poor performing crop) moves from 1.92% per year to 4.39% per year.
Table 2 Historical (2000-2007) and estimated (2007-2015) yield and production growth
estimations for individual crops in Tanzania
Source: Pauw and Thurlow (2011)
2.4 The reality check
Despite the several strategies and policies, the agricultural sector in Tanzania is not performing well
enough to make serious progress in alleviating poverty. Rural households still face low rates of
productivity and high rates of food insecurity and poverty (Mdoe, Mlay, & Kadigi, 2015). This is reflected
in the national household budget survey (National Bureau of Statistics, 2007), that shows a small
decrease in poverty in rural areas from 40,8% in 1991 to 37,6% in 2007. The poverty rates in rural
areas are bigger than the poverty in urban areas. The rural areas face bigger shortages in food and basic
needs than Dar es Salaam, other urban areas and mainland Tanzania (see Table 3). Knowing that the
national poverty rate for the whole country in 2012 was 28.8%. Although I cannot directly compare this
data with the data from the household budget survey, it implicates again that rural areas face higher
poverty rates than urban areas.

8 | P a g e
Table 3 Percentage of incidence of poverty in Tanzania
Source: Household Budget Survey (2012)
The share of agriculture in the total GDP is diminishing: in 2000 agriculture contributed more than 30
percent of the GDP, in 2008 this was 24 percent (MAFAP, 2013). Although GDP share is diminishing, the
sector grew at 4,4 percent per year on average between 1998-2007. The biggest source of the growth
came from major export crops are cotton, sugarcane, coffee and tobacco and are mainly cultivated by
large-scale commercial farmers. To the contrary, the growth from subsistence farmers cultivating staple
crops remained low due to traditional production systems (Pauw & Thurlow, 2011).
In the National Agriculture Policy of 2013 the following hurdles in agriculture are addressed as the main
constraints to agricultural growth: low productivity of land, labor and production inputs; underdeveloped
irrigation potential, limited capital and access to financial services, weak agricultural technical support
services, poor rural infrastructure; infestations and outbreaks of crop pests and diseases; erosion of the
natural resource base and environmental degradation (NAP, 2013). Other factors mentioned are weak
producer organizations; gender relations; depressed prices for primary commodities in global markets;
limited involvement of the private sector; limited participation of youth and weak property rights
(Ministry of Agriculture, 2013). This summation of constraints implicates that the pillars of Kilimo Kwanza
to a big extent have not managed to bring agricultural progress.
2.5 Agricultural development synthesis
The government of Tanzania has the incentive to transform from a small-scale agriculture driven society
to a liberalized economy with a commercialized agricultural sector. Policy frameworks that were designed
after the second generation reforms all focus on the shift from low productivity agriculture to modernized
and commercialized agriculture. Yield and production growth assumptions did emphasize that especially
former poor performing crops would benefit from a higher productivity in agriculture.
The Development Vision 2025 aims for a transformation of the agricultural sector that should be fulfilled
in ten years. Supporting strategies such as the Kilimo Kwanza have clear goals, however their
effectiveness and their implications for rural households remains largely unclear. Constraints in land and
labour productivity seem to be a big hinder to bring economic progress to small scale farmers.
From the above I have formulated two hypotheses that I would like to test in this thesis. First, I would
like to research whether the often referred agricultural transformation to commercial agriculture has
taken place in Tanzania. As a follow up, I would like to test an assumption that is often made in
Tanzanian policy documents: the assumption that a focus on commercial agriculture brings prosperity on
the level of the rural household. This results in the following hypotheses:

9 | P a g e
Hypothesis 1. Tanzania has managed to transform its agricultural sector to a commercialized
agricultural sector;
Hypothesis 2. Commercialized agriculture is the most attractive rural livelihood strategy for a rural
household in Mbeya.

10 | P a g e
3. Theoretical framework
The theoretical framework that I will use for this research focuses on the following concepts: livelihood
strategies, markets and transaction costs, and well-being.
3.1 Rural livelihoods
The concept of livelihood touches on what people do for a living, how they carry this out, and what they
gain by doing it (Groenewald & Van Den Berg, 2012). Ellis (2000) defines a livelihood as “the assets
(natural, physical, human, financial and social capital), the activities, and the access to these (mediated
by institutions and social relation) that together determine the living gained by an individual or
household”. In recent policy thinking, people often talk about sustainable livelihoods, with a by-focus on
future generations. A commonly used definition of sustainable livelihoods is offered by Scoones (1998),
who adapted the definition from Chambers & Conway (1991): “A livelihood comprises the capabilities,
assets (including both material and social resources) and activities required for a means of living. A
livelihood is sustainable when it can cope with and recover from stresses and shocks, maintain or
enhance its capabilities and assets, while not undermining the natural resource base”. People engage in
various livelihood strategies in order to achieve their livelihood objectives. A rural household’s decision
on which strategy to adopt depends on the ability of the five assets of natural, physical, human, financial
and social capital. The literature also suggests other terms for livelihood strategies that also refer to the
way people respond to their circumstances. These are household coping, adaptive or survival strategies
and income earning activities (Thennakoon, 2004).
3.1.1 Sustainable livelihoods framework
In order to better understand the outcomes of different livelihood strategies, DFID (1999) has developed
a framework which can be used to plan new development activities and to analyse the effect of previous
development activities. The sustainable livelihoods framework (see Figure 1) focuses on the relationships
between the factors affecting somebody’s livelihood strategy. In the following paragraph I will explain
the framework in more detail.
Figure 1 Sustainable livelihoods framework Source: DFID (1999)

11 | P a g e
Understanding the vulnerability context is important to get an idea of the external environment in which
people live. Critical shocks, trends and seasonality are influences that people have no control of, but
certainly affect the possibilities in which people can shape their livelihoods. It is important to take into
account that different people are differently affected by the vulnerability context.
Livelihood assets are shown in the framework as the rendering of people’s strengths (capitals or
endowments) and are the essentials to attain positive livelihood outcomes. The idea behind livelihood
assets is that people need a selection of assets in order to attain positive livelihood outcomes. The asset
pentagon is the core of the framework, and the five capitals (human, natural, financial, social and
physical) can be seen as the livelihood building blocks. The capital endowments are in reality constantly
changing, so the shape of the asset pentagon is changing throughout time.
Other determinants that influence people’s livelihood are policies, institutions, organizations and
legislation. These factors are taken up in the transforming structures & processes part of the framework.
They shape livelihoods in the sense that they exist on many levels (micro, meso and macro) and
influence both private and public sector. The transforming structures and processes determine to a
certain extend the access to the five capitals, and they determine for a large part the well-functioning of
markets. There is a feedback effect towards the vulnerability context as structures and processes can
affect trends in a certain area. DFID (1999) gives as an example that well-functioning markets can help
to reduce seasonality effects by facilitating inter-area trade.
Next in the framework are the livelihood strategies, which are closely connected with people’s desired
livelihood outcomes. Livelihood strategies reflect the range and combination of activities and choices that
people undertake in order to achieve their livelihood goals (DFID, 1999). Access to assets is seen as the
building block for the choice in livelihood strategies that a person has. Also, the more options and
flexibility people have in their livelihood strategy, the more resilient they are to shocks and stresses in
the vulnerability context.
Livelihood outcomes reveal the achievements of a livelihood strategy. This part of the framework gives
an understanding how all factors within the livelihoods framework lead to a specific outcome. As shown
in the framework, it cannot be assumed that livelihood outcomes are solely focused on maximization of
income. There are many other priorities that are reflected in the livelihood outcomes (food security, well-
being etc.) that can give important information about people’s preferences for a specific livelihood
strategy and people’s behavioural attitudes.
3.1.2 Hanging in, stepping up and stepping out
The concepts of “hanging in” (protecting livelihoods), “stepping up” (improving livelihoods) and “stepping
out” (changing livelihood activities and structures) are important processes that help to understand the
flexibility of a rural household’s livelihood strategy over time. These terms are furthermore essential in
the analysis of how livelihoods can be improved. The five capitals serve as facilitating services that
enable the transformation processes. Below is a more detailed explanation of hanging in, stepping up
and stepping out, based on the article of Dorward (2009) and Dorward, Ruben, Pender, and
Kuyvenhoven (2007), who use these concepts to understand the dynamics of poverty and to understand
the changing role of agricultural systems in this.
Hanging in: the case when people engage in livelihood activities with the goal to hold on to the
assets that they currently possess. The main goal is not to lose assets as a result of
disadvantageous trends and shocks (see sustainable livelihoods framework).

12 | P a g e
Stepping up: refers to the situation where people enhance the productivity of their assets in
order to expand their livelihood activities. This can be done in several ways, such as investing in
new assets (i.e. equipment, skills, technology, land) or improving existing assets. The aim for
stepping up is to enlarge positive livelihood outcomes, such as higher income or higher well-
being.
Stepping out: the situation where people invest in assets and activities that are more productive
and eventually lead to a move into a different livelihood strategy. This is associated with the
accumulation of a new set of assets. Examples are investment in education and skills in order to
move out of agricultural jobs.
It is possible to be engaged in one specific strategy or in multiple of these strategies at the same time.
The livelihood strategies that are likely to be chosen by each household depend on the specific household
circumstances. According to Dorward et al. (2009), the main factors that determine preferences are the
local market opportunities and the natural resource potential. They also make a distinction between
“poor” and “less poor” households, because for these groups the set of opportunities will be different
(depending on the availability of the five capitals, see Sustainable Livelihoods Framework).
Table 4 gives an idea of the likely strategies of hanging in, stepping up and stepping out that are
adopted by rural households. What can be seen from the table is that poor people are likely to be
engaged in “hanging in” strategies over stepping up and stepping out. The reason for this is that they
mostly live in a vulnerable environment where they struggle to maintain their livelihoods. The hanging in
activities are likely to be different depending on the natural resource base, market opportunities and
possession of assets. Dorward et al. (2009) mention that in the case of low natural resource potential
and market opportunities, poor people will rely on livestock as the most important asset, since this gives
more certainty under different seasonal conditions than crop-based agricultural activities. Market
opportunities determine to a high extend the success of new technologies for livelihood strategies,
because increased production doesn’t lead to larger positive outcomes if markets are not functioning or
non-existent.
The situation for the less poor is different: instead of a “hanging in” strategy they are more likely to
choose for “stepping out” and “stepping up” strategies in order to improve their livelihood. The less poor
possess more assets (see sustainable livelihoods framework) and therefore there are more options for
stepping out and stepping up strategies. In the case of stagnant market opportunities, the options of
stepping up are limited (see Table 4). However, in some cases there is the option to export to more
distant markets which makes stepping up strategies possible. In the case of a low natural resource
potential, the less poor will choose to step out of agriculture. When market opportunities and resource
potential are high, both stepping out (changing to non-farm activities) and stepping up (increase
agricultural productivity) are among the options for the less poor household.

13 | P a g e
Table 4 Livelihood strategies for poor and less poor farmers, by market opportunities and
natural resource potential
Source: Adapted from Dorward et al. (2009)
3.2 Markets and transaction costs
The importance of markets for developing countries is highly emphasized in literature about economic
development (De Janvry, Fafchamps, & Sadoulet, 1991; Dorward, Poole, Morrison, Kydd, & Urey, 2003;
Kydd & Dorward, 2004; Taylor, Zezza, & Gurkan, 2011). Improved market access and opportunities are
seen as critical drivers for sustained pro poor development and poverty alleviation, although it is in itself
neither a sufficient solution nor a magic bullet (Dorward et al., 2003; Taylor et al., 2011). Dorward et al.
(2003) sum up the following reasons for the importance of markets in economic development: (1) the
livelihoods of most of the poor people rely on the participation in several markets, both as private agents
or as employees; (2) poverty reduction processes today and in the past have relied on private sector
economic growth; (3) poor people themselves mention that their livelihoods are highly dependent on
markets (or a lack of access to markets) and (4) markets can be used as a highly efficient tool to
exchange, coordinate and allocate many resources, goods and services to advance economic growth.
Increased commercialization in food markets coincides with an increase in transaction costs from the
perspective of the smallholder farmer (IFPRI, 2005). Transaction costs is a concept from institutional
economics which is concerned with agents’ decisions on market transactions where there are small
numbers of parties involved on each side of the transaction (Vakis, Sadoulet, & de Janvry, 2003;
Williamson, 2005). As an example, the decision for a farmer to sell product on the market is not only
based on the output price, but also on the additional costs incurred for transacting in the market. As
Alene et al. (2008) states, transaction costs are the embodiment of barriers to market participation by
resource-poor smallholders and are associated with the significant degree of market failures in
developing countries. The two main factors leading to high transaction cost are the following: (1) the
usually poor provision of public goods; and (2) the costs emerging from coping with different rules,
regulations and players within the markets (IFPRI, 2005). Transaction costs can be both observable and
non-observable and are therefore often referred to as “hidden costs” (Ouma, Jagwe, Obare, & Abele,
2010). Examples of the most common transaction costs that are specifically significant for smallholders
in developing countries are the distance to markets, poor infrastructure and poor access to assets and
information (IFPRI, 2005). Transaction costs lead to high exchange costs, causing a raise in the real price
of inputs and a decrease in the real price received for outputs (Ouma et al., 2010).
14 | P a g e
Closely related to transaction costs is the problem of failing markets. De Janvry et al. (1991, p. 1401)
describe the situation of market failure as “when the cost of a transaction through market exchange
creates disutility greater than the utility gain that it produces, with the result that the market is not used
for the transaction […] In general, markets exist, but they selectively fail for particular households,
making the corresponding commodity a non-tradable for that household”. Market failure is thus
described as household specific, not as commodity specific.
3.3 Well-being
The concept of well-being is increasingly used as a measurement tool of people’s current and future
living conditions. Although well-being is a widely used concept in (economic) literature, there is no
consistency in how well-being is defined and measured. Furthermore, terms as happiness, life
satisfaction and quality of life are often used interchangeably with well-being.
The definition that I find the most effective to use in this thesis research is the one of OECD (2013).
OECD (2013) developed three pillars that will help understanding and measuring people’s well-being.
This threefold definition is drawing on previous work from several researchers.
● Material living conditions (or economic well-being), which determine people’s consumption
possibilities and their command over resources.
● Quality of life, which is defined as the set of non-monetary attributes of individuals that
shapes their opportunities and life chances, and has intrinsic value under different
cultures and contexts.
● The sustainability of the socio-economic and natural systems where people live and
work, which is important for well-being to last over time. Sustainability depends on how
current human activities impact on the stocks of different types of capital (natural,
economic, human and social) that underpin well-being (OECD, 2013, p. 27).
This definition is coming from the viewpoint that economic (or material) well-being is critical factor to
overall well-being. An increase in income will lead to improvements in other dimensions of well-being,
and thereby will increase the freedom to choose a livelihood strategy. However, it is important to realize
that overall well-being does not only depend on income in absolute terms. The perception whether the
income is substantial to satisfy one’s needs is important, as well as the relative income compared to
other people’s income (Ferrer-i-Carbonell, 2005). This view is supported by Easterlin (1995, p. 36), who
states that “happiness, or subjective well-being, varies directly with one’s own income and inversely with
the incomes of others”. Ferrer-i-Carbonell (2002) advocates that in the ideal situation, variables such as
health, children and financial satisfaction are taken into account in the analysis of well-being.
15 | P a g e
4. Project and research area description
In this part of the thesis I will give all necessary background information on geographic and socio-
economic indicators of the research area. Furthermore, I will give some information about the integrated
project “Increasing Agricultural Productivity in the Breadbasket Area of Southern Tanzania”, led by SNV
Netherlands Development Organisation. The aim of this chapter is to sketch the context of the SNV
project and of the research area.
4.1 Project description
This research is part of an independent impact evaluation that will measure the impact of the integrated
AGRA project entitled “Increasing Agricultural Productivity in the Breadbasket Area of Southern Tanzania”.
The project is led by SNV Netherlands Development Cooperation and has four main objectives:
i) To strengthen the capacity and efficiency of farmer organizations in the target districts;
ii) To increase smallholder market led agricultural production
iii) To enhance smallholder farmers’ access to structure produce markets
iv) To improve access to extension and advisory services among smallholder farmers and the
private sector
The project “is anchored in increasing productivity of the selected important crops (Maize, rice, soya and
beans) in the breadbasket area of southern agricultural growth corridor to competitively supply local,
national and regional markets. This is achieved through Inclusive Business approach to create market
access opportunities for producers which are commercially viable and scalable” (SNV, 2013, p. 15). The
use of markets is thereby seen a main criterion for increasing the rural poor’s well-being and living
standards.
4.2 Area description
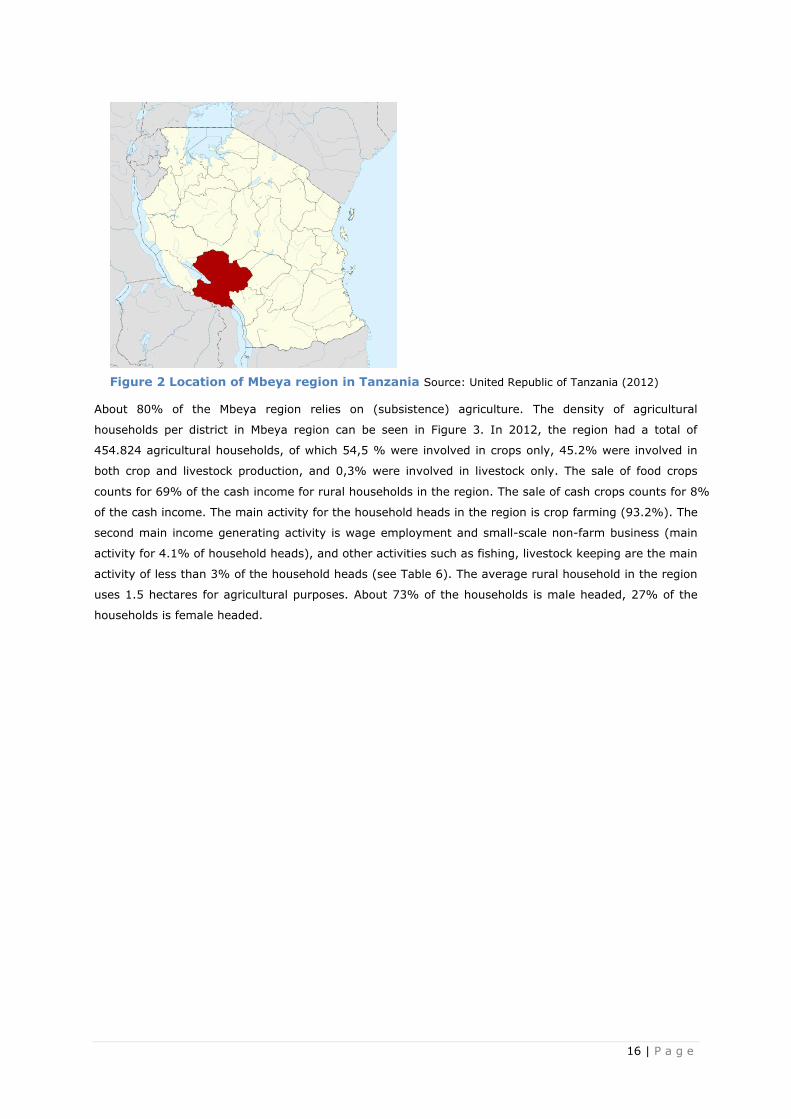
This research focuses on the livelihood strategies in the Southern Highlands of Tanzania. The data used
for this study is collected in the region of Mbeya (see Figure 2). Mbeya is located in the Southwest of
Tanzania and consists of 8 districts. The regional capital is the city Mbeya, and the region had a
population of 2.7 million in 2012. This paragraph gives a description of the Mbeya region in order to get a
good understanding of the regional conditions that affect livelihood strategies of rural households. The
information used in this paragraph is mainly relying on the Mbeya Region Agriculture Sample Census,
(United Republic of Tanzania, 2012).
16 | P a g e
About 80% of the Mbeya region relies on (subsistence) agriculture. The density of agricultural
households per district in Mbeya region can be seen in Figure 3. In 2012, the region had a total of
454.824 agricultural households, of which 54,5 % were involved in crops only, 45.2% were involved in
both crop and livestock production, and 0,3% were involved in livestock only. The sale of food crops
counts for 69% of the cash income for rural households in the region. The sale of cash crops counts for 8%
of the cash income. The main activity for the household heads in the region is crop farming (93.2%). The
second main income generating activity is wage employment and small-scale non-farm business (main
activity for 4.1% of household heads), and other activities such as fishing, livestock keeping are the main
activity of less than 3% of the household heads (see Table 6). The average rural household in the region
uses 1.5 hectares for agricultural purposes. About 73% of the households is male headed, 27% of the
households is female headed.
Figure 2 Location of Mbeya region in Tanzania Source: United Republic of Tanzania (2012)

17 | P a g e
Figure 3 Total number of agricultural households by district in Mbeya region Source:
National Bureau of Statistics (2012)
Both cash and food crops are produced in the region. The main food crops grown in the region are maize,
paddy, beans, sorghum, Irish potatoes and sweet potatoes. The main cash crops grown in the region are
coffee, Pyrethrum, and tea. The crop that is grown the most is maize, 47.7% of the total agricultural
area is occupied by this crop. Area planted for maize is at least 3 times bigger than area for beans, the
second dominant crop.

18 | P a g e
Source: United Republic of Tanzania (2012)
In 46% of the rural households in Mbeya region, one or more family members are involved in off-farm
income activities. These activities include working in the public or private sector, permanently or
temporary. Off-farm income activities also include working on farms that belong to other farmers. In
most cases only one household member is involved in off farm employment (60%), as opposed to two
(33%) or more than two (7%).
The overall literacy rate in the Mbeya region is 76%. The literacy rate among household heads is 72%,
82% of the male household heads are literate and 47% of the female household heads are literate.
Among 74% of the population in the region has completed at least one level of schooling or is still
attending school. 20% of the population in the region has never attended school. As shown in Table 6,
27% of the household heads have not finished any education. The majority of the household heads have
finished primary education (67%), and some have attained post primary education (5%) or adult
education (2%).
Table 6 Educational attainment of household heads per district
Source: United Republic of Tanzania (2012)
Table 6 Major income generating activities divided by district (Number and % of
households involved??) Source: United Republic of Tanzania (2012).
Table 5 Main activity of agricultural household heads by number and percentage per district.

19 | P a g e
Table 7 shows the percentages of rural households that sold (part of their) harvest. There are several
problems identified in the census that make the marketing and selling of crops difficult. The main reason
is that selling prices are too low in the open market (99.3% of the households selling crops mentions
this). Other problems are long distances to the market, high transportation costs, lack of market
information and lack of buyers.
Table 7 Percentage of households selling their crops per district
District Percentage of households selling crops
Chunya 77.4
Mbeya Rural 89.3
Kyela 86.3
Ileje 72.4
Mbozi 87.1
Mbarali 89.1
Mbeya Urban 81.3
Source: United Republic of Tanzania (2012)

20 | P a g e
5. Data and methodology
This chapter presents an overview of the methods used to fulfil the objectives of the study. The chapter
starts with a description of the data collection procedure, followed by an explanation of the cluster
analysis. This analysis is used to identify the different livelihood strategies among the respondents in the
study area. The second part describes the multinomial logit model that is used to understand the factors
that influence the choice of each livelihood strategy.
5.1 Data collection The data used for this study are drawn from a field study for the independent impact evaluation of the
integrated AGRA project entitled: “Increasing Agricultural Productivity in the Breadbasket Area of
Southern Tanzania”. The data was collected in four districts of Mbeya region, namely Mbozi, Momba,
Mbarali and Mbeya Rural between December 2014 and February 2015. The data was collected by a
research team consisting of five supervisors and 30 enumerators. The data collection was led by A.
Bongole, PhD student Development Economics at Wageningen University.
The data on livelihood strategies was collected through a household survey among 1648 randomly
selected households. The one selection criteria that was held during the selection was that the
households needed to be member of a farmer group in one of the four districts. The survey was
separated in two parts that were simultaneously conducted for each household. The first part addressed
the major land and labour related questions and was assigned to the household member primarily
responsible for decision making about plots (mostly male). The second part addressed the household
related question such as household composition, individual occupation and food consumption habits. This
part was assigned to the household member primarily responsible for the household chores (mostly
female).
5.2 Cluster analysis
In order to identify the different livelihood strategies in Mbeya, it is important to classify the strategies
into groups. A functional way to classify the data is to conduct a cluster analysis. There are several steps
to be taken in the cluster analysis, starting with the classification of the livelihoods. The classification can
be done in several ways, because livelihood strategies are linked with several factors. Classification
based on total realized income is the most commonly used way to cluster livelihood strategies (see
Brown, Stephens, Ouma, Murithi, & Barrett, 2006; Nathan & Mohamad, 2014; Tesfaye, Roos, Campbell,
& Bohlin, 2011). However I have chosen to qualify the livelihood strategies in a different manner. I firstly
used a combination of the main productive assets land and labour (see Groenewald & Van Den Berg,
2012; Jansen et al., 2006; Jansen, Pender, Damon, Wielemaker, & Schipper, 2006). Additionally, I added
commercialization indicators to cluster into groups since I want to test the hypothesis that commercial
agriculture is the most attractive livelihood strategy for rural households in the research area. By using
land and labour variables in combination with commercial agriculture variables I have captured the most
important features from the theoretical framework that will determine the existing rural livelihood
strategies in the research area.
The main productive assets in a rural household are land and labour. Land allocation shows the strategic
land-use choices of a household to generate income flows, which consequently affects the well-being of a
household. Labour allocation shows how the household divides its time to specific activities, both farming
and non-farming activities. The main productive assets of land and labour are also used in other

21 | P a g e
livelihood strategies studies that use cluster analysis. This approach is used in papers about livelihood
strategies and neoliberal policy reforms in Mexico (Groenewald & Van Den Berg, 2012), sustainable land
use in Honduras (Jansen, Pender, Damon, & Schipper, 2006) and natural disasters in Nicaragua (Van den
Berg, 2010). The cluster analysis will distinguish different land-use and labour-use patterns that
determine the several livelihood strategies used by the rural households. A third factor that will be used
in the cluster analysis is the degree to which a rural livelihood has commercialized its practices. Variables
that determine the degree of commercialization are the use of warehouse, use of irrigation, use of a loan,
use of crop technologies and the division between market production and home consumption of the
harvest. In total, a sum of 11 classification variables are used to determine the livelihood clusters. The
complete description of the variables can be found in Table 8.
Table 8 Variables used for the classification of livelihood strategies
Labour allocation Land allocation Commercialization
agriculture
% of household members
engaged in subsistence
agriculture / (% of household
members engaged in subsistence
agriculture + % of household
members engaged in commercial
agriculture)
% of cultivated area used for
maize
Harvest share sold on the
market/harvest share sold on the
market + food consumption
% of household members
working in non-farm activities
(forestry, petty trading, non-
farm wage work, fishing, hunting
etc.)
% of cultivated area used for
beans
Use of warehouse
% of cultivated area used for rice Credit: possession of a loan
% of cultivated area used for
groundnut
Crop technologies: Use of
chemical fertilizer, herbicides,
pesticides, improved seeds
Use of irrigation
The classification variables are thereafter reduced to a smaller set of variables by doing a principal-
component factoring (PCF). This data reduction method is slightly different from the often used common
factor analysis (CFA) which looks for linear combinations within the correlation matrix for classification
variables. CFA differentiates between common and unique variance in the variables as a way to explain
correlation in the variables. PCF relies on a different set of quantitative methods by accounting the
variances in the observed measures. By using the PCF I can reduce the large set of measures to a
smaller, more manageable number of measures that can be used in the cluster analysis (T. A. Brown,
2006). The outcomes of the PCF showed a number of 5 factors with an eigenvalue larger than 1.
Following the Kaiser criterion that suggest to only retain those factors with eigenvalues larger than 1, I
decided to continue with 5 factors. The PCF thus reduced the variables in Table 8 from 11 to 5. The
reduction of 11 variables in 5 factor variables is useful when conducting the cluster analysis, as it results
in a much more clear-cut delineation of clusters than a stand-alone cluster analysis. The 5 factor
variables are thereby less subject to scale effects that influence the cluster analysis on directly measured
variables (Jansen et al., 2006).
After generating the rotated factor loadings the next step is to cluster the livelihood strategies. The aim
of the cluster analysis is to attain a high intra-class similarity (homogeneity within the cluster) and a low

22 | P a g e
inter-class similarity (heterogeneity between clusters) (Reddy, 2013). To measure the similarity between
different observations, a distance measure is needed. I used the Euclidean distance that calculates the
coefficients between each pair of households. The magnitude of these coefficients measures the similarity
or dissimilarity of each pair in Euclidean space (Lopez, 2008). Households that have a low Euclidean
distance coefficient will be more alike when they have high distance coefficients:
𝐷𝑖𝑗 = √∑(𝑥𝑘𝑖 − 𝑥𝑘𝑗)2
𝑛
𝑘=1
Where Dij = distance coefficient between i and j; xki = value for variable xk for case i; and xkj = value for
variable xk for case j.
I first used Ward’s linkage hierarchical clustering to inspect the number of agglomerate clusters in my
data set. Based on the results of the hierarchical clustering, the number of natural groups in the cluster
data was defined. A dendogram was drawn to visually inspect the number of groups. Based on this
dendogram and common-sense checking I selected four livelihood strategy clusters.
The second step was to use a non-hierarchical clustering method named K-means clustering to check for
misclassification of observations at the boundaries of each cluster. This procedure starts with dividing the
data into k groups and selecting the cluster centre for each k, based on the four clusters already selected
by Ward’s clustering. This k-means clustering follows by an iterative process that assigns each instance
to its closest cluster. The cluster centre mean is updated after each iterative process so that it converges
with all instances. This process continues until all observations are assigned to the groups they are
closest to (Wagstaff, Cardie, Rogers, & Schrödl, 2001).
5.3 Multinomial logit regression
When all livelihood strategies for rural households in Mbeya are determined through the clustering
process, the next step is to run a multinomial logit model that will identify the main variables that
influence each household’s decision to adopt a certain strategy. The multinomial logit regression
estimates the probability that a household selects a reference strategy over one of the other optional
strategies, thereby adopting the most preferred livelihood strategy. I used the strategy with the highest
share of households as the reference strategy. The coefficients per strategy show the probability that a
household chooses an alternative strategy over the reference strategy. A positive estimated coefficient
reveals a higher probability that a household adopts the alternative livelihood strategy, a negative
estimated coefficient reveals lower probability that a households adopts the alternative livelihood
strategy.
The multinomial logit model allows to predict the behaviour of dependent variables as a function of
multiple explanatory variables (Dougherty, 2002). Thereby, the estimated coefficients can identify
positive and negative effects that influence the likelihood that a household will opt for an alternative
livelihood strategy (Groenewald & Van Den Berg, 2012).

23 | P a g e
The multinomial logit model is adapted from Lopez (2008) and looks as follows:
Y∗ = ∑ 𝛽𝑗𝑟 ∙ 𝑋𝑟 + 𝜀𝑗
𝑅
𝑟=1
𝑌 = 1 𝑖𝑓 𝑌∗ ≤ 𝜇1,
𝑌 = 2 𝑖𝑓 𝜇1, ≤ 𝑌∗ ≤ 𝜇2,
𝑌 = 𝑚 𝑖𝑓 𝜇𝑗−1, < 𝑌∗
In this model, Y* represents an unobserved latent outcome of utility, Y presents the selected livelihood
strategy, βjr represents the estimated parameters (r = 1, 2, …, R), j represents the livelihood alternatives
(j = 1, 2, …, m), Xr are the variables that represent household characteristics that influence the decision
process, εj represent error terms (which might be skills needed to engage into livelihood strategies) and
µj represents the unknown threshold parameter separating livelihood strategies. The set of variables Xr
include variables for natural, human, physical, and financial capital. The description and descriptive
statistics of all the variables can be found in Table 9.
Table 9 Household determinants of livelihood strategies
Explanatory
variables
Definitions Mean (Std. Dev.)
Human capital
Household size Number of household members 5.38 (2.22)
Education household
head
Primary education or lower = 0, more than primary
education = 1
3.12 (1.44)
Highest educational
level
Secondary standard education or lower = 0, more than
secondary standard education = 1
4.27 (1.92)
Sex household head Male = 0, female = 1 0.14 (0.34)
Age household head Years 48.48 (12.91)
Dependency ratio Number of household members between age 15-70/ total
number of household members
0.61 (0.21)
Natural capital
Land size Amount of land owned by the household in hectares 6.74 (12.93)
Land ownership ratio Amount of land owned divided by the total cultivated
area
0.91 (0.25)
Financial capital
Assets owned Estimated (median) total monetary value of the valuable
items that the household owns
10.04 (21.38)
Physical capital
Agricultural equipment Amount of agricultural equipment that the household
owns
1.46 (0.56)
Cattle owned Estimated monetary value of livestock and cattle that the
household owns
10.83 (21.52)
Commercialization determinants
Distance to market Distance from farm to nearest output market in
kilometres
22.79 (31.62)
Distance to tarmac
road
Distance from farm to nearest tarmac road in kilometres 13.91 (12.93)
Distance to agrodealer Distance from farm to nearest agrodealer in kilometres 15.65 (24.30)
24 | P a g e
The variables “assets owned” and “cattle owned” were modified to avoid scaling problems and to be able
to better interpret the marginal effects during the analysis. I scaled both variables with a factor of 0.01.
There is one important assumptions that must hold in order to successfully use the multinomial logit
model, which is the Independence of Irrelevant Alternatives (IIA) assumption. This assumption will be
violated when the livelihood strategies are not mutually exclusive. In other words, the choice for a
livelihood should not be influenced by the choice for any other alternative strategy (Starkweather &
Moske, 2011). There are three tests in STATA that assess the IIA assumption: Hausman test, suest-
based Hausman test and Small-Hsiao test. It is important that the null hypothesis of independent
alternatives cannot be rejected. In my model, this was the case for all three tests.
5.4 Household well-being indicator
The next thing that needs to be measured is the household well-being in each cluster. It is difficult to
compare well-being across households or individuals, because there is no metric to compare different
utilities. The most commonly used tool to measure well-being is therefore a proxy variable such as real
income or resource availability (OECD, 2013). However, well-being is a multidimensional concept and
therefore can be better understood while looking at multiple indicators. OECD (2013) advices to use (1)
income, (2) consumption and (3) wealth as indicators for well-being.
The data that is used for this research is incomplete on income, consumption and wealth. Therefore I
need to look for other quantitative indicators that can estimate household well-being. I have decided to
use (1) the possession of household assets and (2) the 7 days food expenditures per household as
quantitative indicators of well-being.
5.5.1 Possession of household assets
In the analysis possession of household assets will be used as an indicator for well-being. This indicator
can also be seen as an observable variable that can represents the latent variable income, which is often
named as a strong indicator for well-being (Po, Finlay, Brewster, & Canning, 2012). I have created an
Asset Index to compare well-being across households. The data used for the Asset Index consisted of
asset items owned (yes = 1) by the household. I decided to leave out those assets that were possessed
by less than 10 or more than 90 percent of the households. Furthermore a variable is created that
indicates if a household has an inlaid floor (yes = 1). The variables that were included in the final Asset
Index were phone ownership, radio ownership, television ownership, bicycle ownership, motorbike
ownership, improved stove ownership, mattress ownership, panga knife ownership and inlaid floor.
The Asset Index is created via Principal Component Analysis (PCA). PCA is a method that extracts
dominant patterns from a data matrix (Wold, Esbensen, & Geladi, 1987) and is a good method to reduce
the number of variables. In order to reduce the variables, I use the Kaiser criterion (the same as in the
factor analysis). Kaiser criterion advises to retain those scores with an eigenvalue higher than 1, in my
case this comes down to two variables. Following Groenewald and Van Den Berg (2012), I did the Kaiser-
Meyer-Olkin (KMO) test in order to ensure sampling adequacy. This test is used to assess the strength of
the relationships, which tells something about the factorability of the variables (Beavers et al., 2013).
The KMO measure of sampling adequacy is equal to 0.80, which indicates that there is a strong
relationship between the possession of the assets.

25 | P a g e
5.1.2 Household consumption expenditures
Household consumption expenditure is the second variable used to measure well-being. I use the 7 days
expenditures per household as indicator. 7 days household consumption expenditures are smooth over
short term fluctuations and therefore they are more accurate in estimating long-run well-being levels
than 24 hour food consumption recalls. Especially for poor households this method is more reliable and
less vulnerable for reporting bias (World Bank, 2001; Barret et al. 2001; Meyer and Sullivan, 2003; and
Ravallion, 2003).
In order to use the household consumption expenditure data as an indicator for well-being, I need to
create a mechanism that counts for the number of people in each household. The easiest way to do this
is to divide the total consumption expenditures by the number of household members, but this measure
can be very misleading for the following two reasons. First, there is a difference between the
consumption needs in the household, with the most important presumption that children need less food
than adults. Second, there are economies of scale in consumption that should be taken into account
(Haughton & Khandker, 2009). Therefore, a measurement that translates total household well-being into
individual well-being needs to be used. Each member of the household is measured as a fraction of an
adult male. Then the sum of these fractions is used as household size (Mkenda, Luvanda, Rutasitara, &
Naho, 2004). The household size is not measured by the total number of household members, but in
numbers of adult equivalent (AE) (Haughton & Khandker, 2009). The formula that I use for the adult
equivalent is as follows:
𝐴𝐸 = (𝐴 + 𝛼𝐾)𝜃
Where A is the number of adult in the household, K is the number of children in the household. All
individuals of age 15 and older are defined as adults, all individuals below 15 as children. Α is the
household consumption of a child relative to an adult, θ represents the economies of scale effect of the
total household size. Following evidence reported in Deaton (1997), I use α = θ = 0.75 as weights for
food consumption expenditures.

26 | P a g e
6. Results
This chapter gives a description of the livelihood strategies adopted by households in the research area.
In this chapter I also present the summary statistics of each strategy. The chapter follows with the
multinomial logit model, that gives more insights in the determinants of each strategy. The implications
of adapting a certain livelihood for the household well-being is discussed next. Lastly, the effect of past
economic liberalization policies is discussed.
6.1 Livelihood strategy identification
Four main livelihood strategies were identified during the cluster analysis: (1) maize farmer; (2) maize +
other crop farmer; (3) diversified farmer and (4) rice farmer. The distribution of households among these
strategies is shown in Table 9, that shows that most household belong to the second cluster (34.56%).
The smallest amount of households is in the fourth cluster (18.58%).
Table 10 Livelihood strategies distribution
Livelihood strategy Number of
households
Percentage Cumulative
Maize farmer (1) 366 23.69 23.61
Maize + other crop farmer
(2)
534 34.56 58.06
Diversified farmer (3) 358 23.17 81.16
Rice farmer (4) 287 18.58 100
Total 1.545 100.00
One of the main indicators that shows the difference between each cluster is the average number of
crops cultivated per cluster (see Figure 4). It shows that none of the strategies focuses on one single
group. All households have one crop that is the most important in their livelihood strategy. For the first
three clusters, this is maize. In the fourth cluster rice is the most important crop. The main crop per
cluster is also the main characteristic for the division of the clusters. The combination of the main crop
with other crops is the second characteristic for the cluster division. The maize and rice farmer mostly
combine their main crop with one other crop. The households in the second livelihood strategy combine
maize farming mostly with two other crops, and the households in the third livelihood strategy even
cultivate four crops on average. The summary statistics of each cluster are shown in Table 11.

27 | P a g e
Figure 4 Median of number of crops cultivated per cluster
Table 11 Summary statistics for each cluster
N=1545 Cluster 1 Cluster 2 Cluster 3 Cluster 4
Share of land allocated to crop
(%)
Maize farmer Maize & beans
farmer
Diversified
farmer
Rice farmer
Maize .82 .48 .45 .24
Beans .05 .29 .13 .02
Rice .02 .01 .01 .69
Groundnut .01 .01 .20 .01
Other .10 .21 .21 .03
Labour allocation variables
Subsistence agriculture vs.
commercial agriculture*
.79 .70 .80 .66
Non-farm activities** .36 .10 .10 .16
Commercial agriculture variables
Use of credit (% of households) .10 .13 .04 .25
Use of technology (% of households) .59 .62 .72 .53
Use of irrigation (% of households) .03 .08 .05 .45
Harvest share sold on the market (%) .98 .85 .69 .90
Use of warehouse (%) .00 .00 .02 .37
* % of household members (15-70 year) active in subsistence agriculture / % of household members (15-70 year) active in subsistence agriculture + % of household members (15-70 year) active in
commercial agriculture. ** % of household members (15-70 year) active in non-farm wage labour, petty trading, mining, forestry, fishing, hunting or other self-employed.
All livelihood strategies are separately discussed in the next part of the paragraph. A more in-depth
explanation per cluster is given, based on the summary statistics shown above.
6.1.1 Maize farmer
This is the second biggest livelihood strategy in the research area that represents almost a quarter of the
rural households. As the name already implicates, households that engage in this strategy are mainly
involved in maize farming. 82% of the cultivated area on each farm is used for maize farming. Beans are
the second crop cultivated on the land of this cluster (5%). The average distribution of the land is shown

28 | P a g e
in Figure 5. The majority of the households in this livelihood are located in Momba (175 households,
48%). The complete distribution of the districts over the first livelihood is given in Figure 6.
Figure 5 Distribution of cultivated land of the maize farmer in percentage (Livelihood 1).
Figure 6 Distribution of maize farmer households per district (Livelihood 1)
This first cluster thereby represents the livelihood strategy that engages most in non-farm activities,
having the highest ratio of household members participating in non-farm activities (36% of the
household members on average). The major non-farm activity that these households are engaged in is
petty trading (see Figure 7). The wage labour in the Figure represents only non-farm wage labour, off-
farm wage labour is excluded.
This livelihood strategy is mainly focused on producing for the market: 98% of the total production is
sold on the market. The survey data also indicate that 10% of the households in this cluster make use of
a loan for agricultural production.

29 | P a g e
Figure 7 Distribution of non-farm work in percentage (Livelihood 1)
6.1.2 Maize & other crop farmer
This livelihood strategy corresponds to the cluster that consists of farmers that mainly cultivate maize
and a second and/or third crop. Beans is the second crop that is mainly cultivated in this livelihood
strategy. 48% of the land in this cluster is used for maize cultivation, followed by 29% cultivated land for
beans (see Figure 8).
Figure 8 Distribution of land per crop (Livelihood 2)
There are several other crops cultivated by the rural households in this livelihood strategy. Coffee
(cultivated by 153 out of 534 households in the cluster), sunflower (cultivated by 72 out of 534
households in the cluster) and groundnuts (cultivated by 65 out of 354 households in the cluster) are the

30 | P a g e
other important crops in this cluster. The majority of this cluster cultivates both maize and beans
(95,5%). Most households in this cluster (39%) combine the maize and beans farming with a third crop.
26% of the farmer cultivates more than three crops.
The majority of the rural households that are in this livelihood cluster are settled in Mbeya rural (50%),
followed by Mbozi (33%). Few households from Momba (15%) and Mbarali (2%) are represented in this
cluster.
6.1.3 Diversified farmer
This cluster has the highest diversity in the number of crops that are cultivated. As shown in table 12,
the majority of the households in this cluster cultivate either 3 or 4 crops (together 77% of the cluster).
Only 10% of the households in this livelihood cultivates 2 crops, and the other 13% of the households
cultivates more than 5 crops.
Table 12 Number of crops cultivated (Livelihood 3)
All households in this cluster cultivate maize. In this sense there is a similarity with the first and second
cluster. However, the cultivated area for maize is much smaller than in the first livelihood cluster. The
biggest difference with the livelihoods in the second cluster is the importance of groundnuts in terms of
cultivated area and in terms of the amount of households cultivating groundnut. Figure 9 shows clearly
that the total cultivated area for maize (45% of total cultivated area) is much smaller than in the first
livelihood strategy. The cultivated area for groundnuts (20% of total cultivated area) is the second
biggest in this cluster.

31 | P a g e
Figure 9 Distribution of land per crop (Livelihood 3)
The four main crops that are cultivated in this cluster are maize (by 100% of the households),
groundnuts (by 91% of the households), beans (by 78% of the households) and coffee (by 38% of the
households). In total, 28% of the households cultivates all 4 of the crops. The biggest part of the
households in cluster cultivates maize, beans and groundnuts without growing coffee (43%).
The majority of the households that are engaged in this livelihood come from Mbozi (72%). 18% of the
households are located in Mbeya, 6% in Momba and 4% in Mbarali.
The households in this livelihood cluster have the highest subsistence/commercial agriculture ratio, which
means that these households practice more subsistence agriculture compared to other strategies. This is
also reflected in a relatively low harvest share sold on the market. The average household in this cluster
sells 69% on the market and keeps 31% of the harvest for home consumption. At the same time,
households in this cluster have a small ratio of household members taking part in non-farm agricultural
activities.
Another important difference between this cluster and the other clusters is the relative high use of
technology. With technology I point to 4 specific technologies: chemical fertilizer, herbicides, pesticides,
and improved seeds. Figure 10 shows how often each technology is used in this cluster. It shows that
chemical fertilizer is the most often used technology (by 94% of the households), and pesticides are the
least used (57% of the households). The majority of the households in this household uses 3 or 4 of the
technologies (69% of the households). 21% of the households uses 2 out of 4 technologies and 10%
uses less than 2 technologies.
The use of credit is very low in this cluster; only 4% of the households possess a loan for crop
production.

32 | P a g e
Figure 10 Use of technology (Livelihood 3)
6.1.4 Rice farmer
This cluster contains all farmers that cultivate rice as their most important crop. There is a clear
connection between this livelihood and the district of Mbarali: 94% of the households in this cluster are
located in Mbarali (see Figure 11).
Figure 11 Number of households per district (Livelihood 4)
The importance of rice is also reflected in the amount of land that is used for rice cultivation. On average
69% of the land in this cluster is used for the cultivation of rice. This is followed by maize, which
occupies 24% of the cultivated area on average (see Figure 12). In terms of cultivated area, rice and
maize are the only two crops have great importance. 18% of the households cultivates only rice. The
major part in this cluster (78% of the households) cultivates both rice and maize. The remaining 4%
cultivates rice and at least one other crop that is not maize. The other 2 crops that have a (rather small)
importance in this cluster are beans and groundnuts. 20% of the households cultivates beans besides
rice and maize. 10% of the households cultivates groundnuts besides rice and maize.

33 | P a g e
Figure 12 Distribution of land per crop (Livelihood 4)
This livelihood strategy is more commercially oriented than the other livelihood strategies. The
households in this cluster have the lowest subsistence/commercial agriculture ratio. This means that they
have the highest proportion of farmers that participate in commercial agriculture. Another important
characteristic of this cluster is the households make more use of credit. 25% of the households in the
cluster possess a loan, compared to 10%, 13% and 4% in cluster 1,2 and 3. Another interesting feature
is the use of irrigation: 45% of the households in this cluster use irrigation on their farm, compared to
3%, 8% and 4% of the households in cluster 1,2, and 3. Also the use of warehouse is much higher in
this strategy, with 37% of the households using this.
The use of herbicides, pesticides, chemical fertilizer and improved seeds is the lowest among all clusters.
On average the households that use this livelihood strategy make use of 2 out of the 4 technologies.
Chemical fertilizer is the most used technology (used by 76% of the households), followed by herbicides
(used by 68% of the households).
6.1.5 Livelihood strategy synthesis
The cluster analysis distinguished four livelihood strategies after the factor and cluster analysis. The first
cluster contains maize farmers, the second includes the farmers that cultivated maize combined with
another crop that is as equally important for the farmer. The third cluster includes the diversified farmers,
the fourth cluster contains the rice farmers. A quick overview of some of the characteristics per cluster
can be found in Table 13.
Table 13 Overview of main features per cluster
N=1545 Cluster 1 (n=366) Cluster 2 (n=534) Cluster 3 (n=358) Cluster 4 (n=287)
Maize farmer Maize + other crop
farmer
Diversified farmer Rice farmer
Land
allocation
Maize as most
important crop
Maize combined
with another crop
Maize combined with
multiple crops
Rice as most
important crop
Labour
allocation
Both on-farm and
non-farm
Mostly on-farm Mostly on-farm Mostly on-farm
Commer-
cialization
Focus on market
consumption
No use of
warehouse facilities
High use of
herbicides, pesticides,
improved seeds
High access to
credit and irrigation

34 | P a g e
6.2 Multinomial logit model
In this section I investigate the determinants of each livelihood strategy. I use a multinomial logit model
to explain the relationship between household characteristics and the choice for a particular livelihood
strategy. The aim of the multinomial logit model is to understand what type of households are involved
in which livelihood activities. The multinomial logit model uses the 5 assets from the sustainable
livelihoods framework (DFID, 1999) as starting point. The model uses variables for human capital
(household composition and education level), natural capital (land owned), financial capital (assets
owned) and physical capital (cattle and agricultural equipment owned). There is no sufficient data to
include variables for social capital, however I assume that this is positively related (mainly) with natural
and physical capital. Distances to important agro-related facilities (output market, agrodealer and tarmac
road) are included in the multinomial regression, as well as socio-economic indicators (sex and age
household head, dependency ratio). The results of the logistic regression are shown in Table 13.
Table 14 Multinomial logit coefficients: determinants of livelihood strategies
Variable Maize farmer Diversified farmer Rice farmer
Coëf. St. Error Coëf. St. Error Coëf. St. Error
Sex household head (female =
1)
-0.224 0.223 -0.210 0.220 0.292 0.231
Age household head -0.000 0.006 0.005 0.006 0.018 0.007***
Education household (1= more
than primary)
0.544 0.222** 0.188 0.240 0.759 0.244***
Education household (1=more
than secondary ordinary)
0.298 0.230 -0.078 0.237 -0.040 0.258
Household size -0.046 0.038 0.006 0.036 0.034 0.040
Household dependency ratio -0.880 0.385** 0.379 0.368 0.378 0.421
Land ownership ratio -0.811 0.302**
*
-0.117 0.346 -1.263 0.332***
Land owned 0.031 0.010**
*
0.010 0.012 0.032 0.010***
Assets owned 0.012 0.004**
*
0.002 0.005 0.006 0.005
Cattle owned -0.008 0.003** -0.002 0.003 -0.003 0.003
Agricultural equipment owned -0.086 0.127 0.128 0.126 -0.490 0.149***
Distance to agricultural market 0.003 0.003 -0.001 0.004 0.015 0.003***
Distance to agrodealer -0.003 0.003 -0.011 0.004** -0.031 0.005***
Distance to tarmac road -0.006 0.003* -0.005 0.004 0.013 0.003***
Constant 1.038 0.517** -0.780 0.538 -0.628 0.578
* significant at 10%; ** significant at 5%; *** significant at 1%
Number of observations = 1518
Log Likelihood: -1930.88
Pseudo R2: 0.0629
Prob. Chi = 0
Maize + other crop (strategy 2) is the base category
The table examines the variables that would affect the probability for households to choose another
livelihood strategy than the reference group (livelihood strategy 2, maize + other crop farmer). The data
show that the characteristics of the cluster “diversified farmers” are only little different from the “maize &
other crop farmer”. The results show that the diversified farmers are more likely to live closer to the
agrodealer. There are substantial differences between the reference strategy and both the maize farmer

35 | P a g e
and rice farmer strategy. Farmers with a higher education, more land and a (relatively big) share of
rented land have a higher likelihood to be engaged in maize or rice farming.
There are particular household characteristics that make it more likely to be engaged in maize farming
over maize + other crop farming. The household dependency ratio has a negative effect on the
probability of being engaged in maize farming. This means that the cluster with the maize farmers has
significantly more people below 15 or above 70 years old in the household compared to household
members between 15 - 70. Households that have a relatively high amount of assets owned are more
likely to be engaged in maize farming, while a high amount of cattle has a negative effect on the
probability of being engaged in this livelihood strategy. Furthermore, the distance to the tarmac road is
relatively smaller for farmers that are engaged in maize farming.
There are also aplenty household characteristics that increase the probability to engage in rice farming.
Households involved in rice farming have a relatively aged household head compared to the reference
strategy. Households that own more agricultural equipment have a lower probability to be engaged in
rice farming. Rice farmers are in general further away from the agrodealer. At the same time,
households that live closer to the agricultural output market and a tarmac road have a high likelihood to
be engaged in maize farming.
6.3 Livelihood strategies and well-being
This part of the chapter focuses on the relationship between the livelihood strategies and well-being. I
created two variables to measure well-being (asset index and consumption expenditures) and in the first
paragraph these variables will be analysed. In the second paragraph I compare well-being across
households and especially across the four clusters. Furthermore I try to find the main factors that
influence well-being, and I analyse how much well-being can be attained from each livelihood strategy.
6.3.1 Determinants of well-being
Both asset ownership and food consumption expenditures are used in order to determine the levels of
well-being. The ownership of assets reveals information about the well-being of the households in the
research area. I assume that a household has higher levels of well-being once the ownership of assets is
higher. Furthermore there is a clear relationship between the amount of food consumption and well-
being, because economic welfare will increase when a household has more resources to spend.
I analysed the scores of the two variables with an eigenvalue > 1, derived from the principal-component
analysis (see Table 14). The table shows that “phone ownership” and “inlaid floor” have the biggest
influence on the outcomes of score 1. The households that have a high score on variable 1 thus have a
higher likelihood to possess a phone and a radio. All the components in score 1 are positive, which
means the higher the score for variable 1, the higher the ownership of assets in the household.
The scores in the second score table show both positive and negative values on the asset variables. This
means that a high score on variable 2 means that the household has a high amount of specific assets,
and consequently a higher level of well-being. Table 14 shows that the positive outcome on this variable
is mainly based on the assets that only a small proportion of the households possess. The most
influential positive scores in variable 2 are television ownership (owned by 21.5% of the households),
motorbike ownership (owned by 15.9% of the households) and improved stove ownership (owned by
11.3% of the households). This implies that the high scores for variable 2 are based on the possession of

36 | P a g e
relative “luxury” assets that are only available a small proportion of the households. This also means that
a high score on the second variable counts for a higher level of well-being.
Table 15 Determinants of asset index scores
Variable Percentage of
households
possessing the
item
Scores variable 1
(Eigenvalue 2.54814)
Scores variable 2
(Eigenvalue 1.10434)
Phone ownership 80.6 0.404 -0.088
Radio ownership 70.5 0.361 -0.183
Television ownership 21.5 0.333 0.494
Bicycle ownership 56.9 0.230 -0.365
Motorbike ownership 15.9 0.301 0.399
Improved stove
ownership
11.3 0.205 0.374
Mattress ownership 88.5 0.381 -0.254
Panga knife ownership 84.8 0.231 -0.451
Inlaid floor 63.3 0.419 0.117
The food expenditures data are a summation of the total household food expenditures from one week.
The total household food expenditures are then divided by the number of household members in terms of
adult equivalent (AE). This means that each member of the household is measured as a fraction of an
adult male. The exact calculation of the AE can be found in section 5.1.2 of this thesis.
6.3.2 Well-being levels per livelihood strategy
The Asset Index scores and consumption expenditures per adult equivalent for each cluster are shown in
Table 15. The scores show that maize farmers attain the highest asset index score, followed by the
cluster rice farmer. The cluster maize + other crop farmers has the lowest scores, and the diversified
farmer group are only a fraction better off.
Table 16 Asset index scores and food expenditures per cluster
Variable Maize farmer Maize + other
crop farmer
Diversified
farmer
Rice farmer
Mean St. Error Mean St. Error Mean St. Error Mean St.
Error
Asset Index Score 1 0.216 1.638 -0.362 1.703 -0.052 1.512 0.416 1.251
Asset Index Score 2 0.323 1.061 -0.024 1.010 -0.257 0.970 -0.134 1.098
Total Asset Index
Score
0.537 2.090 -0.386 1.787 -0.310 1.689 0.282 1.897
Total Asset Index
Score counted for
eigenvalues
0.908 4.512 -0.949 0.246 -0.416 3.864 0.913 3.736
Consumption
Expenditures per
adult equivalent
9.378 7.847 6.055 5.443 5.778 4.821 7.560 5.144
The first asset index score indicates that the cluster rice farmers is the best listed, followed by the maize
farmers cluster. The maize + other crop farmer cluster has the lowest score, which means that these
farmers have a small amount of assets compared to the other clusters. Phone ownership and an inlaid

37 | P a g e
floor are the most important determinants of the first score, which means that a relative big proportion
of the rice farmers and a relative small proportion of maize + other crops farmers own these assets.
The second asset index score is only positive for the cluster maize farmers. The cluster diversified
farmers has the lowest score on this variable. As said before, the determinants of this score are the
“luxury” assets that are only owned by a small proportion of the farmers. This means that the maize
farmers are the best off, followed by rice farmers, maize + other crop farmers and diversified farmers. In
terms of total scores, there are two clusters that perform relatively well (maize and rice farmers) and
there are two clusters that perform less well (maize + other crop and diversified farmers).
Table 15 also gives an overview of the mean consumption expenditures per capita (in adult equivalent)
per cluster. The group that with the biggest expenditure on food consumption per capita is the maize
farmer cluster, followed by the rice farmer cluster. The cluster maize + other farmer and diversified
farmer are respectively the third and fourth. The maize farmer cluster spends 62% more on food
consumption than the diversified farmer cluster. There is thus a big difference in the food expenditure
patterns of the clusters.
Both the asset index scores and the food expenditures data conclude that the two clusters that perform
best are (1) the maize farmer and (2) the rice farmer. The less performing clusters are (1) diversified
farmer and (2) the maize + other crop farmer. The results from the multinomial logit model already
implied that the diversified farmer cluster and the maize + other crop farmer have the most similarities.
This is also reflected in their levels of well-being, which lay relatively close to each other. The maize
farmer cluster and rice farmer cluster show similarities as well: they both have higher levels of well-being,
their farming practices are more specialized, they attained higher education levels and have a larger
share of rented land.
6.4 Influence of economic reforms on livelihood strategies
In this part of the thesis I will discuss the livelihood clusters in relation to the economic reform policies. I
want to know whether the goals of the economic reforms are visibly shown in the current livelihood
strategies of the rural households in the research area. I want to find out if the hypotheses stated in
chapter 2 are correct. The first hypothesis implicates that the Tanzanian agricultural sector has
transformed from a subsistence based to a commercial based sector. The second hypothesis is a follow-
up of the first hypothesis and claims that commercialized agriculture is the most attractive livelihood
strategy for rural households in Tanzania/Mbeya.
6.4.1 Hypothesis 1: Tanzania has managed to transform its agricultural sector to a commercialized
agricultural sector
The second chapter discussed the degree to which the Tanzanian agricultural sector has adopted policies
that should transform the agricultural sector to a commercialized one. The Development Vision 2025
clearly formulated the goal to transform “from a low productivity agricultural economy to a semi-
industrialized one led by modernized and highly productive agricultural activities which are effectively
integrated and buttressed by supportive industrial and service activities in the rural and urban areas”. To
what extend is this reflected in the results from the data analysis?
In the cluster analysis, I included some “commercialization variables” in order to test the degree of
commercialization among the clusters. These were “use of credit”, “use of technology”, “harvest share
sold on the market” and “use of warehouse”. Based on these data it can be concluded that the rice

38 | P a g e
farmer cluster is most commercially oriented. This cluster is the only cluster that is making use of
warehouse and irrigation. Furthermore it is the cluster that makes the most use of credit.
Commercialized farming characteristics can also be found in the maize farmer cluster. This cluster makes
no use of irrigation or warehouse, but has a very high score on the harvest share sold on the market.
The maize + other crop farmer cluster and the diversified farmer cluster show very little commercialized
farming characteristics, with the exception that they make high use of technology. These two clusters
show more characteristics of subsistence farming: they hardly use irrigation or warehouse, they have the
smallest share of harvest sold on the market and they make little use of credit. The National Strategy for
Growth and Reduction of Poverty has stated that the comparative advantage of farmers in Tanzania is
the abundance of land and the suitability of the land for irrigation. The results from the multinomial
logistic regression cannot conclude that these comparative advantages hold for the farmers in our
research area: the majority of the farmers is small-scale and irrigation is only used in the district of
Mbarali where rice farmers are active and irrigation systems are supplied by the public sector.
This outcome implies that the first hypothesis “Tanzania has managed to transform its agricultural sector
to a commercialized agricultural sector” has to be rejected. For Mbeya it holds that the majority of the
rural households is not involved in what can be called commercialized agriculture.
6.4.2 Hypothesis 2: Commercialized agriculture is the most attractive rural livelihood strategy for a rural
household in Mbeya
One of the desired outcomes of the transformation to commercialized agriculture is increased living
standards for rural household. Therefore it is interesting to check whether the households engaged in
livelihood strategies with a (relatively) high degree of commercialization really reach the highest level of
well-being.
The two clusters with the highest scores for the well-being indicators were the rice and maize farmer
clusters. Their Asset index scores and food consumption expenditures were substantially higher than the
scores of the other two clusters. The characteristics of the maize and rice farmers indeed show that they
have things in common that the other clusters don’t have. As said before, these clusters have specialized
their production on one crop. Furthermore they do not cultivate more than 2 crops on average. Third,
they have the biggest proportion of harvest sold on the market. Maize is the top market producer (98%
of harvest sold on the market) followed by rice (89% of harvest sold on the market). Fourth, the rice and
maize farmers have larger land cultivation areas and land owned (see Table 16). Both in terms of land
ownership and rented land these farmers have larger land sizes in use. The high level of specialization,
their focus on market output and the larger land area give a good indication that the maize and rice
farmers are engaged in livelihood strategies that have a greater focus on commercialized agriculture.
Table 17 Average owned land area in acres
Cluster Mean Standard error
Maize farmer 8.24 1.04
Maize + other crop farmer 5.37 0.27
Diversified farmer 5.66 0.30
Rice farmer 8 0.82
One of the unexpected outcomes of the cluster analysis is that the maize and rice farmers are more often
involved in non-farm activities. This indicates that they are not fully specialized in farming. An
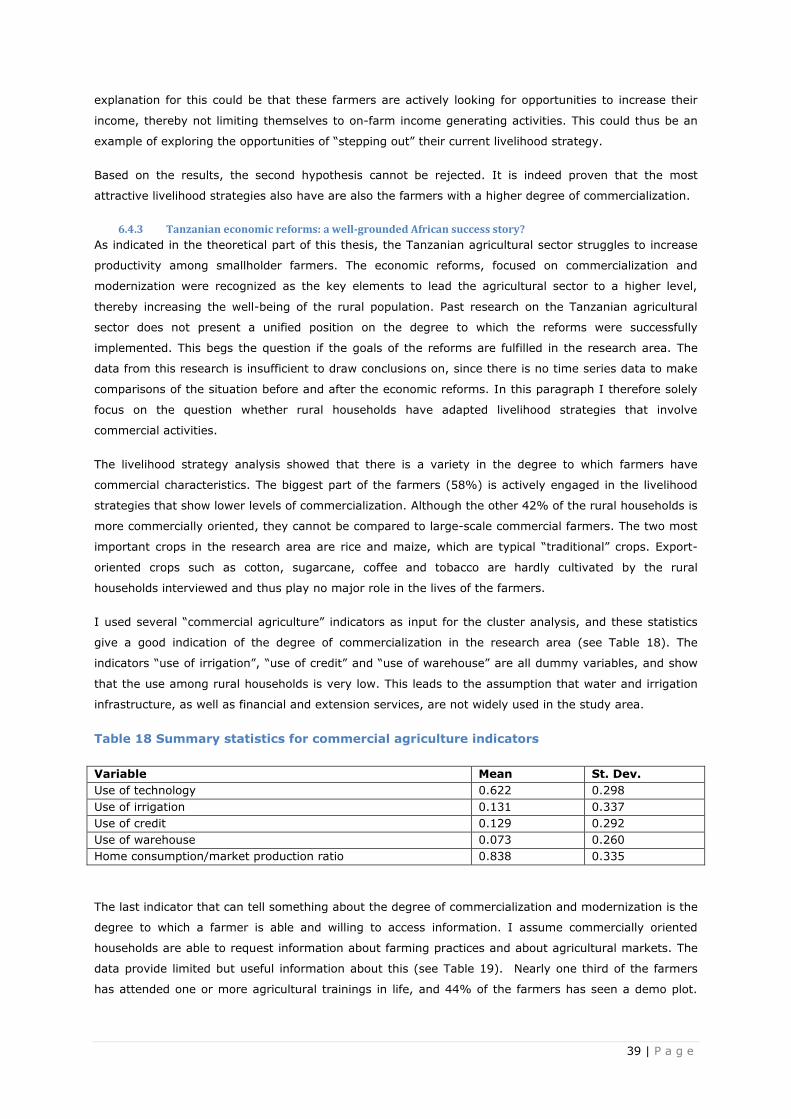
39 | P a g e
explanation for this could be that these farmers are actively looking for opportunities to increase their
income, thereby not limiting themselves to on-farm income generating activities. This could thus be an
example of exploring the opportunities of “stepping out” their current livelihood strategy.
Based on the results, the second hypothesis cannot be rejected. It is indeed proven that the most
attractive livelihood strategies also have are also the farmers with a higher degree of commercialization.
6.4.3 Tanzanian economic reforms: a well-grounded African success story?
As indicated in the theoretical part of this thesis, the Tanzanian agricultural sector struggles to increase
productivity among smallholder farmers. The economic reforms, focused on commercialization and
modernization were recognized as the key elements to lead the agricultural sector to a higher level,
thereby increasing the well-being of the rural population. Past research on the Tanzanian agricultural
sector does not present a unified position on the degree to which the reforms were successfully
implemented. This begs the question if the goals of the reforms are fulfilled in the research area. The
data from this research is insufficient to draw conclusions on, since there is no time series data to make
comparisons of the situation before and after the economic reforms. In this paragraph I therefore solely
focus on the question whether rural households have adapted livelihood strategies that involve
commercial activities.
The livelihood strategy analysis showed that there is a variety in the degree to which farmers have
commercial characteristics. The biggest part of the farmers (58%) is actively engaged in the livelihood
strategies that show lower levels of commercialization. Although the other 42% of the rural households is
more commercially oriented, they cannot be compared to large-scale commercial farmers. The two most
important crops in the research area are rice and maize, which are typical “traditional” crops. Export-
oriented crops such as cotton, sugarcane, coffee and tobacco are hardly cultivated by the rural
households interviewed and thus play no major role in the lives of the farmers.
I used several “commercial agriculture” indicators as input for the cluster analysis, and these statistics
give a good indication of the degree of commercialization in the research area (see Table 18). The
indicators “use of irrigation”, “use of credit” and “use of warehouse” are all dummy variables, and show
that the use among rural households is very low. This leads to the assumption that water and irrigation
infrastructure, as well as financial and extension services, are not widely used in the study area.
Table 18 Summary statistics for commercial agriculture indicators
Variable Mean St. Dev.
Use of technology 0.622 0.298
Use of irrigation 0.131 0.337
Use of credit 0.129 0.292
Use of warehouse 0.073 0.260
Home consumption/market production ratio 0.838 0.335
The last indicator that can tell something about the degree of commercialization and modernization is the
degree to which a farmer is able and willing to access information. I assume commercially oriented
households are able to request information about farming practices and about agricultural markets. The
data provide limited but useful information about this (see Table 19). Nearly one third of the farmers
has attended one or more agricultural trainings in life, and 44% of the farmers has seen a demo plot.

40 | P a g e
Requests for information from extension officers or NGO officers remains limited (respectively 18% and
4%) and information about marketing opportunities is requested by 20% of the farmers.
Table 19 Summary statistics about information access and/or use
Variable Mean St. Dev.
Farmer has requested information from extension officer in the
past (yes = 1)
0.18 0.39
Farmer has requested information from NGO officer in the past
(yes = 1)
0.04 0.19
Farmer has attended agriculture related training in the past (yes
= 1)
0.31 0.46
Farmer has requested information about market opportunities in
the past (yes = 1)
0.20 0.40
Farmer has accessed demo plot in the past (yes = 1) 0.44 0.50
Summarizing these findings, I conclude that there is not sufficient data to draw conclusions whether the
economic reforms and agricultural policy changes have had the desired impact on smallholder farmers in
the study area. What the data do show is that the use of available infrastructures such as irrigation is still
only used by a minor group of farmers. The same holds for the use of forward and backward linkages
and the degree to which farmers are actively looking for information: this remains limited. Thereby the
Tanzanian agriculture in the study area is still largely focused on subsistence agriculture. There has no
shift taken place from subsistence agriculture to large-scale commercialized agriculture, and farmers still
rely on traditionally cultivated crops and do not focus on the “transformation crops” suggested by the
Kilimo Kwanza Implementation Framework. However, traditionally cultivated crops as maize and rice are
seen as “strategic crops” that have growth potential. The growth scenario’s given by Pauw and Thurlow
(2011) also predict higher growth rates for these crops, because of their unexplored potential.
If the goal of the economic reforms is to initiate a green revolution in the country, there is still a long
way to go. The current state of agriculture in the study area is not ready to take agriculture to this level
yet.

41 | P a g e
7. Discussion
This research has tried to contribute to the knowledge on the relation between rural households,
economic reforms and well-being. The results gave provided information about the effectiveness of the
agricultural policies and the correctness of the vision that Tanzania’s agricultural sector would be better
off when agriculture is more commercially focused. In this discussion I will make links between literature
and the results from the quantitative data. Furthermore I will point out the weaknesses of the analysis
and what could be improved in the future.
A shortcoming of the research was the lack of data from the situation before the economic reforms. I
have tried to measure the effects of the economic reforms on the livelihood strategies that farmers are
currently engaged in, but there is no data on the type livelihood strategies that these farmers were
engaged in before the economic reforms. Therefore it is impossible to conclude that engaging in a
specific livelihood strategy was the result of economic reforms. This research therefore only examines
whether the preferred outcomes of the economic reforms are visible in the type of livelihoods that exist
in the research area.
The use of the Sustainable Livelihoods Framework has proven to be a helpful tool to analyze the
livelihood strategies. The part of the framework that might be underrepresented in this research is the
vulnerability context. I have highlighted the main geographical, social and economic characteristics of the
region Mbeya, but I did not have sufficient information about previous and current shocks, trends and
seasonality in the research area to give a full representation of the vulnerability context in the research
area. The livelihood assets pentagon is the most important feature of the Sustainable Livelihoods
Framework, and it also functions as the backbone of the research.
The multinomial logistic regression showed significant results for all of the capital variables. One of the
shortcomings of the analysis is that it lacks one or more variables that could represent social capital.
Furthermore, not all other livelihood assets were equally represented in the multinomial logistic
regression. The analysis would have benefitted from extra data on for instance financial capital (i.e. a
credit constraint indicator) and natural capital (i.e. quality of the soil). The livelihood outcomes that were
analyzed in this research solely focused on well-being, while in reality there are many more outcomes
important in order to achieve sustainable livelihoods. It would therefore be interesting to extend this
research in the future by including more social, economic and environmental indicators that could define
sustainable livelihood strategies.
The concepts of “hanging in”, “stepping up” and “stepping out” seem to be very helpful in analyzing
different types of livelihood strategies. The economic reforms can be seen as a strategy from the
government to move subsistence farmers from hanging in livelihood strategies to stepping up livelihood
strategies. The results have shown that not all livelihood clusters have managed to move from hanging in
to stepping up strategies. The rural households engaged in maize + other crop farming and diversified
farming still mostly engage in hanging in activities, focusing on holding on to what they currently possess
and coping with trends and shocks without losing their assets. The literature mentions that it might be
impossible for certain households to move from hanging in to stepping up because the households lack
the minimum requirements (such as a minimum amount of land, education etc.). It is very likely that
this is also the main reason that farmers from the maize + other crop and diversified livelihood strategy
do not move into other activities such as the maize or rice farmer strategy. Maize + other crop farmers
and diversified farmers possess less of each of the livelihood capitals, which both leads to a lower level of
42 | P a g e
well-being and a smaller amount of opportunities to move into stepping up strategies. The maize and rice
farmers seem to have had more opportunities to engage into both stepping up and stepping out activities.
The literature suggest that the households who have better market opportunities, have higher
accumulation of assets and possess greater land area are also likely to be engaged in activities other
than hanging in activities. This can be confirmed by our results about the rice and maize farmer clusters.
Farmers in these cluster invested more in assets such as credit, irrigation and education. For this reason
they have managed to increase the productivity compared to the other two livelihood strategies. Thereby
they have a broader scope of livelihood activities, since they have a higher percentage of household
members engaged in non-farm work. This means that the households from the maize and rice farming
clusters engage in both stepping up and stepping out activities in their livelihood strategies. Lastly, the
literature describes that there is a difference between poor rural households (who engage in hanging in
activities) and less poor rural households (who engage in stepping up and stepping out activities). This
distinction is also reflected in our results from the well-being indicators: the rice and maize farmers have
better scores on all the well-being indicators.
The impact of transaction costs and failing markets is also addressed in the multinomial logistic
regression, where I used three variables representing transaction costs (distance to nearest agricultural
output market, agrodealer and tarmac road). The transaction cost variables were integrated in the
multinomial logit regression in order to check whether one cluster would be more market oriented than
another cluster. Based on the literature it would be logical that the maize and rice farmer clusters are
located closer to the output market, agrodealer and tarmac road. However, our results do not show that
these distances are significantly closer for the rice and maize farmers. The results even show that the
distance to the output market and tarmac road are significantly longer for the cluster rice farmers
compared to maize + other crop farmers. For these variables, the outcomes suggested by the literature
do not correspond to our findings. It might be the case that there are other unknown factors that impact
the outcome of the variables (i.e. rice and maize farmers live further away from the agricultural output
market, but have more transportation options that decrease the time needed to reach the market).
Another explanation could be that I did not capture the commercial orientation well enough in the
variables. I could have solved this by adding other market-oriented variables such as market information
available to farmers.
The cluster analysis has helped to order and qualify the different livelihood strategies. I think that the
cluster analysis might have improved if I had more exact data about the labor activities. The dataset did
not include information on the order of importance of the different labor activities, which made it
impossible to accurately estimate the level of commercialized farmer practices. For future research I
would include a scaling mechanism that indicated the importance of each labor activity as income
generating activity for the household. Another thing that could have impacted the results is the valuation
of the assets owned. During the data collection, the respondents qualified the value of their assets
themselves, which leaded to a high degree of inconsistency in the valuation of the assets. This problem
was solved by using one standard valuation per asset, namely the median per asset.
This research also attempted to measure the level of well-being among each livelihood strategy. In the
theoretical framework I opted to use the OECD definition of well-being, focused on material living
conditions, quality of life and the stock of the five capitals. It appeared to be difficult to incorporate
quality of life in measuring well-being, because I had no data to assess this. Quality of life contains an
intrinsic value which can differ under different cultures and contexts, which makes it hard to measure.

43 | P a g e
However, I think that it could have made this analysis more accurate when this would be included in the
measurement of well-being. The data set for calculating the well-being also exhibited some weaknesses.
There were consumption expenditures excluded during the data collection, such livestock home
consumption. Furthermore the assets were counted for their possession (household possesses the item =
1), without counting for the value of each asset.
In future research it would be a great advantage to include qualitative interviews. This would be a good
way to analyze the levels of well-being perceived by the rural households in the study area. It would be
interesting to see whether maize and rice farmers would still be the favorite livelihood strategy in terms
of well-being when quality of life would be included in the analysis. Furthermore it would give additional
information about the motives behind the choice for a particular livelihood strategy. I furthermore think
the indicators for well-being (asset ownership and consumption expenditures) were somewhat narrow for
assessing well-being, and I would recommend extra well-being indicators in future research. The
incorporation of indicators related to i.e. health, children and financial satisfaction would have given a
more complete definition of well-being.

44 | P a g e
8. Conclusion Over the last 40 years, multiple policy reforms in Tanzania’s economic and agricultural sector have taken
place. The country has changed from a socialist economy to a liberalized economy, initiated by two series
of major agricultural and economic reforms. The reforms have always had a focus on liberalization: from
crop liberalization to land liberalization to market liberalization. The government wants to continue to
reform the agricultural sector in this way. Future reforms should convert the agricultural sector from a
subsistence, low productivity sector to a sector that uses innovative production systems, a sector where
farmers are able to increase their well-being by using the market mechanism. This research has tried to
find out how the economic reforms and policy changes have affected rural livelihood strategies to this
point in the region of Mbeya in the Southern Highlands of Tanzania. I thereby examined the degree of
commercialization in each livelihood strategy and I examined the levels of well-being per livelihood
strategy.
The multinomial logistic regression showed the determinants of each livelihood strategy. The maize +
other crop strategy was chosen to be the reference strategy, because the biggest amount of households
were engaged in this livelihood strategy (534 households). The model showed that the diversified farmer
and the maize + other crop farmer had many characteristics in common. Meanwhile there were
numerous differences between the reference strategy and the maize farmer strategy and the rice farmer
strategy. Maize and rice farmers also showed the most commercial attitude in their farming practices, by
specializing on one crop, a higher use of output markets and a greater use of irrigation and credit. The
maize and rice farmer differentiated themselves from the other clusters in the sense that they received
more education and they owned more land. Maize farmers also owned more assets, rice farmers owned
more agricultural equipment. The multinomial logistic regression already enlightened that maize and rice
farmers were in a better position compared to the other livelihood strategies. This was confirmed by the
estimation of well-being that was done after the multinomial logistic regression.
Results have shown that well-being is the highest for the rural households in the maize farmer and rice
farmer strategy. These clusters achieved considerably higher values on the asset index, and they also
had higher food consumption expenditures. This supports the statement of the government that higher
levels of well-being can be attained when farmers are pushed into more commercialized livelihood
strategies. Households that are engaged in the maize farmer and rice farmer livelihood strategy have a
better position (more land available, higher education, etc.) and this suggest that they could benefit
more from the economic reforms and subsequently have reached higher levels of well-being. The
diversified farmer strategy and maize + other crop farmer strategy show lower levels of
commercialization and lower levels of well-being. They are therefore seen as the less favourable
livelihood strategies. The limited amount of assets suggests that farmers are pulled into these livelihood
strategies, because the low amount of assets might impede them to move into other, more favourable
livelihood strategies.
The main promise for the agricultural sector in the Development Vision 2025 is that “The economy will
have been transformed from a low productivity agricultural economy to a semi-industrialized one led by
modernized and highly productive agricultural activities which are effectively integrated and buttressed
by supportive industrial and service activities in the rural and urban areas.” (Tanzania Planning
Commission, 1999). The outcomes of this research imply that the Tanzanian government still has a long
way to go forward in order to have achieved this in 10 years. The majority of the households is still
engaged in livelihood strategies with low levels of well-being, and traditional production systems are still

45 | P a g e
widely used in the area of research. There seem to be only limited opportunities to move from a hanging
in strategy to a stepping up strategy for the diversified farmers and maize + other crop farmers. A
recommendation to the policy makers is therefore to check for the minimum requirements that would
enable these farmers to engage into livelihood strategies with higher well-being statuses. In this way the
economic reforms could have a more direct effect, not only on those farmers that possess more assets
and are already pushed into more lucrative livelihood strategies, but on all farmers that together define
the national agricultural sector of Tanzania.

46 | P a g e
References
Alene, A. D., Manyong, V. M., Omanya, G., Mignouna, H. D., Bokanga, M., & Odhiambo, G. (2008). Smallholder
market participation under transactions costs: Maize supply and fertilizer demand in Kenya. Food
Policy, 33(4), 318-328. doi: 10.1016/j.foodpol.2007.12.001
Beavers, A. S., Lounsbury, J. W., Richards, J. K., Huck, S. W., Skolits, G. J., & Esquivel, S. L. (2013). Practical
considerations for using exploratory factor analysis in educational research. Practical assessment,
research & evaluation, 18(6), 1-13.
Brown, D. R., Stephens, E. C., Ouma, J. O., Murithi, F. M., & Barrett, C. B. (2006). Livelihood strategies in the
rural Kenyan highlands: Cornell University.
Brown, T. A. (2006). Confirmatory factor analysis for applied research. New York: Guilford Press.
Chambers, R., & Conway, G. R. (1991). Sustainable Rural Livelihoods: Practical Concepts for the 21st Century
IDS Discussion Paper No. 296. Brighton, UK: Institute of Development Studies, University of Sussex.
Cooksey, B. (2011). Marketing reform? The rise and fall of agricultural liberalisation in Tanzania. Development
Policy Review, 29(s1), 57-81.
De Janvry, A., Fafchamps, M., & Sadoulet, E. (1991). Peasant household behaviour with missing markets: some
paradoxes explained. The Economic Journal, 1400-1417.
Devarajan, S., Dollar, D., & Holmgren, T. (2001). Aid and Reform in Africa: Lessons from Ten Case Studies.
Washington, DC: World Bank.
DFID (1999). Sustainable livelihoods guidance sheets. London, UK: Department for International Development.
Dorward, A., Anderson, S., Bernal, Y. N., Vera, E. S., Rushton, J., Pattison, J., & Paz, R. (2009). Hanging in,
stepping up and stepping out: livelihood aspirations and strategies of the poor. Development in
Practice, 19(2), 240-247.
Dorward, A., Poole, N., Morrison, J., Kydd, J., & Urey, I. (2003). Markets, institutions and technology: missing
links in livelihoods analysis. Development Policy Review, 21(3), 319-332.
Dorward, A., Ruben, R., Pender, J., & Kuyvenhoven, A. (2007). Livelihood Strategies, Policies and Sustainable
Poverty Reduction in LFAs: a Dynamic Perspective. Sustainable Poverty Reduction in Less-favoured
Areas: Problems, Options and Strategies, 461.
Dougherty, C. (2002). Introduction to econometrics (Vol. 2): Oxford University Press Oxford.
Easterlin, R. A. (1995). Will raising the incomes of all increase the happiness of all? Journal of Economic
Behavior and Organization, 27(1), 35-47.
Easterly, W., & Easterly, W. R. (2006). The white man's burden: why the West's efforts to aid the rest have
done so much ill and so little good: Penguin.
Edwards, S. (2014). Is Tanzania a success story? A long term analysis African Successes: Sustainable Growth:
University of Chicago Press.
Ellis, F. (2000). Rural Livelihood Diversity in Developing Countries: Analysis, Methods. Policy. Oxford University
Press.
Ellis, F., & Mdoe, N. (2003). Livelihoods and rural poverty reduction in Tanzania. World Development, 31(8),
1367-1384.
Ferrer-i-Carbonell, A. (2002). Subjective questions to measure welfare and well-being: Tinbergen Institute
Discussion Paper.
Ferrer-i-Carbonell, A. (2005). Income and well-being: an empirical analysis of the comparison income effect.
Journal of Public Economics, 89(5), 997-1019.

47 | P a g e
Government of Tanzania (2009). Ten pillars of Kilimo Kwanza, implementation framework, retrieved 21-03-
2015, from http://www.tzonline.org/pdf/tenpillarsofkilimokwanza.pdf
Groenewald, S. F., & Van Den Berg, M. M. (2012). Smallholder Livelihood Adaptation in the Context of
Neoliberal Policy Reforms: A Case of Maize Farmers in Southern Veracruz, Mexico. Journal of
Development Studies, 48(3), 429-444.
Haughton, J. H., & Khandker, S. R. (2009). Handbook on poverty and inequality: World Bank Publications.
Ibhawoh, B., & Dibua, J. (2003). Deconstructing Ujamaa: The legacy of Julius Nyerere in the Quest for social
and economic development in Africa. African Journal of Political Science, 8(1), 59-83.
Jansen, H., Pender, J., Damon, A., & Schipper, R. (2006). Rural Development Policies and Sustainable Land Use
in the Hillside Areas of Honduras: A Quantitative Livelihoods Approach (Vol. 147). Washington, DC:
International Food Policy Research Institute.
Jansen, H. G., Rodriguez, A., Damon, A., Pender, J., Chenier, J., & Schipper, R. (2006). Determinants of
income-earning strategies and adoption of conservation practices in hillside communities in rural
Honduras. Agricultural Systems, 88(1), 92-110.
Jansen, H. G. P., Pender, J., Damon, A., Wielemaker, W., & Schipper, R. (2006). Policies for sustainable
development in the hillside areas of Honduras: a quantitative livelihoods approach. Agricultural
Economics, 34(2), 141-153.
Jerven, M. (2011). Growth, Stagnation or Retrogression? On the Accuracy of Economic Observations, Tanzania,
1961-2001. Journal of African economies, 20(3), 377-394. doi: 10.1093/jae/ejr003
Kydd, J., & Dorward, A. (2004). Implications of market and coordination failures for rural development in least
developed countries. Journal of international development, 16(7), 951-970.
Lopez, R. S. A. (2008). Livelihood strategies of farmers in Bolivar, Ecuador: asset distribution, activity selection
and income generation decisions in rural households. (MSc.), Virginia Polytechnic Institute and State
University, Virginia.
FAO (2013). Review of Food and Agricultural Policies in the United Republic of Tanzania. Monitoring and
Analysing Food and Agricultural Policies Country Report Series. Rome, Italy.
Mdoe, N. S. Y., Mlay, G. I., & Kadigi, M. L. (2015). Farming Systems in Tanzania: Empirical Evidence of
Changes in Livelihood Patterns and Poverty Among Smallholder Farmers. In Sustainable Intensification
to Advance Food Security and Enhance Climate Resilience in Africa, 555-571. Springer International
Publishing.
Ministry of Agriculture (2013). National Agriculture Policy. Dar es Salaam.
Ministry of Finance and Economic Affairs (2010). National Strategy for Growth and Reduction of Poverty II. Dar
es Salaam, Tanzania.
Mkenda, A. F., Luvanda, E. G., Rutasitara, L., & Naho, A. (2004). Poverty in Tanzania: comparisons across
administrative regions: Government of Tanzania.
Moyo, D. (2009). Dead aid: Why aid is not working and how there is a better way for Africa: Macmillan.
Nathan, S. B. S., & Mohamad, M. R. (2014). Livelihood Strategies and Household Income of a Paddy Farming
Community in Northwest Selangor, Malaysia. Journal of Emerging Economies and Islamic Research,
2(1).
National Bureau of Statistics (2007). National Household Budget Survey Tanzania: Ministry of State Presidents
Office Planning and Privatisation.
Ngaiza, R. S. (2012). Kilimo Kwanza. Paper presented at the Regional Workshop on an Integrated Policy
Approach to Commercializing Smallholder Maiza Production, Nairobi, Kenya.

48 | P a g e
Nord, R., Sobolev, Y., Dunn, D., Hajdenberg, A., Hobdari, N., Maziad, S., & Roudet, S. (2009). Tanzania: the
story of an African transition: International Monetary Fund Washington, DC.
OECD (2013). OECD Framework for Statistics on the Distribution of Household Income, Consumption and
Wealth: OECD.
Pauw, K., & Thurlow, J. (2011). Agricultural growth, poverty, and nutrition in Tanzania. Food Policy, 36(6), 795-
804. doi: 10.1016/j.foodpol.2011.09.002
Pauw, K., & Thurlow, J. (2012). The Role of Agricultural Growth in Reducing Poverty and Hunger: The Case of
Tanzania. Paper presented at the Leveraging Agriculture for Improving Nutrition and Health, New Delhi,
India.
Po, J. Y., Finlay, J. E., Brewster, M. B., & Canning, D. (2012). Estimating Household Permanent Income from
Ownership of Physical Assets: Program on the Global Demography of Aging.
Reddy, V. (2013). Data Analysis Course: Cluster Analysis. Retrieved 23-02-2015, from
http://www.slideshare.net/21_venkat/cluster-analysis-for-dummies
Scoones, I. (1998). Sustainable rural livelihoods: a framework for analysis.
Scoones, I. (2009). Livelihoods perspectives and rural development. The Journal of Peasant Studies, 36(1),
171-196.
SNV (2013). Proposal for the AGRA Tanzania Integrated Project Entitled: “Increasing Agricultural Productivity in
the Breadbasket Area of Southern Tanzania”. SNV Netherlands Development Organisation. Dar es
Salaam.
Starkweather, J., & Moske, A. K. (2011). Multinomial logistic regression. University of Northern Texas (UNT).
Texas.
Swenya, A., Kabisama, M. M., & Shadrack, J. (2014). Poverty reduction initiatives continue questionable.
Retrieved 19-03-2015, from http://www.socialwatch.org/es/book/export/html/15763
Tanzania Planning Commission (1999). Tanzania Development Vision 2025. Dar es Salaam, Tanzania.
Tanzania Planning Commission (2009). Study on the Identification of Potential Growth Drivers for Tanzania
Based on an Analysis of Tanzanians Competitive and Comparative Advantages - Growth Sectors and
Growth Drivers: A Situational Analysis Report. Dar es Salaam, Tanzania: Economic and Social
Research Foundation.
Taylor, J. E., Zezza, A., & Gurkan, A. (2011). Rural poverty and markets. documento de referencia para el
Informe sobre la pobreza rural.
Tesfaye, Y., Roos, A., Campbell, B. M., & Bohlin, F. (2011). Livelihood strategies and the role of forest income
in participatory-managed forests of Dodola area in the bale highlands, southern Ethiopia. Forest policy
and economics, 13(4), 258-265.
Thennakoon, S. (2004). Rural livelihood strategies and the five capitals: A comparative study in selected
villages of Sri Lanka. Paper presented at the Proceddings of the 18th European Conference on Modern
South Asian Studies. Lund, Sweden, July.
United Republic of Tanzania (2012). National Agriculture Sample Census Volume VI: Regional Report: Mbeya
Region.
Van den Berg, M. (2010). Household income strategies and natural disasters: Dynamic livelihoods in rural
Nicaragua. Ecological Economics, 69(3), 592-602.
Wagstaff, K., Cardie, C., Rogers, S., & Schrödl, S. (2001). Constrained k-means clustering with background
knowledge. ICML 1, 577-584.

49 | P a g e
Wold, S., Esbensen, K., & Geladi, P. (1987). Principal component analysis. Chemometrics and intelligent
laboratory systems, 2(1), 37-52.
World Bank (2014). Tanzania Overview. Retrieved 22 September, 2014, from
http://www.worldbank.org/en/country/tanzania/overview
World Bank (2015). World Development Indicators Online database. Retrieved 4 March 2015, from
http://data.worldbank.org/country/tanzania#cp_gep