Rural Feeder Protection Business Case - Revised Proposal - 5.19 - Rural Feeder...The Rural Feeder...
39
2020-25 Revised Regulatory Proposal 10 December 2019 Supporng document 5.19 Rural Feeder Protecon Business Case SAPN - 5.19 - Rural Feeder Protection Business Case - December 2019 - Public
Transcript of Rural Feeder Protection Business Case - Revised Proposal - 5.19 - Rural Feeder...The Rural Feeder...

2020-25 Revised Regulatory Proposal10 December 2019
Supporting document 5.19Rural Feeder Protection Business Case
SAPN - 5.19 - Rural Feeder Protection Business Case - December 2019 - Public
Business Case – Rural Feeder Protection
2
SA Power Networks
Rural Feeder Protection Name changed from “Country Protection Compliance”
www.sapowernetworks.com.au
Business Case December 2019
Business Case – Rural Feeder Protection
3
Contents 1. EXECUTIVE SUMMARY .................................................................................................................... 5
2. INTRODUCTION ............................................................................................................................... 6
3. BACKGROUND ................................................................................................................................. 6
4. PROGRAM SCOPE ............................................................................................................................ 7
5. RISK & COST BENEFIT ANALYSIS MODEL ......................................................................................... 7
6. RISKS ................................................................................................................................................ 8
6.1 Safety Risks ........................................................................................................................... 10
6.2 Bushfire Risks ........................................................................................................................ 11
6.3 Transformer Damage Risks ................................................................................................... 11
6.3.1 Transformer damages due to uncleared faults............................................................. 11
6.3.2 Value of Customer Reliability (VCR) .............................................................................. 13
7. PROTECTION SOLUTIONS .............................................................................................................. 14
8. COST BENEFIT ANALYSIS ............................................................................................................... 16
8.1 Solution Benefits ................................................................................................................... 16
8.2 Net Cash Flow ....................................................................................................................... 16
9. OPTIONS ANALYSIS ....................................................................................................................... 17
10. PROJECT COST ............................................................................................................................... 20
11. PROJECT TIMING ........................................................................................................................... 20
A. APPENDIX 1 – Reported Incidents of Inadequate Backup Protection .......................................... 21
B. APPENDIX 2 – Rural Feeder Protection Risk and Cost Benefit Analysis Models ........................... 22
C. APPENDIX 3 – NPV Comparison of Solutions ................................................................................ 23
D. APPENDIX 4 – The RFP Program Cost and Timeline ...................................................................... 24
E. APPENDIX 5 – Reclosers Failure Analysis ...................................................................................... 26
F. APPENDIX 6 – Protection Reviews on 19kV Feeders .................................................................... 27
G. APPENDIX 7 – RFP Model Breakdown ........................................................................................... 29
G.1 Database ............................................................................................................................... 29
G.2 Recloser Failures Data ........................................................................................................... 29
G.3 Network Faults ...................................................................................................................... 30
G.3.1 Safety-fault per feeder .................................................................................................. 31
G.3.2 Bushfire-fault per feeder .............................................................................................. 31
G.3.3 Transformer-damage-fault per feeder .......................................................................... 31
G.4 Fire Start Incidents ................................................................................................................ 31
G.5 RISK ....................................................................................................................................... 32
G.5.1 Safety Risk ..................................................................................................................... 32
G.5.2 Bushfire Risk .................................................................................................................. 33
G.5.3 Probability of Ignition.................................................................................................... 33
G.5.4 Transformer Damage Risk ............................................................................................. 35

Business Case – Rural Feeder Protection
4
G.5.5 Transformer Damage vs Clearing Times ....................................................................... 36
G.6 Net Present Value ................................................................................................................. 37
H. APPENDIX 8– Regulatory Drivers .................................................................................................. 38
I. APPENDIX 9 – NPV Calculation and Options Assessment ........................................................... 39
Business Case – Rural Feeder Protection
5
1. EXECUTIVE SUMMARY The Rural Feeder Protection (RFP) initiative is a $7.11 million program developed to mitigate and
maintain the network risks associated with inadequate backup protection within the 19kV network in
the rural areas. This program is a continuation of a program started in 2013 and solutions within this
document are proposed to be implemented over the next regulatory control period, 2020/21 to
2024/25.
SA Power Networks developed Risk and Cost Benefit Analysis (CBA) models as a part of this program
to determine the eligibility of each feeder to be included in the overall program. The Risk model
calculates the risk carried by every 19kV feeder whilst the Cost Benefit Analysis (CBA) model
determines the net economic value of protection solutions deployed on to the affected feeders. This
program only includes solutions for the inadequately protected feeders that were found to be
economically viable, i.e. total risk benefits and benefits to the customer exceed initial solution cost in
present value terms.
It is estimated that over the course of 25-year asset life, the total benefits are in the order of $10.28
million with a Net Cash Flow of $3.17 million (exclusive of discount rates). In addition, it is also
estimated that the total ‘at risk’ Value of Customer Reliability (VCR) that is avoided due to the
implementation of this program is $1.09 million over the course of 25 years.
The 11kV feeders that are supplied from transformers of size 5MVA or below in the rural areas have
been excluded from the program for the 2020/21 to 2024/25 regulatory period. These were excluded
as the total risk and VCR benefits are low and is not justifiable for the initial solution costs. These
feeders shall continue to remain in the watchlist for the foreseeable future until risks have escalated
and/or newer and economically viable solutions become available.
Business Case – Rural Feeder Protection
6
2. INTRODUCTION The Rural Feeder Protection (RFP) program is a continuation of an established program that is aimed
to address backup protection inadequacy in the rural areas. As a part of this program, the highest risk
rural feeders have been actioned using proven modern protection solutions since 2013. For the
regulatory period 2020-2025, SA Power Networks has acknowledged the comments made by AER on
the draft submission.
The Risk and Cost Benefit Analysis models developed by SA Power Networks is presented in the
resubmission to demonstrate the prudent and efficient selection and inclusion of rural feeders in the
RFP program. Modern and cheaper protection technology is now available on the market, since our
draft submission, and is adopted in the program to reduce the overall cost and to improve the
efficiency of the program. The evidence of asset damage due to the primary protection failures are
presented in the resubmission document.
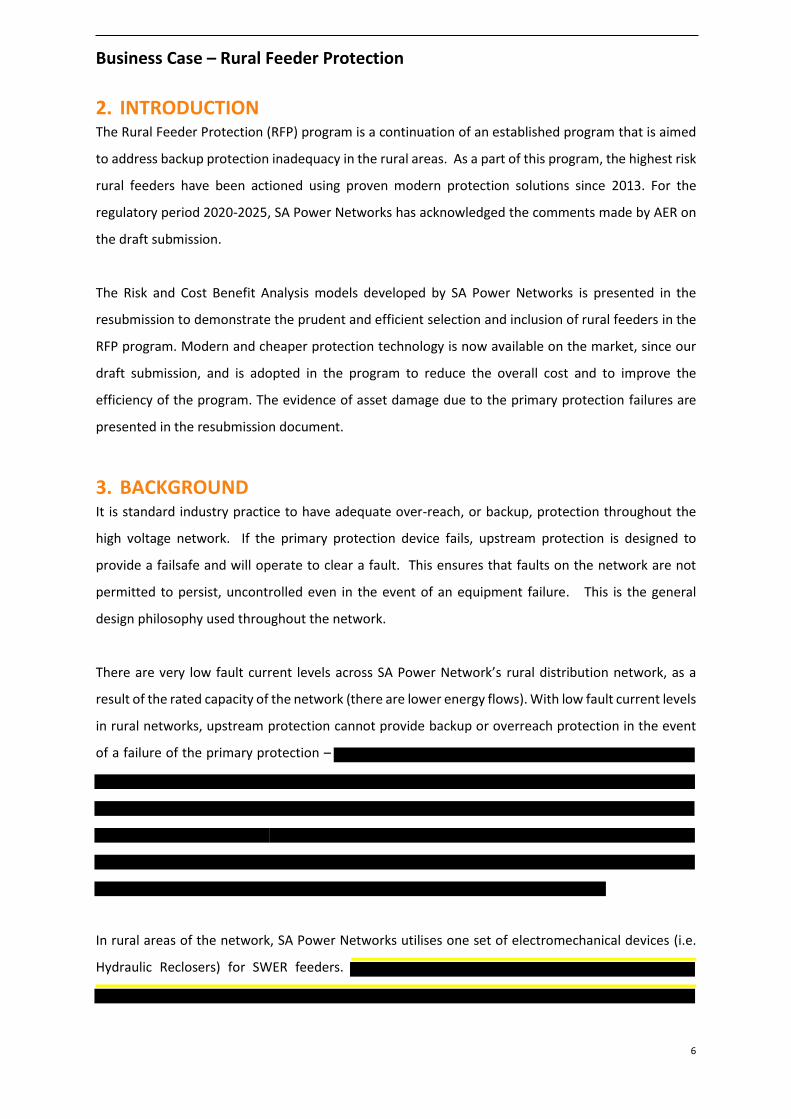
3. BACKGROUND It is standard industry practice to have adequate over-reach, or backup, protection throughout the
high voltage network. If the primary protection device fails, upstream protection is designed to
provide a failsafe and will operate to clear a fault. This ensures that faults on the network are not
permitted to persist, uncontrolled even in the event of an equipment failure. This is the general
design philosophy used throughout the network.
There are very low fault current levels across SA Power Network’s rural distribution network, as a
result of the rated capacity of the network (there are lower energy flows). With low fault current levels
in rural networks, upstream protection cannot provide backup or overreach protection in the event
of a failure of the primary protection –
In rural areas of the network, SA Power Networks utilises one set of electromechanical devices (i.e.
Hydraulic Reclosers) for SWER feeders.
Business Case – Rural Feeder Protection
7
(See section 6.3.1 for explanation of assets damage due to uncleared faults in rural areas).
The RFP program commenced in 2013 and to date 44 protection solutions have been deployed to
address the protection issues of the highest risk feeders. The continuation of this program will address
the existing inadequate backup protection of 203 of the highest risk 19kV SWERs through the
installation of additional protection devices over the next regulatory period.
4. PROGRAM SCOPE Each inadequately protected SWER feeder (310 in total) is assessed to determine its total risks in terms
of safety, bushfire and transformer damage risks. The SWER feeders with the highest risks are
prioritised and economically feasible solutions are implemented to manage the risk.
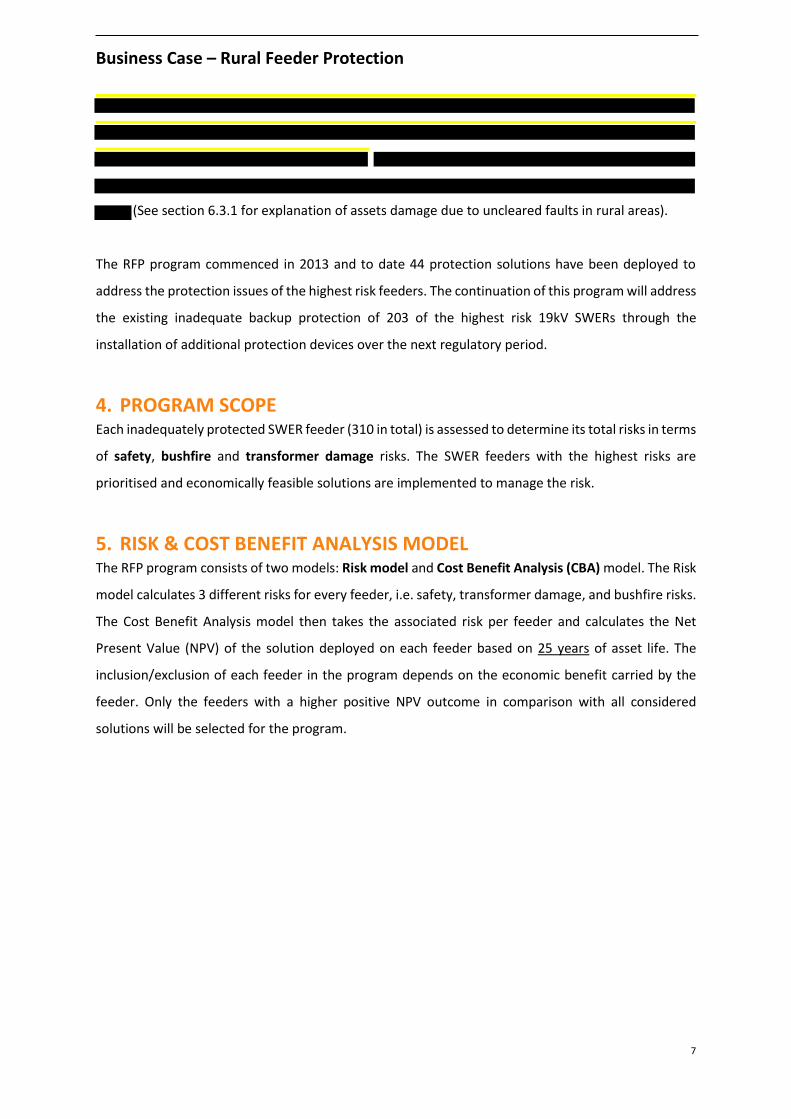
5. RISK & COST BENEFIT ANALYSIS MODEL The RFP program consists of two models: Risk model and Cost Benefit Analysis (CBA) model. The Risk
model calculates 3 different risks for every feeder, i.e. safety, transformer damage, and bushfire risks.
The Cost Benefit Analysis model then takes the associated risk per feeder and calculates the Net
Present Value (NPV) of the solution deployed on each feeder based on 25 years of asset life. The
inclusion/exclusion of each feeder in the program depends on the economic benefit carried by the
feeder. Only the feeders with a higher positive NPV outcome in comparison with all considered
solutions will be selected for the program.
Business Case – Rural Feeder Protection
8
Figure 1: The RFP Risk & CBA Model
6. RISKS
Business Case – Rural Feeder Protection
9
The total risk carried by each feeder is the sum of the following:
▪ Safety risk
▪ Bushfire risk
▪ Transformer damage risk
This is the risk of permanent transformer damage due to an uninterrupted fault and the
subsequent prolonged outage.
• Value of Customer Reliability (VCR) Risk
This is the economic risk applied due to the transformer damage resulting in a prolonged
outage (refer to section 6.3.2).
𝑇𝑜𝑡𝑎𝑙 𝑅𝑖𝑠𝑘 = 𝑆𝑎𝑓𝑒𝑡𝑦 𝑅𝑖𝑠𝑘 + 𝐵𝑢𝑠ℎ𝑓𝑖𝑟𝑒 𝑅𝑖𝑠𝑘 + 𝑇𝑟𝑎𝑛𝑠𝑓𝑜𝑟𝑚𝑒𝑟 𝐷𝑎𝑚𝑎𝑔𝑒 𝑅𝑖𝑠𝑘
Equation 1: Total Risk
Each risk is calculated as the product of the likelihood of the event occurring and the consequence of
that event (refer to Appendix 7 for breakdown of risk calculations). Figure 3 below shows the overall
economic risk composition on the 19kV network, with the transformer damage risk being the highest
contributor.
𝑅𝑖𝑠𝑘 = 𝑃𝑟𝑜𝑏𝑎𝑏𝑖𝑙𝑖𝑡𝑦 × 𝐶𝑜𝑛𝑠𝑒𝑞𝑢𝑒𝑛𝑐𝑒 ($)
Equation 2: Risk
Business Case – Rural Feeder Protection
10
6.1 Safety Risks On average, SA Power Networks experiences 29 safety related incidents per year from equipment
such as excavators and EWPs, coming into contact with HV conductors on the 19kV network. The
longer the fault area remains energised, the higher the probability that a person in close proximity to
the fault could come into contact with energised assets. The safety risk formula is as follows:
𝑆𝑎𝑓𝑒𝑡𝑦 𝑅𝑖𝑠𝑘 = 𝐷𝑒𝑎𝑡ℎ 𝑅𝑖𝑠𝑘 + 𝐼𝑛𝑗𝑢𝑟𝑦 𝑅𝑖𝑠𝑘
Equation 3: Safety Risk
The RFP program
aims to minimise the safety risk of all the selected feeders with the priority being the feeders with
highest risk.
Business Case – Rural Feeder Protection
11
6.2 Bushfire Risks The RFP program addresses the consequential risk of starting a bush fire as a result of equipment
being damaged due to uncleared faults. There is clear historical precedence where electrical
infrastructure has been involved in bushfire ignitions, such as Ash Wednesday in 1983, and Black
Saturday in 2009. The RFP model does not over-lap in any way with the SA Power Network’s Bushfire
Management program. The unique features of the RFP are:
1. The RFP program focuses on prevention of potential bushfire starts caused by the primary
protection failure and subsequent equipment damage.
2. The RFP program targets feeders located in both Medium Bush Fire Risk Areas (MBFRA) and
High Bush Fire Risk Areas (HBFRA).
The two models utilise the common base data such as economic cost, probability of ignition model,
fire ban period and fire start record in the model development (refer to Figure 18 in Appendix 7 for
comparison).
6.3 Transformer Damage Risks
𝑇𝑟𝑎𝑛𝑠𝑓𝑜𝑚𝑒𝑟 𝐷𝑎𝑚𝑎𝑔𝑒 𝑅𝑖𝑠𝑘 = 𝑀𝐴𝐽𝑂𝑅 𝐷𝑎𝑚𝑎𝑔𝑒 𝑅𝑖𝑠𝑘 + 𝑀𝐼𝑁𝑂𝑅 𝐷𝑎𝑚𝑎𝑔𝑒 𝑅𝑖𝑠𝑘
Equation 4: Transformer Damage Risk
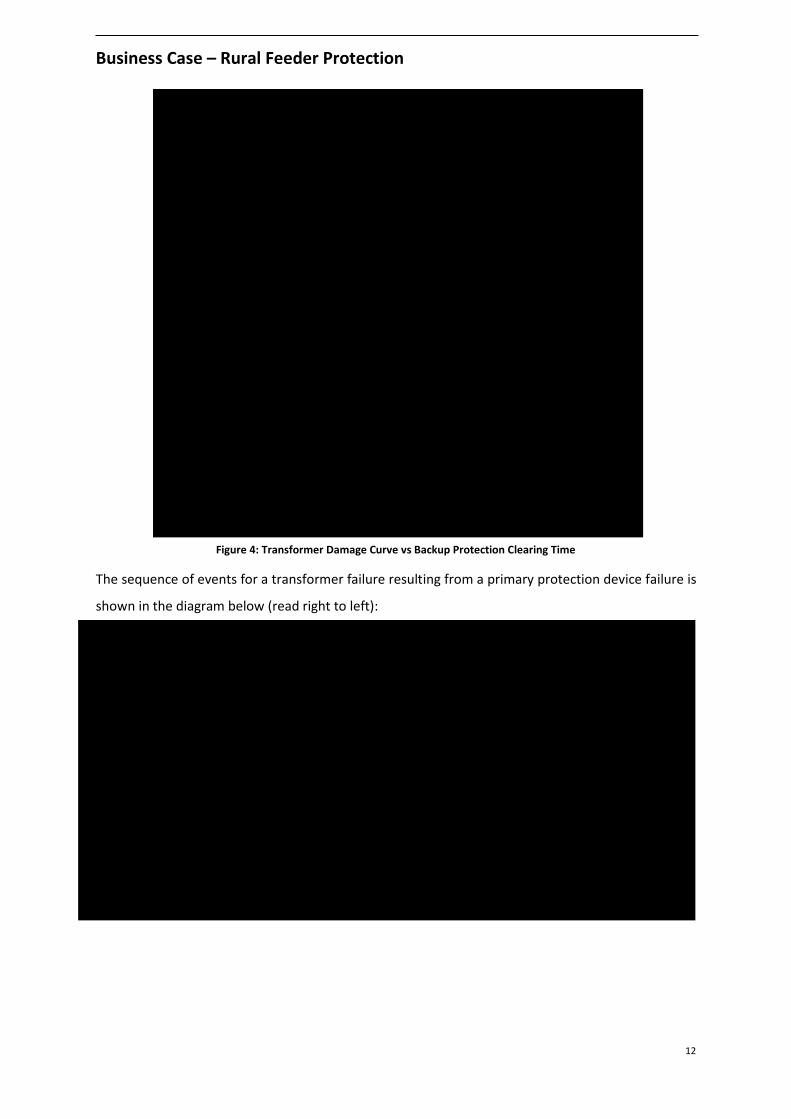
6.3.1 Transformer damages due to uncleared faults Based on the transformer protection curve published by IEEE (Category 1 IEEE C37.91), it is suggested
that the maximum allowable time is between 3 seconds to 32 seconds to prevent the isolation
transformer damage on our network (for 150kVA rated transformer and fault currents between 50A
to 160A). If existing primary protection fails and if there is no backup protection, then the isolation
transformer will fail if the conditions for transformer damage shown in Figure 4 are exceeded. The RFP
program aims to achieve backup protection of 2 seconds or less, in the event of primary protection
failure, to avoid transformer damage (see Figure 4).
Business Case – Rural Feeder Protection
12
Figure 4: Transformer Damage Curve vs Backup Protection Clearing Time
The sequence of events for a transformer failure resulting from a primary protection device failure is
shown in the diagram below (read right to left):
Business Case – Rural Feeder Protection
13
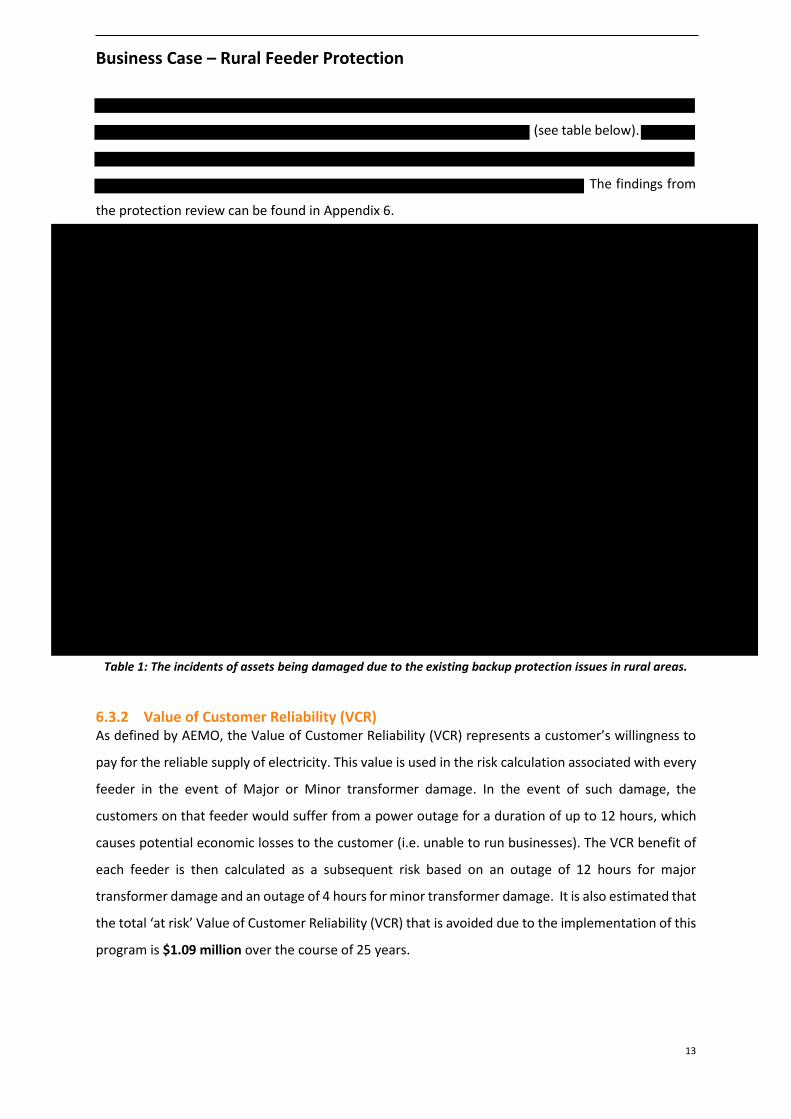
(see table below).
The findings from
the protection review can be found in Appendix 6.
Table 1: The incidents of assets being damaged due to the existing backup protection issues in rural areas.
6.3.2 Value of Customer Reliability (VCR) As defined by AEMO, the Value of Customer Reliability (VCR) represents a customer’s willingness to
pay for the reliable supply of electricity. This value is used in the risk calculation associated with every
feeder in the event of Major or Minor transformer damage. In the event of such damage, the
customers on that feeder would suffer from a power outage for a duration of up to 12 hours, which
causes potential economic losses to the customer (i.e. unable to run businesses). The VCR benefit of
each feeder is then calculated as a subsequent risk based on an outage of 12 hours for major
transformer damage and an outage of 4 hours for minor transformer damage. It is also estimated that
the total ‘at risk’ Value of Customer Reliability (VCR) that is avoided due to the implementation of this
program is $1.09 million over the course of 25 years.
Business Case – Rural Feeder Protection
14
7. PROTECTION SOLUTIONS The RFP program proposes to install additional protection device(s) to ensure that all credible faults,
are cleared in a timely manner (2 seconds or less) by the backup protection device, when primary
protection has failed. Different protection solutions have been assessed to determine the most
suitable strategy using a cost benefit analysis model, including new technology to address the
inadequate backup protection on the rural feeders (Refer to Section 9 for the feasibility analysis). Note
that all high risk 11kV feeders have been actioned prior to 2020. The lower risk 11kV feeders will be
considered beyond the 2020 to 2025 regulatory control period. The solutions and their suitability for
selected 19 kV SWER feeders are further explained in Section 9.
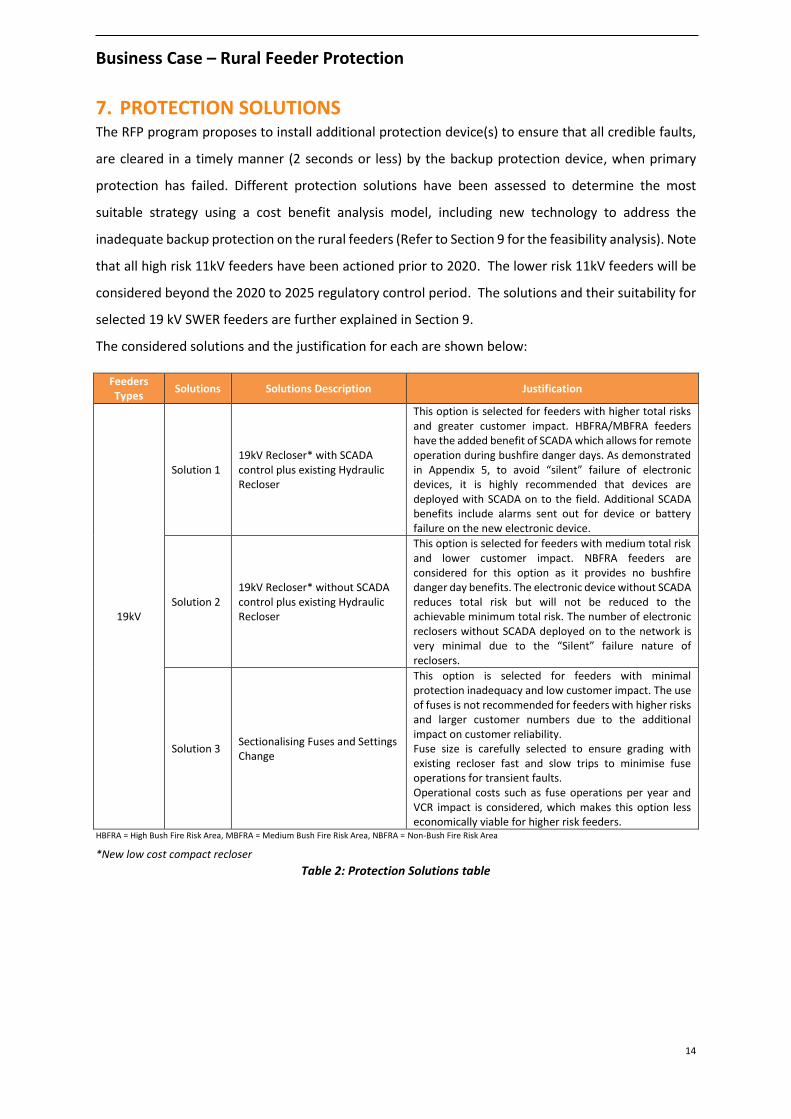
The considered solutions and the justification for each are shown below:
Feeders Types
Solutions Solutions Description Justification
19kV
Solution 1 19kV Recloser* with SCADA control plus existing Hydraulic Recloser
This option is selected for feeders with higher total risks and greater customer impact. HBFRA/MBFRA feeders have the added benefit of SCADA which allows for remote operation during bushfire danger days. As demonstrated in Appendix 5, to avoid “silent” failure of electronic devices, it is highly recommended that devices are deployed with SCADA on to the field. Additional SCADA benefits include alarms sent out for device or battery failure on the new electronic device.
Solution 2 19kV Recloser* without SCADA control plus existing Hydraulic Recloser
This option is selected for feeders with medium total risk and lower customer impact. NBFRA feeders are considered for this option as it provides no bushfire danger day benefits. The electronic device without SCADA reduces total risk but will not be reduced to the achievable minimum total risk. The number of electronic reclosers without SCADA deployed on to the network is very minimal due to the “Silent” failure nature of reclosers.
Solution 3 Sectionalising Fuses and Settings Change
This option is selected for feeders with minimal protection inadequacy and low customer impact. The use of fuses is not recommended for feeders with higher risks and larger customer numbers due to the additional impact on customer reliability. Fuse size is carefully selected to ensure grading with existing recloser fast and slow trips to minimise fuse operations for transient faults. Operational costs such as fuse operations per year and VCR impact is considered, which makes this option less economically viable for higher risk feeders.
HBFRA = High Bush Fire Risk Area, MBFRA = Medium Bush Fire Risk Area, NBFRA = Non-Bush Fire Risk Area
*New low cost compact recloser
Table 2: Protection Solutions table

Business Case – Rural Feeder Protection
15
The concept of the typical proposed protection solution is shown in Figure 6 below, and the
primary/backup protection used is based on the selected solution. The location of the new device is
dependent on the existing condition of inadequate backup protection on the feeder.
Business Case – Rural Feeder Protection
16
8. COST BENEFIT ANALYSIS The Net Present Value (NPV) of each solution investment cost determines the inclusion of a feeder in
the RFP program. The feeders that can demonstrate positive net present value over the course of a
25-year asset life will be considered in the program. The solution that produces the highest positive
NPV is selected for that specific feeder (see Appendix 3 for comparison). It is important to understand
that this program cannot eliminate all the risks associated with safety, bushfire and equipment
damage within the network. The program aims to mitigate and manage the risks associated with
safety, bushfire and equipment damage efficiently, for when the primary protection device has failed
to operate for a fault on the network.
8.1 Solution Benefits Each solution considered in the RFP program has their own benefits as well as operational costs. Refer
to Appendix 9 for all risk benefits across all feeders and comparison of Net Present Value across all
solutions. Solutions are carefully selected based on the existing risk of the feeder and taking
operational costs and other benefits into account. Note that if the considered solutions are not
implemented, significant risks remain on the network.
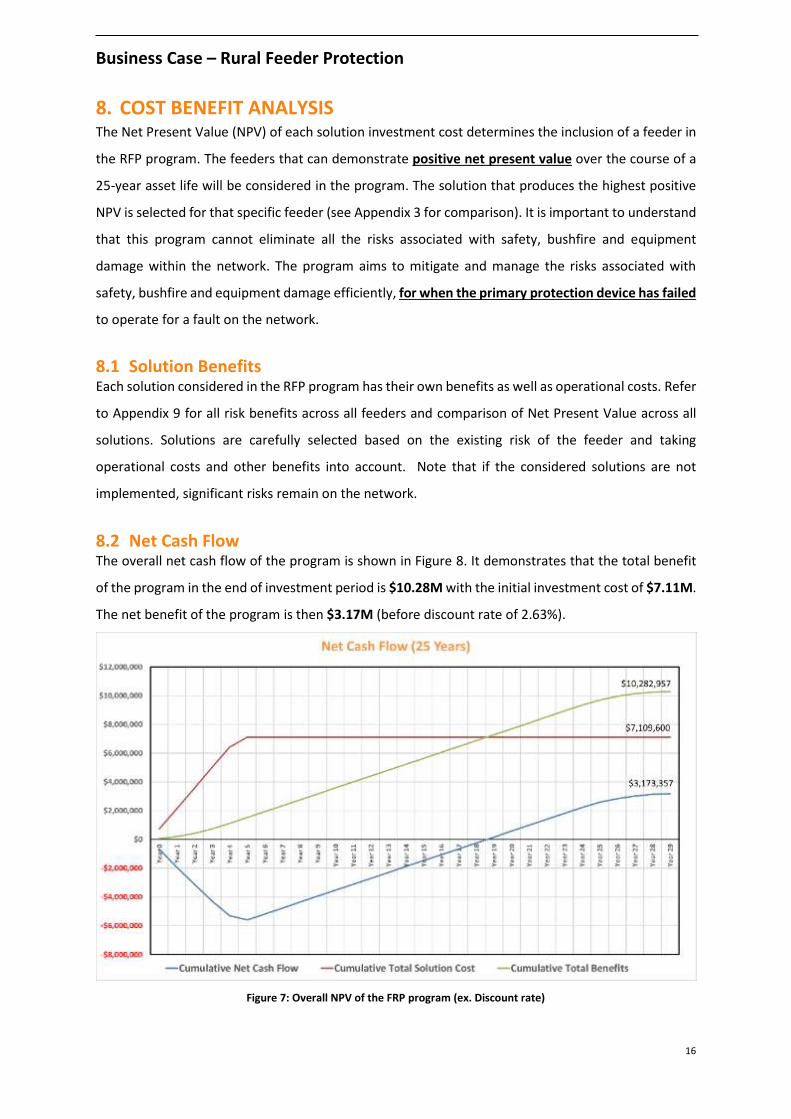
8.2 Net Cash Flow The overall net cash flow of the program is shown in Figure 8. It demonstrates that the total benefit
of the program in the end of investment period is $10.28M with the initial investment cost of $7.11M.
The net benefit of the program is then $3.17M (before discount rate of 2.63%).
Figure 7: Overall NPV of the FRP program (ex. Discount rate)
Business Case – Rural Feeder Protection
17
9. OPTIONS ANALYSIS Various options have been considered to address the protection inadequacy in rural feeders. These
options are presented below. SA Power Networks recommends Option 2 to be the most viable and
effective strategy.
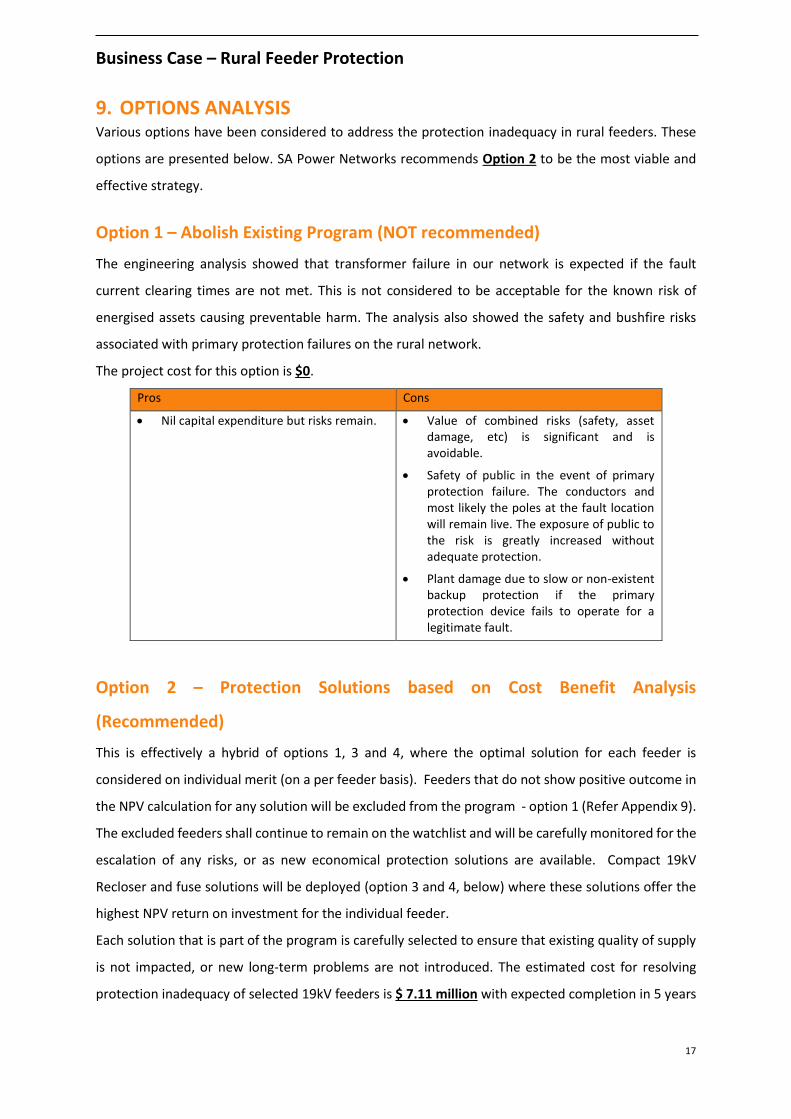
Option 1 – Abolish Existing Program (NOT recommended)
The engineering analysis showed that transformer failure in our network is expected if the fault
current clearing times are not met. This is not considered to be acceptable for the known risk of
energised assets causing preventable harm. The analysis also showed the safety and bushfire risks
associated with primary protection failures on the rural network.
The project cost for this option is $0.
Pros Cons
• Nil capital expenditure but risks remain. • Value of combined risks (safety, asset damage, etc) is significant and is avoidable.
• Safety of public in the event of primary protection failure. The conductors and most likely the poles at the fault location will remain live. The exposure of public to the risk is greatly increased without adequate protection.
• Plant damage due to slow or non-existent backup protection if the primary protection device fails to operate for a legitimate fault.
Option 2 – Protection Solutions based on Cost Benefit Analysis
(Recommended)
This is effectively a hybrid of options 1, 3 and 4, where the optimal solution for each feeder is
considered on individual merit (on a per feeder basis). Feeders that do not show positive outcome in
the NPV calculation for any solution will be excluded from the program - option 1 (Refer Appendix 9).
The excluded feeders shall continue to remain on the watchlist and will be carefully monitored for the
escalation of any risks, or as new economical protection solutions are available. Compact 19kV
Recloser and fuse solutions will be deployed (option 3 and 4, below) where these solutions offer the
highest NPV return on investment for the individual feeder.
Each solution that is part of the program is carefully selected to ensure that existing quality of supply
is not impacted, or new long-term problems are not introduced. The estimated cost for resolving
protection inadequacy of selected 19kV feeders is $ 7.11 million with expected completion in 5 years
Business Case – Rural Feeder Protection
18
(end of 2025). In the overall Net Cash Flow of the program depicted in Figure 7, the benefits (or risks
avoided) outweigh the cost of the investment.
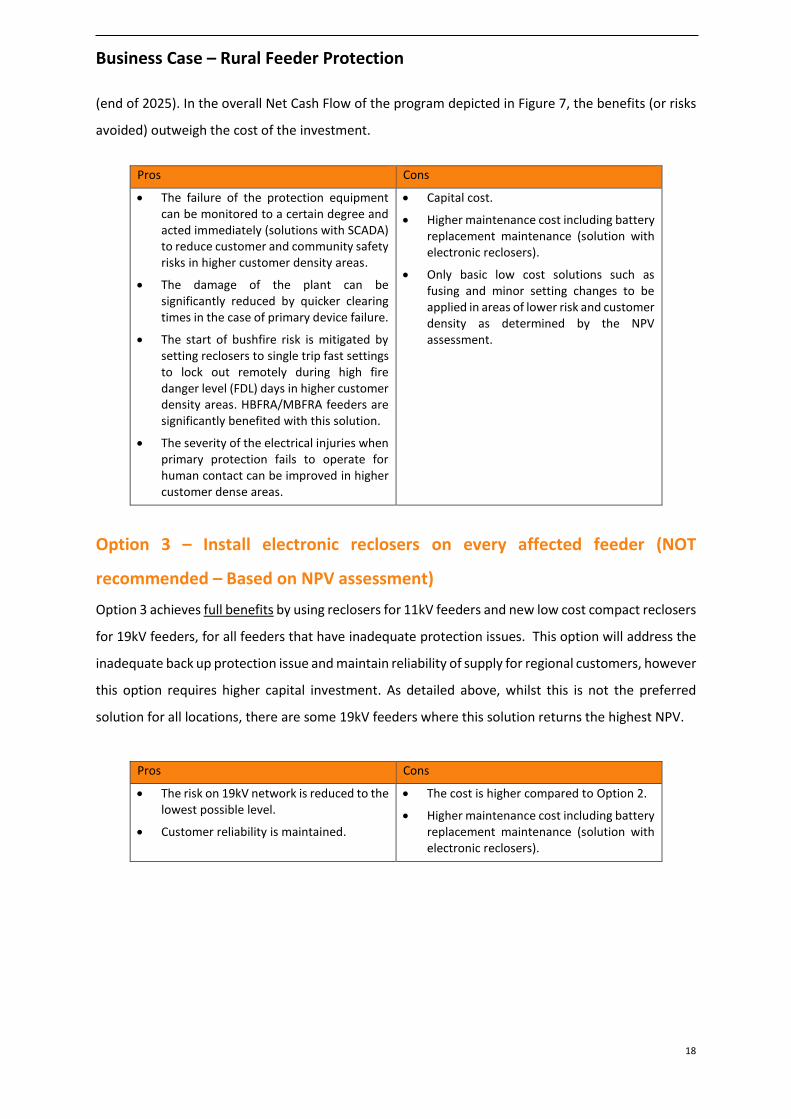
Pros Cons
• The failure of the protection equipment can be monitored to a certain degree and acted immediately (solutions with SCADA) to reduce customer and community safety risks in higher customer density areas.
• The damage of the plant can be significantly reduced by quicker clearing times in the case of primary device failure.
• The start of bushfire risk is mitigated by setting reclosers to single trip fast settings to lock out remotely during high fire danger level (FDL) days in higher customer density areas. HBFRA/MBFRA feeders are significantly benefited with this solution.
• The severity of the electrical injuries when primary protection fails to operate for human contact can be improved in higher customer dense areas.
• Capital cost.
• Higher maintenance cost including battery replacement maintenance (solution with electronic reclosers).
• Only basic low cost solutions such as fusing and minor setting changes to be applied in areas of lower risk and customer density as determined by the NPV assessment.
Option 3 – Install electronic reclosers on every affected feeder (NOT
recommended – Based on NPV assessment)
Option 3 achieves full benefits by using reclosers for 11kV feeders and new low cost compact reclosers
for 19kV feeders, for all feeders that have inadequate protection issues. This option will address the
inadequate back up protection issue and maintain reliability of supply for regional customers, however
this option requires higher capital investment. As detailed above, whilst this is not the preferred
solution for all locations, there are some 19kV feeders where this solution returns the highest NPV.
Pros Cons
• The risk on 19kV network is reduced to the lowest possible level.
• Customer reliability is maintained.
• The cost is higher compared to Option 2.
• Higher maintenance cost including battery replacement maintenance (solution with electronic reclosers).
Business Case – Rural Feeder Protection
19
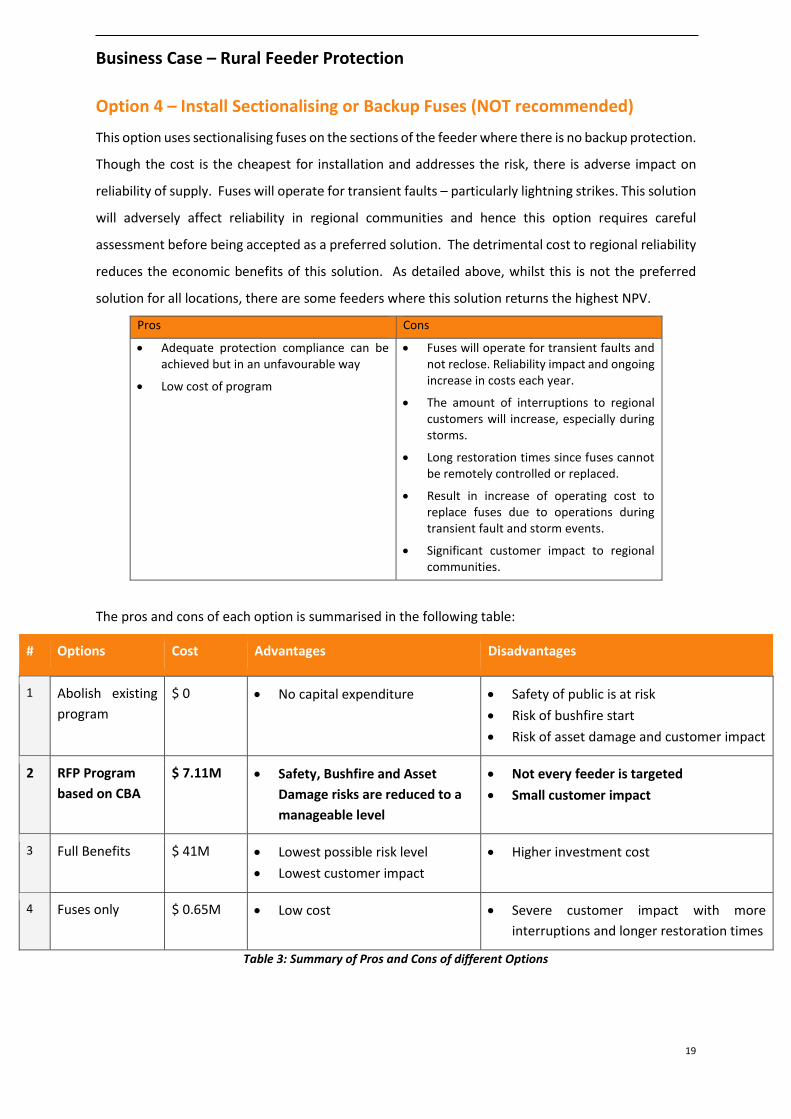
Option 4 – Install Sectionalising or Backup Fuses (NOT recommended)
This option uses sectionalising fuses on the sections of the feeder where there is no backup protection.
Though the cost is the cheapest for installation and addresses the risk, there is adverse impact on
reliability of supply. Fuses will operate for transient faults – particularly lightning strikes. This solution
will adversely affect reliability in regional communities and hence this option requires careful
assessment before being accepted as a preferred solution. The detrimental cost to regional reliability
reduces the economic benefits of this solution. As detailed above, whilst this is not the preferred
solution for all locations, there are some feeders where this solution returns the highest NPV.
Pros Cons
• Adequate protection compliance can be achieved but in an unfavourable way
• Low cost of program
• Fuses will operate for transient faults and not reclose. Reliability impact and ongoing increase in costs each year.
• The amount of interruptions to regional customers will increase, especially during storms.
• Long restoration times since fuses cannot be remotely controlled or replaced.
• Result in increase of operating cost to replace fuses due to operations during transient fault and storm events.
• Significant customer impact to regional communities.
The pros and cons of each option is summarised in the following table:
# Options Cost Advantages Disadvantages
1 Abolish existing
program
$ 0 • No capital expenditure
• Safety of public is at risk
• Risk of bushfire start
• Risk of asset damage and customer impact
2 RFP Program
based on CBA
$ 7.11M • Safety, Bushfire and Asset
Damage risks are reduced to a
manageable level
• Not every feeder is targeted
• Small customer impact
3 Full Benefits $ 41M • Lowest possible risk level
• Lowest customer impact
• Higher investment cost
4 Fuses only $ 0.65M • Low cost • Severe customer impact with more
interruptions and longer restoration times
Table 3: Summary of Pros and Cons of different Options
Business Case – Rural Feeder Protection
20
10. PROJECT COST Based on the model analysis, the NPV result shows that the risks of 203 SWERs can be mitigated using
the proposed protection solutions, while maintaining net positive economic benefits. In the next
regulatory period 2020 to 2025, a $7.11 million program is required to apply protection solutions to
solve protection inadequacy and manage risks on selected 19kV SWERs throughout the network. The
remaining affected feeders, both 11kV and 19kV are expected to be resolved by 2030 when new
economical solutions are available or if risk levels have increased in the future. Refer to Appendix 4
for the breakdown of the cost.
11. PROJECT TIMING It is expected for the Rural Feeder Protection program to be completed by the end of 2030, with only
203 out of 310 affected 19kV feeders are to be resolved by 2025, to ensure the risks associated with
the current network are managed appropriately. Refer to Appendix 4 for the breakdown of the
timeline for the regulatory period 2020/21 to 2024/25.
Business Case – Rural Feeder Protection
21
A. APPENDIX 1 – Reported Incidents of Inadequate Backup Protection The incidents below occurred on feeders where primary protection devices have failed during faults . Note that these are
only the incidents that were reported.
Business Case – Rural Feeder Protection
22
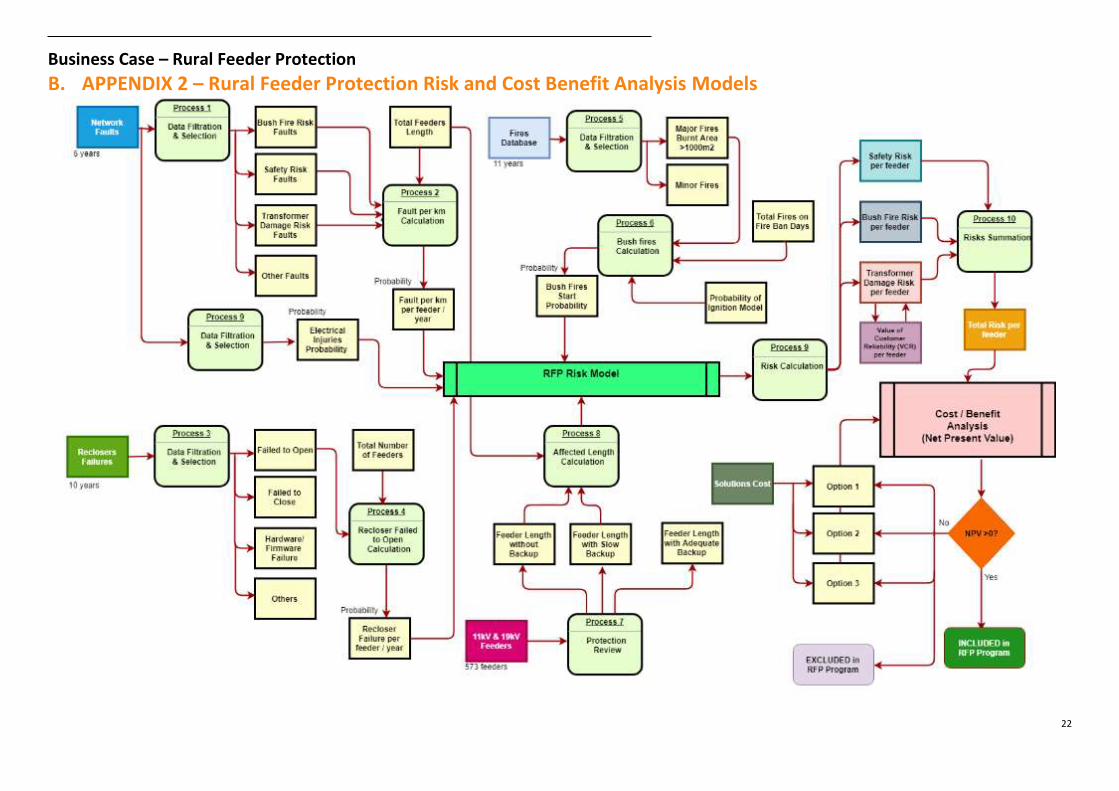
B. APPENDIX 2 – Rural Feeder Protection Risk and Cost Benefit Analysis Models
Business Case – Rural Feeder Protection
23
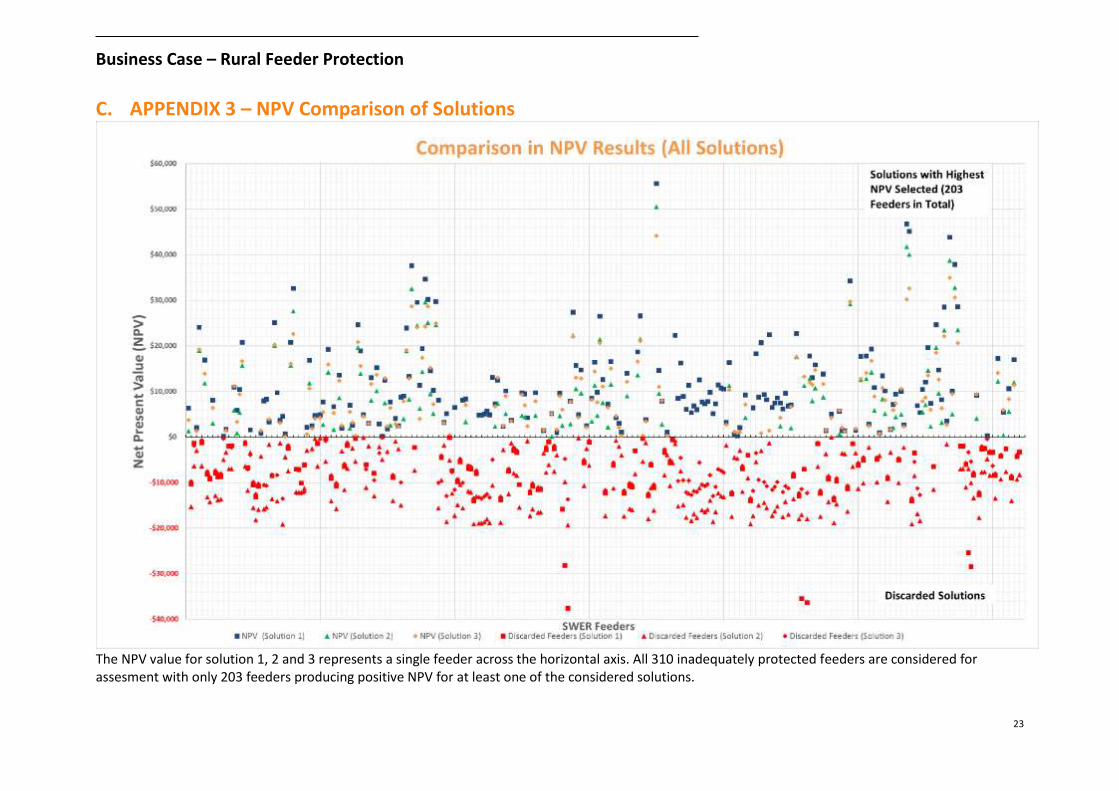
C. APPENDIX 3 – NPV Comparison of Solutions
The NPV value for solution 1, 2 and 3 represents a single feeder across the horizontal axis. All 310 inadequately protected feeders are considered for assesment with only 203 feeders producing positive NPV for at least one of the considered solutions.
Business Case – Rural Feeder Protection
24
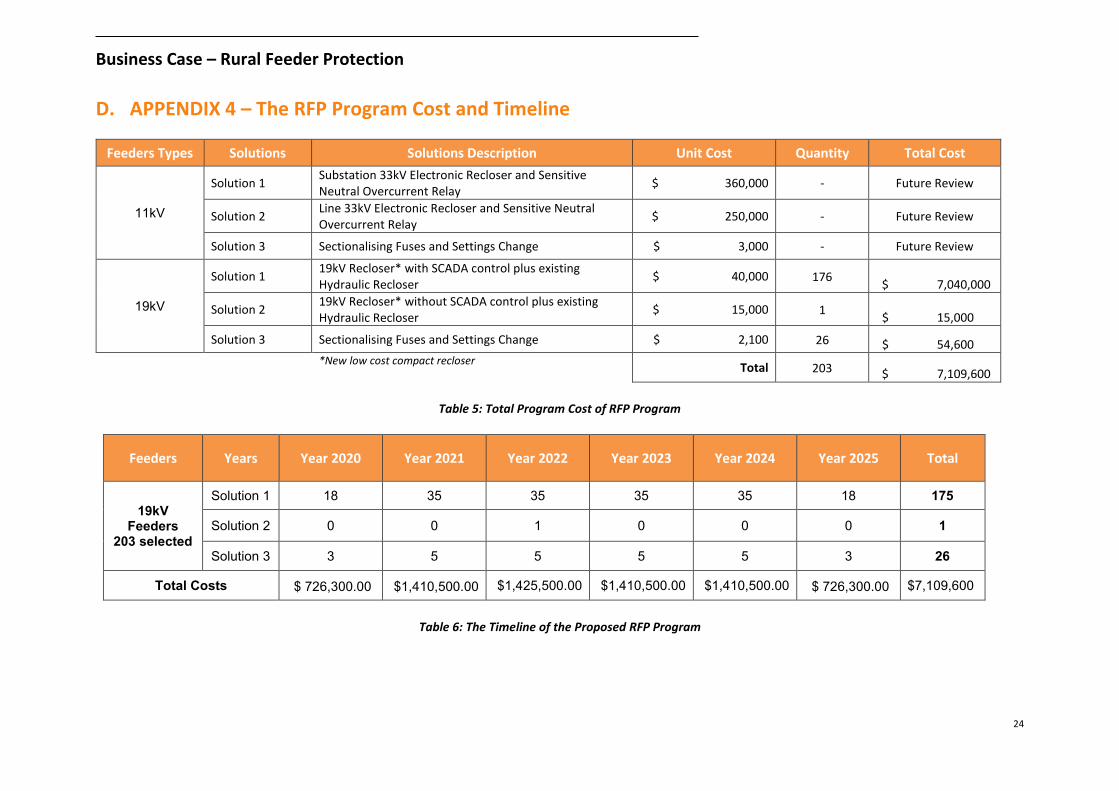
D. APPENDIX 4 – The RFP Program Cost and Timeline
Feeders Types Solutions Solutions Description Unit Cost Quantity Total Cost
11kV
Solution 1 Substation 33kV Electronic Recloser and Sensitive Neutral Overcurrent Relay
$ 360,000 - Future Review
Solution 2 Line 33kV Electronic Recloser and Sensitive Neutral Overcurrent Relay
$ 250,000 - Future Review
Solution 3 Sectionalising Fuses and Settings Change $ 3,000 - Future Review
19kV
Solution 1 19kV Recloser* with SCADA control plus existing Hydraulic Recloser
$ 40,000 176 $ 7,040,000
Solution 2 19kV Recloser* without SCADA control plus existing Hydraulic Recloser
$ 15,000 1 $ 15,000
Solution 3 Sectionalising Fuses and Settings Change $ 2,100 26 $ 54,600
*New low cost compact recloser Total 203 $ 7,109,600
Table 5: Total Program Cost of RFP Program
Feeders Years Year 2020 Year 2021 Year 2022 Year 2023 Year 2024 Year 2025 Total
19kV Feeders
203 selected
Solution 1 18 35 35 35 35 18 175
Solution 2 0 0 1 0 0 0 1
Solution 3 3 5 5 5 5 3 26
Total Costs $ 726,300.00 $1,410,500.00 $1,425,500.00 $1,410,500.00 $1,410,500.00 $ 726,300.00 $7,109,600
Table 6: The Timeline of the Proposed RFP Program
Business Case – Rural Feeder Protection
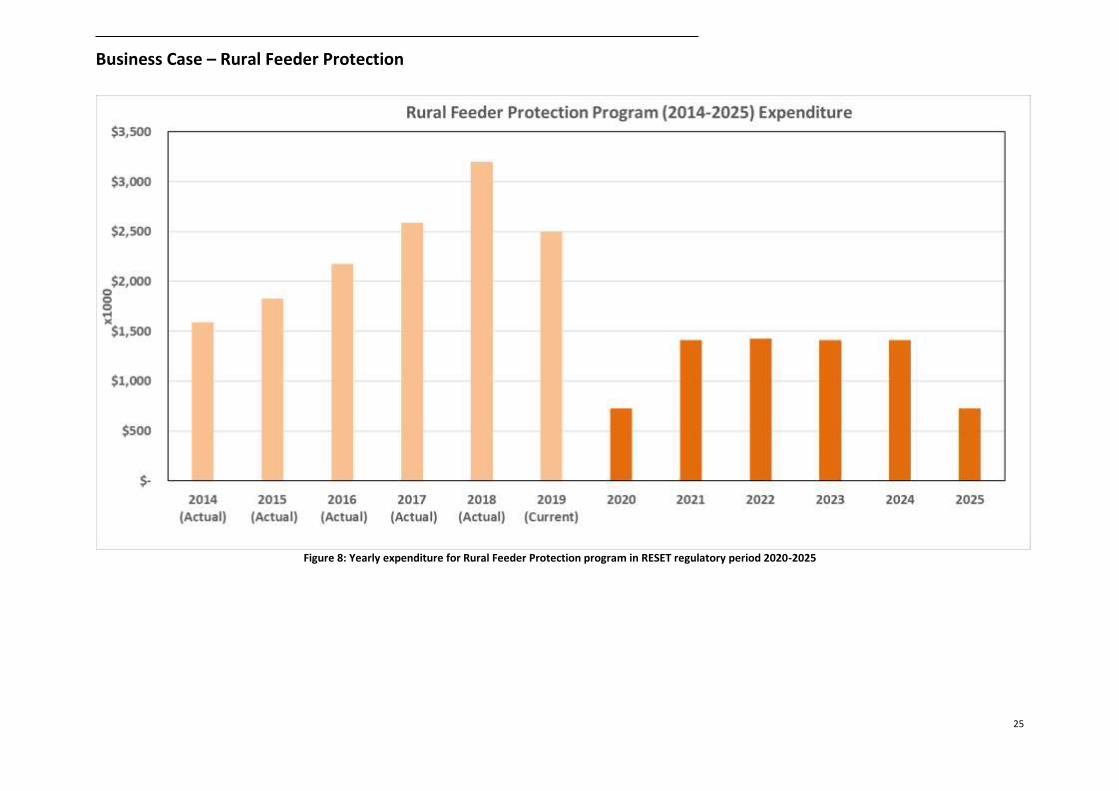
25
Figure 8: Yearly expenditure for Rural Feeder Protection program in RESET regulatory period 2020-2025
Business Case – Rural Feeder Protection
26
E. APPENDIX 5 – Reclosers Failure Analysis
Table 7: Reclosers Failed to Open Failures Analysis
The table above shows the records of reclosers that failed to operate and the maximum possible number
of days that the recloser may have failed and remained in a failed state. Note that these hydraulic reclosers
are not SCADA monitored and there may be several in-service reclosers which were already in a failed
state. The failures are not discovered until a fault event occurs or during recloser maintenance. It is
entirely reasonable to expect that a recloser may fail (silent failure) during the last known operation or
following a test on the last maintained date.
Business Case – Rural Feeder Protection
27
F. APPENDIX 6 – Protection Reviews on 19kV Feeders All the 19kV feeders within the network were reviewed to assess the protection coverage. Long feeders
with a single protection recloser and smaller rated supply transformers protected by fuses tend to suffer
more protection issues than any other feeders. Based on the review, three parameters are assigned to
the reviewed feeders, i.e.:
1. Percentage of a feeder that has adequate backup protection (any credible faults that would be
cleared by the backup protection device in less than 2 seconds)
2. Percentage of a feeder that has slow backup protection (any credible faults that would be cleared
by the backup protection device between 2 to 10 seconds)
3. Percentage of a feeder that has no backup protection (any credible faults that would be cleared
by the backup protection device after 10 seconds or would not be cleared until fault has further
developed)
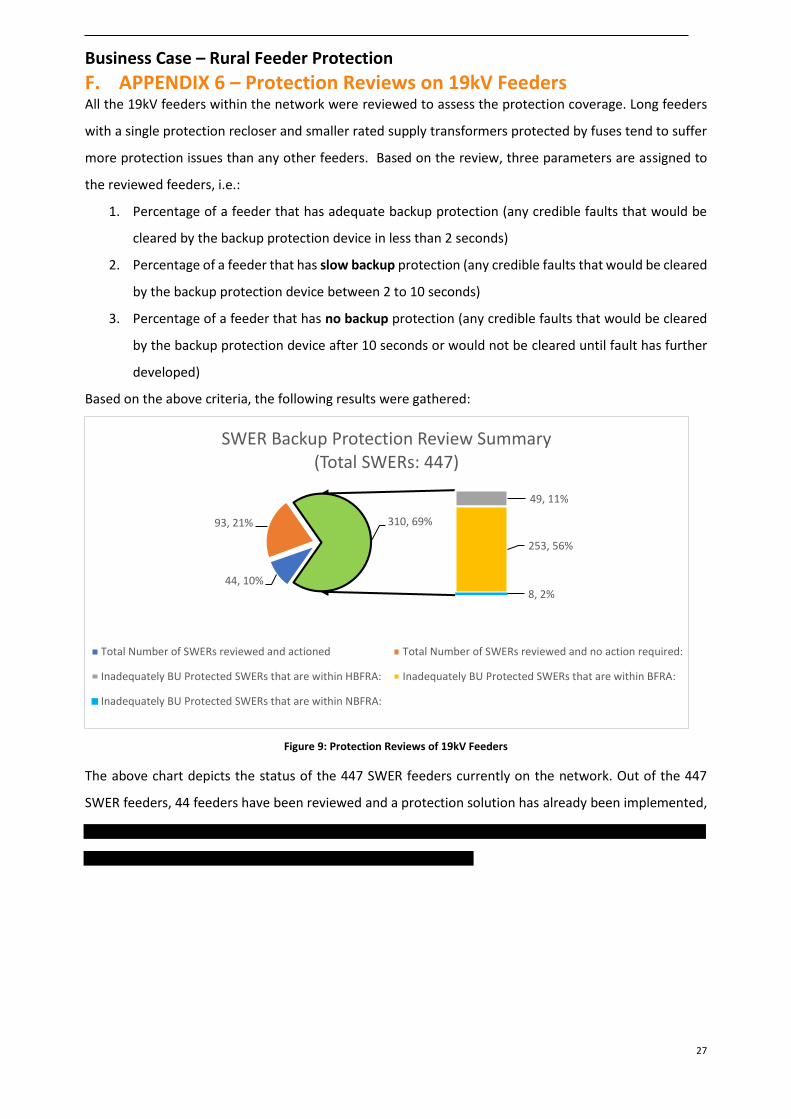
Based on the above criteria, the following results were gathered:
Figure 9: Protection Reviews of 19kV Feeders
The above chart depicts the status of the 447 SWER feeders currently on the network. Out of the 447
SWER feeders, 44 feeders have been reviewed and a protection solution has already been implemented,
44, 10%
93, 21%
49, 11%
253, 56%
8, 2%
310, 69%
SWER Backup Protection Review Summary (Total SWERs: 447)
Total Number of SWERs reviewed and actioned Total Number of SWERs reviewed and no action required:
Inadequately BU Protected SWERs that are within HBFRA: Inadequately BU Protected SWERs that are within BFRA:
Inadequately BU Protected SWERs that are within NBFRA:
Business Case – Rural Feeder Protection
28
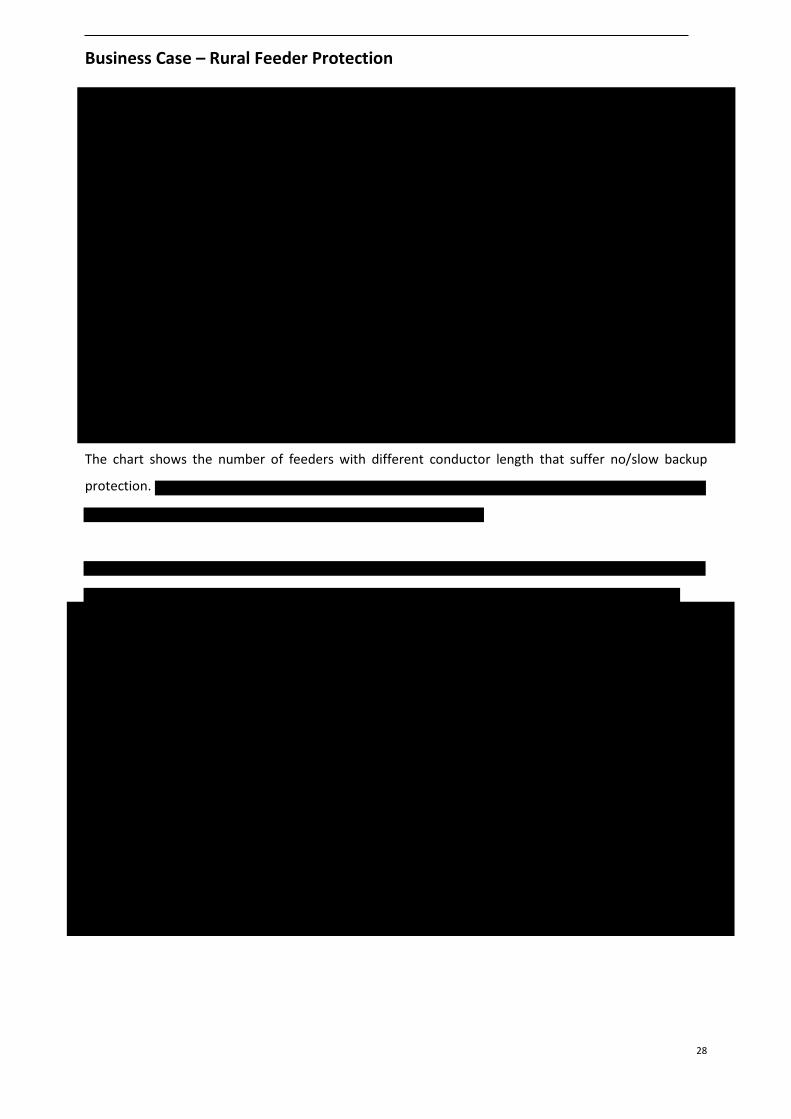
The chart shows the number of feeders with different conductor length that suffer no/slow backup
protection.
Business Case – Rural Feeder Protection
29
G. APPENDIX 7 – RFP Model Breakdown The simplified risk model can be found in Figure 1 and detailed model can be found in Appendix 4.
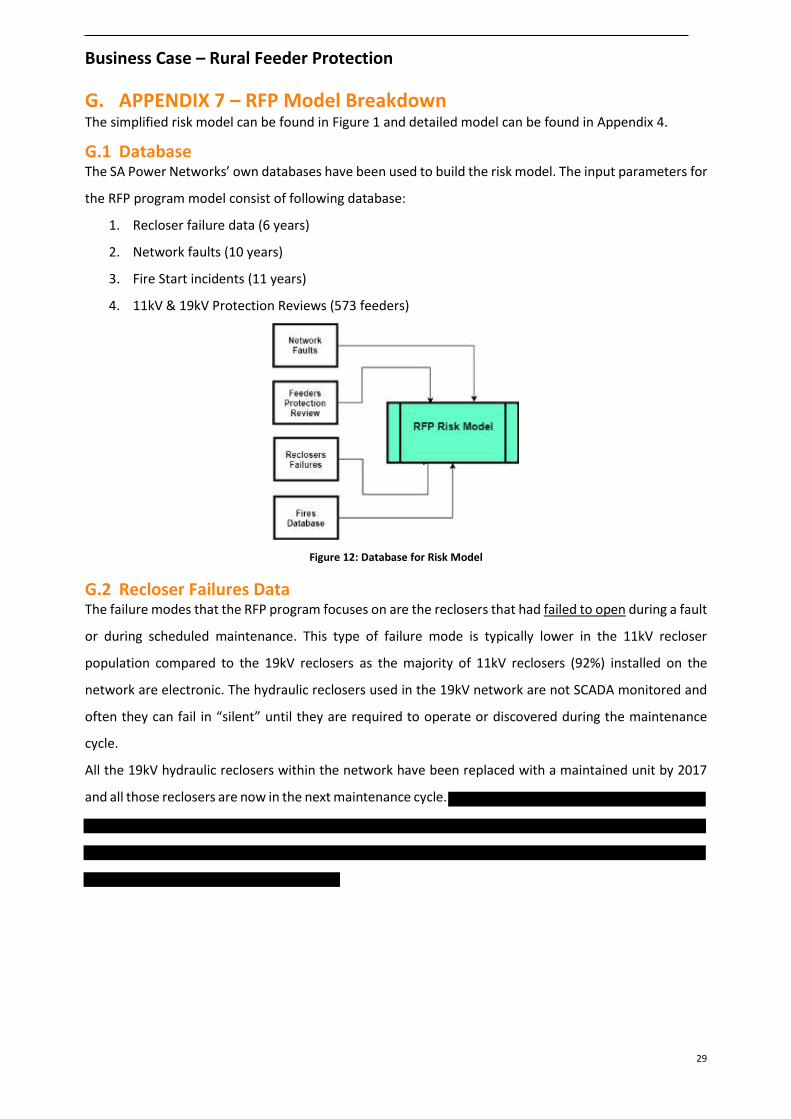
G.1 Database The SA Power Networks’ own databases have been used to build the risk model. The input parameters for
the RFP program model consist of following database:
1. Recloser failure data (6 years)
2. Network faults (10 years)
3. Fire Start incidents (11 years)
4. 11kV & 19kV Protection Reviews (573 feeders)
Figure 12: Database for Risk Model
G.2 Recloser Failures Data The failure modes that the RFP program focuses on are the reclosers that had failed to open during a fault
or during scheduled maintenance. This type of failure mode is typically lower in the 11kV recloser
population compared to the 19kV reclosers as the majority of 11kV reclosers (92%) installed on the
network are electronic. The hydraulic reclosers used in the 19kV network are not SCADA monitored and
often they can fail in “silent” until they are required to operate or discovered during the maintenance
cycle.
All the 19kV hydraulic reclosers within the network have been replaced with a maintained unit by 2017
and all those reclosers are now in the next maintenance cycle.
Business Case – Rural Feeder Protection
30
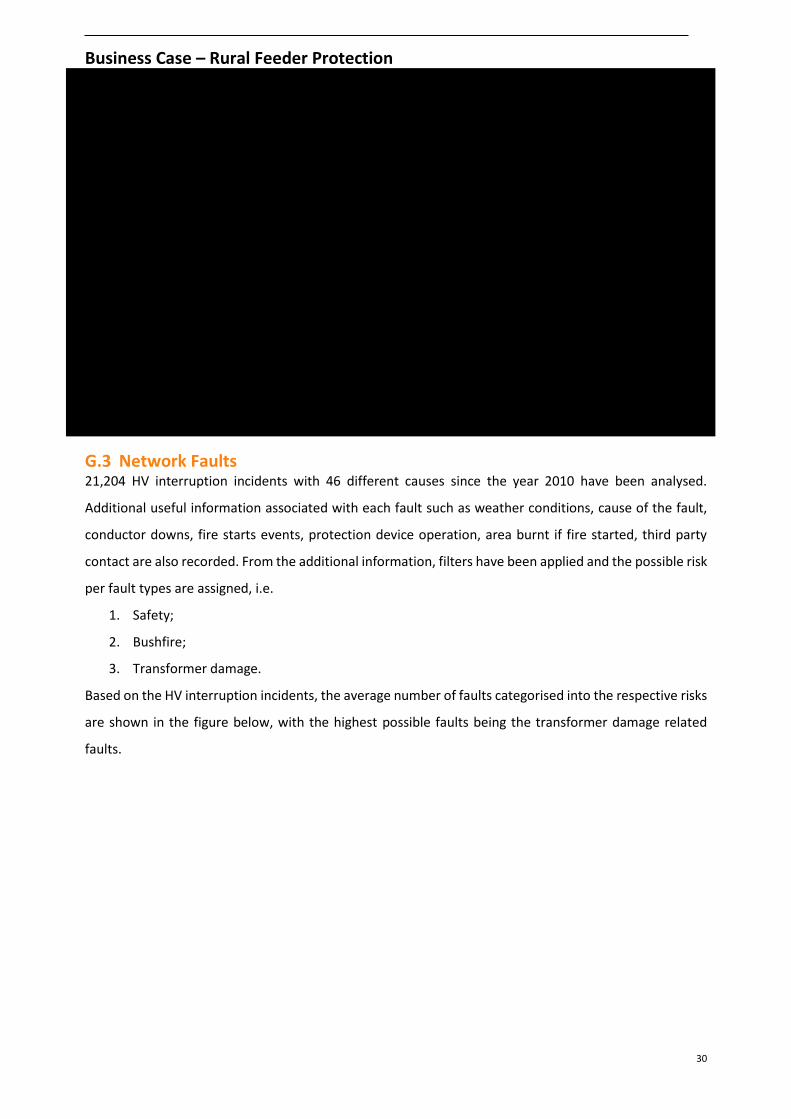
G.3 Network Faults 21,204 HV interruption incidents with 46 different causes since the year 2010 have been analysed.
Additional useful information associated with each fault such as weather conditions, cause of the fault,
conductor downs, fire starts events, protection device operation, area burnt if fire started, third party
contact are also recorded. From the additional information, filters have been applied and the possible risk
per fault types are assigned, i.e.
1. Safety;
2. Bushfire;
3. Transformer damage.
Based on the HV interruption incidents, the average number of faults categorised into the respective risks
are shown in the figure below, with the highest possible faults being the transformer damage related
faults.
Business Case – Rural Feeder Protection
31
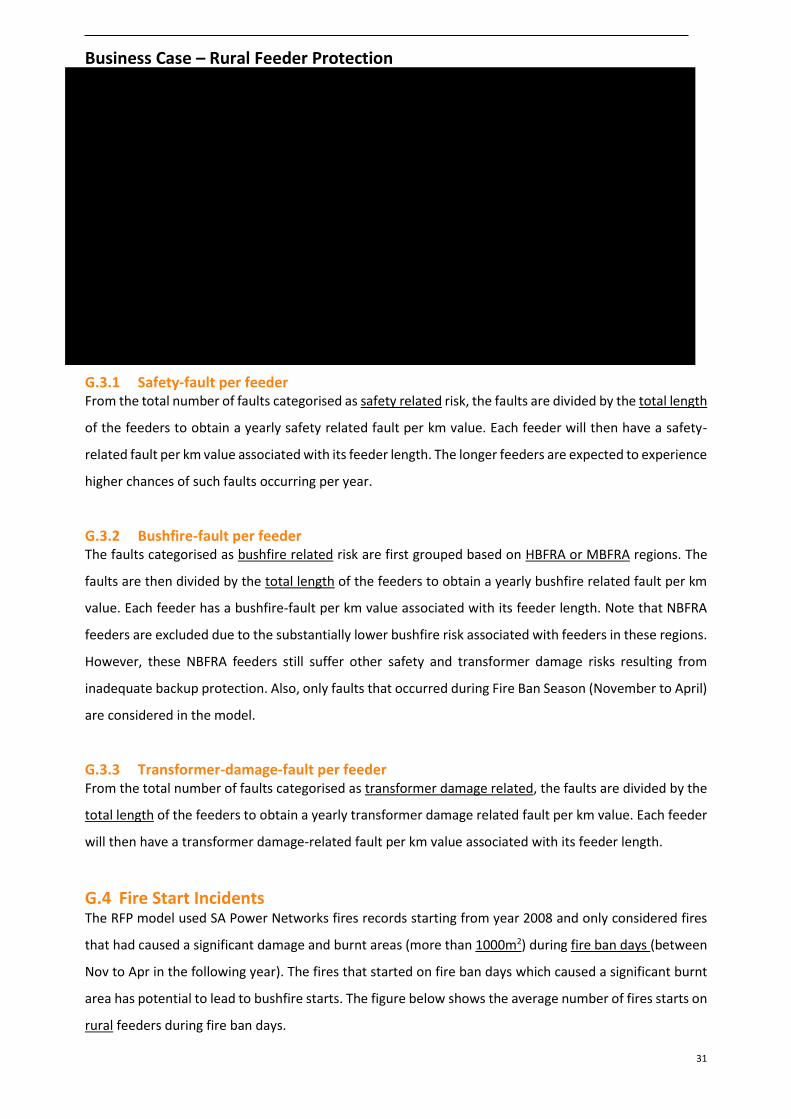
G.3.1 Safety-fault per feeder From the total number of faults categorised as safety related risk, the faults are divided by the total length
of the feeders to obtain a yearly safety related fault per km value. Each feeder will then have a safety-
related fault per km value associated with its feeder length. The longer feeders are expected to experience
higher chances of such faults occurring per year.
G.3.2 Bushfire-fault per feeder The faults categorised as bushfire related risk are first grouped based on HBFRA or MBFRA regions. The
faults are then divided by the total length of the feeders to obtain a yearly bushfire related fault per km
value. Each feeder has a bushfire-fault per km value associated with its feeder length. Note that NBFRA
feeders are excluded due to the substantially lower bushfire risk associated with feeders in these regions.
However, these NBFRA feeders still suffer other safety and transformer damage risks resulting from
inadequate backup protection. Also, only faults that occurred during Fire Ban Season (November to April)
are considered in the model.
G.3.3 Transformer-damage-fault per feeder From the total number of faults categorised as transformer damage related, the faults are divided by the
total length of the feeders to obtain a yearly transformer damage related fault per km value. Each feeder
will then have a transformer damage-related fault per km value associated with its feeder length.
G.4 Fire Start Incidents The RFP model used SA Power Networks fires records starting from year 2008 and only considered fires
that had caused a significant damage and burnt areas (more than 1000m2) during fire ban days (between
Nov to Apr in the following year). The fires that started on fire ban days which caused a significant burnt
area has potential to lead to bushfire starts. The figure below shows the average number of fires starts on
rural feeders during fire ban days.
Business Case – Rural Feeder Protection
32
G.5 RISK Recall the 3 types of risks considered in the model:
i. Safety risk
ii. Bushfire risk
iii. Transformer damage risk
Figure 16: Total Risk of a Feeder
G.5.1 Safety Risk
This may be
regarded as being very conservative considering the actual data shown in Appendix 1 Table 4, which
indicates at least 2 near misses in 6 years. The safety risk formula is given as the following:
Business Case – Rural Feeder Protection
33
𝑆𝑎𝑓𝑒𝑡𝑦 𝑅𝑖𝑠𝑘 = 𝐷𝑒𝑎𝑡ℎ 𝑅𝑖𝑠𝑘 + 𝐼𝑛𝑗𝑢𝑟𝑦 𝑅𝑖𝑠𝑘
= 𝐶(𝐸𝐶𝐷) × 𝑃(𝐷𝐵𝐴) × 𝑃(𝑅𝐹𝑂) × 𝑃(𝐹𝐵𝐿)+ 𝐶(𝐸𝐶𝐼) × 𝑃(𝐼𝐵𝐴) × 𝑃(𝑅𝐹𝑂) × (𝑃(𝐹𝐵𝐿)
Where: C(ECD) = Consequence of Economic Cost per Death
C(ECI) = Consequence of Economic Cost per Injuries
P(RFO) = Probability Recloser Failed to Open
P(DBA) = Probability of Death
P(IBA) = Probability of Injuries
P(FBL) = Probability of a Safety Fault Based on affected Length (sum of no and slow backup protection sections)
Note that the probability of fault occurring per feeder, P(FBL) the fault is based on total affected length
of the feeder, i.e. the sum of feeder length with slow and no backup protection as both conditions could
lead to death or injury.
G.5.2 Bushfire Risk The RFP model for assessing the bushfire risk component is closely compared to Bush Fire Risk
Management’s model to ensure consistency in approach and method. The RFP program aims to mitigate
bush fire start by placing the backup protection devices into high speed single trip in addition to SA Power
Networks’ current practice for high bush fire risk days. Note that there is no additional benefit during non-
bush fire risk days because any fire start is not expected to develop into bushfires on these days.
The bushfire risk reduction formula is as follows:
𝐵𝑢𝑠ℎ𝑓𝑖𝑟𝑒 𝑅𝑖𝑠𝑘 = 𝐶(𝐸𝐵𝐹) × 𝑃(𝑅𝐹𝑂) × 𝑃(𝐹𝑆) × 𝑃(𝐵𝐹𝑆) × 𝑃(𝑆𝑅) × 𝑃(𝐹𝐵𝑇)
Where: C(EBF) = Consequence of Bushfire’s Economic cost
P(RFO) = Probability Recloser Failed to Open
P(FS) = Probability of fire start
P(BFS) = Probability of Bushfire Start
P(SR) = Suppression Rate (90%)
P(FBT) = Probability Fault Based on Total Length (100% of the length)
Note that the proposed new fast tripping backup protection device is able to reduce the probability of a
bushfire start on any part of the feeder during high bush fire risk days, instead of on the affected section
only. Hence the risk reduction in the calculation is based on the fault per whole feeder P(FBT).
G.5.3 Probability of Ignition
It shows the probability of ignition under different environmental
conditions (windspeed, air temperature, fuel moisture content) for different current magnitudes. For a
Business Case – Rural Feeder Protection
34
typical SWER fault current between 50A to 160A, it shows that
To ensure that RFP’s model does not overstate bushfire risk, the bushfire start probability is compared
against the probability of Bushfire Management model from the Bushfire Management Group. The graph
below depicts the validity check of the two models, with the inclusion of primary protection failures
probability in both models. The two models are closely aligned.
Business Case – Rural Feeder Protection
35
G.5.4 Transformer Damage Risk Transformer Damage risk is divided into Major and Minor damage risk when the primary protection fails.
It is assumed the certainty of a transformer to suffer (major or minor) damage when a primary protection
without adequate backup protection, has failed to operate for a permanent fault. There is subsequent risk
followed by the initial transformer damage incident, i.e. economic cost due to the supply interruptions.
Many rural feeders have limited feeder transferability and therefore supply may only be restored when
the supply transformer is repaired or replaced. To estimate the economic cost due to the transformer
damage, the Value of Customer Reliability (VCR) has been applied.
The transformer damage risk formula is as follows:
𝑇𝑟𝑎𝑛𝑠𝑓𝑜𝑚𝑒𝑟 𝐷𝑎𝑚𝑎𝑔𝑒 𝑅𝑖𝑠𝑘
= 𝑀𝑎𝑗𝑜𝑟 𝑇𝑟𝑎𝑛𝑠𝑓𝑜𝑚𝑒𝑟 𝐷𝑎𝑚𝑎𝑔𝑒 𝑅𝑖𝑠𝑘 + 𝑀𝑖𝑛𝑜𝑟 𝑇𝑟𝑎𝑛𝑠𝑓𝑜𝑟𝑚𝑒𝑟 𝐷𝑎𝑚𝑎𝑔𝑒 𝑅𝑖𝑠𝑘
= 𝐶(𝑇𝐷𝑀 + 𝑉𝐶𝑅𝑀) × 𝑃(𝑅𝐹𝑂) × 𝑃(𝐹𝑁𝐿) + 𝐶(𝑇𝐷 + 𝑉𝐶𝑅) × 𝑃(𝑅𝐹𝑂) × 𝑃(𝐹𝑆𝐿)
Note that Major Risk includes Subsequent Risk associated with major transformer damage whereas Minor
Risk includes Subsequent Risk associated with minor transformer damage. It is considered a major
transformer damage if the transformer has failed catastrophically due to an undetected fault and it is
considered a minor transformer damage if the damage caused to the transformer due to slow backup
protection is repairable on site.
Where: C(TDM) = Consequence of Transformer Damage Major
C(TD) = Consequence of Transformer Damage minor
Business Case – Rural Feeder Protection
36
C(VCRM) = Consequence of VCR Impact due to Major TF damage (Based on 12-hour outage)
C(VCR) = Consequence of VCR Impact due to minor TF damage (Based on 4-hour outage)
P(RFO) = Probability Recloser Failed to Open
P(FNL) = Probability Fault on No backup based on km Length
P(FSL) = Probability Fault on Slow backup based on km Length
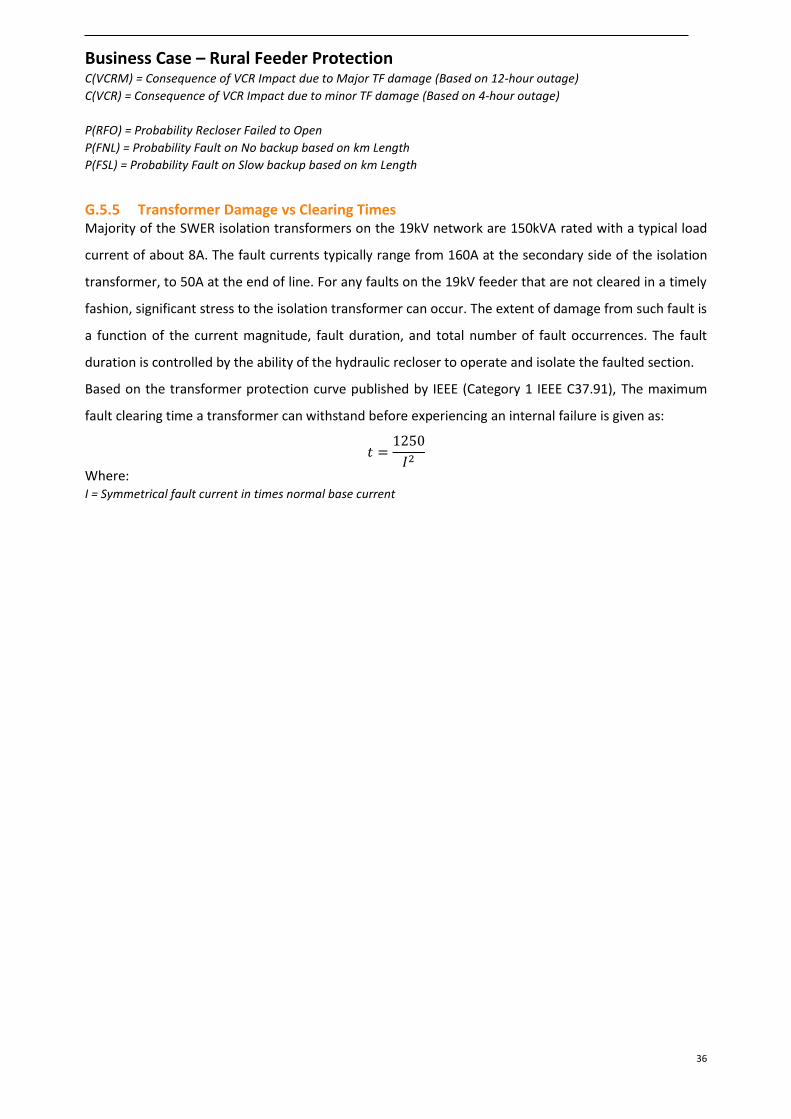
G.5.5 Transformer Damage vs Clearing Times Majority of the SWER isolation transformers on the 19kV network are 150kVA rated with a typical load
current of about 8A. The fault currents typically range from 160A at the secondary side of the isolation
transformer, to 50A at the end of line. For any faults on the 19kV feeder that are not cleared in a timely
fashion, significant stress to the isolation transformer can occur. The extent of damage from such fault is
a function of the current magnitude, fault duration, and total number of fault occurrences. The fault
duration is controlled by the ability of the hydraulic recloser to operate and isolate the faulted section.
Based on the transformer protection curve published by IEEE (Category 1 IEEE C37.91), The maximum
fault clearing time a transformer can withstand before experiencing an internal failure is given as:
𝑡 =1250
𝐼2
Where: I = Symmetrical fault current in times normal base current
Business Case – Rural Feeder Protection
37
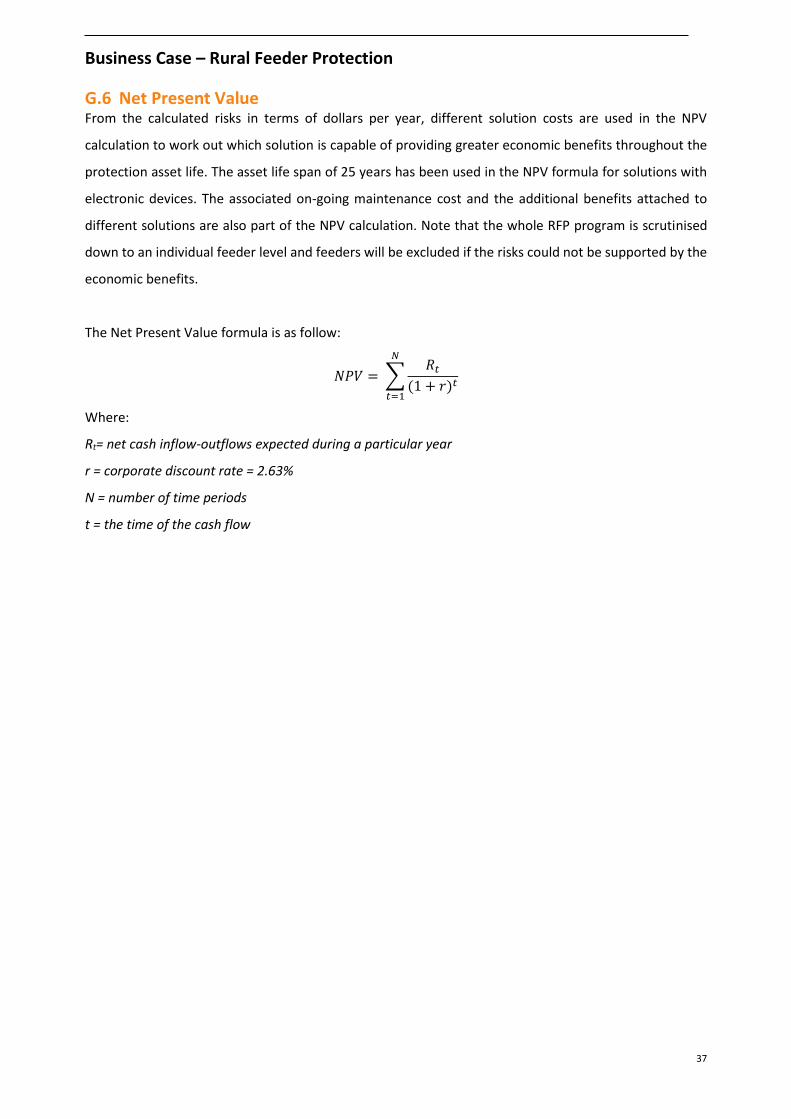
G.6 Net Present Value From the calculated risks in terms of dollars per year, different solution costs are used in the NPV
calculation to work out which solution is capable of providing greater economic benefits throughout the
protection asset life. The asset life span of 25 years has been used in the NPV formula for solutions with
electronic devices. The associated on-going maintenance cost and the additional benefits attached to
different solutions are also part of the NPV calculation. Note that the whole RFP program is scrutinised
down to an individual feeder level and feeders will be excluded if the risks could not be supported by the
economic benefits.
The Net Present Value formula is as follow:
𝑁𝑃𝑉 = ∑𝑅𝑡
(1 + 𝑟)𝑡
𝑁
𝑡=1
Where:
Rt= net cash inflow-outflows expected during a particular year
r = corporate discount rate = 2.63%
N = number of time periods
t = the time of the cash flow
Business Case – Rural Feeder Protection
38
H. APPENDIX 8– Regulatory Drivers There are a number of safety related legislative or regulatory obligations imposed on SA Power Networks
that relate specifically to managing safety risks in our network. The extracts from the National Electricity
Objective (NEO) and National Electricity Rules (NER) published documents as follows:
National Electricity Objective
The National Electricity Objective (NEO), set out in the National Electricity Law (NEL), is to:
"promote efficient investment in, and efficient operation and use of, electricity services for the long-term
interests of consumers of electricity with respect to -
i. price, quality, safety, reliability and security of supply of electricity; and
ii. the reliability, safety and security of the national electricity system".
National Electricity Rules (Schedule 5.1)
The National Electricity Rules in Chapter 5, Schedule S5.1.9 (c) and (f) Protection systems and fault
clearance times requires that Network Users:
i. Subject to clauses S5.1.9(k) and S5.1.9(l), a Network Service Provider must provide sufficient
primary protection systems and back-up protection systems (including breaker fail
protection systems) to ensure that a fault of any fault type anywhere on its transmission
system or distribution system is automatically disconnected in accordance with clause
S5.1.9(e) or clause S5.1.9(f).
ii. The fault clearance time of each breaker fail protection system or similar back-up protection
system of a Network Service Provider must be such that a short circuit fault of any fault type
that is cleared in that time would not damage any part of the power system (other than
the faulted element) while the fault current is flowing or being interrupted
Business Case – Rural Feeder Protection
39
I. APPENDIX 9 – NPV Calculation and Options Assessment See confidential model, supporting document 5.19.1 - Rural Feeder Protection model