Rural Commuting Commuting and Economic Functions of Rural Small Towns and Places RURAL PLANNING...
26
Rural Commuting Rural Commuting Commuting and Economic Commuting and Economic Functions of Rural Small Functions of Rural Small Towns and Places Towns and Places RURAL PLANNING SEMINAR RURAL PLANNING SEMINAR
-
Upload
easter-lane -
Category
Documents
-
view
216 -
download
0
Transcript of Rural Commuting Commuting and Economic Functions of Rural Small Towns and Places RURAL PLANNING...

Rural CommutingRural Commuting
Commuting and Economic Functions Commuting and Economic Functions of Rural Small Towns and Placesof Rural Small Towns and Places
RURAL PLANNING SEMINARRURAL PLANNING SEMINAR

General Factors for CommutingGeneral Factors for Commuting
Three majors factors for increased Three majors factors for increased commuting in the U.S. – Post WWIIcommuting in the U.S. – Post WWII– Increased use of the automobileIncreased use of the automobile– Boom in worker supply due to baby boomBoom in worker supply due to baby boom– Shift to suburban areasShift to suburban areas– Growing affluenceGrowing affluence

RURAL OUT-COMMUTINGRURAL OUT-COMMUTING
Integral part of non-metro lifeIntegral part of non-metro life 90% of non-metro commutes are to non-90% of non-metro commutes are to non-
metro locationsmetro locations 90-95% are in private vehicles90-95% are in private vehicles 70% drive alone70% drive alone

Aggregate Commuting by SizeAggregate Commuting by SizeSize of CommunitySize of Community Commuting OutCommuting Out Commuting InCommuting In
<than 2,500<than 2,500 44%44% 18%18%
2,500 to2,500 to
10,00010,000
41%41% 62%62%
>10,000>10,000 25%25% 63%63%


Some CharacteristicSome Characteristic
Midwest and West have very large out-Midwest and West have very large out-commuting rates and distancescommuting rates and distances
South is the highest in reverse commuting – South is the highest in reverse commuting – workers commute outward, while merchants workers commute outward, while merchants commute inwardcommute inward

Commuting Outside Place of Commuting Outside Place of ResidenceResidence

Commuting FactorsCommuting Factors
Commuting to higher wagesCommuting to higher wages More affordable housingMore affordable housing Pushed out of high cost areasPushed out of high cost areas...Today, as a result of recent decades of rural population loss, ...Today, as a result of recent decades of rural population loss,
houses and store buildings in some rural villages have houses and store buildings in some rural villages have become vacant. Absentee landlords…have cut them up become vacant. Absentee landlords…have cut them up into apartments, which they now rent at rates that are into apartments, which they now rent at rates that are considerably lower than rents in the larger towns or nearby considerably lower than rents in the larger towns or nearby cities.... Thus, some small villages have become de facto cities.... Thus, some small villages have become de facto low-income housing sites.low-income housing sites.

Rural Commuting CharacteristicsRural Commuting Characteristics
To Work 47% 4 min 36 minTo Work 47% 4 min 36 min Shopping 21% 3 min 45 minShopping 21% 3 min 45 min Entertainment 10% 5 min 50 minEntertainment 10% 5 min 50 min Personal 10% 3 min 31 minPersonal 10% 3 min 31 min Recreation 02% 8 min 37 minRecreation 02% 8 min 37 min Other 10%Other 10%

Rural O/D Models SuggestRural O/D Models Suggest
Metropolitan place bound residences take 25% less trips that Metropolitan place bound residences take 25% less trips that rural residences rural residences
Metropolitan residences spend 30% more time in private autos Metropolitan residences spend 30% more time in private autos than rural residences than rural residences
Rural and semi-rural residences within the CEA have the Rural and semi-rural residences within the CEA have the highest commuting times in the USA. The variables associated highest commuting times in the USA. The variables associated with this long commute are: with this long commute are:
Affordable housing Affordable housing Wage and job rates increase as the distance to metro Wage and job rates increase as the distance to metro
decreases decreases Specialization and variety of goods in shopping trips Specialization and variety of goods in shopping trips Recreational opportunitiesRecreational opportunities

Data SuggestsData Suggests
Rural travel distance to work appears to be Rural travel distance to work appears to be increasing as the proportion of shorter work trips has increasing as the proportion of shorter work trips has declined, while the proportion of longer work trips has declined, while the proportion of longer work trips has increased.increased.
In contrast, rural travel time, and travel distance for In contrast, rural travel time, and travel distance for workers living outside the metropolitan areas were workers living outside the metropolitan areas were much shorter than the national average for a majority much shorter than the national average for a majority of commuters. At the same time, a subset of workers of commuters. At the same time, a subset of workers in rural areas (18%) had the longest travel times in in rural areas (18%) had the longest travel times in the USA. These trips are set at 50 miles or morethe USA. These trips are set at 50 miles or more

Take Home QuestionsTake Home Questions
Is a good job something you must leave home to Is a good job something you must leave home to find?find?
Will rural commute time decrease with the advent of Will rural commute time decrease with the advent of tele-workers at home? tele-workers at home?
Does rural "compact community" promote lower Does rural "compact community" promote lower commuting times commuting times
Does an inter-modal form of commuting have any Does an inter-modal form of commuting have any hope of penetrating the rural market?hope of penetrating the rural market?

AND … Rural MigrationAND … Rural Migration
The objective of the study is to investigate the The objective of the study is to investigate the relationship between why persons move to relationship between why persons move to rural areas - and the characteristics of these rural areas - and the characteristics of these in-migrants. The study explores which in-migrants. The study explores which characteristics have the greatest influence of characteristics have the greatest influence of people's decisions to move and also reveals people's decisions to move and also reveals how the inter-relationship of these how the inter-relationship of these characteristics affect attitudes on mobility.characteristics affect attitudes on mobility.

Mobility (Migration)Mobility (Migration)
Voluntary Mobility Decisions Result Voluntary Mobility Decisions Result from:from:
PUSH - Perceived stress factors at PUSH - Perceived stress factors at the current location the current location
PULL - Realizing greater satisfaction PULL - Realizing greater satisfaction elsewhere elsewhere
BOTH - Combination of PUSH/PULLBOTH - Combination of PUSH/PULL

Determinants of MigrationDeterminants of Migration
Determinants of Migration (why people Determinants of Migration (why people move - generally)move - generally)
Base income Base income Perceived cost of living differentials Perceived cost of living differentials Employment opportunities Employment opportunities Education Education Age Age Local government services Local government services Quality of life factorsQuality of life factors

Post DeterminantsPost Determinants
Post Decision Determinants (Deciding where to Post Decision Determinants (Deciding where to move)move)
Proximity to a CEA Proximity to a CEA General economic conditions at destination General economic conditions at destination Proximity to close relatives Proximity to close relatives Proximity to quality of life and leisure factors Proximity to quality of life and leisure factors Cost of living Cost of living Safety Safety Quality of schools Quality of schools ClimateClimate

Economic/QOL FactorsEconomic/QOL Factors
Economic versus Quality of Life FactorsEconomic versus Quality of Life Factors Rural migration studies with relatively high Rural migration studies with relatively high
confidence levels indicate that there is an confidence levels indicate that there is an association between socio/econ status and a association between socio/econ status and a decision to relocate. Higher socio/econ status decision to relocate. Higher socio/econ status is associated with economic pull factors, while is associated with economic pull factors, while lower socio/econ status is associated with lower socio/econ status is associated with quality of life (push) factorsquality of life (push) factors

Educational FactorsEducational Factors
Current Study - Education FactorsCurrent Study - Education Factors Note: study confirms that metro to rural moves are Note: study confirms that metro to rural moves are
most common within the state of initial residence most common within the state of initial residence and less than 100 miles - thus, this gives strength and less than 100 miles - thus, this gives strength to the commuting hypothesis.to the commuting hypothesis.
Grade School 1.5%Grade School 1.5% Some High School 6.6Some High School 6.6 High School GED 39.5High School GED 39.5 Some College/Tech School 34.4Some College/Tech School 34.4 College/Tech School 17.5College/Tech School 17.5 Advanced Grad 10.6Advanced Grad 10.6 600 surveyed N = 569600 surveyed N = 569

Factors – Important + Very ImportantFactors – Important + Very Important
Ability to own home 1 (V. Important) 4 (both)Ability to own home 1 (V. Important) 4 (both) Housing Cost 2 2Housing Cost 2 2 Near friend/family 3 5Near friend/family 3 5 Quality of Schools 4 6Quality of Schools 4 6 Cost of living 5 3Cost of living 5 3 Job opportunity 6 9Job opportunity 6 9 Housing quality 7 1Housing quality 7 1 Distance to work 8 8Distance to work 8 8 Local taxes 9 7Local taxes 9 7 Cultural opportunities 10 10Cultural opportunities 10 10
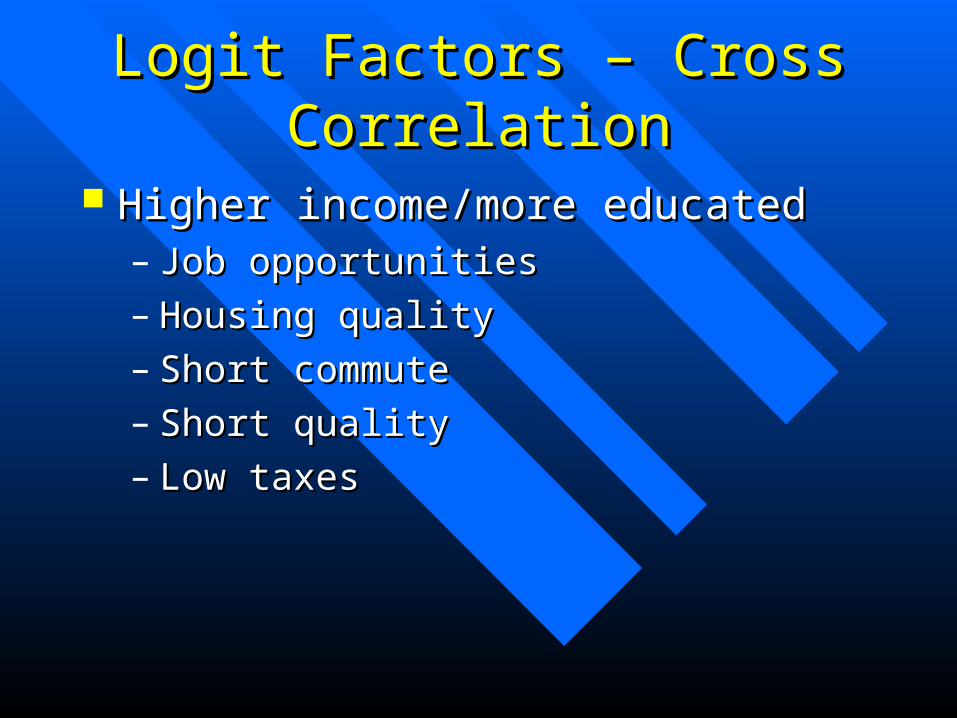
Logit Factors – Cross CorrelationLogit Factors – Cross Correlation
Higher income/more educatedHigher income/more educated– Job opportunities Job opportunities – Housing quality Housing quality – Short commute Short commute – Short quality Short quality – Low taxesLow taxes

Retired PersonsRetired Persons
Location near family and friends Location near family and friends Local taxesLocal taxes
Lower Income – Less EducatedLower Income – Less Educated Ability to Own HomeAbility to Own Home Cost of LivingCost of Living

Population ReboundPopulation Rebound
Currently, nonmetro areas are experiencing what some demographers Currently, nonmetro areas are experiencing what some demographers interpret as a population rebound, the first since the 1970's. Research interpret as a population rebound, the first since the 1970's. Research indicates that this trend is pervasive -indicates that this trend is pervasive - however, not to be however, not to be misinterpreted as a population boommisinterpreted as a population boom since nonmetro population in the since nonmetro population in the US only makes up 20.4% of the US population. Beale argues that the US only makes up 20.4% of the US population. Beale argues that the population increase has more to do with metro to nonmetro migration population increase has more to do with metro to nonmetro migration of domestic citizens than an international influx into theof domestic citizens than an international influx into the
nonmetro counties. Economic incentives or job opportunities provided nonmetro counties. Economic incentives or job opportunities provided by nonmetro areas in the early 1990's is a major factor to consider by nonmetro areas in the early 1990's is a major factor to consider when analyzing this demographic trend. However, job growth in the when analyzing this demographic trend. However, job growth in the nonmetro area has stabilized since July 1995 and demographers are nonmetro area has stabilized since July 1995 and demographers are patiently waiting to see if the current rebound will continue, stabilize, patiently waiting to see if the current rebound will continue, stabilize, or decline.or decline.

Population Rebound ExplainedPopulation Rebound Explained
1. All economic classes of counties have been affected by the nonzero 1. All economic classes of counties have been affected by the nonzero population rebound including farming, manufacturing and mining population rebound including farming, manufacturing and mining through an involvement of people.through an involvement of people.
2. The 562 nonmetro counties that experienced population decline 2. The 562 nonmetro counties that experienced population decline during this decade have experienced a slower rate of loseduring this decade have experienced a slower rate of lose than during than during the decade of the 80's.the decade of the 80's.
3. Rural counties experienced a 1.3 million population increase due to 3. Rural counties experienced a 1.3 million population increase due to inmigration (taking into consideration outmigration) of individuals inmigration (taking into consideration outmigration) of individuals from metro areas.from metro areas.
4. Components of change4. Components of change@ @ in population differ between metro and in population differ between metro and nonmetro areas. Metro growth=5.8%nonmetro areas. Metro growth=5.8%C C 75% rate of natural increase, 75% rate of natural increase, 25% migration, 30% internal exchange off-set by domestic 25% migration, 30% internal exchange off-set by domestic outmigrationoutmigration
2. Nonmetro growth=5.1%2. Nonmetro growth=5.1%C C 50% domestic inmigration, 40% rate of 50% domestic inmigration, 40% rate of natural increase, 10% international immigration.natural increase, 10% international immigration.

Boundary ChangesBoundary Changes
Discussion: Often times when an adjacent rural area experiences Discussion: Often times when an adjacent rural area experiences growth the adjoining city will annex the community into their city growth the adjoining city will annex the community into their city limits to broaden the tax base. Some argue that one reason limits to broaden the tax base. Some argue that one reason nonzero areas experienced decline in the 80's is because a large nonzero areas experienced decline in the 80's is because a large proportion of nonzero areas that experienced growth in the 70's proportion of nonzero areas that experienced growth in the 70's became annexed. Thus, smaller nonmetro areas were left to became annexed. Thus, smaller nonmetro areas were left to restructure their economies to provide services once provided by restructure their economies to provide services once provided by the newly annexed areas. In the early 90's job growth was the newly annexed areas. In the early 90's job growth was pervasive however, now we see that phenomena once again pervasive however, now we see that phenomena once again stabilizing as metro economic revitalization is complete. Do youstabilizing as metro economic revitalization is complete. Do you
think its possible that in the new millennium we may see some of think its possible that in the new millennium we may see some of the nonmetro areas experiencing the current rebound to be the nonmetro areas experiencing the current rebound to be swallowed by adjacent metro cities in the wake of their economic swallowed by adjacent metro cities in the wake of their economic rebound?rebound?

Growing Rural CountiesGrowing Rural Counties
1/4 of the nonmetro counties experiencing growth account for 3/4 of 1/4 of the nonmetro counties experiencing growth account for 3/4 of all population growth in nonmetro areas.all population growth in nonmetro areas.
Where are they?-- Majority found in the West (avg growth= 11.8%)Where are they?-- Majority found in the West (avg growth= 11.8%) The majority are found in the mountains and plateaus extending from The majority are found in the mountains and plateaus extending from
the Rockies to the Mexico border. Ozarks, upper Midwest lake the Rockies to the Mexico border. Ozarks, upper Midwest lake country, Florida, Blue Ridge Mountains, and outskirts of a thriving country, Florida, Blue Ridge Mountains, and outskirts of a thriving metro areametro area
3. Types of Counties:3. Types of Counties: 1. Retirement amenities (accounting for 46% of all nonmetro growth) 1. Retirement amenities (accounting for 46% of all nonmetro growth)
however, growth is also attributed to young and middle aged since however, growth is also attributed to young and middle aged since these amenities also attract these age groupsthese amenities also attract these age groups
2. Middle range growth (national avg of 5.6%) is 2. Middle range growth (national avg of 5.6%) is 2 2 of nonzero of nonzero counties and have mixed economiccounties and have mixed economic nonspecialized, manufacturing, nonspecialized, manufacturing, government, and othersgovernment, and others

Rural Areas Not AffectedRural Areas Not Affected
25% of all nonzero counties experiencing decline in the 25% of all nonzero counties experiencing decline in the 90's did so at a slower rate than in the 80's.90's did so at a slower rate than in the 80's.
Avg population was 13,000 Avg population was 13,000 C C Avg population of Avg population of rebounding areas 25,000rebounding areas 25,000
1990-1995 only 1/7 of all counties experienced consistent 1990-1995 only 1/7 of all counties experienced consistent population decline.population decline.
located in the Great Plains and Corn Belt (growth peaked located in the Great Plains and Corn Belt (growth peaked at only 2% and is attributed to deaths over births not out-at only 2% and is attributed to deaths over births not out-migration), Mississippi Delta, mining towns migration), Mississippi Delta, mining towns C C decline due decline due to more deaths than births.to more deaths than births.