Interprocedural Path Profiling and the Interprocedural Express-Lane Transformation

RUNTIME TECHNIQUES AND INTERPROCEDURAL ANALYSIS
IN JAVA VIRTUAL MACHINES
by
Feng Qian
School of Computer Science
McGill University, Montreal
March 2005
A thesis submitted to McGill University
in partial fulfillment of the requirements of the degree of
Doctor of Philosophy
Copyright c© 2005 by Feng Qian

Abstract
Java programs are deployed in a bytecode format that is executed by a Java Vir-
tual Machine (JVM). JVM performance is determined by several major components:
execution engine, garbage collector, and threading system. In this thesis, we study
a new garbage collection scheme and speculative optimizations in just-in-time (JIT)
compilers for improving Java performance.
We present a novel approach for reducing garbage collection frequencies. Without
an escape analysis, the system uses write barriers to capture escaping objects and
allocation sites. Instead of allocating non-escaping objects on stacks, the system
allocates them in regions that are treated as extensions of stack frames. By freeing
regions with associated stack frames, the system can reduce the frequency of garbage
collections. We present the overall idea and provide details of a specific design and
implementation.
A JVM allows dynamic class loading. A JIT compiler can speculatively optimize
code base on loaded classes only. However, the virtual machine must revert specu-
latively optimized code if newly loaded classes invalidates optimization assumptions.
In this thesis, we review existing techniques supporting speculative optimizations,
including runtime guards, code patching, and on-stack replacement. We present an
improvement and implementation of an on-stack replacement mechanism.
A call graph is necessary for developing interprocedural program analyses. Call
graph construction in a Java virtual machine needs to overcome difficulties of dynamic
class loading and lazy reference resolution. In this thesis, we show a general approach
to adapt static type analysis to a JIT environment for building call graphs. We also
introduce a new call graph profiling mechanism using code stubs.
i

We developed a general type analysis framework for supporting speculative method
inlining in a JIT environment. Several popular type analyses were implemented in the
framework, including two interprocedural ones, XTA and VTA. Using the framework,
we did an extensive limit study of method inlining and reported our findings and
experience in the thesis.
In each chapter we discuss the related work. At the end of the thesis, we point
out future research directions.
ii

Resume
French abstract goes here.
iii

Acknowledgement
Undoubtedly, it is not possible to finish this thesis without supports from many
people. I am glad to have a chance to think them all.
My sincere thanks go to my adviser, Laurie Hendren, for her patient guidance,
enthusiastic supervision, and generous financial support. She is not only an excellent
technical advisor, but also a demonstrator of performing outstanding research. I also
like to thank other professors of SOCS who either offered great courses or served in
my thesis committee: Clark Verbrugge, Hans Vangheluwe, Karel Driesen, Prakash
Panangaden, and Doina Precup.
Sable laboratory is a fun place to work on. Dr. Etienne Gagnon explained to me
his Ph.D student experience. Talks with Jerome Miecznikowski and John Jorgensen
were always enlightening. More recently, I had an inspiring office-mate, Ondrej Lha-
tok, to talk about both research and life.
I also appreciated guidance and help given to me by Dr. Stephen Fink and Dr.
Michael Hind from IBM T.J Watson. They showed me what a world-class industrial
research lab is when I was a summer intern there. IBM Jikes RVM team also provided
an excellent research infrastructure, on which most of this thesis work was built.
I gratefully thank my wife, Beibei Zou, for her support, encouragement, and
understanding in the 5-years journey. Whenever I was frustrated, she always pointed
me to the positive side. I am indebted to my parents and my uncle who inspired my
interests in science and technology when I was a kid.
Last but not least thanks to SOCS and NSERC for providing scholarships during
my graduate study.
iv

Contents
Abstract i
Resume iii
Acknowledgement iv
Contents v
List of Figures ix
List of Tables xi
1 Introduction 1
1.1 The Java programming langauge and the Java virtual machine . . . . 1
1.2 Motivation . . . . . . . . . . . . . . . . . . . . . . . . . . . . . . . . . 6
1.2.1 Automatic memory management . . . . . . . . . . . . . . . . 6
1.2.2 JIT compilation and optimizations . . . . . . . . . . . . . . . 7
1.3 Contributions . . . . . . . . . . . . . . . . . . . . . . . . . . . . . . . 9
1.4 Thesis outline . . . . . . . . . . . . . . . . . . . . . . . . . . . . . . . 10
2 Setting 12
2.1 Jikes Research Virtual Machine (RVM) . . . . . . . . . . . . . . . . . 12
2.1.1 Compilers . . . . . . . . . . . . . . . . . . . . . . . . . . . . . 13
2.1.2 Experimental approach . . . . . . . . . . . . . . . . . . . . . . 17
2.2 Benchmarks . . . . . . . . . . . . . . . . . . . . . . . . . . . . . . . . 18
v

3 Region-Based Allocator 20
3.1 Overview . . . . . . . . . . . . . . . . . . . . . . . . . . . . . . . . . . 21
3.2 Allocator . . . . . . . . . . . . . . . . . . . . . . . . . . . . . . . . . . 23
3.2.1 Heap organization . . . . . . . . . . . . . . . . . . . . . . . . . 23
3.2.2 Services . . . . . . . . . . . . . . . . . . . . . . . . . . . . . . 24
3.3 Adaptive VM . . . . . . . . . . . . . . . . . . . . . . . . . . . . . . . 26
3.4 Collector . . . . . . . . . . . . . . . . . . . . . . . . . . . . . . . . . . 32
3.5 Results . . . . . . . . . . . . . . . . . . . . . . . . . . . . . . . . . . . 32
3.5.1 Benchmarks . . . . . . . . . . . . . . . . . . . . . . . . . . . . 33
3.5.2 Choice of page size . . . . . . . . . . . . . . . . . . . . . . . . 34
3.5.3 Region-reclaimed space . . . . . . . . . . . . . . . . . . . . . . 36
3.5.4 Write barrier behaviors . . . . . . . . . . . . . . . . . . . . . . 39
3.5.5 Impact on thin locks . . . . . . . . . . . . . . . . . . . . . . . 41
3.5.6 Effectiveness of adapting . . . . . . . . . . . . . . . . . . . . 41
3.5.7 Summary . . . . . . . . . . . . . . . . . . . . . . . . . . . . . 45
3.6 Related work . . . . . . . . . . . . . . . . . . . . . . . . . . . . . . . 45
3.7 Conclusions . . . . . . . . . . . . . . . . . . . . . . . . . . . . . . . . 47
4 Runtime Techniques Supporting Speculative Optimizations 49
4.1 Speculative inlining . . . . . . . . . . . . . . . . . . . . . . . . . . . . 50
4.2 Class and method tests . . . . . . . . . . . . . . . . . . . . . . . . . . 51
4.2.1 Guarded inlining using class and method tests . . . . . . . . . 51
4.2.2 Direct inlining using preexistance analysis . . . . . . . . . . . 53
4.3 Code patching and on-stack replacement . . . . . . . . . . . . . . . . 54
4.3.1 Code patching . . . . . . . . . . . . . . . . . . . . . . . . . . . 54
4.3.2 On-stack replacement . . . . . . . . . . . . . . . . . . . . . . . 55
4.4 Improvement and implementation of on-stack replacement in Jikes RVM 61
4.4.1 Transition to de-inlined code . . . . . . . . . . . . . . . . . . . 61
4.4.2 Implementation . . . . . . . . . . . . . . . . . . . . . . . . . . 62
4.5 Related work and discussion . . . . . . . . . . . . . . . . . . . . . . . 65
vi

5 Online Call Graph Construction 67
5.1 Motivation . . . . . . . . . . . . . . . . . . . . . . . . . . . . . . . . . 67
5.2 Static call graph construction for OO programs . . . . . . . . . . . . 70
5.2.1 Class hierarchy analysis and rapid type analysis . . . . . . . . 71
5.2.2 Reachability-based interprocedural type analysis . . . . . . . . 71
5.3 Runtime call graph construction using type analyses . . . . . . . . . . 72
5.3.1 Dynamic CHA and RTA for call graph construction . . . . . . 73
5.3.2 Instantiation-based type analysis . . . . . . . . . . . . . . . . 75
5.3.3 Characteristics of dynamic CHA, RTA, and ITA . . . . . . . . 77
5.3.4 Evaluation . . . . . . . . . . . . . . . . . . . . . . . . . . . . . 78
5.4 Accurate call graph construction using profiling code stubs . . . . . . 82
5.4.1 Background: virtual method table . . . . . . . . . . . . . . . 83
5.4.2 Call graph construction by profiling . . . . . . . . . . . . . . . 85
5.4.3 Optimizations . . . . . . . . . . . . . . . . . . . . . . . . . . . 91
5.4.4 Evaluation . . . . . . . . . . . . . . . . . . . . . . . . . . . . . 94
5.5 Related work . . . . . . . . . . . . . . . . . . . . . . . . . . . . . . . 101
6 Online Interprocedural Type Analysis and Method Inlining 103
6.1 Introduction . . . . . . . . . . . . . . . . . . . . . . . . . . . . . . . . 104
6.2 A type analysis framework for method inlining . . . . . . . . . . . . . 106
6.2.1 Framework structure . . . . . . . . . . . . . . . . . . . . . . . 107
6.2.2 A limit study of method inlining using dynamic type analyses 109
6.3 Dynamic reachability-based type analysis . . . . . . . . . . . . . . . . 115
6.4 Related work . . . . . . . . . . . . . . . . . . . . . . . . . . . . . . . 122
6.5 Discussion . . . . . . . . . . . . . . . . . . . . . . . . . . . . . . . . . 122
7 Conclusions and Future Work 127
7.1 Conclusions . . . . . . . . . . . . . . . . . . . . . . . . . . . . . . . . 127
7.2 Future work . . . . . . . . . . . . . . . . . . . . . . . . . . . . . . . . 129
7.2.1 Dynamic interprocedural analyses and speculative optimizations 129
7.2.2 Online escape analysis . . . . . . . . . . . . . . . . . . . . . . 129
vii

7.2.3 Improve the efficiency of on-stack-replacement . . . . . . . . . 130
A Dynamic metrics of benchmarks 141
viii

List of Figures
1.1 Partial contents of Helloworld.class . . . . . . . . . . . . . . . . . 4
2.1 Class and object layout in Jikes RVM . . . . . . . . . . . . . . . . . 15
3.1 Memory organization of page-based heaps with regions . . . . . . . . 21
3.2 Services for regions . . . . . . . . . . . . . . . . . . . . . . . . . . . . 25
3.3 Services for barriers . . . . . . . . . . . . . . . . . . . . . . . . . . . . 27
3.4 Allocating spaces . . . . . . . . . . . . . . . . . . . . . . . . . . . . . 28
3.5 Sharing bits with thin locks . . . . . . . . . . . . . . . . . . . . . . . 30
3.6 Local region behaviors . . . . . . . . . . . . . . . . . . . . . . . . . . 38
3.7 Clean regions released . . . . . . . . . . . . . . . . . . . . . . . . . . 43
4.1 An inlining example . . . . . . . . . . . . . . . . . . . . . . . . . . . 51
4.2 Code patching example . . . . . . . . . . . . . . . . . . . . . . . . . . 56
4.3 On-stack replacement example . . . . . . . . . . . . . . . . . . . . . . 58
4.4 Example of Fink’s OSR approach . . . . . . . . . . . . . . . . . . . . 60
4.5 De-inlining example . . . . . . . . . . . . . . . . . . . . . . . . . . . . 63
5.1 Call graphs with different context-sensitivity . . . . . . . . . . . . . . 69
5.2 TIB in Jikes RVM . . . . . . . . . . . . . . . . . . . . . . . . . . . . 84
5.3 VMT in Jikes RVM . . . . . . . . . . . . . . . . . . . . . . . . . . . . 84
5.4 Extended VMT for profiling call graph . . . . . . . . . . . . . . . . . 86
5.5 Example of allocating CTB indexes . . . . . . . . . . . . . . . . . . . 87
5.6 Inlining 1 element of CTB . . . . . . . . . . . . . . . . . . . . . . . . 93
5.7 GC time when running 213 javac . . . . . . . . . . . . . . . . . . . . 97
ix

5.8 Growth of call graph at runtime ( 213 javac) . . . . . . . . . . . . . . 99
6.1 TypeAnalaysis interface . . . . . . . . . . . . . . . . . . . . . . . . . 108
6.2 Type analysis framework diagram . . . . . . . . . . . . . . . . . . . . 109
6.3 Model of VTA events . . . . . . . . . . . . . . . . . . . . . . . . . . . 117
6.4 GC behaviors affected by VTA ( 213 javac) . . . . . . . . . . . . . . 120
6.5 An example where inlining can reduce optimization opportunities . . 124
x

List of Tables
2.1 Introduction of SpecJVM98 benchmarks . . . . . . . . . . . . . . . . 19
3.1 Allocation sites . . . . . . . . . . . . . . . . . . . . . . . . . . . . . . 34
3.2 Effect of page size on # of collections and froth . . . . . . . . . . . . 35
3.3 Allocation behaviors . . . . . . . . . . . . . . . . . . . . . . . . . . . 37
3.4 Write barrier behaviorss . . . . . . . . . . . . . . . . . . . . . . . . . 40
3.5 Impact on thin locks . . . . . . . . . . . . . . . . . . . . . . . . . . . 41
3.6 Effect of Adaption . . . . . . . . . . . . . . . . . . . . . . . . . . . . 44
5.1 The number of scalar allocations with checks . . . . . . . . . . . . . . 77
5.2 Statistics of initialized types(P), rapid types(P) and instantiated types(P) 78
5.3 Call graph size of bootimage classes only . . . . . . . . . . . . . . . . 79
5.4 ( 213 javac) call graph size when including bootimage classes . . . . . 80
5.5 Call graph size comparison of dynamic CHA, RTA, and ITA (applica-
tion and libraries) . . . . . . . . . . . . . . . . . . . . . . . . . . . . . 81
5.6 Overhead of profiling interface calls (best of 10 runs) . . . . . . . . . 89
5.7 Call edges from invokeinterface by ITA and profiling . . . . . . . . . 90
5.8 Call edges for non-virtual calls by ITA and profiling . . . . . . . . . . 91
5.9 Call edges due to inlined methods . . . . . . . . . . . . . . . . . . . . 92
5.10 Distribution of CTB sizes ( 213 javac) . . . . . . . . . . . . . . . . . 92
5.11 Bootimage sizes and allocated CTB sizes of 213 javac . . . . . . . . 96
5.12 Eliminated CTB loads by different inlining CTB sizes . . . . . . . . . 98
5.13 Call graph comparison of CHA and profiling (application and library) 100
xi
6.1 Coverage of the hottest call sites . . . . . . . . . . . . . . . . . . . . . 111
6.2 Limit study of method inlining using type analyses . . . . . . . . . . 113
6.3 Comparison of VTA and IdealTypeAnalysis for inlining interface calls 119
6.4 VTA graph sizes . . . . . . . . . . . . . . . . . . . . . . . . . . . . . 119
6.5 Performance comparison using a copying mark-sweep collector . . . . 121
6.6 Performance comparison using a generational mark-sweep collector . . 121
A.1 Selected dynamic metrics of benchmarks . . . . . . . . . . . . . . . . 142
xii

Chapter 1
Introduction
The Java programming language gains popularity in many application domains.
Java’s execution model is different from many static compiled languages such as
Fortran and C/C++. The Just-In-Time (JIT) compilation approach deployed by
Java virtual machines (JVMs) creates a new scenario for language implementation
and compiler optimizations.
In this thesis, we study both challenges and opportunities of program analyses and
compiler optimizations in Java virtual machines. The main contents of this thesis in-
clude a new garbage collection scheme using dynamic techniques and interprocedural
program analyses in the presence of dynamic class loading and lazy method com-
pilation. Dynamic analyses are designed to support speculative optimizations for
best performance results. The problems and solutions can also be applied to virtual
machines for other languages such as C#.
1.1 The Java programming langauge and the Java vir-
tual machine
Since it was born as a programming language for small devices, the Java program-
ming language [AGH00] has become a mainstream programming language in many
domains, such as web and e-business application development, transaction server
1

implementation, scientific computation, etc. Java1 is designed as a high-level object-
oriented language with safety features. Type checking is required at both compilation
time and execution time. Null pointer accesses and array bounds overflows must be
captured and reported to applications. Garbage collection is the default memory
management, which frees programmers from freeing objects manually and reduces
the chances of human mistakes. Other desirable features include multi-threading and
large common libraries.
The Java virtual machine (JVM) specification [LY96] is designed to support the
Java programming language, but it does not interact with the source language directly.
As indicated by its name, the Java virtual machine is an abstract machine which
defines an instruction set, bytecodes, and other resources.
It is necessary to introduce the structure of the Java virtual machine before ex-
amining the technical details of its implementation. A Java thread is conceptually
similar to an operating system thread. Execution in a thread is sequential, but mul-
tiple threads can execute in parallel. Each thread has its own program counter and
private stack. The heap is a shared data area among all Java threads. Objects and
arrays are allocated in the heap and reclaimed by garbage collectors.
The implementation of the Java virtual machine specification is architecture-
dependent. It can be a piece of software [Gri98, jikb, sab, kaf] written in other
languages, such as assembly, C, or even Java itself, or implemented as hardware
CPUs [aji, jav]. The software approach is more prominent in practice. A software
virtual machine contains a runtime system that supports threading, garbage collec-
tion, networking, IO support, etc. The bytecode instructions can be interpreted. An
alternative is to compile the bytecode to native code and execute the native code.
Often the latter approach is called Just-In-Time (JIT) compilation. Note that the
JVM specification supports classes from languages other than Java if the classes obey
the specification.
Java applications are compiled to and distributed in a compact, platform-neutral
representation, the class file format. The class file format is the binary format
1We refer to the Java programming language as Java, and the Java virtual machine as JVM inthis thesis.
2

accepted by Java virtual machines. Each class file has a constant pool which con-
tains symbolic names of types, methods, and fields accessed by bytecode instructions
of methods in this class. Bytecode instructions are stack-based. We use a simple
example, Helloworld.java, to facilitate the understanding of the class file format.
1: public class Helloworld {
2: public static void main(String[] args) {
3: System.out.println(‘‘Hello world!’’);
4: }
5: }
The Helloworld.java is compiled to a binary class file “Helloworld.class” by
a Java-to-bytecode compiler such as javac, jikes [jika], or soot [soo]. Figure 1.1
are partial contents of the class file, disassembled by the command line “javap -v
Helloworld”. At the bytecode index 5 of the main method is an “invokevirtual
#4” instruction, which corresponds to the invocation of “println” method at line 3 in
the source code. Note that the number “#4” in the bytecode instruction is an index of
the constant pool of Helloworld.class. Further, the #4 entry of the constant pool is
comprised by entries #19 and #20. Recursively tracing down, the #4 entry represents
a method signature “java/io/PrintStream.println(Ljava/lang/String;)V”.
From above example, we see that bytecode instructions access types, methods and
fields by their symbolic names. The virtual machine is responsible for resolving these
names to concrete classes, methods or fields at runtime.
The Java virtual machine supports two kinds of types: primitive types and ref-
erence types. Primitive types include integral types and float types. Reference type
variables are pointers to objects or arrays. A bytecode instruction explicitly distin-
guishes the types of values it operates on. For example, an aload instruction copies
an object reference from a variable to the stack, and an integer value is loaded by
an iload instruction. Although the class file does not contain declaring types of lo-
cal variables, the virtual machine can reconstruct static types for variables using the
type information contained in bytecode instructions. Rich type information in byte-
codes is not only necessary for type checking, but also very useful for efficient garbage
collections and compiler optimizations.
3

public class Helloworld extends java.lang.Object
Constant pool:
const #2 = Field #16.#17;
const #3 = String #18;
const #4 = Method #19.#20;
const #16 = class #23;
const #17 = NameAndType #24:#25;
const #18 = Asciz Hello world!;
const #19 = class #26;
const #20 = NameAndType #27:#28;
const #23 = Asciz java/lang/System;
const #24 = Asciz out;
const #25 = Asciz Ljava/io/PrintStream;;
const #26 = Asciz java/io/PrintStream;
const #27 = Asciz println;
const #28 = Asciz (Ljava/lang/String;)V;
public static void main(java.lang.String[]);
Code:
Stack=2, Locals=1, Args_size=1
0: getstatic #2;
3: ldc #3;
5: invokevirtual #4;
8: return
LineNumberTable:
line 3: 0
line 4: 8
Figure 1.1: Partial contents of Helloworld.class
4

The execution of a Java application starts at a special method public void
main(String[]) of a class whose name is supplied by the command line. Before
using a class (e.g., creating instances, accessing members, etc.), the virtual machine
must load the class and create an internal representation for it. The process involves
several steps:
Loading. The class loading process finds the binary representation of the class.
The binary can come from various sources, depending on the class loader used.
Then the virtual machine parses the representation according to the class
file format. This process also checks some constraints required by the virtual
machine specification. If the class can be loaded, and it has a direct superclass
or super interface, the symbolic references to them must be resolved. This
resolution triggers the loading of the superclass or super interface if necessary.
Linking. The linking process verifies the representation is well formed. The virtual
machine may use some data-flow analyses to verify that bytecode instructions
satisfy some semantic requirements. Then the virtual machine creates necessary
internal data structures, such as type information and method tables, as the in-
ternal representation of the class. There are several kinds of symbolic references
in the constant pool. In particular, we are interested in type, method, and field
references. Resolving a symbolic reference may cause other classes to be loaded.
The Java virtual machine specification does not require symbolic references to
be resolved at linking time. Instead, many VM implementations choose the lazi-
est strategy for saving resources and improving responsiveness. By the laziest
strategy, symbolic references are not resolved until used. Thus, dynamic class
loading can be triggered by the execution of instructions for object creation,
method invocation, field accesses and type checking.
Initialization. The initialization process executes the static initializer method
“<clinit>” and initializes static fields of the class. It may trigger the ini-
tialization of its superclass and super interfaces.
A class may contain several methods. An abstract method has only a name,
5

parameter and return types. A normal method has an array of bytecode instructions.
The invocation of a normal method requires its bytecode instructions to be parsed
or compiled first. The compilation of bytecode instructions does not need to be done
when loading and resolving the class. Instead, to save the workload and resources, a
virtual machine can delay the process until the first invocation of the method during
the execution. This technique is typically called lazy method compilation.
The Java programming language provides constructs for creating objects in heaps,
but there are no constructs for deallocating objects. Heaps are managed by automatic
memory managers, such as garbage collectors. The Java virtual machine specification
has no specific requirements on choosing which garbage collection algorithm to use.
1.2 Motivation
Two features distinguish Java from other languages: automatic memory management
(garbage collection) and Just-In-Time (JIT) compilation. Program analyses have
been used in nearly every compiler for optimizations. Previous research on program
analysis mainly focused on ahead-of-time compilers. JIT compilation mode presents a
different scenario for program analysis designers. In this thesis, we refer to a program
analysis performed in an ahead-of-time compiler as static, and the one in a JIT
compiler as dynamic.
1.2.1 Automatic memory management
The Java virtual machine implicitly uses garbage collectors as default memory man-
agers. Garbage collection [JL96] has the advantage of freeing memory safely and
often precisely. However, tracing and collecting objects consumes many machine cy-
cles during the program execution, so reducing the frequency of garbage collection
can be beneficial.
Stack-allocation of objects is one promising approach to reduce the work of a
garbage collector [GS00]. If an object does not escape a method, it can be created
on a stack frame instead of in a heap. Objects on the stack can be reclaimed without
6

intervention by the garbage collector. However, there are several potential obstacles
to performing object stack-allocation in the Java virtual machine: existing techniques
require static escape information, there are restrictions on objects that can be allo-
cated on stack, and finalize methods have to be handled specially. This motivates us
to design a new object allocator reducing garbage collection overhead without above
restrictions in Java virtual machines.
In our initial design, we use runtime checks to detect escaping objects. Heap
organization must be changed to facilitate new allocation scheme. This approach
allows us to study benchmark behaviors using the new allocator. It also gives us
an indication how to design a runtime escape analysis for eliminating unnecessary
checks.
1.2.2 JIT compilation and optimizations
Over the last 10 years, virtual machine technology has greatly advanced. Most Java
virtual machines running on desktop or server computers have built-in Just-in-time
compilers, which obtain 10 fold or more performance improvement than an inter-
preter. Most intraprocedural data-flow analyses have been implemented in these
JIT compilers [PVC01, AAB+00, SOT+00, CLS00, GKS+04]. Further performance
improvements have been achieved using adaptive and feedback-directed optimiza-
tions [AFG+00, AHR02]. To improve startup performance, a mixed mode of inter-
pretation and JIT compilation is often used to interpret a method first and only
selectively compile hot methods [PVC01,AAB+00].
Methods are commonly used as compilation units. Not only do methods provide
a natural semantic boundary of code blocks, but also the implementation of dynamic
compilation becomes easier in the presence of virtual method calls. State-of-the-art
JIT compilers have implemented most intraprocedural (within a method) analyses
and optimizations as in ahead-of-time (static) compilers. Dynamic interprocedural
(over a collection of methods) analyses, however, have not yet been widely adopted.
Very few coarse type-based interprocedural analyses (IPAs) [IKY+00, PS01] have
gained ground in JIT compilation environments. However, work relating to more
7

complicated, reachability-based IPAs, such as dynamic points-to analysis and escape
analysis, is only just starting to emerge [HDH04,QH04,QH05].
Static IPAs assume that the whole program is available at analysis time. However,
this may not be the case in a Java virtual machine. The virtual machine can download
a class file from the network, create it on-the-fly, or retrieve it from other unknown
resources. Even when all programs exist on local disks, the virtual machine typically
loads classes lazily, on demand, to reduce resource usage and improve responsive-
ness [LB98]. When a JIT compiler encounters an unresolved symbolic reference, it
may choose to delay resolution until the instruction is executed at runtime. These
unresolved references has to be dealt with correctly by dynamic IPAs.
Although Java’s dynamic features pose difficulties for program analyses and op-
timizations, there are many opportunities at runtime that can only be enjoyed by
dynamic analyses. For example, a dynamic IPA only needs to analyze loaded classes
and invoked methods. Therefore, the analysis can be more efficient and the results
are more precise comparing to a static analysis which must analyze programs based
on conservative assumptions about which classes might be loaded and which methods
might be invoked. Thus, a dynamic IPA’s analyzed code base can be much smaller
than in a conservative static analysis. Further, dynamic class loading can improve
the precision of type analyses. The set of runtime types can be limited to loaded
classes. Thus, a dynamic analysis has more precise type information than its static
counterpart. In contrast to the conservative (pessimistic) nature of static analysis, a
dynamic one can be optimistic about future execution, if used in conjunction with
runtime invalidation mechanisms [PS01, IKY+00,FQ03,SYN03a].
Dynamic IPAs seem more suitable for long-running applications in adaptive re-
compilation systems. Pechtchanski and Sarkar [PS01] described a general approach of
using dynamic IPAs. A virtual machine gathers information about compiled methods
and loaded classes in the initial state, and performs recompilation and optimizations
only on selected hot methods. When the application reaches a “stable state”, infor-
mation changes should be rare.
In summary, the development of more advanced interprocedural analyses in JIT
environments has not been widely explored and practiced. The differences between
8

static and dynamic interprocedural analyses are:
1. a static analysis has the full program available to the analysis whereas a dynamic
one only has seen the executed part;
2. a dynamic analysis has much tighter limitations on space and time resources,
but a static analysis is more flexible in general; and
3. a static analysis has to be conservative, but a dynamic one can be speculatively
optimistic if the system has the ability to invalidate the code or execution states
when optimistic assumptions are violated.
One goal of this thesis is to design advanced dynamic interprocedural analysis at
runtime for improving Java performance in the full context of the Java virtual machine
specification. We also study techniques for supporting speculative optimizations using
interprocedural analysis results.
1.3 Contributions
This thesis made following contributions to the virtual machine research area:
Region-based allocator. Without an effective online escape analysis, the effect
of object stack-allocation is limited in Java virtual machines. Instead, we sug-
gested an adaptive region-based allocator in Chapter 3. Our approach uses
dynamic write barriers to detect escaping objects. By extending a stack frame
with a region, other restrictions of object stack-allocation are removed. We had
implemented an prototype in an early version of Jikes RVM, and we studied
detailed behaviors of the allocator.
Improvement and implementation of an on-stack replacement algorithm.
Speculative optimizations may yield better performance improvement than con-
servative optimizations. To support speculative optimizations, a Java virtual
machine needs invalidation mechanisms as backups for correcting wrong specu-
lations. In Chapter 4, we reviewed several existing invalidation techniques and
9

presented an improvement and implementation of a new on-stack-replacement
mechanism [FW00] in Jikes RVM.
Efficient call graph construction in the presence of dynamic class loading
and lazy compilation. Interprocedural analysis needs a call graph of the
program. In Chapter 5, we studied call graph constructions in Java virtual
machines. We demonstrated a general approach for handling dynamic class
loading in a dynamic program analysis. We did a detailed comparison study
of several well-known type analyses for constructing call graphs. Furthermore,
we designed and evaluated a novel mechanism [QH04] for constructing accurate
call graphs with cheap cost. All mechanisms have been implemented in Jikes
RVM and evaluated on a set of standard Java benchmarks.
Dynamic interprocedural type analyses and method inlining. We conducted
a thorough study of speculative method inlining in Chapter 6. First, we pre-
sented a limit study of method inlining using type analyses. We analyzed the
strength and weakness of each analysis. Using runtime call graphs, we devel-
oped two advanced interprocedural type analyses in a JIT environment. We
showed an incremental, event-driven model of dynamic interprocedural analysis
which handles dynamic class loading and lazy reference resolution properly. We
also pointed out strength and weakness of simple class hierarchy analysis and
dynamic interprocedural type analysis.
1.4 Thesis outline
First, in Chapter 2, we briefly introduce Jikes RVM, the test bed of our implemen-
tations and benchmarks used in this thesis. Chapter 3 introduces the design and
evaluation of a region-based allocator. We review runtime techniques supporting
speculative inlining in Chapter 4. Improvement and implementation of an on-stack
replacement algorithm is presented in this chapter as well. We study different dynamic
call graph construction algorithms in Chapter 5, which includes several dynamic type
analyses and a new profiling mechanism. Chapter 6 studies method inlining using
10

type analysis. This chapter also presents the design and evaluation of a reachability-
based interprocedural type analysis as an application of dynamic call graphs. Finally
conclusions and future work are given in Chapter 7.
11

Chapter 2
Setting
A programming language requires an efficient implementation to prove it is useful.
Java’s inventor, Sun Microsystem, encourages the model of open design and private
implementation of the Java virtual machine specification [LY96]. There is a variety
of Java implementations accessible. We chose an open source virtual machine, Jikes
RVM [jikb], as our test bed for its maturity and active support. The Jikes RVM
implementation includes an efficient runtime system, a simple baseline compiler and
an advanced optimizing compiler, a collection of GC implementations, and rich doc-
umentation.
2.1 Jikes Research Virtual Machine (RVM)
Jikes RVM [AAB+00, jikb] is an open-source (under IBM’s Public Licence [CPL])
research virtual machine for executing Java bytecodes. Jikes RVM implements most
of the Java virtual machine specification, and can run a variety of Java benchmarks.
Jikes RVM itself is mostly written in Java, including compilers, runtime system, and
garbage collectors. RVM classes are in a special package com.ibm.JikesRVM. Jikes
RVM uses a public class library GNU classpath [cla], which is independent of virtual
machines (a virtual machine needs to provide a small number of proxy classes in order
to use the library). The bootstrap code and low-level signal handling functions are
written in C. Jikes RVM currently supports four OS/architectures: AIX/PowerPC,
12

Linux/x86, Linux/PowerPC, and Mac OS X. Because of its openness, maturity, and
active support, Jikes RVM is an ideal test bed for experimenting new VM technologies.
2.1.1 Compilers
Jikes RVM provides two compilers, a baseline compiler and an optimizing compiler.
It uses a compile-only approach where bytecode instructions are compiled to native
code before execution. The baseline compiler has some common aspects to a bytecode
interpreter: fast compilation and low performance. It generates machine code quickly
in a single pass, but the code quality is relatively poor. In fact, the baseline compiled
code simulates the stack architecture outlined in the specification [LY96].
The optimizing compiler performs both static data-flow analyses and feed-back
directed optimizations on compiled methods. Optimized code is as efficient as those
produced by industrial JIT compilers such as Sun’s HotSpot server compiler [PVC01]
and IBM’s product JIT compiler [SOT+00].
The bootstrapping process of Jikes RVM includes compiling RVM source code
(in Java) to standard Java class files using the jikes 1 compiler. A bootimage is a
binary executable which contains the baseline compiler, a system class loader, garbage
collectors, and optionally other components. Chosen components build a list of class
files to be initialized and compiled by a bootimage writer tool (written in Java) on
a host Java virtual machine. Objects on the host VM are converted to RVM objects
and methods in the bootimage classes are pre-compiled to machine code by RVM
compilers. RVM classes, objects, and machine code are written into the bootimage.
With some C and assembly code, the bootimage writer builds a binary executable
bootimage of Jikes RVM which can run Java applications as other virtual machines.
When executing an application, the bootimage loads itself entirely into the heap
and executes some initialization code. Then it parses the command line and finds
the main class of the application. A main thread is created for the application and
public static void main(String[]) method of the main class is invoked. The
bootimage also creates several system threads for garbage collectors, recompilation
1Jikes [jika] is a Java-to-bytecode compiler, and Jikes RVM is a Java virtual machine.
13

system, adaptive controller, debugger, etc. After the main thread terminates, RVM
unloads resources and shuts down itself.
The Jikes RVM web site [jikb] has considerable information about the design and
implementation of the system. In this part of the thesis, we introduce some technolo-
gies used in the virtual machine, which are highly related to our thesis contents.
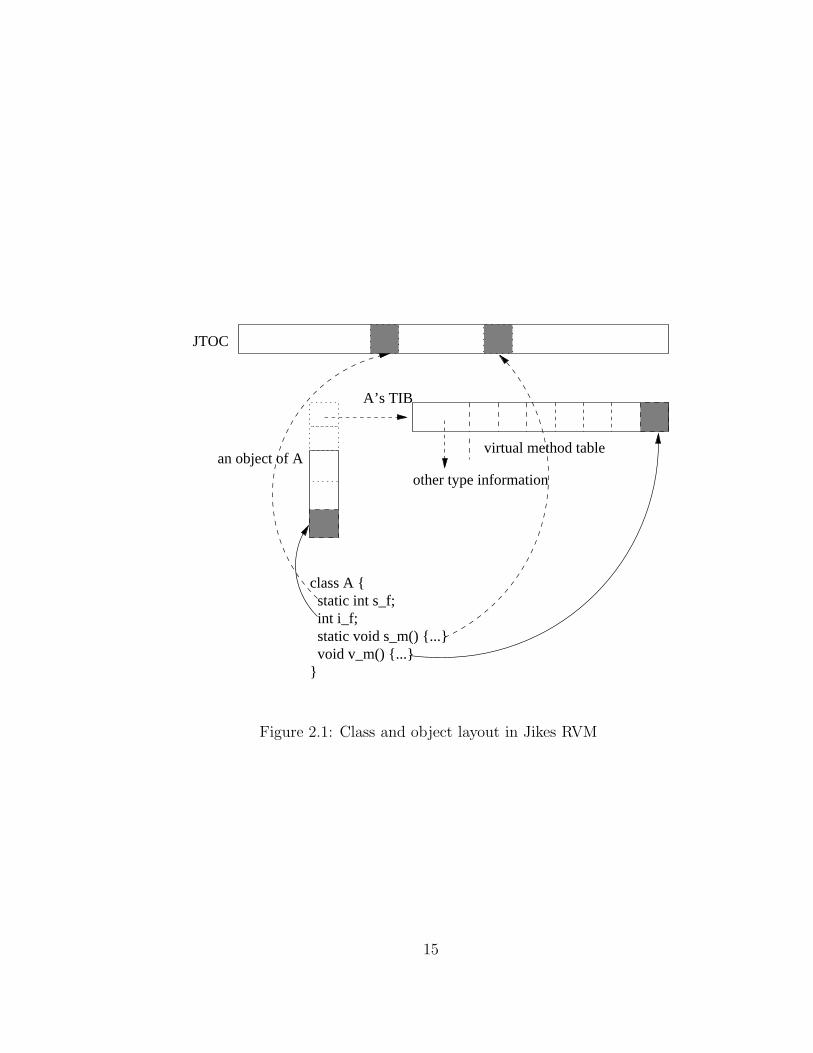
Internal representations. It is necessary to understand the object layout and
the internal representation of classes in Jikes RVM. We use the example in
Figure 2.1 to explain the idea. A resolved class A has a TypeInformationBlock
(TIB), which contains superclass and super interface ids, interface method table,
virtual method table, and other miscellaneous information. There is a global
data structure called Java Table Of Contents (JTOC), whose entries are values
of literals, static fields, or machine code addresses of static methods. The start
address of JTOC is kept in a register for fast access. Each class member (field
or method) is assigned a runtime constant offset at class resolution time. The
offsets of static members are used to access contents in JTOC (dashed lines in
Figure 2.1). For example, getstatic A.s f is simply compiled to instructions:
v = *(JTOC + A.s_f’s offset);
The offset of a non-static field, e.g, A.i f, is used to calculate the address of the field
value when given an object pointer of type A. The offset of virtual method ( A.v m )
decides where its machine code address locates in A’s virtual method table.
Lazy compilation. To reduce compilation overhead, Jikes RVM delays the compilation
of a method until its first time invocation. This is done by, at class resolution time,
putting the address of a special code stub, trampoline, in the virtual method table
or JTOC instead of eagerly compiling the method. When the method is invoked,
the special code stub is executed. The code stub blocks the execution and calls
the compiler to compile the method. After the compilation was done, the virtual
machine fills the method’s entry in virtual method table or JTOC with its machine
code address. Then the code stub resumes execution by jumping to the compiled code
directly. Since the method’s entry in virtual method table or JTOC has been replaced
by real machine code address, future invocation on the method directly jumps to the
machine code address.
14
class A { static int s_f; int i_f; static void s_m() {...}
} void v_m() {...}
JTOC
other type information
virtual method table
A’s TIB
an object of A
Figure 2.1: Class and object layout in Jikes RVM
15

Dynamic linking. As we discussed in Section 1.1, the class file contains symbolic refer-
ences of types, methods and fields used by bytecode instructions. A reference must
be resolved to a concrete entity before executing the instruction. Resolving a refer-
ence may trigger the loading of other classes. A virtual machine can take the laziest
strategy to delay the resolution until the instruction gets executed. Jikes RVM takes
such a lazy approach, called dynamic linking. Efficient implementation of dynamic
linking requires cooperation between compilers and the runtime system.
When compiling a bytecode instruction accessing a field or method reference (e.g.,
getfield, invokevirtual, etc.), the compilers checks if the reference can be resolved
without loading other classes. A resolved field or method has an offset for accessing
its value or machine code address. Therefore, the compilers can generate efficient
instructions to access a resolved member’s value by its offset.
Each field or method reference is assigned a unique id when it is created, and the
virtual machine maintains a table of offsets for unresolved ones. The table is indexed
by the unique id of each reference, and the contents are initialized to a special value.
When a reference gets resolved, the table entry is set to the resolved entity’s offset.
When compiling a bytecode instruction accessing a reference that cannot be resolved
at compile time, the compilers generate instructions for checking if the table entry
of the reference contains a valid offset value. If not, there is an instruction calling a
resolution method to resolve the reference. Otherwise, the offset is read out from the
table and used to access the member.
Compiler IRs. The baseline compiler does one-pass parsing of bytecodes and generates
machine code quickly. The compiler has a big loop and code generation mimics the
stack architecture defined by the Java virtual machine specification. Although the
baseline compiler is easy to understand and modify, the stack nature of bytecode
makes the conventional data-flow analysis harder. On the other hand, the optimizing
compiler compiles bytecodes to machine code through several intermediate represen-
tations (IRs). It performs many data-flow analyses and optimizations on each IR.
The IRs include high-level IR (HIR), low-level IR (LIR), and machine code level IR
(MIR). Optionally there is a Static Single-Assignment (SSA) [Muc97] form available
at HIR and LIR. Developing data-flow analyses based on HIR or LIR is much easier
than raw bytecodes.
16

Compiler optimizations. The optimizing compiler provides a full suite of optimizations
that include standard data-flow optimizations such as constant propagation and fold-
ing, dead code elimination, etc. There are some other Java-specific optimizations
such as null check and bounds check eliminations. Method inlining is an important
optimization for object-oriented programs. The optimizing compiler performs both
static inlining (using type analyses results) and adaptive inlining (using profiling in-
formation). The default type analysis used for static inlining is the class hierarchy
analysis (CHA) [DGC95]. It also implements method and class tests [DA99], code
patching [IKY+00], pre-existence based inlining [DA99].
2.1.2 Experimental approach
The product configuration of Jikes RVM compiles all RVM classes into the bootimage.
The execution uses a mixed compilation mode. Methods are quickly compiled by
the baseline compiler first. Only hot methods are selected for recompilation by the
optimizing compiler. Jikes RVM uses an adaptive analytical model [AFG+00] for
driving recompilation and optimizations. The estimation of costs and benefits is
based on samples collected at thread-switch points. The thread-switching is driven
by OS timers. Therefore, the behaviour of the adaptive system is subject to OS
workload and is nondeterministic. Although the default adaptive analytic model is
flexible and intelligent, the decision can be easily affected by small changes made in
the virtual machine code. For example, in one of our early experiments, the change we
made in the baseline compiler slowed down the application at startup time. Without
retraining the adaptive system, the recompilation decision was changed dramatically.
In order to compare results quantatively, we used a counter-based strategy for
recompilation in our experiments in this thesis. Hot methods are selected for recom-
pilation based on their invocation counters. Thus, nondeterminism introduced by the
virtual machine is mostly eliminated. We verified that the recompilation behaviors
between different runs of the same benchmark are very similar.
17

2.2 Benchmarks
In this section, we introduce the benchmark suite we used in our experiments. Spec-
JVM98 [speb] is a client-side benchmark suite for experimenting Java virtual machine
development. It consists of 8 benchmarks introduced in Table 2.12. The suite also
provides a driver class, SpecApplication to execute individual benchmark with a
number of iterations without restarting the virtual machine between runs. This can
be used to simulate a long running application. Usually the first a few runs let the
virtual machine compile most of the executed methods, recompile and optimize a few
hot methods. After a few runs, there are less VM activities. The performance of
later runs can be used to measure the quality of optimized code. Appendix A has a
summary of key metrics of benchmarks 3.
SpecJBB2000 [spea] is a server-side benchmark which emulates a 3-tier system
with emphasis on the middle tier. It models a wholesale company and supports several
warehouses. Several clients send operation requests to the server and each client
operates on a dedicated warehouse. The server creates one thread for each client.
All warehouse data are resident in the heap. SpecJBB2000 is a multi-threading,
long-running Java server benchmark.
In addition to the standard Spec benchmark suites, we used several benchmarks in
different experiments. Soot-c [VRGH+00] is a Java bytecode transformation frame-
work that is quite object-oriented, and which has several phases with potentially
different allocation behaviors. CFS is a correlation-based feature subset selection
evaluator from a popular open-source data mining package Weka [wek]. The pro-
gram has an object-oriented design and does intensive numerical computation. We
use a driver similar to the one from SpecJVM98 to run the CFS several times. The
first run reads the data from a file and following runs operate the data on the heap.
Simulator [cer] is a certificate revocation schemes. A variation of simulator interwo-
ven with AspectJ [aspa] code is also used in some of our experiments.
2The description comes from http://www.spec.org.3For more metrics, see http://www.sable.mcgill.ca/metrics/
18

201 compress Modified Lempel-Ziv method (LZW). It finds common
substrings and replaces them with a variable size code.
202 jess JESS is a Java Expert Shell System. The benchmark
workload solves a set of puzzles.
205 raytrace A raytracer that works on a scene depicting a dinosaur.
209 db Performs multiple database functions on memory resi-
dent database. Reads in a 1 MB file which contains
records with names, addresses and phone numbers of en-
tities and a 19KB file called scr6 which contains a stream
of operations to perform on the records in the file.
213 javac This is the Java compiler from the JDK 1.0.2.
222 mpegaudio This is an application that decompresses audio files that
conform to the ISO MPEG Layer-3 audio specification.
227 mtrt This is a variant of 205 raytrace, where two threads each
renders the scene in the input file time-test model, which
is 340KB in size.
228 jack A Java parser generator that is based on the Purdue
Compiler Construction Tool Set (PCCTS). This is an
early version of what is now called JavaCC.
Table 2.1: Introduction of SpecJVM98 benchmarks
19

Chapter 3
Region-Based Allocator
This chapter introduces an adaptive, region-based allocator for Java. The basic
idea is to allocate non-escaping objects in local regions, which are allocated and freed
in conjunction with their associated stack frames. By releasing memory associated
with these stack frames, the burden on the garbage collector is reduced, possibly
resulting in fewer collections.
The novelty of our approach is that it does not require static escape analysis,
programmer annotations, or special type systems. The approach is transparent to
the Java programmer and relatively simple to add to an existing JVM. The system
starts by assuming that all allocated objects are local to their stack region, and then
catches escaping objects via write barriers. When an object is caught escaping, its
associated allocation site is marked as a non-local site, so that subsequent allocations
will be put directly in the global region. Thus, as execution proceeds, only those
allocation sites that are likely to produce non-escaping objects are allocated to their
local stack region.
We present the overall idea, and then provide details of a specific design and
implementation in Jikes RVM. Our experimental study evaluates the idea using the
SpecJVM98 benchmarks, plus one other large benchmark. We show that a region-
based allocator is a reasonable choice, that overheads can be kept low, and that the
adaptive system is successful at finding local regions that contain no escaping objects.
20

3.1 Overview
The whole system consists of three parts: the allocator manages regions and allocates
space for objects; the JIT compiler inserts instructions for acquiring and releasing a
region in each compiled method; and the collector performs garbage collection when
no more heap space is available.
In a region system, the heap space is divided into pages. The pages can be fixed-
size or variable-size. In our system, we use fixed-size pages for fast computation of
page numbers from addresses. The allocator is also a region manager. It manages
a limited number of tokens. Each token is a small integer number identifying a re-
gion. Two regions, Global and Free, exist throughout the execution of a program.
Other, local regions, exist for shorter durations. They are assigned to and released
by methods dynamically.
A high-level view of our memory organization is given in Figure 3.1. A more
detailed description of the implementation is given in Section 3.2.
INUSERegionIDAddressFreeBytesNextPage
INUSEDIRTYFirstPageThread
statck
Page 0 Page 1
GLOBAL FREELISTRegion 2 Region i
Page N
Frame A
Region Descriptor
Page Descriptor
HEAP SPACE
Frame D
Figure 3.1: Memory organization of page-based heaps with regions
A region token points to a list of pages in the heap. The region space is expanded
by inserting free pages at the head of the list. The Global region contains objects
created by non-local allocation sites and pages containing objects that have escaped
out of local regions. The Global region space can only be reclaimed by the collector.
The system uses bit maps to keep track of free pages in the heap. The pages of a
local region can be appended to the Global region or reclaimed by resetting their
entries in the bit map.
21

A method activation obtains a region token by either acquiring an available token
from the region manager or by inheriting its caller’s token. The region identified by
the token acts as an extension of the activation’s stack frame. Before exiting, the
activation releases the region if it was not inherited. It is clear that the lifetime of a
local region is bounded by the lifetime of its host stack frame. There is a many-to-one
mapping between stack frames and regions.
An object can be created in the region of the top stack frame or in the Global
region. For the remainder of the discussion we need to define what we mean by an
object escaping from a region, and a non-local allocation site.
Definition 1 An object escapes its allocation region if and only if it becomes pointed
to by an object in another region.
Definition 2 An allocation site becomes non-local when an object created by that site
escapes.
Given this definition of escape, there are only three Java bytecode instructions,
putstatic, putfield, and aastore, that can lead to an object escaping. Therefore,
it is sufficient to insert write barriers before these instructions to detect the escape of
an object.
There is one additional situation that must be considered. When a method returns
an object, the object may escape its allocation region via stack frames. However, this
kind of escape can be prevented by either: (1) inserting write barriers before all
areturn byte codes, or (2) requiring all methods returning objects to inherit their
caller’s region. In our implementation we have taken the second approach. It should
be noted that objects passed to the callee as parameters are not a problem since the
lifetime of the callee’s stack frame is bounded by the caller’s.
For an assignment such as lhs.f = rhs, the write barrier checks if the rhs is in
the same region as the lhs object. When they are in different regions, the region
containing the rhs object is marked as dirty. Since static fields are much like global
variables, we assume that a putstatic always leads to the rhs object escaping, and the
region associated with this object is marked as dirty.
22

It is worth pointing out that a region cannot contain an object reachable from
other regions without being marked as dirty. If there is a path which causes an object
o1 of a region R1 to be reached from objects in other regions, there must be an object,
say oi, in R1 which is on the path and is directly pointed to by another object not
in R1, and the assignment of this pointer must have been captured by write barriers.
Hence, R1 must be marked as dirty when such a path exists.
Each allocation site in a compiled method is uniquely indexed, and each object
has a field in its header for recording the index of its allocation site (see Section
3.3 for a discussion of how this is accomplished without increasing the object header
size). The allocator maintains a bit vector to record the states of the allocation sites.
Besides marking the region dirty, the write barrier also marks an escaping object’s
allocation site as non-local. The allocator allocates objects in local regions only for
local allocation sites. By not allocating objects for non-local sites in the local region,
future activations of the method are very likely to have a local region containing only
non-escaping objects.
The system is quite straightforward and we have implemented it in Jikes RVM [AAB+00]
(see Section 2.1 for the introduction of Jikes RVM). The prototype of the allocator
is implemented with the baseline compiler only. When we present the VM-related
part in Section 3.3, the stack frame layout refers to the conventions of the baseline
compiler.
3.2 Allocator
3.2.1 Heap organization
Various garbage collection techniques have different heap organizations. For example,
mark-and-swap collectors use a single space, copying collectors divide space into two
semi-spaces, and generational collectors divide the heap into several aging areas. In
this chapter, the heap we are discussing refers to the space where new objects are
allocated.
A region memory manager organizes a heap as pages. Without loss of generality,
23

the heap in our system is organized as contiguous pages with a fixed size which is a
power of 2. The starting address of the heap is aligned to the page size. Therefore,
computing the page number for an address requires only subtraction and bit shifting.
Some systems do not allocate the large objects from regions, and do not allow an
object to straddle two pages. In order to get a full picture of allocation behaviors,
our system does not use a separate space for large objects and attempts to allocate
objects on contiguous pages whenever it can.
Figure 3.1 gives a high-level overview of the memory organization that we use
for our implementation of regions. A page descriptor encodes page status, region
identification, allocation point, and the index of next page. A region descriptor
contains region status, and the first page index of the region.
This organization provides sufficient information for region-based allocation. When
allocating space in a region, the allocator first checks the free bytes of the first page.
When there is not enough space left there, a free page is taken from the free list and
inserted in the page list as the first page. Allocating space for large objects involves
searching for contiguous free pages. We have measured the overhead for these allo-
cations for our benchmarks, and as shown in Section 3.5, the frequency of expensive
searches is quite low, indicating that this is a reasonable design.
3.2.2 Services
The internal heap organization is transparent to the JVM. The allocator provides a
set of services to the JVM and collector. We describe these functions here.
There are two services for region operations as shown in Figure 3.2. Internally, free
region tokens are managed by a stack. The NEWREGION service pops a region token
from the stack, and pre-allocates one free page for it (pre-allocation is only used
with lazy region allocation, to be explained in Section 3.3). If no token is currently
available, the Global one is returned. The FREEREGION operation has to check the
Dirty field in the region descriptor. Only when the region is clean, can pages be
reclaimed by adding them to the free list. Otherwise, pages are appended to the page
list of the Global region.
24

NEWREGION: int
if the rid_stack is empty
return GLOBAL;
else
rid = rid_stack.pop;
pre_allocate_page(rid);
return rid;
FREEREGION (int rid)
if the region is dirty
append pages to the GLOBAL region;
else
add pages to the free list;
rid_stack.push(rid);
Figure 3.2: Services for regions
25

As outlined in Figure 3.3, the allocator provides two services for write barriers.
The CHECKWRITE service is called before putfield and aastore byte codes. The addresses
lhs and rhs point to the left hand side and right hand side objects. The operation
filters out null pointers and escaped objects first, then computes page indexes from
object addresses and tests equality. Region IDs are retrieved from page descriptors
and compared if the objects are not in the same page. The rhs object is marked as
escaped if it is not in the region of the lhs object.
The write barrier for putstatic calls MARKESCAPED directly. As we explained in
Section 3.1, the allocator uses a bit vector to record the states of allocation sites.
Both services not only mark the region as dirty, but also set the state of the allocation
site to non-local. In the object header, a bit in the status word is used to mark an
object as escaped.
The main function of the allocator is to allocate space for an object. With regions,
the allocation of space is somewhat complicated. The allocation process ALLOC is
illustrated in figure 3.4. Here, we present only a high-level abstraction of the service.
The allocation method first checks the state of the allocation site. Only local sites
are eligible for allocation from local regions. The internal method getHeapSpace
allocates space in the first page if the free space is larger than the required size. If the
first attempt fails, it looks at pages following the current page. If the request cannot
be satisfied from these pages, it then looks for contiguous pages by scanning the bit
maps. This is the most expensive operation in a region-based allocator.
These services also provide the facilities required by the garbage collector to per-
form collections. We discuss the collection process in Section 3.4.
3.3 Adaptive VM
To utilize regions, a JVM needs the following modifications:
1. each allocation site is assigned a unique index at compilation time;
2. the object header has a field for recording the index of its allocation site;
26

CHECKWRITE (ADDRESS lhs, rhs): boolean
if rhs is null
return TRUE; // case 1
if rhs is escaped
return FALSE; // case 2
if rhs and lhs are in the same page
return TRUE; // case 3
if rhs and lhs are in the same region
return TRUE; // case 4
mark rhs as escaped,
return FALSE; // case 5
MARKESCAPED (ADDRESS rhs): boolean
if rhs is null
return TRUE; // case 1
if rhs is escaped
return FALSE; // case 2
mark rhs as escaped,
return FALSE; // case 3
Figure 3.3: Services for barriers
27

ALLOC (int rid, int size): ADDRESS
call _getHeapSpace(rid, size);
if failure
initiate a collection;
call _getHeapSpace(rid, size);
if failure
out of memory;
else
return the address;
_getHeapSpace (int rid, int size): ADDRESS
1. allocate space from the first page;
2. if failure, check if enough pages
following the first page are available;
3. if not, search contiguous pages
in the free list;
if both attempts fail
out of memory;
else
add free pages to the region;
return the starting address;
Figure 3.4: Allocating spaces
28

3. the stack frame has a slot for the region ID at a fixed offset from the frame
pointer;
4. the method prologue and epilogue have additional instructions to deal with the
region ID slot; and
5. write barriers are inserted before putstatic, putfield, and aastore byte codes.
The allocation method has two more parameters than before: the index of an
allocation site is a runtime constant, and the region ID is fetched from the stack
frame.
When deciding whether or not a method is eligible for a new local region, our
implementation uses following criteria:
• A native call is assigned the Global region id.
• The <clinit> method always uses the Global region since we know that it
initializes static fields.
• The <init> method inherits the caller’s region because it initializes the instance
fields.
• A method returning an object is not eligible for a new region. This rule elimi-
nates the need for a write barrier for the areturn byte code. More importantly,
as pointed out by [GS00], there are many methods just allocating objects for
the caller.
• A one-pass scan of the byte codes counts the allocation sites of each method. If
the number is lower than a threshold, no local region is needed for this method.
We currently use a threshold of 1.
• The first executed method of the booting thread is assigned the Global region
ID.
In our initial development it became clear that making newregion and freeregion
calls on each activation is too expensive for the run time system since many activations
29

9 2 0
?
31
count hash codethread ID
(a) Structure of the status word
00 non−zero site
(b) Status of a non-escaping object
1?
(c) Status of an escaped object
Figure 3.5: Sharing bits with thin locks
may have empty regions, either because their allocation sites have become non-local
or because no object is allocated. To eliminate these empty regions, we use lazy
region allocation. An eligible method first saves a special region ID, e.g. 0, in the
region ID slot, indicating the stack frame needs a dynamic region, but it has not yet
been allocated. The code for allocation first checks the ID, and then calls newregion
only when necessary. The freeregion method is called only when the region ID is a
valid one. If a method inherits a region from its caller, it must write back its current
region ID to the caller’s stack frame.
Another implementation issue is how to encode the allocation site index in the
object header. A two-word object header is quite a popular design on most JVMs.
One word of the header is used as a status word. Our implementation avoids growing
the object header by storing the allocation site index in space already used by the
thin lock [BKMS98].
In Jikes RVM version 2.0, the thin lock uses 13 bits for recording the ID of the
locking thread, and 6 bits for counting locks. Figure 3.5(a) shows the structure of the
status word. Bit 31 is called the monitor shape bit which is 0 if the lock is thin and
1 if it is fat.
30
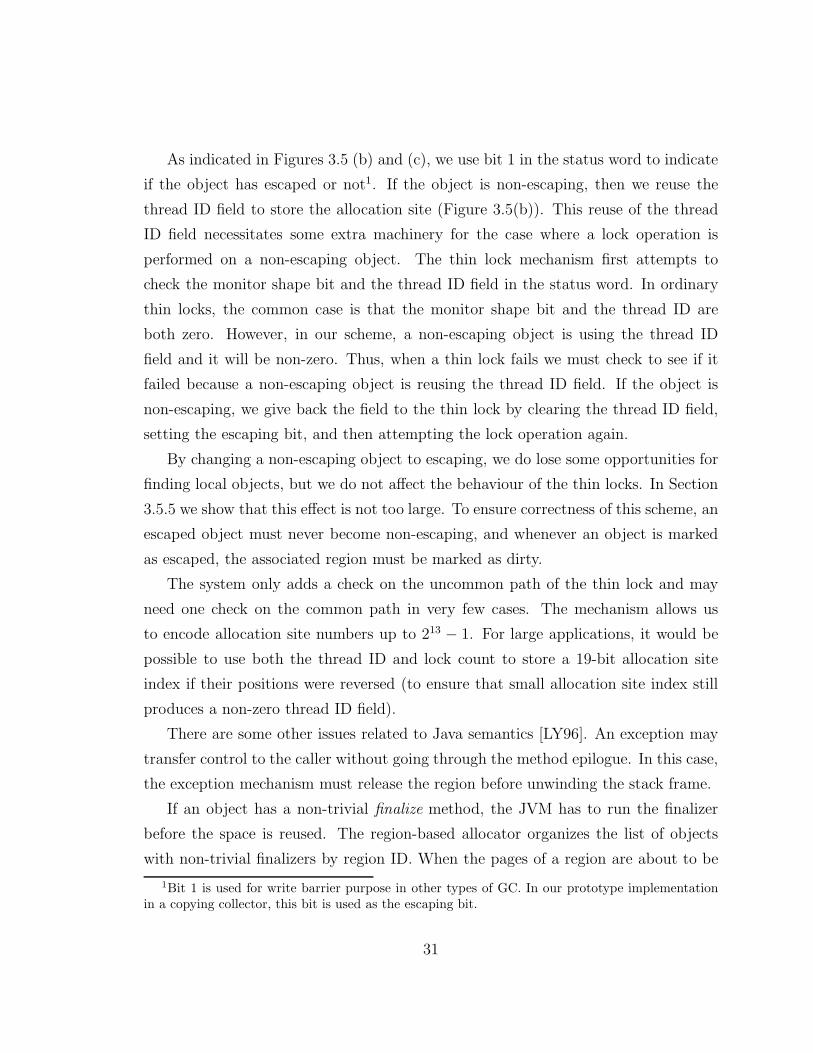
As indicated in Figures 3.5 (b) and (c), we use bit 1 in the status word to indicate
if the object has escaped or not1. If the object is non-escaping, then we reuse the
thread ID field to store the allocation site (Figure 3.5(b)). This reuse of the thread
ID field necessitates some extra machinery for the case where a lock operation is
performed on a non-escaping object. The thin lock mechanism first attempts to
check the monitor shape bit and the thread ID field in the status word. In ordinary
thin locks, the common case is that the monitor shape bit and the thread ID are
both zero. However, in our scheme, a non-escaping object is using the thread ID
field and it will be non-zero. Thus, when a thin lock fails we must check to see if it
failed because a non-escaping object is reusing the thread ID field. If the object is
non-escaping, we give back the field to the thin lock by clearing the thread ID field,
setting the escaping bit, and then attempting the lock operation again.
By changing a non-escaping object to escaping, we do lose some opportunities for
finding local objects, but we do not affect the behaviour of the thin locks. In Section
3.5.5 we show that this effect is not too large. To ensure correctness of this scheme, an
escaped object must never become non-escaping, and whenever an object is marked
as escaped, the associated region must be marked as dirty.
The system only adds a check on the uncommon path of the thin lock and may
need one check on the common path in very few cases. The mechanism allows us
to encode allocation site numbers up to 213 − 1. For large applications, it would be
possible to use both the thread ID and lock count to store a 19-bit allocation site
index if their positions were reversed (to ensure that small allocation site index still
produces a non-zero thread ID field).
There are some other issues related to Java semantics [LY96]. An exception may
transfer control to the caller without going through the method epilogue. In this case,
the exception mechanism must release the region before unwinding the stack frame.
If an object has a non-trivial finalize method, the JVM has to run the finalizer
before the space is reused. The region-based allocator organizes the list of objects
with non-trivial finalizers by region ID. When the pages of a region are about to be
1Bit 1 is used for write barrier purpose in other types of GC. In our prototype implementationin a copying collector, this bit is used as the escaping bit.
31

reclaimed, the finalize methods of objects in the region get called.
3.4 Collector
The collector must ensure that if an object escapes its original region, that region
is marked as dirty. One way of ensuring this would be to introduce write barriers
during collections. However, this may sacrifice the efficiency of the collector. There is
a trade-off between precision and performance. If all live objects are copied to dirty
regions, no barriers are needed. So, the second option is to copy all live objects to
the Global region of another space. This does not violate the above rule since the
global region never gets released. This strategy has the same efficiency as a normal
copying collector. However, copying all objects to the Global region may cause
some objects created in the next epoch to be treated as escaped, and their associated
allocation sites marked as non-local, unnecessarily.
Our current implementation keeps objects in their original region as much as
possible, and marks all live regions as dirty after the collection. Now objects in the
root set are divided into subsets by their regions, with each live region corresponding
to a subset of the root set. The collector starts with collecting all reachable objects
from the subset belonging to the Global region. In the next step, the collector
collects objects reachable from the subset corresponding to each local region. All
objects copied to the Global region are marked as escaped to allow fast checks in
barriers (the states of the allocation sites are not changed). Although this strategy
makes some stackable objects in current live regions unstackable, it does not require
write barriers and will not make allocation sites non-local unnecessarily. Currently,
we do not have experimental evidence to show which option is better in reality.
3.5 Results
We implemented a page-based heap and a prototype of a region-based allocator in
Jikes RVM v2.0 with the baseline compiler. The region-based allocator is implemented
32

in a semi-space copying collector using Cheney’s tracing algorithm [JL96]. The im-
plementation uses a uniprocessor configuration. However, it can be implemented in
existing parallel collectors with little effort.
To understand the program behavior, we did detailed profiling of the allocation
behaviors, and report the experimental results of the following aspects:
• the allocation behavior of the region-based allocator;
• the percentage of space reclaimed by local regions, and the reduction in collec-
tions due to local region allocation;
• the behavior of write barriers;
• the impact on thin locks; and
• the effect of adaptivity.
3.5.1 Benchmarks
We report experimental results on the SpecJVM98 benchmark suite and soot-c.
We first provide some measurements to give some idea of the allocations performed
by each benchmark. Table 3.1 shows the profiles of allocation sites. The column
labeled Compiled gives the total number of allocation sites in compiled methods. It
includes the allocation sites in the JVM, libraries and benchmark code. The column
labeled Used lists the number and percentage of allocation sites which created at least
one object. On average 26% of the allocation sites create at least one object. The
columns labeled Non-local and Local show the fraction of used allocation sites which
are categorized as non-local and local. An allocation site is categorized as local if it
is never marked as non-local by the adaptive algorithm. The last column, labeled
Max RID, gives the maximum number of regions used by the benchmark at the same
time. This gives us some idea of the number of region tokens required. Note that a
program (like 213 javac) with deep recursion may use a large number of regions.
In all of our experiments the total heap size is set to 50M, from which the JVM uses
about 1.5M as the boot area. The JVM itself shares the same heap with applications.
33

Benchmark Compiled Used Non-local Local Max RID
201 compress 2108 346(16%) 115(33%) 231(67%) 11
202 jess 2407 577(23%) 276(47%) 301(53%) 9
209 db 2117 358(16%) 124(34%) 234(66%) 11
213 javac 2871 895(31%) 437(48%) 458(52%) 56
222 mpegaudio 3266 1502(45%) 157(10%) 1345(90%) 12
227 mtrt 2228 497(22%) 196(39%) 301(61%) 19
228 jack 2396 614(25%) 204(33%) 410(67%) 16
soot-c 3030 1158(34%) 551(52%) 507(48%) 14
Table 3.1: Allocation sites
We do not distinguish the objects created by the system or the benchmarks. The
heap is divided into two semi-spaces. A 25M heap is quite small for most of our
benchmarks, which forces the garbage collector to work.
3.5.2 Choice of page size
The choice of page size may affect utilization of heap space. A larger page size will
allow more allocations to be satisfied in the first page. On the other hand, smaller
page size will reduce the amount of froth (unused pieces of the heap due to the allo-
cation of chunks/pages of memory2). Table 3.2 shows the the effect of different page
sizes on the number of garbage collections needed and the froth rates. The column
labeled Base collections gives the number of collections needed for the base semi-
space copying garbage collector, without the regions. The three columns labeled clc
give the collections required for the region-based allocator, assuming page sizes of 256
bytes, 1K bytes and 4K bytes.3 Similarly, the columns labeled froth give the wasted
space for the three different page sizes (computed by unused bytes/allocated bytes).
Note that a page size of 4K leads to a large froth rate for several benchmarks, most
2This term was introduced by Steensgaard [Ste00].3We disabled System.gc() calls for both collectors.
34

notably 213 javac (130%), 228 jack (27.5%) and soot-c (23.5%). The very high
froth rate for 213 javac also seems to increase the number of garbage collections,
which is more than double that of the base collector.
Benchmark Base # 256 Bytes 1K Bytes 4K Bytes
collections clc froth clc froth clc froth
201 compress 7 7 0.03% 7 0.11% 7 0.47%
202 jess 12 11 0.13% 11 0.53% 11 2.19%
209 db 4 4 0.05% 4 0.23% 4 1.05%
213 javac 12 12 4.96% 15 29.41% 25 130.42%
222 mpegaudio 0 0 0.62% 0 2.10% 0 9.05%
227 mtrt 7 1 0.03% 1 0.09% 1 0.38%
228 jack 9 7 1.29% 8 5.97% 9 27.52%
soot-c 15 13 1.09% 13 4.89% 15 23.49%
Table 3.2: Effect of page size on # of collections and froth
From the perspective of number of collections and froth, the smaller pages seem
better. However, this is not the complete story. One must also consider the overhead
for allocations. The cheapest form of allocation is when the newly allocated object
fits in the current page, the second cheapest is when the allocation can be allocated on
the next page, and the most expensive is when one must search the free list for enough
contiguous pages to meet the allocation request. These overheads are summarized
in Table 3.3. Considering the three page size configurations: 256-byte, 1K, and 4K,
the allocations are categorized into three types, which reflect three possibilities in
getHeapSpace in Figure 3.3.
1. firstpage the space is available in region’s first page;
2. nextpages the region is expanded with immediately contiguous pages; and
3. searching search for contiguous pages in the free list.
35

A large size (4K) allows most of allocations to be satisfied with cheap costs.
But, as we demonstrated in Table 3.2, the froth rate may run out of control. From
Table 3.3 we see that there is not a large difference in the behavior of allocations
when comparing page sizes of 1K and 4K. However, even though a smaller page size
(256 bytes) reduces froth rates, the allocation distribution changes dramatically, with
many more allocations requiring expensive operations. From these results we conclude
that the trade-off between page size and froth rate is worth considering when using a
page-based heap. For our remaining experiments we chose a page size of 1K, which
gives us both reasonable froth rate and reasonable allocation overhead.
3.5.3 Region-reclaimed space
The next important measurement is to find out the percentage of space that is re-
claimed from local regions. That is, how much space can be reclaimed when using
the region-based approach. Recall that the region can be reclaimed when a stack ac-
tivation is popped only when the dirty bit has not been set (i.e. the region is clean).
If any object in the region has escaped, then the dirty bit will be set, and this region
must be added to the Global region which will be collected by the garbage collector.
The table given in Figure 3.6(a) gives the bytes reclaimed from clean regions and
the percentage they represent of total allocated bytes, when the page size is 1K.
Different page sizes give very similar numbers. The percentage of region-reclaimed
bytes varies between benchmarks. In the best case, 227 mtrt has 80 percent of total
allocated memory reclaimed by regions, with the number of collections reduced from
7 to 1. In the worst case, 209 db has less than 1% region-reclaimed space, with no
impact on the number of collections.
Another way to look at the behavior of the regions is to examine the number of
bytes allocated from local regions over the duration of the execution. Figure 3.6(b)
shows the fraction of bytes allocated that are allocated from local regions. The x-axis
is an abstraction of time, with each unit corresponding to 1M bytes of allocations. The
y-axis shows the fraction of those 1M bytes that were allocated from a local region. For
example, the graph labeled 227 mtrt indicates that after an initial startup, about
36

Benchmark page firstpage nextpages searching
size
201 compress 256 82.73% 16.23% 1.04%
1K 94.96% 4.74% 0.30%
4K 98.43% 1.44% 0.13%
202 jess 256 86.75% 12.89% 0.36%
1K 96.71% 3.27% 0.02%
4K 99.16% 0.83% 0.01%
209 db 256 92.24% 7.69% 0.07%
1K 98.04% 1.92% 0.03%
4K 99.49% 0.48% 0.03%
213 javac 256 89.56% 8.58% 1.85%
1K 97.43% 2.00% 0.57%
4K 99.41% 0.50% 0.09%
222 mpegaudio 256 84.97% 12.09% 2.94%
1K 95.54% 3.52% 0.94%
4K 98.59% 0.98% 0.43%
227 mtrt 256 96.04% 2.58% 1.39%
1K 99.51% 0.38% 0.11%
4K 99.88% 0.10% 0.02%
228 jack 256 91.64% 6.46% 1.91%
1K 97.79% 1.59% 0.63%
4K 99.48% 0.33% 0.19%
soot-c 256 88.28% 9.85% 1.88%
1K 96.85% 2.66% 0.49%
4K 99.21% 0.68% 0.11%
Table 3.3: Allocation behaviors
37

Benchmark base total region-reclaimed clc froth
collections allocated
201 compress 7 116M 15.39M(13.27%) 7 0.11%
202 jess 12 267M 17.36M( 6.50%) 11 0.53%
209 db 4 77M 0.57M( 0.74%) 4 0.23%
213 javac 12 212M 18.65M( 8.80%) 15 29.41%
222 mpegaudio 0 7M 1.96M(28.00%) 0 2.10%
227 mtrt 7 143M 115.15M(80.52%) 1 0.09%
228 jack 9 223M 51.00M(22.87%) 8 5.97%
soot-c 15 219M 40.72M(18.59%) 13 4.89%
(a) Region-reclaimed space
0
0.2
0.4
0.6
0.8
1
0 50 100 150 200 250
javac (per 1M)
0
0.2
0.4
0.6
0.8
1
0 50 100 150 200 250 300
jess (per 1M)
0
0.2
0.4
0.6
0.8
1
0 20 40 60 80 100 120 140 160
mtrt (per 1M)
0
0.2
0.4
0.6
0.8
1
0 50 100 150 200 250
soot-c (per 1M)
(b) Bytes allocated in local regions
Figure 3.6: Local region behaviors38

90% of all allocated bytes are allocated from local regions. In contrast, the graph
labeled 202 jess shows that this benchmark quickly declines to less than 10% of all
allocations from local regions. The graph labeled soot-c shows a widely fluctuating
rate as the program progresses. This is likely because soot-c is quite a complex
benchmark with many different phases. It is interesting to note that if all the bytes
allocated to local regions are also region-released, then the area under the curves of
Figure 3.6(b) should be equal to the region-reclaimed number shown in Figure 3.6(a).
This appears to be the case, as confirmed by our measurements given in Section 3.5.6,
showing that almost all local regions are clean when released.
3.5.4 Write barrier behaviors
Another important aspect of the collector we measured is the behavior of write bar-
riers, as summarized in Table 3.4. Overall, a write barrier has bounded constant
time as shown by the pseudo-code in Figure 3.3. However, it is still a burden to
the system. To get better idea of how to optimize the barriers, we categorize the
CHECKWRITE(CW) for putfield and aastore into five types.
1. the right hand side is a null pointer;
2. the right hand side object is already marked as escaped;
3. both objects are in the same page;
4. both objects are in the same region; and
5. the LHS and RHS objects are not in the same region.
The first case checks if the right hand side reference is a null pointer, and the
second case checks the escaping bit, which requires a load and a compare instruction.
As shown in Table 3.4, the majority of checks are filtered out by these two cases,
which indicates it is beneficial to separate these two cases as a common path and
inline them. The remaining three cases can be processed by a method call. Similarly
the write barriers for putstatic are also categorized into three types, with the first two
cases benefiting from inlining.
39

Benchmark null quick samepage sameregion escaped1
201 compress CW2 15.07% 83.64% 1.05% 0.17% 0.07%
MS3 0.00% 91.45% 8.55%
202 jess CW 0.22% 99.75% 0.02% 0.00% 0.00%
MS 1.88% 85.63% 12.50%
209 db CW 0.12% 99.88% 0.00% 0.00% 0.00%
MS 0.00% 90.48% 9.52%
213 javac CW 10.81% 88.84% 0.32% 0.03% 0.00%
MS 2.90% 89.63% 7.47%
222 mpegaudio CW 0.42% 98.12% 0.08% 1.38% 0.00%
MS 3.20% 83.56% 13.24%
227 mtrt CW 13.82% 84.49% 1.66% 0.02% 0.00%
MS 0.00% 86.44% 13.56%
228 jack CW 11.79% 87.58% 0.62% 0.01% 0.00%
MS 0.00% 91.00% 9.00%
soot-c CW 5.20% 91.88% 2.71% 0.21% 0.00%
MS 0.00% 93.48% 6.52%1In this table, zero only means the rate is lower than 0.005%. 2CW is the short name of
CHECKWRITE for putfield and aastore. 3MS is the short name of MARKESCAPED for
putstatic.
Table 3.4: Write barrier behaviorss
40

Currently, we have not incorporated any static analysis for removing write barriers.
Certainly, such analyses will reduce the runtime cost of the system. We will investigate
such algorithms in the future.
3.5.5 Impact on thin locks
We also profiled the impact of sharing bits with thin locks. Table 3.5 shows the rate
of failed locks because of sharing bits. 201 compress and 222 mpegaudio have only
a few thousand locks in a full run, so their results cannot represent the real effect of
sharing bits. On other benchmarks, the rate of spoiled locks is no more than 5%.
Benchmark thin locks spoiled locks
201 compress 1.6K 172(9.58%)
202 jess 4.8M 4881(0.10%)
209 db 45.2M 2915(0.01%)
213 javac 14.7M 341585(2.26%)
222 mpegaudio 5.6K 497(8.15%)
227 mtrt 1.3M 25816(1.92%)
228 jack 9.4M 497016(5.00%)
soot-c 5.6M 73204(1.30%)
Table 3.5: Impact on thin locks
3.5.6 Effectiveness of adapting
The last behavior that we studied was the effect of the adaptive part of our algorithm.
The basic idea of our approach was to mark allocation sites as non-local as soon as they
are found escaping the first time. The justification of this decision was that this would
prevent this allocation site from spoiling clean regions in the future, and we expected
that this would lead to most local regions being clean at release time. Figure 3.7(a)
shows the number of local regions that are clean at release time over the duration of
41

the execution of the program. The x-axis is an abstraction of time, with each point
representing the release of 1000 local regions (100 for 202 jess). The y-axis shows
the number of those local regions that are clean at release time. Accompanying the
title of each graph is the number of clean regions and total allocated regions. It is
very clear that after a short startup time, the system quickly adapts so that almost
100% of the local regions are clean at release time. There is occasionally a small dip,
but then the system adjusts and it goes back to almost 100%. So, it does appear that
the system adapts well.
In order to see what would happen without adapting, we removed the part of
the algorithm that marks an allocation site as non-local, so that all4 allocations
are placed in the local regions. Figure 3.7(b) shows the result in this case. First,
note that many more regions are created, and the scale on these graphs are now per
10000 local regions (1000 for 202 jess). However, we can also see some interesting
trends. The benchmark 227 mtrt appears to create mostly non-escaping objects, so
for this benchmark it is not such a bad idea to just put all objects in local regions.
For benchmarks 213 javac and soot-c, we see that removing the adaption leads
to many more regions, and many of those regions are not clean. In these cases the
adaption works to cull those dirty regions. For 202 jess we see a very interesting
behavior, in that in the last two thirds of the execution, a lot of objects appear to be
non-escaping, and the number of clean regions stays quite high. With the adaption,
we get a higher percentage of clean regions, but we don’t find nearly as many. In
this case we suspect that there are some allocation sites which sometimes produce
escaping objects, and sometimes not. A more complicated prediction scheme appears
to be necessary for this kind of benchmark.
We also collected our overall measurements for the two cases, with adaption and
without adaption. These are summarized in Table 3.6. Note that in some cases,
most notably 213 javac, switching off the adaption drastically increases the froth
rate (589% instead of 29%) and number of garbage collections (96 instead of 15).
However, as we might have predicted from the graph in Figure 3.7(b), the performance
4except native calls, <clinit>, and the first executed method of the boot thread, see Section 3.3.
42

900
920
940
960
980
1000
0 50 100 150 200 250 300 350 400 450 500
javac (per 1000), 498K/499K
0
2000
4000
6000
8000
10000
0 20 40 60 80 100 120 140 160 180 200
javac (per 10000), 449K/1.82M
60
65
70
75
80
85
90
95
100
0 100 200 300 400 500 600 700 800
jess (per 100), 72K/72K
0
200
400
600
800
1000
0 20 40 60 80 100 120 140 160
jess (per 1000), 117K/149K
900
920
940
960
980
1000
0 500 1000 1500 2000 2500 3000
mtrt (per 1000), 2.96M/2.96M
0
2000
4000
6000
8000
10000
0 50 100 150 200 250 300 350
mtrt (per 10000), 2.9M/3.04M
900
920
940
960
980
1000
0 50 100 150 200 250 300 350 400 450
soot-c (per 1000), 406K/407K
0
2000
4000
6000
8000
10000
0 20 40 60 80 100 120
soot-c (per 10000), 419K/1.07M
(a) With adaption (b) No adaption
Figure 3.7: Clean regions released
43

for 202 jess is much better without adaption. This is a clear sign that we must
look at other forms of adaption that are more robust when the objects created from
a site sometimes escape, and sometimes do not. Overall, it seems that the adaptive
algorithm gives better performance and controls excessive froth.
The third column of Table 3.6 gives the total size of escaping objects which were
captured by write barriers or reachable from escaping objects. Locked objects are also
considered as escaping. The difference between the total allocated size and the size of
escaping objects gives us a rough upper bound of the space that can be reclaimed by
regions. We see that there is a large space to improve the current prediction scheme.
Benchmark total total base region clc froth
allocated escaped clc reclaimed
201 compress 116M 99M 7 WA1 15.39M (13.27%) 7 0.11%
NA2 14.75M (12.72%) 7 3.61%
202 jess 267M 6M 12 WA 17.36M ( 6.50%) 11 0.53%
NA 224.92M (84.24%) 2 9.04%
209 db 77M 24M 4 WA 0.57M ( 0.74%) 4 0.23%
NA 0.53M ( 0.68%) 4 5.77%
213 javac 212M 112M 12 WA 18.65M ( 8.80%) 15 29.41%
NA 24.41M (11.51%) 96 589.09%
222 mpegaudio 7M 2M 0 WA 1.96M (28.00%) 0 2.10%
NA 1.37M (19.57%) 0 128.43%
227 mtrt 143M 17M 7 WA 115.15M (80.52%) 1 0.09%
NA 112.56M (78.71%) 6 62.42%
228 jack 223M 69M 9 WA 51.00M (22.87%) 8 5.97%
NA 94.66M (42.45%) 7 16.26%
soot-c 219M 89M 15 WA 40.72M (18.59%) 13 4.89%
NA 7.82M ( 3.57%) 57 276.54%
1 WA is the short name for With Adaption. 2 NA is the short name for No Adaption.
Table 3.6: Effect of Adaption
44

3.5.7 Summary
Our current implementation, using the baseline compiler, was aimed at producing
a prototype that could be used to measure the behavior of the system, as we have
presented in this section. Our numbers show that: 1) page size is important, but
with the appropriate page size, the overhead for froth and the frequency of expensive
searches for free pages is quite low; 2) for many benchmarks a significant percentage of
allocated memory can be placed in local regions which are still clean at release time;
3) appropriate choices for the barrier operations can put the common cases on a low-
cost path; 4) the overhead for sharing space with thin locks seems acceptable; 5) the
adaptive part of the algorithm is important for focusing the system on the allocation
sites that are likely not to escape; and 6) for many, but not all, benchmarks the
adaptive system finds more local regions than a non-adaptive system.
We did try measuring runtime improvement using this prototype, but it turned
out that the overheads in our current implementation are still too high, and this can
lead to an overall slow down. This is due to several factors, including: 1) the cost of
region management, 2) the cost of write barriers, and 3) small helper methods used
by region and barrier implementation.
In our preliminary experiment with the optimizing compiler, we found that the
optimizing compiler allocates far more objects than benchmarks. It is hard to measure
the effects of regions on applications.
3.6 Related work
We have described a region-based allocator using page-based heaps. Although we
use the terminology region here, the technique does not involve any region inference
algorithm [TT97]. The technique provides an alternative way to allocate objects on
stack in a JVM. There is much literature on garbage collection, region-based memory
management and object stack-allocation, thus we focus on those systems most closely
related to our work.
45

Tofte’s region inference system [TT97,Tof98] automatically infers regions for ob-
jects. It achieves automatic memory management by compiler analyses. Gay and
Aiken’s C@ [GA98] and RC [GA01] provide language support for regions. C@ does
not require an inference algorithm. It uses reference counting and stack scans to de-
termine the safety of reclaiming a region. The main point of our work was to develop a
system that works for an existing language, Java, and that is transparent to the Java
programmer. Steensgaard [Ste00] proposed thread-specific heaps for multi-threaded
programs. Both systems require the heap to be organized as pages/chunks. We stud-
ied the allocation behaviors of Java programs on page-based heaps. The preliminary
results suggest that Java programs are sensitive to the page size.
Escape analyses [CGS+99, Bla99, WR99, GS00] for Java determine whether the
objects created by an allocation site may escape certain scopes. Mainly the analysis
results can be used in two optimizations. Thread escape analysis results can be
used to remove unnecessary synchronizations, and escape analysis to find method-
bounded allocation sites can be used to create objects on the local stack frames.
However, the cost of the analyses prevents them from being used at run time, and Java
semantics may pose restrictions on stackable objects. Our region-based allocator aims
to reduce the work of garbage collector by allocating objects in temporary regions.
The technique needs no analyses and may be suitable for a run time system like a Java
Virtual Machine. One of our future research directions is to explore online escape
analysis to remove unnecessary barriers for region allocation.
McDowell [McD] reported the number of potentially stackable objects in a set of
Java benchmarks. Like other escape analyses, McDowell also made the assumption
that a compile time algorithm must make a decision for all objects created by an
allocation site, although he was using dynamic profiling information to conclude the
results. Our system does not require this limitation. An allocation site may create
objects in local regions before any of them is found to be escaped. Extensions of our
adaption algorithm may also allow allocation sites to become local again, even after
being marked as non-local.
Hallenberg [Hal99] introduced garbage collection into individual regions in Tofte’s
region inference system for the ML Kit. Although our collector has a similar name
46

as his system, the structures are quite different. In his system, the region inference
algorithm creates regions, and inside a region, a copying collector collects live objects.
The backbone of our system is a garbage collector, and the region is a natural way
to extend stack frames. The region organization serves as the basis of adaptive
allocation. Interested readers can find the design of Hallenberg’s system in [Hal99],
chapter 11.
3.7 Conclusions
We have presented an adaptive, region-based allocator for Java Virtual Machines and
studied the allocation behavior of Java programs on page-based heaps. The main idea
is to detect on-the-fly these allocation sites that do not escape their region, and then
manage these allocations in local regions that can be released when the associated
stack frame is popped.
We implemented the system using the Jikes RVM baseline compiler and associated
garbage collector, and we used this prototype to study the behavior of a collection of
Java benchmarks, including the SpecJVM98 benchmarks. This study showed that the
design of the system is crucial, including an appropriate choice of page size, and tech-
niques for minimizing space overhead and region allocation/deallocation overhead.
We also studied the adaptive mechanism of our system, and found that it quickly
found regions from which no object escaped.
Given our encouraging results, there are several directions to continue on this
work. First, we would like to profile and analyze important escaping allocation sites,
and develop necessary techniques to allow more objects be allocated on regions.
Our second major area of investigation is to look at a wider range of adaptive
mechanisms. In this work, we mark an allocation site as non-local as soon as one
object allocated from that site escapes. This scheme is a rather coarse and naive
prediction scheme. When we turn off the adaptation, this corresponds to a predictor
that always predicts that no object will escape. Our experiments show that this
second method works well for those programs where, in fact, a large portion of the
47

objects do not escape. We would now like to examine other more complex predictors.
For example, we could use more than 1 bit, and only mark an allocation site as non-
local after some number of objects escape. We could also increase the granularity of
the predictor by associating dirty bits with pages within regions, rather than having
1 bit per region. Another possibility is to reset allocation sites to being local at
intervals, for example at collection time or during phase shifts in the program. This
may help in the case where the same allocation site is sometimes local and sometimes
non-local. As part of this study we also would like to measure the effect of the regions
on memory locality.
Our final area of research is to examine the effect of our system when coupled with
different garbage collectors. As we pointed out in Section 3.4, it should be relatively
straightforward to incorporate our ideas in a variety of collectors.
48

Chapter 4
Runtime Techniques Supporting Speculative
Optimizations
Static program analyses for optimizations must be conservative to preserve the
semantics of original programs. Data-flow facts induced by static analyses must be
held regardless input data or execution environments because once the program is
compiled to binaries, the compiler has no control on the code and execution. In a JIT
environment such as a Java virtual machine, since compilers are part of the execution
engine, it is possible to dynamically change the compiled code.
In a Java virtual machine, classes are loaded dynamically, and methods are com-
piled lazily. When compiling a method, program properties collected by compilers are
held for loaded classes and compiled methods, but might be invalidated when more
classes are loaded later. We call optimizations based only on compile-time properties
speculative. Speculatively optimized code is only safe at compile time and might be
wrong in future execution.
In this chapter, we review existing techniques for supporting speculative optimiza-
tions in Java virtual machines. First, we review runtime guards for method inlining in
Section 4.2. Section 4.3 introduces more complicated code rewriting techniques: code
patching and on-stack replacement. Finally, in Section 4.4, we present our improve-
ment and implementation of an on-stack replacement in Jikes RVM. These techniques
can be used for supporting speculative optimizations using dynamic interprocedural
49

analyses results. Section 4.5 discusses related work.
4.1 Speculative inlining
Methods are important semantic abstraction boundaries of object-oriented programs.
Compiler writers, however, work hard to remove these boundaries to improve per-
formance. In the Java programming language, a virtual call has the form of <x,
A.m()> where x is a variable pointing to objects of type A or its subtypes, and m()
is the method signature. The real target of each invocation depends on the type of
object pointed to by the variable x at runtime. We call the object pointed to by x
the receiver of the call, and m() is a message sent from the caller. A method call
requires setting up a stack frame, passing parameters and returning the result. A
virtual call requires extra costs of looking up the target method. Method inlining is
an important optimization of object-oriented programs. Inlining reduces the direct
cost of calls and creates new optimization opportunities for the inlined code.
Due to polymorphism, a virtual call may invoke several different methods in the
course of program execution. The target method is determined by the type of the
receiver object and the callee method signature. A virtual call site can be categorized
into polymorphic or monomorphic. A polymorphic call site has more than one target
method during execution, and a monomorphic call site has only one target even
it is virtual. A type analysis, such as class hierarchy analysis (CHA) [DGC95],
can prove some virtual call sites are monomorphic and a compiler can inline these
monomorphic call sites speculatively. However, dynamic class loading grows the class
hierarchy during the program execution, and it may invalidate previous CHA results
for inlining. For example, a virtual call formally recognized as monomorphic by CHA
might become polymorphic in the future. Speculative inlining requires a backup
mechanism to ensure the correctness of optimized code in the presence of dynamic
class loading.
We use an example in Figure 4.1 to illustrate speculative inlining. A class A
declares a virtual method m() and a class B extends A without overriding the method
50

m(). Another class C extends A but overrides the method m(). We use the class
name followed by the method name (e.g., A.m() and C.m()) to distinguish methods
in different classes.
A
B C
m
m
if (cond)
foo(new B());
else
foo(new C());
void foo(A a) {
......
a.m();
......
}
Figure 4.1: An inlining example
If class C is not loaded when the method foo gets recompiled, CHA concludes
that the receiver type set of the call site a.m() is only A and B (assuming both were
loaded). The compiler can resolve the call target to be A.m() only. Thus, this is a
monomorphic call at the moment of optimization, and the compiler inlines A.m() into
foo. However, the compiler needs a mechanism to ensure that only objects of type
A or B can reach inlined code of A.m() since the class C can be loaded in the future
execution.
4.2 Class and method tests
4.2.1 Guarded inlining using class and method tests
First we review a simple technique, class tests, for ensuring the correctness of specu-
lative inlining. In Jikes RVM, as shown in Figure 2.1, an object has a pointer to its
class’s type information block (TIB). The compiler generates the code for the virtual
51

call a.m() of the form:
a_tib = a->TIB;
if (a_tib == A’s TIB)
inlined A.m()
else
normal virtual call
The inlined code of A.m() is guarded by a class test. If the runtime type of a is A,
the control falls through into inlined code of A.m(). Otherwise, it goes to the more
expensive virtual call implementation.
The drawback of class test is that it only covers the case when an object type is A.
If the object type is B, the control falls to the normal virtual call, although the target
is still A.m(). One remedy is to change the test to a tib == A’s TIB || a tib ==
B’s TIB, but it has two tests for type B and increases code density.
Detlefs and Agesen [DA99] provided a new solution to the dilemma of class test. It
uses method tests to guard inlining of virtual method invocations with the assumption
that the target can be obtained from the class information cheaply. In most Java
virtual machines, obtaining a method address from a virtual method table takes only
one load instruction. Foo’s compiled code using method tests would be as follows:
a_tib = a->TIB;
m_addr = a_tib[m->method_offset];
if (m_addr == A.m’s address)
inlined A.m()
else
normal virtual call
A single method test can cover more classes than a class test with the cost of
one load instruction in the fast path. The two techniques can be selectively used in
practice. For example, if the inlined method is in a final class, the class test can be
used since there is no other receiver types due to language constraints.
52
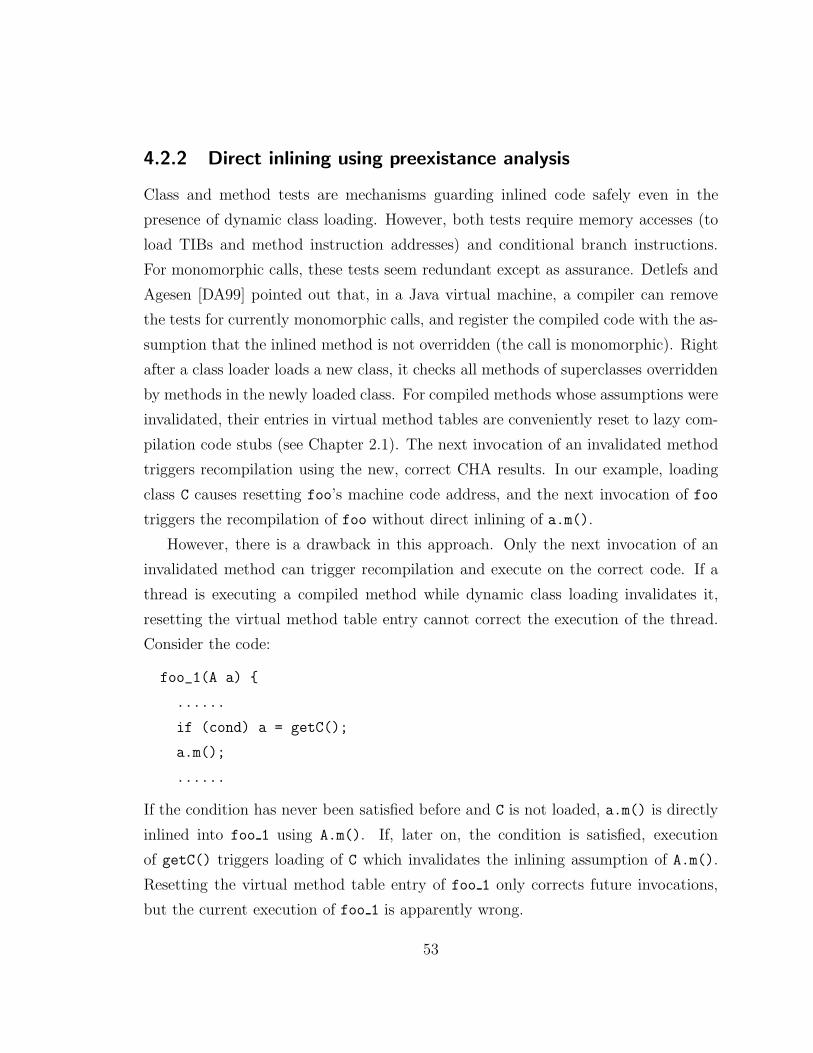
4.2.2 Direct inlining using preexistance analysis
Class and method tests are mechanisms guarding inlined code safely even in the
presence of dynamic class loading. However, both tests require memory accesses (to
load TIBs and method instruction addresses) and conditional branch instructions.
For monomorphic calls, these tests seem redundant except as assurance. Detlefs and
Agesen [DA99] pointed out that, in a Java virtual machine, a compiler can remove
the tests for currently monomorphic calls, and register the compiled code with the as-
sumption that the inlined method is not overridden (the call is monomorphic). Right
after a class loader loads a new class, it checks all methods of superclasses overridden
by methods in the newly loaded class. For compiled methods whose assumptions were
invalidated, their entries in virtual method tables are conveniently reset to lazy com-
pilation code stubs (see Chapter 2.1). The next invocation of an invalidated method
triggers recompilation using the new, correct CHA results. In our example, loading
class C causes resetting foo’s machine code address, and the next invocation of foo
triggers the recompilation of foo without direct inlining of a.m().
However, there is a drawback in this approach. Only the next invocation of an
invalidated method can trigger recompilation and execute on the correct code. If a
thread is executing a compiled method while dynamic class loading invalidates it,
resetting the virtual method table entry cannot correct the execution of the thread.
Consider the code:
foo_1(A a) {
......
if (cond) a = getC();
a.m();
......
If the condition has never been satisfied before and C is not loaded, a.m() is directly
inlined into foo 1 using A.m(). If, later on, the condition is satisfied, execution
of getC() triggers loading of C which invalidates the inlining assumption of A.m().
Resetting the virtual method table entry of foo 1 only corrects future invocations,
but the current execution of foo 1 is apparently wrong.
53

Detlefs and Agesen [DA99] pointed out that, if the receiver object of a call is
preexisting before the method, resetting its entry in virtual method table is sufficient
to ensure the safety because these method activations running on threads would not
create objects of newly loading classes. They proposed a simple invariant argument
analysis for proving the preexistance of receivers. The analysis tracks simple data-flow
between reference type variables. If a variable is only assigned values from parameters,
then it is preexisting before the method call. In our example, the parameter a of foo
is preexisting, but a of foo 1 is not.
For monomorphic calls whose receivers could not be proved to be preexisting, thin
guards [AR02] can be used to combine several tests into one test. Although guarded
inlining removes the overhead of building call stacks and passing parameters, the
control flow created by guards limits the effectiveness of further optimizations on
inlined code. The merge of inlined code and backup path essentially removes the
data-flow benefits from inlining. Thin guards are able to create large regions of
inlined code for optimizations. Control-flow splitting [CU91] breaks the merge by
duplicating the path and improves the effectiveness of optimizations.
4.3 Code patching and on-stack replacement
In this section, we discuss more complicated techniques for direct inlining of monomor-
phic virtual calls in the presence of dynamic class loading. One technique, code
patching, rewrites speculatively inlined code if dynamic class loading invalidates the
inlining assumption. Another technique, on-stack replacement, dynamically changes
the activation of an invalidated method to a safe one.
4.3.1 Code patching
Preexistance analysis may not always succeed on removing method and class tests
for inlined monomorphic calls. Ishizaki et. al. presented a code patching tech-
nique [IKY+00] to remove all method and class tests for monomorphic calls in the
presence of dynamic class loading. Code patching uses dynamic CHA to identify
54

monomorphic calls based on the class hierarchy at compile time.
Like a method or class test, code patching uses a guard at compile time. However,
the guard is not a test, but a condition that the inlined method is not overridden.
Using the previous example, Figure 4.2(a) shows the pseudo-IRs of inlined call. If
A.m() is not overridden at compile time, the compiler directly inlines it into foo,
and generates a backup path for the call. The conditional test is treated as a nor-
mal conditional branch instruction until code generation phase. When generating
machine code for the test, it is replaced by a label, start of inlined code, as shown
in Figure 4.2(b), and the condition, A.m() is overridden, is registered in a database
together with the machine code address offsets at start of inlined code and backup. If
C is loaded later and C.m() overrides A.m(), the Java virtual machine immediately
patches the first instruction at the label start of inlined code by a direct jump to the
backup path as shown in Figure 4.2(c). The virtual machine can optionally reset foo’s
entry in the virtual method table.
The advantage of code patching is that it removes memory loads and conditional
branch instructions. Also recompilation is not a necessity. The disadvantage is that it
needs to track detailed dependency and synchronize caches explicitly on some archi-
tectures. Preexistance based inlining can still be used together with code patching.
4.3.2 On-stack replacement
In a Java virtual machine, it is convenient to transition to a newly compiled version
of a method by resetting the entry of virtual method table. So the future method
invocations branch to the new version. However, the transition for a method that is
currently executing on some thread’s stack presents a harder engineering challenge.
In the case of direct inlining, if an invalidated method is executing on a thread’s
stack, the method activation must be transferred to a version without direct inlining.
Preexistance based inlining avoids direct inlining of calls that might be invalidated
and lead to wrong execution. Code-patching technique uses a similar idea as guarded
inlining except it removes memory accesses and conditional branch instructions. Now
55

if (A.m() is overridden) goto backup;
inlined A.m()
......
backup:
normal virtual call of a.m()
(a) compile-time guard of code patching
start_of_inlined_code:
inlined A.m()
......
backup:
normal virtual call of a.m()
(b) inlined call
start_of_inlined_code:
jump backup
......
backup:
normal virtual call of a.m()
(c) after code patching
Figure 4.2: Code patching example
56

we look at a more general and advanced technique, on-stack replacement, for in-
validating speculatively optimized code without the preexistance requirement, while
retaining better data-flow effects of optimized code than guarded inlining.
To perform the transition to a new version of compiled code, the SELF pro-
gramming language implementations [Hol94] pioneered on-stack replacement (OSR)
technology. OSR technology enables fundamental VM enhancements, including de-
bugging optimized code via de-optimization [Urs92], deferred compilation to improve
compiler speed and/or code quality [CU91], online optimization of activations contain-
ing long-running loops, and optimization and code generation based on speculative
program invariants.
Figure 4.3(a) is an example for demonstrating the concept of on-stack replacement.
In this case, the variable a is not preexisting, but A.m() is currently not overridden.
As shown in Figure 4.3(b), the compiler can perform direct inlining by inserting an
osr point in the code before the inlined code and after the assignment of a. An OSR
point is an intermediate instruction that uses all live variables at the point in the
original program. The OSR point also keeps a map from variable names to values or
locations after register allocation. In the example, the osr point instruction records
the stack locations of variables x and a, and also records the constant values of
variables i, j, and k. If the class C is loaded later on, the class loader can change the
instruction at osr point to a call of a special function to perform on-stack replacement.
The transition of optimized (wrong) code to unoptimized (correct) code is shown in
Figure 4.3(c). The left side is the state of foo’s optimized code when the execution
reaches the osr point. The right side is reconstructed stack frame for unoptimized
code at the entry point. The machine program counter is set to the entry point and
the execution will continue on unoptimized code with the new stack frame.
Holzle et. al. proposed an approach [Urs92] for performing transition for SELF
programs. Their approach introduces interrupt points in code to be invalidated and
entry points in the middle of another version of code. To perform transition from
one version of code to another version, the first step is to recover the source-level
program state. It is straightforward to recover such states from unoptimized code.
For optimized code, the compiler inserts a few interrupt points which are equivalent
57

void foo(int x) {
int i = 10, j = 20;
A a = getObject();
int k = i + j;
a.m(k);
......
}
(a) source code
a = call getObject;
osr_point (x, i=10, j=20, k=30, a);
inlined code of A.m(30);
......
(b) direct inline of A.m();
i = 10j = 20a = call getObjectk = i + j
a.m(k)entry_point:
a = call getObject;
inlined code of A.m(30)osr_point:
this
x
k=30
a
j=20
i=10
x
this
a
(c) transition to unoptimized code at OSR point
Figure 4.3: On-stack replacement example
58
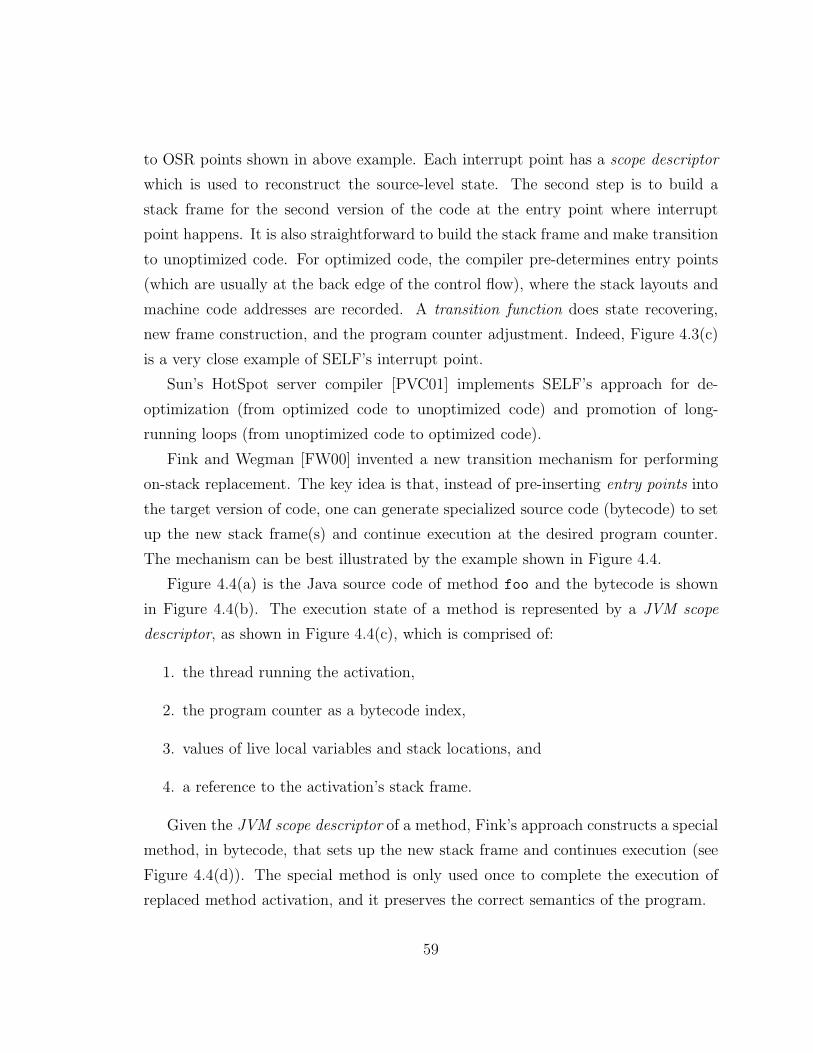
to OSR points shown in above example. Each interrupt point has a scope descriptor
which is used to reconstruct the source-level state. The second step is to build a
stack frame for the second version of the code at the entry point where interrupt
point happens. It is also straightforward to build the stack frame and make transition
to unoptimized code. For optimized code, the compiler pre-determines entry points
(which are usually at the back edge of the control flow), where the stack layouts and
machine code addresses are recorded. A transition function does state recovering,
new frame construction, and the program counter adjustment. Indeed, Figure 4.3(c)
is a very close example of SELF’s interrupt point.
Sun’s HotSpot server compiler [PVC01] implements SELF’s approach for de-
optimization (from optimized code to unoptimized code) and promotion of long-
running loops (from unoptimized code to optimized code).
Fink and Wegman [FW00] invented a new transition mechanism for performing
on-stack replacement. The key idea is that, instead of pre-inserting entry points into
the target version of code, one can generate specialized source code (bytecode) to set
up the new stack frame(s) and continue execution at the desired program counter.
The mechanism can be best illustrated by the example shown in Figure 4.4.
Figure 4.4(a) is the Java source code of method foo and the bytecode is shown
in Figure 4.4(b). The execution state of a method is represented by a JVM scope
descriptor, as shown in Figure 4.4(c), which is comprised of:
1. the thread running the activation,
2. the program counter as a bytecode index,
3. values of live local variables and stack locations, and
4. a reference to the activation’s stack frame.
Given the JVM scope descriptor of a method, Fink’s approach constructs a special
method, in bytecode, that sets up the new stack frame and continues execution (see
Figure 4.4(d)). The special method is only used once to complete the execution of
replaced method activation, and it preserves the correct semantics of the program.
59

void foo(int x) {
int i=10, j=20;
A a = getObject();
int k = i + j;
a.m(k);
......
}
(a) Java source code
running thread: MainThread
frame pointer: 0xSomeAddress
program counter: 21
local variables: L0(this), L1(x), L2(i)=10,
L3(j)=20, L4(a), L5(k)=30
stack expressions: S0=a, S1=30
(c) JVM scope descriptor for an activation of foo
0: bipush 10
2: istore_2
3: bipush 20
5: istore_3
6: aload_0
7: invokevirtual getObject()LA;
10: astore 4
12: iload_2
13: iload_3
14: iadd
15: istore 5
17: aload 4
19: iload 5
21: invokevirtual A.m(I)V
......
(b) bytecode
load (this)
astore 0
ldc (x)
istore 1
ldc 10
istore 2
ldc 20
istore 3
load (a)
astore 4
ldc 30
istore 5
load (a)
ldc 30
goto 21
0: bipush 10
......
21: invokevirtual A.m(I)V
......
(d) specialized version
Figure 4.4: Example of Fink’s OSR approach
60

Fink’s approach does not need a transition function to set up target stack frame
and does not require entry points in the target code. However, it needs to con-
struct and compile a specialized method. SELF’s approach requires modifications in
compilers to generate entry points in the code, which may limit the effectiveness of
some optimizations and require large engineering efforts. In contrast, Fink’s approach
only requires small modifications on existing compilers to compile specialized meth-
ods. The specialized method initializes locals and stacks with runtime constants, this
could enable more optimization opportunities. The cost of the Fink’s approach is
that it requires creating one specialized method for one replacement, and increases
the workload of dynamic compilation system.
We have extended Fink and Wegman’s mechanism to support de-inlining, and im-
plemented it in Jikes RVM (in collaboration with one of original authors, S.J.Fink).
Based on this OSR implementation, several optimizations, such as long-running
method promotion and deferred compilation, have been developed and evaluated [FQ03].
4.4 Improvement and implementation of on-stack re-
placement in Jikes RVM
When the optimizing compiler compiles a method, it first determines where to insert
osr points in the IR. The decision solely depends on the application of OSR. An OSR
point indicates the bytecode-level state can be recovered and on-stack replacement
can happen when the program execution reaches the program point.
4.4.1 Transition to de-inlined code
We extended Fink’s approach to support de-inlining. The ordinary approach can
handle the OSR points in the caller’s code. When the compiler inlines a call, an
osr barrier instruction is inserted before the inlined call site. The barrier collects live
variables before the call instruction and is passed to the compilation context of the
inlinee. If an osr point instruction is inserted in the inlined code, it uses not only
61

the inlinee’s live variables, but also those in osr barrier instructions from the caller.
This provides enough information to perform de-inlining if the osr point in the inlined
code is reached. After register allocation, the compiler builds a table mapping the
lives to physical positions (register numbers or spilling offsets) with detailed type
information. The table is encoded as an OSR map, some auxiliary information of the
compiled method.
When on-stack replacement happens, the system recovers JVM scope descriptors
for methods in the inlining chain. Each descriptor except the leaf refers to its inli-
nee’s descriptor. Figure 4.5(a) shows an example where method bar was inlined into
method foo, and on-stack replacement happens at the label B of bar. Recovered JVM
scope descriptors for foo and bar are shown in Figure 4.5(c) where foo’s descriptor
has a reference to the inlinee bar’s descriptor. As shown in Figure 4.5(c), the spe-
cialized bytecode for the inliner, foo prime, in addition to set up local variables and
stack expressions, makes a call to the specialized bytecode of the inlinee, bar prime.
Right after the call, the control jumps to the next instruction of the original call. In
bar prime, the prologue sets up locals and stacks.
4.4.2 Implementation
We have fully implemented Fink’s approach and improvement in Jikes RVM with ap-
plications of deferred compilation, long-running loop promotion [FQ03]. Linux/x86,
Linux/PPC, and AIX/PPC are supported. Here we discuss the general implementa-
tion strategy and engineering challenges encountered and our solutions.
When on-stack replacement is used for promoting long-running loops, the compiler
needs to extract the JVM scope descriptor from unoptimized code, which is relatively
easy because the baseline compiler generated code that mimics the JVM stack ma-
chine. If an application requires deoptimization, it needs help from the optimizing
compiler to insert osr points in the code. In the optimizing compiler, an osr point is
implemented as an OsrPoint instruction in Jikes RVM’s IR, which uses live variables
at its insertion point. An OsrBarrier is an instruction to hold live variables before an
inlined call. Live variables are aggregated to OsrPoint instructions in inlinees. After
62

void foo() {
bar();
A:
......
}
void bar() {
......
B:
......
}
(a) Java code. Bar is inlined into foo and
an OSR happens at program point B.
foo_prime :
<specialized foo prologue>
call bar_prime
goto A;
......
bar();
A:
......
bar_prime :
<specialized bar prologue>
goto B;
......
B:
......
(c) special methods for OSR transi-
tionfoo’s descriptor:
running thread
......
frame pointer
reference to bar’s descriptor
bar’s descriptor:
running thread
......
(b) JVM scope descriptors for foo and bar
Figure 4.5: De-inlining example
63

parsing inlined code, OsrBarriers are removed. As we discussed before, places to
insert OsrPoint instructions solely depend on the OSR application. For example, in
deferred compilation, OsrPoints replaces branch targets or exception handlers which
are never executed. An OsrPoint is also a GC point for reusing the code to build GC
maps.
Before generating machine code, OsrPoint instructions are expanded to runtime
services. Currently there are two implementations. The first implementation uses the
adaptive compilation system in Jikes RVM. An OsrPoint is implemented as a special
thread switch point. When a thread hits an OsrPoint, it is suspended. A separate
compilation thread inspects the suspended thread, performs on-stack replacement for
it, and re-schedules it afterwards. The second implementation simulates lazy method
compilation: each OsrPoint is replaced by a call of a runtime service; the service
inspects the current thread and performs on-stack replacement. Two approaches
differ in only how to schedule threads requiring on-stack replacement, but share most
of other code. The OSR runtime service can be broken down to several steps:
1. extract execution state from the top stack frame of a suspended thread,
2. generate new code for the suspended activation, and
3. transfer execution in the suspended thread to new compiled code.
Bytecode instructions for setting up new stack frames must be selected according
to the types of values. Type information in OSR maps serves this purpose. One
challenge of OSR transition is how to carry reference type values from old stack
frames to new stack frames.
Values extracted from stack frames are in binary format. If a value is a reference,
it is indeed the address of a live object. It is not feasible to use the row addresses dur-
ing the OSR transition because the process may trigger GC and objects get moved.
Jikes RVM provides primitives to disable and enable GC. If a system method needs
to manipulate row addresses of some objects, it should disable GC first. After ma-
nipulation, it re-enables GC. We call such a region GC-critical. A GC-critical region
64

has to be small, and the code in the region should not trigger GC. OSR transition
code does not fit in one GC-critical region.
To solve this problem, we only create a GC-critical region for converting row
addresses to normal Java references when extracting JVM scope descriptors. These
references are saved in a temporary object array, which is subject to normal garbage
collection. In the prologue of specialized method, loading a reference value to stack
or local variable is done by bytecode instructions reading the element of the object
array (indexes are known when storing references into the array).
Based on the implementation, Fink conducted some experiments of deferred com-
pilation and long-running loop promotion. More experimental results can be found in
the paper [FQ03]. On-stack replacement is considered as a powerful, yet expensive,
invalidation mechanism. Therefore, an application has to use it wisely. Ideally, it
should be used in the situation where invalidation is rare. We have not used on-stack
replacement to perform direct inlining.
4.5 Related work and discussion
Guarded inlining uses runtime tests to ensure the correctness of optimized program.
The optimized code preserves the semantics of original program regardless the in-
put data and execution environments. However, code patching, preexistance based
inlining, and on-stack replacement present a new scenario for optimizations, where
optimized code is correct only with respect to the execution environment at opti-
mization time. These techniques ensure that the system has ability to correct the
invalidated code if future execution violates optimization assumptions. However, if
the assumption is most likely to be true in the future, speculation enables more ef-
fective and aggressive optimizations. One common of three techniques is that the
system knows when a speculation is violated and takes safety measurements before
the execution goes wrong.
One application of on-stack replacement is to choose compilation and optimization
65

units better than methods in a JIT environment. Whaley’s partial method compi-
lation [Wha01] essentially applies SELF-91’s uncommon branch extension to “rare”
blocks as determined by heuristics or profile data. His work assumes on-stack re-
placement is ready for use. Suganuma et. al [SYN03b] extends Whaley’s approach
further to use regions as compilation units. A region is a collection of code from
several methods excluding rarely executed portions. At region exit point, it requires
on-stack-replacement to transfer the execution to the original methods.
Bruening and Duesterwald [BD00] explored alternative compilation units for Java.
Their results suggest that using hot loops and traces, in combination with methods, as
compilation units can reduce compiled code size while preserving acceptable coverage
of optimized code.
The techniques we discussed in this chapter ensure the correctness of speculative
optimizations. The execution of optimized code preserves the semantics of original
program at anytime. A more aggressive approach is to speculatively execute the
program and correct the machine state if the speculation is wrong. RePLay [PL01] is
a proposed hardware framework supporting speculative execution. We are not aware
of software approaches that support speculative execution.
66

Chapter 5
Online Call Graph Construction
In this chapter, we study the call graph construction problem in Java virtual ma-
chines. The chapter is organized as follows. First we introduce the problem and
motivation in Section 5.1. Section 5.2 reviews several classical static call graph con-
struction algorithms for object-oriented programs. Then we describe three runtime
type analyses for computing conservative call graphs in Section 5.3. A new call graph
profiling mechanism is introduced in Section 5.4. We evaluated each algorithm by an-
alyzing the cost of the analysis and comparing the quality of constructed call graphs
on a set of standard Java benchmarks. Finally the related work and conclusion is
discussed in Section 5.5.
5.1 Motivation
Interprocedural analyses (IPAs) derive more precise program information than in-
traprocedural ones. Static IPAs provide a conservative approximation of runtime
information to clients for optimizations. A foundation of IPA is the call graph of the
analyzed program.
A call graph is a directed graph that represents call relations between methods
(or functions in the C programming language). There exists a directed edge from a
method A to a method B if A calls B. The precision of a call graph can be measured
by two metrics: flow-sensitivity and context-sensitivity. A flow-sensitive call graph
67

differentiates edges from different call sites in the same caller to a callee. For example,
the method A may have two call sites s1 and s2 both calling the method B, a flow-
insensitive call graph has one edge from A to B, but a flow-sensitive graph has two
distinct edges from A.s1 to B and A.s2 to B. Flow-sensitive call graphs are useful for
flow-sensitive analyses, and flow-insensitive call graphs are usually more compact.
The second measurement of call graphs is the context-sensitivity. Figure 5.1(a)
is a simple example for showing call graphs with different context-sensitivity. Fig-
ure 5.1(b) shows the call graph without contexts (we call it 0-degree context-sensitive).
This is not very useful because an analysis has to assume that a method can be
called by all methods. A most commonly used call graph is the one with 1-degree
context-sensitivity, as shown in Figure 5.1(c), where each method is represented as
one node in the graph and edges are call relations between methods. Usually we call
it context-insensitive comparing to ones with higher degrees shown in Figure 5.1(d).
In Figure 5.1(d), a callee has one representative node for each calling context. In this
study, we focus on constructing context-insensitive call graphs since it is most widely
used by interprocedural analyses.
A main feature of object-oriented (OO) programming languages is the support of
polymorphism. A polymorphic call is a call site which may invoke different method
during program execution. Polymorphism has big engineering benefits for program
design, code reuse and easy maintainance, and it is typically used for developing large
frameworks, the Java utility library is such an example. In the Java programming lan-
guage, polymorphism is implemented as virtual method calls, which target is looked
up by the type of receiver object and callee signature at runtime. Although virtual
calls increase the flexibility of program design, they incur large runtime overhead
comparing to static calls whose targets can be statically binded at compile time.
From compiler writers, virtual calls also pose difficulties on program analyses and
optimizations.
Since a program analysis analyzes the code before its execution, it is not possible to
know the exact runtime types of a receiver at a virtual call site. However, language
constraints and program contexts can let the analysis compute a super set of the
receiver’s runtime types. The central problem of static call graph construction for
68

foo() { bar() {
gee(); gee();
} }
gee() {...}
(a) a simple example
foo bar
gee
(b) call graph without context
(0-degree)
foo bar
gee
(c) context-insensitive call
graph (1-degree)
foo bar
gee gee
(d) context-sensitive call graph
(2-degree)
Figure 5.1: Call graphs with different context-sensitivity
69

object-oriented programs is often converted to efficient computation of accurate type
sets of receiver variables at virtual call sites.
In addition to virtual calls, call graph construction for Java is further complicated
by the presence of dynamic class loading. Static call graph constructors assume that
all code that may be executed at runtime is available for analyzing. In a Java virtual
machine, however, classes are loaded dynamically to reduce resource usage. It is also
beneficial to delay the resolution of symbolic references as late as possible until the
referred entity is required. A call graph constructor or program analysis should avoid
triggering the resolution of these unresolved references. Therefore, a dynamic call
graph has to be incremental (dealing with dynamic class loading), efficient, and type
safe.
In next several sections, we show a general approach for handling Java’s dynamic
features seamlessly in a JIT environment. Our approach also has little overhead on
the execution of applications. First, we review classical static call graph construction
algorithms for object-oriented programs. Then we show how to adapt and extend
several static type analyses to runtime for computing dynamic call graphs. We intro-
duce a new mechanism that uses a profiling code stub to capture invoked call edges.
The call graph constructed by our profiling mechanism is dramatically smaller than
those computed by type analyses. All algorithms are designed to be efficient and can
be used in practice. A very desirable feature of our approach is that call graphs can
be built incrementally while execution proceeds. An interprocedural analysis based
on dynamic call graphs can support speculative optimizations.
5.2 Static call graph construction for OO programs
A static call graph is constructed by using a type analysis to compute runtime type
sets of reference variables. The type set is then used, together with a callee signature,
to resolve the set of targets of a virtual call. A static type analysis requires all classes
are available and a complete class hierarchy can be constructed at analysis time.
70

5.2.1 Class hierarchy analysis and rapid type analysis
In a strongly typed language such as Java, each variable has a declaring type. At
runtime, the variable can only point to objects of its declaring type and subtypes.
Class hierarchy analysis (CHA) [DGC95] exploits this language constraint. CHA
makes a conservative assumption that all subtypes of a receiver’s declaring type are
possible types at runtime (the most conservative assumption is that all types are
possible, and this yields no useful information for program analyses).
Given a complete class hierarchy and a type T, we define a set, hierarchy types(T),
be the type T and its subtypes in the hierarchy. Given a call site s whose receiver’s
declaring type is C, the class hierarchy analysis assumes hierarchy types(C) is the
runtime type set of the receiver (in other words, all types not in hierarchy types(C)
cannot be receiver types of s). For Java programs, we can limit hierarchy types to
only normal classes (vs. interface) since interfaces cannot be instantiated. Abstract
classes are regarded as normal too. If C is an interface, hierarchy types(C) includes
normal classes that implement C directly or indirectly. The cost of static CHA is
merely the cost of constructing class hierarchy, which can be done very easily and
quickly by any modern compiler.
Rapid type analysis (RTA) [BS96] uses program contexts to refine type sets com-
puted by CHA. Given a program P, only types with allocation sites in P’s program
text can be instantiated at runtime. Therefore, the type set of a receiver can be
pruned by removing classes in hierarchy types(C) that do not have allocation sites in
the program P.
To gather types with allocation sites, RTA needs to parse the program text linearly.
The time and space required by RTA is minimal. RTA is considered to be a fast and
effective improvement of CHA.
5.2.2 Reachability-based interprocedural type analysis
Further constraints can be derived from program texts by analyzing and tracking
data flows. Reachability-based algorithms [Ste96,And94,TP00, SHR+00] build flow
graphs for the program at different granularity levels. Variables have representative
71

nodes in the flow graph, and assignments are formulated as flow edges between nodes.
Interprocedural data-flow is built on a call graph computed by CHA or RTA.
If an allocation site can reach a variable in the flow graph, the allocated type is
considered to be in the runtime type set of the variable. A variable’s declaring type
can be used to filter out reachable types that are not in its subtypes, either during or
after the propagation.
Algorithms often trade the time and space with precision. Context-insensitive
algorithms can be modelled as unification-based [Ste96] or subset-based [And94]
propagation as points-to analysis. The complexity varies from O(Nα(N, N)) for
unification-based analysis to O(N3) for subset-based analysis. Context-sensitive al-
gorithms [EGH94,WL95] might yield more precise results but are difficult to scale to
large programs.
The results of a static type analysis can be used to prune the basic call graph
or guide the inlining of virtual calls. In this thesis, we developed online versions of
two reachability-based type analyses, XTA [TP00] and VTA [SHR+00]. Since these
type analyses are performed in a JIT compiler, the results are only used for method
inlining in our study.
5.3 Runtime call graph construction using type anal-
yses
Now we discuss how to adapt static CHA and RTA to dynamic ones for incrementally
constructing call graphs in a JIT compiler. We present a general approach for handling
dynamic class loading and lazy resolution of symbolic references. We also describe a
new dynamic type analysis, ITA, which uses unique runtime allocation information
to further improve the results of CHA and RTA.
72

5.3.1 Dynamic CHA and RTA for call graph construction
Dynamic CHA. At runtime, a Java virtual machine maintains a hierarchy of loaded
classes. As program’s execution proceeds, new classes may be loaded and added to
the hierarchy. Thus, the hierarchy tree grows dynamically. The compiler can compute
a dynamic hierarchy types set of C by walking through the snapshot of the hierarchy
at an execution point. In contrast to the static hierarchy types(C), the dynamic one
can expand as the class hierarchy grows.
In a Java virtual machine, a class has to be initialized before its first instance
gets created (see Section 1.1 for more details on class loading process). Given a
program P, we define the set of initialized classes as initialized types(P). Since class
initialization is triggered by the virtual machine, the set initialized types(P) is built
and dynamically expanded by the runtime system. Given a variable o with a declaring
type T, the dynamic CHA computes the type set of o by
type sets(o) = hierarchy types(T ) ∩ initialized types(P )
Dynamic RTA. In Java virtual machines, a method is parsed by interpreters or
JIT compilers before its execution. Dynamic RTA can collect all allocation sites of
parsed methods encountered so far.
Given a program P, we define the set of types used by allocation expressions in
parsed methods of P as rapid types(P)1. The type set of o is defined as the intersection
of hierarchy types(T) and rapid types(P):
type sets(o) = hierarchy types(T ) ∩ rapid types(P )
The rapid types(P) contains only initialized classes (initialized implies resolved), there-
fore, it is strictly smaller than initialized types(P).
To unify implementations of dynamic CHA and RTA, we define a meta type
set eligible types(P) which is initialized types(P) when using CHA or rapid types(P)
when using RTA. Because the bytecode does not carry the static declaring type of
1Classes that create objects via newInstance method are treated as members of rapid types(P)immediately.
73

a variable from the source language, we use the declaring type of the callee method
for computing call targets. Java’s static type system implies this is a safe solution.
When analyzing a call site, S, with a resolved method reference of C.m, The analysis
computes possible targets using the following algorithm:
for each class sC in hierarchy_types(C)
if sC is not in eligible_types(P)
continue;
while sC != null
if sC declares m
generate a call edge from S to sC.m
break;
else
sC = sC’s super class
One caveat of dynamic RTA is that when the JIT compiler compiles an allocation
site with a type reference mref, the reference may not be resolved yet. An unresolved
symbolic reference is only the name of a class. Now we discuss handling of dynamic
class loading and unresolved type references.
Dealing with dynamic class loading. In a Java virtual machine, dynamic class
loading can happen in two forms: by implicitly accessing a class or a class member, or
by explicitly load a class using Class.forName method. Dynamic class loading causes
the hierarchy tree to grow, and expands hierarchy types sets. When using dynamic
CHA, the initialized types(P) set is dynamically expanded as well. As for dynamic
RTA, new members are added into rapid types(P) when new methods are parsed. All
that means analyzed call sites may have new runtime types, and both analyses must
fix them properly by considering the expansion of type sets.
Our solution to type set expansion is to maintain a map resolved sites : m →
{s, . . .}, where m is a resolved method, and s is a parsed call site whose resolved
callee signature is m. Let T be a new member of the meta type set eligible types(P),
dynamic CHA and RTA fix parsed call sites using the following algorithm:
for each virtual method m declared in T
74

for each method m’ overridden by m
for each s of resolved_sites(m’)
generate a call edge from s to m
Handling unresolved references. At compile time, a call site may have an
unresolved method reference which cannot be resolved without loading new classes.
A call graph constructor should not resolve such references because class loading
incurs runtime overhead. Instead, unresolved call sites are put in a separate database
using the method reference as index: unresolved sites : mref → {s, . . .}. The
database monitors method reference resolution events. When a method reference
mref is resolved to a method m, a new entry m → unresolved sites(mref) is added
to the resolved sites database discussed in previous paragraph.
Unresolved type references must be dealt with correctly for dynamic RTA. The
analysis may encounter allocation sites whose allocation types are unresolved. An
unresolved type reference is only a class name. To ensure the correctness, classes
resolved from these references should be added into the rapid types(P) as soon as
they are initialized. Our solution is to track the set of unresolved types from parsed
allocation sites, and monitors type reference resolution events. A newly resolved type
from the set is marked and added into rapid types(P) after its initialization.
Dynamic CHA and RTA do not need runtime checks in application code. All
events triggering the analyses happen at class loading, reference resolution and method
compilation time. The only cost is to maintain dependency databases that incur mem-
ory overhead. In our implementation, we use special integer sets and hash tables for
saving memory.
5.3.2 Instantiation-based type analysis
Dynamic RTA improves the results of CHA by reducing the size of the meta set eligi-
ble types(P) of a program P. Java explicitly requires garbage collection as its dynamic
memory management. Objects are allocated through a memory management inter-
face. This allows the virtual machine know the exact set of classes that have instances
at runtime. Only classes with instances can be the runtime types of a receiver. This
75

leads to a new improvement of the class hierarchy analysis, instantiation-based
type analysis (ITA).
During the execution of a program P, we define a set instantiated types(P) as the
set of types that have had instances. It is easy to see that instantiated types(P) is a
subset of rapid types(P)2. Given a variable o with a declaring class C, the type set
computed by ITA is the intersection of hierarchy types(C) and instantiated types(P):
type set(o) = hierarchy types(C) ∩ instantiated types(P )
In Jikes RVM, objects are created in heaps via allocators. An allocator takes a
type and returns an object. Building instantiated types(P) is straightforward. The
allocation sequence checks if the type passed in was in the set. If not, it adds the
type as the new member to the set. When building the bootimage, the bootimage
writer builds the type set by scanning objects in the bootimage. The meta type set,
eligible types(P), is instantiated types(P) for ITA, and algorithms for dealing with
unresolved method references and type set expansion are shared among CHA, RTA
and ITA.
When compilers compile a new bytecode instruction, if the type reference is re-
solved and is in the instantiated types(P) set, then the instruction is compiled to a
runtime service without checks. This can happen in two situations: another alloca-
tion site of the same type was executed before compiling the current site; the current
allocation site is being recompiled in an adaptive system.
Table 5.1 shows the number of scalar allocations that require a check at runtime
in our benchmarks. The second column shows the dynamic counts of total allocations
during benchmark runs. The third column lists the number of allocations requiring
checks, followed by the percentages of total allocation counts. Except 201 compress
and 222 mpegaudio, which are not allocation intensive, other benchmarks only need
checks for a small portion of allocations. Overall, adding a check in the allocation
sequence does not cause measurable effects.
2Classes that create objects via newInstance method are treated as members of rapid types(P)and instantiated types(P).
76

benchmark total checks
201 compress 455,488 450,585 (99%)
202 jess 57,410,199 3,760,777 (7%)
209 db 32,247,049 1,036,771 (3%)
213 javac 54,486,512 20,475,862 (38%)
222 mpegaudio 1,817,243 1,789,324 (98%)
227 mtrt 61,766,963 4,643,998 (8%)
228 jack 51,622,992 10,318,194 (20%)
SpecJBB2000 347,774,820 119,048,760 (34%)
CFS 8,085,943 2,726,610 (34%)
Table 5.1: The number of scalar allocations with checks
5.3.3 Characteristics of dynamic CHA, RTA, and ITA
Dynamic ITA and RTA improves CHA by reducing the size of the meta set eligi-
ble types(P). Table 5.2 shows the size of the meta type set at the end of benchmark
runs. Columns 2 to 4 show the total numbers of classes in eligible types(P) used by
CHA, RTA and ITA. The rest of columns break the number further down to two
categories: classes belonging to Jikes RVM and classes in applications and libraries3.
The numbers of classes from Jikes RVM are very close for different benchmarks, the
numbers of application and library classes vary a lot. The size difference between
initialized types(P) and rapid types(P) is pretty small in all categories. It indicates
that the dynamic RTA is less effective on improving CHA. However, among initialized
classes, only less than half of them have created instances at runtime. This can be
explained that many kinds of bytecode instructions can trigger class loading and ini-
tialization. For example, static field accesses and static method invocations can cause
class loading and initialization, and if a class is initialized, its superclasses must be
initialized too. The much smaller instantiated types(P) indicates ITA could improve
the results of CHA more than dynamic RTA.
3We use the package name to distinguish the source of classes, some library classes are used byboth the RVM and the applications.
77

all RVM app&lib
benchmark (P) CHA RTA ITA CHA RTA ITA CHA RTA ITA
201 compress 1160 1042 541 854 767 409 306 275 132
202 jess 1290 1169 672 854 767 414 436 402 258
205 raytrace 1173 1053 557 854 767 413 319 286 144
209 db 1154 1035 542 854 767 416 300 268 127
213 javac 1286 1163 658 854 767 419 443 396 239
222 mpegaudio 1190 1063 567 854 767 414 336 296 153
227 mtrt 1173 1053 557 854 767 413 319 286 144
228 jack 1194 1073 575 854 767 413 340 306 162
SpecJBB2000 1264 1130 643 854 767 415 410 363 228
CFS 1185 1060 571 854 767 415 331 293 156
Table 5.2: Statistics of initialized types(P), rapid types(P) and instantiated types(P)
5.3.4 Evaluation
In this section we evaluate dynamic CHA, RTA and ITA for constructing call graphs.
Jikes RVM is written in Java and it has many more classes than any benchmark
we have. If an analysis includes RVM classes, the results would be overwhelmed by
the information from these classes. The production configuration of Jikes RVM is a
FastAdaptive setup (it can choose different garbage collectors). FastAdaptive config-
uration pre-compiles all RVM classes (the runtime system, compilers, garbage collec-
tors, and some core Java libraries) into the bootimage (native code and resources).
Although this configuration takes longer time to build the bootimage and may have
larger memory footprint, the execution is much faster than a thin configuration that
has to compile the optimizing compiler itself at runtime. In our evaluation of call
graph construction, we use the FastAdaptive configuration.
To construct call graphs for bootimage classes, dynamic CHA, RTA and ITA re-
quire the bootimage compiler to collect call sites of methods compiled into the bootim-
age. All call sites are treated as unresolved and registered in unresolved sites(P).
78

ALL non-virtual virtual interface
CHA 146,740 35,292 51,706 59,742
RTA 145,427 99.1% 35,292 50,660 98.0% 59,475 99.6%
ITA 69,893 47.6% 35,292 25,898 50.0% 8,703 14.6%
Table 5.3: Call graph size of bootimage classes only
Besides the registered call sites, dynamic CHA does not require special care because
the class hierarchy is built in the bootimage. Dynamic RTA requires the compiler to
mark types of allocation sites as in rapid types(P). When copying objects from host
Java virtual machine to the RVM bootimage, ITA puts object types into instanti-
ated types(P). All classes in the bootimage are initialized.
When executing an application, Jikes RVM first loads the bootimage into the
heap and initializing other necessary resources. Before starting the main application
thread, the RVM calls the type analysis which goes through registered call sites from
the bootimage and builds call edges for resolved ones just as they are newly compiled.
Table 5.3 shows the number of call edges built by dynamic CHA, RTA, and ITA,
for bootimage classes only. All call graphs are flow-sensitive unless otherwise stated.
The second column shows the total number of call edges in the graph, and columns
3 to 5 breaks them further down to three categories according to the type of each
call sites. Non-virtual calls includes call edges from invokestatic and invokespecial.
Since these non-virtual calls are treated in the same way by analyses, the number
of call edges are the same as well. We are interested in the last two columns: call
edges from invokevirtual (column 4) and invokeinterface (column 5). Comparing to
the call graph built by CHA, dynamic RTA has nearly no improvement of call graphs
constructed by CHA. Dynamic ITA removes about 58% edges from invokevirtual and
86% from invokeinterface. However, this improvement is not meaningful since the
bootimage is statically compiled. It only serves the purpose to be compared with
Table 5.4.
Table 5.4 compares the call graph sizes in the same way as Table 5.3 except that
the call graph contains application and library classes of 213 java benchmark. When
79

ALL non-virtual virtual interface
CHA 167,519 37,297 65,779 64,443
RTA 166,053 99.1% 37,297 64,580 98.1% 64,176 99.6%
ITA 131,206 78.3% 37,297 57,440 87.3% 36,469 56.6%
Table 5.4: ( 213 javac) call graph size when including bootimage classes
application and library classes participate the analysis, dynamic ITA removes 13% of
call edges from invokevirtual and 44% from invokeinterface. Recall that dynamic ITA
only has negligible runtime overhead, it is a good replacement of CHA for building a
call graph including the bootimage.
Now we look at call graph sizes for application and library classes only. Ta-
ble 5.5 compares edges numbers by dynamic CHA, RTA, and ITA of all benchmarks.
Columns have the same meaning as Table 5.3 and 5.4. Invokevirtual bytecode con-
tributes more edges than other kinds of calls. Using CHA constructed call graph
as the base, dynamic RTA removes only 2 to 3% edges from invokevirtual, and ITA
reduces the number of edges up to 10%. Dynamic ITA is less effective on application
classes than on bootimage classes.
From Table 5.3 and 5.5, we can see the dynamic CHA leaves a small room for
improvement by other type analyses. This is a very different characteristic of static
CHA and dynamic CHA.
It is worth to point out that the number of call edges of 213 javac in Table 5.4 is
much larger than the sum of edge numbers from Table 5.3 and 5.5. The bootimage
contains RVM classes that have been initialized. Methods other than static class
initializers (< clinit >) are compiled but not executed. Many RVM classes only
have instances when running applications. Thus, the initialized types(RVM) from
the bootimage does not contain many RVM classes which are used by compilers and
garbage collectors at runtime.
Because RVM classes and application classes share the same class hierarchy and
the same meta type set, mixing them together generates false call edges from RVM
call sites to application methods and from application call sites to RVM methods too.
80

benchmark ALL non-virtual virtual interface
201 compress CHA 1862 1057 774 31
RTA 1843 1057 755 97.5% 31
ITA 1802 2057 730 94.3% 15
202 jess CHA 4325 1762 2070 493
RTA 4286 1762 2033 98.2% 491
ITA 4171 1762 1955 94.4% 454
205 raytrace CHA 3023 1241 1751 31
RTA 3003 1241 1731 98.9% 31
ITA 2951 1241 1695 96.8% 15
209 db CHA 2177 1107 941 129
RTA 2157 1107 921 97.9% 129
ITA 2059 1107 895 95.1% 57
213 javac CHA 14936 2038 12390 508
RTA 14783 2038 12227 98.7% 508
ITA 13796 2038 11502 92.8% 256
222 mpegaudio CHA 2520 1236 1239 45
RTA 2470 1236 1189 96.0% 45
ITA 2412 1236 1147 92.6% 29
227 mtrt CHA 3024 1242 1751 31
RTA 3004 1242 1731 98.9% 31
ITA 2952 1242 1695 96.8% 15
228 jack CHA 4658 1940 2278 440
RTA 4618 1940 2238 98.2% 440
ITA 4352 1940 2204 96.8% 208
SpecJBB2000 CHA 7186 2002 4775 389
RTA 7128 2002 4717 98.8% 389
ITA 6923 2002 4623 96.8% 278
CFS CHA 3385 689 2545 151
RTA 3331 689 2491 97.9% 151
ITA 3074 689 2285 90.0% 100
Table 5.5: Call graph size comparison of dynamic CHA, RTA, and ITA (application
and libraries)
81

In order to get effective optimizations on application code in Jikes RVM, we need a
sound approach to distinguish RVM classes from application classes instead of just
using package names. Unfortunately, this is currently an open question in research
community using Jikes RVM.
5.4 Accurate call graph construction using profiling
code stubs
Dynamic type analysis, such as CHA, RTA, and ITA, can be used to build conservative
call graphs at runtime. However, it is desirable to have a more precise call graph for
most interprocedural analyses. Also we would like to find the answer of the question:
how precise are these call graphs built by type analyses?
Instead of using type analysis to compute a conservative call graph, we propose
a dynamic approach for profiling and constructing context-insensitive call graphs at
runtime. The mechanism initializes virtual method tables using a profiling code stub.
When a method call happens, the code stub is executed. The code stub generates a
call edge event, then triggers method compilation if the method is not compiled yet,
and finally patches the virtual method table using the method code address.
The proposed mechanism has some very desirable features as a runtime call graph
constructor:
Accuracy. Only executed call edges are in the call graph.
Efficiency. It captures the first invocation event of each call edge, and only the first
execution has some profiling overhead. The repeated calls only need to execute
at most one more instruction. We also show several optimizations to reduce the
overhead further.
Just-in-time: A call edge is captured before the control flow is transferred to the
callee. Clients, such as call graph builders, can register callback routines called
by the profiling code stub when new call edges are discovered. Callbacks can
82

perform necessary actions before the callee is invoked. This enables speculative
optimizations with invalidation.
Flexibility: The profiling mechanism can be used in conjunction with type analyses.
For different kinds of call sites, we can choose profiling or type analysis for
trading off efficiency and accuracy.
The remainder of this section is structured as follows. First, in Section 5.4.1 we
give the necessary background, describing the implementation of virtual method ta-
bles in Jikes RVM. In Section 5.4.2 we describe the basic mechanism we propose for
building call graphs at runtime, and in Section 5.4.3 we show how this basic mecha-
nism can be optimized to reduce overheads. Finally, in Section 5.4.4, we measure the
cost of call graph profiling and compare profiled call graphs to ones constructed by
using dynamic CHA.
5.4.1 Background: virtual method table
Before jumping into details of the profiling mechanism, it is necessary to understand
how virtual method calls are implemented in Jikes RVM. We first revisit the virtual
method dispatch table in Jikes RVM [AAB+00], which is a standard implementation
in modern Java virtual machines. Figure 5.2 depicts the object layout in Jikes RVM.
Each object has a pointer, in its header, to the Type Information Block (TIB) of its
type (class). A TIB is an array of objects that encodes the type information of a class.
At a fixed offset from the TIB header is the Virtual Method Table (VMT) which is
embedded in the TIB array. A resolved method has an entry in the VMT of its declar-
ing class, and the entry offset to the TIB header is a constant, say method offset,
assigned during class resolution. A VMT entry records the instruction address of the
method that owns it. Figure 5.3 shows that, if a class, say A, inherits a method from
its superclass, java.lang.Object, the entry at the method offset in the subclass’
TIB has the inherited method’s instruction address. If a method in the subclass, say
D, overrides a method from the superclass, the two methods still have the same offset,
but the entries in two TIBs point to different method instructions.
83

other type information
virtual method table
method instruction addressA’s TIB
an object of A
fields
header
Figure 5.2: TIB in Jikes RVM
java.lang.Object
A
E
VMT
D
method instruction address
overriding method instruction address
Figure 5.3: VMT in Jikes RVM
84

Given an object pointer at runtime, an invokevirtual bytecode is implemented by
three basic operations:
TIB = * (ptr + TIB_OFFSET);
INSTR = TIB[method_offset];
JMP INSTR
The first instruction obtains the TIB address from the object header. The address of
the real target is loaded at the method offset offset in the TIB. Finally the execution
is transferred to the target address.
Lazy method compilation works by first initializing TIB entries with the address
of a lazy compilation code stub. When a method is invoked for the first time, the
code stub gets executed. The code stub triggers the compilation of the target method
and patches the address of the compiled method into the TIB entry (where the code
stub resided before).
5.4.2 Call graph construction by profiling
Lazy method compilation code stub captures the first invocation of a method without
distinguishing callers. It can be viewed as constructing a call graph with 0-degree
context-sensitivity (e.g., Figure 5.1(b)) where a method can be called by all compiled
methods. The space overhead of lazy method compilation is that each method requires
a TIB entry. If there are n methods, it requires n TIB slots.
Given n methods, there are n2 possible call edges in an 1-degree context-sensitive
call graph (e.g., Figure 5.1(c)). In order to capture call edges, we extended the TIB
structure to store information per caller. Figure 5.4 shows the extended TIB structure.
The TIB entry of a method is replaced by an array of instruction addresses. We call
the array a Caller-Target Block (CTB). The indexes of CTB slots (caller index) are
dynamically assigned to callers4 of the method by the JIT compilers. The up-bound
of memory overhead for CTBs could be n2. But dynamic assignment of CTB indexes
reduces the memory requirement to a very low level. Note that now an invokevirtual
bytecode takes one extra load to get the target address.
4or call sites if the call graph is flow-sensitive.
85
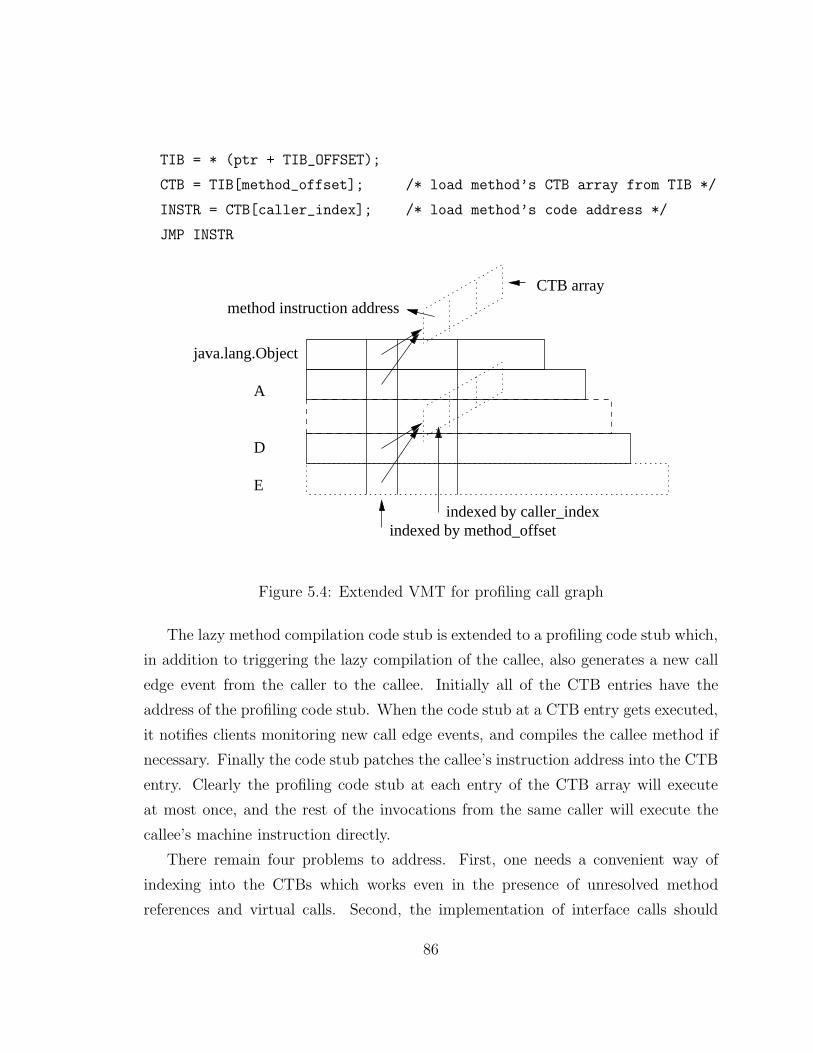
TIB = * (ptr + TIB_OFFSET);
CTB = TIB[method_offset]; /* load method’s CTB array from TIB */
INSTR = CTB[caller_index]; /* load method’s code address */
JMP INSTR
java.lang.Object
A
D
E
method instruction address
CTB array
indexed by caller_indexindexed by method_offset
Figure 5.4: Extended VMT for profiling call graph
The lazy method compilation code stub is extended to a profiling code stub which,
in addition to triggering the lazy compilation of the callee, also generates a new call
edge event from the caller to the callee. Initially all of the CTB entries have the
address of the profiling code stub. When the code stub at a CTB entry gets executed,
it notifies clients monitoring new call edge events, and compiles the callee method if
necessary. Finally the code stub patches the callee’s instruction address into the CTB
entry. Clearly the profiling code stub at each entry of the CTB array will execute
at most once, and the rest of the invocations from the same caller will execute the
callee’s machine instruction directly.
There remain four problems to address. First, one needs a convenient way of
indexing into the CTBs which works even in the presence of unresolved method
references and virtual calls. Second, the implementation of interface calls should
86

be aware of the CTB array. Third, non-virtual calls (static methods and object
initializers) can be handled specially. Fourth, we must handle the case where an
optimizing compiler inlines one method into another. Our solution to these four
problems is given below.
Allocating slots in the CTB
To index callers of a callee, our modified JIT compiler maintains a map from a callee
method signature to an array of callers:
callercounter : callee → callers[]
When the compiler compiles a virtual call to a callee in the caller, it checks whether
callercounter(callee) contains the caller. If caller is not in the map, it is put in
callee’s caller array. The index of caller in the array is returned as the CTB index of
the call site.
A.m() B.m()
for X.x()
A’s TIB
for Z.z()
B’s TIB
for Y.y()
Figure 5.5: Example of allocating CTB indexes
In Java bytecode, an invokevirtual instruction contains only a symbolic reference
to the name and descriptor of the method as well as a symbolic reference to the
class where the method can be found. Resolving the method reference to a callee
method signature requires the class to be loaded first. To deal with unresolved method
references and virtual calls, our approach uses the callee’s method name and descriptor
87

as the index in the map instead of the resolved method:
callercounter : (name, desc) → callers[]
For example, both methods X.x() and Y.y() have virtual calls of a symbolic ref-
erence A.m(), and another method Z.z() has a virtual call of B.m(). Because the
references A.m() and B.m() may resolve to the same method at runtime, we take a
conservative assumption that all three methods are possible callers of any method
with the signature: (m, ()) → [X.x(), Y.y(), Z.z()]5, and allocates slots in the TIB
for all of them. At runtime, only two CTB entries of A.m() may be filled, and only
one entry of B.m() may get filled. Figure 5.5 shows what the CTBs look like for
method A.m() and B.m(). With this solution no accuracy is lost, but some space
may be wasted due to unfilled CTB entries. Although some space is sacrificed, our
approach simplifies the task of handling symbolic references and virtual calls. In
real applications we observed that only a few common method signatures, such as
equals(java.lang.Object), and hashCode(), have large caller sets where space is
unused.
Approximating interface calls
Interface calls are considered to be more expensive than virtual calls in Java programs
because a normal class can only have a single direct super class, but could implement
multiple interfaces. Jikes RVM has an efficient implementation of interface calls using
a interface method table with conflict resolution stubs [ACF+01].
We tried two approaches to handle interface calls in the presence of CTB arrays.
Our first approach profiles interface calls by allocating a caller index for a call site
in the JIT compiler and generating an instruction before the call to save the index
value in a known memory location. After a conflict resolution stub has found its
target method, it loads the index value from the known memory location. The CTB
array of the target method is loaded from the TIB array of receiver object’s declaring
class. The target address is read out from the CTB at the index, and finally the
5A full method descriptor should include the name of the method, parameter types, and thereturn type. In this example, we use the name and parameter types only for simplicity.
88

benchmark ITA (s) PROF (s)
201 compress 6.363 6.273 -1.1%
202 jess 4.277 4.420 3.3%
205 raytrace 2.650 2.745 3.6%
209 db 12.635 12.722 0.6%
213 javac 8.037 8.220 2.3%
222 mpegaudio 5.422 5.629 3.8%
227 mtrt 2.827 2.945 4.2%
228 jack 4.831 4.930 2.0%
Table 5.6: Overhead of profiling interface calls (best of 10 runs)
resolution stub jumps to the target address. This approach uses two more instructions
to store and load the caller index than invokevirtual calls6. After introducing one of
our optimizations in Section 5.4.3, inlining CTB elements into TIBs, the conflict
resolution stub requires more instructions to check the range of the index value to
determine if the indexed CTB element is inlined in the TIB or not. As shown in
Table 5.6, the overhead of profiling interface call (with inlined CTB size of 4) ranges
from -1.1% to 4.2% for SpecJVM98 benchmarks. Data were collected on a 1.5M
Pentium M laptop with 512M memory, and benchmarks were run 10 times using
SpecApplication driver with input size 100. We report the best run.
Our second approach was to simply use dynamic type analysis to compute call
edges for invokeinterface call sites at compile time, without introducing profiling
instructions.
Table 5.7 shows the number of call edges from invokeinterface calls using ITA
type analysis and profiling. Although profiling (3rd column) reduces a large number
of call edges, the absolute number of call edges from invokeinterface is only a small
portion of total call edges. We chose to use the second approach for the remaining
experiments in this thesis.
6Certainly, if there is a spare register for use, we can save the index in the register and read itout in the resolution stub, but registers are scarce resources in common architectures.
89

benchmark ITA PROF
201 compress 15 7
202 jess 454 144
205 raytrace 15 7
209 db 57 19
213 javac 256 59
222 mpegaudio 29 21
227 mtrt 15 7
228 jack 208 92
SpecJBB2000 278 37
CFS 100 18
Table 5.7: Call edges from invokeinterface by ITA and profiling
Handling static methods and object initializers
Because there are many object initializers that share a common name <init> and
descriptor, their CTB arrays may grow too large if we allocate CTB slots using the
name and descriptor as index. Since calls of object initializers and static methods
are non-virtual, the allocation of CTB slots for each method is independent of other
methods even with the same name and descriptor. For example, static methods A.m()
and B.m() both can use the same CTB index for different callers. Therefore, there is
no superfluous space in CTB arrays of object initializers and static methods. The only
problem is to handle unresolved method references correctly. For these unresolved
static or object initializer method references, a dependency on the reference from
the caller is registered in a database. When the method reference gets resolved, the
dependency is converted to a call edge conservatively. Table 5.8 shows the numbers
of call edges constructed by ITA and profiling mechanism from static methods and
object initializers, on our set of benchmarks. Using the 213 javac benchmark as
example, ITA adds 87 more edges than profiling, but it is only about 1.5% more of
total edges.
90

benchmark static init
ITA PROF ITA PROF
201 compress 179 157 201 147
202 jess 368 332 632 560
205 raytrace 215 192 320 272
209 db 189 164 224 170
213 javac 389 356 908 855
222 mpegaudio 194 173 325 269
227 mtrt 216 194 320 272
228 jack 302 277 542 479
SpecJBB2000 788 726 1001 807
CFS 197 133 403 301
Table 5.8: Call edges for non-virtual calls by ITA and profiling
Dealing with Inlining
Optimizing compilers perform aggressive inlining on a few hot methods. We capture
these events as follows. When a callee is inlined into a caller by an optimizing JIT
compiler, the call edge from the caller to callee is added to the call graph uncondi-
tionally. This is a conservative solution without runtime overhead. Since an inlined
call site is likely executed before its caller becomes hot, the number of added super-
fluous edges is modest. Table 5.9 validates our assumption. Column 2 shows the
numbers of call edges when method inlining is disabled, and column 3 lists the edge
numbers when inlining is enabled. The edge number increment ranges from 1.6 to
6.9% for most of our benchmarks except 213 javac and CFS. The last column shows
the number of call edges created due to inlining events.
5.4.3 Optimizations
Our runtime call graph construction mechanism may incur two kinds of overhead in
Jikes RVM. First, adding one instruction per call can potentially consume many CPU
91

benchmark full inlining inlined
201 compress 1423 1446 1.6% 334 23%
202 jess 3208 3430 6.9% 502 15%
205 raytrace 2534 2585 2.0% 443 17%
209 db 1588 1660 4.5% 363 22%
213 javac 6012 6915 15.0% 1280 19%
222 mpegaudio 1894 1940 2.4% 352 18%
227 mtrt 2536 2587 2.0% 443 17%
228 jack 3403 3524 3.6% 407 12%
SpecJBB2000 5214 5476 5.0% 528 10%
CFS 1611 1776 10.2% 467 26%
Table 5.9: Call edges due to inlined methods
cycles because Jikes RVM itself is compiled by the same compiler used for compiling
applications, and it also inserts many system calls into applications for runtime checks,
locks, object allocations, etc. Second, a CTB array is a normal Java array with a
three-word header; thus CTB arrays can increase memory usage and create extra
work for garbage collectors.
#callers Java Libraries 213 javac app
0 2384 78.60% 325 27.71%
1 95 81.61% 167 41.94%
2-3 119 85.38% 120 52.17%
4-7 221 89.24% 185 67.95%
8- 339 376
TOTAL 3159 1173
Table 5.10: Distribution of CTB sizes ( 213 javac)
Table 5.10 shows the distribution of the CTB sizes for 213 javac benchmark
from SpecJVM98 suite [speb] profiled in a FastAdaptive bootimage. The bootimage
92

contains mostly RVM classes and a few Java utility classes. We only profiled methods
from Java libraries and the benchmark. A small number of methods from bootimage
classes may have CTB arrays allocated at runtime because there is no clear cut
mechanism for distinguishing between Jikes RVM code and application code. The
first column shows the range of the number of callers. The second and third columns
list the distributions of methods belonging to Java libraries and application code.
To demonstrate that most methods have few callers, we calculated the cumulative
percentages of methods that have no caller, ≤ 1, ≤ 3 and ≤ 7 callers in the first to
fourth rows. We found that 89% of methods from (loaded classes in) Java libraries
and 68% of methods from application code have no more than 7 callers. In these
cases, it is not wise to create short CTB arrays because each array header takes 3
words. The last data row labelled “TOTAL” gives the total number of methods of all
classes and the number of methods in each of two sub-categories.
java.lang.Object
A
D
E
Figure 5.6: Inlining 1 element of CTB
To avoid the overhead of array headers for CTBs, and to eliminate the extra
instruction to load the CTB array from a TIB in the code for invokevirtual instruc-
tions, a local optimization is to inline the first few elements of the CTB into the TIB.
Since caller indexes are assigned at compile time, a compiler knows which part of the
CTB will be accessed in the generated code. To accommodate the inlined part of
the CTB, a class’ TIB entry is expanded to allow a method to have several entries.
93

Figure 5.6 shows the layout of TIBs with one inlined CTB element. When generating
instructions for a virtual call, the value of the caller’s CTB index, caller index, is
examined: if the index falls into the inlined part of the CTB, then invocation is done
by three instructions:
TIB = * (ptr + TIB_OFFSET);
INSTR = TIB[method_offset + caller_index];
JMP INSTR
Whenever a CTB index is greater than or equal to the inlined CTB size, IN-
LINED CTB SIZE, then four instructions must be used for the call:
TIB = * (ptr + TIB_OFFSET);
CTB = TIB[method_offset + CTB_ARRAY_OFFSET];
INSTR = CTB[caller_index - INLINED_CTB_SIZE];
JMP INSTR
Note that in addition to saving the extra instruction for inlined CTB entries, the
space overhead of the CTB header is eliminated in the common cases where all CTB
entries are inlined.
Another source of optimization is to avoid the overhead of handling system code,
such as runtime checks and locks, inserted by compilers, because this code is frequently
called and ignoring them does not affect the semantics of applications. To achieve
this, the first CTB entry is reserved for the purpose of system inserted calls. Instead
of being initialized with the address of a call graph profiling stub, the first entry has
the address of a lazy method compilation code stub or method instructions. When
the compiler generates code for a system call, it always assigns the zero caller index
to the caller. To avoid the extra load instruction, the first entry of a CTB array is
always inlined into the TIB.
5.4.4 Evaluation
We have implemented our proposed call graph construction mechanism in Jikes
RVM [jikb] v2.3.0. Our benchmark set was introduced in Section 2.2. We use a
94

variation of the FastAdaptiveCopyMS bootimage for evaluating our mechanism. In
our experiment, classes whose names start with com.ibm.JikesRVM are not presented
in the dynamic call graphs because (1) the number of RVM classes is much larger
than the number of classes of applications and libraries, and (2) the classes in the
boot image were statically compiled and optimized, type analysis such as ITA can be
used to compute the call graph. Static IPAs such as extant analysis [Vug00] may be
applied on the bootimage classes. We report the experimental results for application
classes and Java library classes.
In our initial experiments we found that the default adaptive configuration gave
significantly different behaviour when we introduced dynamic call graph construction
because the compilation rates and speedup rates of compilers were affected by our
call graph profiling mechanism. It was possible to retrain the adaptive system to
work well with our call graph construction enabled, but it was difficult to distinguish
performance differences due to changes in the adaptive behaviour from differences due
to overhead from our call graph constructor. In order to provide comparable runs in
our experiments, we used a counter-based recompilation strategy and disabled back-
ground recompilation. We also disabled adaptive inlining. This configuration is more
deterministic between runs as compared to the default adaptive configuration. This
behavior is confirmed by our observation that, between different runs, the number of
methods compiled by each compiler is very stable. The experiment was conducted
on a PC with a 1.5G Hz Pentium 4 CPU and 500M memory. The heap size of RVM
was set to 400M. Note that Jikes RVM and applications share the same heap space
at runtime.
The first column of Table 5.11 gives four configurations of different inlined CTB
sizes and the default FastAdaptiveCopyMS configuration without the dynamic call
graph builder. The bootimage size was increased about 10%, as shown in column 2,
when including all compiled code for call graph construction. Inlining CTB elements
increases the size of TIBs. However, changes are relatively small (the difference
between inlined CTB sizes 1 and 2 is about 150 kilobytes), as shown in the second
column.
The third column shows the memory overhead, in bytes, of allocated CTB arrays
95

for methods of classes in Java libraries and benchmarks when running the 213 javac
benchmark with an input size 100. The time for creating, expanding and updating
CTB array is negligible.
Inlined bootimage size CTB space
CTB sizes (bytes) (bytes)
default 24,382,332 N/A N/A
1 26,809,420 9.95% 833,952
2 26,959,148 10.57% 814,104
4 27,218,672 11.63% 786,000
8 27,730,004 13.73% 746,944
Table 5.11: Bootimage sizes and allocated CTB sizes of 213 javac
A Jikes RVM-specific problem is that the RVM system and applications share the
same heap space. Expanding TIBs and creating CTBs consumes heap space, leaving
less space for the applications, and also adding more work for the garbage collectors.
We examine the impact of CTB arrays on the GC. Since CTB arrays are likely to
live for a long time, garbage collection can be directly affected. Using the 213 javac
benchmark as example with the same experimental setting mentioned before, GC time
was profiled and plotted in Figure 5.7 for the default system and configurations with
different inlined CTB sizes. The x-axis is the garbage collection number during the
benchmark run, and the y-axis is the time spent on each collection. We found that,
with these CTB arrays, the GC is slightly slower than the default system, but not
significantly. When inlining more CTB elements, the GC time is slightly increased.
This might be because the increased size of TIBs exceeds the savings on CTB array
headers when the inlining size gets larger. We expect a VM with a specific system
heap would solve this problem.
The problem mentioned above also poses a challenge for measuring the overhead
of call graph profiling. Furthermore, the call graph profiler and data structures are
written in Java, which implies execution overhead and memory consumption, affecting
benchmark execution times. To only measure just the overhead of executing profiling
96

0
200
400
600
800
1000
1200
1400
1600
1800
0 10 20 30 40 50 60
gc ti
me
(ms)
garbage collection number
garbage collection time (_213_javac)
1248
default
Figure 5.7: GC time when running 213 javac
97

code stubs, we used a compiler option to replace the allocated caller index by the zero
index. When this option is enabled, calls do not execute the extra load instruction
and profiling code stub, but still allocate CTB arrays for methods. For CFS and
SpecJVM98 benchmarks, we found that usually the first run has some performance
degradation when executing profiling code stubs (up to 9% except for 201 compress7),
but the degradation is not significant upon reaching a stable state ( between -2 to
3% ). The performance of SpecJBB2000 is largely unaffected. Compared to not
allocating CTB arrays at all (TIBs, however, are still expanded), the performance
change is also very small.
benchmark 2 4 8
201 compress 97.26% 99.99% 99.99%
202 jess 0.93% 27.39% 41.10%
209 db 97.39% 97.74% 99.99%
213 javac 21.62% 64.25% 83.53%
222 mpegaudio 40.81% 63.00% 78.38%
227 mtrt 26.08% 73.82% 99.46%
228 jack 48.51% 77.82% 86.01%
Table 5.12: Eliminated CTB loads by different inlining CTB sizes
Table 5.12 shows the percentages of eliminated CTB load instructions by differ-
ent CTB inlining sizes. The experiment ignores call edges from and to RVM classes,
and does not profile static, <init>, and interface methods. Each SpecJVM98 bench-
mark runs 10 times with input size 100 using the SpecApplication driver. The
percentage of eliminated loads varies on different benchmarks. For example, loads
of 201 compress and 209 db are mostly eliminated with an inlining size of 2, but
202 jess only has 41% eliminated even with an inlining size of 8. Other benchmarks
have high elimination rates at inlining size 8. Eliminated loads did not cause signif-
icant performance changes. In our set of benchmarks, it seems that inlining more
7The first run of 201 compress does not promote enough methods to higher optimization levels.
98

0
2000
4000
6000
8000
10000
12000
14000
0 100 200 300 400 500 600
the
num
ber
of c
all e
dges
from
invo
kevi
rtua
l
virtual time (the number of opt compiled methods)
CHAProfiling
Figure 5.8: Growth of call graph at runtime ( 213 javac)
CTB array elements does not result in further performance improvements.
Table 5.13 compares the sizes of profiled call graphs to these constructed by dy-
namic CHA. Each benchmark has two rows, the first row is the call graph size by CHA
and the second row is the size by profiling. The third column (labelled as “ALL”)
gives the total number of call edges (application and library only). The number of
call edges by CHA is same as Table 5.5. The row of “PROF” also has calculated
percentages of call edges comparing to the row of “CHA”. From the last column,
we can see that profiled call graphs have 24% to 63% fewer virtual edges than CHA
ones. The number of call edges from other call sites are similar because we used type
analyses to compute them. Overall, profiling mechanism is able to reduce the total
number of edges by 15% to 54% as shown in the third column. The reduction for the
number of methods is not as significant as for the number of call edges.
99

benchmark ALL virtual
201 compress CHA 1862 774
PROF 1446 78% 381 49%
202 jess CHA 4325 2070
PROF 3432 79% 1273 61%
205 raytrace CHA 3023 1751
PROF 2585 86% 1338 76%
209 db CHA 2177 941
PROF 1660 76% 506 54%
213 javac CHA 14936 12390
PROF 6917 46% 4645 37%
222 mpegaudio CHA 2520 1239
PROF 1940 77% 687 55%
227 mtrt CHA 3024 1751
PROF 2587 86% 1339 76%
228 jack CHA 4658 2278
PROF 3538 76% 1441 63%
SpecJBB2000 CHA 7186 4775
PROF 5517 77% 3251 68%
CFS CHA 3385 2545
PROF 1776 52% 1018 40%
Table 5.13: Call graph comparison of CHA and profiling (application and library)
100

Call graph sizes shown before were collected at the end of benchmark runs. Con-
sider applications of call graphs, it is more likely to be used at runtime by interpro-
cedural analyses. Figure 5.8 shows the call graph size changes of 213 javac when
the benchmark runs. The x-axis is the virtual time using the number of methods
recompiled by the optimizing compiler. The y-axis is the number of call edges. The
y-values at the end of x-axis is what reported in Table 5.13. From the figure, we can
see that the sizes of call graphs constructed by different approaches have a similar
ratio during the benchmark execution as the end of run. This confirms the consistent
improvement of each call graph construction method.
A call graph client can use profiling mechanism with flexibility. For example, a
client analysis could re-profile cold call edges to improve data-flow analysis results.
After a client receives a call edge event, it performs propagation, then it can remove
the call edge and require the VM to re-profile the same edge. If this call edge only
executed once, future propagations will not pass data-flow information through the
edge. This may improve the results of client analysis in the cost of more profiling
overhead. However, type analyses cannot accomplish this task because call edge
construction depends on class resolution, compilation or allocation events.
5.5 Related work
Static call graph construction for object-oriented programs focuses on approximating
a set of types that a receiver of a polymorphic call site may have at runtime. Both
CHA [DGC95] and RTA [BS96] are fast type analyses for method inlining and call
graph construction. In a Java virtual machine, when type analyses are limited to
initialized classes, we found that dynamic CHA leaves little room for improvement.
Dynamic RTA is less effective than static one. The instantiation-based type analysis
(ITA) is able to improve CHA call graphs by a small margin. However, three type
analyses are not close to the limit as shown in Figure 5.13.
Reachability-based algorithms [Ste96,And94,SHR+00,TP00] propagate types from
allocation sites to receivers of polymorphic call sites along a program’s control flow.
101

Assignments, method calls, field and array accesses may pass types from one variable
to another. The analyses can either use a call graph built by CHA or RTA, then
refine it, or build the call graph on the fly [RMR01].
Trampoline is a technique for generating a piece of self-modifying code on-the-fly.
Java virtual machines heavily used this technique for implementing lazy compilation
and class loading. Our call graph profiling stub is a self-modifying trampoline which
pays the cost at the first-time execution.
In this section we have exhaustively studied call graph construction problem in
Java virtual machines. We showed a general approach to deal with dynamic class
loading and unresolved references in dynamic type analyses. A unique ITA is proposed
for approximating call graphs of the bootimage. We have also proposed a profiling-
based call graph construction mechanism, which builds most precise call graphs at
runtime. Algorithms were implemented in Jikes RVM and evaluated using a set of
Java benchmarks. An important characteristic of the dynamic call graph is that it
supports speculative optimizations with invalidation backups.
102

Chapter 6
Online Interprocedural Type Analysis and
Method Inlining
Using dynamic call graphs constructed by mechanisms in Chapter 5, we devel-
opped two reachability-based interprocedural type analysis, XTA and VTA, in Jikes
RVM. The type analysis results are used for speculative method inlining.
This chapter also seeks to determine if more powerful dynamic type analyses could
further improve inlining opportunities in a JIT compiler. To achieve this goal we de-
veloped a general dynamic type analysis framework which we have used for designing
and implementing dynamic versions of several well-known static type analyses, in-
cluding CHA, RTA, XTA and VTA.
Surprisingly, the simple dynamic CHA is nearly as good as an ideal type analysis
for inlining virtual method calls. There is little room for further improvement. On
the other hand, only a reachability-based interprocedural type analysis (VTA) is able
to capture the majority of monomorphic interface calls.
We also found that memory overhead is the biggest issue with dynamic whole-
program analyses. We used a generational garbage collector to reduce the impact
of VTA data structures and measured performance improvement. We also present
demand-driven approaches to reduce the memory overhead of dyanmic IPAs.
103
6.1 Introduction
Object-oriented programming languages encourage programmers to write small meth-
ods and compact classes so that the code is easy to read, modify, and maintain.
Java programs exemplify this design idea: many tiny methods have only one line of
code to access a field, return a hash value, or invoke another method. Design pat-
terns [GHJV95] use class inheritance and virtual calls extensively to obtain great engi-
neering benefits. Code instrumentation tools, such as AspectJ compilers [aspb,aspa],
insert many small methods into instrumented programs. The downside of using small
methods is that a program has to make frequent method calls. Object-oriented pro-
grams heavily rely on compilers to reduce calling overhead.
Efficient implementation of polymorphic calls has been studied extensively in the
context of C++ [Dri01]. The Java programming language only allows single inheri-
tance on normal classes, but allows multiple inheritance on interfaces. Virtual calls in
Java can be categorized into two kinds: virtual calls on normal class types and inter-
face calls on interfaces. Virtual calls can be implemented very efficiently by modern
JIT compilers. Various techniques reduce the overhead of interface calls as well.
Even though the direct overhead of virtual calls is low, further performance im-
provement is often obtained from method inlining and optimizations on inlined code.
Inlining creates larger code blocks for program analyses and improves the accuracy of
intraprocedural analyses which must often handle method calls conservatively. Thus,
method inlining is a very important part of a Java optimizer because it further reduces
method call overhead and also increases other opportunities for optimizations.
A key step of method inlining is to decide which method(s) can be inlined at a
call site. This can be achieved by using information conveyed via language constructs
such as final and private declarations (which provide restrictions on which methods
could be called), or the information can be gathered using a type analysis which
determines which runtime types may be associated with a receiver, and hence which
methods may be called. Another alternative is to profile targets of call sites. Inlining
based on language constructs and type analyses results is conservative at analysis
time and it supports direct inlining that maximizes optimization opportunities. In
104

this chapter, we study method inlining using type analysis results.
Static type analyses for Java programs [DGC95, BS96, SHR+00, TP00] are not
directly applicable to JIT compilers because of dynamic features of Java virtual ma-
chines. The type set of a variable might have new members as new classes are loaded
and thus optimizations based on old results could be invalidated. Various techniques
have been devised to use dynamic class hierarchy analysis for directly inlining in the
presence of dynamic class loading and JIT compilation.
In this chapter we evaluate the effectiveness of several dynamic type analyses
for method inlining in a Java virtual machine (Jikes RVM [AAB+00]). We built a
common type analysis framework for expressing dynamic type analyses and used the
results of these analyses for speculative inlining with invalidations. We then used
this framework to perform a study of how many method calls can be inlined for the
different varieties of type analyses.
We were also interested in finding the upper bound on how many calls that can
be inlined, to determine if more accurate type analyses are required. To gather this
information we used an efficient call graph profiling mechanism [QH04] to log call
targets of each virtual call site. The logged information is used as an ideal type
analysis for re-executing the benchmark. We compare the inlining results of other
type analyses to the ideal one. In order to measure the maximum inlining potential
of a type analysis, we also relaxed the size limit on inlining targets.
Our results were quite surprising. The simple CHA is nearly as good as the ideal
type analysis for inlining virtual method calls and leaves little room for improvement.
On the other hand, CHA is less effective for inlining interface calls. Further, we found
that the majority of interface invocations are from a small number of hot call sites
which are used in a very simple pattern.
In order to capture the monomorphic interface calls we developed dynamic VTA,
which is a whole-program analysis. We analyzed the effectiveness and costs of this
whole-program approach. We found that the main difficulty of such a dynamic whole-
program analysis is that it requires large heap space for maintaining analysis data
which must co-exist with application data in the heap. From our experience, we
believe a demand-driven approach would make a dynamic interprocedural analysis
105

practical in Java virtual machines and we suggest such an approach.
Our objective is to understand how well a dynamic type analysis can perform with
respect to method inlining in a JIT compiler, and what opportunities there are for
improvement. In this study, we made following contributions:
• A limit study of method inlining using dynamic type analyses on a set of stan-
dard Java benchmarks;
• Development and experience of an interprocedural reachability-based type anal-
ysis in a JIT environment;
• Interesting observations of speculative inlining and a proposal of demand-driven
interprocedural type analyses.
Readers who are interested in the background of method inlining should read the
Chapter 4. In this chapter, we describe the design of a common type analysis frame-
work for speculative inlining in Section 6.2, The limit study results are also presented
in this section. The whole-program VTA type analysis is described in Section 6.3 with
experimental results. Related work is discussed in Section 6.4. Finally, in Section 6.5,
we conclude with some observations and plans for future work.
6.2 A type analysis framework for method inlining
A static analysis is performed at compile-time and must make conservative assump-
tions that include all possible runtime executions. A static type analysis answers a
basic question: what is the set of all possible runtime types of variable v at program
point P . A dynamic type analysis is performed in a JIT environment, and therefore
it is time-sensitive. It answers a query similar to a static one, except the answer is
not for all executions, but for execution prior the time of answering the query. The
results may change over program’s execution. In order to use type analysis results
for optimizations in a JIT environment, there are a few requirements we set for the
analysis:
106

dynamic: it has to handle Java’s dynamic features seamlessly, such as dynamic class
loading, reference resolution, and JIT compilation;
conservative: analysis results must be correct at analysis time with respect to the
executed part of the program;
just-in-time: the analysis should be able to notify clients when previous analysis
results are about to change during execution.
A dynamic type analysis fits into a Java virtual machine without changing the lazy
strategy of handling class loading and compilation. The conservativeness ensures
optimizations based on analysis results are correct at the analysis time (it might
be invalidated in the future). If the analysis can update its results just-in-time, it
can be used for speculative optimizations with some invalidation mechanisms. Our
objective is to design a type analysis framework supporting speculative inlining in a
JIT compiler.
6.2.1 Framework structure
We designed a type analysis interface shown in Figure 6.1. In a Java method, a call
site is uniquely identified by the method and a bytecode index. Given the method and
bytecode index, the getNodeId method returns a node ID for further queries. The
node ID allocation decides the granularity of different type analyses. For example,
CHA and RTA use a single ID for all call sites, XTA allocates a node ID for all call
sites in the same method, and VTA assigns different IDs to different call sites. The
lookupTargets method returns an array of targets resolved by using reaching types
of the node with a given callee method signature. The detailed lookup procedure is
the same as virtual method lookup, defined by the JVM specification [LY96]. An
inline oracle makes inline decisions according to the lookup results.
If the type analysis finds a monomorphic call site (with only one target), then the
oracle decides to perform speculative inlining (using preexistence or code patching).
It must register a dependency via the checkAndRegisterDependency method. A
dependency says that, given a node and a callee method signature, a compiled method
107

(cm) is valid only when the lookup results have one target that is the same as the
parameter target.
After registering the dependency successfully, any change in the type set of the
node causes verification of dependencies on this node. The verifyDependency method
is called by the type analysis when the node has a new reaching type. For each de-
pendency of the node, the verification procedure performs method lookup using the
new reaching type and the callee method signature. If the lookup result is different
from the target method of the dependency, the compiled method must be invalidated
immediately.
public interface TypeAnalysis {
public int getNodeId(VM_Method caller, int bcindex);
public VM_Method[] lookupTargets(int nodeid, VM_Method callee);
public boolean checkAndRegisterDependency(int nodeid,
VM_Method callee,
VM_CompiledMethod cm,
VM_Method target);
protected void verifyDependency(int nodeid, VM_Class newKls);
}
Figure 6.1: TypeAnalaysis interface
A TypeAnalysis implementation has to monitor system events such as class load-
ing, method compilation, etc. We have implemented several type analyses as depicted
in Figure 6.21. CHA and RTA only differentiate classes that participate in the reach-
ing type sets. We made a new variation of CHA, called ITA, to only allow classes
with instances to participate in reaching types. XTA and VTA share many com-
ponents. A special class, IdealTypeAnalysis, uses profiled results for the purpose
of our limit study. All implementations satisfy the requirements defined at the be-
ginning of this section. A client, StaticInlineOracle, uses the analysis results for
1JikesRVM has an implementation of dynamic CHA, we re-implemented it in our framework withlittle efforts.
108

speculative inlining.
StaticInlineOracle
DependencyDatabase
XTA VTA
CHA RTA ITA
InlineOracle
<<interface>>
<<interface>>
TypeAnalysis
AbstractTypeAnalysis
OneSetTypeAnalysis
IdealTypeAnalysis
Figure 6.2: Type analysis framework diagram
6.2.2 A limit study of method inlining using dynamic type analy-
ses
An ideal type analysis
To measure how precise a type analysis could be, we need an ideal type analysis for
comparison. If a benchmark runs deterministically, we can profile targets in the first
run, and then use the profiled targets as faked analysis results for the second run.
We use an inexpensive call graph profiling mechanism [QH04] to gather call targets.
An IdealTypeAnalysis parses the profiled targets for call sites, and the lookupTargets
method returns profiled target(s) for a call site. The IdealTypeAnalysis uses CHA for
call sites from the RVM boot image.
109

Experimental approach
An inline oracle has to balance the benefits and costs of inlining. Excessive inlining
may blow up code size and slow down the execution. Therefore, a JIT compiler
usually sets a size limit on inlined targets using some heuristics. Hazelwood and
Grove [HG03] described the size heuristic used in Jikes RVM. For the purpose of our
study, we would like to measure the maximum potential of a type analysis for method
inlining without a size limit. However, inlining all call sites is not feasible. Instead,
we only inline the most frequently executed call sites, without a size limit.
We implemented the framework and type analyses in JikesRVM v2.3.0. We used
the FastAdaptiveCopyMS configuration for initial experiments since it is stable and
can run all of our benchmarks. The configuration uses a copying mark-sweep collector.
Benchmarks
Our benchmark set includes the SpecJVM98 suite [speb], SpecJBB2000 [spea], a CFS
subset evaluator from a data mining package Weka [wek], a simulator of certificate
revocation schemes [cer], and a variation of the simulator interwoven with AspectJ
code for detecting calls that return null on error conditions.
Table 6.1 summarizes dynamic characteristics of benchmark executions. We ig-
nored call sites in the RVM code and Java libraries compiled into the boot image.
Virtual and interface calls are measured separately. Columns labeled total report the
total counts of invocations in each category. Columns labeled #hottest are numbers
of hottest call sites, ranked in the top 100, whose invocations are more than 1% of
total in Columns 2 and 5. Columns labeled coverage are percentages of invocations
contributed by these hottest call sites.
It is interesting to point out that, for most of the benchmarks, the majority
of invocations are from a small number of hot call sites. Less than 25 call sites
exceed the 1% threshold. Only about half of the benchmarks have more than 1M
interface invocations. These benchmarks have fewer than 10 hot interface call sites
that contribute to more than 92% of invocations.
110

benchmark invokevirtual invokeinterface
total #hottest coverage total #hottest coverage
201 compress 2,191M 7 89% 0 N/A N/A
202 jess 964M 25 71% 0 N/A N/A
205 raytrace 2,837M 16 29% 0 N/A N/A
209 db 762M 8 99% 149M 5 99%
213 javac 688M 10 20% 34M 5 92%
222 mpegaudio 846M 25 80% 2M 11 98%
228 jack 264M 22 74% 46M 11 93%
SpecJBB2000 8,162M 9 34% 146M 7 99%
CFS 639M 15 92% 0 N/A N/A
simulator(orig) 44M 5 71% 0 N/A N/A
simulator(aspects) 162M 13 72% 0 N/A N/A
Table 6.1: Coverage of the hottest call sites
The 213 javac benchmark includes a large amount of auto-generated code. In-
vocation counts are spread over many call sites. SpecJBB2000 has a large code base
as well, and it runs much longer than other benchmarks. Hot call sites selected by
our 1% threshold contribute only about 34% of total invocations.
A list of hottest call sites are provided to the inline oracle. The size limit is
removed for call sites in the list. Thus, the inline oracle can exploit the potential of
a type analysis as much as possible.
As we discussed in Chapter 4, a virtual call site can be inlined using different
techniques:
• direct: direct inlining if the callee method is private or final;
• preex: direct inlining with invalidation checks if the receiver can be proved to
be preexistent prior method calls;
• cp: guarded inlining with code patching;
111

• mt or ct: guarded inlining with method or class tests.
If a call site is currently monomorphic according to the analysis results, guards
are chosen as a command line option. It can be code patching or method/class tests.
For our experiment we used code patching since it has less runtime overhead.
Monomorphic interface calls can be directly inlined if the receiver is preexistent, or
inlined with guards. We found that, in our benchmark set, receivers of nearly all hot
interface calls cannot be proved to be preexistent by an invariant argument analysis.
In our results, we omit the preex category for interface calls. We also performed
another experiment where the inline oracle inlined polymorphic call sites (guarded
by method or class tests) that had 1 or 2 targets resolved using type analysis results.
However, this did not lead to significantly more inlined calls (only 213 javac has a
2% increase). Thus, we do not inline polymorphic calls in our experiment reported
here.
Limit study results
Table 6.2 compares the results of dynamic CHA and IdealTypeAnalysis. Each bench-
mark has two rows: ideal and cha, showing dynamic counts of inlined calls using
different type analyses. Virtual and interface calls are presented separately. Column
total is the count of invocations in each category. In the virtual category, dynamic
CHA did nearly as perfect a job as the ideal type analysis in most benchmarks, ex-
cept 213 javac and simulator(aspects). On these benchmarks, the majority of
dynamic invocations are contributed by monomorphic call sites. The sum of direct,
preex and cp is close to the coverage in Table 6.1. 213 javac leaves a small gap
between cha and ideal. In the interface category, column 8 shows that a large portion
of interface invocations are from monomorphic call sites as well. Dynamic CHA is in-
effective on inlining interface calls. Furthermore, the other two simple type analyses,
RTA and ITA, did not improve the results of inlining interface calls because common
interfaces are implemented by different classes that are likely to be instantiated.
112
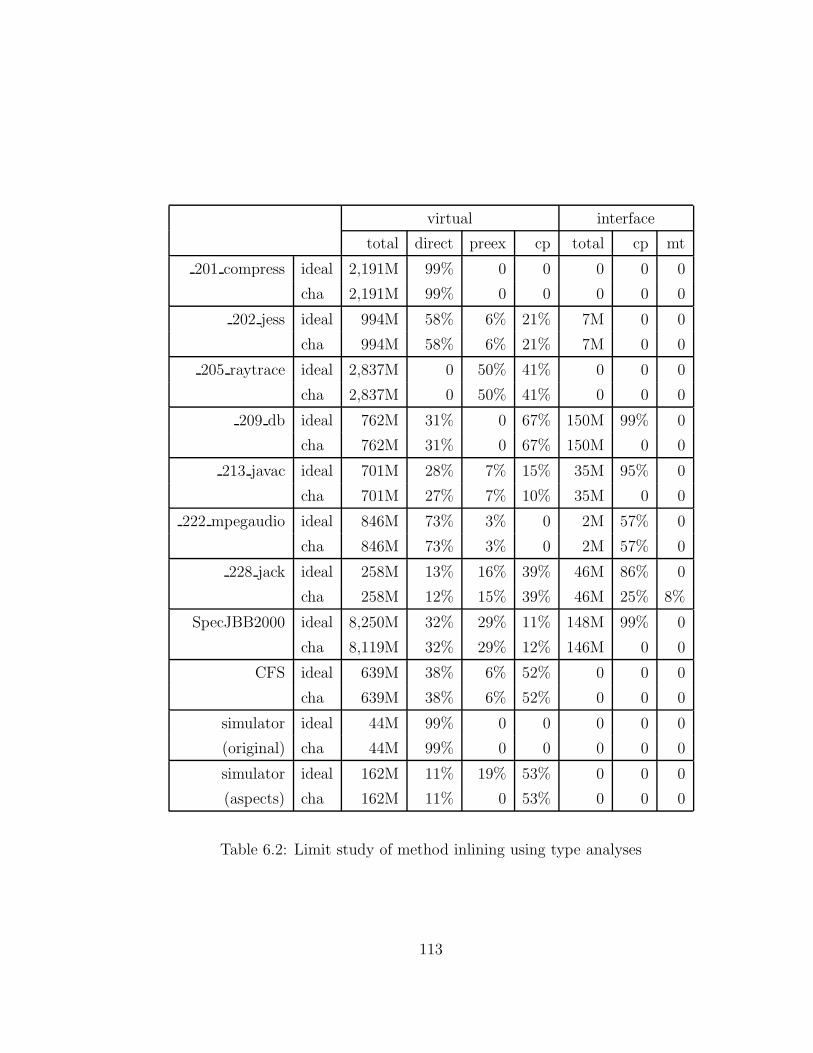
virtual interface
total direct preex cp total cp mt
201 compress ideal 2,191M 99% 0 0 0 0 0
cha 2,191M 99% 0 0 0 0 0
202 jess ideal 994M 58% 6% 21% 7M 0 0
cha 994M 58% 6% 21% 7M 0 0
205 raytrace ideal 2,837M 0 50% 41% 0 0 0
cha 2,837M 0 50% 41% 0 0 0
209 db ideal 762M 31% 0 67% 150M 99% 0
cha 762M 31% 0 67% 150M 0 0
213 javac ideal 701M 28% 7% 15% 35M 95% 0
cha 701M 27% 7% 10% 35M 0 0
222 mpegaudio ideal 846M 73% 3% 0 2M 57% 0
cha 846M 73% 3% 0 2M 57% 0
228 jack ideal 258M 13% 16% 39% 46M 86% 0
cha 258M 12% 15% 39% 46M 25% 8%
SpecJBB2000 ideal 8,250M 32% 29% 11% 148M 99% 0
cha 8,119M 32% 29% 12% 146M 0 0
CFS ideal 639M 38% 6% 52% 0 0 0
cha 639M 38% 6% 52% 0 0 0
simulator ideal 44M 99% 0 0 0 0 0
(original) cha 44M 99% 0 0 0 0 0
simulator ideal 162M 11% 19% 53% 0 0 0
(aspects) cha 162M 11% 0 53% 0 0 0
Table 6.2: Limit study of method inlining using type analyses
113

Discussion
Simulator(aspects) is an interesting benchmark. Injecting AspectJ advice code
increases the number of invocations and changes inlining behaviors dramatically. In
the original benchmark, nearly all virtual calls are monomorphic and can be directly
inlined. With aspects, dynamic CHA misses all monomorphic calls in the preex cat-
egory. After looking at the benchmark closely, we found this is due to the generic
implementation of pointcuts.
The pointcut implementation boxes primitive values in objects and passes them
to AspectJ libraries. The value is then unboxed after the library call. The original
code for unboxing looks like
int intValue(Object v) {
if (v instanceof Number)
return ((Number)v).intValue();
......
}
The single call site of ((Number)v).intValue() contributes 19% preex invocations.
Dynamic CHA failed to inline this call site because the Number class has several
subclasses, Integer, Double, and Long, and the call site is identified as polymorphic.
This particular problem can be solved in two ways: 1) use a context-sensitive
reachability-based type analysis, or 2) change the implementation of unboxing to
facilitate the type analysis. We changed the method to use a tighter type, Integer,
in the type cast expression, then the call site becomes directly inlineable.
Since the number of hot interface call sites is small, we investigated them one by
one. It turns out these hot interface calls are used in a similar pattern:
// <TYPE> is java.util.Vector, java.util.Hashtable, etc.
Enumeration e = <TYPE>.elements();
......
while (e.hasMoreElements())
index[i++] = (Entry)e.nextElement();
Enumeration is an interface in java.util package. The while loop makes two or more
interface calls for enumerating elements of underlying data structures. Dynamic CHA
114

assumes all implementations of the interface are in the runtime type set of e, although
each <TYPE> class returns a specific implementation. Without interprocedural infor-
mation or inlining the <TYPE>.elements() method, a type analysis cannot produce
precise type information of e. Therefore, these interface call sites cannot be inlined
by using dynamic CHA.
From this limit study, we conclude that:
• most virtual calls in standard Java benchmarks are monomorphic;
• dynamic CHA is nearly perfect for inlining virtual calls;
• dynamic CHA is ineffective on inlining interface calls;
• to assist compiler optimizations, a programmer should use precise types when
it does not sacrifice other engineering benefits;
• a large percentage of interface calls are monomorphic and used in a simple
pattern, but it requires an interprocedural analysis to discover the precise type
of the receiver.
6.3 Dynamic reachability-based type analysis
In Section 6.2, we presented a type analysis framework for supporting speculative
inlining. We also presented the results of our limit study of method inlining which
showed that dynamic CHA is not strong enough for inlining interface calls. In this sec-
tion, we present an interprocedural, reachability-based, type analysis that is suitable
for inlining interface calls.
There are two different approaches to performing a dynamic interprocedural anal-
ysis in a Java virtual machine. A whole-program analysis analyzes all classes and
methods that can participate the program execution. A demand-driven analysis only
analyzes the part of code related to a request. We start with the whole-program
approach.
115

We designed and implemented a dynamic version XTA in our previous work [QH04]
as an example of how to deal with dynamic class loading and reference resolution.
However, due to lack of intraprocedural data-flow information, XTA results are very
coarse. Although the computed type sets are smaller than ones from CHA, it still
could not recognize important monomorphic interface call sites. From the method
inlining study, we found XTA results were no better than dynamic CHA.
Design
VTA [SHR+00] uses intraprocedural data flow information to propagate type sets.
Given a Java program (all application and library classes), static VTA constructs a
directed type flow graph G = (V, E, τ) where:
• V is a set of nodes, representing local variables, method formals and returns,
static and instance fields, and array elements;
• E is a set of directed edges between nodes, an edge a → b represents an assign-
ment of a’s value to b;
• τ : V → T is a map from a node to a set of types (classes).
Static VTA has two phases. On phase 1, a constrain collector performs one-pass
scan of the program and constructs a VTA graph. Phase 2 propagates types τ(V ) to
all reachable nodes in the graph.
Dynamic VTA can also take advantage of rich runtime type information. A dy-
namic VTA node has a declaring type inferenced by JikesRVM’s optimizaing compiler.
When propagating types through a node v, only when v’s declaring type is resolved
and its subtypes can become part of τ(v).
We use the same approach outlined in [QH04] to adopt the static VTA to a
JIT compiler. In the whole-program approach, the constraint collector monitors
method compilation events at runtime. Before a method is compiled, the constraint
collector parses the bytecode and creates VTA edges. The collector uses the front-
end of the optimizing compiler in Jikes RVM, which converts bytecode to a three
116

address intermediate representation, HIR. Several optimizations are performed during
translation. An HIR operand has a declaring type.
Dynamic VTA analysis is driven by events from JIT compilers and class loaders.
Figure 6.3 shows the flow of events. In the dotted box are the three modules of
dynamic VTA analysis: VTA graphs, the analysis (include constraint collector), and
dependency databases. The JIT compilers notify the analysis by channel 1 that a
method is about to be compiled. The analysis scans the bytecode of the method body
and, for each new instruction with a resolved type, the analysis adds the type into the
reachable type set of the method via channel 3; otherwise it registers a dependency
on the unresolved type reference for the method via channel 4. Similarly for field
accesses, if the field reference can be resolved without triggering class loading, the
analysis adds a directed edge into the graph via channel 3; otherwise, it registers a
dependency on unresolved field reference for the method. A call graph constructor 5
could add new edges to the graph by channel 2. Whenever a type reference or field
reference gets resolved, the dependency databases are notified (by channel 5), and
registered dependencies on resolved references are resolved to new reachable types or
new edges of the graph.
dependencydatabases
3
6
compilers
profilingcallgraph 2
1
4
classloaders5
analysis
dependenciesinlining
inlineoracle
VTA graphs
Figure 6.3: Model of VTA events
Many system events can change the VTA graph. Whenever the graph is changed
(either the graph has an new edge, or a node has a new reaching type), a propagator
propagates type sets of nodes (related to changes) until no further change occurs.
Whenever the reaching type set of a node has a new member, the analysis verifies
117

dependencies on this node registered by inlining oracles (see Section 6.2). The oracle
has a chance to perform invalidation if inlining assumptions are violated.
Propagations
To support speculative optimizations, the analysis must keep the results up-to-date
whenever a client makes queries. An eager approach propagates new types whenever
the VTA graph is changed. The second approach is to cache graph changes when
collecting constraints of a method, and batch propagations at the end of constraint
collection. The third approach, as suggested in [HDH04, PS01], propagates types
only when a client makes queries on nodes. However, the analysis needs to keep a
list of nodes which type sets are used for speculative optimizations. Whenever the
VTA graph changes, the analysis has to perform demand-driven propagation on listed
nodes to verify assumptions are not invalidated. In our study, we found both eager
and batch propagations are efficient, with respect to the total execution time of each
benchmark. Javac takes up to 1.7 seconds and other benchmarks take less than 1
second.
Implementation
The main data structure of VTA is a type flow graph. Previous work [LH03] showed
that the ordinary set and map implementations from JDK are not scalable. We used a
similar implementation of integer sets as in [LH03]. In addition, we have implemented
a special hash table using primitive integers as keys.
Effectiveness of dynamic VTA
Not surprisingly, VTA is able to handle the simple pattern of interface calls in our
benchmarks set. Table 6.3 compares dynamic counts of inlined interface calls. We
omitted benchmarks with few interface calls. Dynamic VTA is able to catch all
monomorphic interface calls and allows them to be inlined by using code patching.
118

benchmark Ideal(cp) VTA(cp)
209 db 99% 99%
213 javac 95% 95%
228 jack 86% 86%
SpecJBB2000 99% 99%
Table 6.3: Comparison of VTA and IdealTypeAnalysis for inlining interface calls
Memory overhead of whole-program VTA
Although dynamic VTA allows the JIT compiler to utilize maximum inlining opportu-
nities, the cost of whole-program VTA is also high. Table 6.4 is a rough approximation
of memory footprint of VTA graphs for four benchmarks. A VTA graph has three
big pieces: a node set, an edge set, and type sets. Columns 2 to 4 display numbers of
sets and memory footprints. The last column is the total memory footprint of three
pieces.
benchmark nodes (size) edges (size) typesets total
209 db 4,326 (0.13M) 5,419 (0.53M) 0.31M 0.97M
213 javac 11,933 (0.37M) 32,992 (2.54M) 1.28M 4.19M
228 jack 7,261 (0.22M) 10,403 (1.00M) 0.64M 1.86M
SpecJBB2000 11,119 (0.34M) 14,831 (1.54M) 0.80M 2.68M
Table 6.4: VTA graph sizes
Figure 6.4(a) compares sizes of live data for IdealTypeAnalysis, CHA, and VTA,
using 213 javac as the example. Heap occupation has been increased by one-third
(about 10M) for VTA graphs. Also VTA data are lived through application execution.
Figure 6.4(b) depicts time spent on each GC using a copying collector. It is clear
that the whole-program interprocedural analysis has a very high memory overhead.
119

0
5000
10000
15000
20000
25000
30000
35000
40000
45000
0 10 20 30 40 50 60
KB
gc counts
gc live data comparison
idealchavta
(a) live data after each GC
0
500
1000
1500
2000
2500
3000
0 10 20 30 40 50 60
ms
gc counts
gc time comparison
idealchavta
(b) time spent on each GC
Figure 6.4: GC behaviors affected by VTA ( 213 javac)
120

Performance comparison
Table 6.5 shows our preliminary performance measurement using a copying mark-
sweep collector. Data were collected on a laptop with a Pentium M 1.5G processor
and 1G memory, running Linux kernel 2.6.10. We took the best run of 10 runs of
SpecJVM98 benchmarks. SpecJBB2000 is measured by its throughput score (higher
is better). VTA has some speedups on 209 db and 228 jack. 213 javac and
SpecJBB2000 slowed down due to heavier GC workload introduced by VTA graphs,
benchmark CHA VTA speedups
209 db 10.704s 10.448s 2.5%
213 javac 4.006s 4.048s -1.0%
228 jack 2.638s 2.635s 0.1%
SpecJBB2000 12093 9693 -24.8%
Table 6.5: Performance comparison using a copying mark-sweep collector
Recently we switched to a generational mark-sweep collector, which promotes
most of VTA graph objects to old generations. The impact of GC has been reduced.
Table 6.6 compares the best run of 10 runs of two benchmarks. Unfortunately, both
209 db and SpecJBB2000 trigger bugs in the generational mark-sweep collector in
the version of JikesRVM that we are using for our implementation.2
benchmark CHA VTA speedups
213 javac 3.924s 3.900s 0.6%
228 jack 2.514s 2.460s 2.1%
Table 6.6: Performance comparison using a generational mark-sweep collector
2It is possible that this issue will be resolved when we upgrade our implementation to the latestversion of JikesRVM.
121

6.4 Related work
We discussed some related work of method inlining in Chapter 4. The section discusses
additional related work on the topic.
Ishizaki et al. [IKY+00] conducted an extensive study of dynamic devirtualization
techniques for Java programs. In their experiments, size limits were put on inlined
targets, and techniques using dynamic CHA were shown to inline about 46% of virtual
calls (execution counts). Our study answers the question of what is the limit of
method inlining using different type analyses. By lifting the size limit on hottest
call sites, we were able to understand the maximum inlining potential using a type
analysis. Our limit study shows that CHA is nearly as perfect as an ideal type
analysis.
Pechtchanski and Sarkar [PS01] presented a framework for dynamic optimistic
interprocedural analysis (DOIT) in a JIT environment. For each method, the DOIT
analysis builds a value graph similar to a VTA graph. However, due to lack of a
complete dynamic call graph, DOIT does not track type flow between method calls
(parameters and returns). Instead, it uses conservative subtypes of declaring types of
method parameters and returns. DOIT is good at obtaining precise type information
for fields whose values are assigned in one method and used by another method. Our
work focused on limit study of method inlining using type analyses, including online
interprocedural analyses based on dynamic call graphs. Our results independently
confirms that dynamic CHA is effective for inlining virtual calls in Java programs.
Profiled-directed inlining is effective to identify profitable inlining targets at poly-
morphic call sites. However, profile-directed inlining requires runtime tests to guard
the inlining target. Our focus is on exploiting unguarded inlining opportunities ex-
posed by type analyses.
6.5 Discussion
In this chapter we have presented a study on the limits of speculative inlining. Some-
what to our surprise we found that using dynamic CHA for speculative inlining is
122

almost as good as using an “ideal” analysis, for inlining virtual method calls. How-
ever, for even simple uses of interface calls, none of dynamic CHA, RTA, XTA or
ITA gives enough information for determining that interface calls are monomorphic.
Rather, to detect these opportunities, one requires a stronger type analysis and we
presented a dynamic version of VTA for this purpose.
Our experiments with our dynamic VTA do show that it provides detailed enough
type information to identify inlining opportunities for interface calls in our bench-
mark set. However, we also note that the memory overhead of our whole program
approach to dynamic VTA is quite large, and we suggest an alternative demand-driven
approach.
In addition to these main contributions of this chapter, we also made several other
general observations about speculative method inlining.
Observation 1
The conventional wisdom is that inlining increases optimization opportunities. How-
ever, in the presence of speculative optimizations, inlining may reduce optimization
opportunities as well. Figure 6.5 shows such an example. In Figure 6.5(a), the method
Foo.m() is declared as virtual, but not overridden. Thus the call site in the child
method is a candidate of direct inlining based on the receiver’s preexistence prior
method call (Figure 6.5(b)). However, if a compiler inlines child() into parent(),
and the receiver of foo.m() is not preexistent prior the parent(), the call site can
only be inlined with a guard as in Figure 6.5(c). Since the frequency of calling
foo.m() is much more than calling child(), the performance of parent() might not
be maximized. This pattern did happen in the 213 javac benchmark.
The above contradiction could be resolved by using on-stack replacement tech-
nology [FQ03,Urs92] or thin guards [AR02]. Indeed, method invalidation performs
on-stack replacement at method entries. A compiler can insert a general on-stack
replacement point after the statement Foo f = getfiled with a condition that Foo.m is
currently final. The compiler can directly inline the body of Foo.m into the loop.
123

parent() {
Foo f = getfield
this.child(f);
}
child(Foo foo) {
while(cond)
foo.m()
}
(a) source
parent() {
Foo f = getfield
this.child(f);
}
child(Foo foo) {
while (cond)
inlined Foo.m(foo)
}
(b) inline ‘Foo.m’ only
parent(){
Foo f = getfield
while(cond)
if (Foo.m is currently final)
inlined Foo.m(f)
else
Foo.m(f)
}
(c) inline ‘child’, then ‘Foo.m’
Figure 6.5: An example where inlining can reduce optimization opportunities
Observation 2
Our second observation is that inlining decisions may be affected by library imple-
mentations. A Java virtual machine is bundled with a specific implementation of Java
class library. For example, the GNU classpath [cla] is an open-source implementation
of Java libraries and used by many open source Java virtual machines, including Jikes
RVM. The implementation of Hashtable.elements() in the GNU classpath (version
0.07) returns objects of a single type Hashtable$Enumerator. The implementation
in Sun’s JDK 1.4.2 04, however, may return objects of Hashtable$EmptyEnumerator
and Hashtable$Enumerator. Several hot interface call sites in our benchmark set
would not be directly inlined if using Sun’s JDK.
Demand-driven propagation
VTA graphs of large benchmarks (e.g., 213 javac and SpecJBB2000) have large num-
ber of nodes. However, there are only a few hundreds nodes whose type sets are used
for inlining. Both batch and eager propagations save type sets for all nodes. The
demand-driven propagation [PS01] is attractive since it does not require the analysis
to save type sets for intermediate nodes. The analysis can do a depth-first search on
the VTA graph to find all reachable types of a node. However, in order to support
124

speculative inlining, the analysis has to perform depth-first search on all receiver nodes
of speculatively inlined sites, whenever the VTA graph changes. We are planning to
implement this approach and measure the performance.
Outline of a demand-driven analysis
The whole-program interprocedural analysis analyzes all compiled methods. Al-
though the analysis itself is reasonably fast, the VTA graph representation takes
a lot of memory space. Because Jikes RVM shares the same heap with applications,
more live data triggers more frequent garbage collections and increases GC time in
each collection. Section 6.2 shows that only a few call sites are hot in each benchmark.
If the analysis only analyzes code related to these hot call sites, the time and space
overhead could be reduced.
Demand-driven analysis [VR01,HT01] itself is an interesting research topic. It has
been explored in the context of static points-to analysis. It is attractive to perform
incremental, demand-driven IPA at runtime in a JIT environment.
We are developing a demand-driven VTA type analysis. We outline the require-
ment and design of the demand-driven analysis to support speculative inlining of
interface calls. Given a receiver variable e, the compiler would decide if it is interest-
ing to perform the type analysis on e. A simple heuristic is that e’s declaring type is
a common interface, such as Enumeration and Iterator, and there are interface invo-
cations in loops made on the variable. Once the compiler decides to analyze e, the
demand-driven analysis would look at the source of e. If there is a single definition
of e in the method, it continues looking at where the value of e comes from. There
are several possible cases, we describe each case and solution:
• e is passed in as a parameter. In this case, the analysis gives up since it is too
expensive to analyze all callers of the method;
• e gets its value from a field or an array element. It requires a whole-program
analysis in order to know all writes to the field or array element. Field analy-
sis [GRS00] could be used if it is available, otherwise, the analysis gives up in
this case;
125

• e’s value is returned from a method call. This is the case the analysis tries to
analyze further, and it performs the following steps:
– is there only one target of the call site? if so, then
– can the type analysis get a precise type of return objects in the target
method?
If the analysis successfully finds the precise type of e, it then registers a depen-
dency that assumes the analyzed method is the only target of the call site.
The above approach could successfully inline the common interface call patterns
we found in our benchmarks. However, it is fairly restricted to these patterns. We
believe the right approach should look at more patterns used in the real applications
and analyze important ones case by case.
Future work
Based on this study we have concluded that a type analysis for invokeinterfaces is an
important area of research, and we are currently working on a demand-driven analysis
and compact graph representation to reduce the costs of dynamic VTA. We are also
looking at more applications of dynamic interprocedural analysis in JIT compilers.
A new research topic is to investigate the effectiveness of compiler optimizations on
different design patterns.
126

Chapter 7
Conclusions and Future Work
In this chapter, we summarize the thesis in Section 7.1. In Section 7.2, we discuss
several potential research directions from the thesis work.
7.1 Conclusions
In this thesis we have explored runtime instrumentation and dynamic program anal-
ysis in a Java virtual machine. The objective is to investigate the opportunities and
challenges of program analysis and optimizations in a runtime system for languages
such as Java and C#.
In Chapter 3, we presented a novel dynamic memory allocation scheme in garbage
collectors. The new scheme uses write barriers to gain the benefits of stack allocation,
but avoiding the requirement of an escape analysis that is not largely available in JIT
environments. In our allocator, an allocation site was dynamically attributed as
escaping and non-escaping based on its execution history. In an escaping analysis,
such a property is derived from programs and langauge constraints, and is often
over-conservative.
We presented the overall idea, and provided details of a prototype design. In our
implementation, we carefully measured the benchmark behaviors and optimized the
instrumentation. Our quantative meansurement gave encouraging results. In the best
case of 227 mtrt, the number of collections was reduced from 7 to 1.
127

A JIT environment allows speculative optimizations based on runtime invalidation
techniques. In Chapter 4, we reviewed existing state-of-the-art work in this field. It
covers simple runtime checks to complicated on-stack-replacement. We also presented
an improvement and implementation of a new on-stack replacement mechanism in a
real Java virtual machine. All these techniques are necessary to utilize more advanced
program analyses for speculative optimizations.
A necessary step of interprocedural analyses is to construct call graphs efficiently.
In Chapter 5, we did a thorough study of dynamic call graph construction problem in
Java virtual machines. We showed a general approach of handling dynamic class load-
ing and unresolved references in a dynamic program analysis. A call graph profiler,
using trampoline, builds most precise call graphs with small runtime overhead. Type
analysis and profiler can be coupled to make trade-off between efficiency and preci-
sion. We implemented and evaluated algorithms in Jikes RVM on a set of standard
benchmarks.
It is relatively easy to adapt a static intraprocedural analysis to a JIT compiler
since methods are compilation units in both envoriments. Interprocedural analyses,
however, are largely unexplored in JIT compilers.
In Chapter 6, we presented the design and implementation of several dynamic
interprocedural type analyses. We used method inlining as an experiment to study
how to use analysis results for speculative optimizations. We found that a dynamic
analysis only needs to focus on a narrow region of code, and it has quite different
effects comparing to its static counterpart.
We examined necessary techniques to create maximum inlining opportunities. A
dynamic interprocedural type analysis has been developed in Jikes RVM. We studied
the costs and gains of a whole program analysis approach, and pointed out issues
of the approach. In this study, we also made some interesting observations about
dynamic program analysis and speculative inlining.
128

7.2 Future work
In this section, we pointed out some future research directions following the thesis
work.
7.2.1 Dynamic interprocedural analyses and speculative optimiza-
tions
Dynamic interprocedural analysis is still not a well-understood research field. The
whole program approach used in static analysis is unlikely to succeed because the cost
of maintain intermediate data structures is too high in a Java virtual machine. The
90/10 rule applies on Java programs as well. A successful dynamic analysis should
spend limited resource on the small percentage of hot code regions. On-demand
approach might succeed in a JIT environment.
We point out some possible dynamic interprocedural analyses, but not exhaustive:
interprocedural type analysis results can be used to inline interface call sites, and
eliminate unnecessary type checks; escape analysis enables new garbage collection
schemes, such as regions, connectivity-based GC, etc.; value range analysis allows
bounds check elimination.
Advanced interprocedural analysis would create new optimization opportunities.
We need to explore new kinds of speculative optimizations in a JIT environment.
The current OSR prototype is a heavyweight implementation. It requires fine-grained
tuning to alleviate the cost of backup mechanism.
7.2.2 Online escape analysis
Ruf [Ruf00] proposed a static escape analysis for synchronization removal in the
Marmot compiler [FKR+98]. A similar analysis [Ste00] could be used for creating
thread-local heaps. Not like other escape analyses [CGS+99, Bla99, WR99], Ruf’s
analysis does not assume that an object is escaping because it is reachable from a
static field. Only objects that may be accessed by multiple threads are considered
129

escaping. Ruf’s analysis relies on a conservative call graph and annotates methods
that may be accessed by multiple threads.
We could develop an online escape analysis similar to the one suggested in [Ste00]
using our dynamic call graph constructors. There are several ways to improve the
efficiency and precision of the dynamic analysis:
1. track thread creation and annotate call graph with live threads;
2. since the runtime system knows exact lifetime of a thread, an object accessed
by threads with non-overlapping lifetime can still be considered as thread-local;
Using the hybrid of dynamic analysis and instrumentation, it is possible to develop
an efficient and effective online escape analysis. However, applications of analysis
results may require new invalidation techniques to ensure correct execution when old
results were invalidated.
7.2.3 Improve the efficiency of on-stack-replacement
Our implementation of on-stack-replacement (Section 4.4) requires an OsrPoint in-
struction that uses all variables in the source program. It may limit the precision of
intraprocedural analyses, such as constant propagation, common subexpression elim-
ination, etc. One future research direction is to study how to reduce side-effects of
on-stack-replacement on regular program optimizations.
130

Bibliography
[AAB+00] Bowen Alpern, C. Richard Attanasio, John J. Barton, Michael G. Burke,
Perry Cheng, Jong-Deok Choi, Anthony Cocchi, Stephen J. Fink, David
Grove, Michael Hind, Susan Flynn Hummel, Derek Lieber, Vassily Litvi-
nov, Mark F. Mergen, Ton Ngo, James R. Russell, Vivek Sarkar, Mauri-
cio J. Serrano, Janice C. Shepherd, Stephen E. Smith, Vugranam C.
Sreedhar, Harini Srinivasan, and John Whaley. The Jalapeno Virtual
Machine. IBM Systems Journal, 39(1):211–238, February 2000.
[ACF+01] Bowen Alpern, Anthony Cocchi, Stephen J. Fink, David Grove, and
Derek Lieber. Efficient Implementation of Java Interfaces: Invokeinter-
face Considered Harmless. In Proceedings of the Conference on Object-
Oriented Programming Systems, Languages, and Applications (OOP-
SLA’01), pages 108–124, 2001.
[AFG+00] Matthew Arnold, Stephen Fink, David Grove, Michael Hind, and Pe-
ter F. Sweeney. Adapative Optimization in the Jalapeno JVM. In Pro-
ceedings OOPSLA 2000 Conference on Object-Oriented Programming
Systems, Languages, and Applications, ACM SIGPLAN Notices, pages
47–65. ACM, October 2000.
[AGH00] Ken Arnold, James Gosling, and David Holmes. The Java Programming
Language (Third Edition). Addison-Wesley, 2000.
131

[AHR02] Mattew Arnold, Michael Hind, and Babara Ryder. Online Feedback-
Directed Optimization of Java. In Proceedings of the Conference on
Object-Oriented Programming Systems, Languages, and Applications,
pages 111 – 129, 2002.
[aji] Ajile systems. http://www.ajile.com.
[And94] Lars Ole Andersen. Program Analysis and Specialization for the C
Programming Language, May 1994. Ph.D thesis, DIKU, University of
Copenhagen.
[AR02] Matthew Arnold and Barbara G. Ryder. Thin Guards: A Simple and
Effective Technique for Reducing the Penalty of Dynamic Class Load-
ing. In 16th European Conference for Object-Oriented Programming
(ECOOP’02), pages 498 – 524, 2002.
[aspa] AspectBench compiler for AspectJ. http://aspectbench.org/.
[aspb] AspectJ. http://eclipse.org/aspectj/.
[BD00] Derek Bruening and Evelyn Duesterwald. Exploring Optimal Compi-
lation Unit Shapes for an Embedded Just-In-Time Compiler. In Pro-
ceedings of the 2000 ACM Workshop on Feedback-Directed and Dynamic
Optimization FDDO-3, Dec 2000.
[BKMS98] David F. Bacon, Ravi B. Konuru, Chet Murthy, and Mauricio J. Serrano.
Thin Locks: Featherweight Synchronization for Java. In Proceedings of
the Conference on Programming Language Design and Implementation,
pages 258–268, June 1998.
[Bla99] Bruno Blanchet. Escape Analysis for Object Oriented Languages: Ap-
plication to Java. In Conference on Object-Oriented Programming, Sys-
tems, Languages and Applications (OOPSLA’99), pages 20–34, Nov
1999.
132

[BS96] David F. Bacon and Peter F. Sweeney. Fast Static Analysis of C++
Virtual Function Calls. In Proceedings of the Conference on Object-
Oriented Programming Systems, Languages, and Applications (OOP-
SLA’96), pages 324 – 341, October 1996.
[cer] Certrevsim. http://www.pvv.ntnu.no/ andrearn/certrev/sim.html.
[CGS+99] Jong-Deok Choi, Manish Gupta, Mauricio J. Serrano, Vugranam C.
Sreedhar, and Samuel P. Midkiff. Escape Analysis for Java. In Con-
ference on Object-Oriented Programming, Systems, Languages and Ap-
plications (OOPSLA’99), pages 1–19, Nov 1999.
[cla] Gnu classpath. http://www.gnu.org/classpath.
[CLS00] Michal Cierniak, Guei-Yuan Lueh, and James M. Stichnoth. Practicing
JUDO: Java under Dynamic Optimizations. In Proceedings of the Con-
ference on Programming Language Design and Implementation, pages
13–26, Vancouver, BC, Canada, June 2000.
[CPL] Common Public License Version 1.0.
http://www.opensource.org/licenses/cpl.php.
[CU91] Craig Chambers and David Ungar. Making Pure Object-Oriented Lan-
guages Practical. In Proceedings of the Conference on Object-Oriented
Programming, Systems, Languages, and Applications (OOPSLA’91),
pages 1 – 15, 1991.
[DA99] David Detlefs and Ole Agesen. Inlining of Virtual Methods. In 13th Euro-
pean Conference on Object-Oriented Programming (ECOOP’99), pages
258 – 278, June 1999.
[DGC95] Jeffrey Dean, David Grove, and Craig Chambers. Optimization of
Object-Oriented Programs Using Static Class Hierarchy Analysis. In 9th
European Conference on Object-Oriented Programming (ECOOP’95),
pages 77 – 101, August 1995.
133

[Dri01] Karel Driesen. Efficient Polymorphic Calls. The Kluwer International
Series in Engineering and Computer Science, 2001.
[EGH94] Maryam Emami, Rakesh Ghiya, and Laurie J. Hendren. Context-
sensitive interprocedural points-to analysis in the presence of function
pointers. In Proceedings of the ACM SIGPLAN 1994 Conference on Pro-
gramming Language Design and Implementation, pages 242–256, 1994.
[FKR+98] Robert Fitzgerald, Todd B. Knoblock, Erik Ruf, Bjarne Steensgaard,
and David Tarditi. Marmot: an optimizing compiler for Java. Microsoft
technical report, Microsoft Research, October 1998.
[FQ03] Stephen J. Fink and Feng Qian. Design, Implementation and Evaluation
of Adaptive Recompilation with On-Stack Replacement. In International
Symposium on Code Generation and Optimization (CGO’03), pages 241
– 252, March 2003.
[FW00] Stephen Fink and Mark Wegman. IBM Patent: System and Method for
Dyanmically Optimizing Executing Activations, August 2000. Docket
No. YO92000-0248.
[GA98] David Gay and Alexander Aiken. Memory Management with Explicit
Regions. In Proceedings of the 1998 ACM SIGPLAN Conference on Pro-
gramming Language Design and Implementation, pages 313–323, Mon-
treal, Canada, June 1998.
[GA01] David Gay and Alexander Aiken. Language Support for Regions. In Pro-
ceedings of the ACM SIGPLAN ’01 Conference on Programming Lan-
guage Design and Implementation, pages 70–80, 2001.
[GHJV95] Erich Gamma, Richard Helm, Ralph Johnson, and John Vlissides. De-
sign Patterns. Addison-Wesley, 1995.
[GKS+04] Nikola Grcevski, Allan Kielstra, Kevin Stoodley, Mark Stoodley, and
Vijay Sundaresan. Java Just-in-Time Compiler and Virtual Machine
134

Improvements for Server and Middleware Applications. In 3rd Virtual
Machine Research and Technology Symposium (VM’04), pages 151 – 162,
May 2004.
[Gri98] D. Griswold. The Java HotSpot Virtual Machine Architecture, 1998.
http://www.javasoft.com/products/hotspot/whitepaper.html.
[GRS00] S. Ghemawat, K.H. Randall, and D.J. Scales. Field Analysis: Getting
Useful and Low-Cost Interprocedural Information. In Proceedings of
the Conference on Programming Language Design and Implementation,
pages 334–344, June 2000.
[GS00] David Gay and Bjarne Steensgaard. Fast Escape Analysis and Stack
Allocation for Object-based Programs. In Compiler Construction, 9th
International Conference (CC 2000), pages 82–93, 2000.
[Hal99] Niels Hallenberg. Combining Garbage Collection and Region Inference
in The ML Kit, 1999. Master’s thesis. Department of Computer Science,
University of Copenhagen, Denmark.
[HDH04] Martin Hirzel, Amer Diwan, and Michael Hind. Pointer Analysis in the
Presence of Dynamic Class Loading. In 18th European Conference for
Object-Oriented Programming (ECOOP’04), pages 96–122, June 2004.
[HG03] Kim Hazelwood and David Grove. Adaptive Online Context-Sentitive
Inlining. In International Symposium on Code Generation and Opti-
mization (CGO’03), pages 253 – 264, March 2003.
[Hol94] Urs Holzle. Adaptive Optimization for SELF: Reconciling High Perfor-
mance with Exploratory Programming, 1994. Ph.D Thesis, Standford
University.
[HT01] Navin Heintze and Olivier Tardieu. Demand-Driven Pointer Analysis.
In Proceedings of the ACM SIGPLAN 2001 Conference on Programming
Language Design and Implementation, pages 24 – 34, 2001.
135

[IKY+00] Kazuaki Ishizaki, Motohiro Kawahito, Toshiaki Yasue, Hideaki Ko-
matsu, and Toshio Nakatani. A Study of Devirtualization Techniques
for a Java Just-In-Time Compiler. In Proceedings of the Conference
on Object-Oriented Programming, Systems, Languages, and Applications
(OOPSLA’00), pages 294–310, 2000.
[jav] Javalin stamp. http://www.parallax.com/javalin/index.asp.
[jika] Jikes compiler. http://www-124.ibm.com/developerworks/oss/jikes/.
[jikb] Jikes RVM. http://www-124.ibm.com/developerworks/oss/jikesrvm/.
[JL96] Richard Jones and Rafael Lins. Garbage Collection: Algorithms for
Automatic Dynamic Memory Management. John Wiley & Sons, 1996.
[kaf] Kaffe Virtual Machine. http://www.kaffe.org.
[LB98] Sheng Liang and Gilad Bracha. Dynamic Class Loading in the Java(TM)
Virtual Machine. In Proceedings of the Conference on Object-Oriented
Programming Systems, Languages, and Applications, pages 36 – 44,
1998.
[LH03] Ondrej Lhotak and Laurie Hendren. Scaling Java points-to analysis using
Spark. In G. Hedin, editor, Compiler Construction, 12th International
Conference, volume 2622 of LNCS, pages 153–169, Warsaw, Poland,
April 2003. Springer.
[LY96] Tim Lindholm and Frank Yellin. The Java Virtual Machine Specifica-
tion. Addison-Wesley, 1996.
[McD] C.E. McDowell. Reducing garbage in Java.
http://www.cse.ucsc.edu/research/embedded/pubs/gc/.
[Muc97] Steven S. Muchnick. Advanced Compiler Design and Implementation.
Morgan Kaufmann, 1997.
136

[PL01] Sanjay J. Patel and Steven S. Lumetta. rePlay: A Hardware Framework
for Dynamic Program Optimization. In IEEE Transactions on Comput-
ers, pages 590 – 608, 2001.
[PS01] Igor Pechtchanski and Vivek Sarkar. Dynamic optimistic interprocedu-
ral analysis: A framework and an application. In Proceedings of the
Conference on Object-Oriented Programming Systems, Languages, and
Applications, pages 195 – 210, 2001.
[PVC01] Michael Paleczny, Christopher Vick, and Cliff Click. The Java
HotSpot(TM) Server Compiler. In USENIX Java Virtual Machine Re-
search and Technology Symposium, pages 1 – 12, 2001.
[QH04] Feng Qian and Laurie Hendren. Towards Dynamic Interprocedural Anal-
ysis in JVMs. In 3rd Virtual Machine Research and Technology Sympo-
sium (VM’04), pages 139 – 150, May 2004.
[QH05] Feng Qian and Laurie Hendren. A Study of Type Analysis for Spec-
ulative Method Inlining in a JIT Environment. In Proceedings of 14th
International Conference, CC 2005, April 2005.
[RMR01] Atanas Rountev, Ana Milanova, and Barbara Ryder. Points-to analysis
for Java using annotated constraints. In Proceedings of OOPSLA’01,
pages 43 – 55, 2001.
[Ruf00] Eric Ruf. Effective synchronization removal for java. In Proceedings of
the Conference on Programming Language Design and Implementation,
pages 208 – 218, 2000.
[sab] Sablevm. http://www.sablevm.org.
[SHR+00] Vijay Sundaresan, Laurie J. Hendren, Chrislain Razafimahefa, Raja
Vallee-Rai, Patrick Lam, Etienne Gagnon, and Charles Godin. Prac-
tical Virtual Method Call Resolution for Java. In Proceedings of the
137

Conference on Object-Oriented Programming, Systems, Languages, and
Applications (OOPSLA’00), pages 264–280, 2000.
[soo] Soot - a Java Optimization Framework.
http://www.sable.mcgill.ca/soot/.
[SOT+00] T. Suganuma, T. Ogasawara, M. Takeuchi, T. Yasue, M. Kawahito,
K. Ishizaki, H. Komatsu, and T. Nakatani. Overview of the IBM Java
Just-in-Time Compiler. IBM Systems Journal, 39(1):175–193, 2000.
[spea] Spec JBB2000 benchmark. http://www.spec.org/jbb2000/.
[speb] Spec JVM98 benchmarks. http://www.spec.org/osg/jvm98/index.html.
[Ste96] Bjarne Steensgaard. Points-to Analysis in Almost Linear Time. In Pro-
ceedings of the 23rd ACM SIGPLAN-SIGACT Symposium on Principles
of Programming Languages, pages 32–41, January 1996.
[Ste00] Bjarne Steensgaard. Thread-Specific Heaps for Multi-Threaded Pro-
grams. In Proceedings of the second International Symposium on Mem-
ory Management, pages 18 – 24, 2000.
[SYN03a] Toshio Suganuma, Toshiaki Yasue, and Toshio Nakatani. A Region-
Based Compilation Technique for a Java Just-In-Time Compiler. In
Proceedings of the Conference on Programming Language Design and
Implementation, pages 312 – 323, 2003.
[SYN03b] Toshio Suganuma, Toshiaki Yasue, and Toshio Nakatani. A Region-
based Compilation Technique for a Java Just-in-time Compiler. In Pro-
ceedings of the Conference on Programming Language Design and Im-
plementation, pages 312 – 323, 2003.
[Tof98] Mads Tofte. A brief introduction to regions. In Proceedings of the first In-
ternational Symposium on Memory Management, pages 186–195. ACM
Press, 1998.
138

[TP00] Frank Tip and Jens Palsberg. Scalable Propagation-based Call Graph
Construction Algorithms. In Proceedings of the Conference on Object-
Oriented Programming Systems, Languages, and Applications (OOP-
SLA’00), pages 281–293, October 2000.
[TT97] Mads Tofte and Jean-Pierre Talpin. Region-Based Memory Manage-
ment. Information and Computation, 132(2):109–176, 1997.
[Urs92] Urs Holzle and Craig Chambers and David Ungar. Debugging Optimized
Code with Dynamic Deoptimization. In Proceedings of the Conference
on Programming Language Design and Implementation, pages 32 – 43,
1992.
[VR01] Frederic Vivien and Martin C. Rinard. Incrementalized Pointer and Es-
cape Analysis. In Proceedings of the Conference on Programming Lan-
guage Design and Implementation, pages 35 – 46, 2001.
[VRGH+00] Raja Vallee-Rai, Etienne Gagnon, Laurie Hendren, Patrick Lam, Patrice
Pominville, and Vijay Sundaresan. Optimizing Java bytecode using the
Soot framework: Is it feasible? In Compiler Construction, 9th Interna-
tional Conference (CC 2000), pages 18–34, 2000.
[Vug00] Vugranam C. Sreedhar and Michael G. Burke and Jong-Deok Choi. A
framework for interprocedural optimization in the presence of dynamic
class loading. In Proceedings of the Conference on Programming Lan-
guage Design and Implementation, pages 196 – 207, 2000.
[wek] Weka 3: Data Mining Software in Java.
http://www.cs.waikato.ac.nz/ml/weka/.
[Wha01] John Whaley. Partial method compilation using dynamic profile infor-
mation. In ACM Conference on Object-Oriented Programming Systems,
Languages, and Applications, Oct 2001.
139

[WL95] Roberd P. Wilson and Monica S. Lam. Efficient Context-Sensitive
Pointer Analysis for C Programs. In Proceedings of the Conference on
Programming Language Design and Implementation, pages 1 – 12, 1995.
[WR99] J. Whaley and M. Rinard. Compositional Pointer and Escape Analysis
for Java Programs. In Conference on Object-Oriented Programming, Sys-
tems, Languages and Applications (OOPSLA’99), pages 187–206, Nov
1999.
140

Appendix A
Dynamic metrics of benchmarks
Table A.1 lists six important metrics of benchmarks used in this thesis. The data
come from the webpage of Sable research group at McGill University1. We use short
names for benchmarks due to the limit of page width. Each row compares one metric
of all benchmarks. We also use different metric names from the original source:
loaded.classes is the number of loaded application classes (a.k.a size.appLoadedClasses.value);
size.load is the number of bytecode instructions of loaded application classes (a.k.a
size.appLoad.value);
size.exec is the number of bytecode instructions that are executed at least once (a.k.a
size.appRun.value);
poly.sites is the number of different virtual call sites executed in application code
(a.k.a polymorphism.appCallSites.value);
poly.polyrate is the percentage of call sites that have multiple targets (a.k.a polymor-
phism.appTargetPolyDensity.value);
mem.alcrate is the allocation rate as the number of bytes allocated per killo bytecode
executed (a.k.a memory.byteAppAllocationDensity.value);
1http://www.sable.mcgill.ca/metrics
141

metric comp jess db javac mpeg mtrt jack soot
loaded.classes 22 158 14 175 62 35 66 522
size.load 6,555 22,370 6,436 44,664 38,484 11,193 23,424 45,278
size.exec 5,084 11,634 4,546 26,267 34,975 9,460 18,721 23,850
poly.sites 54 737 128 2617 326 939 1124 2877
poly.polyrate 0.019 0.011 0 0.103 0.037 0.005 0.010 0.049
mem.alcrate 11.096 294.895 24.824 131.824 0.431 91.766 313.793 167.476
Table A.1: Selected dynamic metrics of benchmarks
142