Runtime analysis of parallel applications for industrial ...
22
Runtime analysis of parallel applications for industrial software development Markus Geimer and Christian Feld, Forschungszentrum Jülich GmbH Daniel Becker, Siemens AG
Transcript of Runtime analysis of parallel applications for industrial ...
Runtime analysis of parallel applications for
industrial software development
Markus Geimer and Christian Feld, Forschungszentrum Jülich GmbH
Daniel Becker, Siemens AG

Page 2 M. Geimer, C. Feld, and D. Becker
Summary
Supportive tool stack
Runtime recording with Score-P
Multicore tool support
Application requirements
Outline
Page 3 M. Geimer, C. Feld, and D. Becker
Power Generation
Services
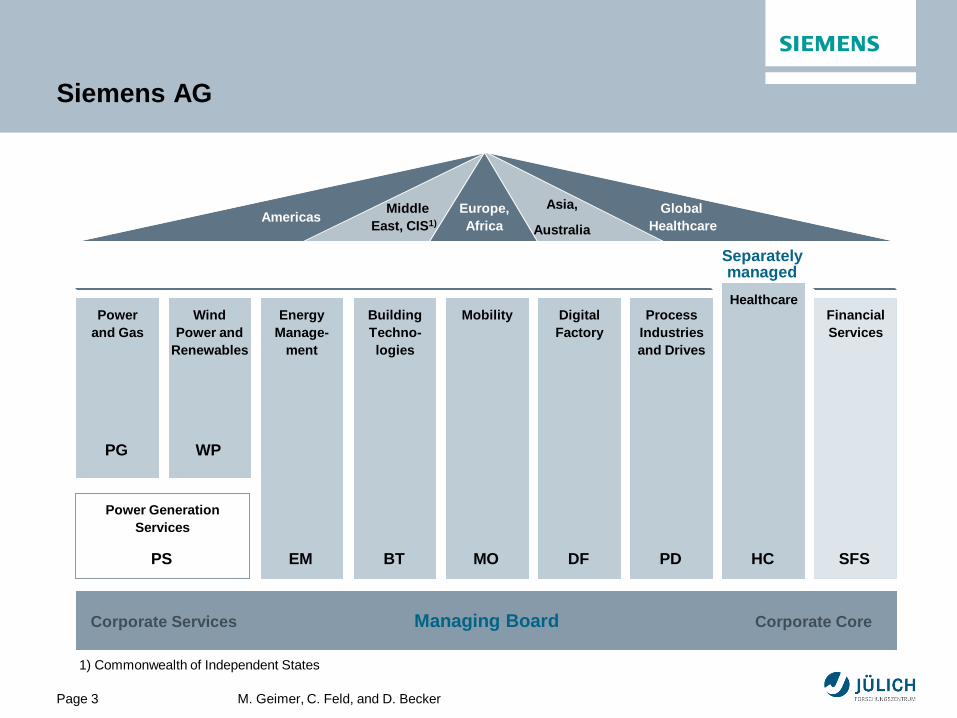
Siemens AG
1) Commonwealth of Independent States
Managing Board
Market
Americas Global
Healthcare
Middle
East, CIS1)
Asia,
Australia
Europe,
Africa
Financial
Services
Power
and Gas
Wind
Power and
Renewables
Mobility
Energy
Manage-
ment
Building
Techno-
logies
Digital
Factory
Process
Industries
and Drives
Healthcare
Separately managed
Corporate Core Corporate Services
PG
MO PS
WP
EM BT DF PD HC SFS

Page 4 M. Geimer, C. Feld, and D. Becker
Typical multicore migration
Let us assume that an application has already multiple threads…
High effort Concurrency
bugs
• Data races
• Deadlocks/livelocks
• Nondeterminism
• Memory model
• …
• Synchronization &
communication
• Contention on shared
resources
• …
• Explicit thread management
and synchronization
• Limited portability
• …
Poor
performance
Multicore migration is extremely challenging
Page 5 M. Geimer, C. Feld, and D. Becker
Summary
Supportive tool stack
Runtime recording with Score-P
Multicore tool support
Application requirements
Outline

Page 6 M. Geimer, C. Feld, and D. Becker
Design process towards multicore software
Tool support is essential for an
effective and efficient parallelization

Page 7 M. Geimer, C. Feld, and D. Becker
Multicore migration scenario
Requirements for profiling & tracing systems
• Focus on understanding the application and
its parallel aspects
• Threads & processes
• Locks & messages
• Portable to Windows, Linux
• HW independent (x86, ARM, and ppc)
• Heterogeneous system support
(e.g., Intel Xeon Phi, CUDA)
• Formats enabling interoperability and
custom analysis types
Multicore migration scenario
• Legacy code is code where nobody
understands the details
• Runtime behavior is also complex and hard
to follow
• Manual extraction of information is
cumbersome
• Profiling and tracing tools are essential
• To understand and debug
• To engineer and optimize the runtime

Page 8 M. Geimer, C. Feld, and D. Becker
Summary
Supportive tool stack
Runtime recording with Score-P
Multicore tool support
Application requirements
Outline

Page 9 M. Geimer, C. Feld, and D. Becker
Runtime recording with Score-P
• Open source community
• Linux (& Windows)
• HW independent
(x86, ARM, PPC, …)
• Heterogeneous systems
(e.g., Intel Xeon Phi, CUDA)
• Open formats enabling
interoperability and custom
analysis types
• Extremely scalable
www.score-p.org

Page 10 M. Geimer, C. Feld, and D. Becker
Score-P 1.3
• Provides typical functionality for HPC performance tools
• Support for process-level parallelism using MPI/SHMEM
• Support for thread-level parallelism using OpenMP/Pthreads
• Support for accelerator-level parallelism using CUDA
• Based on instrumentation
• Supports various techniques
• Extensive runtime filtering & selective recording capabilities
• Flexible measurement with single re-compilation
• Basic and advanced profile generation
• Event trace recording
• Online access to profiling data
• Scalability: Petascale
• Portability: Supports all major HPC platforms, incl.
IBM Blue Gene, Cray XT/XE/XK/XC, Fujitsu FX10 & K computer,
SGI Altix, Power/AIX, Linux-based clusters (x86, ARM, Power)
• Open source: 3-clause BSD license
Key features
JUQUEEN
28 rack IBM Blue Gene/Q
28,672 nodes (458,752 cores, 4-way SMT)
448 TB RAM, 5.9 Petaflop/s peak

Page 11 M. Geimer, C. Feld, and D. Becker
Score-P workflow
Instr.
target
application
Score-P
measurement lib
HWC
OTF2
event traces Scalasca
Trace Analyzer
CUBE4
wait-state report
CUBE4
summary report
Optimized measurement configuration
Instrumenter
compiler /
linker
Instrumented
executable
Source
modules
Re
po
rt
ma
nip
ula
tion
Vampir Cube TAU ParaProf

Page 12 M. Geimer, C. Feld, and D. Becker
Score-P instrumentation options
• By using the compiler
(GCC, Intel, PGI, IBM xl, Cray, Fujitsu)
• By using source-to-source translation
(Opari2, PDToolkit)
• By linking against a pre-instrumented library
(MPI, SHMEM)
• By using GNU linker symbol renaming
(POSIX threads, SHMEM)
• Extensive API (C/C++/Fortran), supporting
• Program phases
• Functions
• Arbitrary code regions
• Measurement control
Automatic instrumentation Manual instrumentation

Page 13 M. Geimer, C. Feld, and D. Becker
Automatic binary instrumentation using Pin
• Current prototype supports
• Function wrapping
• Incl. pre-runtime filtering (i.e., file level, region level,
shared-object level)
• Replacement of threading API routines
(by calls to Score-P measurement system)
• POSIX threads
• Windows threads
• Qt thread API
• ACE threads
• Pin: dynamic binary
instrumentation tool from
Intel
• Flexible instrumentation at
image-load time
• No recompilation
necessary
• But only supports x86
architectures
Future work: Support for MTAPI (Multicore Association), Intel TBB

Page 14 M. Geimer, C. Feld, and D. Becker
Summary
Supportive tool stack
Runtime recording with Score-P
Multicore tool support
Application requirements
Outline
Page 15 M. Geimer, C. Feld, and D. Becker
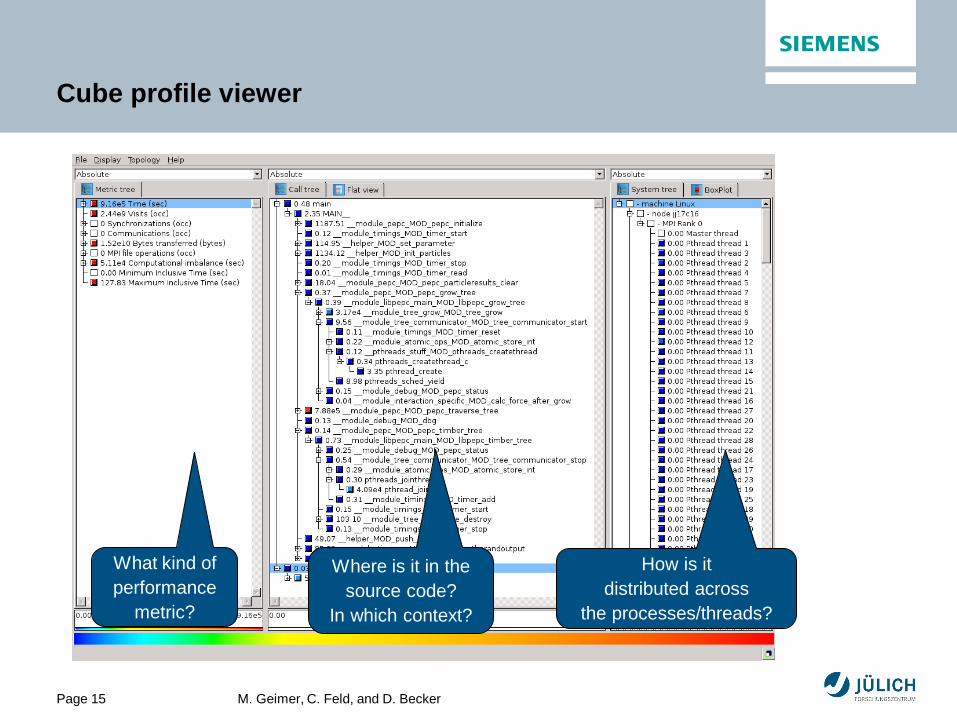
Cube profile viewer
How is it
distributed across
the processes/threads?
What kind of
performance
metric?
Where is it in the
source code?
In which context?
Page 16 M. Geimer, C. Feld, and D. Becker
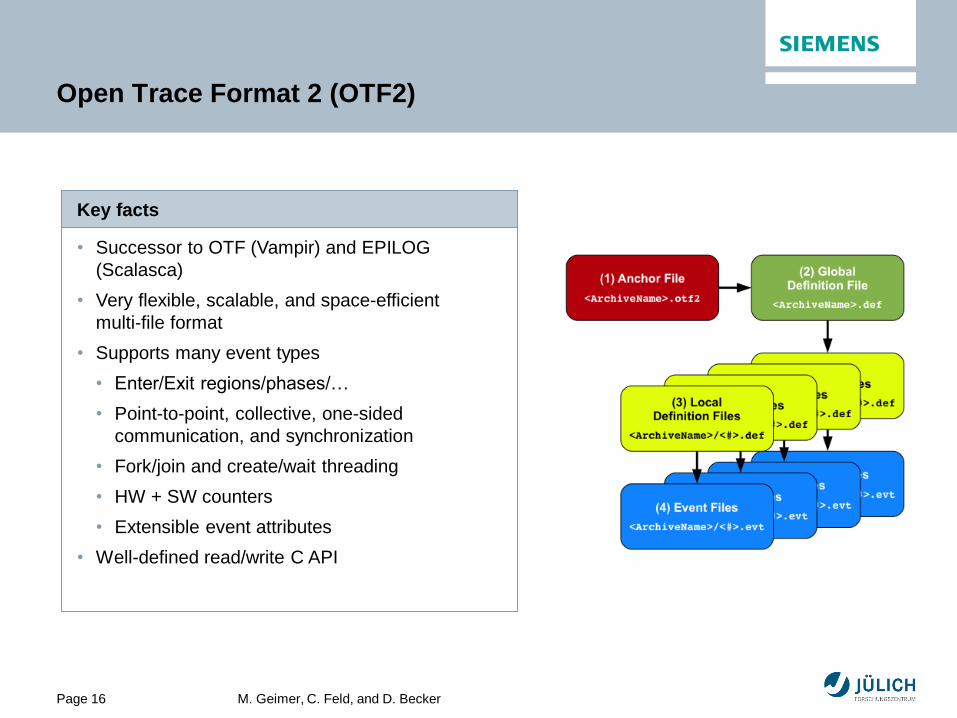
Open Trace Format 2 (OTF2)
• Successor to OTF (Vampir) and EPILOG
(Scalasca)
• Very flexible, scalable, and space-efficient
multi-file format
• Supports many event types
• Enter/Exit regions/phases/…
• Point-to-point, collective, one-sided
communication, and synchronization
• Fork/join and create/wait threading
• HW + SW counters
• Extensible event attributes
• Well-defined read/write C API
Key facts

Page 17 M. Geimer, C. Feld, and D. Becker
Time-line visualization in Vampir (TU Dresden)

Page 18 M. Geimer, C. Feld, and D. Becker
Automatic trace analysis with Scalasca
• Idea
• Automatic search for patterns of inefficient behavior
• Classification of behavior & quantification of significance
• Advantages
• Guaranteed to cover the entire event trace
• Quicker than manual/visual trace analysis
• Parallel replay analysis exploits available memory & processors to deliver scalability
Call
path
Pro
pert
y
Location
Low-level
event trace
High-level
result Analysis

Page 19 M. Geimer, C. Feld, and D. Becker
Example: Lock contention analysis
• Frequent and severe problem during multicore migration
• Automatic determination of waiting times in acquire lock operations
• Easy identification of blocking threads in different call paths
• Currently supports
• OpenMP critical sections & lock API
• Pthread mutex & condition variable APIs
• Future work
• Determine root-cause of waiting time
Page 20 M. Geimer, C. Feld, and D. Becker
Summary
Supportive tool stack
Runtime recording with Score-P
Multicore tool support
Application requirements
Outline

Page 21 M. Geimer, C. Feld, and D. Becker
Summary
• Parallelizing legacy software is tedious
• Developers have to understand all parts of the software
• Getting synchronization right and efficient is challenging
• Profiling and tracing tools
• Enable developers to understand, debug, engineer, and optimize
their application
• Have to be portable and extendable
• Should allow to focus only on relevant parts of the application
• Score-P fulfills these requirements and comes with an supportive tool
stack enabling effective and efficient multicore migrations

Page 22 M. Geimer, C. Feld, and D. Becker
More information and contacts
Multicore Expert Center, Siemens AG
• Dr. Daniel Becker
Score-P & OTF2
• http://www.score-p.org
Scalasca & Cube
• http://www.scalasca.org