Running head: VA SWCD EMPLOLYEE JOB … · employee characteristics survey, the Minnesota...
154
An Examination of Virginia Soil and Water Conservation District Employee Job Satisfaction Angela Paige White Dissertation submitted to the faculty of the Virginia Polytechnic Institute and State University in partial fulfillment of the requirements for the degree of Doctor of Philosophy In Career and Technical Education Dr. John H. Hillison, Committee Co-Chair Dr. Daisy L. Stewart, Committee Co-Chair Dr. Thomas W. Broyles, Committee Member Dr. Patricia M. Sobrero, Committee Member March 27, 2008 Blacksburg, Virginia Keywords: Job Satisfaction, Virginia Soil and Water Conservation Districts
-
Upload
nguyenhanh -
Category
Documents
-
view
220 -
download
0
Transcript of Running head: VA SWCD EMPLOLYEE JOB … · employee characteristics survey, the Minnesota...

An Examination of Virginia Soil and Water Conservation District Employee Job Satisfaction
Angela Paige White
Dissertation submitted to the faculty of the Virginia Polytechnic Institute and State University in partial fulfillment of the requirements for the degree of
Doctor of Philosophy In
Career and Technical Education
Dr. John H. Hillison, Committee Co-Chair Dr. Daisy L. Stewart, Committee Co-Chair
Dr. Thomas W. Broyles, Committee Member Dr. Patricia M. Sobrero, Committee Member
March 27, 2008 Blacksburg, Virginia
Keywords: Job Satisfaction, Virginia Soil and Water Conservation Districts

An Examination of Virginia Soil and Water Conservation District Employee Job Satisfaction Angela Paige White
ABSTRACT
The study’s purpose was to determine the job satisfaction level of Virginia Soil and
Water Conservation District (SWCD) employees during fiscal year 2007-2008. Employee
characteristics were identified; three measures of job satisfaction were attained (intrinsic,
extrinsic, general satisfaction); and satisfaction levels on 12 specific job aspects were
determined. The relationship between job satisfaction and four independent variables (age,
gender, education level, primary job responsibility) was assessed. The instrument consisted of an
employee characteristics survey, the Minnesota Satisfaction Questionnaire (MSQ) 1977 Short-
Form, derived from the MSQ 1967 Long-Form (Weiss, Dawis, England, & Lofquist, 1967), and
a modified 2002 Virginia Association of Soil and Water Conservation Districts (VASWCD)
survey. Descriptive research statistics were utilized. A total of 185 employees participated,
which was an 80% response rate.
The majority of employees were characterized as: non-Hispanic, white, female, average
age 41 years, married with no children 18 and under living in the home, bachelor’s degree,
average tenure of 6.52 years, full-time, permanent position, average hourly wage of $14.45 and
annual salary of $36,373.54, primary job responsibility “technical.”
The MSQ found respondents generally and intrinsically satisfied. Greater satisfaction was
expressed for variety and social services. Overall respondents were undecided about extrinsic job
aspects. Advancement was an area of dissatisfaction.
The modified VASWCD survey found respondents satisfied overall. Respondents were
“very satisfied” with work schedule, type of work, and board relationships. Employees were

less satisfied with health insurance benefits, new employee orientation, and compensation. They
were “dissatisfied” with career advancement opportunities and life insurance.
Differences in total intrinsic, extrinsic, and general job satisfaction, as measured by the
MSQ, based on the independent variables were determined. A one-way ANOVA and Tukey’s
post-hoc test were utilized. Since the population of this study violated Levene’s Test of
Homogeneity, the ANOVA could not be performed for age and intrinsic and general job
satisfaction. The ANOVA was performed for all other variables. There was not a significant
difference in extrinsic satisfaction among respondents of the various age groups. There were no
significant differences in intrinsic, extrinsic, or general job satisfaction for the variables of
gender, education level, or primary job responsibility.
iii

Dedication
I would first like to dedicate this dissertation to my grandmothers, both of whom were
actively involved in my life and served as great mentors. Each showed me there are no limits for
women who seek professional and personal success. Born in the early 1900s, they each found a
way to pursue a career in the health care profession (as registered nurses), raise a family, and
give back to their communities.
To my paternal grandmother Minnie Agnes White, although you are no longer
residing on this Earth, you are always in my heart. Thank you for teaching me to have
respect for myself and others and to appreciate nature-the sun’s morning rays, the
flutter of a butterfly, the chirp of a baby bird, and the beauty of a flower in bloom.
To my maternal grandmother Thelma Taylor Ballenberger, thank you for showing me
how to have confidence, for showing me what it means to help others, and for having
a great sense of style.
I would like to dedicate this dissertation to my parents, Paige and Susie White. Words
can not express what you have done for me and how much your love and support have meant,
especially as I completed my post-graduate work.
Finally, I would like to dedicate this dissertation to my husband Aaron Ball. Aaron, thank
you for all your support, especially the past three years. I know we both look forward to closing
this chapter of our life together and anxiously await the start of our next chapter!
iv

Acknowledgments
I would like to acknowledge the guidance and support I received from each committee
member. First, let me express gratitude to my two co-chairs. Dr. Hillison, I have known you for
some time now and your commitment to my success has been unwavering. I appreciate
everything you have done to assist me on this journey. Dr. Stewart, I have an enormous amount
of respect for your dedication to your work and your student advisees. Your attention to detail is
impressive; I never doubted you reading every word of every draft I sent you and could count on
your constructive feedback. Now let me convey my appreciation to the remaining members of
my committee. Dr. Broyles, I appreciate the statistical support you provided. Dr. Sobrero, thank
you for sharing your Extension expertise and for always giving me words of encouragement.
I would like to express my appreciation and gratitude to Dr. Pat O’Reilly. The guidance
and instruction given in the Professional Seminar provided me with the knowledge and tools
necessary to complete my dissertation.
I would like to acknowledge the assistance I received from the Virginia Tech Center for
Assessment, Evaluation, and Educational Programming (CAEEP). A special thank-you is
extended to Eric Lichtenberger.
I would like to acknowledge the assistance I received from the Virginia Tech Laboratory
for Interdisciplinary Statistical Analysis (LISA). A special thank-you is extended to Sunan Zhao
and Pei Xiao.
I would like to thank the Clinch Valley Soil and Water Conservation District Board of
Directors for their cooperation as I completed my post-graduate work.
v
I want to thank Dr. Franklin “Lex” Bruce, Jr., for granting me permission to use a
modified version of an evaluation he had previously administered as well as for the time he took
to share his research expertise.
I would like to thank Ricky Rash and the Virginia Association of Soil and Water
Conservation Districts (VASWCD) for the unconditional support and assistance I received
throughout the research process.
I would like to acknowledge the cooperation I received from the staff of the Virginia
Department of Conservation and Recreation (DCR) who allowed me to field test my instrument
with assistance from a regional DCR office. A special thank-you is extended to that regional
manager and staff.
A special thank-you goes to A. Joseph Wentz who served as my test proctor on several
occasions.
vi

Table of Contents
Abstract……………………………………………………………………………………………ii
Dedication………………………………………………………………………………………...iv
Acknowledgments…………………………………………………………………………………v
Table of Contents……………………………………………....……………………………...…vii
List of Figures……………………………………………………...………………………….....xii
List of Tables……………………………………………………………………………...…….xiii
Chapter 1 Introduction....……………………………………………………………………...…..1
Background of Study……….……………………………………………………………...2 Theoretical Framework…..…..……………………………………………………………4 Problem Statement……..……………………………………………………………..…...4 Purpose of the Study………..….…………………………………………….……………7 Significance of the Study……...……………………………………………….………….9 Delimitations………….……....…..…………………………………………….………..11 Definitions………….………..………………………………………………….………..12 Organization of the Study……..…..…………………………………………….………..13
Summary……..…….….…..……………………………………...………………………13
Chapter 2 Literature Review…………………………………………………………………....14
Conservation Careers………….…………….…………………………………………….14 SWCD History…….………………………….…………………………………………...15 SWCD Mission and Responsibilities……...…...………………………………………….18 Virginia SWCD Structure………….….….…...……….………………………………..…19 Individual SWCD Office Structure………..….…………………………………………...22 Theoretical Framework………………….….……………………………………………..24 Job Satisfaction………………………….….……………………………………………..27 Job Satisfaction Theories and Measurements…………..…………………………………28
The Hawthorne Effect……………………………………………………………28 Job Satisfaction Blank……………………………………………………………29
Hierarchy of Needs Theory – Maslow...…………………………………………30 Two-Factor Hygiene and Motivation Theory – Herzberg.………………………30
Valence-Instrumentality-Expectancy (VIE) Theory – Vroom..…………………31 Job Descriptive Index (JDI) – Cornell Group……………………………………31
Job Diagnostic Survey (JDS) – Hackman and Oldhman………………………...32 Job in General Scale (JIG) Scale – Ironson, Smith, Brannick, Gibson, and Paul..32 Work Adjustment Theory – Minnesota Group…....……………………………..33
vii

Job Satisfaction and Other Variables…………………………………………………….33 Age………………………..….………………………………………………….34 Gender….....….……..……………………………………………………………36 Education……..…..……………………………………………………………...37 Primary Job Responsibility/Position………....…………………………………..39
Employee Turnover…...………………………………….…………………………...…39 History……..…..…………………………………………………………………39 Current Trends of Employee Tenure and Turnover…..……..…………………...40 Implications of Turnover……..…..……………………………………………...41 Employee Retention……………………………………………………………………...42 Virginia SWCD and Related Agency Studies………………………………..………….43 Summary…………………………………………………………………………………44
Chapter 3 Methodology…………………………………………………………………………48
Description of Study…………..…..……………………………………………………..49 Institutional Review Board Procedures…..……………..……………………………….49 Population….…………………………..….……………………………………………..49 Key Attributes………..…………….……………………………………………………50 Instrumentation - Part I: Minnesota Satisfaction Questionnaire 1977 Short-Form……..50
Validity of MSQ 1977 Short-Form..…………………………………………..…53 Reliability of MSQ 1977 Short-Form…..………………………………..............54 Permission for MSQ 1977 Short-Form Use……………………………………..54 Instrumentation - Part II: Modified 2002 Virginia SWCD Employee Evaluation………55 Permission for modified 2002 Virginia SWCD employee evaluation use..……..55 Validity and reliability for modified 2002 Virginia SWCD Evaluation…..……..56 Instrumentation - Part III: Employee Characteristics………..…………………..………56
Data Collection Assistance…….….…………………..…………………………………56 Field Test………………………..…………………..…………………………………...57 Data Collection Procedures…….. ..…………..…………………………………………59
Incentives………………………..…………..…………………………………………...60 Response Rates and Non-Respondents….…..….………………………………………..61 Data Analysis……………………………..…..………………………………………….63 Research Question 1 – Characteristics of Virginia SWCD employees...………..63 Research Question 2 and Question 3 – Virginia SWCD employees’ general, intrinsic, and extrinsic job satisfaction as measured by Minnesota Satisfaction
Questionnaire (MSQ) 1977 Short-Form….……..……………………………….64 Research Question 4 –.Virginia SWCD employee job satisfaction as measured by
modified 2002 VASWCD survey……………………………………………….65 Research Question 5 – Virginia SWCD employee differences in intrinsic, extrinsic, and general job satisfaction levels as measured by MSQ 1977 Short-
Form based on age, gender, education level, and primary job responsibility…..65 Summary…………………………………………………………………………………66
viii

Chapter 4 Findings of the Study…………………………………………………………………69
Survey Response…………………………………………………………………………70 Employee Characteristics – Research Question 1……..…………..…………………….70 Gender…………………………………………………………………………....70 Age……………………………………………………………………………….70 Ethnicity…...…………………………….……………………………………….71 Race……………...………………….……………………………………………71 Marital Status…………...………….…………………………………………….71 Children 18 and under and living in the home…………………….……………..71 Highest Educational Degree..…….……………………………………………...72 Virginia SWCD Area………..………….………………………..………………72
Tenure……………………………………………………………………………73 Employment Status…..….…….…………………………………………………74 Position Status……………………………………………………………………74 Level of Compensation..…..……………………………………………………..74 Primary Job Responsibility…....…………………………………………………75 MSQ Short-Form – Research Question 2 and 3…………………………………………75
General Job Satisfaction………………………………………………………76 Intrinsic Satisfaction…………………………………………………………..76 Extrinsic Satisfaction………………………………………………………….76
Modified Version of 2002 VASWCD Employee Evaluation – Research Question 4.......79 Differences in job satisfaction based on age, gender, education level, and primary job
responsibility – Research Question 5………………………………………………….....84 Summary..…….………………………………………………….………………………86 Chapter 5 Summary, Conclusions, Recommendations…..………………………………………88
Problem…..………..……………………………………………………………………..88
Purpose and Research Questions………………………………………………………...90 Summary of Literature Review……………..…………………………………………...91 Research Methodology………..………..………………………………………………..92 Conclusions by Research Question……..…………………….…………………………94 Virginia SWCD Employee Characteristics……….…………...…………………94 Virginia SWCD Job Satisfaction – MSQ 1977 Short-Form……..……..………..94 Virginia SWCD Job Satisfaction – Modified VASWCD 2002 Survey…....…….95 Job Satisfaction and Differences with Independent Variables……...….………..96 Recommendations……...………………………………………….……………………..97 Future Research……..……..…………………………………………………………...101 Final Thoughts………....……………………………………………………………….102
References………………………………………………………………………………………103
ix

Appendices…………….………………………………………………………………..………111
Appendix A Virginia Soil and Water Conservation District (SWCD) Employee Turnover Survey, August 2007 ……….……………………………………….…....111
Appendix B Virginia Soil and Water Conservation District (SWCD) Employee Turnover Survey, August 2007 Prior Correspondence E-Mail…………....………..112
Appendix C Virginia Soil and Water Conservation District (SWCD) Employee Turnover
Survey-August 2007 Cover Correspondence E-Mail……………………..113
Appendix D Virginia Soil and Water Conservation District (SWCD) Employee Turnover Survey-August 2007 Follow-up Correspondence E-Mail...........114
Appendix E Virginia Soil and Water Conservation District (SWCD) Employee Satisfaction Survey-Modified Version of 2002 SWCD Employee
Satisfaction Survey……………..……………………..…………………..115
Appendix F Virginia Soil and Water Conservation District (SWCD) Employee Characteristics Survey……..……………………………………....……...116
Appendix G Internal Review Board (IRB) Approval…………………………………..118
Appendix H Minnesota Satisfaction Questionnaire (MSQ) Short-form – Scale and
Corresponding Questions…………………………………………………..119
Appendix I Minnesota Satisfaction Questionnaire (MSQ) Permission………………...120
Appendix J Virginia Soil and Water Conservation District (SWCD) Employee Satisfaction Survey – Modified Version of 2002 SWCD Employee
Evaluation VASWCD Permission ………………………………………...121
Appendix K Virginia Soil and Water Conservation District (SWCD) Employee Satisfaction Survey-Modified Version of 2002 SWCD Employee
Evaluation Bruce Permission……………………………………………..122
Appendix L Summary of Field Test Comments Documented and Corrected .…….…..123
Appendix M Virginia Soil and Water Conservation District (SWCD) Job Satisfaction Study – Prior Correspondence E-Mail…..……………………………….124
Appendix N Virginia Soil and Water Conservation District (SWCD) Job Satisfaction
Study-Cover Correspondence E-Mail with Implied Consent……………..125
Appendix O Virginia Soil and Water Conservation District (SWCD) Job Satisfaction Study-Initial Correspondence E-Mail with Web-Based Survey Link……..127
x

Appendix P Virginia Soil and Water Conservation District (SWCD) Job Satisfaction
Study-Follow-up Correspondence E-mail………….……………………..128
Appendix Q Virginia Soil and Water Conservation District (SWCD) Job Satisfaction Study-Non-Respondent Correspondence E-Mail………..………………..129
Appendix R Minnesota Satisfaction Questionnaire (MSQ) Short-Form-Virginia SWCD
Employee Frequency Distributions by Aspect of Job……………………..130
Appendix S Modified 2002 Virginia Association of Soil and Water Conservation Districts Employee Evaluation - Virginia SWCD Employees’ Satisfaction
Frequency Distributions by Issue……………………..…………………...132
Appendix T Modified 2002 Virginia Association of Soil and Water Conservation Districts Employee Evaluation - Virginia SWCD Employees’ Overall Job
Satisfaction Frequency Distributions……..………………………………..133
Appendix U Virginia SWCD Employee Comments…….……………………………..134
xi

List of Figures
Figure 1 Conservation Planning Levels of Certification……………….……………………….3
Figure 2 VA Soil and Water Conservation District (SWCD) Areas….……………………….20
Figure 3 Minnesota Satisfaction Questionnaire (MSQ) Scales…………….………………….52
xii

List of Tables
Table 1 Virginia SWCD Supervisors’ Opinions About Employee Turnover by Area……..…….6
Table 2 Virginia SWCD Area Employee Turnover Rates July 1, 2002 through July 1, 2007……7
Table 3 Virginia SWCD Employees’ Age Distribution………...……………….………………71
Table 4 Virginia SWCD Employees’ Highest Educational Degree……...……….…………..…72
Table 5 Virginia SWCD Response by Area……………………………………………………..73
Table 6 Virginia SWCD Employees’ Tenure……………………………………………………74
Table 7 Virginia SWCD Employees’ Primary Job Responsibility…………..…………..………75
Table 8 Minnesota Satisfaction Questionnaire Short-Form - Virginia SWCD Employee Intrinsic Scores…………..……………...…………………………………….…………...………78
Table 9 Minnesota Satisfaction Questionnaire Short-Form - Virginia SWCD Employee Extrinsic
Scores……………..……………………….. ……………………………………………79
Table 10 Virginia SWCD Employee Satisfaction Scores by Issue …………………..……….…80
Table 11 Virginia SWCD Employees’ Overall Job Satisfaction………………………………...81
xiii

Chapter 1
Introduction
One characteristic the majority of United States adult citizens share is that they are
gainfully employed. In June 2007 the employment-population ratio was 63.3%, with 145.9
million American adults employed (United States Department of Labor, Bureau of Labor
Statistics [BLS], 2007). Employment is a major factor in our lives and a driving force in our
society.
Entrance into the labor market varies. Although labor laws place job restrictions on
minors based on age and the type of work, individuals may seek employment in the United
States as young as 14 years of age (United States Department of Labor, Employment Standards
Administration Wage and Hour [ESA], n.d.). The majority of Americans enter the workforce on
a more permanent basis upon graduating from high school and/or college, remaining active
members of the workforce until normal retirement age. Normal retirement age is defined by the
Social Security Administration and varies from 62 years of age for those receiving reduced
Social Security retirement benefits to 67 years of age for those born in 1960 or later (United
States Social Security Administration [SSA], n.d.). It is probable that individuals may work 40 or
more years during their lifetime. The Centers for Disease Control and Prevention, National
Center for Health Statistics estimates the average person’s life expectancy to be 77.9 years of age
(Centers for Disease Control [CDC], National Center for Health Statistics [NCHS], 2006). This
means some people will devote more than half their life to work obligations.
Given the aforementioned statistics, it would certainly be advantageous for individuals to
be satisfied with both their chosen career and their employer. Being cognizant of employee job
satisfaction levels, as well as what work characteristics encourage job satisfaction or
1

dissatisfaction, would also be beneficial to employers because this information could potentially
reduce high rates of employee turnover. Employee turnover can have a considerable impact on
the labor market. The United States Department of Labor, BLS tracks employee turnover
statistics and publishes it on a monthly basis. In addition, there have been numerous studies
conducted by both the private and public sector on the impact of employee turnover, several of
which will be examined in Chapter 2.
Background of Study
Governmental agencies are certainly not exempt from employee turnover. Soil and
Water Conservation Districts (SWCDs) are an example. Established in the 1930s as a means of
giving local citizens a voice in the conservation movement, SWCDs are political subdivisions of
state government, located in all 50 states (Virginia Association of Soil and Water Conservation
Districts [VASWCD], n.d.). Virginia is home to 47 SWCDs that represent every county in the
Commonwealth, with the exception of Arlington County. There are also some independent cities
that do not have district representation. Responsibilities and services vary by SWCD;
nevertheless, all make considerable environmental contributions to their respective communities.
Staff positions, in terms of job titles and job descriptions, may differ slightly depending
on the SWCD; even so, most employ an average of four individuals (Virginia Department of
Conservation and Recreation [DCR], 2007a). Regardless of an individual’s position, prior
education, or previous work experience, some additional training and job certifications are
typically required for the new hire to perform satisfactorily. For instance, a Conservation
Technician and/or Conservation Specialist should attain at least a Level II Conservation Planning
Certification in order to adequately complete job duties as a Technical Service Provider (TSP).
This certification consists of completing Level I - Basic Planning Certification and Level II -
2

Resource Management Planning Certification, as defined by the United States Department of
Agriculture (USDA), Natural Resources Conservation Service (NRCS) -Virginia. The highest
level an employee can earn is Level III – Complex Certification. Figure 1 outlines the planning
certification requirements (USDA, NRCS-Virginia, 2007).
Level I – Basic Planning Conservation Planning Course, Part 1 Conservation Planning Course, Part 2 Conservation Planning Course, Part 3 Field Review Erosion Processes Certification Virginia Revised Universal Soil Loss Equation (VA RUSLE) II Practical Exercise Environmental Compliance Training Cultural Resources Training, Part 1-1, Mod 1-6 Virginia Department of Agriculture and Consumer Services (VDACS) Pesticide Applicator Certification (Category 10)
Level II-Resource Management Planning
Cultural Resources Training, Part 1-2, Mod 7-8 Introduction to Water Quality Agricultural Waste Management Systems – A Primer Department of Conservation and Recreation (DCR) Nutrient Management Planner Training Pest Management Considerations
Level III – Complex Plans (Nutrient Management and Certified Nutrient Management Plan)
DCR Nutrient Management Planner Certification Agricultural Waste Management Systems, Level 2
Figure 1. Conservation Planning Certification Levels
Figure 1 illustrates that the levels of conservation planning a technical district employee
should obtain are extensive. Districts may invest a substantial amount of time and finances in
employee professional development because with each level there are associated registration
fees, exam fees, travel expenses, and time that the employee must devote to training, as opposed
to regular job duties. According to James Dickenson, Clinch Valley SWCD Chair, the district
hired a Conservation Specialist in October 2002 and it took 12 months for that employee to earn
3

a Level II certification, with some of the required certifications costing hundreds of dollars as a
result of related registration fees, lodging, and travel expenses (James Dickenson, personal
communication, October 26, 2007). Unfortunately, the return on districts’ investments could be
short-lived if employees voluntarily resign their positions and seek employment elsewhere or are
not successful at their work.
Theoretical Framework
The theoretical framework for this study is grounded in job satisfaction. Numerous
theories have been developed around job satisfaction and how it relates to employee
performance, recruitment, and retention (Accel-Team, n.d.; Dawis, 2004; Hackman & Oldham,
1975; Herzberg, Mausner, Peterson, & Capwell, 1957; Herzberg, Mausner, & Snyderman, 1959;
Ironson, Smith, Brannick, Gibson, & Paul, 1989; Levine, Ash, & Levine, 2004; Maslow, 1943;
Smith, Kendall, & Hulin, 1969; Weiss, Dawis, England, and Lofquist, 1967; Vroom, 1964). This
study centers on the Theory of Work Adjustment. The overall concept is that an employee’s
satisfaction, or lack thereof, with his/her job has an effect on productivity and rates of employee
turnover. This theoretical framework will be discussed in greater detail in Chapter 2.
Problem Statement
Whether or not employee turnover is an issue for Virginia SWCDs has been a subject of
debate over the years. The issue garnered so much attention that in 2002 the Virginia Association
of Soil and Water Conservation Districts (VASWCD) authorized a state-wide employee
evaluation survey, contracting Franklin “Lex” Bruce, Jr., an Evaluation Specialist from Virginia
Tech, to complete the data collection and analysis. The final report’s executive summary stated,
“Analyses were conducted for the purpose of identifying characteristics and/or problems
4

regarding employee satisfaction and factors contributing to the loss of valuable district
employees” (Bruce, 2002, p. 3).
Employee turnover has also been scrutinized at the area and local levels. Michael Altizer
is currently a member of the Virginia Soil and Water Conservation Board (SWCB) and a director
with Clinch Valley SWCD. From 2002-2006, he served as the VASWCD Area IV Chair,
representing 11 conservation districts in Southwest Virginia; during his tenure he witnessed
employee turnover first-hand. From August to December 2002, four SWCDs in Area IV hired a
total of five new employees; by December 31, 2006, only one of those individuals had retained
employment with their respective district, with three voluntarily leaving their positions and one
being dismissed (Michael Altizer, personal communication, February 20, 2007).
In August 2007, with support and review from the VASWCD, the researcher surveyed
individuals serving in a supervisory and/or personnel management capacity from each of the 47
districts. An electronic questionnaire was used to determine whether or not the respondents
thought that employee turnover was a problem for their respective districts for a five-year period
ranging from July 1, 2002 to July 1, 2007. District representatives were also asked to report the
number of staff positions funded during the five-year period and then document how many
employees hired for those positions had voluntarily or involuntarily left. Refer to Appendix A
through D to review the questionnaire and related correspondence. Thirty-six district
representatives responded, equating to a 77% response rate. Response rates by SWCD Areas of
the state were as follows: Area I, 67%, Area II, 100%, Area III, 67%, Area IV, 91%, Area V,
70%, and Area VI, 60%. (Note: Refer to Chapter 2, Figure 2 for a list of districts by Area.)
When asked whether employee turnover was a problem for Virginia SWCDs, a total of
17 SWCD respondents identified employee turnover as a problem (47%), while the remaining 19
5

respondents did not identify employee turnover as problem (53%). Table 1 was generated using
the student version of the Statistical Program for the Social Sciences (SPSS) Version 14.0 for
Windows. Table 1 illustrates how districts responded by Area when asked whether or not
employee turnover was a problem.
Table 1
Virginia SWCD Supervisors’ Opinions About Employee Turnover by Area (n=36)
Opinion on Whether Employee
Turnover is a Problem
Area Yes No Total
I 0 4 4
II 4 2 6
II 4 2 6
IV 5 5 10
V 2 5 7
VI 2 1 3
Total 17 19 36
Respondents from Areas II, III, and VI thought employee turnover was a problem, while those
from Areas I and V did not. The district representatives who responded from Area IV were
evenly divided on the issue.
Table 2 was also generated using SPSS Version 14.0 for Windows. It shows the Virginia
SWCD employees who left their staff positions during the period July 1, 2002, through July 1,
2007.
6

Table 2
Virginia SWCD Area Employee Turnover – July 1, 2002 through July 1, 2007 (n=36)
Area Total
Positions
Funded
Employee
Voluntary
Departures
Employee
Involuntary
Departures –
Result of
Lack of
Funding
Employee
Involuntary
Departures –
Result of
Termination
Total
Departures
Departures
as Percent
of
Positions
I 27 7 0 2 9 33%
II 48 24 0 3 27 56%
III 25 14 4 4 22 88%
IV 48 21 1 3 25 52%
V 38 18 0 1 19 50%
VI 9 3 3 0 6 67%
Based on the data collected it appears that very few districts experience involuntary employee
departures, whether a result of lack of funding to support staff positions or due to terminations.
However, voluntary departures for some districts are quite extensive. The three areas that stated
turnover was not a problem or were divided equally on the issue had the smallest percentage of
departures as a percent of positions.
Purpose of the Study
Perhaps one of the first steps Virginia SWCDs can take to address the issue of employee
turnover is to identify employee job satisfaction. The purpose of this study was to determine the
level of job satisfaction among Virginia SWCD personnel, who were employed during fiscal
7

year 2007-2008. Three measures of job satisfaction (dependent variables) were attained using the
Minnesota Satisfaction Survey (MSQ) 1977 Short-Form: Intrinsic, Extrinsic, and General
Satisfaction (Weiss, Dawis, England, & Lofquist, 1967). These will be defined later and further
discussed in Chapter 2. In addition, this study assessed job satisfaction levels using a modified
version of a survey previously authorized by the VASWCD and administered by Franklin “Lex”
Bruce, Jr., of Virginia Tech in 2002. Employee characteristics were also obtained. Independent
variables were: age, gender, educational level, and position status.
The following research questions were investigated in this research study.
1. What were the characteristics of Virginia Soil and Water Conservation District
employees?
2. What was the general (overall) job satisfaction level of Virginia Soil and Water
Conservation District employees as measured by the Minnesota Satisfaction
Questionnaire (MSQ) 1977 Short-Form?
3. What degrees of intrinsic and extrinsic job satisfaction were expressed by Virginia Soil
and Water Conservation District employees as measured by the Minnesota Satisfaction
Questionnaire (MSQ) 1977 Short-Form?
4. What degree of job satisfaction was expressed by Virginia Soil and Water Conservation
District employees as measured by a modified version of the Virginia Association of Soil
and Water Conservation District’s (VASWCD) 2002 survey?
5. Were there differences in intrinsic, extrinsic, and general job satisfaction levels as
measured by the Minnesota Satisfaction Questionnaire (MSQ) 1977 Short-Form based on
the following independent variables: age, gender, education level, and primary job
responsibility?
8

Significance of Study
Employee job satisfaction is a topic of interest for most professions. This interest stems
from the need for all employers to recruit and retain competent and professional employees. In
reference to job satisfaction,
. . . it remains one of the most important variables in the study of work, either as a
dependent or independent variable. In the end, as the law of effect would have it, it is
satisfaction that rides herd on human choice and action (Dawis, 2004, p. 480).
Other sources have concluded that there is a relationship between job satisfaction levels
and employee turnover (Doran, Stone, Brief, & George, 1991; Duffy, Ganster, & Shaw, 1998;
Gruenberg, 1976; Judge, 1993; Mobley, 1977; O’Connor, Peters, Pooyan, Weekley, Frank, &
Erenkrantz, 1984; Spector, 1997). There are employee job satisfaction studies for a wide range of
professional sectors including Cooperative Extension, school counselors, secondary and post-
secondary education, public librarians, and the health-care industry (Carter, Pounder, Lawrence
& Wozniak, 1989; DeMato, 2001; Jewell, Beavers, Malpiedi, & Flowers, 1990; Pooyan,
Eberhardt, & Szigeti, 1990; Rousan & Henderson, 1996 Rubin, 1995). Research of this nature,
specific to Virginia SWCDs, is limited. There is documentation that in 2002 the VASWCD
authorized a “SWCD Employee Evaluation,” administered with assistance from Franklin “Lex”
Bruce, Jr., Virginia Tech, in which employee job satisfaction was evaluated because district
leaders at the time thought an assessment of job satisfaction was warranted (Bruce, 2002).
Thus, the objective of this particular study was to further contribute to the field of human
resource management, with specific emphasis on conservation districts. The findings,
conclusions, and recommendations are worthwhile to all Virginia SWCD stakeholders,
particularly directors and current and future employees.
9

There are a number of practical implications that can be derived from this study. First and
foremost, the study reveals the overall job satisfaction level of Virginia SWCD employees.
Should respondents express dissatisfaction, the study provides information about an issue that
should be further analyzed and addressed. Previous research, as identified in the Chapter 2
Literature Review, concludes that if employees are dissatisfied, it is highly probable that current
employees will not retain employment. This type of situation could have long-term negative
effects on a SWCD. For instance, future recruitment of qualified applicants could be thwarted
because potential recruits are hesitant about working for an employer whose reputation is
unsatisfactory. In addition, the employees who do maintain their employment with the district
may not perform adequately because of their dissatisfaction, resulting in a poor public image and
lack of support. A relationship between job satisfaction and job performance has been
documented.
Actually, in human relations theory, job satisfaction functions as a variable mediating
between social relations (with supervisor, coworkers, management) on the one hand and
performance and productivity on the other hand. This can be called the “satisfaction-
causes-performance” hypothesis: that job performance depends on the worker’s being
satisfied; and conversely, that job performance will suffer if the worker is dissatisfied
(Dawis, 2004, p. 475).
Knowing what factors promote job satisfaction, as well as dissatisfaction, enables
districts to incorporate positive factors into the work environment and, if possible, eliminate
many of the factors that cause dissatisfaction. In some instances, such data could be utilized by
an organization to address high employee turnover rates. An employee might be qualified to do
the job and be fond of the work responsibilities, but be dissatisfied with the office environment
10

or perhaps the current fringe benefits being offered. For example, if an open office layout is the
reason for an employee’s discontentment, due in part to the lack of privacy and constant
disruptions from co-workers, the district might be able to eradicate the problem by purchasing
office cubicles. On the other hand, if the fringe benefits package is the issue, the solution might
not be as easy to achieve given the present state of the district’s finances. Nevertheless, as a
result of surveying the employees, directors are in a better position to make informed decisions.
Perhaps in the future directors would explore various benefit options and elect to earmark more
of their available operational funds to fringe benefits, as opposed to another budget item.
Finally, in terms of recruitment, there are at least two advantages of knowing whether or
not current employees are satisfied. According to Fasulo and Kinney (2002), with the onset of
the new millennium, environmental career opportunities were “at an all-time high” (p. 1). This
means SWCDs are in direct competition with other employers seeking qualified employees. The
conservation districts’ federal partner, United States Department of Agriculture-Natural
Resources Conservation Service (USDA-NRCS), is fully aware of the labor market situation,
“As NRCS moves toward becoming the “Employer of Choice” for a highly skilled and diverse
workforce enabling conservation, we will be faced with recruiting in a highly competitive and
shrinking market” (2006, p. 22). Recognizing what it takes to satisfy employees aids district
recruitment and retention efforts. Furthermore, directors are supplied with the tools necessary to
target their recruiting efforts toward hiring individuals more compatible with the system. Job
announcements and position descriptions can be fashioned to better accommodate this task.
Delimitations
The population of this study was limited to individuals employed by a SWCD in Virginia
during FY 2007-2008. As a result, the findings and subsequent conclusions of this study are
11

applicable to other groups and/or settings only to the extent that they are similar to the study
population and must be made with caution.
Definitions
Employees: “all part-time and full-time workers who are paid a wage or salary” (United States
Department of Labor-BLS, n.d.).
Job satisfaction: An individual’s attitude toward his/her job (Ewen, 1967; Weiss, et al., 1967).
Extrinsic job satisfaction: An individual’s attitude toward his/her job based on external or
environmental factors such as working conditions, supervision, and co-workers (Wanous
& Lawler, 1972; Weiss, et al., 1967).
General job satisfaction: An individual’s attitude toward his/her job in relation to his/her
attitude toward life in general (Wells & Strate, 1957; Weiss, et al., 1967).
Intrinsic job satisfaction: An individual’s attitude toward work based on internal factors
such as type of work, achievement, and ability utilization (Wanous & Lawler, 1972;
Weiss, et al., 1967).
Soil and Water Conservation District (SWCD): May also be referred to as “district” or
“conservation district;” described as “political subdivisions of state government that
utilize state, federal, and private sector resources to solve today’s conservation problems”
(VASWCD, n.d.).
Soil and Water Conservation District (SWCD) Area: The 47 VA SWCDs are grouped into six
distinct regions based on geographic location and referred to as “Areas.” Refer to Chapter
2, Figure 2 for a list of districts and their associated Area.
Turnover: “the separation of an employee from an establishment (voluntary, involuntary, or
other)” (United States Department of Labor, BLS, n.d.).
12

Organization of the Study
Chapter 1 of the study consists of the introduction, background information on VA
SWCDs, problem statement, purpose of the study including research questions, significance of
this study, limitations and delimitations of the research, definition of terms, and the overall
organization of the study. Chapter 2 presents a review of the literature. In this chapter careers in
conservation are explored, the history and overall mission of SWCDs are described, the
administrative structure of districts in Virginia is examined as well as individual office structure,
the history, theories, and various means of measuring job satisfaction are summarized, employee
turnover and retention are explored, and related agency studies are reviewed. Chapter 3 describes
the methodology for this particular study. Procedures utilized for collecting and analyzing data
are explained. Chapter 4 presents the findings of the study. Chapter 5 is a summary of the
research study. It includes both conclusions and recommendations.
Summary
Employee recruitment and retention are challenging issues for many employers; Virginia
SWCDs are no exception. In terms of retention, there are both positive and negative aspects.
Virginia SWCD leaders can address both employee recruitment and retention by identifying the
characteristics of their staff members, determining the overall job satisfaction levels of those
employees, and exploring factors that impact satisfaction.
13

Chapter 2
Literature Review
Knowledge about employee job satisfaction may aid in managing employee turnover.
Therefore, the purpose of the study was to measure the job satisfaction of individuals presently
employed by Virginia Soil and Water Conservation Districts (SWCD). This chapter provides a
summary of previous research related to topics pertinent to this study: conservation careers; the
history of districts; the mission of SWCDs; the administrative structure of district’s operating in
Virginia; individual office structure; the theoretical framework for the study; an in-depth review
of job satisfaction including history, theories, and measurement; the history, trends, and
implications of both employee turnover and employee retention; and a review of related agency
studies.
Conservation Careers
Prior to the 1960s, careers in the environmental field were limited to the “conservation
sciences, such as natural resources and wildlife management” (Fasulo & Kinney, 2002, p. 2).
The environmentalism movement really began to take shape shortly after the first Earth Day
celebration was held in 1970. Following this world-wide event, the United States authorized
formation of the Environmental Protection Agency (EPA). Since that time, numerous laws in
favor of the environment have been enacted. “As a result of these activities, the number and
types of environmental jobs have also grown tremendously” (Fasulo & Kinney, 2002, p. 5).
“In the environmental career world, there are four basic drivers: political agreement
supporting legal and regulatory requirements, economics and the marketplace, environmental
values, and technology” (Environmental Careers Organization, 1999, p. 8). Fasulo and Kinney
(2002) identified three environmental career types: business type, scientific type, and liberal arts
14

type. Technicians are classified into the scientific career type and are the most sought after.
“Technicians, who outnumber professionals by three to one in most science-oriented fields, are
in the highest demand. Technicians are an integral part of any environmental project because
they do a majority of the hands-on work” (Fasulo & Kinney, 2002, p. 3). The United States
Department of Agriculture-Natural Resources Conservation Service (USDA-NRCS, 2006)
confirmed this assessment in a recently published occupational profile concluding that 86.9% of
their workforce is professional/technical, with a mere 13.03% classified as administrative/other
(2006).
Environmental careers can be found in the private, public, and non-profit sectors. Despite
a decline in the overall growth of government employment, according to the Environmental
Careers Organization, “hundreds of thousands of environmental professionals work for
government agencies, from well-known players such as the National Parks Service to the
smallest local water district” (1999, p. 13).
SWCD History
According to a guidebook edited by Milton S. Heath, Jr. (2004), the idea of conservation
districts started to materialize in the mid-1930s as a result of leadership from Hugh Hammond
Bennett, who is credited as being the “Father of Soil Conservation.”
Bennett’s concern for the land and the mammoth losses of soil as a result of soil erosion
dated back to 1905, when he and his soil survey partner, W. E. McLendon, developed a
theory of sheet erosion – the insidious but large unseen washing away of thin layers of
topsoil (Heath, 2004, p. 2).
As a result of Bennett’s passion for soil conservation, he eventually acquired $160,000 of federal
funding in 1930 to be used specifically for “soil erosion investigations” (Heath, 2004). In 1933,
15

the Soil Erosion Service (SES) was established within the Department of Interior, with Bennett
serving as the first director.
To learn more about the general history of SWCDs, the Web-based orientation course
facilitated by the Virginia Department of Conservation and Recreation (DCR), entitled Topics in
Leadership Management for Conservation District Directors, was referenced. According to
Chapter 2 (History), the origin of SWCDs in the United States can be attributed to the on-going
work of Bennett in combination with a national crisis that resulted in the collision of the
economy and natural resources. On October 24, 1929, the stock market crashed, sending the
country into an economic depression that would last for more than a decade. Two years later, in
1931, a severe drought hit the Midwest and Southern Plains causing severe crop loss. As the
crops died, the “Black Blizzards” began, which referred to the blowing dust generated from over-
plowed and over-grazed land. These dust storms increased with each passing year in what would
become known as the Dust Bowl era. In May 1934, the dust storms spread beyond the Dust Bowl
states, sparking the interest of national leaders meeting in Washington, DC. President Franklin
D. Roosevelt and his administration recognized the connection between the Dust Bowl farmers
and the average American citizen and sought to address the nation’s erosion problems. On April
27, 1935, the U. S. Congress pronounced that soil erosion was “a national menace” and declared
soil and water conservation and wise land use a national policy. Thus, U. S. Public Law 46, the
Soil Conservation Act of 1935 was passed. This Act established national policy, “To provide for
the protection of land resources against soil erosion and other purposes” (Heath, 2004, p. 4). This
Act further endorsed SES as a federal agency, resulting in a name change to Soil Conservation
Service (SCS). Eventually, the SCS would become a part of the United States Department of
Agriculture (USDA) and it would again be renamed in the 1990s as the Natural Resources
16

Conservation Service (NRCS). Under the direction of Bennett, the SCS developed extensive
conservation programs that advocated the use of farming techniques such as strip cropping,
terracing, crop rotation, contour plowing, and cover crops; all of which aided in the retention of
topsoil and prevented irreparable damage to the land (Virginia Department of Conservation and
Recreation [DCR], 2007b).
Bennett recognized the need for state and local involvement in the conservation
movement and sought to make this happen (Heath, 2004). In 1936, a Standard State District Act,
also referred to as “District Law,” was developed by the USDA – SCS, which encouraged the
citizens of local governments to organize conservation districts as subdivisions of state
government. In 1937, President Roosevelt wrote to each state governor, urging every state to
approve legislation that would authorize the creation of SWCDs. The Soil Conservation District
Program recognized that new farming methods must be accepted and enforced by the farmers on
the land, giving local citizens the opportunity to shape soil and water conservation and resource
planning in their communities. Each state would eventually pass the “District Law.” It should be
noted that although all states passed similar legislation, the terminology used to identify and
describe soil and water conservation districts is not standard throughout the United States. For
example, in Virginia elected officials who govern district operations are referred to as
“directors,” while in North Carolina they are referred to as “supervisors,” and in South Carolina
as “commissioners.”
Although not the first state to adopt the District Law, North Carolina was the first state to
organize a conservation district. Appropriately enough, the first district was the Brown
Creek Soil Conservation District, organized on August 4, 1937. It encompassed the
Brown Creek watershed, the site of Bennett’s home in Anson County. (Heath, 2004, p. 4)
17

The Commonwealth of Virginia accepted the federal government’s request to offer this
program in 1938 with the passage of the Soil Conservation District Law. This law is located
within the Code of Virginia under Title 10.1 Conservation, Chapter 5 Soil and Water
Conservation (VA DCR, 2007). There are currently 47 districts in Virginia.
SWCD Mission and Responsibilities
As previously stated, SWCDs are political subdivisions of state government; individual
districts are entrusted with the responsibility of performing conservation work within designated
boundaries. Initially, all districts followed watershed boundaries and as a result encompassed
more than one county; in some cases districts even included parts of several counties (Heath,
2004). Today, the majority of states have experienced some type of district reorganization.
Many have reorganized according to county lines. For example, in North Carolina, “As of the
year 2004, there is only one multi-county district in the entire state…” (Heath, 2004, p. 6). In
Virginia, however, 31 of the 47 SWCDs are classified as multi-county and/or city (Virginia
Association of Soil and Water Conservation Districts [VASWCD], 2007).
In order to accomplish the overall mission of SWCDs, local districts administer a variety
of programs within the communities they serve. Based on personal observation the majority of
Virginia SWCD programs are categorized as follows: Conservation Planning and Technical
Assistance, Administration of Cost-Share Programs, K-12 Environmental Education, Adult
Education, Erosion and Sediment Control, and “Other Programs” such as Equipment Rental
Programs, and Litter and Recycling Programs.
In order to offer the aforementioned programs, SWCDs must have sources of
administrative, technical, and financial assistance. “A district focuses attention on land, water,
and related resource problems; develops programs for solving the problems; and coordinates
18
assistance from public and private sources to carry out conservation programs” (Virginia DCR,
2007, Introduction). Districts may receive technical and financial assistance from local, state, and
federal sources. During the first 30 years of their existence, districts’ primary source of financial,
administrative, and technical support was the federal government via the SCS, but this is not the
case for many districts today (Heath, 2004). For various reasons, state and local governments
provide the bulk of district support. In Virginia, SWCDs target millions of dollars annually to
address agricultural water quality problems in various watersheds (Virginia DCR, n.d.). Virginia
SWCDs receive financial and technical assistance from local, state, and federal sources, with
most Virginia districts receiving the majority of their operational and program funds from the
state legislature (Virginia DCR, n.d.). Of course, there is variation among the states and
individual districts. Even so, the goal of the local, state, and federal relationship is the same for
all districts.
This cooperative process helps districts control soil erosion, prevent flood water and
sediment damages, and promote agricultural and urban conservation. Through
memorandums of agreement with other agencies, districts help to preserve wildlife,
protect the tax base, and enhance the health, safety and welfare of the people. In addition,
districts sponsor community events, such as field trips or demonstration projects, working
with citizens at a grassroots level to create awareness and understanding of conservation
needs and measures (Virginia DCR, 2007, Introduction).
Virginia SWCD Structure
Virginia SWCDs are entrusted with numerous responsibilities. Title 10 of the Code of
Virginia established a structure that ensures SWCDs operate in accordance with established laws
and regulations, while also fulfilling their overall mission, goals, and objectives. The 47 Virginia
19

SWCDs are the basis of this structure. In an effort to better administer SWCD regulations and
programs, Virginia has divided districts into six areas. All 47 SWCDs are members of one of six
individual “Areas.” Figure 2 outlines the six Virginia SWCD Areas as defined in the Directory of
Virginia’s Soil and Water Conservation Districts (Virginia DCR, 2007)
Area Virginia SWCD
Area I Headwaters, Lord Fairfax, Mountain, Mountain Castles, Natural Bridge, Shenandoah Valley
Area II Culpeper, John Marshall, Loudoun, Northern Virginia, Prince William, Thomas Jefferson
Area III Colonial, Hanover-Caroline, Henricopolis, James River, Monacan, Northern Neck, Tidewater, Three Rivers, Tri-County/City
Area IV Big Sandy, Big Walker, Clinch Valley, Daniel Boone, Evergreen, Holston River, Lonesome Pine, New River, Skyline, Scott County, Tazewell
Area V Blue Ridge, Halifax, Lake Country, Patrick, Peaks of Otter, Peter Francisco, Piedmont, Pittsylvania, Robert E. Lee, Southside
Area VI Appomattox River, Chowan Basin, Eastern Shore, Peanut, Virginia Dare Figure 2. Virginia Soil and Water Conservation District (SWCD) Areas
This structure also includes the Virginia Soil and Water Conservation Board, the local
SWCD Board of Directors, Virginia DCR, and the Virginia Association of Soil and Water
Conservation Districts (VASWCD) (Virginia DCR, 2007; Virginia DCR, n.d., Virginia Soil and
Water Conservation Board; the Virginia DCR, n.d., Virginia’s Soil and Water Conservation
Districts). These entities are described in greater detail in the ensuing paragraphs.
Virginia Soil and Water Conservation Board. The Soil and Water Conservation Board was
established by the Virginia General Assembly to assist with the delivery of soil and water
conservation services to citizens of the Commonwealth (Virginia DCR, n.d., Virginia Soil and
Water Conservation Board). The 12-member board includes representation from the six
20

designated SWCD Areas. Members are appointed or re-appointed every four years by the
Governor of Virginia. The Board promotes and provides support and guidance to the local
SWCDs.
SWCD Board of Directors. Individual Virginia SWCDs are governed directly by a local Board of
Directors. District boards are comprised of elected and appointed members as well as associate
members. Appointed members are chosen by the elected members. Official voting privileges are
limited to the elected and appointed directors. Elected and appointed directors serve four-year
terms, while associate directors serve one-year appointments, with no limit on the number of
terms that either may serve. The number of individuals serving on a SWCD Board of Directors
varies across the Commonwealth of Virginia and is based on whether the district is categorized
as single-county or multi-county. Directors are empowered by state law to fulfill many
responsibilities to ensure that the overall SWCD mission is accomplished within local
communities (Virginia DCR, 2007).
Virginia Department of Conservation and Recreation (DCR). The Virginia DCR has been
designated by the General Assembly to aid the Soil and Water Conservation Board and to
oversee the administration of both the operating funds and cost-share funds allocated annually to
individual SWCDs by the state. The later task is substantial, so DCR employs staffers known as
Conservation District Coordinators (CDCs) to serve as a direct link between the Commonwealth
and individual districts. “These coordinators interact daily with district directors and employees,
participate at district functions, assist with personnel management matters, oversee fiscal
management, and guide NPS programs and activities” (Virginia DCR, n.d., Virginia’s Soil and
Water Conservation Districts).
21

Virginia Association of Soil and Water Conservation Districts (VASWCD). In Virginia,
conservation districts have established their own private, non-profit association, which is
headquartered in Richmond, Virginia. According to the VASWCD Web site, “It coordinates
conservation efforts statewide to focus effectively on issues identified by local member districts”
(VASWCD, n.d., Welcome). VASWCD also has a 12-member Board of Directors, with
representation from the six SWCD Areas. In addition, they currently employ three staffers.
Individual SWCD Office Structure
As previously mentioned, all Virginia SWCDs are led by a Board of Directors. A chief
responsibility of the SWCD Board of Directors is to develop a support staff to fulfill the daily
obligations of the district. Personnel structure (job titles, position descriptions, and number of
employees) is not the same for all SWCDs, nevertheless there are similarities. According to
information provided in Lesson 3 of the course Topics in Leadership Management for
Conservation District Directors, there are five position titles that are typical. These are briefly
described in the following numbered list.
1. Administrative Secretary: When SWCDs were initially chartered, it was quite
common for the office to be composed of this one staff position. Of course, as
SWCDs grew, additional staffers were employed. This position has taken on many
titles including Executive Secretary, Administrative Assistant, Office Administrator,
and Administrative Specialist. Job duties typically include initial contact for clients
seeking SWCD services; preparation of written materials including correspondence,
agendas, minutes, plans, reports, newsletters, and news releases; general clerical
work; maintenance of files and program databases; and aiding directors with fiscal
management (preparation of financial reports, annual budget, etc.).
22
2. Conservation Specialist: Typically, this position requires a degree and/or experience
in agriculture, natural resources management, or environmental science. General
responsibilities include administration of the Virginia Agricultural Best Management
Practices (BMP) Cost-Share Program, overseeing the state’s interest of the
Conservation Reserve Enhancement Program (CREP) and certain BMP loan program
functions, preparation of farm conservation plans for landowners, supervising
installation of BMPs, and assistance with local watershed planning and other non-
point source (NPS) prevention activities. In some instances, this position also has
duties associated with the Virginia Erosion and Sediment Control Program for
localities the SWCD serves. This position is often categorized as technical.
3. Conservation Technician: This position is similar to that of a Conservation Specialist;
however, there may be fewer education and/or experience requirements to qualify for
this position, not as many job responsibilities, and compensation may be less.
4. District Manager: This is a managerial position. This staff member oversees the daily
operations of the office, mediates district problems, works with cooperating agencies
to gather information for planning efforts, assists with staff recruitment, and may
supervise other district employees. This position is often combined with another. For
example, Clinch Valley SWCD finances a position that combines the duties of a
Conservation Specialist and District Manager (Michael Altizer, Area IV
Representative for Soil and Water Conservation Board and Director with Clinch
Valley SWCD, personal communication, February 20, 2007).
23

5. Education Specialist: This position is responsible for youth and adult environmental
education programs. The staff member usually conducts school presentations on a
regular basis and coordinates special events for both youth and adults.
Theoretical Framework
As previously stated in Chapter 1, the theoretical framework for this study is based on the
Theory of Work Adjustment. A Psychological Theory of Work Adjustment (1990) declared that
the Theory of Work Adjustment was a product of research conducted through the Work
Adjustment Project at the University of Minnesota. It was initially released in 1964, a
collaboration between René V. Dawis, Lloyd H. Lofquist, and George W. England. Subsequent
revisions and additions followed in 1968, with input from David J. Weiss, and again in 1969.
There have also been journal articles published over the years that provided modifications and
updates to the theory.
The Theory of Work Adjustment centers on work. “If work is as highly valued in our
society as it appears to be, it is necessary and desirable to study the relationship of individuals to
work and the problems faced in adjusting to work” (Dawis & Lofquist, 1990, p. 3). The
partnership of Dawis, Lofquist, England, and Weiss, which will be referred to throughout this
document as the “Dawis group,” spent an extensive amount of time discovering the meaning of
work. The first task was to define the term. “Typical definitions include activity engaged in for
pay, to make a living or to earn money; activity that occupies much of the waking day
(occupations); activity that uses abilities or skills in some social or economic enterprise
(employment); activity that one is called upon to do (vocation); or activity that one contracts to
do (job) (Dawis & Lofquist, 1990, p. 3). In the pursuit of defining work, the Dawis group also
24
discovered there were other key factors associated with the meaning of work. One factor was to
examine what work has meant to society from a historical perspective.
Work, then, has had at least three basic meanings for preindustrial society: (1) a hard
necessity, painful, and burdensome; (2) instrumental, a means toward an end, especially a
religious end; and (3) a creative act, therefore intrinsically good. All three meanings have
probably been present in various proportions of historical periods, one or another aspect
receiving the greatest emphasis depending on time, the place, and the person who was
looking for the meaning of work (Dawis & Lofquist, 1990, p. 5).
Other factors include what work means to those who are unemployed and those who are
approaching retirement. The research group deduced that the “historical and research literature
shows that work is central to human development and total life adjustment and that work
provides a situation for satisfying needs” (Dawis & Lofquist, 1990, p. 7).
The Theory of Work Adjustment actually focused on the work personality and the work
environment. Dawis and Lofquist (1990) declared that work personality is composed of structure
and style. “The major dimensions of work personality structure are abilities and values, which
are reference dimensions for skills and needs, respectively. The basic dimensions of work
personality style are celerity, pace, rhythm, and endurance” (p. 33).
The theory of work adjustment is based on the concept of correspondence between
individual and environment, which implies conditions that can be described as a
harmonious relationship between individual and environment, suitability of the individual
to the environment and of the environment for the individual, consonance or agreement
between individual and environment, and a reciprocal and complementary relationship
between the individual and the environment. (Dawis & Lofquist, 1990, p. 55)
25

Several key terms were associated with the theory. These are defined accordingly.
1. Correspondence: “. . . described as the individual fulfilling the requirements of the
work environment and the work environment fulfilling the requirements of the
individual” (Dawis & Lofquist, 1990, p. 55).
2. Work Adjustment: “The continuous and dynamic process by which the individual
seeks to achieve and maintain correspondence with the work environment is called
work adjustment” (Dawis & Lofquist, 1990, p. 55).
3. Tenure: “. . . a function of correspondence between the individual and work
environment” (Dawis & Lofquist, 1990, p. 55).
Dawis and Lofquist further maintained,
From the basic concepts of correspondence and tenure we can develop the concepts of
satisfactoriness and satisfaction. If the individual has substantial tenure, it can be inferred
that the requirements of the work environment are being fulfilled and that the work
environment has been fulfilling the individual’s requirements. The individual who fulfills
the requirements of the work environment is termed a satisfactory worker. The individual
whose requirements are fulfilled by the work environment is termed a satisfied worker.
Satisfactoriness and satisfaction indicate the correspondence between the individual and
the work environment. (1990, p. 55)
The ensuing numbered list summarizes the Theory of Work Adjustment as stated by
Dawis and Lofquist (1990, p. 9).
1. Work is conceptualized as an interaction between an individual and a work
environment.
26

2. The work environment requires that certain tasks be performed, and the individual
brings skills to perform the tasks.
3. In exchange, the individual requires compensation for work performance and certain
preferred conditions, such as a safe and comfortable place to work.
4. The environment and the individual must continue to meet each other’s requirements
for the interaction to be maintained. The degree to which the requirements of both are
met may be called correspondence.
5. Work adjustment is the process of achieving and maintaining correspondence. Work
adjustment is indicated by the satisfaction of the individual with the work
environment and by the satisfaction of the work environment with the individual, by
the individual’s satisfactoriness.
6. Satisfaction and satisfactoriness result in tenure, the principal indicator of work
adjustment. Tenure can be predicted from the correspondence of an individual’s work
personality with the work environment.
Job Satisfaction
Job satisfaction is a major component of The Theory of Work Adjustment, thus it
warrants some discussion. Job satisfaction did not become an issue until the early 19th century
because prior to this time one’s career was often predetermined by the occupation of that
person’s parents (Dawis & Lofquist, 1990). Since that time a vast amount of research has been
conducted in regard to job satisfaction resulting in a number of theories and satisfaction
measurements.
Job satisfaction is usually measured by administering a questionnaire consisting of items
dealing with satisfaction with various aspects of the job. The purpose of such
27

questionnaires is to determine how satisfied employees are with regard to the various
aspects of the job (Ewen, 1967, p. 68).
Of course, the basis for all the theories and questionnaires is a definition of job
satisfaction. Even a brief literature review reveals an array of definitions. In Chapter 26 of the
Comprehensive Handbook of Psychological Assessment-Volume 4 Industrial and Organizational
Assessment, Dawis stated,
The English word satisfaction comes from the Latin satis (“enough”) and facere (“to
make”), hence the dictionary definitions: (1) to fulfill the needs, expectations, wishes or
desires of; (2) to meet or answer the requirements of. There are, then, two definitions of
satisfaction: satisfaction as fulfillment versus satisfaction as evaluation. In the first
definition, a deficit of some sort exists, and its being filled is satisfaction. In the second
definition, rather than deficits, criteria (requirements) must be met, and their being met is
satisfaction (2004, p. 470).
Job Satisfaction –Theories and Measurements
For the purposes of this study, the researcher devoted a considerable amount of time to
tracing the developments made in the study of job satisfaction. There were past studies and
associated theories that certainly made obvious contributions to job satisfaction research;
therefore, it was important to include these for this particular study as they each factor into the
theoretical framework.
The Hawthorne Effect – Mayo. The Hawthorne Studies brought heightened attention to
the subject of job satisfaction. Elton Mayo, a Harvard Business School professor, conducted a
series of experiments from 1927 to 1932 at the Western Electric Hawthorne Works in Chicago
(Accel-Team, n.d.a). Mayo wanted to determine what effect, if any, work conditions (such as
28

number of hours worked, number of breaks, temperature, light, and humidity) had on the
productivity of factory workers. According to a summary of Mayo’s experiments by Accel-
Team, “he stumbled upon a principle of human motivation that would help to revolutionize the
theory and practice of management” (Accel-Team, n.d.a, paragraph 4). The “principle” Mayo
discovered was that production did increase when changes were made in work conditions
(Hawthorne Effect), but these changes were actually a result of the satisfaction the employees
garnered from being a part of the experiment and the pride they experienced from their team
production efforts. The Hawthorne Studies established that individuals have various reasons for
working; they don’t work solely because of financial reasons. Hawthorne’s well-documented
study launched additional research in the fields of organizational management and industrial
psychology resulting in a number of theories related to job satisfaction.
Job Satisfaction Blank – Hoppock. Robert Hoppock (1935) concluded that job
satisfaction could only be measured and analyzed as a whole. Although Hoppock did not deny
there were many aspects of job satisfaction (“facets”), he surmised that because of individual
characteristics, only one level of job satisfaction could be determined for employees. Dawis
(2004) described Hoppock’s theory as “global” because of the approach he took, while later
researchers would follow a different approach and look at the specific facets of satisfaction.
Hoppock developed a job satisfaction measurement instrument known as the Job Satisfaction
Blank (JSB), which was directly based on his theory. Levine, Ash, and Levine (2004) described
the instrument as follows: “This is the earliest and probably the most used measure in job
satisfaction surveys because it is brief, easy to understand, and easy to administer” (p. 279). With
this instrument, only one level of satisfaction is obtained and the sources of satisfaction are not
determined (Hoppock, 1935; Dawis, 2004). When administering the JSB, Hoppock (1935) found
29

a correlation between scores related to gender, with males having higher means; occupational
level, with higher levels having a higher mean; and age, with older respondents having a higher
mean (Dawis, 2004).
Hierarchy of Needs Theory – Maslow. Abraham Maslow is often credited with the
general job satisfaction model as a result of his Hierarchy of Needs Theory. With this theory, he
concluded that individuals must satisfy five basic needs: physiological, safety, love, esteem, and
self-actualization (Maslow, 1943). As a result of Maslow’s research, organizations realized that
not only did they have to meet the lower-level needs of their employees, namely physiological
and safety needs, they also must seek to meet the higher-level needs, specifically self-esteem and
self-actualization. Numerous job satisfaction theories and models were developed as a result of
Maslow’s Hierarchy of Needs Theory.
Two Factor Hygiene and Motivation Theory – Herzberg. Frederick Herzberg is credited
with the Two Factor Hygiene and Motivation Theory. Herzberg based his research on Maslow’s
Hierarchy of Needs Theory and deduced that there was a difference between job satisfaction and
dissatisfaction (Dawis, 2004; Herzberg, Mausner, & Snyderman, 1959). In regard to Maslow’s
lower order needs, individuals meet these needs to “defer dissatisfaction” as opposed to “earn
satisfaction” (Dawis, 2004, p. 473). Actual satisfaction is only reached when the higher needs
identified by Maslow are met. An employee is satisfied when environmental and organizational
elements of hygiene are fulfilled and when the employee is motivated (Herzberg, Mausner,
Peterson, & Capwell, 1957). Elements of hygiene include working conditions, salary, personnel
policies, etc., while motivation is obtained when an individual has an interest in the job, is given
responsibility, is rewarded for a job well done and there is potential for advancement (Accel-
Team, n.d.b; Herzberg, et al., 1957; & Herzberg, et al., 1959). In addition, Herzberg, et al. (1957)
30

identified a relationship between employee morale and age, tenure, salary, and job level.
However, this research was somewhat refuted by Hulin and Smith (1965) who concluded that the
“U-shaped relationship between age, tenure, and satisfaction must be regarded with suspicion”
(p. 215). Hulin and Smith found more of a linear relationship between the variables; they also
concluded that gender did play a role in satisfaction.
Valence-Instrumentality-Expectancy (VIE) Theory – Vroom. Victor Vroom (1964)
developed the Valence-Instrumentality-Expectancy (VIE) Theory of work motivation in which
he surmised that employee job satisfaction was obtained when individual employees were
provided options from which to choose. The theory is based on three beliefs: Valence - defined
as the rewards that are valued by employees; Expectancy - defined as what employees think they
can accomplish based on individual characteristics; and Instrumentality - defined as whether or
not management will actually follow through on rewards (Vroom, 1964). Job satisfaction is the
valence of the job, which in turn is the function of the valence or other outcomes and the
instrumentality of the job in attaining those outcomes, with job satisfaction stemming from the
expectation of what was to come (Dawis, 2004). For example, if an employee knew that
increasing production would result in a pay increase or a promotion, then he/she would be more
apt to work to achieve the increased production goal. Vroom also concluded that performance is
not only based on intrinsic and extrinsic satisfaction or rewards but also on the characteristics of
an employee.
Job Descriptive Index (JDI) – Cornell Group. The Job Descriptive Index (JDI) was a
product of research at Cornell University in which five facets of job satisfaction were measured:
work, pay, supervision, co-workers, and promotion opportunities (Smith, Kendall, & Hulin,
1969). In terms of measuring facets of job satisfaction, this is considered to be “one of the most
31

widely used” and “the most preferred by researchers” because it asks respondents to describe
their jobs as opposed to directly asking about satisfaction or dissatisfaction levels (Dawis, 2004,
p. 464, 479). Dawis stated that indirectly asking about job satisfaction contributes to the validity
of the JDI.
Job Diagnostic Survey (JDS) – Hackman and Oldham. “Hackman and Oldham (1975)
created the Job Diagnostic Survey (JDS) to measure core characteristics of a job based on their
job characteristic theory” (Dawis, 2004, p. 461). Hackman and Oldham based their theory,
related research, and the JDS “on earlier work by Turner and Lawrence (1965) and by Hackman
and Lawler (1971),” which was a theory that job design contributes to work motivation (1975, p.
160). Positive personal and professional outcomes are attained when three “critical psychological
states” are present for employees; these include “experienced meaningfulness of work,
experienced responsibility for the outcomes of the work, and knowledge of the results of the
work activities” (Hackman & Oldham, 1975, p. 160). The “critical psychological states” are a
result of five “core” job dimensions defined as skill variety, task identity, task significance,
autonomy, and feedback (Hackman & Oldham, 1975). “The JDS is intended (a) to diagnose
existing jobs to determine if (and how) they might be redesigned to improve employee
motivation and productivity, and (b) to evaluate the effects of job changes on employees”
(Hackman & Oldham, 1975, p. 159).
Job in General (JIG) Scale – Ironson, Smith, Brannick, Gibson, and Paul. The Job in
General (JIG) Scale was developed as a “global scale to accompany the facet scales of the Job
Descriptive Index” (Ironson, Smith, Brannick, Gibson, & Paul, 1989, p. 193). Ironson, et al.
(1989) explained that the JIG included multiple items to garner internal consistency estimates,
questions and responses that were written and organized in a manner that made it easy for all
32

members of the working population to complete, few similarities with any measures of different
variables (i.e. should not ask respondent to describe job or share feelings about leaving the job),
show convergent validity, and compatible with the Job Descriptive Index (JDI) so that it could be
used in conjunction with the facet scale questionnaire.
Work Adjustment Theory – Minnesota Group. According to Weiss, Dawis, England, and
Lofquist (1967), “This theory uses the correspondence (or lack of it) between the work
personality and the work environment as the principal reason or explanation for observed work
adjustment outcomes (satisfactoriness, satisfaction, and tenure)” (p. v). The Minnesota
Satisfaction Questionnaire (MSQ) is based on the conceptual framework of the Theory of Work
Adjustment and a product of the Work Adjustment Project facilitated by the Minnesota
Vocational Rehabilitation Administration. It is described as “a measure of one of the primary
indicators of work adjustment” using several aspects of the work environment (Weiss et al.,
1967, p. v). There are two basic versions of the MSQ. The MSQ Long-Form (1967 and 1977)
measures satisfaction on a 21-scale form, while the MSQ Short-Form (1977) measures
satisfaction on a three-scale form. Dawis (2004) stated that the MSQ is also one of the most
popular job satisfaction measures still being utilized.
Job Satisfaction and Other Variables
Previous research acknowledges that a number of demographic and/or employee
characteristic variables are significantly related to the issues of job satisfaction, organizational
commitment, and tenure (Mobley, 1982). Herzberg et al., (1957) outlined four variables related
to job satisfaction: age, tenure, job level, and salary. However, salary is not considered to be an
essential indicator (Herzberg et al., 1957; Hoppock, 1935). According to Carter, Pounder,
Lawrence, and Wozniak, “The variables that are most often included in turnover research include
33

age, sex, and organizational tenure” (1989, p. 8). Certainly, there may be additional variables
depending on the nature of the organization (Carter et al., 1989).
Age. According to Lee and Wilbur (1985) and DeMato (2001), there are numerous
positions on the relationship between job satisfaction and age; they can be divided into
categories. The first position is initially based on the work of Herzberg et al., (1957) in which a
U-shaped relationship between job satisfaction and age was identified. In summary, the younger
a worker is, the higher his/her job satisfaction, but this satisfaction decreases after a few years on
the job, only to increase again with age. The second position is based on several studies (Bernal,
Snyder, & McDaniel, 1998; Hulin & Smith, 1965; Lee & Wilbur, 1985), all of which concluded
that job satisfaction increases as an employee ages. The third position maintains that although
there is a linear relationship between job satisfaction and age, there is a period in time, usually
pre-retirement, when satisfaction levels start to decline (Saleh & Otis, 1964). Finally, there are
studies that find no significant relationship between job satisfaction and age. Bedeian, Ferris, and
Kacmar (1992) declared that “chronological age” was not a “stable predictor of job satisfaction,”
rather tenure was a far superior indicator (p. 45).
In The New Workforce by Harriet Hankin (2004), generational differences and how they
relate to the work environment were examined extensively. Hankin stated,
There are varying views about whether understanding the generations is a useful tool for
understanding what motivates an individual. Both sides of the argument make relevant
points. On the one hand is the argument that factors other than birth year have a major
impact on who one is: upbringing, education, affluence or lack of it, and even geography,
just to name a few. I agree. On the other hand, members of a generation do share a
34

history that reflects the news, views, politics and entertainment that shaped their youth. I
think both influences are relevant.
For employers, however, generations are perhaps the most consistent indicator of work
needs. While a person can move, get an education, or change financial circumstances, a
birth date never changes. It is a useful and dependable benchmark for certain information
and is critical for longitudinal studies and trends. Companies and co-workers alike benefit
from an understanding of the characteristics of the generations. (p. 49)
The generations as defined by Hankin (2004) are summarized in the numbered list.
1. Silent Generation: Born 1922 to 1945. Come from traditional family settings. “They
tend to be highly disciplined, hardworking, and loyal employees who play by the
rules” (p. 50).
2. Baby Boomers: Born 1946 to 1964. Come from nuclear families. Large group of
individuals belong to this group. Value education. Considered to be workaholics.
“Boomers are active in social issues, civil rights, and politics. They are an optimistic,
competitive group that focuses deeply on personal accomplishment” (p. 52).
Considered to be big spenders and poor savers. Predicted to work beyond traditional
retirement age. This generation is sometimes divided into three segments since it
spans a period of 18 years.
3. Generation X: Born 1965 to 1976. Generation that experienced high rates of divorce
and increased number of mothers working outside the home. Hankin discovered,
“Generation X, more than any other generation I studied, is the one most that is
elusive because the differences among its members can be so extreme” (p. 55). Some
members take a traditional approach to their professional and personal lives, while
35

others are less concerned with life and have been labeled as “slackers.” Hankin
describes members of Generation X as having “…traits of independence, resilience,
and adaptability. They also desire immediate and on-going feedback and are equally
comfortable giving feedback to others. Other traits of this group included working
well in multicultural settings, desire for some fun in the workplace, and a pragmatic
approach for getting things done” (p. 56). Generations X also does not feel the same
loyalty to their employer as some of the other generations, but instead value their
work, colleagues, and immediate supervisors.
4. Baby Boom Echo: Born 1977 to 2000. Children of the Boomers. Traits include: self-
confidence, goal oriented, multitasking skills, team players, prefer group
socialization, high-tech, well-educated with work experience or internships. Hankin
discovered, “When asked about factors that affect their commitment and motivation
to work, 82 percent cited flexible working arrangements, a figure much higher than
that for the other generations” (p. 60).
5. Millennium Generation: Born after 2000. Hankin makes the following prediction
about the work traits of this generation, “…I see young people entering the work
place who will be comfortable with diversity, who will expect equal pay as an
everyday occurrence, and who will be flexible and interested in carving out their own
niche both at home and at work” (p. 60-61).
Gender. There have also been numerous studies conducted to determine if gender plays a
role in job satisfaction (Andrisani & Shapiro, 1978; Barclay, Fields, & Halpert, 1981; Harrell,
1958, Hulin & Smith, 1964; Sauser & York, 1978; Weaver, 1977). According to Barclay et al.,
“Past research has detailed conflicting results in the area of sex differences in job satisfaction.
36

The attempts to explain these differences have focused either on person-centered variables or
situation-centered variables” (1981, p. 3). In preparation for their own study, Barclay et al.,
determined that early studies, such as those of Harrell (1958), found females to be more satisfied
with their jobs when compared to males; however, later studies contradicted those previous
findings (Hulin & Smith, 1964). A 1977 study by Weaver found variables such as race, salary,
and status to influence employee job satisfaction, but he could not find any differences among
gender. This research was further supported by others. Andrisani and Shapiro (1978) determined
that race played a factor in job satisfaction. Sauser and York (1978) found that gender was not
the only variable that had an effect on job satisfaction with age, education, and tenure also
playing a role. The Barclay et al., (1981) study investigated not only whether there were
differences in job satisfaction based on gender, but which had more of an effect, person-centered
variables or situation-centered variables. The study’s situation-centered variable was defined as
“subtle treatment discrimination,” while the person-centered variable was “belief in roles for
women” (p. 4). The researchers found that the situation-centered variable was a greater factor in
the job satisfaction of the two genders and further concluded that examining job satisfaction
based on gender alone was insufficient.
Education. Vila and Garcia-Mora (2005) examined education as a determinant of job
satisfaction and through their review of the literature surmised that there are monetary and non-
monetary outcomes of education for the worker. They also found, “Indeed, a number of studies
do include a worker’s level of education as an explanatory variable for job satisfaction. The
evidence on the effects of education on job satisfaction, however, is rather limited” (p. 411). Vila
and Garcia-Mora (2005) summarized findings of studies conducted around the world. They
discovered that a United States based study by Idson (1990) found no significant effects of
37
education level on three out of four different measures of overall job satisfaction. In contrast, a
Canadian study by Meng (1990) revealed that education increases workers’ freedom to decide
how to do the work, their influence on the decisions of supervisors, and their content with the
physical environment of the job. Utilizing a sample of British workers, Clark (1996) stated that
individuals with more education, those of the male gender, middle-aged individuals, those
working long hours, and those working in larger establishments had lower levels of job
satisfaction. According to a study by Clark and Oswald (1996), overall job satisfaction is
declining in the level of education when income is held constant. Furthermore, the level of job
satisfaction depends inversely on worker’s comparison wage rates. “In brief, the existing
evidence on the effects of education level on job satisfaction is mixed and rather inconclusive:
some papers report neutral or negative influences, while the results from others imply positive
effects” (Vila & Garcia, 2005, p. 411).
Vila and Garcia-Mora (2005) conducted their own study, of Spanish workers, to assess
the influence of education on employee job satisfaction and drew the following conclusions:
1. “Workers’ perception of the match between education and employment is relevant as
a determinant of job satisfaction” (p. 420). Workers who feel their job corresponds to
their level of education are more satisfied than those who feel they are overqualified.
2. Education can have different effects on an individual’s satisfaction with different
facets of a job.
3. “Satisfaction with pay, job stability, the job itself, the number of hours worked, the
working schedule and the conditions of work are all directly and positively related to
workers’ level of education” (p. 421).
38

4. Overall job satisfaction is not significantly effected by education level. “. . . this
results from some cancelling out of the effects across the different specific
components of job satisfaction, which may help explain some counter-intuitive results
found in previous research” (p. 421).
Primary Job Responsibility/Position. Research has been conducted on whether or not
there is a relationship between the professional position one holds and the related responsibilities
of that job. The terms “job level” or “job scope” are typically used to describe professional
position. Mahoney, Frost, Grandall, and Weitzel (1972) declared there was a substantiated and
reliable positive relationship between job level and job satisfaction. A review of the literature by
Schmitt and Fitzgerald (1979) discovered,
Studies by Friedmann and Havighurst (1962) and Morse and Weiss (1962) suggest that
those working at the lower levels more often view work as a means to earn a living, while
higher level employees more often view it as pleasurable in itself and as a means of
fulfilling a variety of psychological needs. (p. 4)
Individual factors, such as achievement, autonomy of work, variety of tasks, and significance of
tasks, have been identified as having an impact on job scope (Schmitt & Fitzgerald, 1979; Stone
& Porter, 1973). As a result, these variables should be considered when assessing job level and
job satisfaction.
Employee Turnover
History. Labor turnover, like job satisfaction, was not an issue in the United States until
the early 19th century when it was no longer the norm to be self-employed in agricultural
production or a craft. According to Lauren Owen of Depaul University, “many observers began
to recognize that labor turnover was costly for the firm (in terms of increased hiring and training
39

expenditures) and for the worker (in terms of irregularity of income flows)” (2004, Paragraph 3).
As a result, a number of studies were conducted to determine “causes and consequences” of
labor turnover, with several concluding that high labor turnover rates were a result of worker
dissatisfaction and problems with labor relations (Owen, 2004). Mobley (1982) concluded that
the causes of turnover can be divided into four categories: external factors, organizational
factors, individual factors that were work related, and individual factors that were not work
related.
Current trends of employee tenure and turnover. A 2006 report released by the
Department of Labor, Bureau of Labor Statistics (BLS), found that the median number of years
that wage and salary workers had been with their current employer was four years. As for the
average number of jobs held by workers to date, there has only been one such survey, which was
administered by the Department of Labor, BLS. The study was exclusive to younger members of
the Baby Boom generation, specifically individuals born between 1957 and 1964. The August
2005 summary report stated that members of this population held an average of 10.5 jobs from
ages 18 to 40. The USDA-NRCS Human Capital Strategic Plan 2006-2010 determined the
average length of service for a “general schedule” NRCS employee was 16 years (2006).
Ironically, an analysis of Cooperative Extension positions, completed by the USDA-Agricultural
Research Service, Human Resources Division in December 2005, found the average years of
service for field staff nationwide also equated to 16 years.
Employee turnover is an escalating problem. The majority of U.S. corporations anticipate
an annual 6% voluntary turnover rate, while many high-tech companies expect to lose 30% of
their workforce each year (Norton, 1999). Ruth Ross, director of human policies for the Charles
Schwab Corporation, called turnover “a growing concern, something we’ve come to realize must
40

be taken seriously” (Dobbs, 2000, Paragraph 4). Even government agencies, like USDA–NRCS,
recognize voluntary turnover as a human resource management issue; this was documented in
their Human Capital Strategic Plan 2006-2010 (USDA-NRCS, 2006).
Implications of turnover. The implications associated with employee turnover can be both
positive and negative for the employee and the employer. Turnover is positive for the employer
when an unproductive and disruptive employee elects to resign and seek employment elsewhere.
In addition, it is also positive when an individual dissatisfied with the current job is able to quit
because another more satisfying job opportunity has presented itself. Of course, the negative
implications are numerous. According to a study by Richard Rubin (1995),
The detrimental effects of turnover include declines in productivity before the employee
departs, the costs of separation pay, and the expenses of recruiting, hiring, and training,
and increased supervision of the new employee. In addition, the productivity and morale
of other employees may be affected if the departing employee is considered to be a
valued member of the staff. (p. 85)
There may also be an interruption in the delivery of programs (Rousan & Henderson,
1996). Beale and Hollinsworth (2002) affirmed the aforementioned findings, maintaining that
turnover is associated with both financial costs and human costs to a company. Financial costs
can be sizeable. Dobbs declared,
The loss of experienced workers and the crippling effects associated with it are forcing
more companies to take action. They’ve learned the hard way that constantly hiring and
training new people is costly and time-consuming-an appalling drain on resources that
otherwise would have been used to expand or strengthen the business. (2000, ¶12)
41

Dobbs also stated that, according to experts, replacement costs are double the average
employee’s annual salary, while Norton (1999) reported that replacement costs equate to 25% of
an employee’s salary. Although there is some discrepancy over the actual financial costs, there is
no doubt the costs are sizeable.
Employee Retention
Long-term retention is a goal of all employers. Like turnover, retention has pros and cons
for both the employee and employer. “For workers, staying on the job leads to greater
opportunities for wage gains and promotions at work as well as increased overall stability in their
lives, while employers enjoy the benefits of reduced employee turnover and related expenses”
(Fisher, 2005, Introduction). Numerous retention strategies exist; regardless of the strategies an
employer chooses to incorporate, it is important that the strategies are implemented prior to even
hiring employees. Retention strategies should also be practiced the first day of employment. In
an effort to adequately address employee retention, USDA-NRCS has gone so far as to prepare
an official agency document that outlines retention strategies with specific objectives. Some of
these strategies include: exit interviews for employees who resign their positions, creative
incentives such as competitive benefits to retain personnel, and the development of a national
framework for mentoring (United States Department of Agriculture, NRCS, 2006). Another
popular approach to employee retention is when employers allow employees to change jobs
within the company. “Assisting employees to explore internal job switches rather than leaving an
organization is a positive measure aimed at enhancing employee retention and job satisfaction”
(Beale & Holinsworth, 2002, Abstract, ¶1).
42

Virginia SWCD and Related Agency Studies
The documented research directly related to SWCDs and the issues of job satisfaction,
turnover, and retention are limited. In regards to Virginia SWCDs, the researcher obtained and
reviewed a copy of a 2002 employee evaluation that was authorized by VASWCD. Eighty-nine
percent of Virginia SWCD employees responded to the statewide survey that was designed to
identify issues that might be effecting employee job satisfaction and perhaps contributing to
employee turnover (Bruce, 2002). The study concluded that employees were satisfied overall
with their employment. Areas of dissatisfaction included lack of career advancement
opportunities, low salaries, and relationships with district boards. Respondents identified
younger workers as the type of employee most likely to leave. The report stated, “Working for a
SWCD is seen by some as a stepping stone for younger workers who move on to organizations
(often private) that offer advancement and higher salaries” (Bruce, 2002, p. 4).
There have been research studies on related agencies, including Cooperative Extension
and public libraries. Extension work and soil and water conservation work share similar
characteristics. “Extension agents develop and adapt programs to assist local people in
identifying and solving problems” (Rousan & Henderson, 1996, p. 56). As described in the
previous literature review, Virginia SWCDs direct their conservation efforts at local
communities. An analysis of previous research in the Extension field is worthwhile. Rousan and
Henderson (1996) conducted a study that sought to determine why there was a high rate of
turnover among Ohio State University Extension agents; the reasons identified for agent turnover
included:
…other priorities in their lives, another job offer, insufficient pay for the amount of work
performed, family obligations, too many work responsibilities, attracted to more money
43

elsewhere, conflicts with personal responsibilities, no time for personal relationships, too
many requirements for advancement, conflict with values, and lack of recognition for a
job well done. (p. 60)
In another Cooperative Extension study, this one centered around Louisiana Cooperative
Extension Service agents, researchers stated that turnover can be affected by an employee’s
values in regard to work versus non-work activities, which is consistent with the Mobley model
(Carter et al., 1989). Carter et al. discovered that organizational commitment had greater
influence on employee turnover, but they also determined that it might be better to assess how
much individuals value organizational commitment and job satisfaction prior to evaluating which
one is a greater turnover predictor.
Richard Rubin (1995) took a different approach to studying turnover among public
librarians. Rather than focus solely on reasons why an employee would leave an agency, he also
explored reasons employees choose to remain employed. Rubin found that, at least annually, the
majority of librarians surveyed experience an event that makes them consider resigning and
seeking employment elsewhere. Once an employee decides to seek other employment it can be
difficult for the employer to reverse that decision. Rubin suggested that a reversal strategy might
be “making the job more interesting or challenging to the employee” (1995, p. 110). Of course,
this would require the employer to know what brings satisfaction to the employee. He also
concluded that “employees place considerable emphasis on job security, benefits, and family
responsibilities” (p. 110).
Summary
Soil and Water Conservation Districts were created in the mid-1930s as a means of
giving a local voice to the conservation of natural resources. Virginia has 47 SWCDs, each
44

entrusted with the responsibility of performing conservation work within designated boundaries.
Title 10 of the Code of Virginia defines SWCDs as political subdivisions of state government
and provides regulations and guidelines of operation. Virginia has divided districts into six areas
(Area I through Area VI). Individual districts are led by a Board of Directors who employs
support staff. Personnel structure is not identical among districts, but very similar.
With the spark of the environmental movement in the 1960s, the demand for
environmental workers increased. Today, SWCDs are competing with numerous organizations in
the public, private, and non-profit sector to recruit and maintain competent, professional
employees.
Since the 19th century numerous research studies have been conducted in regard to job
satisfaction. As a result, many theories and measurements of job satisfaction have been
established such as The Hawthorne Effect, Elton Mayo, 1927-1932; Job Satisfaction Blank,
Robert Hoppock, 1935; Hierarchy of Needs Theory, Abraham Maslow, 1943; Two Factor
Hygiene and Motivation Theory, Frederick Herzberg, 1957 and 1959; Valence-Instrumentality-
Expectancy (VIE) Theory, Victor Vroom, 1964; Job Descriptive Index (JDI), Cornell Group,
1969; Job Diagnostic Survey (JDS), Hackman and Oldham, 1975; Job in General (JIG) Scale,
Ironson, Smith, Brannick, Gibson, and Paul, 1989; and Work Adjustment Theory, Minnesota
Group, 1964.
The Theory of Work Adjustment is one of the most recognized and utilized theories of
job satisfaction, thus it serves as the theoretical framework for this study. This theory and its’
related questionnaire (Minnesota Satisfaction Questionnaire) was initially released in 1964 as a
collaboration between René V. Dawis, Lloyd H. Lofquist, and George W. England, with
subsequent revisions and additions following in 1968, with input from David J. Weiss, and again
45

in 1969 (Dawis & Lofquist, 1990). Authors of this theory recognized work to be a valuable part
of society, thus worthy of study. As part of their research various definitions of work were
defined and the history of work was examined. The Theory of Work Adjustment centered on the
work personality and the work environment; satisfaction of the individual with the work
environment and the individual’s satisfactoriness on the job result in correspondence (Dawis &
Lofquist, 1990). Tenure is a product of both satisfaction and satisfactoriness, thus an acute
awareness of employee satisfaction can have a positive impact on employee relations and the
overall well-being of the organization.
A number of variables and their relationship to job satisfaction have been researched.
Age and gender are two of the most common variables that are studied (Herzberg et al., 1957 and
Carter, et al., 1989). In regards to age, research findings vary. Herzberg et al., (1957) concluded
there was a U-shaped relationship between the two variables, while several studies determined
job satisfaction increases as an employee ages (Bernal, et al., 1998; Hulin & Smith, 1965; Lee &
Wilbur, 1985). Saleh and Otis (1964) established a linear relationship, but stated that in pre-
retirement satisfaction levels start to decline. There are even studies that found no significant
relationship between job satisfaction and age (Bedeian, et al., 1992). The research findings
associated with gender are also conflicting. Some studies concluded there was a relationship,
while others found no relationship to exist (Andrisani & Shapiro, 1978; Barclay, et al., 1981;
Harrell, 1958, Hulin & Smith, 1964; Sauser & York, 1978; and Weaver, 1977). More recent job
satisfaction research has addressed two additional variables – education level and position. The
research for education is also mixed (Vila and Garcia-Mora, 2005).
Employee turnover and retention have been linked to job satisfaction (Beale &
Holinsworth, 2002; Mobley, 1982; Owen, 2004; and Rubin, 1995). Both are issues of
46

importance, regardless of the organization. Therefore, job satisfaction is often an area of interest
and study for many organizations (Carter, et al., 1989; Rousan & Henderson, 1996; and Rubin,
1995). Although documented research directly related to SWCDs is limited, Virginia SWCD
employees were asked to complete an employee evaluation in 2002 for the primary purpose of
identifying issues that might be contributing to employee turnover. The 2002 study concluded
that although the majority of respondents were satisfied there were areas of dissatisfaction (lack
of career advancement opportunities, low salaries, and district board relationships).
47

Chapter 3
Methodology
This chapter includes a description of the procedures for collecting and analyzing data.
Through conducting the study, answers were sought to these five questions:
1. What were the characteristics of Virginia Soil and Water Conservation District
employees?
2. What was the overall job satisfaction level of Virginia Soil and Water Conservation
District employees as measured by the Minnesota Satisfaction Questionnaire (MSQ)
1977 Short-Form?
3. What degrees of intrinsic, extrinsic, and general job satisfaction were expressed by
Virginia Soil and Water Conservation District employees as measured by the Minnesota
Satisfaction Questionnaire (MSQ) 1977 Short-Form?
4. What degree of job satisfaction was expressed by Virginia Soil and Water Conservation
District employees as measured by a modified version of the Virginia Association of Soil
and Water Conservation District’s (VASWCD) 2002 survey?
5. Were there differences in job satisfaction levels as measured by the Minnesota
Satisfaction Questionnaire (MSQ) 1977 Short-Form and the Virginia Association of Soil
and Water Conservation District’s (VASWCD) 2002 survey based on the following
independent variables: age, gender, education level, and primary job responsibility?
A description of the study, study population, study variables, data collection instrument, data
collection methods, and methods of data analysis are included within this chapter.
48

Description of the Study
This study was both quantitative and descriptive. Hittleman and Simon (2006) defined
quantitative descriptive research as, “designs that deal with statistically explaining the status or
condition of one or more variables or events” (p. 309). The data collection instrument was
comprised of three sections. The first section was a pre-existing job satisfaction survey known as
the Minnesota Satisfaction Questionnaire (MSQ) Short-Form 1977. The MSQ Short-Form 1977
is copyrighted material and the researcher was not authorized to include a copy of the instrument
in this dissertation or any related documents. Those interested in viewing a sample of the
instrument and related directions are instructed to refer to the following Web site:
http://www.psych.umn.edu/psylabs/vpr/. The second section of this study’s data collection
instrument was a modified version of a 2002 evaluation survey originally authorized by the
VASWCDs and administered by Franklin “Lex” Bruce, Jr., Virginia Tech (Appendix E); and the
final section was an employee characteristics questionnaire (Appendix F). The entire instrument
was administered electronically to members of the target population via a secure Website.
Institutional Review Board Procedures
Policies regulated by the Virginia Tech Institutional Review Board (IRB) were adhered to
for the completion of this study. Although the target population was comprised of adults, cover
correspondence outlining that consent would be implied was sent to individual Virginia SWCD
employees via e-mail by the researcher. The aforementioned correspondence e-mail stated,
“Consent is implied with a returned questionnaire.” IRB approval is documented in Appendix G.
Population
A population is “a group of individuals or objects having at least one characteristic that
distinguishes them from other groups” (Hittleman & Simon, 2006, p. 101). In terms of this study,
49

the population consisted of individuals employed with a SWCD. There are 3000 SWCDs in the
United States, employing thousands of individuals. For the purposes of the study, a target
population was identified, which Hittleman and Simon (2006) defined as “the specific group
with which researchers would like to use their findings for educational purposes” (p. 101). The
target population was comprised of individuals employed with a SWCD located within the
Commonwealth of Virginia during Fiscal Year 2007-2008. There are 47 SWCDs in Virginia.
Names and related contact information for Virginia SWCD employees was obtained via an
employee directory maintained by the VASWCD. As of December 30, 2007, this directory listed
187 Virginia SWCD employees.
Key Attributes
Study participants were asked to report these personal and employment characteristics:
gender, age, ethnicity, race, marital status, children, education, Virginia SWCD Area, tenure,
employment status, position status, level of compensation, and primary job responsibility.
Instrumentation – Part I: Minnesota Satisfaction Questionnaire (MSQ) 1977 Short-Form
As previously mentioned in Chapter 2, the Minnesota Satisfaction Questionnaire (MSQ)
resulted from the Minnesota Studies in Vocational Rehabilitation, commonly referred to as the
Work Adjustment Project (Weiss, Dawis, England, & Lofquist, 1967). The MSQ was published
in 1967 and was later revised and updated in 1977. The researcher selected this instrument
because of its ability to identify Virginia SWCD employee job satisfaction.
The questionnaire (the MSQ) makes it feasible to obtain a more individualized picture of
worker satisfaction than was possible using gross or more general measures of
satisfaction with the job as a whole. The individualized measurement is useful because
50

two individuals may express the same amount of general satisfaction with their work but
for entirely different reasons (Weiss et al., 1967, p. vi).
There are two versions of the MSQ. The MSQ Long-Form (1967 and 1977) has 100
questions that assess job satisfaction on a 20-scale questionnaire. “Each item appears in blocks of
20, with items constituting a given scale appearing at 20-item intervals” (Weiss et al., 1967, p.
1). The MSQ 1977 Short-Form consists of 20 questions that best represent each of the 20 scales
featured on the MSQ 1977 Long-Form (University of Minnesota, Department of Psychology,
n.d.). Weiss et al. (1967) reported that the chosen items were those that correlated the highest
with their respective scales. Figure 3 lists and defines each scale title as it appears in the Manual
for the Satisfaction Questionnaire (Weiss et al., 1967, p.1).
The researcher elected to use the MSQ 1977 Short-Form. There are five response
alternatives for each question on the MSQ Short-Form: Very Dissatisfied, which has an assigned
value of (1), Dissatisfied (2), Neither (3), Satisfied (4), and Very Satisfied (5) (Weiss et al.,
1967). The MSQ 1977 Short-Form has previously been used in print; however, for the purposes
of this study the researcher obtained permission from the University of Minnesota Vocational
Psychology Research Department to administer the questionnaire in a Web-based format using a
secure site. Weiss et al. (1967) reported that the MSQ Long-Form takes the average person 15 to
20 minutes to complete. The MSQ Short-Form was designed to take less time and to be scored
on three scales: intrinsic satisfaction, extrinsic satisfaction, and general satisfaction. Appendix H
itemizes each question by scale.
51

Scale Title Categories of Satisfaction
Ability utilization Intrinsic and General
Achievement Intrinsic and General
Activity Intrinsic and General
Advancement Extrinsic and General
Authority Intrinsic and General
Company policies and practices Extrinsic and General
Compensation Extrinsic and General
Co-workers General
Creativity Intrinsic and General
Independence Intrinsic and General
Moral values Intrinsic and General
Recognition Extrinsic and General
Responsibility Intrinsic and General
Security Intrinsic and General
Social service Intrinsic and General
Social status Intrinsic and General
Supervision – human relations Extrinsic and General
Supervision – technical Extrinsic and General
Variety Intrinsic and General
Working conditions General
Figure 3. Minnesota Satisfaction Questionnaire (MSQ) Scales
52

Validity of MSQ 1977 Short-Form. Validity is “the idea of how the information and its
interpretation consistently, fairly, and accurately represents the ideas, feelings, behaviors, and
activities of the participants” (Hittleman & Simon, 2006, p. 137). In terms of instrument validity,
“validity refers to the extent to which an instrument measures what it is intended to measure”
(Hittleman & Simon, 2006, p. 123). There are three types of instrument validity. Hittleman &
Simon (2006) define construct validity as “the quality obtained when an instrument’s creator
demonstrates the instrument as representing a supportable theory” (p. 304). Weiss et al. (1967)
declared that construct validity of the MSQ was “derived mainly from its performing according
to theoretical expectations” (p. 16). Validation from the Minnesota Importance Questionnaire
(MIQ), which was based on the Theory of Work Adjustment, provided most of the supporting
evidence (Weiss et al., 1967). Concurrent validity is “the extent to which the results show that
subjects’ scores correlate, or are similar, on two instruments administered during the same time
period” (Hittleman & Simon, 2006, p. 303-304). “Evidence for the concurrent validity of the
MSQ is derived from the study of group differences in satisfaction, especially occupational
differences in satisfaction” (Weiss et al., 1967, p. 18). The analysis of data for 25 occupational
groups determined that “group differences (among the 25 occupational groups) were statistically
significant at the .001 level for both means and variances on all 21 MSQ scales,” indicating the
instrument can differentiate among the groups (Weiss et al., 1967, p. 18). The reference to “21
MSQ scales” includes the 20 scales, in addition to “general satisfaction.” The third type of
validity known as content validity is defined as “validity obtained when an instrument’s creator
demonstrates that the specific items or questions used in the instrument represent an accurate
sampling of specific bodies of knowledge (such as curricula or courses of study)” (Hittleman &
Simon, 2006, p. 304). In regards to the MSQ, factor analytic results supported the content
53

validity. Weiss et al. (1967) calculated intercorrelations for the 20 MSQ scales and the “general
satisfaction” utilizing 14 norm groups that included at least 100 individuals within each group;
both intrinsic (ability utilization, achievement, activity, authority, co-workers, creativity,
independence, moral values, recognition, responsibility, social status, and variety) and extrinsic
(advancement, compensation, company policies and practices, security, supervision–human
relations, supervision–technical, and working conditions) factors were derived.
The authors further concluded that since the MSQ Short-Form was a “subset of the long-
form items, validity may be inferred from validity for the long-form” (1967, p. 24). Evidence of
validity for the MSQ Short-Form is also achieved from two sources: “(1) studies of occupational
group differences and (2) studies of the relationship between satisfaction and satisfactoriness, as
specified by the Theory of Work Adjustment” (Weiss et al., 1967, p. 24).
Reliability of MSQ 1977 Short-Form. As maintained by Hittleman and Simon (2006),
“Instruments are said to have reliability when they are consistent in producing their results” (p.
127). Hoyt reliability coefficients were obtained for the MSQ Short-Form. For the Intrinsic
Satisfaction scale, the coefficients ranged from .84 (for the two assembler groups) to .91 for
engineers. For the Extrinsic Satisfaction scale, the coefficients varied from .77 (for electronics
assemblers) to .82 (for engineers and machinists). On the General Satisfaction scale, the
coefficients varied from .87 (for assemblers) to .92 (for engineers) (Weiss et al., 1967, p. 23-24).
The reliability coefficients for this particular study are reported as follows: for the Intrinsic
Satisfaction scale, the Cronbach’s Alpha was .85; for the Extrinsic Satisfaction scale, the
Cronbach’s Alpha was .85; and for the General Satisfaction scale, the Cronbach’s Alpha was .90.
Permission for MSQ 1977 Short-Form use. Permission to use the MSQ 1977 Short-Form
and convert this instrument into a Web-based format was requested from the University of
54

Minnesota, Department of Psychology and authorized in writing by Dr. David J. Weiss, Director
of Vocational Psychology Research on September 12, 2007 (Appendix I).
Instrumentation – Part II: Modified 2002 Virginia SWCD Employee Evaluation
The second part of the instrument consisted of a modified version of the Virginia SWCD
Employee Evaluation that was originally authorized by the VASWCD in 2002. The Association
contracted Franklin “Lex” Bruce, Jr., Assistant Professor and Evaluation Specialist to administer
the survey and analyze the data (Ricky Rash, personal communication, July 12, 2007). The
researcher elected to incorporate a modified version of this survey for two reasons. The 2002
evaluation was initiated “for the purpose of identifying characteristics and/or problems regarding
employee satisfaction and factors contributing to the loss of valuable district employees” (Bruce,
p. 3). It paralleled the purpose of this current study, which was to determine the level of job
satisfaction among Virginia SWCD employees employed during fiscal year 2007-2008. In
addition, the researcher wanted the data collected to be utilized by Virginia SWCDs to improve
district operations. It should be disclosed that the researcher initially planned to assess
satisfaction levels for 13 issues specific to Virginia SWCD employees; however, the issue of
“retirement benefits” was inadvertently omitted from the electronic version of the instrument.
Permission for modified 2002 Virginia SWCD employee evaluation use. Permission to
use a modified version of the 2002 SWCD Employee Evaluation and convert the questionnaire
into a Web-based format was requested from the Virginia Association of Soil and Water
Conservation Districts (VASWCD) and Franklin “Lex” Bruce, Jr., the Virginia Tech Evaluation
Specialist who initially administered the survey on behalf of the VASWCD. Mr. Rash,
VASWCD President, and Dr. Bruce both granted written permission (Appendix J and Appendix
K).
55

Validity and reliability of modified 2002 Virginia SWCD evaluation. The validity and
reliability of the modified 2002 Virginia SWCD evaluation were not specifically reported in the
final report. Nevertheless, there was information provided that supports the validity of this study.
The 2002 version of the evaluation was developed by a panel of experts, including members of
the VASWCD Board of Directors serving during the 2001-2002 fiscal year. Bruce confirmed the
following information about the evaluation: There were numerous drafts of the questionnaire; the
VASWCD Board of Directors selected the “constructs of interest” based on their knowledge of
district personnel issues and their experience as district leaders; and the VASWCD Board
consulted Bruce in regard to the design and layout of the evaluation (personal communication,
July 30, 2007). In terms of reliability, the Cronbach’s Alpha for this particular study was .81.
Instrumentation – Part III: Employee Characteristics
This part of the questionnaire was included to gather the following information about
individual Virginia SWCD employees: gender, age, ethnicity, race, marital status, children,
educational level, SWCD Area, tenure, employment status, position status, salary or wage
earnings, and primary job responsibility. The researcher collected this information to describe the
respondents and to determine if there were any differences in job satisfaction as a result of age,
gender, education level, and primary job responsibility.
Data Collection Assistance
The Center for Assessment, Evaluation, and Educational Programs (CAEEP), located on
the campus of Virginia Tech, assisted with the electronic distribution of the survey instrument
and data collection. In the months prior to the distribution of the survey, the researcher worked
with CAEEP representatives to design the three sections of the instrument into a Web-based
56

format that could be distributed to individual employees listed in the Virginia SWCD 2007
Employee Directory.
Field Test
Recognizing the importance of testing an instrument prior to administering the survey to
the target population, the researcher elected to field test the survey. Dillman (2007) described
this element of research as “pretesting,” which accomplishes several things including “an
evaluation of procedures which should be done by sending some questions to a small sample of
the respondent population and seeing whether any problems come up,” “finding out if production
mistakes were made in printing the questionnaire by having a few people fill it out,” and
“learning whether people understand the questions” (p. 140). Dillman proposed a four stage
process. Stage 1 is defined by Dillman as a “review by knowledgeable colleagues and analysts”
(2007, p. 140). The researcher completed this stage with assistance from representatives of the
Virginia Tech CAEEP and research professionals serving on the researcher’s dissertation
committee. Stage 2 includes “interviews to evaluate cognitive and motivational qualities” in
which an interviewer works individually with potential respondents to get an understanding of
how each question is being perceived by the respondent (Dillman, 2007, p. 141). In terms of this
study, Stage 2 was not included as part of the field test. Stage 3 consists of a “small pilot study,”
while Stage 4 is considered to be “a final check” (Dillman, 2007, pp. 146-147). The researcher
accomplished the goals of both the third and fourth stages with assistance from the Virginia
Department of Conservation and Recreation (DCR). The researcher chose to request that a
regional DCR office participate in the field test. The researcher did not want to select a sample
from the target population because this would mean that a small percentage had been pre-
exposed to the instrument, which could have an effect on their answers when completing the
57

survey for a second time. Based on guidance from Franklin “Lex” Bruce, Jr., (personal
communication, August 29, 2007) the researcher also chose DCR because agency staffers would
be the most familiar with Virginia SWCDs and the terminology associated with this
organization. In December 2007, the Web-based survey was administered to one Virginia DCR
Regional office, which consisted of eight staff members. Not only were the field test participants
asked to complete the survey electronically, just like members of the target population, they were
also requested to document typographical and/or grammatical errors, share items they found
confusing, and report any technological difficulties.
The regional manager assigned to the DCR regional office that agreed to field test the
instrument was notified both verbally and in writing of the purpose of the study and the field test.
In addition, the manager agreed to inform staffers of the study in two staff meetings held in
November 2007 and December 2007, which simulated the prior correspondence e-mail that
would be sent to the Virginia SWCD employees by Ricky Rash, VASWCD President. On
Monday, December 17, 2007, the researcher sent a cover correspondence e-mail with implied
consent to individual members of the field test group. This e-mail was almost identical to the
correspondence that the target population would receive. On Tuesday, December 18, 2007, the
initial correspondence e-mail with the Web-based survey link was sent to individual members of
the field test group by the CAEEP. Given the size of the field test group, upcoming state
holidays, and the researcher’s timeline, the submittal deadline for the field test group was
established as Friday, December 21, 2007.
Seven of eight DCR staffers completed and returned the survey by the established
deadline. The researcher was informed that the individual who failed to respond was out of the
office for the entire week due to illness. Field test respondents documented technological
58

problems as well as typographical, grammatical, and formatting errors. A summary of field test
comments is provided in Appendix L. Working with representatives from the CAEEP, the
researcher addressed problems and concerns documented by the field test respondents.
Respondents also documented the length of time required to complete the survey.
Completion times ranged from a minimum of 8 minutes to a maximum of 21 minutes, with an
average completion time of 15 minutes.
Data Collection Procedures
In an effort to garner support for this study and maximize participation, the researcher
contacted Ricky Rash, VASWCD President via telephone and e-mail to describe the study in
detail and address any questions or concerns the VASWCD might have in regard to the study.
The researcher requested permission to utilize contact information maintained within the
VASWCD’s employee directory as a means of distributing the associated survey to individual
employees. The researcher also requested that Rash contact employees via the “all-district” list-
serve shortly prior to the researcher’s distribution of the survey.
On August 23, 2007 Rash provided written authorization for the researcher to utilize
contact information that is maintained by the VASWCD for purposes of the “all-district”
employee list-serve and related employee directory (Refer to Appendix J, Paragraph 2). It was
understood that this information would be utilized as a means of distributing the associated
survey. Access to this employee directory information was provided shortly after Rash’s
approval letter via an e-mail from staff at the state office.
The researcher used the Tailored Design Method outlined by Dillman (2007) to collect
data. Two pre-notice letters were sent to the target population. On Thursday, January 3, 2008
Rash sent the aforementioned “prior” e-mail correspondence to all employees at which time he
59

expressed VASWCD’s support of the study, briefly explained the purpose of the study, and
encouraged participation (Refer to Appendix M). Five days later, on Monday, January 7, 2008,
the researcher sent an e-mail to all Virginia SWCD employees. The text of the e-mail modeled
that of an informational cover letter that would accompany a printed survey instrument
(Appendix N). The researcher informed subjects that consent was implied with a returned
questionnaire. The researcher also explained that data collection assistance was being provided
by the Virginia Tech CAEEP.
The initial e-mail was distributed via the CAEEP on Tuesday, January 8, 2008. This e-
mail included a detailed description of the survey, an authenticated login and password, and a
direct link to the Web-based survey instrument (Appendix O). Subjects were requested to
respond within 14 days (on or before Tuesday, January 22, 2008, 5 PM Eastern Standard Time).
A brief e-mail reminder was sent to all members of the target population on Tuesday,
January 15, 2008, seven days after the initial e-mail from the CAEEP (Appendix P). In
accordance with Dillman’s (2007) guidelines this reminder thanked those participants who had
responded and requested those who had not responded to complete the survey by the established
deadline.
On Tuesday, January 22, 2008, the morning of the survey response deadline, a personal
electronic final reminder was sent from the CAEEP to individuals who had not yet responded.
This notice contained a link to the Web-based survey, logins, passwords, and a request for a
response.
Incentives
In an effort to attain a high response rate, a few incentives were offered to participants.
First, the researcher pledged to prepare an executive summary of the results of the survey and
60

post that summary in a central location for all 47 Virginia districts to access and review. Second,
each participant who responded by the January 22, 2008 deadline was entered in a random
drawing for a prize of $100, which was administered by the CAEEP.
Response Rates and Non-Respondents
Given the high response rates generated from both the 2002 VASWCD employee survey
and the August 2007 survey, the researcher was confident that most Virginia SWCD employees
would participate in this study. Nevertheless, during the initial planning phases of the study, the
researcher determined it was important to achieve an acceptable response rate as well as plan for
non-respondents to ensure the results and conclusions drawn from the data collected were an
accurate reflection of the views of Virginia SWCD employees.
First, the researcher sought to define an acceptable response rate. The researcher
referenced several current studies that analyzed the response rates of existing professional
literature and discovered that there is not a standard definition for “response rate;” nor is there a
standard percentage, that if attained, one could say a study’s response rate was acceptable
(Groves, Dillman, Eltinge, & Little, 2002; Groves, 2005; Johnson & Owens, 2003; Wiseman,
2003). “During the last quarter century, there has been a general lack of industry-wide standards
with respect to the meaning, interpretation, and method of calculation of a survey’s response rate
(Wiseman, 2003, ¶3). Groves concurred that although both the Council of American Survey
Research Organizations (CASRO) and the American Association for Public Opinion Research
have provided recommendations for preferred estimates, there is still not “universal compliance
with the guidelines” (2005, p. 140). Groves further stated that, “response rates can be calculated
in a myriad of ways, each implying to the naïve reader different levels of success in measuring
the complete sample” (2005, p. 140). Taking into consideration the flexibility associated with
61

response rates, researchers have concluded that in terms of response rates not only should the
response rate be reported as a numerical value, but a detailed explanation of the calculation
utilized to determine the response rate should be provided (Groves, Dillman, Eltinge, & Little,
2002; Groves, 2005; Johnson & Owens, 2003; Lindner & Wingenbach, 2002; Wiseman, 2003).
In the most basic terms, a survey response rate is the number of completed and usable
surveys obtained in a research project divided by the number of individuals who were asked to
complete the survey (Groves, Dillman, Eltinge, & Little, 2002; Groves, 2005; Johnson & Owens,
2003; Wiseman, 2003). For this particular study, the researcher elected to use this definition to
calculate the response rate for this study.
In regards to an acceptable rate, the researcher referenced a study by Johnson and Owens
(2003), in which an audit of 95 articles from 18 different journals was conducted to examine
response rate procedures. Johnson and Owens determined, “Although none of the journals
contacted for this study reported formal policies regarding minimally acceptable response rates,
one did indicate that only in ‘rare’ instances did a study with a response rate of less than 60% get
accepted for publication” (2003, p. 132).
The researcher gave thoughtful consideration to the issue of how to address non-
respondents, thus a plan for a response rate less than 60% was devised. Deciding the most
appropriate method of contact was challenging. The researcher chose not to contact non-
respondents via a personal telephone call for several reasons. First, as previously stated, the
researcher was a Virginia SWCD employee who felt that making personal contact with
individual subjects could impact their survey responses. Second, a condition of the study was
that the researcher would not be privy to a list of those who had or had not responded, nor to
individual employee responses. If the researcher personally telephoned individuals who had not
62

responded and collected data over the phone, the study’s condition to maintain anonymity would
be violated. The researcher decided that should the response rate be less than 60%, a personal
letter, prepared by the researcher, would be distributed via e-mail by the CAEEP to all the
individuals who had not responded by the pre-established deadline. This correspondence can be
referenced in Appendix Q and was fashioned to stress the importance of achieving a high
response rate and the purpose of the study. Furthermore, a 48-hour response time was
established. If the 60% response rate was still not achieved, the researcher elected to continue
with data analysis and reporting with the actual response rate clearly documented in all related
documents.
Data Analysis
The student version of the Statistical Program for the Social Sciences (SPSS) Version
14.0 for Windows was used to analyze the data collected from the returned surveys. Distribution
frequencies, measures of central tendency, measures of variance, the One-way Analysis of
Variance (ANOVA), and Tukey’s post-hoc test were utilized. The analysis for each of the five
research questions has been outlined below.
Research Question 1 - - Characteristics of Virginia SWCD employees. The primary
purpose of collecting this information was to adequately describe individuals presently employed
by Virginia’s SWCDs; therefore, the researcher utilized descriptive statistics (frequencies of
distribution, measures of central tendency, and measures of variation) to analyze the data
collected, with the specific selection unique to the question. In some instances frequencies of
distribution and related percentages were reported, and in other cases the mean, median, mode,
standard deviation, and/or range was reported.
63

Research Question 2 and Question 3 - - Virginia SWCD employees’ general, intrinsic,
and extrinsic job satisfaction as measured by Minnesota Satisfaction Questionnaire (MSQ) 1977
Short-Form. The Manual for the Minnesota Satisfaction Questionnaire (1967) provided
recommendations on how to interpret MSQ scores collected from participants, which the
researcher gave strong consideration.
The most meaningful scores to use in interpreting the MSQ are the percentile scores for
each scale obtained from the most appropriate norm group for the individual. The
appropriate norm group for an individual is the one that corresponds exactly to his job.
Since, at the present time, the number of norm groups is limited, it may be necessary to
select a norm group that is very similar to the individual’s job.
It is also possible to interpret MSQ raw scores for all scales by ranking them.
These rankings indicate areas of relatively greater, or lesser, satisfaction. (Weiss, Dawis,
England, & Lofquist, pp. 4-5)
After reviewing the available norm groups, the researcher did not feel one norm group could be
selected, considering the nature of the work performed by SWCD employees and the diversity
among individual districts and their staff positions. The researcher also wanted to interpret the
data in a manner that would be clearly understood by the parties the study was designed to assist
(i. e. SWCD employees and VASWCD Board of Directors). Furthermore, the researcher thought
it was wise to interpret the MSQ data in much the same manner as the interpretation of the
modified 2002 VASWCD survey. Therefore, the researcher elected to use descriptive statistics,
including frequencies of distribution, measures of central tendency, and measures of variation.
The frequencies of the responses for all 20 scale titles were reported as well as the mean and
standard deviation. To ascertain a general satisfaction score as well as overall intrinsic and
64

extrinsic satisfaction scores, the individual mean scores for each question were summed by
category and then divided by the number of questions within that group.
Research Question 4 - - Virginia SWCD employee job satisfaction as measured by
modified 2002 VASWCD Survey. Descriptive statistics including frequencies of distribution,
measures of central tendency, and measures of variance were utilized. In the 2002 survey, the
mean, standard deviation, and frequency distributions were reported for each individual item.
The researcher elected to report the 2007-2008 data in a similar fashion.
Research Question 5 - - Virginia SWCD employee differences in intrinsic, extrinsic, and
general job satisfaction levels as measured by MSQ 1977 Short-Form based on age, gender,
education level, and primary job responsibility. A one-way analysis of variance (ANOVA) was
selected as an appropriate statistical test to determine differences between group means. Prior to
utilizing ANOVA, a homogeneity of variance test must always be performed; if the p-value is
less than .05, the ANOVA test is not allowed (Howell, 2007). The researcher performed a
homogeneity test each time an ANOVA test was considered. For instances when the ANOVA
did not violate the homogeneity test an alpha level of .05 was established and p-values were
calculated to determine significance. If the p-value was less than “alpha,” then the researcher
concluded there were differences between the variables being analyzed (Coolidge, 2004; Howell,
2007). According to Coolidge (2004),
The purpose of ANOVA was to determine whether significant differences existed among
two or more groups’ means without inflating the Type I Error. One limitation of ANOVA
is that, if the null hypothesis is rejected, ANOVA is an omnibus test with a vague
alternative hypothesis. ANOVA does not tell us what the exact pattern of mean
differences is. Multiple comparison tests, also called a posterior tests or post hoc tests,
65

were designed to be used after a significant ANOVA where the null has been rejected.
Multiple comparison tests help to determine the pattern of significant differences among
the means….(p. 189)
Tukey’s post-hoc test was selected as the multiple comparison test for this particular study.
Summary
This was a quantitative, descriptive study. The target population was initially comprised
of 187 individuals employed with a Virginia SWCD during fiscal year 2007-2008. An employee
directory maintained by the VASWCD provided employee names and contact information.
IRB approval was granted on November 29, 2007. Consent was implied by completing
and returning the survey instrument.
The researcher utilized an instrument that was based on a combination of questionnaires
to assess employee job satisfaction and identify characteristics of employees. Part I of the
instrument consisted of an existing questionnaire known as the Minnesota Satisfaction
Questionnaire (MSQ) 1977 Short-Form in order to assess overall job satisfaction as well as the
intrinsic, extrinsic, and general job satisfaction of district employees. Permission to use this
instrument and administer it in a Web-based format using a secure site was obtained from the
University of Minnesota Vocational Psychology Research Department. The MSQ Short-Form
consists of 20 questions with five response alternatives: Very Dissatisfied, Dissatisfied, Neither,
Satisfied, Very Satisfied (Weiss et al., 1967). Validity and reliability are proven for this existing
instrument. Part II consisted of a modified survey instrument that was initially authorized in
2002 by the VASWCD to evaluate job satisfaction. Permission to use this instrument was
granted from the administrator of the original survey, Franklin “Lex” Bruce, Jr., and Ricky Rash,
VASWCD President. The researcher chose to incorporate sections from the 2002 survey because
66

they paralleled the current study. Validity was obtained for the initial study via a panel of
experts. A reliability coefficient for this particular study was reported. The final part of this
study’s instrument was used to determine the characteristics of the current work force. The
following information was gathered: gender, age, ethnicity, race, marital status, children,
education level, SWCD Area, tenure, employment status, position status, salary or wage
earnings, and primary job responsibility.
Since the survey was administered electronically, data collection assistance was provided
by the CAEEP. The instrument was also field tested in accordance with guidance provided by
Dillman (2007). A regional Virginia DCR office served as the field test group. The field test was
conducted in December 2007. As a result of the field test, typographical, grammatical,
formatting, and technological errors were identified and corrected prior to initiating the actual
survey.
The Tailored Design Method (Dillman, 2007) was used to collect data. On January 3,
2008 and January 7, 2008, pre-notice letters were sent to the target population. The CAEEP sent
the initial e-mail on January 8, 2008, which included a detailed description of the research,
authenticated login and password, and a direct link to the Web-based survey. Subjects were
given 14 days to respond. E-mail reminders were sent on January 15, 2008 and January 22, 2008.
As incentives, the researcher agreed to prepare an executive summary of the survey
results, making it accessible to the Virginia SWCD employees and a prize of $100 to a randomly
selected respondent. The researcher also established a plan for response rates and non-
respondents. A response rate less than 60% would not be sufficient and would require the
researcher to contact non-respondents (individuals failing to respond by January 22, 2008; 5 PM
EST) via a personal e-mail from the researcher.
67

Data were analyzed with the student version of SPSS Version 14.0 for Windows.
Descriptive statistics, including frequencies of distribution, measures of central tendency, and
measures of variance were utilized, in addition to the One-way ANOVA and Tukey’s post-hoc
statistical tests.
68

Chapter 4
Findings of the Study
The purpose of this study was to determine the level of job satisfaction among Virginia
Soil and Water Conservation District (SWCD) personnel who were employed during fiscal year
2007-2008. Five research questions were addressed:
1. What were the characteristics of Virginia Soil and Water Conservation District
employees?
2. What was the general (overall) job satisfaction level of Virginia Soil and Water
Conservation District employees as measured by the Minnesota Satisfaction
Questionnaire (MSQ) 1977 Short-Form?
3. What degrees of intrinsic and extrinsic job satisfaction were expressed by Virginia
Soil and Water Conservation District employees as measured by the Minnesota
Satisfaction Questionnaire (MSQ) 1977 Short-Form?
4. What degree of job satisfaction was expressed by Virginia Soil and Water
Conservation District employees as measured by a modified version of the Virginia
Association of Soil and Water Conservation District’s (VASWCD) 2002 survey?
5. Were there differences in intrinsic, extrinsic, and general job satisfaction levels as
measured by the Minnesota Satisfaction Questionnaire (MSQ) 1977 Short-Form
based on the following independent variables: age, gender, education level, and
primary job responsibility?
This chapter examines the research findings. The survey response rate as well as data and
analyses related to the five research questions are described. Analyses and related tables were
69

generated using the student version of the Statistical Program for the Social Sciences (SPSS)
Version 14.0 for Windows.
Survey Response
The survey instrument was sent electronically to all Virginia SWCD employees listed, as
of December 30, 2007, in the e-mail directory maintained by the VASWCD (N=187). Of the
surveys that were distributed on Tuesday, January 8, 2008, one was returned with an error
message stating that the e-mail address was invalid and, therefore, could not be forwarded to the
selected recipient. Also the researcher was listed as a member of the population, but was not
included as a participant. This resulted in an accessible population of 185. A total of 148 Virginia
SWCD employees responded to the survey, equating to an overall response rate of 80%.
Employee Characteristics – Research Question 1
The first research question sought to determine the characteristics of Virginia SWCD
employees. Part III of the survey instrument addressed this question. For the purposes of this
document, employee characteristics are discussed individually.
Gender. A total of 90 (63%) females and 54 (38%) males responded to the survey. Four
respondents failed to complete this survey item.
Age. Respondents were asked to report their birth year, which the researcher used to
determine the age of individual respondents as of January 2008. The mean age for respondents
was 41.47 years of age, with a median of 40.50, and a mode of 25. Ages ranged from a minimum
of 23 years of age to a maximum of 69 years of age. Table 3 summarizes the range of ages
represented. Ten respondents failed to provide their birth year.
70

Table 3
Virginia SWCD Employees’ Age Distribution (n=138)
Age Frequency Percent
23-29 33 24
30-39 35 25
40-49 26 19
50-59 29 21
60-69 15 11
Total 138 100
Ethnicity. Two respondents identified themselves as Hispanic (1%), while 139
respondents were non-Hispanic (99%). Seven respondents failed to complete this item.
Race. A total of 135 (97%) respondents identified as “White.” Of the remaining
respondents, one respondent identified as “American Indian or Alaska Native,” one identified as
“American Indian or Alaska Native” and “White,” one identified as “Asian” and “White,” and
one identified as “Black or African American.” Nine respondents failed to complete this item.
Marital status. Ninety-nine respondents reported being married (70%), while 31 (22%)
were single, nine (6%) were divorced, two (1%) were widowed, and one (1%) was separated. Six
respondents failed to complete this item.
Children 18 and under and living in the home. A total of 91 (65%) respondents had no
children 18 and under and living in the home. Nineteen respondents (14%) had one child, 24
(17%) had two children, four (3%) had three children, and one (1%) had four children. Nine
participants failed to respond.
71

Highest educational degree. Respondents were asked to report the highest educational
degree they had received at the time the survey was distributed. Table 4 summarizes the data
collected. Seventy (50%) of the respondents held a bachelor’s degree. Seven respondents failed
to complete this item.
Table 4
Virginia SWCD Employees’ Highest Educational Degree (n=141)
Educational degree Frequency Percent
High school diploma or GED 29 21
Associate’s degree 22 15
Bachelor’s degree 70 50
Master’s degree 19 13
Doctoral degree 1 1
Total 141 100
Virginia SWCD Area. Table 5 illustrates the number of employees from each Virginia
SWCD Area who responded to the job satisfaction survey. A total of 139 employees chose to
identify their SWCD Area, while nine respondents failed to complete this item. The response rate
for each of the six Areas was over 60%. Area III and Area V had the highest response rates
(81%), while Area I had the lowest response rate (62%).
72

Table 5
Virginia SWCD Employees’ Response by Area (n=139)
Virginia SWCD Area Number of employees
receiving survey
Total employees
responding
Percent response rate
I 26 16 62
II 44 35 80
III 37 30 81
IV 31 23 74
V 31 25 81
VI 16 10 63
Tenure. Table 6 highlights employee tenure. The number of years employees had worked
for a Virginia SWCD ranged from three months to 34 years. The mean was 6.52 years of service,
with a standard deviation of 7.07. The median was 4.00 years of service and the mode was 1.00
year of service. Nine respondents failed to complete this survey item.
73

Table 6
Virginia SWCD Employees’ Tenure (n=139)
Tenure in years Frequency Percent
0-5 85 61
6-10 26 19
11-15 9 7
16-20 10 7
21-25 6 4
26-30 2 1
31-35 1 1
Total 139 100
Employment status. A total of 120 (85%) respondents had full-time employment status,
averaging at least 40 hours per week. Twenty-two respondents (16%) were part-time employees.
Six individuals failed to respond.
Position status. A total of 115 (81%) respondents were in a permanent position, meaning
the position was expected to continue indefinitely. Twenty-seven (19%) respondents held
temporary positions, meaning a termination date exists or will be established. Six individuals did
not complete this item.
Level of compensation. Virginia SWCD employees may be paid with an hourly wage or
an annual salary; therefore, respondents were asked to report their compensation as one or the
other. Twenty-four respondents (18%) reported earning an hourly wage. Wages ranged from
$9.00 per hour to $20.00 per hour, with a mean of $14.45 per hour. A total of 110 respondents
74

(82%) reported earning an annual salary. Annual salaries ranged from $21,888.00 to $85,993.00,
with a mean of $36,373.54 per year. Fourteen respondents chose not to provide this information.
Primary job responsibility. Although the researcher recognized that Virginia SWCD
employees perform various job duties, respondents were asked to categorize their primary job
responsibility. Table 7 summarizes the data collected. A total of 72 (51%) respondents were
employed in the technical category. Seven respondents failed to complete this item.
Table 7
Virginia SWCD Employees’ Primary Job Responsibility (n=141)
Primary job responsibility by category Frequency Percent
Administrative assistance or secretarial 23 16
Administrative or managerial 27 19
Educational 19 14
Technical 72 51
Total 141 100
MSQ Short-Form – Research Question 2 and 3
The second and third research questions sought to determine job satisfaction levels of
Virginia SWCD employees utilizing the MSQ Short-Form. Part I of the instrument consisted of
20 questions featured on the MSQ Short-Form. Refer to Appendix R for respondents’ frequency
distributions according to the 20 job scales. Due to copyright laws of this instrument, findings
are reported by the scale title, as opposed to individual question. Two respondents failed to
complete Part I, Questions 1, 4, 12, and 13 of the survey. Three respondents failed to complete
Part I, Question 16.
75

Mean scores were utilized to assess the respondents’ job satisfaction levels. The higher
the mean score the more satisfied the respondent. Mean scores were interpreted as follows: score
in the range of 2.50 to 3.49 was interpreted as “neutral,” meaning respondents could not decide
whether or not they were satisfied with a particular job aspect; a mean score in the range of 3.50
to 4.49 was interpreted as “satisfied,” and a score of 4.50 to 5.00 was interpreted as “very
satisfied.”
General Job Satisfaction. All 20 survey items assessed general job satisfaction. The
intrinsic and extrinsic mean scores are reported in Table 8 and Table 9, respectively. Two survey
items are specific to the general satisfaction score; neither is characterized as intrinsic or
extrinsic. The mean score for the respondents’ (n = 148) satisfaction with their working
conditions was 4.01, with a standard deviation of .92. The mean score for the respondents’ (n =
148) satisfaction with co-workers was 3.95, with a standard deviation of 1.09. To generate a
general job satisfaction score, the mean scores for all 20 survey items were utilized. The range of
mean scores was 2.87 to 4.48. The general job satisfaction score was 3.92.
Intrinsic Satisfaction. Twelve of the 20 items featured on this instrument assessed
intrinsic satisfaction. Respondents were satisfied with 11 out of the 12 intrinsic items, with mean
scores ranging from a 3.41 to 4.48. They were most satisfied with the job item referred to as
variety, followed by social services. Authority was one intrinsic item in which respondents were
“neutral” about their level of satisfaction. The mean for all intrinsic satisfaction items was 4.15,
thus SWCD respondents, overall, were intrinsically satisfied.
Extrinsic Satisfaction. Six of the 20 instrument items assessed extrinsic satisfaction.
Mean scores ranged from 2.87 to 3.84. Respondents were satisfied with three of the extrinsic
items. They were most satisfied with supervision-technical, followed by supervision-human
76

relations, and recognition on the job. Respondents were undecided on their level of satisfaction
for the three remaining extrinsic items. The lowest mean score of 2.87 was attributed to
advancement. The mean for all extrinsic satisfaction items was 3.48, thus SWCD respondents,
overall, were neutral in terms of extrinsic satisfaction.
77

Table 8
Minnesota Satisfaction Questionnaire Short-Form - Virginia SWCD Employee Intrinsic Scores
(n = 148)
Aspect of job as reported by scale title - intrinsic Mean Standard deviation
Variety 4.48 .70
Social services 4.45 .67
Moral values 4.39 .70
Independence 4.34 .70
Activity 4.24 .88
Ability utilization 4.24 .81
Security 4.09 .96
Achievement 4.09 .83
Creativity
4.08 .75
Responsibility 4.06 .81
Social status 3.90 .78
Authority 3.41 .70
Grand mean 4.15
Note. Means established using a scale in which 1 = very dissatisfied, 2 = dissatisfied, 3 = neutral, 4 =
satisfied, and 5 = very satisfied. Means are reported in descending order. A few respondents did not reply
to all items.
78

Table 9
Minnesota Satisfaction Questionnaire Short-Form - Virginia SWCD Employee Extrinsic Scores
(n = 148)
Aspect of job as reported by scale title - extrinsic Mean Standard deviation
Supervision - technical 3.84 1.05
Supervision - human relations 3.76 1.15
Recognition 3.73 .89
Company policies and practices 3.45 1.09
Compensation 3.20 1.10
Advancement 2.87 1.08
Grand mean 3.48
Note. Means established using a scale in which 1 = very dissatisfied, 2 = dissatisfied, 3 = neutral, 4 =
satisfied, and 5 = very satisfied. Means are reported in descending order. A few respondents did not reply
to all items.
Modified Version of 2002 VASWCD Employee Evaluation – Research Question 4
The fourth research question sought to determine job satisfaction levels of Virginia
SWCD employees utilizing a modified version of the 2002 VASWCD Employee Evaluation.
Twelve individual job satisfaction issues were addressed in the first question of this survey,
overall job satisfaction was assessed in the second question, and the third question provided
respondents an opportunity to make comments. Refer to Appendix S for respondents’ frequency
distributions for the 12 job satisfaction issues and to Appendix T for respondents’ frequency
distributions for overall job satisfaction. For the purposes of this document, results are
79

summarized in Table 10 and Table 11. Two respondents failed to complete Part II, Question 1
and three respondents failed to complete Part II, Question 2.
The scale for Tables 10 and 11 of the instrument differed from the MSQ Short-Form
scale. Therefore, mean scores were interpreted as follows: A score in the range of 1.50 to 2.49
was interpreted as “dissatisfied,” a score in the range of 2.50 to 3.49 was interpreted as
“satisfied,” and a score in the range of 3.50 to 4.49 was interpreted as “very satisfied.”
Table 10
Virginia SWCD Employees’ Satisfaction Scores by Issue (n=146)
Job satisfaction issue Mean Standard deviation
Flexibility with professional scheduling
3.63 .99
Type of work performed 3.54 .74
Relationship with district board 3.51 .95
Work relationships 3.49 1.01
Professional development 3.29 .79
Management and supervision 3.19 1.04
Clearly defined job responsibilities and work goals
3.08 .84
Health insurance benefit 2.77 1.65
New employee orientation 2.76 1.09
Salary or wage 2.68 .88
Life insurance benefit 2.36 1.61
Career advancement opportunities 2.18 1.10
Note. Means established using a scale in which 0 = not applicable, 1 = very dissatisfied, 2 = dissatisfied, 3
= satisfied, 4 = very satisfied, and 5 = extremely satisfied. Means are reported in descending order.
80

Table 11
Virginia SWCD Employees’ Overall Job Satisfaction (n=145)
Mean Standard Deviation
Overall Job Satisfaction 3.43 .77
Note: Means established with a scale where 0 = No Applicable, 1 = Very Dissatisfied, 2 = Dissatisfied, 3
= Satisfied, 4 = Very Satisfied, and 5 = Extremely Satisfied. Means are reported in descending order.
The mean score was utilized to assess job satisfaction levels. Mean scores ranged from
2.18 to 3.63. Respondents were “very satisfied” with their flexibility with professional
scheduling, type of work performed, and their relationship with district boards. Respondents
were “satisfied” with seven of the 12 items. Further analysis of the means show respondents
were most satisfied with work relationships, professional development, management and
supervision, and clearly defined job responsibilities and work goals. They were least satisfied
with health insurance benefits, new employee orientation, and salaries or wages. Respondents
expressed “dissatisfaction” with two items: life insurance benefits and career advancement
opportunities. They were most dissatisfied with opportunities available to advance in their career.
Part II, Question 2 assessed overall job satisfaction. A total of 65 (45%, Mean = 3.43, SD
= .77) respondents were “satisfied” with their Virginia SWCD employment.
The final question in Part II afforded employees the opportunity to provide comments or
suggestions on any other items they deemed important to employee satisfaction. Forty-two
percent (n = 62) of respondents offered comments and/or suggestions. The researcher analyzed
the data for predominant themes. Nine themes were identified, many of which supported the
statistical analyses of other sections of the instrument. Appendix U features the 62 comments.
The only edits made by the researcher to the comments were the correction of misspelled words
81

and the removal of content that might have revealed the identity of a district employee, thus
compromising the promised anonymity of respondents. Dominant themes are summarized in the
list below.
1. Career Advancement and Recognition: Respondents stated there was a lack of career
advancement and recognition in Virginia SWCDs.
2. Directors: Several themes emerged that were specifically related to directors. There
was also a combination of positive and negative comments about director
performance and their relationships with staff. In some cases, directors were praised
for their commitment and leadership. In other cases, the opposite was expressed.
Some employees expressed their desire for directors to take a more active role in their
public service. For example, they should not just attend monthly meetings, but also
participate in district events and take a more active role in daily operations, actively
participate in the decision-making process, maintain a professional attitude, forego
personal agendas, and maintain a standard of ethics. One area that consistently
emerged concerned personnel management.
3. Flexibility: Respondents expressed their fondness for the flexible work schedule
afforded by their SWCD employment.
4. Funding: There were two components associated with this item. The first concerned
the lack of funding and inconsistent funding associated with both operating and
program funds. The second related to employee compensation. Respondents believed
that Virginia SWCD employees were underpaid for the amount of work expected.
However, there were several comments that stated the lower pay could be
compensated via fringe benefits packages and other incentives.
82

5. Health Insurance: This item received the greatest number of comments. The
consensus was that districts needed to provide quality and affordable health insurance
coverage for employees. Employees recognize the associated costs, but view such a
benefit as invaluable to employee retention. The lack of health insurance upon
retirement was cited as a reason for employees seeking other employment. Several
employees suggested the Virginia Association of SWCDs pursue a “group” health
insurance policy for all 47 districts, perhaps even getting the districts to be included
under the State employee health insurance plan. Comment 19, 20, and 58 featured in
Appendix V provide further insight on the issue of a Virginia SWCD group health
insurance policy.
6. Orientation: New employee orientation is perceived as insufficient and in some cases
non-existent.
7. Personnel Relations and Office Management: Several comments alluded to poor
working relationships among district staffers and the detrimental effects those have
upon the SWCD. In addition, the issue of office management was discussed. Based
on the statements, an office manager is warranted; however, individuals given this
responsibility should receive adequate and on-going training. Directors must work
closely with the office manager.
8. Relationships with United States Department of Agriculture - Natural Resources
Conservation Service (USDA - NRCS) and Virginia Department of Conservation and
Recreation (DCR): Based on the comments associated with this theme, it appears that
SWCDs appreciate their relationships with the aforementioned agencies but in some
cases there is a need for improvement. Virginia SWCD employees want to be treated
83

as equals and maintain amicable working relationships that benefit the mutual
clientele served by each agency.
9. Workload: Several respondents mentioned the heavy workloads experienced by
SWCD employees. They reflected on how the lack of funding and unstable funding
made in difficult to recruit and retain an adequate number of quality employees.
Furthermore, the level of compensation often did not correspond to the amount of
work employees were responsible for completing. Some mentioned the stress, both
professional and personal, caused by such workloads.
Differences in job satisfaction based on age, gender, education level, and primary job
responsibility – Research Question 5
The researcher determined whether or not there were differences in intrinsic, extrinsic,
and general job satisfaction levels as measured by the MSQ 1977 Short-Form based on these
four independent variables: age, gender, education level, and primary job responsibility. A one-
way analysis of variance (ANOVA) was selected as an appropriate statistical test to determine
differences between group means. Respondents’ total raw scores of intrinsic, extrinsic, and
general job satisfaction were calculated. Prior to utilizing ANOVA, a homogeneity of variance
test was performed. If the p-value was less than .05, the ANOVA test was not conducted
(Howell, 2007). When the ANOVA was appropriate, an alpha level of .05 was established and p-
values were calculated to determine significance. If the p-value was less than “alpha,” then the
researcher concluded there were differences between the variables being analyzed and the
Tukey’s post-hoc was performed as a multiple comparison test to determine direction (Coolidge,
2004; Howell, 2007).
84

Age: According to Levene’s Test of Homogeneity of Variances, the p-value for age and
total intrinsic satisfaction was .01 (p < .05). Therefore, the one-way ANOVA could not be
performed for these variables. For age and total extrinsic satisfaction, Levene’s Test of
Homogeneity calculated a p-value of .07 (p > .05), so the researcher proceeded with the one-way
ANOVA. The p-value was .27 (p > .05), indicating there was not a significant difference in
extrinsic satisfaction based on age. According to Levene’s Test of Homogeneity, the p-value for
age and total general satisfaction was .02 (p < .05). The one-way ANOVA could not be
performed for these variables.
Gender: Levene’s Test of Homogeneity of Variances was not violated for gender and any
of the three job satisfaction variables, so the one-way ANOVA was performed. In terms of
gender and total intrinsic satisfaction, the p-value was .96 (p > .05), indicating there was not a
significant difference in intrinsic satisfaction based on gender. In terms of gender and total
extrinsic satisfaction, the p-value was .64 (p > .05), indicating there was not a significant
difference in extrinsic satisfaction between male and female respondents. The p-value for gender
and total general satisfaction was .79 (p > .05), indicating there was not a significant difference
in general satisfaction for the variable of gender.
Education level: Levene’s Test of Homogeneity of Variances was not violated for
education level and any of the three job satisfaction variables, so the one-way ANOVA was
performed. In terms of education level and total intrinsic satisfaction, the p-value was .50 (p >
.05), indicating there was not a significant difference in intrinsic satisfaction among respondents
with varied levels of education. In terms of education level and total extrinsic satisfaction, the p-
value was .62 (p > .05), indicating there was not a significant difference in extrinsic satisfaction
for the variable of education level. The p-value for education level and total general satisfaction
85

was .53 (p > .05), indicating there was not a significant difference in general satisfaction for
education levels.
Primary job responsibility: Levene’s Test of Homogeneity of Variances was not violated
for primary job responsibility and any of the three job satisfaction variables, so the one-way
ANOVA was performed. In terms of primary job responsibility and total intrinsic satisfaction,
the p-value was .07 (p > .05), indicating there was not a significant in intrinsic satisfaction
among respondents with varied job responsibilities. In terms of primary job responsibility and
total extrinsic satisfaction, the p-value was .70 (p > .05), indicating there was not a significant
difference in extrinsic satisfaction for the job responsibility variable. The p-value for primary job
responsibility and total general satisfaction was .19 (p > .05), indicating there was not a
significant difference in general satisfaction for primary job responsibility.
Summary
Chapter 4 presented the findings as they related to the purpose of the study and the
related research questions. In addition, statistical data including distribution frequencies,
measures of central tendency (mean, median, and mode), and measures of variation (standard
deviation and range) were presented. An overall or general level of job satisfaction among the
Virginia SWCD employees who responded was found for both the MSQ Short-Form 1977 and
the modified 2002 VASWCD survey.
The MSQ Short-Form found employees, overall, were intrinsically satisfied. They were
most satisfied with the variety and social services. In terms of overall extrinsic satisfaction,
respondents were neutral. However, individual extrinsic items in which “satisfaction” was
expressed included supervision-technical, supervision-human relations, and recognition.
Respondents were less satisfied with advancement.
86
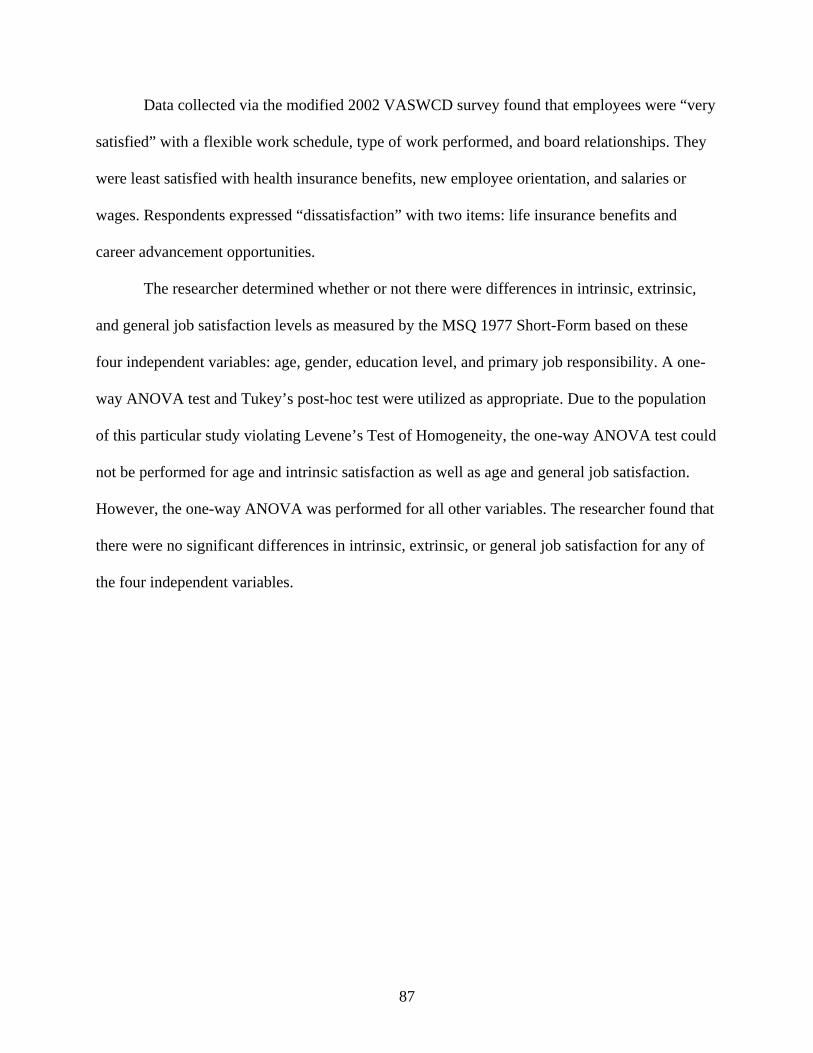
Data collected via the modified 2002 VASWCD survey found that employees were “very
satisfied” with a flexible work schedule, type of work performed, and board relationships. They
were least satisfied with health insurance benefits, new employee orientation, and salaries or
wages. Respondents expressed “dissatisfaction” with two items: life insurance benefits and
career advancement opportunities.
The researcher determined whether or not there were differences in intrinsic, extrinsic,
and general job satisfaction levels as measured by the MSQ 1977 Short-Form based on these
four independent variables: age, gender, education level, and primary job responsibility. A one-
way ANOVA test and Tukey’s post-hoc test were utilized as appropriate. Due to the population
of this particular study violating Levene’s Test of Homogeneity, the one-way ANOVA test could
not be performed for age and intrinsic satisfaction as well as age and general job satisfaction.
However, the one-way ANOVA was performed for all other variables. The researcher found that
there were no significant differences in intrinsic, extrinsic, or general job satisfaction for any of
the four independent variables.
87

Chapter 5
Summary, Conclusions, Recommendations
This chapter summarizes the problem, purpose and research questions, literature review,
and research methodology for the study. In addition, conclusions and recommendations are
discussed.
Summary
Problem
Employment is a major factor in the lives of most Americans and a driving force in our
society. According to the United States Department of Labor-Bureau of Labor Statistics, in June
2007 the employment-population ratio was 63.3%, with 145.9 million American adults employed
(United States Department of Labor, Bureau of Labor Statistics, 2007). Some American adults
devote more than half their life to work obligations. The majority of Americans enter the
workforce on a permanent basis upon graduating from high school and/or college, remaining
active members of the workforce until normal retirement age. The Social Security
Administration defines normal retirement age as 62 years of age for those receiving reduced
Social Security retirement benefits to 67 years of age for those born in 1960 or later (United
States Social Security Administration, n.d.). It is probable that individuals may work 40 or more
years during their lifetime. Given a life expectancy of 77.9 years of age (Centers for Disease
Control, National Center for Health Statistics, 2004), some people may work more than half their
life.
Being satisfied with one’s employment is advantageous for both the employee and
employer. One such benefit is a potential reduction in employee turnover, which can have a
substantial impact on the labor market. Rubin (1995) identified declines in production, separation
88

pay, and costs associated with recruitment, orientation, and training of a new hire as negative
consequences of turnover. There is no doubt there are both financial and human costs attributed
to turnover (Beale & Hollinsworth, 2002; Dobbs, 2000; Norton, 1999; Rousan & Henderson,
1996).
Employee turnover affects all sectors of the labor market and is an escalating problem.
The majority of U.S. corporations anticipate an annual 6% voluntary turnover rate, while many
high-tech companies expect to lose 30% of their workforce each year (Norton, 1999).
Governmental agencies, such as Soil and Water Conservation Districts, are not exempt
from employee turnover. The United States Department of Agriculture – Natural Resources
Conservation Service (USDA – NRCS), recognizes voluntary turnover as a human resource
management issue; this was documented in their Human Capital Strategic Plan 2006-2010
(USDA-NRCS, 2006). Leaders in Virginia’s 47 SWCDs have debated whether or not employee
turnover is an issue for several years. The issue gained so much interest that in 2002 the Virginia
Association of Soil and Water Conservation Districts (VASWCD) authorized a state-wide
employee evaluation survey for the purpose of assessing employee satisfaction and identifying
factors that might be contributing to employee turnover. In 2007, individuals serving in a
supervisory and/or personnel management capacity from each of the 47 districts were directly
asked whether or not employee was a problem for Virginia SWCDs. Of the 36 district
supervisors who responded, 47% identified employee turnover as a problem, while 53% did not
identify employee turnover as a problem. Respondents from three areas thought turnover was a
problem, while two areas did not think turnover was a problem, and one was divided on the
issue. Voluntary departures were experienced in all areas and there were a larger number in the
three areas in which supervisors indicated that turnover was a problem.
89

Purpose and Research Questions
The Theory of Work Adjustment concludes that employees’ satisfaction, or lack thereof,
with their job has an effect on productivity and rates of employee turnover (Weiss, Dawis,
England, & Lofquist, 1967). Therefore, identifying factors associated with employee job
satisfaction levels (intrinsic, extrinsic, and general) and taking appropriate actions, may be a
means of deterring future employee turnover. The purpose of this study was to determine the
level of job satisfaction among Virginia SWCD personnel who were employed during fiscal year
2007-2008. The following research questions were investigated in this research study.
1. What were the characteristics of Virginia Soil and Water Conservation District
employees?
2. What was the general (overall) job satisfaction level of Virginia Soil and Water
Conservation District employees as measured by the Minnesota Satisfaction
Questionnaire (MSQ) 1977 Short-Form?
3. What degrees of intrinsic and extrinsic job satisfaction were expressed by Virginia Soil
and Water Conservation District employees as measured by the Minnesota Satisfaction
Questionnaire (MSQ) 1977 Short-Form?
4. What degree of job satisfaction was expressed by Virginia Soil and Water Conservation
District employees as measured by a modified version of the Virginia Association of Soil
and Water Conservation District’s (VASWCD) 2002 survey?
5. Were there differences in the intrinsic, extrinsic, and general job satisfaction level as
measured by the Minnesota Satisfaction Questionnaire (MSQ) 1977 Short-Form based on
the following independent variables: age, gender, education level, and primary job
responsibility?
90

Summary of Literature Review
In the mid-1930s SWCDs were created to give a local voice to the conservation of natural
resources. Title 10 of the Code of Virginia defines SWCDs as political subdivisions of state
government and provides regulations and guidelines of operation. Virginia’s 47 SWCDs are
responsible performing conservation work within designated boundaries. Work is accomplished
with leadership from a Board of Directors and a support staff.
The demand for environmental workers surged in the 1960s with the onset of the
environmental movement. Today, SWCDs are competing with numerous public and private
entities to recruit and maintain competent, professional employees.
Since the 19th century, numerous research studies have been conducted in regard to job
satisfaction. As a result, many theories and measurements of job satisfaction were established
and include: the Hawthorne Effect, Elton Mayo, 1927-1932; Job Satisfaction Blank, Robert
Hoppock, 1935; Hierarchy of Needs Theory, Abraham Maslow, 1943; Two Factor Hygiene and
Motivation Theory, Frederick Herzberg, 1957 and 1959; Valence-Instrumentality-Expectancy
Theory, Victor Vroom, 1964; Job Descriptive Index, Cornell Group, 1969; Job Diagnostic
Survey, Hackman and Oldham, 1975; Job in General Scale, Ironson, Smith, Brannick, Gibson,
and Paul, 1989; and Work Adjustment Theory, Minnesota Group, 1964. The Theory of Work
Adjustment was selected as the theoretical framework for this study because of its recognition
and extensive utilization. It is centered on the work personality and the work environment. An
individual’s satisfaction with the work environment in combination with satisfactory
performance on the job result in correspondence, which is when the employee fulfills the
requirements of the work environment and the work environment meets the requirements of the
employee (Dawis & Lofquist, 1990). Tenure is a product of both satisfaction and satisfactoriness,
91

thus an acute awareness of employee satisfaction can have a positive impact on employee
relations and the overall well-being of the organization.
A number of variables and their relationship to job satisfaction have also been researched.
Age and gender are two of the most common variables that are studied (Carter, Pounder,
Lawrence & Wozniak, 1989; Herzberg, Mausner, Peterson, & Capwell, 1957). More recent job
satisfaction research has addressed education level and position (Clark, 1996; Idson, 1990;
Meng, 1990; Vila & Garcia-More, 2005). In regard to all four variables, research findings are
conflicting.
The literature review confirmed that employee turnover and retention have been linked to
job satisfaction (Beale & Holinsworth, 2002; Mobley, 1982; Owen, 2004; Rubin, 1995). As a
result, job satisfaction is an area of interest for many types of organizations. Nevertheless,
documented research directly related to SWCDs is limited.
Research Methodology
This was a quantitative, descriptive study. The target population was composed of
individuals employed with a Virginia SWCD during fiscal year 2007-2008, resulting in an
accessible population of 185. The instrument consisted of three parts, each selected to assess
employee job satisfaction and identify characteristics of employees. Part I of the instrument
featured an existing questionnaire known as the Minnesota Satisfaction Questionnaire (MSQ)
1977 Short-Form, utilized to determine the intrinsic, extrinsic, and general job satisfaction levels
of district employees. Part II was a modified survey instrument that was initially authorized in
2002 by the VASWCD to evaluate job satisfaction. Part III identified employee characteristics
(gender, age, ethnicity, race, marital status, children, educational level, SWCD Area, tenure,
employment status, position status, salary or wage earnings, and primary job responsibility).
92

The survey instrument was Web-based and administered via a secure site. The Virginia
Tech Center for Assessment, Evaluation, and Educational provided data collection assistance.
Dillman (2007) served as a source of reference for the study’s field test. A regional Virginia
Department of Conservation and Recreation (DCR) office served as the field test group. As a
result of the field test, typographical, grammatical, formatting, and technological errors were
identified and corrected prior to initiating the actual survey.
The Tailored Design Method (Dillman, 2007) was used to collect data. On January 3,
2008, and January 7, 2008, pre-notice letters were sent to the target population via e-mail. The
CAEEP sent the initial mailing on January 8, 2008, which included a detailed description of the
research, an authenticated login and password, and a direct link to the Web-based survey.
Subjects were requested to respond within 14 days and electronic reminders were issued on
January 15, 2008, and January 22, 2008. A total of 148 Virginia SWCD employees responded to
the survey by the established deadline of January 22, 2008, equating to an overall response of
80%.
Data were analyzed with the student version of the Statistical Program for the Social
Sciences (SPSS) Version 14.0 for Windows. Descriptive statistics including distribution
frequencies, measures of central tendency (mean, median, mode), and measures of variance
(standard deviation and range) were used to report employee characteristics and identify levels of
job satisfaction for various aspects of the job. The one-way Analysis of Variance (ANOVA) was
utilized to determine mean differences among the variables (job satisfaction and the independent
variables of age, gender, educational level, primary job responsibility).
93

Conclusions by Research Question
Virginia SWCD Employee Characteristics
The following traits characterized the majority of Virginia SWCD respondents: non-
Hispanic, white, female, average age of 41 years, married with no children 18 and under living in
the home, hold a bachelor’s degree, average tenure of 6.52 years, employed full-time, employed
in a permanent position, with the position expected to continue indefinitely, and hold a technical
position. Of all the survey questions, respondents were the least willing to share their levels of
compensation, with 14 electing not to answer this question. For those who did respond, the
average hourly wage was $14.45 per hour, while salaried employees reporting earning an
average of $36,373.54 per year. The majority of respondents categorized their primary job
responsibility as “technical.”
The researcher concluded from the findings that there are a low number of minority
workers. Another conclusion drawn was that tenure is likely an issue for this agency with
average employee tenure slightly greater than six years. Also, there appears to be some
discrepancy in the compensation of employees statewide, with a considerable difference between
the low salary ($21,888.00) and the highest reported salary ($85,990.00).
Virginia SWCD Job Satisfaction – MSQ 1977 Short –Form
The findings determined that Virginia SWCD employees were generally satisfied with
their jobs. In terms of intrinsic satisfaction, SWCD respondents were also satisfied; however,
somewhat greater levels of satisfaction were expressed in regard to variety and social services. In
terms of overall extrinsic satisfaction, the response was neutral. Respondents were undecided on
three of the six extrinsic job aspects, but they expressed satisfaction with the remaining three
94

extrinsic aspects. These were supervision-technical, supervision-human relations, and
recognition. The lowest mean scores were reported for compensation and advancement.
The researcher concluded that for the most part Virginia SWCDs are making a concerted
effort to encourage the general and intrinsic satisfaction of their employees. In terms of extrinsic
satisfaction, although the two extrinsic items with the lowest mean scores were still in the
“neutral” range, both were areas of concern for the majority of respondents. The issue of the
level of compensation could be related to the aforementioned range of salaries.
Virginia SWCD Job Satisfaction – Modified VASWCD 2002 Survey
As reported in the findings, the majority of respondents were generally satisfied with
their district employment. There were distinctions among the satisfaction levels for the 12 job
issues addressed in this section of the survey, with employee ratings on some questions falling
above or below “satisfied.” Flexibility with work schedule, type of work performed, and
relationship with district boards were three areas in which respondents were “very satisfied.”
District employees were less satisfied with health insurance benefits, new employee orientation,
and salaries and wages. Respondents were clearly “dissatisfied” with life insurance benefits and
opportunities available to advance in their career. The additional comments and suggestions
provided by a number of respondents were particularly informative.
Based on the findings, SWCD employees take pride in their work and value the
contributions they make to their communities. There is no doubt that flexibility with professional
scheduling is an item of great satisfaction.
As a result of findings from both the first question and third question, the researcher was
able to draw several conclusions. Although employee relationships with the district board were
cited as an item of great satisfaction in the first question of the survey, in the third question many
95

respondents felt the need to elaborate on this item. Based on the data collected, the researcher
concluded that having an effective board is essential to the satisfaction of employees and the
overall health of the agency. Employees expect individuals serving on SWCD boards to be
professional leaders who take an active role in their public service. The findings suggest that
personnel management is a serious issue. It appears that directors need to more effectively
address personnel issues in a professional, timely, and efficient manner. Another conclusion
drawn centered upon health insurance benefits. It appears that health insurance coverage widely
varies across the 47 Virginia SWCDs. Employees have concerns about their present coverage as
well as coverage upon retirement. Exploration of ways to provide state-wide health insurance
coverage should be considered. In addition, the lack of new employee orientation causes the
transition into SWCD employment to be more difficult and leads to frustration. Once again,
salaries and wages emerged as an area of less satisfaction, thus the researcher surmised it merits
the attention of district leaders.
Since the majority of respondents were dissatisfied with their life insurance benefits, it
suggested to the researcher that many districts fail to provide this fringe benefit. Yet again,
dissatisfaction with career advancement opportunities was expressed. The researcher decided this
item was certainly deficient for the majority of SWCDs.
Job Satisfaction and Differences with Independent Variables
The researcher determined whether or not there were differences in intrinsic, extrinsic,
and general job satisfaction levels as measured by the MSQ 1977 Short-Form based on these
four independent variables: age, gender, education level, and primary job responsibility. A one-
way ANOVA test was utilized to determine differences between the means of groups, while
Tukey’s post-hoc test was used as the multiple comparison test. Due to the population of this
96

particular study, the Levene’s Test of Homogeneity was violated, thus the one-way ANOVA test
could not be performed for age and intrinsic satisfaction as well as age and general job
satisfaction. However, the one-way ANOVA was performed for all other variables. The
researcher concluded that there were no significant differences in intrinsic, extrinsic, or general
job satisfaction for any of the four independent variables.
Recommendations
Based on the findings and conclusions, the researcher formulated a list of
recommendations for practice and policy. Please be advised that comments are not listed in any
order of importance.
1. The study confirmed that in general current Virginia SWCD employees are satisfied
with their jobs and enjoy their work. The majority were willing to participate in this
study in hopes of making the SWCD work environment the best it possibly can be.
The comments and/or suggestions, both positive and negative, should be carefully
reviewed by individuals in a position of authority. Any criticisms should be taken
constructively. Ultimately, action should be taken promptly on some of the items
documented through this survey, as a means of improving Virginia SWCDs. Many of
the items documented in this survey were initially documented in the 2002 VASWCD
Employee Evaluation; however, it appears the results of the original survey may not
have been used effectively.
2. Although there are a low number of minorities employed by Virginia SWCDs, a
challenge might be to discover if recruitment of employees targets minorities, and if
they are retained once hired. Virginia SWCDs should continue to work on attracting
minorities.
97

3. The average number of years respondents had worked for a SWCD was 6.52 years.
The researcher believed this is a good indicator that turnover is occurring within the
agency in comparison with Cooperative Extension in Virginia. Virginia SWCD
leaders should take the issue of employee turnover seriously and focus on ways to
retain quality employees.
4. The majority of respondents categorized their primary job responsibility as
“technical.” Information provided in the Chapter 2 Literature Review confirmed that
technical positions were in the most demand, thus SWCDs are competing with
numerous entities for the same type of employee. SWCD leaders must be aware of
the demand for technical positions and ensure that districts state-wide are places
where quality employees desire to work.
5. Satisfaction with flexibility of professional scheduling was a recurring response.
SWCDs should emphasize this aspect of the job when recruiting new employees
because it is a unique characteristic.
6. The lack of career advancement opportunities was cited on numerous occasions in
this study and in 2002. Unfortunately, given the structure of Virginia SWCDs, it may
be impossible to directly address this item. Nevertheless, there are alternative
solutions. First, directors should be clear with potential recruits, informing them of
the fact that there are few opportunities for advancement within the organization. In
return for limited advancement opportunities, SWCDs could establish their own
system of advancement or career ladder. Employees might earn additional fringe
benefits based on outstanding performance and/or years of service. For example, an
employee with 10 years of service might earn additional annual leave or an employee
98

who successfully completes a series of projects might earn an end-of-year bonus.
Several respondents alluded to a lack of recognition, but recognition would be
another way to compensate employees for not being able to advance. Various means
of recognition should be explored. The overall goal would be to provide something to
employees that would be equivalent to what they would get if they were afforded the
opportunity to advance within the organization.
7. Unstable and inconsistent funding was a predominant issue in the study. It should be
noted that this issue was also documented in 2002. Individual districts, VASWCD,
partnering agencies, and state legislators must work on a solution to this problem. A
state policy that could identify a source of consistent revenue for SWCDs and allocate
such revenue accordingly would be warranted.
8. Level of compensation was an area of concern in this study and the 2002 survey.
Certainly, the previously described funding issues compound this issue. Based on
data collected, the range of annual salaries and hourly wages for employees seems
extreme. It appears employees would appreciate more consistency among districts.
Also, employees want performance evaluations to play a greater role in pay raises.
Just because one employee gets an increase in salary for exemplary work does not
mean the entire staff warrants an increase. In both the 2002 survey and this study,
employees offered some solutions: (a) VASWCD, working in conjunction with
representation from all 47 districts, should develop a state-wide pay scale; (b) both
cost-of-living annual pay increases as well as merit increases should be established;
and (c) directors should be objective when making payroll decisions.
99

9. Insurance, specifically health, life, and dental, emerged as a major issue for
respondents. There is an overwhelming need to establish a group health insurance
plan for SWCD employees state-wide. Employees also value life insurance and dental
insurance plans. It was obvious that employees have given much thought to this issue
as expressed in the following direct quotations from the employee comments:
1. Health insurance is very important. As district employees become older
(even the young ones), health insurance becomes more important. The
Association should look into getting district employees on the State health
plan. This would make better use of state funding and be better than the
variety of group plans and individual policies that districts carry.
2. I think there is constant worry about affordable health insurance. Can
VASWCD create a “group” for insurance purposes and get us all a more
reasonable rate on health, life, dental, etc.? This would be a very valuable
reason to be part of VASWCD.
3. One issue of concern is that upon retirement there is not way to buy into
the health plan. If you dedicate your career to the district, upon retirement
you have to find private insurance at a time when you have given up your
income and have more health problems. State employees and some private
companies have the option to remain with their plan and pay for it out of
pocket, which is still lower than a private provider. Looking ahead,
retirement planning is the one issue that makes moving to another agency
an attractive option despite being satisfied with district employment.
100

Providing a group health plan would alleviate some of the compensation, career
advancement, and recognition concerns. The VASWCD is strongly encouraged to
convene an exploratory committee on health insurance coverage and find a solution to
this issue. If the districts can be a part of the Virginia Retirement System, which was
created for State employees, why can districts not be a part of the State health
insurance plan?
10. New employee orientation is warranted. The VASWCD, working in conjunction with
Virginia DCR, should develop an orientation curriculum that would accommodate
districts hiring employees for an array of positions at varying times of the year.
11. Director relationships with staff members are critical not only to the overall
satisfaction of employees, but the SWCD in general. Directors must be aware of the
role they play. Given the comments about directors, there is no doubt that director
orientation should be mandatory and perhaps more extensive than what is being
currently offered. It appears that directors need additional training in ethics and
personnel management.
12. The establishment of district managers within each office should be given strong
consideration since it seems the daily leadership and supervision is necessary. That
being said, individuals selected to fill such positions should be adequately trained.
Future Research
Future research should perhaps focus on some of the individual findings of this study. A
study that could immediately emerge is one that focuses strictly on health insurance coverage for
Virginia SWCD employees. A study of this nature should encompass the following: an in-depth
assessment of what types of health insurance benefits each of the 47 SWCDs offers employees;
101

health insurance costs for districts and employees; quality of coverage; census of interest in a
group plan; feasibility of becoming part of the Commonwealth of Virginia’s state employee
health plan; and a plan of action based on the findings and conclusions. Since the lack of
opportunities for career advancement was an area of dissatisfaction, a study could be devoted to
addressing this issue. Such a study could focus on the needed skills for 21st century employees
who desire greater autonomy and engagement with organizational issues. Another study might
concentrate on new employee orientation, specifically identifying the professional development
needs of new employees. Future study should be conducted to determine effective management
traits and how SWCD directors and managers can practice such skills. To determine if areas of
concern and dissatisfaction are really the reasons employees leave, future research with
employees who have left SWCD positions may be needed. Finally, a follow-up to this particular
study within the next 5 years would be legitimate in order to assess progress.
Final Thoughts
In conclusion, Virginia SWCD employees are generally satisfied with their jobs. They are
dedicated to the overall mission of SWCDs, which is to give a local voice to the conservation
movement and protect and preserve the community’s natural resources. Employees acknowledge
there are aspects of the job which could be improved and appear to be willing to work with local
boards and the VASWCD to make those improvements. After two employee satisfaction
evaluations in a span of six years, it is time for district representatives in leadership positions to
take notice of the findings and work toward addressing the items of concern.
102

References
Accel-Team. (n.d.a). Human relations contributors – Elton Mayo’s Hawthorne experiments. Retrieved July 2, 2007, from http://www.accel-team.com/motivation/hawthorne_02.html
Accel-Team. (n.d.b). Human relations contributors – Frederick Herzberg. Retrieved July 2,
2007, from http://www.accel-team.com/human_relations/hrels_05_herzberg.html Andrisani, P. J., & Shapiro, M. B. (1978). Women’s attitudes toward their jobs: Some
longitudinal data on a national sample. Personnel Psychology, 31(1), 15-34. Barclay, L. A., Fields, M. W., & Halpert, J. A. (1981, April). The impact of gender, perceived
female isolation and beliefs in traditional roles for women on job satisfaction. Paper presented at the 53rd Annual Meeting of the Midwestern Psychological Association, Detroit, MI.
Beale, A. V., & Holinsworth, S. R. (2002). Achieving congruence between employee interests
and county jobs: a win-win proposition. Journal of Employment Counseling, 38(1), 22- 30.
Bedeian, A. G., Ferris, G. R., & Kacmar, K.M. (1992). Age, tenure, and job satisfaction: A tale of two perspectives. Journal of Vocational Behavior, 40(1), 33-48.
Bernal, D., Snyder, D., & McDaniel, M. (1998). The age and job satisfaction relationship: Does
its shape and strength still evade us? Journal of Gerontology: Psychological Sciences, 53-B(5), 287-293.
Brayfield, A. H., Wells, R. V., & Strate, M. W. (1951). An index of job satisfaction. Journal of
Applied Psychology, 35(5), 307-311. Brayfield, A. H., Wells, R. V., & Strate, M. W. (1957). Interrelationships among measures of job
satisfaction and general satisfaction. Journal of Applied Psychology, 41(4), 201-205. Bruce, L., Jr., (2002, May). SWCD Employee Evaluation. Unpublished report presented to the
Virginia Association of Soil and Water Conservation Districts. Blacksburg: Virginia Tech.
Centers for Disease Control, National Center for Health Statistics. (2004). Fast stats A-Z – Life
expectancy. Retrieved October 9, 2006, from http://www.cdc.gov/nchs/fastats/lifexpec.htm
103

Carter, C. G., Pounder, D. G., Lawrence, F. C., & Wozniak, P. J. (1989, November). Factors related to organizational turnover intentions of Louisiana Cooperative Extension Service agents. Paper presented at the Annual Conference on Quality-of-Life Studies in Marketing and Management, Blacksburg, VA.
Clark, A. E. (1996). Job satisfaction in Britain. British Journal of Industrial Relations, 34(2),
189-217.
Clark, A. E., & Oswald, A. J. (1996). Satisfaction and comparison income. Journal of Public Economics, 61(6), 359-381.
Coolige, F. L. (2004). Statistics: A gentle approach. London: SAGE Publications. Dawis, R. V., & Lofquist, L. H. (1990). A psychological theory of work adjustment.
Minneapolis: University of Minnesota Vocational Psychology Research. Dawis, R. V. (2004). Job satisfaction. In J. C. Thomas (Ed.) & M. Hersen (Ed. at Large),
Comprehensive handbook of psychological assessment: Vol. 4. Industrial and organizational assessment (pp. 470-481). New York: John Wiley and Sons.
DeMato, D. S. (2001, September). Job satisfaction among elementary school counselors in
Virginia: Thirteen years later. Unpublished doctoral dissertation, Virginia Polytechnic Institute and State University, Blacksburg.
Dillman, D. A., (2007). Mail and internet surveys: The tailored design method (2nd ed.).
Hoboken, NJ: John Wiley & Sons. Dobbs, K. (2000, August). Plagued by turnover? Train your managers. Training, 37(8), 62-66. Doran, L. I., Stone, V. K., Brief, A. P., & George, J. M. (1991). Behavioral intentions as
predictors of job attitudes: The role of economic choice. Journal of Applied Psychology, 76(1), 40-46.
Duffy, M. K., Ganster, D.C., & Shaw, J. D. (1998). Positive affectivity and negative
outcomes: The role of tenure and job satisfaction. Journal of Applied Psychology, 76(3), 950-959.
Environmental Careers Organization. (1999). The complete guide to environmental careers
in the 21st century. Washington, DC: Island Press. Ewen, R. B. (1967). Weighting components of job satisfaction. Journal of Applied Psychology,
51(1), 68-73. Fasulo, M., & Kinney, J. (2002). Careers for environmental types & others who respect the
Earth. (2nd ed.). New York: VGM Career Books.
104

Fisher, D. J. (2005). The road to good employment retention – Three successful programs from the jobs initiative. Baltimore: Annie E. Casey Foundation. Friedmann, E. A., & Havighurst, R. J. (1962). Work and retirement. In S. Nosow & W. H. Form (Eds.), Man, work, and society (pp. 41-55). New York: Basic Books. Groves, R. M., Dillman, D. A., Eltinge, J. L., & Little, R. J.A. (Eds.). (2002). Survey nonresponse. New York: John Wiley & Sons. Groves, R. M. (2005). Survey errors and survey costs. New York: Wiley-Interscience. Gruenberg, M. M. (1976). Job satisfaction. New York: Macmillan. Hackman, J. R., & Oldham, G. R. (1975). Development of the job diagnostic survey. Journal of
Applied Psychology, 60(2), 159-170. Hankin, H. (2004). The new workforce. New York: American Management Association. Harrell, T. W. (1958). Industrial psychology. New York: Holt, Rinehart, and Winston. Heath, M. S., Jr. (2004). Guidebook on the law and practice of soil and water conservation in North Carolina. Chapel Hill: University of North Carolina, School of Government. Herzberg, F., Mausner, B., & Snyderman, B. (1959). The motivation to work. New York: Wiley. Herzberg, F., Mausner, B., Peterson, R., & Capwell, D. (1957). Job attitudes: Review of research and opinion. Pittsburgh: Psychological Services of Pittsburgh. Hittleman, D. R., & Simon, A. J. (2006). Interpreting educational research: An introduction for consumers of research (4th ed.). Upper Saddle River, NJ: Merrill-Prentice Hall. Hoppock, R. (1935). Job satisfaction. New York: Harper. Howell, D. C. (2007). Statistical methods for psychology (6th ed.). Belmont, CA: Thomson
Wadsworth. Hulin, C. L., & Smith, P. C. (1964). Sex differences in job satisfaction. Journal of Applied
Psychology, 48(2), 88-92. Hulin, C. L., & Smith, P. C. (1965). A linear model of job satisfaction. Journal of Applied
Psychology, 49(3), 209-216. Idson, I. L. (1990). Establishment size, job satisfaction and the structure of work. Applied
Economics, 22, 1007-1018.
105

Ironson, G. H., Smith, P. C., Brannick, M. T., Gibson, W. M., & Paul, K. B. (1989). Construction of a job in general scale: A comparison of global, composite, and specific measures. Journal of Applied Psychology, 74(2), 193-200.
J. S. Evans Consulting, Inc. (n.d.). Minnesota satisfaction questionnaire. Retrieved July 2, 2007,
from http://www.jsevansconsultinginc.com/Pages/MINNESOTA.htm Jewell, L. R., Beavers, K. C., III, Malpiedi, B. J., & Flowers, J. L. (1990). Relationships between
levels of job satisfaction expressed by North Carolina vocational agriculture teachers and their perceptions toward the agricultural education teaching position. Journal of Agricultural Education, 31(1), 52-57.
Johnson, T. P. and Owens, L. (2003, August). Survey response rate reporting in professional
literature. American Association for Public Opinion Research – Section on Survey Research Methods, 127-133. Retrieved December 31, 2007, from http://issrweb.asu.edu/services/sras/resources/articles/SURVEY%20RESPONSE%20 RATE%20REPORTING.pdf
Judge, T. A. (1993). Does affective disposition moderate the relationship between job
satisfaction and voluntary turnover? Journal of Applied Psychology, 78, 395-401. Lee, R., & Wilbur, E. R. (1985). Age, education, job tenure, salary, job characteristics, and job
satisfaction: A multivariate analysis. Human Relations, 38, 781-791. Levine, E. L., Ash, R. A., & Levine, J. D. (2004). Judgmental assessment of job related
experience, training, and education for use in human resource staffing. In J. C. Thomas (Ed.) & M. Hersen (Ed. at Large), Comprehensive handbook of psychological assessment: Vol. 4. Industrial and organizational assessment (pp. 270-296). New York: John Wiley and Sons.
Lindner, J. R., & Wingenbach, G. J. (2002). Communicating the handling of
nonresponse error in research in brief articles. Journal of Extension, 40(6). Retrieved December 31, 2007, from http://www.joe.org/joe/2002december/rb1.shtml.
Mahoney, T. A., Frost, P., Grandall, N. F., & Weitzel, W. (1972). The conditioning
influence of organization size upon managerial practice. Organizational Behavior and Human Performance, 8(2), 230-241.
106

Maslow, A. H. (1943). A theory of human motivation. Psychological Review, 50, 394-395. Meng, R. (1990). The relationship between unions and job satisfaction. Applied Economics, 22,
1635-1648. Mobley, W. H. (1977). Intermediate linkages in the relationship between job satisfaction and
employee turnover. Journal of Applied Psychology, 62, 237-240. Mobley, W. H. (1982). Employee turnover: Causes, consequences and control. Reading,
MA: Addison-Wesley. Morse, N. C., & Weiss, R. J. (1962). The function and meaning of work and the job. In S. Nosow & W. H. Form (Eds.), Man, Work, and Society (pp. 29-35). New York: Basic Books. Norton, S. M. (1999). Teacher retention: Reducing costly teacher turnover. Contemporary
Education, 70(3), 52-55. O’Connor, E. J., Peters, L. H., Pooyan, A., Weekley, J., Frank, B., & Erenkrantz, B. (1984).
Situational constraint effects on performance, affective reactions, and turnover: A field replication and extension. Journal of Applied Psychology, 69, 663-672
Owen, L. (2004, April 30). History of labor turnover in the U.S. Retrieved February 24, 2007,
from http://eh.net/encyclopedia/article/owen.turnover Pooyan, A., Eberhardt, B. J., & Szigeti, E. (1990, May). Work-related variables and turnover
intention among registered nurses. Nursing and Health Care, 11(5), 254-258. Rossman, G. B., & Rallis, S. F. (2003). Learning in the field: An introduction to qualitative research (2nd ed.). Thousand Oaks, CA: Sage. Rousan, L. M., & Henderson, J. L. (1996). Agent turnover in Ohio State University
Extension [Electronic Version]. Journal of Agricultural Education, 37(2), 56-62. Rubin, R. (1995). A study of job factors affecting current public library employees’ desire
to remain with or leave their employer. Journal of Library Administration, 221(1), 85-111.
Saleh, S. D., & Otis, J. L. (1964). Age and level of job satisfaction. Personnel Psychology, 17,
425-430. Sauser, W. I., Jr., & York, C. M. (1978). Sex differences in job satisfaction: A re-examination.
Personnel Psychology, 31, 537-547. Schmitt, N., & Fitzgerald, M. (1979, May). Organizational size, work group size, job level and
perceived job characteristics. Paper presented at the Annual Meeting of the Midwestern Psychological Association, Chicago, IL.
107

Smith, P. C., Kendall, L. M., & Hulin, C. L. (1969). Measurement of satisfaction in work and retirement. Chicago: Rand McNally.
Spector, P. E. (1997). The role of frustration in antisocial behavior at work. In R. A. Giaclone &
J. Greenberg (Eds.), Antisocial behavior in organizations (pp. 1-17). Thousand Oaks, CA: Sage.
Stone, E. F., & Porter, L. W. (1973, November) Job scope and job satisfaction: A study of urban
workers (Scientific Report 22). Irvine, California University: Graduate School of Administration. (ERIC Document Reproduction Service No. ED086897)
United States Department of Agriculture, Natural Resources Conservation Service. (n.d.) About
us. Retrieved February 21, 2007, from http://www.nrcs.usda.gov/about/ United States Department of Agriculture, Natural Resources Conservation Service-Virginia.
(2006). Human capital strategic plan 2006-2010. Washington, DC: Author. United States Department of Agriculture, Natural Resources Conservation Service-Virginia.
(2007, May). Requirements for providing conservation planning assistance (General Manual, Title 180-CPA, Amendment No. VA24). Richmond, VA: Author.
United States Department of Labor, Bureau of Labor Statistics. (n.d.). BLS glossary.
Retrieved October 9, 2006, from http://www.bls.gov/bls/glossary.htm#turnover United States Department of Labor, Bureau of Labor Statistics. (2005, August 25). Number of
jobs held, labor market activity, and earnings growth among the youngest baby boomers - Results of a longitudinal survey. Retrieved October 9, 2006, from http://www.bls.gov/news.release/pdf/nlsoy.pdf
United States Department of Labor, Bureau of Labor Statistics. (2006, September 8). Employee
tenure in 2006. Retrieved October 9, 2006, from http://www.bls.gov/news.release/tenure.nr0.htm
United States Department of Labor, Bureau of Labor Statistics. (2007, June 1). Employment
situation summary. Retrieved June 22, 2007, from http://www.bls.gov/news.release/empsit.nr0.htm
United States Department of Labor, Employment Standards Administration Wage and Hour
Division. (n.d.) Fair labor standards act. Retrieved October 9, 2006, from http://www.dol.gov/esa/whd/flsa/
108

United States Social Security Administration. (n.d.). Retirement age. Retrieved October 9, 2006, from http://www.ssa.gov/pubs/ageincrease.htm
University of Minnesota, Vocational Psychology Research. (n.d.). Minnesota satisfaction
questionnaire. Retrieved June 22, 2007, from http://www.psych.umn.edu/psylabs/vpr/msqinf.htm
Vila, L. E., & Garcia-Mora, B. (2005). Education and determinants of job
satisfaction. Education Economics, 13(4), 409-425. Virginia Association of Soil and Water Conservation Districts. (n.d.). About the association.
Retrieved October 9, 2006, from http://www.vaswcd.org/aboutus.htm Virginia Association of Soil and Water Conservation Districts. (n.d.). Soil and water
conservation districts listed by county/city. Retrieved September 15, 2007, from http://www.vaswcd.org/swcdlist.htm
Virginia Department of Conservation and Recreation (n.d.). Virginia soil and water conservation
board. Retrieved October 9, 2006, from http://www.dcr.virginia.gov/soil_&_water/vs&wcb.shtml
Virginia Department of Conservation and Recreation (n.d.). Virginia’s soil and water
conservation districts. Retrieved October 9, 2006, from http://www.dcr.virginia.gov/soil_&_water/swcds.shtml
Virginia Department of Conservation and Recreation. (2007a). Directory of Virginia’s soil and
water conservation districts. Richmond, VA. Author. Virginia Department of Conservation and Recreation (2007b). Topics in leadership management
for conservation district employees. [On-line course curriculum]. Richmond, VA: Author.
Vroom, V. H. (1964). Work and motivation. New York: Wiley. Wanous, J. P., & Lawler, E. E., III. (1972). Measurement and meaning of job satisfaction.
Journal of Applied Psychology, 56(2), 95-105. Weaver, C. N. (1977). Relationships among pay, race, sex, occupational prestige, supervision,
work autonomy, and job satisfaction in a national sample. Personnel Psychology, 30, 437-445.
Weiss, D. J., Dawis, R. V., England, G.W., & Lofquist, L. H. (1967). Manual for the Minnesota
Satisfaction Questionnaire. Minneapolis: The University of Minnesota Press.
109

Wiseman, F. (2003). On the reporting of response rates in extension research. Journal of Extension, 41(3). Retrieved December 31, 2007, from http://www.joe.org/joe/2003june/comm1.shtml.
110

Appendix A: Virginia Soil and Water Conservation District (SWCD) Employee Turnover Survey, August 2007
Virginia Soil & Water Conservation District (SWCD) Employee Turnover Survey
Prepared and Issued by Angela P. White Reviewed by Ricky Rash, President VASWCD
TO BE COMPLETED BY: 1 Staff Member from each Virginia SWCD with Guidance from at least 1 SWCD Director TO BE RETURNED BY: TUESDAY, AUGUST 14, 2007; 5 PM
1. Identify the VA Soil and Water Conservation District (SWCD) Area in which the district you
represent is associated. _____ Area I _____ Area II _____ Area III _____ Area IV _____ Area V _____ Area VI
2. How many paid staff positions (include part-time, full-time, temporary, and permanent) did the SWCD
support from July 1, 2002, thru July 1, 2007? Example: The SWCD supported an Administrative Secretary, Conservation Specialist, and part-time Conservation Technician from 2002-2007 and a TMDL Technician from 2005-2007 for a total of 4 staff positions during the aforementioned time frame. __________
3. How many individual employees voluntarily left the SWCD between July 1, 2002, and July 1, 2007? _______ 4. How many individual employees involuntarily left the SWCD because there was not enough funding to
continue to support their staff position? _________
5. How many individual employees involuntarily left the SWCD due to dismissal or termination of employment associated with unsatisfactory job performance or a related circumstance?
________ 6. Does the SWCD you represent believe that employee turnover is a problem? YES _____ NO _____ 7. If you have any additional comments related to employee turnover, please share those comments. ____________________________________________________________________________________ ____________________________________________________________________________________ Direct Questions and Return Surveys To: Angela P. White E-Mail: [email protected]: 276-889-2105
111

Appendix B: Virginia Soil and Water Conservation District (SWCD) Employee Turnover Survey, August 2007
Prior Correspondence E-Mail FROM: Ricky Rash [[email protected]] DATE: Wednesday, August 1, 2007 10:52 AM TO: [email protected] SUBJECT: Requested Information To All Directors, Associate Directors, and Staff: Angela White of Clinch Valley SWCD is conducting a research project for her graduate work at Virginia Tech. This all important work may be used in the near future for determining the needs of individual districts. Questions are being posed that “IF(!) there is a sizeable roll-up in NPS funds, are there qualified people available to fill these positions?” Our answer was “we don’t know.” And the follow-up question went something like, “Is it time to begin working with schools and universities to train these people?” This may be the start for answering these questions. Angela has been presented a copy of a survey done several years ago that from memory seems very similar. Again, it is from memory. I have reviewed the current survey and approve. I urge you to take a few minutes and comply with her request. The board is aware and supportive. This is research that districts will benefit from once complete. Thank you in advance for your cooperation. Angela will be in touch and responses should go back to her. Ricky Rash President VASWCD www.vaswcd.org
112

Appendix C: Virginia Soil and Water Conservation District (SWCD) Employee Turnover Survey, August 2007
Cover Correspondence E-Mail FROM: White, Angela – Lebanon, VA DATE: Wednesday, August 1, 2007 2:07 PM TO: [email protected]: Virginia SWCD Survey Employee Turnover 2007 ATTACHMENTS: Virginia SWCD Survey_Employee Turnover 2007.doc
Hello, my name is Angela White. The distribution of this e-mail and the attached survey was briefly explained in a previous e-mail sent to the Virginia SWCD “All-District” list-serve from Ricky Rash, VASWCD President, dated August 1, 2007. For those of you receiving this e-mail who do not know me, I am employed with Clinch Valley SWCD in Russell County. I am also pursuing a graduate degree through Virginia Tech. As a graduation requirement, I must complete a research project. My research will focus on Virginia SWCD employee job satisfaction and how that relates to employee turnover. As you know, I have discussed this project with Ricky Rash, garnering support for my research. Presently, I am in the process of conducting some preliminary research on Virgnia SWCD employee turnover. The purpose of this preliminary research is to determine whether or not employee turnover is an issue that warrants attention. I thought the most effective means of obtaining this information would be to send an electronic questionnaire to district employees who are in management and/or administrative positions. This is the reason you have received this e-mail, while other staff members in your district office have not. I utilized the 2007 employee directory to obtain contact information. If I sent you this e-mail in error, please forward to the appropriate staff member in your office. I am interested in knowing the employee turnover rate for Virginia SWCD employees for a five-year period from July 1, 2002, to July 1, 2007. I would really appreciate your assistance in completing the attached survey, which is in MS Word. Please return to me via e-mail or fax (276-889-2105) by Tuesday, August 14, 2007. In an effort to maintain anonymity and confidentiality, I will not report results by individual districts, but rather report by SWCD Areas. Although I must keep track of individual SWCD response rates, I assure you those individuals who submitted data will not be identified nor will the employee turnover rates for individual districts be reported. Should you or members of your Board have questions or concerns about this survey or my research project, please do not hesitate to contact me via e-mail or telephone. I hope that the information I collect and analyze over the next eight months will be used to benefit all 47 SWCDs and their dedicated employees. Thanks in advance for your participation! Sincerely, Angie --- Angela P. White, District Manager Clinch Valley Soil and Water Conservation District Phone #: 276-889-4650, Ext. 127 Fax #: 276-889-2105 [email protected]
113

Appendix D: Virginia Soil and Water Conservation District (SWCD)
Employee Turnover Survey, August 2007 Follow-up Correspondence E-Mail
FROM: White, Angela – Lebanon, VA DATE: Monday, August 13, 2007 10:57 AM TO: [email protected]: Reminder of VA SWCD Employee Turnover Survey Deadline – Tuesday August 14, 2007 ATTACHMENTS: Virginia SWCD Survey_Employee Turnover 2007.doc District Managers and Administrators, First, let me thank the 28 SWCDs that have responded to my electronic survey. I appreciate the time and effort you took to complete the survey. I just wanted to send a reminder to those districts that have not had an opportunity to complete and return the survey that the deadline is tomorrow – Tuesday, August 14th. If possible, please complete the survey and return to me by that deadline. A high response rate will make the data collected more useful. Thanks again, Angie --- Angela P. White, District Manager Clinch Valley Soil & Water Conservation District Phone #: 276-889-4650, Ext. 127 Fax #: 276-889-2105 [email protected]
114

Appendix E: Virginia Soil and Water Conservation (SWCD) Employee Satisfaction Survey – Modified Version of 2002 SWCD
Employee Satisfaction Survey
Part II – Virginia Soil and Water Conservation District (SWCD) Employee Satisfaction Survey
Modified Version of 2002 SWCD Employee Evaluation originally authorized by VASWCD
1. Rate each of the issues listed below in terms of your satisfaction. Please be advised that the
scale designed for this survey is not the same as the previous survey.
Ask yourself: How satisfied am I with this job issue? Very Dissatisfied: Means I am very dissatisfied with this job issue. Dissatisfied: Means I am dissatisfied with this job issue. Satisfied: Means I am satisfied with this job issue. Very Satisfied: Means I am very satisfied with this job issue. Extremely Satisfied: Means I am extremely satisfied with this job issue. Not Applicable: Means this particular job issue does not apply to me.
Issue Level of Satisfaction
Very Dissatisfied
Dissatisfied Satisfied Very Satisfied
Extremely Satisfied
Not Applicable
a. Career advancement opportunities 1 2 3 4 5 0 b. Clearly defined job responsibilities and work goals
1 2 3 4 5 0
c. Flexibility with professional scheduling 1 2 3 4 5 0 d. Health insurance benefit 1 2 3 4 5 0 e. Life insurance benefit 1 2 3 4 5 0 f. Management and supervision 1 2 3 4 5 0 g. Orientation when I was a new employee 1 2 3 4 5 0 h. Professional development (e.g., training, skill enhancement opportunities)
1 2 3 4 5 0
i. Relationship with district board 1 2 3 4 5 0 j. Salary or wage 1 2 3 4 5 0 k. Type of work performed 1 2 3 4 5 0 l. Work relationships (e.g., professional associates, clients)
1 2 3 4 5 0
2. Overall, how would you rate your current satisfaction as a Soil and Water Conservation
District employee: Very
Dissatisfied Dissatisfied Satisfied Very
Satisfied Extremely Satisfied
1 2 3 4 5 3. Do you have any other comments or suggestions that you feel are important to employee job
satisfaction? Please use the space provided to share those comments or suggestions.
115

Appendix F: Virginia Soil and Water Conservation District (SWCD) Employee Characteristics Survey
Part III – Virginia Soil and Water Conservation District (SWCD) Employee Characteristics Survey 1. Gender: Male _______ Female _______ 2. Birth Year: _____ 3a. Ethnicity: (Select one.) Hispanic _______ Non-Hispanic _______ 3b. Race: (Select one or more.) American Indian or Alaska Native _______ Asian _______ Black/African American _______ Native Hawaiian or Other Pacific Islander _______ White _______ 4. Marital Status Single _______ Married _______ Separated _______ Divorced _______ Widowed _______ 5. Number of children 18 and under living in the home. _______ 6. What is the highest educational degree you have received? High school diploma or GED _______ Associate’s Degree _______ Bachelor’s Degree _______ Master’s Degree _______ Doctoral Degree _______ 7. In which Virginia Soil and Water Conservation District (SWCD) Area do you work?
Area I (Headwaters, Lord Fairfax, Mountain, Mountain Castles, Natural Bridge, Shenandoah Valley) _______ Area II (Culpeper, John Marshall, Loudoun, Northern Virginia, Prince William, Thomas Jefferson) _______
Area III (Colonial, Hanover-Caroline, Henricopolis, James River, Monacan, Northern Neck, Tidewater, Three Rivers, Tri-County/City) __________
Area IV (Big Sandy, Big Walker, Clinch Valley, Daniel Boone, Evergreen, Holston River, Lonesome Pine, New River, Skyline, Scott
County, Tazewell) _______ Area V (Blue Ridge, Halifax, Lake Country, Patrick, Peaks of Otter, Peter Francisco, Piedmont, Pittsylvania, Robert E. Lee, Southside) _______ Area VI (Appomattox River, Chowan Basin, Eastern Shore, Peanut, Virginia Dare) _______
116
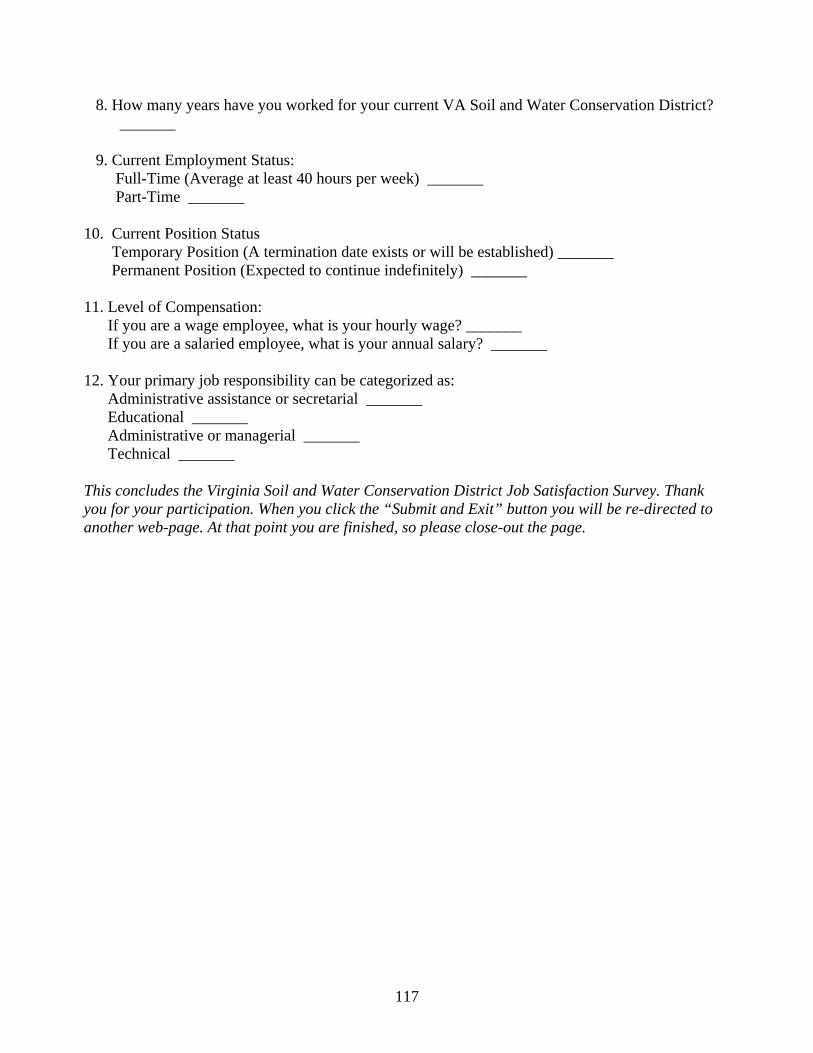
8. How many years have you worked for your current VA Soil and Water Conservation District? _______
9. Current Employment Status: Full-Time (Average at least 40 hours per week) _______ Part-Time _______
10. Current Position Status Temporary Position (A termination date exists or will be established) _______ Permanent Position (Expected to continue indefinitely) _______ 11. Level of Compensation: If you are a wage employee, what is your hourly wage? _______ If you are a salaried employee, what is your annual salary? _______ 12. Your primary job responsibility can be categorized as: Administrative assistance or secretarial _______ Educational _______ Administrative or managerial _______ Technical _______ This concludes the Virginia Soil and Water Conservation District Job Satisfaction Survey. Thank you for your participation. When you click the “Submit and Exit” button you will be re-directed to another web-page. At that point you are finished, so please close-out the page.
117

Appendix G: Internal Review Board (IRB) Approval
118

Appendix H: Minnesota Satisfaction Questionnaire (MSQ) Short-form – Scale and Corresponding Questions
Intrinsic satisfaction scale………………………….Question 1, 2, 3, 4, 7, 8, 9, 10, 11, 15, 16, 20 Extrinsic satisfaction scale…………………………..Question 5, 6, 12, 13, 14, 19 General satisfaction scale……………….Question 1, 2, 3, 4, 5, 6, 7, 8, 9, 10, 11, 12, 13, 14, 15, 16, 17, 18, 19, 20
119

Appendix I: Minnesota Satisfaction Questionnaire (MSQ) Permission
120

Appendix J: Virginia Soil and Water Conservation District (SWCD) Employee Satisfaction Survey – Modified Version of 2002 SWCD Employee Evaluation
VASWCD Permission
ngela P. White oad
E: SUPPORT OF RESEARCH AND PERMISSION TO UTILIZE MODIFIED
ear Ms. White:
he purpose of this letter is to acknowledge that the VA Association of Soil and Water
SWCD
is my understanding that data collection will take place during FY 2007-2008. I am
l
incerely,
August 23, 2007
Virginia Association of Soil and Water
7308 Hanover ille, VA 23111 Conservation Districts
Green Drive, MechanicsvTelephone No. (804) 559-0324 Fax (804) 559-0325
A2778 Mountain RCedar Bluff, VA 24609 R VERSION OF 2002 SWCD EMPLOYEE EVALUATION SURVEY D TConservation Districts (VASWCD) supports your research project in which you will be assessing the current job satisfaction levels of VA SWCD employees. The VA Association also grants you permission to utilize a modified version of the 2002Employee Evaluation Survey that was authorized by VASWCD and administered with assistance from Dr. Franklin “Lex” Bruce, Jr., Virginia Tech. Italso aware that your survey instrument will be distributed to all employees via the “all-district” list-serve. Immediately prior to distribution of the survey, I will notify all potentiaparticipants of the Association’s support of your research. S
Ricky Rash, President VASWCD
121

Appendix K: Virginia Soil and Water Conservation District (SWCD)
Employee Satisfaction Survey – Modified Version of 2002 SWCD Employee Evaluation Bruce Permission
College of Agriculture and Life Sciences September 28, 2007 Dear Angela White: You have my permission to use a modified versioI designed. Please don’t hesitate to contact me if further infor Sincerely,
Franklin A. Bruce, Jr., Ph.D. Department of Agricultural and Applied Econom
12
Agricultural and Applied Economics (0401) 301-A Hutcheson Hall Virginia Tech Blacksburg, Virginia 24061 540/231-4441 Fax: 540/234-7417 E-mail: [email protected] Use-Value website: http://usevalue.agecon.vt.edu/
n of the 2002 VASWCD Employee Survey that
mation is needed.
ics
Invent the Future
V I R G I N I A P O L Y T E C H N I C I N S T I T U T E A N D S T A T E U N I V E R S I T Y A n e q u a l o p p o r t u n i t y , a f f i r m a t i v e a c t i o n i n s t i t u t i o n
2

Appendix L: Summary of Field Test Comments Documented and Corrected
T
echnical Difficulties Notify participants in the initial cor ith the Web-based survey link that
the username and the password assigned to access the survey are case sensitive. Pages are automatically reloaded after entering each Web page for the first time; however,
aware of this technical feature. Part III, Question 1: “Gender” selection is sub estion 2. Part III, Question 7: “Area” selection is subject to change when scrolling to Question 8.
-You” at the end of the surve directions on how to submit survey responses and exit the survey.
art I: Minnesota Satisfaction Questionnaire (MSQ) Short-Form
respondence e-mail w
data are not affected. Make participantsject to change when scrolling to Qu
Include a “Thank y. Provide clearer
P Third Bullet of Directions: Incomplete statement that needs clarified.
statements for each scale (very satisfied, satisfied, etc.), separate the word n with either a colon or dash.
and Water Conservation District (SWCD) Employee Satisfaction
In the descriptionfrom the definitio
art II: Virginia SoilP
Survey Formatting of scale descriptions should coincide with formatting utilized in Part I. In the directions, participants should be advised that the scale in Part II is different from the
rginia Soil and Water Conservation District (SWCD) Employee Characteristics
scale utilized in Part I. Part III: Vi
rvey Su Question 7: Define Virginia SWCD Areas for employees. Question 11: Insert space to accommodate more than 5 characters when reporting salary.
123

Appendix M: Virginia Soil and Water Conservation District (SWCD) Job Satisfaction Study – Prior Correspondence E-Mail
ATE: January 3, 2008
Survey
A f via e-mail to fill out a web-based uestionnaire for a research project being conducted by Angela White. As many of you
in VA and she is also completing graduate work through Virginia Tech.
em e characteristics of current employees and their levels of job atisfaction. One component of the study is directly related to an employee evaluation
D).
se is an important one. Data collected will be reviewed and utilized to benefit districts cross the Commonwealth. The VASWCD Board of Directors is aware and supportive
of this study. Each of you will be contacted by Angela in the near future. She will provide directions for the survey and an electronic link for you to access the survey via a secure web site administered by Virginia Tech. Thank you in advance for your cooperation. Sincerely,
FROM: Ricky Rash [[email protected]] DTO: [email protected] SUBJECT: Support for Virginia SWCD Employee Job Satisfaction
ew days from now you will receive a request qare aware, Angela is employed by Clinch Valley Soil and Water Conservation District Russell County, The primary focus of the study is Virginia Soil and Water Conservation District
ployees, specifically thssurvey authorized in 2002 by the Virginia Association of Soil and Water Conservation Districts (VASWC I am writing this e-mail in advance to encourage your participation in this study becauita
Ricky Rash President VASWCD Crewe, VA 434-645-1349
Virginia Association of Soil and Water Conservation Districts
7308 Hanover Green Drive, Mechanicsville, VA 23111 Telephone No. (804) 559-0324 Fax (804) 559-0325
124

Appen CD)
Job Satisfaction Study – Cover Correspondence E-Mail with Implied Consent
– Lebanon, DATE: January 7, 2008 TO: Individual VirginiSUBJECT: Information Regardi
rt from ervation District’s (VASWCD) Board of
, on j irginia SWCD employees. As you are aware, Ricky Rash, y study via e-mail on January 3, 2008. This study is
what factors nd/or conditions impact employee job satisfaction.
be
n results by individual employees or individual districts, but rather report
s
nuary 8, 2008 you will receive an e-mail from the Virginia Tech CAEEP. The e-
an average of 15
dix N: Virginia Soil and Water Conservation District (SW
FROM: White, Angela VA
a SWCD Employees ng Virginia SWCD Employee Job Satisfaction Survey
I have sent this e-mail to request your participation in a study I am conducting, with suppothe Virginia Association of Soil and Water ConsDirectors ob satisfaction of VVASWCD President notified you about mpart of an effort to learn not only an overall job satisfaction level for employees, but a Results from the survey will be presented to the VASWCD Board of Directors, SWCD Area Chairs, and all 47 district Chairs. It is my hope that the results will be utilized to benefit all SWCDs and their dedicated employees. Anonymity and confidentiality will be maintained. To guarantee both, a third party willutilized to collect the research data. The Virginia Tech Center for Assessment, Evaluation, and Educational Programming (CAEEP) is assisting with this process. I will not personally have access to information regarding who has responded and what those individual responses were. Iaddition, I will not report
y SWCD Areas. b This survey is voluntary; however, your participation would be greatly appreciated. Consent iimplied with a returned questionnaire.
n Tuesday, JaOmail will include survey instructions, a link to the Web-based survey, and your individual loginand related password, which are necessary to access the online survey.
he survey was pilot tested and tookT minutes to complete.
o show my appreciation for your participation the following incentives have been established. rovide an executive summary of the results of my survey to the VASWCD for
posting on their Web site. Second, each participant who responds by the deadline of Tuesday,
TFirst, I will p
January 22, 2008 will be entered in a random drawing for a prize of $100.
y questions or comments about this study, do not hesitate to contact me via the xperience any technical difficulties, such as
gin and/or password, please contact Eric Lichtenberger, Virginia Tech [email protected]
If you have ancontact information provided below. Should you equestions about your loCAEEP at elicht or (540) 231-2549.
125

Thank you in advance for helping with this important study. It is only with your generous support that
incerely,
. Whi er
hone #: 276-889-4650, Ext. 127
my research project can be successful.
S Angela P te, District ManagClinch Valley Soil and Water Conservation District Lebanon, VA 24266 [email protected]
126

Appendix O: Virginia Soil and Water Conservation District (SWCD) Job Satisfaction Study – Initial Correspondence E-Mail with Web-Based Survey Link
Virginia Tech Center for Assessment, Evaluation, and Educational Programs ATE: January 8, 2008
CD Employees ction Survey
elow is a direct link to the Virginia Soil and Water Conservation District (SWCD) Job Satisfaction Survey being conducted by Angela White, with support from the Virginia Association of SWCDs. As stated in previous e-mail correspondence from Angela, the Virginia Tech Center for Assessment, Evaluation, and Educational Programs (CAEEP) is assisting with research data collection. This survey is voluntary. Consent is implied with a returned questionnaire. Anonymity and confidentiality will be maintained. Angela will not have access to individual employee responses. Raw data will be destroyed immediately upon completion of the final report. To access the survey, simply click on the survey link. When prompted, enter your unique username and password (both are case sensitive), which have been assigned and featured below. Should you experience any technical difficulties please contact Eric Lichtenberger ([email protected]
FROM: DTO: Individual Virginia SWSUBJECT: Virginia SWCD Employee Job Satisfa Dear __________, B
), Virginia Tech CAEEP at (540) 231-2549. Thank you in advance for helping with this important study. It is only with your generous support that Angela’s research project can be successful. To get to the survey: 1.) Click on the following URL or copy and paste it into your web browser http://dce.vtdata.org:16080/fmi/iwp/cgi?-db=VASWCD%20Survey$-startsession To log in, use the following case sensitive username: __________ and case sensitive password: __________ Sincerely, Eric Lichtenberger, Ph.D. Assistant Director Center for Assessment, Evaluation, and Educational Programming Virginia Tech
127

Appendix P: Virginia Soil and Water Conservation District (SWCD) Job Satisfaction Study – Follow-up Correspondence E-Mail
FROM: Virginia Tech Center for Assessment, Evaluation, and Educational Programs DATE: January 15, 2008 (7 days after survey issued)
eminder
ion ort from
CD employees have been asked to participate in this research project.
rely like
ou, that we can understand what factors impact employee job satisfaction levels.
TO: Individual Virginia SWCD Employees SUBJECT: Virginia SWCD Employee Job Satisfaction Survey R Dear __________, Last Tuesday, an e-mail containing a direct link to the Virginia Soil and Water ConservatDistrict (SWCD) Job Satisfaction Survey, being conducted by Angela White, with suppthe Virginia Association of SWCDs, was sent to you. As you are aware the Virginia Tech Centerfor Assessment, Evaluation, and Educational Programs (CAEEP) is assisting with research data collection. All Virginia SW If you have already completed and returned the electronic survey, please accept our sincere thanks. However, if you have not returned your survey, please do so today. We are sincegrateful for your assistance because it is only with the cooperation of SWCD employees, y If you did not receive the e-mail with the survey link, or if it has been discarded, please contact us at the Virginia CAEEP via e-mail ([email protected]) or telephone at (540) 231-25will promptly send you another one.
49 and we
ic Lichtenberger, Ph.D.
irginia Tech
Sincerely, ErAssistant Director Center for Assessment, Evaluation, and Educational Programming V
128

Appendix Q: Virginia Soil and Water Conservation District (SWCD) Job il
ipation Request
mployees, but what factors and/or conditions impact employee job satisfaction. Results from the
he study is drawing to a close and our records indicate that you have not yet responded. Your
CD) employees.
is voluntary, and should you prefer not to respond that is fine. We want to assure you at anonymity and confidentiality will be maintained. To guarantee both, a third party (Virginia
t, Evaluation, and Educational Programs (CAEEP) has been utilized ch data. Angela White will not personally have access to information
ere. In addition, results will by individual employees or individual districts, but rather reported by SWCD
Areas. Your willingness to consider participating in the study is greatly appreciated. Thank you. Sincerely, Eric Lichtenberger, Ph.D. Assistant Director Center for Assessment, Evaluation, and Educational Programming Virginia Tech
Satisfaction Study – Non-Respondent Correspondence E-Ma FROM: Virginia Tech Center for Assessment, Evaluation, and Educational Programs DATE: January 23, 2008 TO: Individual Virginia SWCD Employees SUBJECT: Virginia SWCD Employee Job Satisfaction Survey Final Partic Dear __________, Three weeks ago you were sent several e-mails regarding an important research study being conducted by Angela White, with support from the Virginia Association of Soil and Water Conservation Districts (VASWCD). This study is part of an effort to learn not only an overall job satisfaction level for district estudy will be presented to the VASWCD Board of Directors, Soil and Water Conservation District (SWCD) Area Chairs, and all 47 SWCD Chairs with the hope they will be utilized to benefit all SWCDs and their dedicated employees. Tsurvey responses are important to the overall study. A high response rate ensures that the surveyresults and corresponding conclusions and recommendations are representative of Virginia Soil and Water Conservation District (SW This surveythTech Center for Assessmento collect the researregarding who has responded and what those individual responses wnot be reported
129

Appendix R ia SWCD
Employee Frequency Distributions by Aspect of Job
of job le title Level of satisfaction frequencies (n = 148)
: Minnesota Satisfaction Questionnaire (MSQ) Short-Form – Virgin
Aspect as reported by sca
Very Dissatisfied N Satisfied V
Dissatisfied
ery
Satisfied
68 Activity
1 8 13 57
Independence 1 2 7 74 64
84
33
19 32 43 49
44
Security 1 14 14 60 59
8
13
60
Company policies and practices 7 26 30 62 22
Compensation 8 40 27 59 13
Advancement 17 41 38 48 4
1 10 8 89 40
0 7 14 85 39
Working Conditions 8 20 71 46
Co-Workers 6 14 14 62 52
Variety 0 5 3 56
Social status 0 5 37 72
Supervision – human relations 5
Supervision – technical 4 15 25 60
Moral values 0 4 6 67 71
Social services
0 3 6 61 7
Authority 0 5 90 40
Ability utilization 1 7 7 73
Responsibility
Creativity
3
130

Recognition 1 15 32 75 25
Achievement 78 47 1 8 14
131

Appendix S: Modified 2002 Virginia Associat of Soil an ater C erva DistrictEmployee Evaluation - Virginia SWCD Employees’ Satisfaction Frequency Distributions
by Issue
Job satisfaction issue Level of satisfaction frequencies (n = 146)
ion d W ons tion s
Very
Dissatisfied
Dissatisfied Satisfied Very
Satisfied
Extremely
Satisfied
Not
Applicable
Career advancement opportunities
15 43 64 5 1 18
Clearly defined job responsibilities and work goals
5 18 87 28 7 1
Flexibility with professional scheduling
1 4 60 49 29 3
Health insurance benefit
9 18 38 34 22 25
Life insurance benefit
6 16 57 17 13 36
Management and supervision
5 20 65 39 14 3
New employee orientation
13 26 72 23 6 6
Professional development
3 12 80 42 9 0
Relationship with district board
1 15 57 49 23 1
Salary or wage
10 47 66 18 3 1
Type of work performed
0 4 76 49 17 0
Work relationships
3 7 61 50 22 3
132

Appendix T: Modified 2002 Virginia Association of Soil and Water Conservation Districts Employee Evaluation - Virginia SWCD Employees’ Overall Job Satisfaction Frequency
Distributions
atisfaction
Overall job
s
Level of satisfaction (n = 145)
Very
Dissatisfied
Dissatisfied Satisfied
Sat ed
E
Sat ed Applicable
Very
isfi
xtremely
isfi
Not
Frequency 0 14 65 55 11 0
Percentage 0 9.65 44.83 37.93 7.59 0
133

Appendix U: Virginia Soil and Water Conservation District (SWCD) Employee Comments 1. Expect privacy of my work space, email password, etc. Some things disappear and show
up later. I don't invade their area unless I am asked to do something for them with their sion. Some important m call-which was
important). I strive to write down messages for fellow workers. 2. Can't we all just get along? 3. Directors need to take more of a role in management and supervision responsibility in
this district. In this hairman who has been the c in icstarted is controlling and manipulates things to how he wants things, not what is best for
strict or the comm ity we serv e direc are tak advantag situationsin order to benefit themselves or family members. Directors need to read, listen, and
s things more instead of just voting on thin onth ings a the annuameeting. Directors and staff need to have ethics training. All staff members need to be more responsible and have better work ethics.
4. Too many people to get the job done. If less people, then people could work and not be
disturbed by the ones that don't. 5. Responsibilities are not given to employees. There seems to be an atmosphere that
TMDL (Total Maximum Daily Load) is taking opportunities away from districts/NRCS/FSA. TMDL seems could benefit from independent contracts, with qualified people working out of their homes or independent offices.
6. I feel there is a glass ceiling for some district employees. Once an employee does a good
jog continually, they often receive a “MEETS EXPECTATIONS" rating on Job Performance Evaluations. It becomes difficult for an employee who has been with the SWCD for a long period of time to exceed the SWCD directors’ expectations because of the sustained high level of “getting things done” and they feel it becomes the norm for the employee. There have been times when a decision was made by staff to postpone a project the directors wanted done because of extenuating circumstances and then it was mentioned in their annual evaluation for making a decision which actually would have saved the SWCD money had the office closed.
7. I feel that every employee should be judged fairly on their work performance and
rewarded or reprimanded accordingly. This policy is in place but sometimes abused for various reasons.
8. Lack of funding for SWCDs always remains an issue. Funding is always uncertain and
varies from time to time. 9. Directors need to be held accountable for their responsibilities, since they are elected
officials.
permis essages were never given to me (i.e. doctor
district the c hairman s ce the distr t
the di un e. Som tors ing e of
discus gs at m ly meet nd at l
134

10. I think the previous question (overall satisfaction) is unfair. To characterize my level of satisfaction overall will not represent the facts. For instance, I am very dissatisfied with
dule, working conditions, etc.
1. Less inside, more outside; less paper, more face-to-face; less NRCS computer
12. 13.
4. Board members should be more active in employee job skills and roles. They need to be
nagement role to oversee day to day operations and be
able to report to the board with an unbiased opinion. DCR should have a more active role
15. 6. I am a relatively long term employee who has the benefit of a very good and strong board
elatively e.
ere
n
18. of work with only average salary. Very concerned about no health care
provision after retirement.
19. d salary even though it is still below comparable work at other agencies. This district has a good health and benefits package through the county. One
ou our career to the district, upon retirement you have to find private insurance at
a time when you have given up your income and have more health problems. State
those on my Board who have no vision which restricts my ability to be proactive. I am very dissatisfied that I am compensated based upon the performance (or lack there of) ofState employees. I am very dissatisfied that many on my Board have no idea what the district does. However, I am very satisfied with my flexible sche
1
programs/requirements/reporting/specifications/designs/policies/forms/CYA red tape
More specific orientation when on the job as a new employee.
Districts are not viewed as go-to professionals when in fact they have a lot to offer. Uneven funding and employee turnover have contributed greatly to this problem. The State should take bigger role in training and professionalism.
1able to address adversity and not overlook things on the chance it will go away. Someonein each district should have a ma
in district personnel guidance and policy.
Retirement and insurance benefits for part time employees.
1of directors who I truly believe appreciate my work and opinions. One less than five minutes ago thanked me for all the work I do. The good work environment in a rlow stress job that is related to agriculture, where I have spent my life, is important to mGenerally District pay levels need improvement across the board and districts need to stop looking at the positions as entry level work. It takes a good two years to learn the work and good employees come and move on in less than two years. I like to work hin spite of the lower pay. On the other hand what I get in benefits and time off goes a good way toward offsetting the low pay. My district has and supports a good benefit plafor the employees.
17. Job security with see-saw state funding is my biggest worry.
Extreme amount
This district provides a goo
issue of concern is that upon retirement there is no way to buy into the health plan. If ydedicate y
135

employees and some private companies have the option to remain with their plan and payfor it out of pocket, which is still lower than a private provider. Looking ahead, retirement planning is the one issue that makes moving to another agency an attractive option despite being satisfied with district employment.
Directors need continuing education and accountability for attendance and engaDistricts have incr
20. gement.
edible, unrealized potential for applying for grants, undertaking projects. Relationships with partners are precious, and need structured support at all
1. Health Insurance is very important. As district employees become older (even the young
ssociation should look into getting district employees onto the State health plan. This would make better use of
2. I am extremely satisfied with my job. The only dissatisfaction that I get is in the
ement within my district. Unless I am willing to transfer to NRCS, which I would prefer not to do, there is little I
24.
5. Better supervision, better management
6. Wish salary was better and maybe more Training on the Cost-Share programs that we are
7. I know that within the administrative area, there is not much advancement or big wage
28.
ion of
levels.
2ones), health Insurance becomes more and more important. The A
state funding and be better than the variety of group plans and individual polices thatdistricts’ carry.
2instability of the funding for my position. I am extremely satisfied with my board's support of Conservation Education, but without funding we are often on edge making sure we can keep this important position in our district. I ranked "new employee orientation" as "Very Dissatisfied" only because I never received a new employee orientation.
23. I feel as though there are little to no opportunities for advanc
can do to advance professionally and economically. Also, there was little formal training for me as a new employee. Although I feel as if I have learned much, (although not NEARLY what I feel I NEED to know) the transition to this position would have been much easier for me if there had been some formal training available. I do love my job though. The satisfaction of knowing I am helping farmers, the environment, and my community is wonderful.
Our district manager has a hands-off approach. If help is needed, it is readily given. Everyone in our office is enthusiastic and supportive. It is a great place to work.
2 2
trying to sell overall I really like my job.
2increases.
The relationship with NRCS needs to change from one of dictation to cooperation and partnership. We do not work for them anyway. The issue of salary needs to be addressed. Any raises that are received are be eclipsed by the cost of living. It becomes a quest
136

whether you can afford to work at a district not if you are satisfied with the work you are doing.
No potential for advancement. 29.
strict
r est of the staff. The directors have allowed this behavior to go on for so long that
they do not know how to stop it. I can retire at the drop of a hat or the next false
31.
ill t year. More commitment from Directors to attend Board meetings and
other related programs would also be a tremendous benefit from staff.
32. DCR
or s other state or federal organizations. Districts should not be considered as
children in the conservation partnership, we should be treated as equal partners in the
33.
ing
lso
ew districts as an equal partner and do not include us in decision making. This ultimately affects the way we have to follow procedures to get our
4. I feel I am satisfied with my position, I love my job. I would like to see salaries increase
orld. I feel that a high rate of district employee is due to salaries and costly benefits. I do understand what districts go through to keep
5. I am a contract employee and work under a grant which I wrote and am run through the
y job is strictly education for K-12 for the counties our district covers. I feel privileged to do what I do for the district and will be applying for another grant upon the
30. Our office operates as a flat line organization that was set up to satisfy one employee who
did not want to work well with others. To this date that employee violates all the dipolicies and the district board does nothing to stop this behavior. It is a morale breakefor the r
allegation that drives me to a lawsuit.
Stable funding for SWCD would benefit staff, districts and clients in allowing us to provide sustained levels of programs and services without having to worry if funding wbe available nex
The working relationship between the district and other agencies such as NRCS andis not what it should be. Often time’s district employees and I feel that NRCS and DCRtreats districts and their staff with a lower level of professional respect. District employees feel we are not treated with the same level of respect or the same caliberimportance a
conservation partnership.
If the USDA offices with which we work were more coordinated with each other and within their own programs, I would have an easier time getting any jobs done concernthem. NRCS in particular is very uncooperative in matters that concern producers with which we both work. They do not seem to realize that we all should be doing what is inthe best interest of the producer and not what's best for the agency and its programs. AUSDA does not seem to vi
jobs for the producers done.
3for district employees in this cost-risen w
funding.
3district. As such I have no health benefits or life insurance; however, I set my own schedule. M
completion of this cycle. My only negative is that this is not a full time position with SWCD.
137

36. ation agencies in order to reduce the extremely high employee turnover rates
anted stepchild to DCR and NRCS. We are all suppose to do the same thing but district employees are paid the least, and sometimes District
38.
d ideas;
s
40. on'ts, job
situations, and scenarios. Also a clearly defined training schedule.
41. 42. 43. of retirement benefits or life insurance. Not enough room for
advancement and because of never knowing how much money is available for technical t
44. so
5. I believe guidelines or mandates should be slashed state-wide for Conservation District
46. s and deadlines are often hard to manage and this is a constant source of stress
in the position and is really the only reason I have considered leaving the district. It's
oad
47. ently happy with my salary, though it is on the lower end.
Overall SWCDs need to look closely at bringing pay rates more inline with other conserv
37. Seems like districts are the unw
employees have more duties and responsibilities.
Management accessibility for decision making; Good communication, especially management/staff e.g., regular staff meetings, updates; Advance notice of schedules and absences; No favoritism--keep it professional; Acknowledgment of good work anMerit increases
39. Would like to know how district employees can be included in State Benefits, such a
health insurance and state park perks?
Yearly orientation for new employees, state-wide, to go over Dos and D
Being able to get along with cooperating agencies is a plus.
Training; good communication with Board members and partnering agencies.
There has been no mention
assistance we don't have job security. This along with poor salary ranges causes districemployees to leave after getting trained. I feel the district board members should be more active and attend activities with the district to some support and that they are aware of what is going on in their counties.
There is little opportunity for advancement within a district and that is why we losemany people to NRCS. Funding uncertainty from year to year causes anxiety.
4Directors concerning employee compensation. I also would like to see a position established to help mediate between employees and District Boards.
Workload
often challenging to delegate responsibilities to other employees that may not be receiving as much financial compensation as I do so I feel I must manage the workland earn a lot of comp time--working late and weekends as needed. My personal life/family/hobbies and ultimately my personal health suffer from the constant stress.
I am curr
138

48. I enjoy collaboration with other agencies. 9. Unfortunately, because of the "structure" of Conservation Districts, the job often lends
es, ve to be self starters and task oriented
in order for districts to run smoothly and efficiently. This in itself creates situations where pes of
0. Regulation, paperwork, and bureaucracy keep actual gains to a minimum. Performance is
t l bureaucrats to district management. You have
taken many young driven students who thought they could make a difference even when tters to
conditions, the ones that do, do it in spite of the system.
1. I believe that employees and boards should have a similar outlook in the conservation r budget .
. . a bit more security for employees’ salary, and the ability for the district to provide health care as a benefit. Workload is also a stress for employees as well as the board. Our
2. Better benefit package for employees. Health insurance would be helpful. More and more
nge. ments for certain
staff personnel because they may or may not like that person, event if that person is
54. nal
rd
keeping employees.
4itself to problems and concerns that are hard to work out. In general without a day to day supervisor, Conservation Districts can run into problems with policies and procedurpersonnel issues, and the like. District employees ha
problems arise. Also every district is different, they all are made up of different typeople-Directors and Employees and each (district) has their own way of operating and conducting business.
5based on money spent and paper work generated, not gains in water quality; this thoughprocess has moved from just upper leve
not making much money and taken away their ingenuity and given them cookie cuwork with. Most driven employees don’t last long under the present
5
arena for there to be a harmonious relationship. There will always be stress ove
workload is quite high and we often feel like the work is our whole life rather than a career. Thus the answer to the first question relating to time . . . there is always too muchto do. In general I am very satisfied with my position with the district . . . the Board allows us the freedom to do the work needed and also to find the area that we excel in and develop there.
5duties are assigned to district staff with not enough present staff to accomplish the goal,so the responsibilities add up on present staff making added level of stress.
53. Board members need to keep abreast of policies and procedures in order to make
decisions. Each staff person should be given the same raises within a reasonable raBoard members should not be allowed to create hostile work environ
dedicated, hard-working, and does his/her job in a professional manner.
Overall direction and supervision support given by the Board is inadequate. Persorelationships between staff members and board members can cause problems in the office, such as division and distrust. I don't see a fix to this problem and if our Boarepresents the management of most districts, then I can see why many have difficulty
139

55. District board should treat all employees equally. Board of directors should act decisively without hesitation. Specifically, when a matter has been voted on and seconded, no
56. nities should be offered more often, ex: prescribed burning
training. Some training requirements should be reviewed as far as # of years required for
57. 8. I think there is constant worry about affordable health insurance. Can VASWCD create a
be
en o
arding office space, computer access to the point of "crippling" a CD. Rent increased substantially this year and we are hearing a rumor that computer
eir numbers.
This is very crippling, and limiting. CDs have such magnanimous opportunities in their
n
ot ehind the eight
ball on because of lack of funding and financial staff support. Also, we seem to receive
on to to ve
lready overtaxed with work and under-funded in operational areas (staffing). A way to "control" districts? Not sure...CDs need a stronger, unified voice. And we need to be free of the fear we currently must respect because of our "reliance" on
going back to appease a dissatisfied employee. Careers and life have ups and downs, as adults we should graciously accept criticism, readjust our behavior and move on. Grudgesare petty and a waste of time. The attitude of “I’ve been doing this the same way for thelast X years and I won’t change,” is archaic and should totally be disregarded. As SWCD employees we are a team. Often one employee begins to be “I” oriented rather than “TEAM” oriented and everyone suffers. One bad apple spoils the bunch.
Some training opportu
certification - ex. Nutrient Management Training Certification requires 3 Years Experience and many employees taking this training are only in the SWCD in a 2-year position. Why take the training if you can't be certified? And why should the district payfor the training if you can't be certified?
We need more active Board members who have been trained for their position.
5"group" for insurance purposes and get us all a more reasonable rate on health, life, dental, etc.? This would be a very valuable reason to be part of VASWCD. There seems to be no training for new managers, or ongoing training for managers. Updated info onpersonnel management, legal issues, board management, PR ideas, etc. I worked for a CD in another state and an overview of Virginia and the programs and participants wouldVERY helpful too. Training form and/or hard copy reference manual form. A training on the cost-share program for "infants" in the program would be welcome, from the Gresheet up... The relationship with NRCS is important to maintain. However, CDs seem tbe put on the spot reg
access will become prohibitively expensive. CDs should be treated as independent entities, not state or federal, but a hybrid. We are much more useful in this capacity. Toomany people/agencies seem to want to "own" districts, their programs and th
communities! We are supposed to be at the grass roots level, working within communities, not viewed as part of the overwhelming, impersonal federal system or evestate system. State and federal programs have a greater chance of reaching folks at the local level through a grass roots organization that is seen as part of the community, npart of the government. And urbanization is an issue that many CDs are b
monies to "put BMPs on the ground" but staffing is limited. There is never an increasefor sustainable staffing to expand programming. It is difficult to hire a part-time persassist with BMP implementation when there is no stability in the job. The time it takestrain a part-time person takes almost as long as the money lasts. This is not cost effectifor districts that are a
140

other entities. We need to be able to expand our own programming according to what our locales need. We all have issues we share and issues that are unique to the areas, peoand governments we serve! Thanks for this opportunity! I sure hope there are changes brought about by the solicited comments.
Raises are given “across the board” so that less performing employees are “rewarded” for slacking. There’s no incentive to do a better job.
ple
59.
0. Flexibility is the best aspect of working for my district. Compared to our closest partners
its, etc.
61. 2. I feel like there is not enough training for my position. Seems like there is a lot to do and
specific program, etc.
6(NRCS) we do way more field work, paper work, and are paid way less, less benefOver come those hurdles and districts could have a better chance at keeping competent and capable employees.
Professionalism and work ethic is very comforting and appreciated in this district office.
6sometimes I am spinning my wheels because I haven't been taught how to use a
141