
RUNNING HEAD: DEVELOPMENT OF THE EBBINGHAUS ILLUSION...
44
1 RUNNING HEAD: DEVELOPMENT OF THE EBBINGHAUS ILLUSION IN WESTERN AND REMOTE CULTURES The ontogeny of visual context effects: Tracing effects of culture and the urban environment on the development of the Ebbinghaus illusion in British and Namibian observers Andrew J. Bremner 1 , Martin Doherty 2 , Serge Caparos 3 , Jan de Fockert 1 , Karina J. Linnell 1 , & Jules Davidoff 1 1 Department of Psychology, Goldsmiths, University of London 2 School of Psychology, University of East Anglia 3 Département de Psychologie, Université du Québec à Trois-Rivières ACCEPTED: CHILD DEVELOPMENT (10 AUGUST 2015) THIS IS A PRE-PRINT (I.E. PRE-REVIEW) VERSION OF THE ACCEPTED MANUSCRIPT ABSTRACT WORD COUNT: 120; WORD COUNT: 10,457 KEYWORDS: VISUAL ILLUSIONS, CROSS-CULTURAL DIFFERENCES, SIZE CONTRAST EFFECTS, EBBINGHAUS ILLUSION, TITCHENER’S CIRCLES, CORRESPONDENCE TO: Dr Andrew J. Bremner, Department of Psychology, Goldsmiths, University of London, New Cross, London, SE14 6NW, U.K.; Tel: +44 (0) 20 7078 5142; Fax: +44 (0) 20 7919 7873; email: [email protected]. ACKNOWLEDGEMENTS: This research was supported by awards from the Economic and Social Research Council UK (Grant No. 2558227) to JD, JdF, KJL, and AJB, and the European Research Council under the European Community's Seventh Framework Programme (FP7/2007-2013) (ERC Grant agreement no. 241242) to AJB. The authors would like to thank all of the participants who took part in Namibia and the UK, including the children and teachers of All Saints RC Comprehensive School, Sheffield, and also our translators and guides in Namibia, John and Kemuu Jakurama.
Transcript of RUNNING HEAD: DEVELOPMENT OF THE EBBINGHAUS ILLUSION...

1
RUNNING HEAD: DEVELOPMENT OF THE EBBINGHAUS ILLUSION IN WESTERN AND
REMOTE CULTURES
The ontogeny of visual context effects: Tracing effects of culture and the urban environment on the
development of the Ebbinghaus illusion in British and Namibian observers
Andrew J. Bremner1, Martin Doherty2, Serge Caparos3, Jan de Fockert1, Karina J. Linnell1, & Jules
Davidoff1
1Department of Psychology, Goldsmiths, University of London
2School of Psychology, University of East Anglia
3Département de Psychologie, Université du Québec à Trois-Rivières
ACCEPTED: CHILD DEVELOPMENT (10 AUGUST 2015)
THIS IS A PRE-PRINT (I.E. PRE-REVIEW) VERSION OF THE ACCEPTED MANUSCRIPT
ABSTRACT WORD COUNT: 120; WORD COUNT: 10,457
KEYWORDS: VISUAL ILLUSIONS, CROSS-CULTURAL DIFFERENCES, SIZE CONTRAST
EFFECTS, EBBINGHAUS ILLUSION, TITCHENER’S CIRCLES,
CORRESPONDENCE TO: Dr Andrew J. Bremner, Department of Psychology, Goldsmiths, University of
London, New Cross, London, SE14 6NW, U.K.; Tel: +44 (0) 20 7078 5142; Fax: +44 (0) 20 7919 7873;
email: [email protected].
ACKNOWLEDGEMENTS: This research was supported by awards from the Economic and Social
Research Council UK (Grant No. 2558227) to JD, JdF, KJL, and AJB, and the European Research Council
under the European Community's Seventh Framework Programme (FP7/2007-2013) (ERC Grant agreement
no. 241242) to AJB. The authors would like to thank all of the participants who took part in Namibia and the
UK, including the children and teachers of All Saints RC Comprehensive School, Sheffield, and also our
translators and guides in Namibia, John and Kemuu Jakurama.

2
ABSTRACT
We investigated the development of visual context effects in the Ebbinghaus illusion across UK people and
the Himba of Namibia who are remote from Western cultural influence. Traditional Himba showed no
illusion up until 9-10 years, whereas UK children show a robust illusion from 7- to 8-years of age. Greater
illusion in UK than traditional Himba children was stable from 9-10 years to adulthood. We also examined
the Ebbinghaus illusion in Namibian children growing up in the nearest urban conurbation to the traditional
Himba villages, finding a sustained influence of the urban environment across childhood and adulthood. We
conclude that cross-cultural differences in perceptual biases to process visual context emerge in early
childhood and are influenced by the urban environment.
3
Many cross-cultural studies now show that perceptual phenomena, often assumed to be basic human
endowments, vary from culture to culture (e.g., Bremner, Caparos, Davidoff, De Fockert, Linnell & Spence,
2013; Davidoff, 2001; De Fockert, Davidoff, Fagot & Goldstein, 2007; Deregowski, 189; Doherty, Tsuji &
Phillips, 2008; Miyamoto, Nisbett & Masuda, 2006; Nisbett, Peng, Choi & Norenzayan, 2001; Rivers,
1905). Such findings do not just challenge the widely-held assumption that research studies involving solely
Western educated participants are representative of perceptual (and psychological) processes the world over
(see Henrich, Heine & Norenzayan, 2010). They also provide insight into the ontogeny of perceptual
functioning. In that sense, cross-cultural comparisons share some of the aims of developmental research.
However, whereas cross-cultural studies illustrate the environmental context which gives rise to
particular phenotypes, developmental studies, by delineating the developmental trajectories by which
phenotypes unfold, provide clues to the ways in which inheritance, biology, environment and physical
constraints interact to give rise to a given phenotype (Mareschal, Johnson, Sirois, Spratling, Thomas &
Westermann, 2007). Here we report the findings of three experiments which combine the strengths of cross-
cultural and developmental methods to shed light on the emergence of visual context effects in childhood
and adolescence (cf. Franklin, Clifford, Williamson & Davies, 2005; Roberson, Davidoff, Davies & Shapiro,
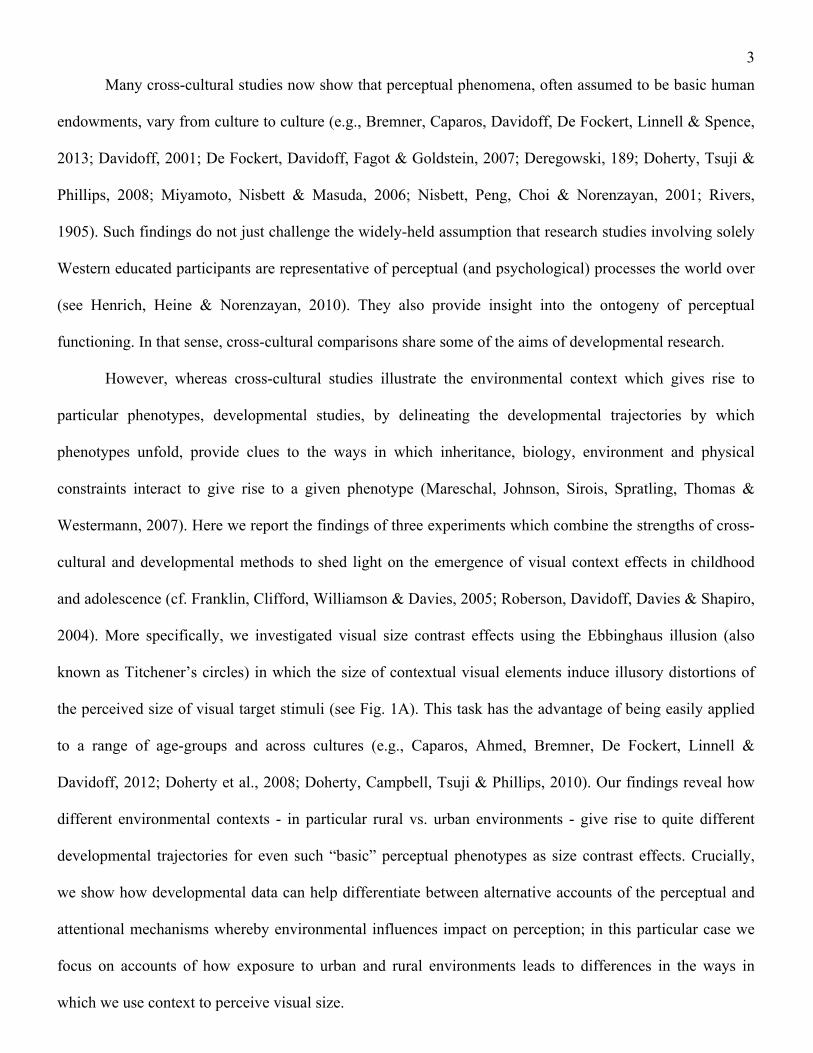
2004). More specifically, we investigated visual size contrast effects using the Ebbinghaus illusion (also
known as Titchener’s circles) in which the size of contextual visual elements induce illusory distortions of
the perceived size of visual target stimuli (see Fig. 1A). This task has the advantage of being easily applied
to a range of age-groups and across cultures (e.g., Caparos, Ahmed, Bremner, De Fockert, Linnell &
Davidoff, 2012; Doherty et al., 2008; Doherty, Campbell, Tsuji & Phillips, 2010). Our findings reveal how
different environmental contexts - in particular rural vs. urban environments - give rise to quite different
developmental trajectories for even such “basic” perceptual phenotypes as size contrast effects. Crucially,
we show how developmental data can help differentiate between alternative accounts of the perceptual and
attentional mechanisms whereby environmental influences impact on perception; in this particular case we
focus on accounts of how exposure to urban and rural environments leads to differences in the ways in
which we use context to perceive visual size.

4
Effects of context are often considered to be a fundamental aspect of visual processing and cognitive
systems more widely in humans (Phillips & Singer, 1997). Furthermore, certain illusory effects of context
have been argued to be universal and informationally encapsulated aspects of visual processing, not
susceptible to effects of experience over development and learning (Fodor, 1983; see McCauley & Henrich,
2006). Observations of cross-cultural, individual and developmental differences in the effects of visual
context (e.g., Caparos et al., 2012; Doherty et al., 2010; Schwarzkopf, Song & Rees, 2011) are particularly
noteworthy in this light. In particular, a large body of findings shows that East Asian observers are more
likely than Western observers to give priority to contextual information in a variety of tasks including object
categorisation (Norenzayan, Smith, Kim & Nisbett, 2002), change detection (Miyamoto et al., 2006) and
size judgements (Doherty et al., 2008; Kitayama, Duffy, Kawamura & Larsen, 2003).
A range of accounts of these kinds of cross-cultural differences have been offered. Nisbett et al.
(2001; see also Varnum, Grossman, Kitayama & Nisbett, 2010) have argued that cross-cultural variations in
the use of context are due to differences in the social structure in those cultures. More individualistic cultures
(e.g., Western cultures) are argued, through their sociocultural inheritance, to promote “analytic” processing
of the details in visual patterns, whereas more collectivist cultures (e.g., East Asian cultures) promote
“holistic” processing of continuities and relationships. Another class of explanations, not necessarily
incompatible with those appealing to social structure, has suggested that the physical environments which
different cultures inhabit lead them to prioritise context to different extents. Miyamoto et al. (2006) argue
that greater visual clutter in our physical environments (such as that found in urban vs. rural environments,
or in Japanese vs. U.S. cities) leads to a greater processing of context. Aside from clutter there are a great
many other aspects of the visual environment which could potentially drive differences in processing of
visual context. Inhabitants of towns and cities are much more likely to be exposed to pictures and other
printed materials (e.g., when looking at picture or when learning to read). Recent research shows that
learning to read enhances “holistic” visual processing (Szwed, Ventura, Querido, Cohen & Dehaene (2012).
Researchers (e.g., Deregowski, 1989; Doherty et al., 2010) have also argued that the extents to which
different cultures are exposed to different kinds of pictures shape perceptual tendencies. More specifically,
5
Doherty et al. (2010) argue that greater processing of context is required when viewing depictions of objects
in depth in order to resolve the conflict between pictorial cues to depth and primary depth cues specifying
the real depth of the picture and its markings (see Gregory, 1968). They propose that extended experience of
resolving this conflict might lead to differences in use of size contrast in the Ebbinghaus illusion.
Recent data from a population which is particularly remote from Western and East Asian cultural
influences (the Himba of Northern Namibia) promises to help distinguish between at least some of these
accounts. The Himba live in a traditional and distinctly uncluttered rural environment with few if any
pictures. However, Himba society promotes interdependent rather than independent behaviours (Gluckman,
1965), due to their villages being comprised of large family compounds. Thus, lesser processing of context
in this group relative to Western observers is predicted by the visual clutter and picture exposure accounts,
whereas similar, if not greater processing of context is predicted by Nisbett et al.’s (2001) social structure
account. De Fockert et al. (2007), and Caparos et al. (2012) have demonstrated that the Himba exhibit less
Ebbinghaus illusion and, correspondingly, greater accuracy at discriminating the real sizes of stimuli in this
task relative to UK and Japanese participants. This enhanced performance points to a relative neglect of the
(task-irrelevant) contextual elements which leads to the illusion in Westerners and Japanese participants.
These findings strengthen arguments that the urban environment (either through the visual clutter it presents
or through the exposure to pictures and printed materials which go along with urban living) may drive cross-
cultural differences in size contrast effects, and weaken arguments based on a role for social structure.
Indeed, Caparos et al. (2012) show that, among the Himba themselves, urbanisation is associated with the
degree of context processing. Himba who have moved to live in an urban environment show a greater
influence of context on visual processing than traditional Himba in the Ebbinghaus illusion and in a
hierarchical figure matching task.
As described above, our aim with these studies was to investigate the emergence of cross-cultural
differences in visual context effects to gain clues as to the underlying developmental processes which give
rise to such variations. We examined the development of size contrast effects in the Ebbinghaus illusion in
both UK and traditional Himba children. Before we outline alternative accounts of the development of
6
crosscultural differences in visual context effects (which the experiments reported here separate between) we
first review the literature on the development of the Ebbinghaus illusion. A number of studies have
examined the development of this illusion in early life in Western cultures. The majority report an increase
in the effect of context with age (Doherty et al., 2010; Duemmler, Franz, Jovanovic & Schwarzer, 2008;
Kaldy & Kovacs, 2003; Weintraub, 1979). One study by Hanisch, Konczak, and Dohle (2001) reports no
difference in the extent of the illusion between 5 to 12 years of age and adulthood. However, the absence of
a finding in Hanisch et al.’s study is explicable through their use of a “same/different” judgement task in
which differential response bias can mask differences in the strength of illusion between groups (Doherty et
al., 2010; Kaldy & Kovacs, 2003).
The extent of separation between targets and context elements has been shown to lead to local
contour interactions which influence processing of the size of the target in the Ebbinghaus illusion,
independently of size contrast effects (Haffenden, Schiff & Goodale, 2001). One advantage of Doherty et
al.’s (2010) study is that it provides a purer measure of size contrast effects by controlling for the potential
effects of such local contour interactions on the strength of the illusion; they did this by keeping the
separation between targets and context elements constant across conditions. Like Kaldy and Kovacs (2003)
they also employed a two alternative forced choice task (2AFC) to identify the larger of two targets, which,
because it does not require “same/different” (or “yes/no” responses), is typically less susceptible to response
biases in children. Doherty et al. (2010) found that across 4- to 10-year-old children, it is only from 6 years
of age that children begin to demonstrate a significant Ebbinghaus illusion, and that the illusion continues to
develop even beyond 10 years of age. Given the above advantages, we decided to employ the same task as
Doherty et al. (2010), in the current investigation. In Experiments 1 and 2 we investigate the developmental
trajectories of size contrast effects in the Ebbinghaus illusion across children from the UK and Himba
children. Our aim was to examine the developmental trajectories of size contrast effects between these
groups in order to determine at what point in development cross-cultural divergence arises in effects of
visual context. Such information provides clues to the origins of variations in visual context effects. We
focussed on two potential ways in which cross-cultural variations in the Ebbinghaus illusion (and context

7
perception more generally) might arise.
Variations in the Ebbinghaus illusion have traditionally been argued to arise from differences in the
extent to which we are perceptually biased (or have a perceptual style) to process context (Doherty et al.,
2008; Caparos et al., 2012; Happé, 1999; Phillips, Chapman & Berry, 2004). The cross-cultural variations in
the Ebbinghaus illusion observed between Himba and UK participants are certainly explicable in this way.
As well as showing less susceptibility to the Ebbinghaus illusion, the Himba also analyse and compare local
(featural) rather than global (configural) aspects of hierarchical (Navon) figures, suggesting a perceptual bias
away from contextual processing (Caparos et al., 2012; Davidoff, Fonteneau & Fagot, 2008). However, there
is at least one other explanation of cross-cultural variations in the Ebbinghaus illusion (and in context
processing more widely). In the Ebbinghaus illusion task, participants are asked to judge the sizes of the
central circles. The surrounding inducing elements are essentially distracting information to be ignored.
Thus, improved performance (and a greater neglect of context) in the Ebbinghaus illusion task can also be
explained by a greater ability to focus attention on the relevant information, and filter out irrelevant
information (De Fockert & Wu, 2009); what has been referred to as attentional filtering. This explanation of
variations in context effects is particularly pertinent given that there is now quite some evidence that the
Himba demonstrate an advantage compared to Westerners at selectively attending to task-relevant
information (Caparos, Linnell, De Fockert, Bremner & Davidoff, 2013; De Fockert, Caparos, Linnell &
Davidoff, 2011; Linnell, Caparos, De Fockert & Davidoff, 2013).
These perceptual bias and attentional filtering accounts make quite different predictions regarding
the development of cross-cultural differences in the Ebbinghaus illusion. There is good reason to presume
that variations (cross-cultural or otherwise) in perceptual bias to features vs. context (configural shapes)
could arise early in life. Biases to process particular kinds of visual patterns are evident early in the first year
of life (e.g., Bornstein, Ferdinandsen & Gross, 1981; Ghim & Eimas, 1988; LoBue, 2012). Visual context
appears to play a role in visual processing early in the first year (e.g., Bremner, Bryant & Mareschal, 2006;
Yamazaki, Otsuka, Kanazawa & Yamaguchi, 2010), and even 3-month-old infants appear to change their
processing of visual patterns from global to local aspects depending on duration of exposure (Colombo,
8
Mitchell, Coldren & Freeseman, 1991; Frick, Colombo & Allen, 2000). Furthermore, there is also evidence
that cross-cultural differences in perceptual biases emerge across the first year of life. Yoshida, Iversen,
Patel, Mazuka, Nito, Gervain, and Werker (2010), found that differences in grouping of auditory stimuli
between infants growing up in English-speaking and Japanese-speaking environments, although not apparent
at 5-6 months, were observable at 7-8 months.
In contrast to perceptual biases, an ability to filter out distracting information (attentional filtering)
has not been observed in infancy and continues to mature well beyond 10 years of age and into early
adulthood (Comalli, Wapner & Werner, 1962; Enns, Brodeur & Trick, 1998; Ridderinkhof & Van der Stelt,
2000; Rueda, Fan, McCandliss, Halperin, Gruber, Lercari & Posner, 2004; Waszak, Li & Hommel, 2010).
Thus, if cross-cultural differences in context processing in the Ebbinghaus illusion are driven by variations
in attentional filtering, we would predict a much more protracted divergence between Himba and UK
groups. Experiments 1 and 2 addressed this issue.
In Experiment 3 we examined in more detail the nature of the environmental factors which mediate
the emergence of cross-cultural differences in context effects in the Ebbinghaus illusion. Specifically, we
traced the development of the Ebbinghaus illusion in Namibian children who were growing up in an urban
environment near the Himba villages where we had tested the traditional Himba. Elements of the urban
environment (including, as discussed above, greater perceptual clutter, and increased exposure to pictures
and other printed matter) could quite plausibly drive both increases in perceptual bias towards context and/or
decreased ability to ignore task-irrelevant context. Many children across a range of ethnic groups including
the Himba now grow up in Opuwo, the only permanent town within easy reach of the traditional Himba
villages. By comparing the development of the Ebbinghaus illusion in traditional Himba and urban children
in Opuwo we can glean a relatively pure measure of the effect of an urban vs. rural environment on the
developmental unfolding of context effects in the Ebbinghaus illusion.
Experiment 1
In Experiment 1 we investigated the development of the Ebbinghaus illusion in children between 3
and 10 years of age, who were being brought up traditionally in a remote Himba village in Kaokoland in
9
Northern Namibia. We used the 2AFC Ebbinghaus task used by Phillips et al. (2004) and Doherty et al.
(2010) in their investigation of the development of the illusion in children living in the UK. This task
includes a control condition in which participants make size discriminations in the absence of the illusion
inducers. We compared the extent of the illusion set against baseline size discrimination performance in
traditional Himba children with an age-matched subset of the UK participants tested by Doherty et al.
(2010).
Methods
Participants. The Himba are semi-nomadic herders who have very limited contact with Western
culture and artifacts. The traditional Himba participants were recruited from two traditional villages in
Kaokoland. Fifty traditional Himba children participated (29 female, 21 male). None of the Himba
participants had ever been involved in experimental research. The Himba do not usually keep accurate birth
records and so we had to estimate the ages of the participants; this was achieved by asking the children’s
friends and parents how old they were, and by evaluating ages on the basis of physical similarity to children
whose ages were known. For the younger children we determined whether they were younger or older than 5
years of age by asking them to touch their ear with their contralateral hand over the top of the head
(Roberson et al., 2001). The estimated ages of the children varied from 3 to 10 years. Three participants
(whose estimated ages were 4, 5, and 5) were excluded from analyses as two did not complete the test and
one demonstrated a complete bias to respond to one side of the display only. The remaining participants
were then grouped into the following age-groups: 3-6 years, 7-8 years, 9-10 years (see Table 1 for
participant characteristics). To provide as fair a comparison as possible with the UK sample we selected a
subset of the participants tested in Doherty et al. (2010) who were matched to the Traditional Himba
participants in age (in years) and gender; this yielded groups which were matched as precisely as was
possible on the basis of the age information which we had. Where there was more than one potential match
among the UK sample per Himba participant, we selected the first participant tested.
--Insert Table 1 about here--
Apparatus, materials and design. The experimental stimuli were presented via a computer running a
10
custom C++ program (Doherty et al., 2010). The task required participants to select which of two orange
circles (presented on either side of a computer screen) was the larger. On experimental (“context”) trials the
orange “target” circles were surrounded by grey “inducer” circles, yielding two side-by-side 3 x 3 arrays of
circles (see Fig. 1A). The orange target circles were present on their own on control (“no context”) trials (see
Fig. 1B).
--Insert Figure 1 about here--
For both the experimental and control conditions, on each trial the size difference between the target
circles was 2, 6, 10, 14, or 18 pixels. One of the targets was always 100 pixels (subtending approximately
3.3° of visual angle at a viewing distance of 45 cm), and so the other target varied in size between 82 and
118 pixels, yielding 10 possible size comparisons. Each size comparison was presented twice, once with the
100 pixel target on the left, and once with it on the right.
On most trials in the experimental condition, the larger of the two target circles was surrounded by
eight larger inducers (each of which was 125 pixels in diameter) and the smaller of the two target circles was
surrounded by eight smaller inducers (each of which was 50 pixels in diameter). Size discrimination is
typically impaired by inducers presented in this juxtaposition of size contrast to the targets. In the
experimental condition, we also presented an additional four trials in which the inducers should, if the size
contrast illusion is perceived, enhance size discrimination, that is, trials in which the inducers are smaller
than the larger target and larger than the smaller target. These four trials (the helpful context condition) only
used the most difficult size discrimination condition (i.e., where the targets were either 100 vs. 102, or 98 vs.
100 pixels in size. These additional trials allowed us to check whether the participants are employing a
response strategy in the experimental condition which relies on the size of the inducers rather than the
targets. If a participant were to choose the array with larger inducers, which would lead to success on the
majority of experimental trials, then they would be incorrect on each of the trials in this subset.In total the
participants were presented with 44 trials (24 experimental trials, 20 control trials). The control and
experimental conditions were presented in separate blocks (order was counterbalanced across participants).
Within each block, the order of trials was fully randomized in a different sequence for each participant.
11
Procedure. The participants were tested inside a tent placed in a shaded area. The only occupants of
the tent were the participant, the experimenter and the translator. The participants were asked to point to the
orange (target circle) which “looks bigger”. The experimenter recorded the participant’s response on each
trial via a keyboard. The key-presses also advanced the program to the next trial presentation. No feedback
was given throughout the procedure. The procedure lasted between 2 and 5 minutes.
Statistical analyses. Analyses focused on two dependent variables. Firstly, size discrimination
accuracy was operationalised as the percentage of trials on which participants selected the larger of the two
circles when prompted to do so, pooled across all of the size difference discrimination conditions (excluding
the helpful context condition) (“percentage accuracy”). Percentage accuracy across participant groups and
conditions was investigated using Analysis of Variance (ANOVA). Secondly, to glean a measure of the
extent of the illusion we subtracted participants’ overall accuracy in the context condition from their
accuracy in the control condition (“percentage illusion”). To determine the age at which cross-cultural
differences in the illusion emerge in development, we conducted planned comparison tests of the percentage
illusion score between the UK and traditional Himba participants at each age-group. Further planned
comparisons were conducted to determine the age-groups in which a significant illusion was observed in
both cultures. Statistical analyses were run on IBM SPSS Statistics Version 21.
Results
Figure 2 (Panels A-C) illustrates participants’ percentage accuracy at size discrimination either with
or without the presence of inducers which would lead to size illusions, and plots corresponding variations in
performance across size discrimination conditions. Performance declines as the difference in sizes between
the targets decreases, across age-groups. The effect of the Ebbinghaus illusion, seen in poorer size
discrimination performance in the “context” condition than to the “no context” condition, is particularly
notable in the 9- to 10-year-old UK participants. Their performance in the context (illusion) condition was
poorer than the Himba participants’ performance in the same condition.
--Insert Figure 2 about here--
12
Participants’ percentage accuracy across all conditions (apart from the helpful context condition) was
entered into a 2 x 2 x 3 mixed design ANOVA with the within-participants factor of Condition (Context / No
context), and the between-participants factors of Culture (UK / Himba), and Age-group (3- to 6-year-olds /
7- to 8-year-olds / 9- to 10-year-olds) (see Fig. 2). This revealed main effects of Condition, F(1, 88) = 44.3,
p < .001, ηp2 = .335, describing poorer performance in the Context condition (M = 71.2, SD = 16.5) than in
the No context condition (M = 81.8, SD = 14.5) – i.e., an effect of the illusion across groups and conditions,
and Culture, F(1, 88) = 8.6, p = .004, ηp2 = .089, describing poorer size discrimination accuracy by the
Himba children (M = 72.9, SD = 14.0) than the UK children (M = 80.1, SD = 9.3) across conditions, and
Age-group, F(2, 88) = 4.9, p = .01, ηp2 = .100, describing an overall trend for improved size discrimination
accuracy with age across conditions (3- to 6-year-olds: M = 72.5, SD = 13.5; 7- to 8-year-olds: M = 78.0,
SD = 13.7; 9- to 10-year-olds: M = 80.3, SD = 7.5). There were also 1st order interactions of Condition x
Culture, F(1, 88) = 8.4, p = .005, ηp2 = .087, Condition x Age-group, F(2, 88) = 7.6, p = .001, ηp
2 = .147, and
Culture x Age-group, F(2, 88) = 9.9, p < .001, ηp2 = .184. These were all qualified however, by a significant
2nd order interaction of Condition x Culture x Age-group, F(2, 88) = 5.9, p = .004, ηp2 = .118.
Rather than using post-hoc tests to explore the interaction of Condition x Culture x Age-group we
proceed to the planned comparisons detailed in the Methods section. Planned comparisons were run on the
percentage illusion score (calculated by subtracting participants’ overall percentage accuracy in the context
condition from their overall percentage accuracy in the control condition) comparing cultures at each age-
group. These planned comparisons to function as simple contrasts in an exploration of the 2nd order
interaction reported above. Three comparisons were made and so a Bonferroni correction was applied
yielding an alpha level of p = .017. Cross-cultural comparisons of this illusion score within each of the age-
groups revealed a significantly greater illusion in the UK 9- to 10-year-olds than the Himba 9- to 10-year-
olds, t(28) = 3.83, p = .001, d = 1.28. No significant differences in illusion between cultures were found for
7- to 8-year-olds, t(24) = 1.67, n.s., d = .71, or 3- to 6-year-olds, t(36) = 0.67, n.s., d = .21. Planned
comparisons were also run to determine whether each age-group and culture demonstrated a significant
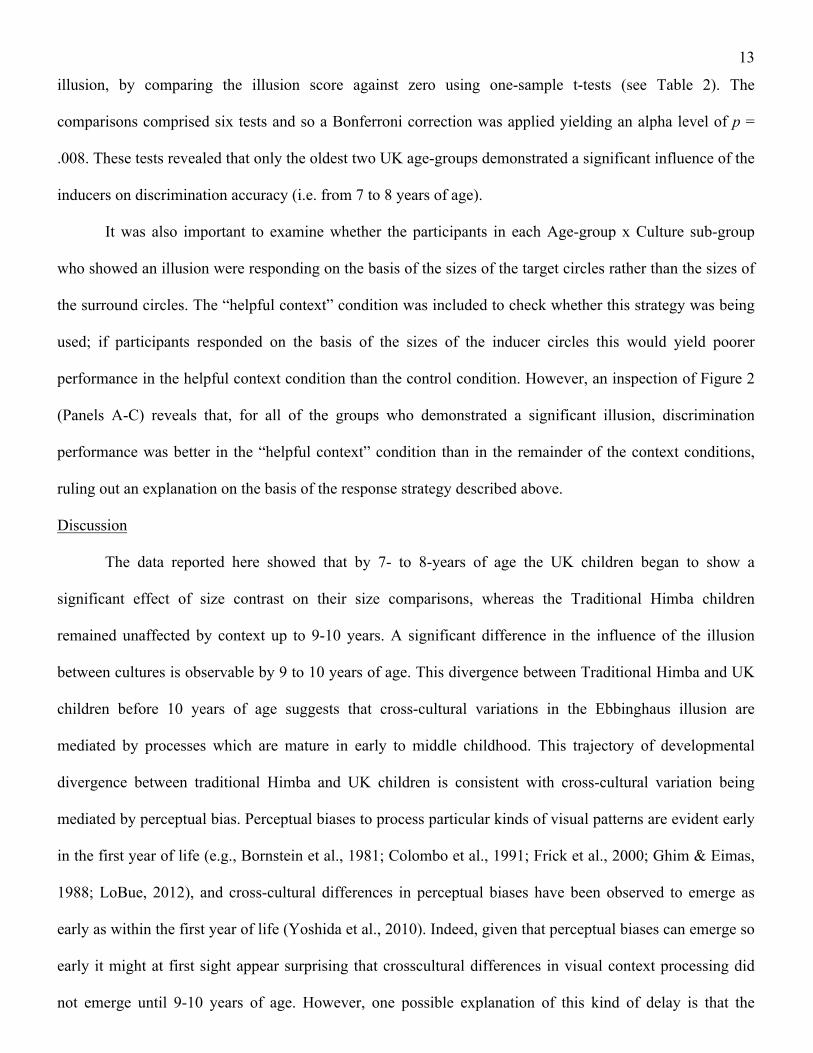
13
illusion, by comparing the illusion score against zero using one-sample t-tests (see Table 2). The
comparisons comprised six tests and so a Bonferroni correction was applied yielding an alpha level of p =
.008. These tests revealed that only the oldest two UK age-groups demonstrated a significant influence of the
inducers on discrimination accuracy (i.e. from 7 to 8 years of age).
It was also important to examine whether the participants in each Age-group x Culture sub-group
who showed an illusion were responding on the basis of the sizes of the target circles rather than the sizes of
the surround circles. The “helpful context” condition was included to check whether this strategy was being
used; if participants responded on the basis of the sizes of the inducer circles this would yield poorer
performance in the helpful context condition than the control condition. However, an inspection of Figure 2
(Panels A-C) reveals that, for all of the groups who demonstrated a significant illusion, discrimination
performance was better in the “helpful context” condition than in the remainder of the context conditions,
ruling out an explanation on the basis of the response strategy described above.
Discussion
The data reported here showed that by 7- to 8-years of age the UK children began to show a
significant effect of size contrast on their size comparisons, whereas the Traditional Himba children
remained unaffected by context up to 9-10 years. A significant difference in the influence of the illusion
between cultures is observable by 9 to 10 years of age. This divergence between Traditional Himba and UK
children before 10 years of age suggests that cross-cultural variations in the Ebbinghaus illusion are
mediated by processes which are mature in early to middle childhood. This trajectory of developmental
divergence between traditional Himba and UK children is consistent with cross-cultural variation being
mediated by perceptual bias. Perceptual biases to process particular kinds of visual patterns are evident early
in the first year of life (e.g., Bornstein et al., 1981; Colombo et al., 1991; Frick et al., 2000; Ghim & Eimas,
1988; LoBue, 2012), and cross-cultural differences in perceptual biases have been observed to emerge as
early as within the first year of life (Yoshida et al., 2010). Indeed, given that perceptual biases can emerge so
early it might at first sight appear surprising that crosscultural differences in visual context processing did
not emerge until 9-10 years of age. However, one possible explanation of this kind of delay is that the
14
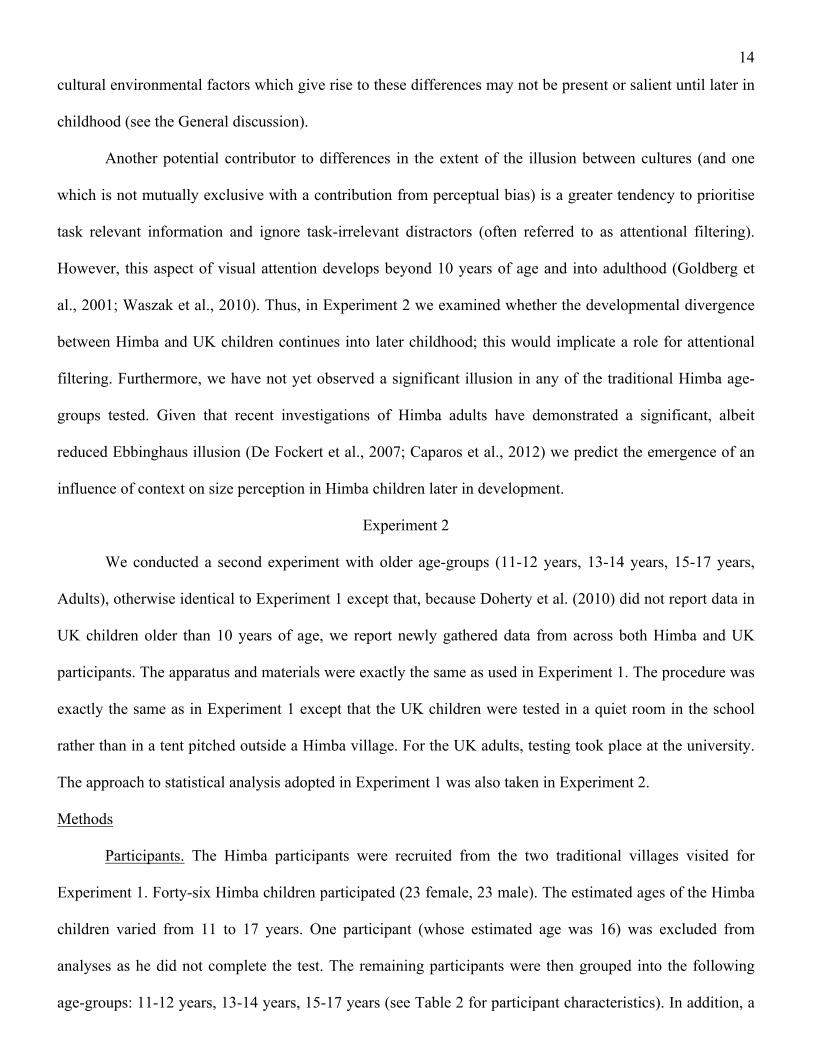
cultural environmental factors which give rise to these differences may not be present or salient until later in
childhood (see the General discussion).
Another potential contributor to differences in the extent of the illusion between cultures (and one
which is not mutually exclusive with a contribution from perceptual bias) is a greater tendency to prioritise
task relevant information and ignore task-irrelevant distractors (often referred to as attentional filtering).
However, this aspect of visual attention develops beyond 10 years of age and into adulthood (Goldberg et
al., 2001; Waszak et al., 2010). Thus, in Experiment 2 we examined whether the developmental divergence
between Himba and UK children continues into later childhood; this would implicate a role for attentional
filtering. Furthermore, we have not yet observed a significant illusion in any of the traditional Himba age-
groups tested. Given that recent investigations of Himba adults have demonstrated a significant, albeit
reduced Ebbinghaus illusion (De Fockert et al., 2007; Caparos et al., 2012) we predict the emergence of an
influence of context on size perception in Himba children later in development.
Experiment 2
We conducted a second experiment with older age-groups (11-12 years, 13-14 years, 15-17 years,
Adults), otherwise identical to Experiment 1 except that, because Doherty et al. (2010) did not report data in
UK children older than 10 years of age, we report newly gathered data from across both Himba and UK
participants. The apparatus and materials were exactly the same as used in Experiment 1. The procedure was
exactly the same as in Experiment 1 except that the UK children were tested in a quiet room in the school
rather than in a tent pitched outside a Himba village. For the UK adults, testing took place at the university.
The approach to statistical analysis adopted in Experiment 1 was also taken in Experiment 2.
Methods
Participants. The Himba participants were recruited from the two traditional villages visited for
Experiment 1. Forty-six Himba children participated (23 female, 23 male). The estimated ages of the Himba
children varied from 11 to 17 years. One participant (whose estimated age was 16) was excluded from
analyses as he did not complete the test. The remaining participants were then grouped into the following
age-groups: 11-12 years, 13-14 years, 15-17 years (see Table 2 for participant characteristics). In addition, a

15
group of Himba adults was tested (n = 35, 25 female, 20 male). One of these adults was excluded due to
evidence of impaired vision. None of the Himba participants had ever been involved in experimental
research. The UK participants were recruited from a comprehensive school in Sheffield. Table 3 presents the
participant characteristics.
Results
Figure 3 (Panels A-D) illustrates participants’ percentage accuracy at size discrimination either with
or without the presence of inducers which would lead to size illusion, and plots corresponding variations in
performance across size discrimination conditions. The effect of the Ebbinghaus illusion is observable in all
age-groups across both cultures, but to a greater extent in the UK participants.
--Insert Figure 3 about here--
Participants’ percentage accuracy across all conditions (apart from the helpful context condition) was
entered into a 2 x 2 x 4 mixed design ANOVA with the within-participants factor of Condition (Context / No
context), and the between-participants factors of Culture (UK / Himba), and Age-group (11- to 12-year-olds
/ 13- to 14-year-olds / 15- to 17-year-olds / Adults) (see Fig. 3). This showed main effects of Condition, F(1,
144) = 418.5, p < .001, ηp2 = .744, describing poorer accuracy in the Context condition (M = 79.6, SD =
13.9) than in the No context condition (M = 92.1, SD = 7.1) – i.e., an effect of the illusion across groups and
conditions, and Culture, F(1, 144) = 89.9, p < .001, ηp2 = .384, describing greater accuracy across age-groups
and conditions in the Himba participants (M = 85.8, SD = 8.6) compared to the UK participants (M = 70.2,
SD = 10.3). There was also a 1st order interaction of Condition x Culture, F(1, 144) = 132.94, p < .001, ηp2 =
.480. No other interactions were significant (all Fs < 2).
The interaction of Condition x Culture was explored with four Bonferroni-corrected t-tests. Two
paired-samples tests revealed differences in accuracy between Context and No context conditions in both
Himba (Context: M = 79.6, SD = 13.9; No context: M = 92.1, SD = 7.1), t(78) = 8.2, p < .001, d = .90, and
UK (Context: M = 47.1, SD = 18.2; No context: M = 93.4, SD = 7.2), t(72) = 21.2, p < .001, d = 2.5,
participants, with both groups performing with greater accuracy in the no context condition. Two
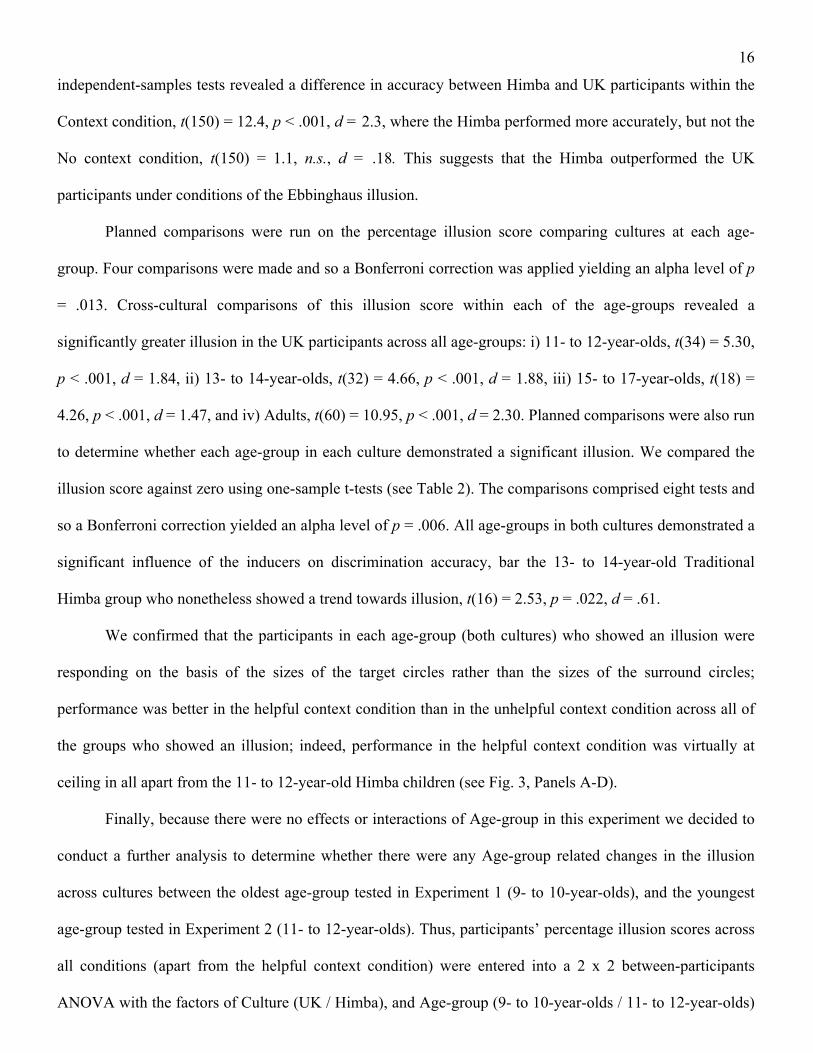
16
independent-samples tests revealed a difference in accuracy between Himba and UK participants within the
Context condition, t(150) = 12.4, p < .001, d = 2.3, where the Himba performed more accurately, but not the
No context condition, t(150) = 1.1, n.s., d = .18. This suggests that the Himba outperformed the UK
participants under conditions of the Ebbinghaus illusion.
Planned comparisons were run on the percentage illusion score comparing cultures at each age-
group. Four comparisons were made and so a Bonferroni correction was applied yielding an alpha level of p
= .013. Cross-cultural comparisons of this illusion score within each of the age-groups revealed a
significantly greater illusion in the UK participants across all age-groups: i) 11- to 12-year-olds, t(34) = 5.30,
p < .001, d = 1.84, ii) 13- to 14-year-olds, t(32) = 4.66, p < .001, d = 1.88, iii) 15- to 17-year-olds, t(18) =
4.26, p < .001, d = 1.47, and iv) Adults, t(60) = 10.95, p < .001, d = 2.30. Planned comparisons were also run
to determine whether each age-group in each culture demonstrated a significant illusion. We compared the
illusion score against zero using one-sample t-tests (see Table 2). The comparisons comprised eight tests and
so a Bonferroni correction yielded an alpha level of p = .006. All age-groups in both cultures demonstrated a
significant influence of the inducers on discrimination accuracy, bar the 13- to 14-year-old Traditional
Himba group who nonetheless showed a trend towards illusion, t(16) = 2.53, p = .022, d = .61.
We confirmed that the participants in each age-group (both cultures) who showed an illusion were
responding on the basis of the sizes of the target circles rather than the sizes of the surround circles;
performance was better in the helpful context condition than in the unhelpful context condition across all of
the groups who showed an illusion; indeed, performance in the helpful context condition was virtually at
ceiling in all apart from the 11- to 12-year-old Himba children (see Fig. 3, Panels A-D).
Finally, because there were no effects or interactions of Age-group in this experiment we decided to
conduct a further analysis to determine whether there were any Age-group related changes in the illusion
across cultures between the oldest age-group tested in Experiment 1 (9- to 10-year-olds), and the youngest
age-group tested in Experiment 2 (11- to 12-year-olds). Thus, participants’ percentage illusion scores across
all conditions (apart from the helpful context condition) were entered into a 2 x 2 between-participants
ANOVA with the factors of Culture (UK / Himba), and Age-group (9- to 10-year-olds / 11- to 12-year-olds)

17
(see Figs. 2 & 3). This revealed main effects of Culture (Himba: M = 12.7, SD = 17.6; UK: M = 39.4, SD =
18.0), F(1, 62) = 40.9, p < .001, ηp2 = .398, and Age-group (9- to 10-year-olds: M = 18.8, SD = 20.5; 11- to
12-year-olds: M = 32.1, SD = 22.0), F(1, 62) = 10.3, p = .002, ηp2 = .142. There was no interaction of Age-
group x Culture (F < 1). This indicates an increase in the illusion from 9-10 to 11-12 years across both
Cultures, but with that illusion being significantly greater in the UK children at both ages.
Discussion
Across 11- to 12-year-olds, 13- to 14-year-olds, 15- to 17-year-olds, and adults we found significant
(or, in the case of the Himba 13- to 14-year-olds, trending to significant) illusions in both the traditional
Himba and UK participant groups. Consistent with previous findings (Caparos et al., 2012; De Fockert et al.,
2007) the illusion was substantially greater in the UK group than in the traditional Himba. This resulted in
higher levels of accuracy in the traditional Himba compared to the UK participants. Interestingly, and in
contrast to the findings from younger children in Experiment 1, there were no changes between 11-12 years
and adulthood in the effect of culture across age-groups. The extent of the illusion increases between 9-10
years and 11-12 years across both cultures, without any further divergence between cultures in the extent of
the illusion. This indicates that cross-cultural variations in the Ebbinghaus illusion have emerged fully at
around 9-10 years of age, in spite of culture-general increases in the illusion up until 11-12 years.
In combination with the data from Experiment 1 the data presented here show that cross-cultural
differences in the influence of size context in the Ebbinghaus illusion develop in early to middle childhood
(Experiment 1), but remain stable from 10 years of age (Experiment 2). Given that changes in perceptual
bias occur early in development, and attentional filtering develops beyond 10 years of age (see earlier) our
data indicate that cross-cultural differences in size context effect emerge due to differences in perceptual bias
between cultures, rather than differences in the ability to selectively attend to task-relevant information, and
filter out task-irrelevant information (see Caparos et al., 2013; De Fockert et al., 2011; Linnell et al., 2013).
A crucial question concerns how cross-cultural differences in perceptual biases might emerge. There
exist a great many differences between the environments which traditional Himba children grow up in and
those of British school-children, within both their physical and sociocultural environments. In the next
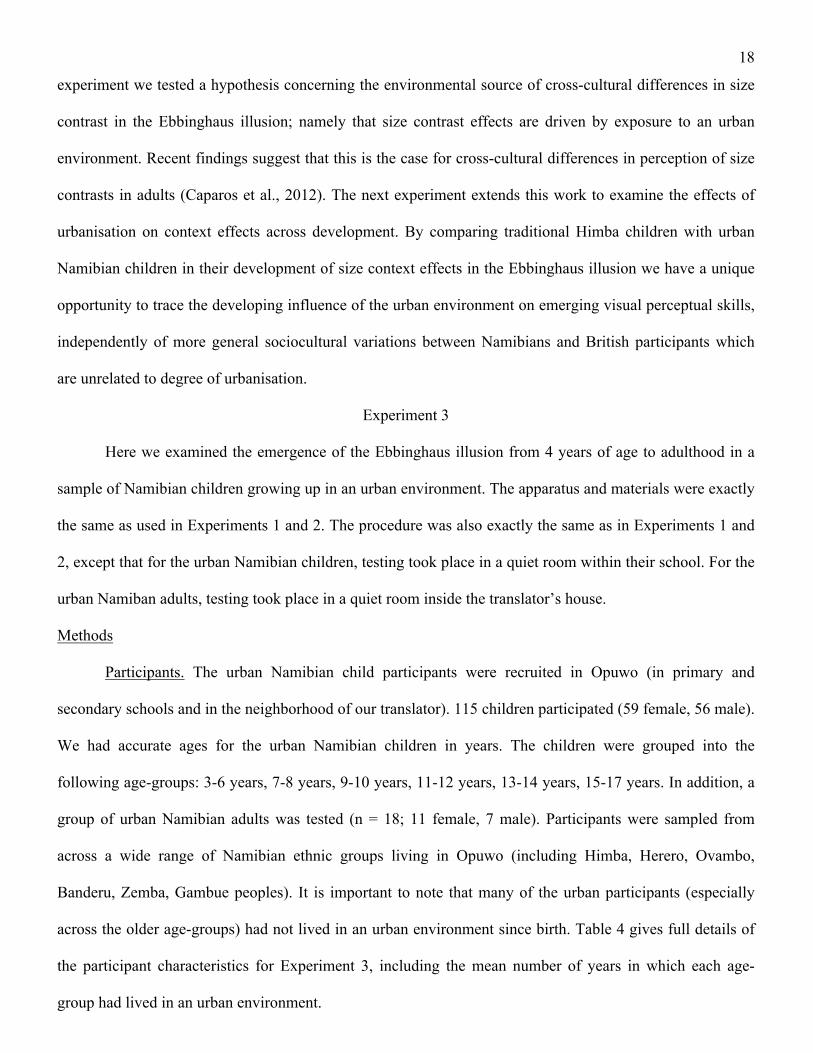
18
experiment we tested a hypothesis concerning the environmental source of cross-cultural differences in size
contrast in the Ebbinghaus illusion; namely that size contrast effects are driven by exposure to an urban
environment. Recent findings suggest that this is the case for cross-cultural differences in perception of size
contrasts in adults (Caparos et al., 2012). The next experiment extends this work to examine the effects of
urbanisation on context effects across development. By comparing traditional Himba children with urban
Namibian children in their development of size context effects in the Ebbinghaus illusion we have a unique
opportunity to trace the developing influence of the urban environment on emerging visual perceptual skills,
independently of more general sociocultural variations between Namibians and British participants which
are unrelated to degree of urbanisation.
Experiment 3
Here we examined the emergence of the Ebbinghaus illusion from 4 years of age to adulthood in a
sample of Namibian children growing up in an urban environment. The apparatus and materials were exactly
the same as used in Experiments 1 and 2. The procedure was also exactly the same as in Experiments 1 and
2, except that for the urban Namibian children, testing took place in a quiet room within their school. For the
urban Namiban adults, testing took place in a quiet room inside the translator’s house.
Methods
Participants. The urban Namibian child participants were recruited in Opuwo (in primary and
secondary schools and in the neighborhood of our translator). 115 children participated (59 female, 56 male).
We had accurate ages for the urban Namibian children in years. The children were grouped into the
following age-groups: 3-6 years, 7-8 years, 9-10 years, 11-12 years, 13-14 years, 15-17 years. In addition, a
group of urban Namibian adults was tested (n = 18; 11 female, 7 male). Participants were sampled from
across a wide range of Namibian ethnic groups living in Opuwo (including Himba, Herero, Ovambo,
Banderu, Zemba, Gambue peoples). It is important to note that many of the urban participants (especially
across the older age-groups) had not lived in an urban environment since birth. Table 4 gives full details of
the participant characteristics for Experiment 3, including the mean number of years in which each age-
group had lived in an urban environment.
19
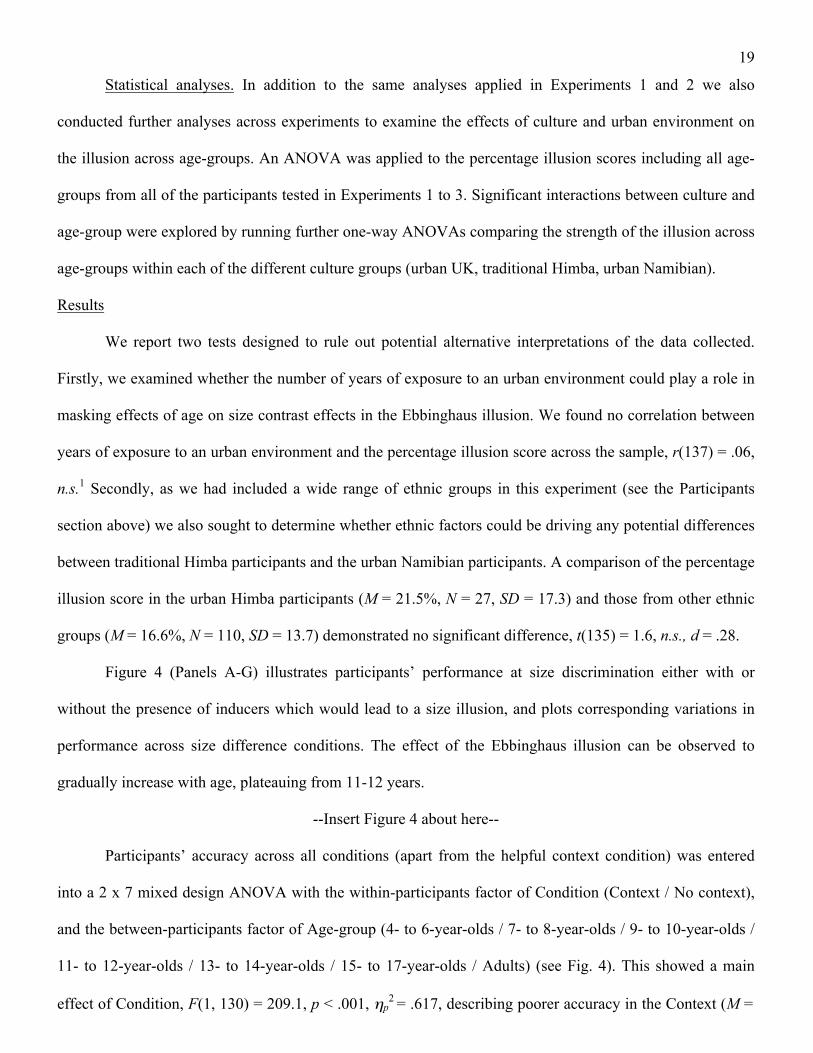
Statistical analyses. In addition to the same analyses applied in Experiments 1 and 2 we also
conducted further analyses across experiments to examine the effects of culture and urban environment on
the illusion across age-groups. An ANOVA was applied to the percentage illusion scores including all age-
groups from all of the participants tested in Experiments 1 to 3. Significant interactions between culture and
age-group were explored by running further one-way ANOVAs comparing the strength of the illusion across
age-groups within each of the different culture groups (urban UK, traditional Himba, urban Namibian).
Results
We report two tests designed to rule out potential alternative interpretations of the data collected.
Firstly, we examined whether the number of years of exposure to an urban environment could play a role in
masking effects of age on size contrast effects in the Ebbinghaus illusion. We found no correlation between
years of exposure to an urban environment and the percentage illusion score across the sample, r(137) = .06,
n.s.1 Secondly, as we had included a wide range of ethnic groups in this experiment (see the Participants
section above) we also sought to determine whether ethnic factors could be driving any potential differences
between traditional Himba participants and the urban Namibian participants. A comparison of the percentage
illusion score in the urban Himba participants (M = 21.5%, N = 27, SD = 17.3) and those from other ethnic
groups (M = 16.6%, N = 110, SD = 13.7) demonstrated no significant difference, t(135) = 1.6, n.s., d = .28.
Figure 4 (Panels A-G) illustrates participants’ performance at size discrimination either with or
without the presence of inducers which would lead to a size illusion, and plots corresponding variations in
performance across size difference conditions. The effect of the Ebbinghaus illusion can be observed to
gradually increase with age, plateauing from 11-12 years.
--Insert Figure 4 about here--
Participants’ accuracy across all conditions (apart from the helpful context condition) was entered
into a 2 x 7 mixed design ANOVA with the within-participants factor of Condition (Context / No context),
and the between-participants factor of Age-group (4- to 6-year-olds / 7- to 8-year-olds / 9- to 10-year-olds /
11- to 12-year-olds / 13- to 14-year-olds / 15- to 17-year-olds / Adults) (see Fig. 4). This showed a main
effect of Condition, F(1, 130) = 209.1, p < .001, ηp2 = .617, describing poorer accuracy in the Context (M =

20
75.7, SD = 12.8) than in the No context (M = 93.3, SD = 6.5) condition – i.e., an effect of the illusion across
groups and conditions. There was also a marginally significant 1st order interaction of Condition x Age-
group, F(6, 130) = 2.1, p = .057, ηp2 = .089. There was no main effect of Age-group (F < 2).
We proceed to the planned comparisons detailed in the Methods section, in which the percentage
illusion score was compared against zero at each age-group (see Table 2). All of these comparisons
comprised seven tests and so a Bonferroni correction was applied yielding an alpha level of p = .007. These
tests, reported in Table 2, revealed that all age-groups of urban Namibian participants (even the youngest 4-
to 6-year-olds) demonstrated a significant influence of the inducers on discrimination accuracy; that is, a
significant illusion.
The participants in each age-group who showed an illusion were responding on the basis of the sizes
of the target circles rather than the sizes of the surround circles. Performance was better in the helpful
context condition than in the unhelpful context condition across all of the groups who showed a significant
illusion. The helpful context condition was virtually at ceiling from 9-10 years of age (see Fig. 4).
To examine the developmental unfolding of the influence of the urban environment on size contrast
effects, we ran further analyses comparing the UK participants, and the traditional and urban Namibian
participants across all age-groups. To this purpose, we took the percentage illusion score and entered it into a
3 x 7 between participants ANOVA with the factors of Culture (UK / Traditional Himba / Urban Namibian),
and Age-group (3- to 6-year-olds / 7- to 8-year-olds / 9- to 10-year-olds / 11- to 12-year-olds / 13- to 14-
year-olds / 15- to 17-year-olds / Adults) (see Fig. 5). This showed a main effect of Culture, F(2, 362) = 63.8,
p < .001, ηp2 = .261. Tukey HSD showed that all three cultures differed on the percentage illusion score, with
the traditional Himba demonstrating the lowest percentage illusion (M = 10.2, SD = 15.0, N = 126), the
urban Namibian demonstrating an intermediate level of illusion (M = 17.6, SD = 14.5, N = 137), and the UK
participants demonstrating the greatest percentage illusion (M = 34.0, SD = 24.4, N = 120) (all paired
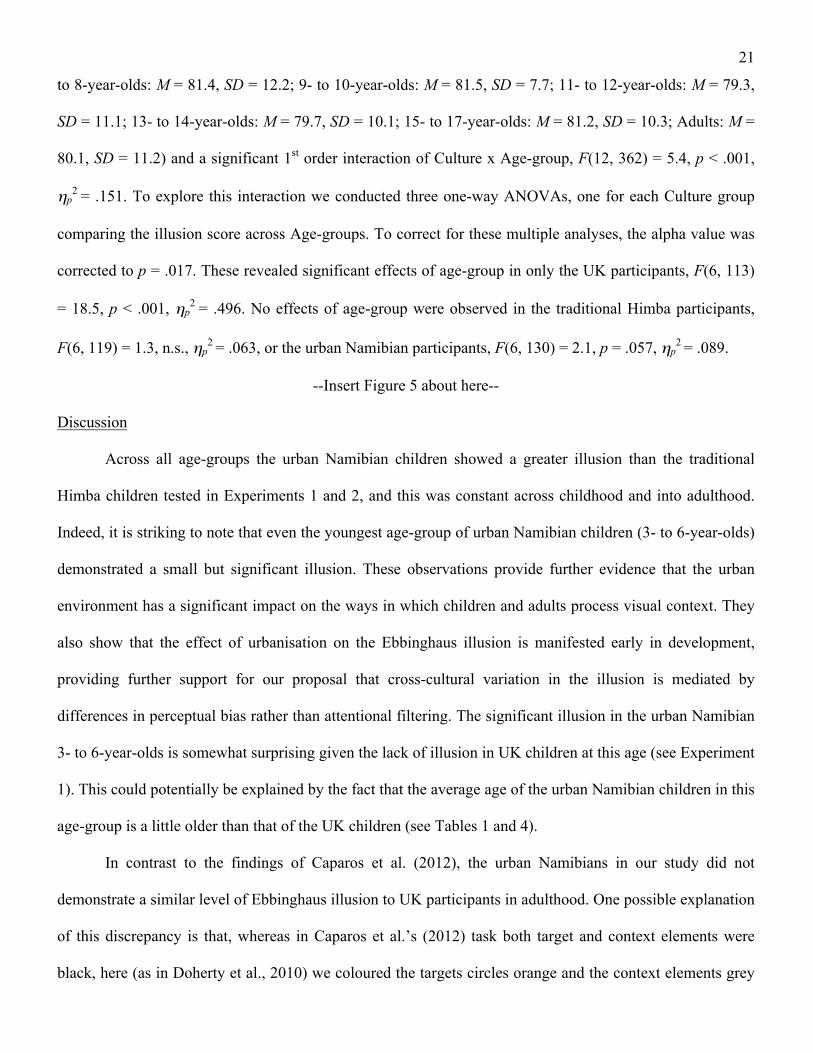
comparisons were significant, p < .001). There was also a main effect of Age-group, F(6, 362) = 16.6, p <
.001, ηp2 = .216, describing a trend to increasing illusion with age (3- to 6-year-olds: M = 76.1, SD = 13.1; 7-
21
to 8-year-olds: M = 81.4, SD = 12.2; 9- to 10-year-olds: M = 81.5, SD = 7.7; 11- to 12-year-olds: M = 79.3,
SD = 11.1; 13- to 14-year-olds: M = 79.7, SD = 10.1; 15- to 17-year-olds: M = 81.2, SD = 10.3; Adults: M =
80.1, SD = 11.2) and a significant 1st order interaction of Culture x Age-group, F(12, 362) = 5.4, p < .001,
ηp2 = .151. To explore this interaction we conducted three one-way ANOVAs, one for each Culture group
comparing the illusion score across Age-groups. To correct for these multiple analyses, the alpha value was
corrected to p = .017. These revealed significant effects of age-group in only the UK participants, F(6, 113)
= 18.5, p < .001, ηp2 = .496. No effects of age-group were observed in the traditional Himba participants,
F(6, 119) = 1.3, n.s., ηp2 = .063, or the urban Namibian participants, F(6, 130) = 2.1, p = .057, ηp
2 = .089.
--Insert Figure 5 about here--
Discussion
Across all age-groups the urban Namibian children showed a greater illusion than the traditional
Himba children tested in Experiments 1 and 2, and this was constant across childhood and into adulthood.
Indeed, it is striking to note that even the youngest age-group of urban Namibian children (3- to 6-year-olds)
demonstrated a small but significant illusion. These observations provide further evidence that the urban
environment has a significant impact on the ways in which children and adults process visual context. They
also show that the effect of urbanisation on the Ebbinghaus illusion is manifested early in development,
providing further support for our proposal that cross-cultural variation in the illusion is mediated by
differences in perceptual bias rather than attentional filtering. The significant illusion in the urban Namibian
3- to 6-year-olds is somewhat surprising given the lack of illusion in UK children at this age (see Experiment
1). This could potentially be explained by the fact that the average age of the urban Namibian children in this
age-group is a little older than that of the UK children (see Tables 1 and 4).
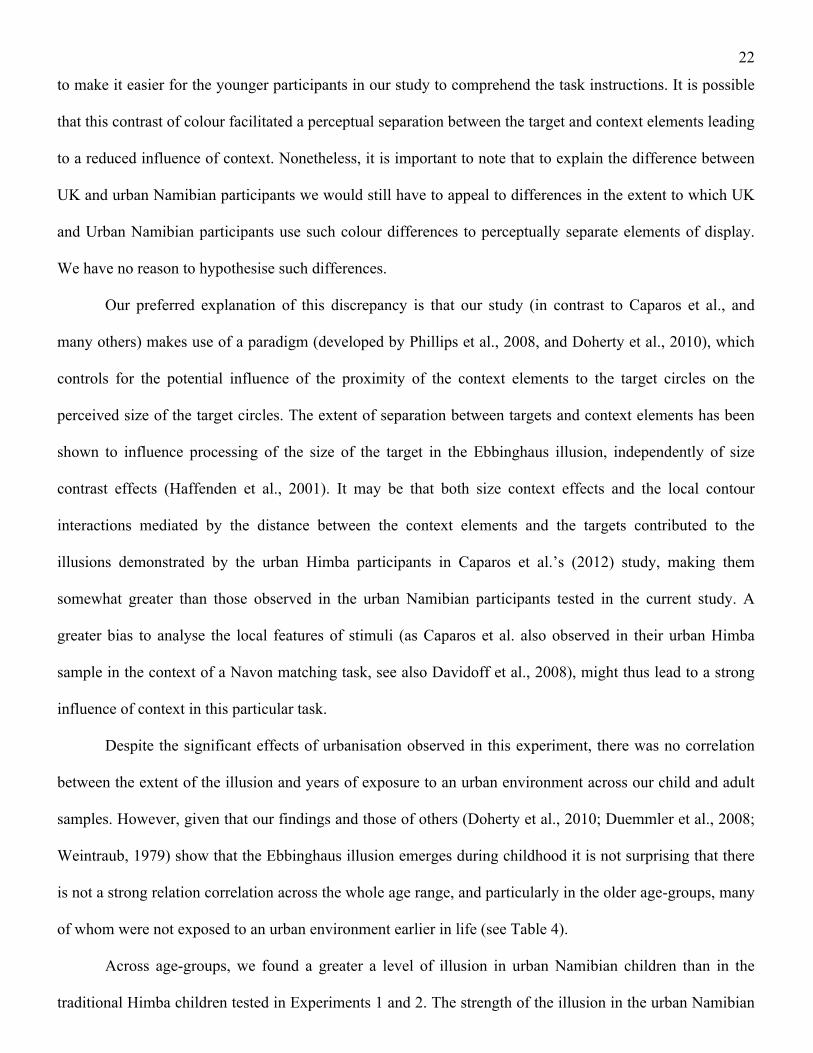
In contrast to the findings of Caparos et al. (2012), the urban Namibians in our study did not
demonstrate a similar level of Ebbinghaus illusion to UK participants in adulthood. One possible explanation
of this discrepancy is that, whereas in Caparos et al.’s (2012) task both target and context elements were
black, here (as in Doherty et al., 2010) we coloured the targets circles orange and the context elements grey
22
to make it easier for the younger participants in our study to comprehend the task instructions. It is possible
that this contrast of colour facilitated a perceptual separation between the target and context elements leading
to a reduced influence of context. Nonetheless, it is important to note that to explain the difference between
UK and urban Namibian participants we would still have to appeal to differences in the extent to which UK
and Urban Namibian participants use such colour differences to perceptually separate elements of display.
We have no reason to hypothesise such differences.
Our preferred explanation of this discrepancy is that our study (in contrast to Caparos et al., and
many others) makes use of a paradigm (developed by Phillips et al., 2008, and Doherty et al., 2010), which
controls for the potential influence of the proximity of the context elements to the target circles on the
perceived size of the target circles. The extent of separation between targets and context elements has been
shown to influence processing of the size of the target in the Ebbinghaus illusion, independently of size
contrast effects (Haffenden et al., 2001). It may be that both size context effects and the local contour
interactions mediated by the distance between the context elements and the targets contributed to the
illusions demonstrated by the urban Himba participants in Caparos et al.’s (2012) study, making them
somewhat greater than those observed in the urban Namibian participants tested in the current study. A
greater bias to analyse the local features of stimuli (as Caparos et al. also observed in their urban Himba
sample in the context of a Navon matching task, see also Davidoff et al., 2008), might thus lead to a strong
influence of context in this particular task.
Despite the significant effects of urbanisation observed in this experiment, there was no correlation
between the extent of the illusion and years of exposure to an urban environment across our child and adult
samples. However, given that our findings and those of others (Doherty et al., 2010; Duemmler et al., 2008;
Weintraub, 1979) show that the Ebbinghaus illusion emerges during childhood it is not surprising that there
is not a strong relation correlation across the whole age range, and particularly in the older age-groups, many
of whom were not exposed to an urban environment earlier in life (see Table 4).
Across age-groups, we found a greater a level of illusion in urban Namibian children than in the
traditional Himba children tested in Experiments 1 and 2. The strength of the illusion in the urban Namibian
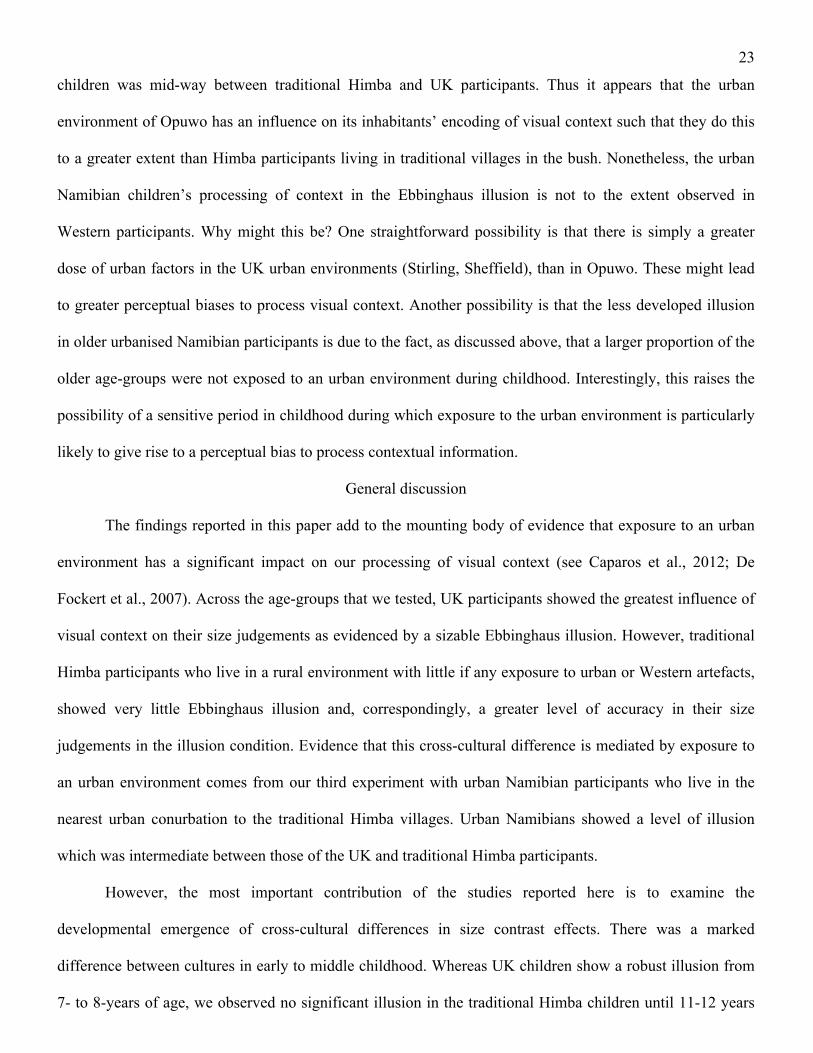
23
children was mid-way between traditional Himba and UK participants. Thus it appears that the urban
environment of Opuwo has an influence on its inhabitants’ encoding of visual context such that they do this
to a greater extent than Himba participants living in traditional villages in the bush. Nonetheless, the urban
Namibian children’s processing of context in the Ebbinghaus illusion is not to the extent observed in
Western participants. Why might this be? One straightforward possibility is that there is simply a greater
dose of urban factors in the UK urban environments (Stirling, Sheffield), than in Opuwo. These might lead
to greater perceptual biases to process visual context. Another possibility is that the less developed illusion
in older urbanised Namibian participants is due to the fact, as discussed above, that a larger proportion of the
older age-groups were not exposed to an urban environment during childhood. Interestingly, this raises the
possibility of a sensitive period in childhood during which exposure to the urban environment is particularly
likely to give rise to a perceptual bias to process contextual information.
General discussion
The findings reported in this paper add to the mounting body of evidence that exposure to an urban
environment has a significant impact on our processing of visual context (see Caparos et al., 2012; De
Fockert et al., 2007). Across the age-groups that we tested, UK participants showed the greatest influence of
visual context on their size judgements as evidenced by a sizable Ebbinghaus illusion. However, traditional
Himba participants who live in a rural environment with little if any exposure to urban or Western artefacts,
showed very little Ebbinghaus illusion and, correspondingly, a greater level of accuracy in their size
judgements in the illusion condition. Evidence that this cross-cultural difference is mediated by exposure to
an urban environment comes from our third experiment with urban Namibian participants who live in the
nearest urban conurbation to the traditional Himba villages. Urban Namibians showed a level of illusion
which was intermediate between those of the UK and traditional Himba participants.
However, the most important contribution of the studies reported here is to examine the
developmental emergence of cross-cultural differences in size contrast effects. There was a marked
difference between cultures in early to middle childhood. Whereas UK children show a robust illusion from
7- to 8-years of age, we observed no significant illusion in the traditional Himba children until 11-12 years

24
of age. No changes in cross-cultural differences were seen after 9-10 years of age. Namibian children who
were growing up in an urban environment demonstrated a greater illusion than traditional Himba children
which was sustained across childhood and adulthood giving a clear indication that the urban environment
influences the emergence of contextual visual processing. The divergence between traditional Himba and
Western children in early childhood sheds important light on the perceptual processes which mediate cross-
cultural differences in the ways in which context perception develops in early life.
In this paper we have distinguished between two ways in which cross-cultural differences in context
perception might emerge through development. We argued that differences in perceptual bias have the
potential to emerge from early in life given especially that perceptual biases to process particular kinds of
visual patterns are evident early in the first year of life (e.g., Bornstein et al., 1981; Colombo et al., 1991;
Frick et al., 2000; Ghim & Eimas, 1988; LoBue, 2012), and cross-cultural differences in perceptual biases
have been observed to emerge as early as across the first year of life (Yoshida et al., 2010). Another
possibility is that differences in the extent to which attentional filtering is employed to selectively attend to
task-relevant information could explain differential processing of visual context (with greater filtering
leading to a lesser influence of context on perception). This account, made particularly plausible by the
observation that the traditional Himba are superior to UK observers in selectively attending to task-relevant
information (Caparos et al., 2013; De Fockert et al., 2011; Linnell et al., 2013), predicts a more protracted
developmental trajectory of cross-cultural differences in context perception given the later maturation of
attentional filtering which continues to develop beyond 10 years of age and into early adulthood. However,
as stated above, we have observed here that cross-cultural differences in the influence of the Ebbinghaus
illusion are fully developed by 9-10 years of age, and so our findings strongly support the perceptual bias
account in preference to the attentional filtering account. Thus, we argue that UK children, and Namibian
children growing up in an urban environment develop a perceptual bias to process context more than do
traditional Himba children when inspecting visual patterns.
Given that some perceptual biases emerge in the first year of life (Bornstein et al., 1981; Colombo et
al., 1991; Frick et al., 2000; Ghim & Eimas, 1988; LoBue, 2012; Yoshida et al., 2012), why did we not
25
observe differences in visual context effects between UK and traditional Himba children at the youngest age-
group we tested? The answer seems likely to lie in the nature of the environmental drivers which give rise to
cross-cultural differences in bias towards or away from visual context processing. The only example (of
which we are aware) of a study demonstrating cross-cultural variations in perceptual bias in infancy,
highlights the emergence (by 7-8 months) of differences in grouping of auditory stimuli between infants
growing up in English-speaking and Japanese-speaking environments (Yoshida et al., 2012). Yoshida and
colleagues ascribed these variations to differences between the infants’ language environments. Whereas
language environments are particularly pertinent to the developing infant, even as early as the first year of
life (e.g., Vouloumanos & Werker, 2007; Werker, Yeung & Yoshida, 2012), we might speculate that the
environmental differences which give rise to cross-cultural variations in visual context processing are more
pertinent later in development, that is, in early childhood.
But what are the environmental factors which drive the emergence of cross-cultural differences in
visual context effects? As described earlier, researchers have suggested a range of different accounts. Nisbett
et al. (2001; see also Varnum et al., 2010) have argued that cross-cultural variations in the use of context are
due to differences in social structure across cultures. Other explanations appeal to the idea that the physical
environments which different cultures inhabit lead them to prioritise context to different extents; visual
clutter and the pictorial environment are among the factors implicated (Caparos et al., 2012; Deregowski,
1989; Doherty et al., 2010; Miyamoto et al., 2006; Szwed et al., 2012). Our findings suggest that, whatever
the precise source is, it exists in differences between urban and rural environments. There are a great many
potential differences between urban and rural environments, in both physical and social structure. However,
our findings of greater context effects in a urban than a rural sample (see also Caparos et al., 2012) do argue
against the possibility that differences in visual context processing could be driven by social differences
between cultures which are not correlated with differences in the physical (urban vs. rural) environment.
Indeed, of the proposals which have been made in the literature, those involving differences in social
structure more generally are less consistent with our findings. Varnum et al.’s (2010) proposal has it that
more individualistic cultures (e.g., Western cultures) promote “analytic” processing of the details in visual

26
patterns, whereas more collectivist cultures (e.g., East Asian cultures) promote “holistic” processing of
continuities and relationships. This is inconsistent with findings that (as well as here see Caparos et al.,
2012; Davidoff et al., 2008; De Fockert et al., 2007) traditional Himba participants who are interdependent
(or collectivist) by nature (Gluckman, 1965) have a local (analytical) bias in visual processing.
Proposals concerning differences in the physical structure of the environment leading to variations in
in perceptual bias fare better. Visual clutter has been proposed to promote a greater processing of context
(Caparos et al., 2012; Linnell et al., 2013; Miyamoto et al., 2006), as has exposure to pictures and printed
material (Deregowski, 1989; Doherty et al., 2010; Szwed et al., 2012). Both visual clutter and pictorial
exposure are greater in the urban environment where we observed greater effects of context on visual
processing. But which of these environmental differences provides the best explanation of the trajectories of
cross-cultural differences in visual context processing observed in the current investigation? We prefer the
account based on exposure to pictorial stimuli, and printed matter more generally, simply because whereas a
cluttered environment seems likely to impact on the developing child across early life, pictorial or printed
stimuli become particularly relevant in early to middle childhood – the point at which we observed
divergence between Traditional Himba, and UK children in the Ebbinghaus illusion.
As we have already argued, our data strengthen the case against accounts of cross-cultural
differences in context processing which appeal to differences in the ability to selectively attend to particular
kinds of information (see Kitayama et al., 2003). It is reasonable to enquire how our conclusion squares with
the now large body of evidence that the Himba appear to be particularly good at focussing their attention on
task-relevant aspects of visual patterns (De Fockert et al., 2011; Linnell et al., 2013). A recent study by
Caparos and colleagues (2013) sheds light on this matter. They showed that the Himba’s advantage in
selective attention works at both local and global levels of analysis; they are less distracted by global
information than Westerners, which is expected given their local bias, but they are also less distracted by
global configurations. As such, differences in selective attention do not easily explain a perceptual bias to
local features. An interesting question for future research will be to examine whether the opposite relation
might be true. Does a lesser processing of context early in development lead to an advantage in selective
27
attention at both local and global levels of analysis later in development? It is possible that the advantage
which traditional Himba adults show over UK participants in selective attention (attentional filtering) to both
global and local information is due to their lesser perceptual bias to context in early life.
Another important question to ask concerns whether the developmental and cross-cultural effects of
size contrast observed here extend across other context effects. It seems likely that the development of
perceptual biases towards or away from context will have widespread effects across a range of tasks. Indeed,
as well as being much less influenced by context in the Ebbinghaus illusion, traditional Himba adults tend to
match two-dimensional hierarchical figures on the basis of featural rather than configural similarities
(Caparos et al., 2012; Davidoff et al., 2008). It is interesting to consider whether the developmental
emergence of cross-cultural differences in hierarchical figure processing mirrors that found in the emergence
of the Ebbinghaus illusion. Several studies of the development of hierarchical figure processing demonstrate
an extended development of an ability to report global shapes in hierarchical patterns (Elkind, Koegler &
Go, 1964; Dukette & Stiles, 1996, 2001), which matches up quite well with the trajectory of visual context
effects observed in the Ebbinghaus illusion by Doherty et al. (2010). Elkind and colleagues argued that the
emergence of Piagetian concrete logical operations was the driving factor in the development of global
shape. However, on the basis of correlational evidence alone, it is equally likely that developments in
perceptual bias towards visual context might be at play.
Subsequent investigations of local vs. global processing have revealed a more complicated picture.
When directed to attend to either local or global levels of description under speeded conditions, young
children initially show a large global (rather than local) precedence which gradually ameliorates into late
childhood and through adolescence (Mondloch, Geldart, Maurer & De Schonen, 2003). It is possible that,
under speeded conditions of analysis in a selective attention task, attentional filtering comes to play a larger
role, yielding a more protracted development. It will be interesting to determine whether differences in
perceptual bias towards context in early life (like those seen between UK and Himba observers) will lead to
different degrees and trajectories of global and local precedence in speeded selective attention tasks.

28
A further prediction to arise from our findings is that all illusions involving an influence of visual
context should increase during childhood up until 11 years of age (at least in Westerners). The literature
documenting developmental changes in Western children’s responses to visual illusions beyond the
Ebbinghaus illusion is somewhat conflicted on this matter. There are some reports of other illusions which
increase in strength with age (Ponzo illusion: Leibowitz & Judisch, 1967), but also other context-driven
illusions in which are seen no change or decreases in strength with age (Müller-Lyer and Horizontal-vertical
Illusions: Brosvic, Dihoff & Fama, 2002; Pinter & Anderson, 1916; Rivers, 1905). One way of resolving
these differences may be to make a more detailed analysis of the perceptual and attentional processes
involved in these various illusions. If not just perceptual bias, but also other factors such as attentional
filtering are involved but to differing extents, this may help explain the different developmental trajectories
(e.g., developing attentional filtering could explain the reduction in the Müller-Lyer illusion with age).
In this article we have reported the findings of a series of experiments which combine the strengths
of cross-cultural and developmental methods to shed light on the emergence of visual size context effects in
childhood and adolescence. The cross-cultural comparisons have shown clearly that urban vs. rural
environmental contexts give rise to different ways of processing visual context; visual context plays a greater
role in task-relevant decisions in individuals who have grown up in urban environments. The developmental
trajectories of these cross-cultural variations shed light on the processes whereby the urban environment
gives rise to a greater effect of context in visual processing. Our findings show that cross-cultural variations
in visual context effects are fully developed by 9-10 years of age, indicating that the urban environment
gives rise to a perceptual bias to process context, rather than fostering the processing of task-irrelevant
contextual information by reducing the extent to which context is filtered out by selective attention. We
tentatively propose that differences in perceptual bias to process visual context arise from the differing
degrees to which children are exposed to pictorial and printed materials between traditional and urban
environments, with a greater exposure leading to greater processing of visual context in urban children.
REFERENCES
29
Bornstein, M. H., Ferdinandsen, K., & Gross, C. G. (1981). Perception of symmetry in infancy.
Developmental Psychology, 17, 82-86.
Bremner, A. J., Bryant, P. E., & Mareschal, D. (2006). Object-centred spatial reference in 4-month-old
infants. Infant Behavior and Development, 29, 1-10.
Bremner, A. J., Caparos, S., Davidoff, J., de Fockert, J. W., Linnell, K. J., & Spence, C. (2013). “Bouba” and
“Kiki” in Namibia? A remote culture make similar shape-sound matches, but different shape-taste
matches to Westerners. Cognition, 126, 165-172.
Brosvic, G. M., Dihoff, R. E., & Fama, J. (2002). Age-related susceptibility to the Müller-Lyer and the
horizontal-vertical illusions. Perceptual & Motor Skills, 94, 229-234.
Caparos, S., Ahmed, L., Bremner, A. J., de Fockert, J. W., Linnell, K. J., & Davidoff, J. (2012). Exposure to
an urban environment alters the local bias of a remote culture. Cognition, 122, 80-85.
Caparos, S., Linnell, K. J., Bremner, A. J., De Fockert, J. W., & Davidoff, J. (2013). Do local and global
perceptual biases tell us anything about local and global selective attention? Psychological Science,
24, 206-212.
Colombo, J., Mitchell, D. W., Coldren, J. T., & Freeseman, L. J. (1991). Individual differences in infant
visual attention: Are short lookers faster processors or feature processors? Child Development, 62,
1247-1257.
Comalli, PE, J., Wapner, S., & Werner, H. (1962). Interference effects of stroop color-word test in
childhood, adulthood, and aging. The Journal of Genetic Psychology, 100, 47-53.
Davidoff, J.B. (2001). Language and perceptual categorisation. Trends in Cognitive Sciences, 5, 382-387.
Davidoff, J.B., Fonteneau, E., & Fagot, J. (2008). Local and global processing. Observations from a remote
culture. Cognition, 108, 702-709.
De Fockert, J. W., Caparos, S., Linnell, K. J., & Davidoff, J. (2011). Reduced distractibility in a remote
culture. PLoS ONE, 6, e26337.
30
De Fockert, J.W., Davidoff, J., Fagot, J., Parron, C., & Goldstein, J. (2007). More accurate size contrast
judgments in the Ebbinghaus illusion by a remote culture. Journal of Experimental Psychology:
Human Perception & Performance, 33, 738-742.
De Fockert, J.W., & Wu, S. (2009). High working memory load leads to more Ebbinghaus illusion.
European Journal of Cognitive Psychology, 21, 961-970.
Deregowski, J.B. (1989). Real space and represented space: Cross-cultural perspectives. Behavioral & Brain
Sciences, 12, 51-119.
Doherty, M.J., Campbell, N.M., Tsuji, H.T., & Phillips, W.A. (2010). The Ebbinghaus illusion deceives
adults but not young children. Developmental Science, 13, 714-721.
Doherty, M.J., Tsuji, H., & Phillips, W.A. (2008). The context-sensitivity of visual size perception varies
across cultures. Perception, 37, 1426-1433.
Duemmler, T., Franz, V. H., Jovanovic, B., & Schwarzer, G. (2008). Effects of the Ebbinghaus illusion on
children’s perception and grasping. Experimental Brain Research, 186, 249-260.
Dukette, D., & Stiles, J. (1996). Children’s analysis of hierarchical patterns: Evidence from a similarity
judgement task. Journal of Experimental Child Psychology, 63, 103-140.
Dukette, D., & Stiles, J. (2001). The effects of stimulus density on children’s analysis of hierarchical
patterns. Developmental Science, 4, 233-251.
Elkind, D., Koegler, R. R., & Go, E. (1964). Studies in perceptual development: II. Part-whole perception.
Child Development, 35, 81-90.
Enns, J. T., Brodeur, D. A., & Trick, L. (1998). Selective attention over the lifespan: Behavioral measures.
In J. E. Richards (Ed.), Cognitive neuroscience of attention: A developmental perspective. Mahwah,
NJ: Lawrence Erlbaum Associates.
Fodor, J. (1983). The modularity of mind. Cambridge, MA: MIT Press.
Franklin, A., Clifford, A., Williamson, E., & Davies, I. R. L. (2005). Colour term knowledge does not affect
categorical perception of colour in toddlers. Journal of Experimental Child Psychology, 94, 322-327.
31
Frick, J., Colombo, J., & Allen, J. R. (2000). Temporal sequence of global-local processing in 3-month-old
infants. Infancy, 1, 375-386.
Ghim, H. -R., & Eimas, P. D. (1988). Global and local processing by 3- and 4-month-old infants. Perception
& Psychophysics, 43, 165-171.
Gluckman, M. (1965). Politics, law and ritual in tribal society. Oxford, UK: Blackwell.
Goldberg, M. C., Maurer, D., & Lewis, T. L. (2001). Developmental changes in attention: the effects of
endogenous cueing and of distractors. Developmental Science, 4, 209–219.
Gregory, R. L. (1968). Perceptual illusions and brain models. Proceedings of the Royal Society of London B,
171, 179-296.
Haffenden, A. M., Schiff, K. C., & Goodale, M. A. (2001). The dissociation between perception and action
in the Ebbinghaus illusion. Current Biology, 11, 177-181.
Hanisch, C., Konczak, J., & Dohle, C. (2001). The effect of the Ebbinghaus illusion on grasping behaviour
of children. Experimental Brain Research, 137, 237-245.
Happé, F. (1999). Autism: cognitive deficit or cognitive style? Trends in Cognitive Sciences, 3, 216-222.
Henrich, J., Heine, S. J., & Norenzayan, A. (2010). The weirdest people in the world? Behavioral & Brain
Sciences, 33, 61-135.
Kaldy, Z., & Kovacs, I. (2003). Visual context integration is not fully developed in 4-year-old children.
Perception, 32, 657-666.
Kitayama, S., Duffy, S., Kawamura, T., & Larsen, J. T. (2003). Perceiving an object and its context in
different cultures: A cultural look at New Look. Psychological Science, 14, 201-206.
Leibowitz, H. W., & Judisch, J. M. (1967). The relation between age and the magnitude of the Ponzo
illusion. The American Journal of Psychology, 80, 105-109.
Linnell, K. J., Caparos, S., De Fockert, J. W., & Davidoff, J. (2013). Urbanization decreases attentional
engagement. Journal of Experimental Psychology: Human Perception & Performance.
doi:10.1037/a0031139
32
LoBue, V. (2013). What are we so afraid of? How early attention shapes our most common fears. Child
Development Perspectives, 7, 38-42.
Mareschal, D., Johnson, M. H., Sirois, S., Spratling, M., Thomas, M., & Westermann, G. (2007).
Neuroconstructivism, Vol. I: How the brain constructs cognition. Oxford, UK: Oxford University
Press.
McCauley, R. N., & Henrich, J. (2006). Susceptibility to the Müller-Lyer illusion, theory-neutral
observation, and the diachronic penetrability of the visual input system. Philosophical Psychology,
19, 1-23.
Miyamoto, Y., Nisbett, R. E., & Masuda, T. (2006). Culture and the physical environment. Holistic versus
analytic perceptual affordances. Psychological Science, 17, 113-119.
Mondloch, C. J., Geldart, S., Maurer, D., & De Schonen, S. (2003). Developmental changes in the
processing of hierarchical shapes continue into adolescence. Journal of Experimental Child
Psychology, 84, 20-40.
Nisbett, R. E., Peng, K., Choi, I., & Norenzayan, A. (2001). Culture and systems of thought: Holistic versus
analytic cognition. Psychological Review, 108, 291-310.
Norenzayan, A., Smith, E. E., Kim, B. J., & Nisbett, R. E. (2002). Cultural preferences for formal versus
intuitive reasoning. Cognitive Science, 26, 653-684.
Phillips, W. A., Chapman, K. L. S., & Berry, P. D. (2004). Size perception is less context sensitive in males.
Perception, 33, 79-86.
Phillips, W. A., & Singer, W. (1997). In search of common foundations for cortical computation. Behavioral
& Brain Sciences, 20, 657-722.
Pinter, R., & Anderson, M. M. (1916). The Müller-Lyer illusion with children and adults. Journal of
Experimental Psychology, 1, 200-210.
Ridderinkhof, K. R., & Van der Stelt, O. (2000). Attention and selection in the growing child: Views derived
from developmental psychophysiology. Biological Psychology, 54, 55-106.
33
Rivers, W. H. R. (1905). Observations on the senses of the Todas. British Journal of Psychology, 1, 321-
396.
Roberson, D., Davidoff, J., Davies, I. R. L., & Shapiro, L. R. (2004). The development of color categories in
two languages: A longitudinal study. Journal of Experimental Psychology: General, 133, 554-571.
Rueda, M. R., Fan, J., McCandliss, B. D., Halparin, J. D., Gruber, D. B., Lercari, L. P., & Posner, M. I.
(2004). Development of attentional networks in childhood. Neuropsychologia, 42, 1029-40.
Schwarzkopf, D. S., Song, C., & Rees, G. (2011). The surface area of human V1 predicts the subjective
experience of object size. Nature Neuroscience, 14, 28-30.
Szwed, M., Ventura, P., Querido, L., Cohen, L., & Dehaene, S. (2012). Reading acquisition enhances an
early visual process of contour integration. Developmental Science, 15, 139-149.
Varnum, M.E.W., Grossman, I., Kitayama, S., & Nisbett, R.E. (2010). The origin of cultural differences in
cognition: The social orientation hypothesis. Current Directions in Psychological Science, 19, 9-13.
Vouloumanos, A., & Werker, J. F. (2007). Listening to language at birth: Evidence for a bias for speech in
neonates. Developmental Science, 10, 159-171.
Waszak, F., Li, S.-C., & Hommel, B. (2010). The development of attentional networks: Cross-sectional
findings from a life span sample. Developmental Psychology, 46, 337-349.
Weintraub, D. J. (1979). Ebbinghaus illusion: Context, contour, and age influence the judged size of a circle
amidst circles. Journal of Experimental Psychology: Human Perception and Performance, 5, 353-
364.
Werker, J. F., Yeung, H. H., & Yoshida, K. A. (2012). How do infants become experts at native-speech
perception? Current Directions in Psychological Science, 21, 221-226.
Yamazaki, Y., Otsuka, Y., Kanazawa, S., & Yamaguchi, M. K. (2010). Perception of the Ebbinghaus
illusion in 5-to 8-month-old infants. Japanese Psychological Research, 52, 33-40.
34
Yoshida, K. A., Iversen, J. R., Patel, A. D., Mazuka, R., Nito, H., Gervain, J., & Werker, J. F. (2010). The
development of perceptual grouping biases in infancy: a Japanese-English cross-linguistic study.
Cognition, 115, 356-361.
FIGURE CAPTIONS
Figure 1: Examples of stimuli used in the Ebbinghaus illusion task. Participants are asked to say which of the
two central (target) circles were larger. In the experiments reported in this paper, the target circles were
coloured orange and the surrounding (inducer) circles were grey. In each of the three conditions shown here,
the target circle on the right if 2% larger than the one on the left. In Western participants, the misleading
context condition typically gives the incorrect impression that the circle on the left is larger. The helpful
context condition enhances performance by emphasising the actual size differences.
Figure 2: Experiment 1: Size discrimination accuracy in Traditional Himba and UK children between 3 and
10 years, with and without the influence of visual size context. Accuracy at identifying the largest of the two
target circles is measured (chance performance is 50%). Panels A-C show performance in each of the size
difference conditions in separate graphs for each age-group. In the “context” conditions, the inducers are
expected (in Western adults) to give rise to a size contrast illusion whereby the accuracy of the size
discrimination was reduced, particularly when differences between the two targets were smaller. In the
“helpful” condition (tested at a 2% size difference only), a size contrast illusion leads to improved
performance. To aid comparisons across age group and culture, Panel D reports a measure of performance
across all size difference conditions. Lower brackets indicate which groups showed a significant illusion (see
Table 2). No significant illusion was observed in the Himba age-groups. Only the 9- to 10-year-old UK
children showed a significant illusion. The higher brackets indicate significant differences in the extent of
illusion between cultures (* = uncorrected p < .05, ** = uncorrected p < .01, *** = uncorrected p < .001, n.s.
= not significant).
Figure 3: Experiment 2: Size discrimination accuracy in Traditional Himba and UK participants between 11
years and adulthood, with and without the influence of visual size context. Accuracy at identifying the
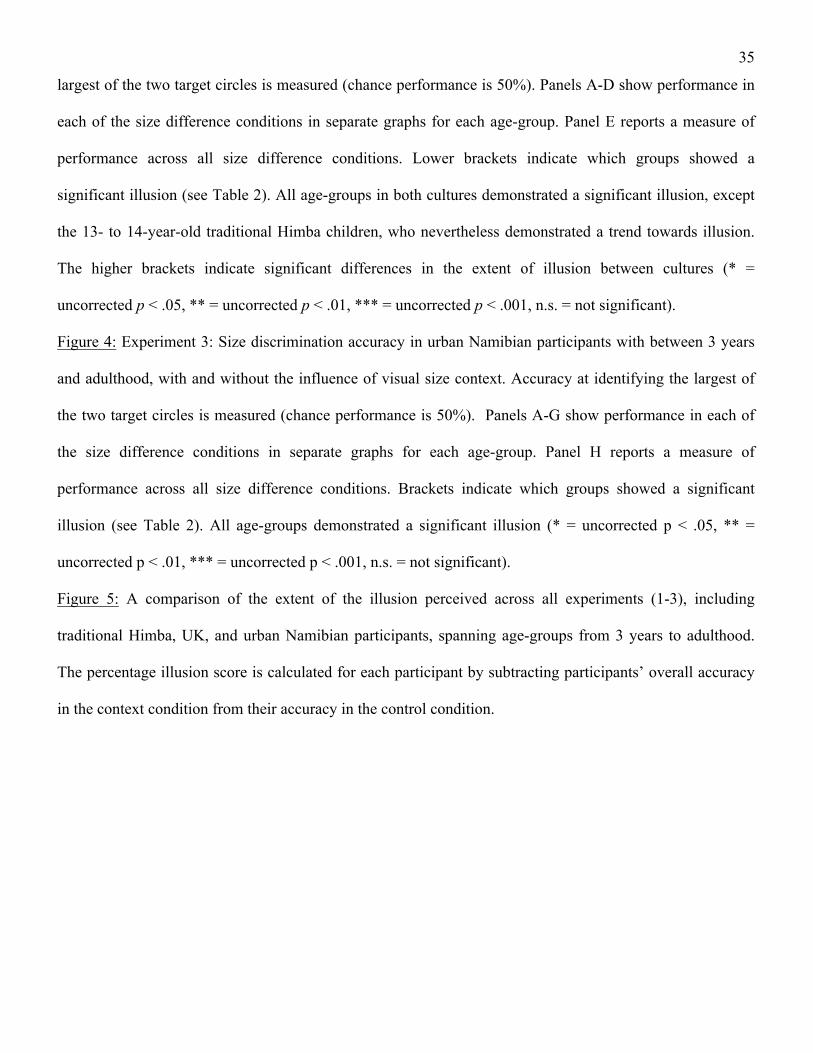
35
largest of the two target circles is measured (chance performance is 50%). Panels A-D show performance in
each of the size difference conditions in separate graphs for each age-group. Panel E reports a measure of
performance across all size difference conditions. Lower brackets indicate which groups showed a
significant illusion (see Table 2). All age-groups in both cultures demonstrated a significant illusion, except
the 13- to 14-year-old traditional Himba children, who nevertheless demonstrated a trend towards illusion.
The higher brackets indicate significant differences in the extent of illusion between cultures (* =
uncorrected p < .05, ** = uncorrected p < .01, *** = uncorrected p < .001, n.s. = not significant).
Figure 4: Experiment 3: Size discrimination accuracy in urban Namibian participants with between 3 years
and adulthood, with and without the influence of visual size context. Accuracy at identifying the largest of
the two target circles is measured (chance performance is 50%). Panels A-G show performance in each of
the size difference conditions in separate graphs for each age-group. Panel H reports a measure of
performance across all size difference conditions. Brackets indicate which groups showed a significant
illusion (see Table 2). All age-groups demonstrated a significant illusion (* = uncorrected p < .05, ** =
uncorrected p < .01, *** = uncorrected p < .001, n.s. = not significant).
Figure 5: A comparison of the extent of the illusion perceived across all experiments (1-3), including
traditional Himba, UK, and urban Namibian participants, spanning age-groups from 3 years to adulthood.
The percentage illusion score is calculated for each participant by subtracting participants’ overall accuracy
in the context condition from their accuracy in the control condition.
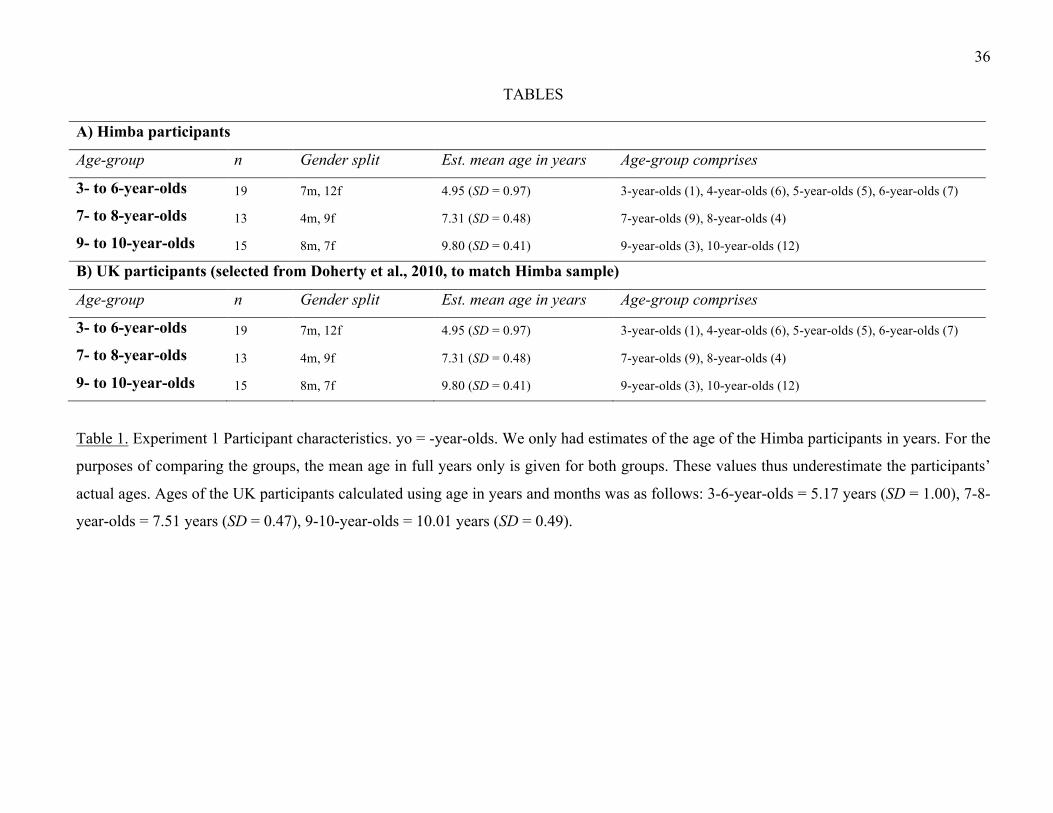
36
TABLES
A) Himba participants
Age-group n Gender split Est. mean age in years Age-group comprises
3- to 6-year-olds 19 7m, 12f 4.95 (SD = 0.97) 3-year-olds (1), 4-year-olds (6), 5-year-olds (5), 6-year-olds (7) 7- to 8-year-olds 13 4m, 9f 7.31 (SD = 0.48) 7-year-olds (9), 8-year-olds (4) 9- to 10-year-olds 15 8m, 7f 9.80 (SD = 0.41) 9-year-olds (3), 10-year-olds (12) B) UK participants (selected from Doherty et al., 2010, to match Himba sample)
Age-group n Gender split Est. mean age in years Age-group comprises
3- to 6-year-olds 19 7m, 12f 4.95 (SD = 0.97) 3-year-olds (1), 4-year-olds (6), 5-year-olds (5), 6-year-olds (7) 7- to 8-year-olds 13 4m, 9f 7.31 (SD = 0.48) 7-year-olds (9), 8-year-olds (4) 9- to 10-year-olds 15 8m, 7f 9.80 (SD = 0.41) 9-year-olds (3), 10-year-olds (12)
Table 1. Experiment 1 Participant characteristics. yo = -year-olds. We only had estimates of the age of the Himba participants in years. For the
purposes of comparing the groups, the mean age in full years only is given for both groups. These values thus underestimate the participants’
actual ages. Ages of the UK participants calculated using age in years and months was as follows: 3-6-year-olds = 5.17 years (SD = 1.00), 7-8-
year-olds = 7.51 years (SD = 0.47), 9-10-year-olds = 10.01 years (SD = 0.49).

37
Culture
TH participants UK participants UH participants
Age-group Mean (SD) t (df) p d Mean (SD) t (df) p d Mean (SD) t (df) p d
3- to 6-year-olds 5.26 (17.20) 1.33 (18) .199 .31 1.58 (16.50) .42 (18) .682 .10 10.28 (13.00) 3.35 (17) .004 .79
7- to 8-year-olds 6.92 (13.62) 1.83 (12) .092 .51 16.54 (15.60) 3.82 (12) .002 1.06 13.75 (15.12) 4.07 (19) .001 .91
9- to 10-year-olds 7.00 (18.40) 1.47 (14) .163 .38 30.67 (15.34) 7.74 (14) <.001 2.00 14.75 (19.09) 3.46 (19) .003 .77
11- to 12-year-olds 17.50 (15.83) 4.69 (17) <.001 1.11 46.67 (17.15) 11.55 (17) <.001 2.72 21.43 (10.51) 9.35 (20) <.001 2.04
13- to 14-year-olds 11.18 (18.25) 2.53 (16) .022 .61 43.53 (22.06) 8.14 (16) <.001 1.97 23.82 (14.53) 6.76 (16) <.001 1.64
15- to 17-year-olds 12.00 (9.78) 3.88 (9) .004 1.23 46.50 (23.69) 6.21 (9) <.001 1.96 19.74 (10.86) 7.92 (18) <.001 1.82
Adults 10.74 (10.31) 6.07 (33) <.001 1.04 47.50 (15.96) 15.75 (27) <.001 2.98 19.31 (14.33) 6.32 (21) <.001 1.35
Table 2. The results of One-sample t-tests comparing the illusion score within each age-group and each culture against chance (zero) (across
Experiments 1, 2, and 3). Underlined p values indicate those groups who showed a significant illusion. Significance was determined according
to a corrected alpha level (see main text for the details of what the alpha level was corrected to for each experiment).

38
A) Himba participants
Age-group N Gender split Est. mean age in years Age-group comprises
11- to 12-year-olds 18 9m, 9f 11.67 (SD = 0.49) 11-year-olds (6), 12-year-olds (12)
13- to 14-year-olds 17 5m, 12f 13.41 (SD = 0.51) 13-year-olds (10), 14-year-olds (7)
15- to 17-year-olds 10 8m, 2f 16.30 (SD = 0.95) 15-year-olds (3), 16-year-olds (1), 17-year-olds (6)
Adults 34 14m, 20f 20.62 (SD = 2.78) 18- to 26-year-olds
B) UK participants
Age-group n Gender split Est. mean age (years) Age-group comprises
11- to 12-year-olds 18 10m, 8f 11.67 (SD = 0.49) 11-year-olds (6), 12-year-olds (12)
13- to 14-year-olds 17 5m, 12f 13.41 (SD = 0.51) 13-year-olds (10), 14-year-olds (7)
15- to 17-year-olds 10 6m, 4f 16.30 (SD = 0.95) 15-year-olds (3), 16-year-olds (1), 17-year-olds (6)
Adults 28 13m, 15f 19.36 (SD = 1.66) 18- to 25-year-olds
Table 3. Experiment 2 participant characteristics. yo = -year-olds. We only had estimates of the age of the Himba participants in years. For the
purposes of comparing the groups, the mean age in full years only is given for both groups. These values thus underestimate the participants’
actual ages. Ages of the UK participants calculated using age in years and months was as follows: 11- to 12-year-olds = 12.08 years (SD =
0.52), 13- to 14-year-olds = 13.85 years (SD = 0.57), 15- to 17-year-olds = 16.66 years (SD = 1.17).

39
Urban Namibian participants
Age-group n Gender split Mean age in years Mean years urban Age-group comprises
3- to 6-year-olds 18 8m, 10f 5.56 (SD = 0.62) 5.56 (SD = 0.62) 4-year-olds (1), 5-year-olds (6), 6-year-olds (11)
7- to 8-year-olds 20 11m, 9f 7.45 (SD = 0.51) 7.45 (SD = 0.51) 7-year-olds (11), 8-year-olds (9)
9- to 10-year-olds 20 11m, 9f 9.65 (SD = 0.49) 7.55 (SD = 3.61) 9-year-olds (7), 10-year-olds (13)
11- to 12-year-olds 22 13m, 9f 11.68 (SD = 0.48) 8.95 (SD = 3.76) 11-year-olds (7), 12-year-olds (15)
13- to 14-year-olds 17 6m, 11f 13.41 (SD = 0.51) 9.94 (SD = 5.09) 13-year-olds (10), 14-year-olds (7)
15- to 17-year-olds 18 7m, 11f 15.72 (SD = 0.75) 9.15 (SD = 5.79) 15-year-olds (8), 16-year-olds (7), 17-year-olds (3)
Adults 19 7m, 12f 21.00 (SD = 2.16) 10.78 (SD = 8.64) 18- to 26-year-olds
Table 4. Experiment 3 participant characteristics. yo = -year-olds. We only had access to the ages of the Urban Namibian participants in years.
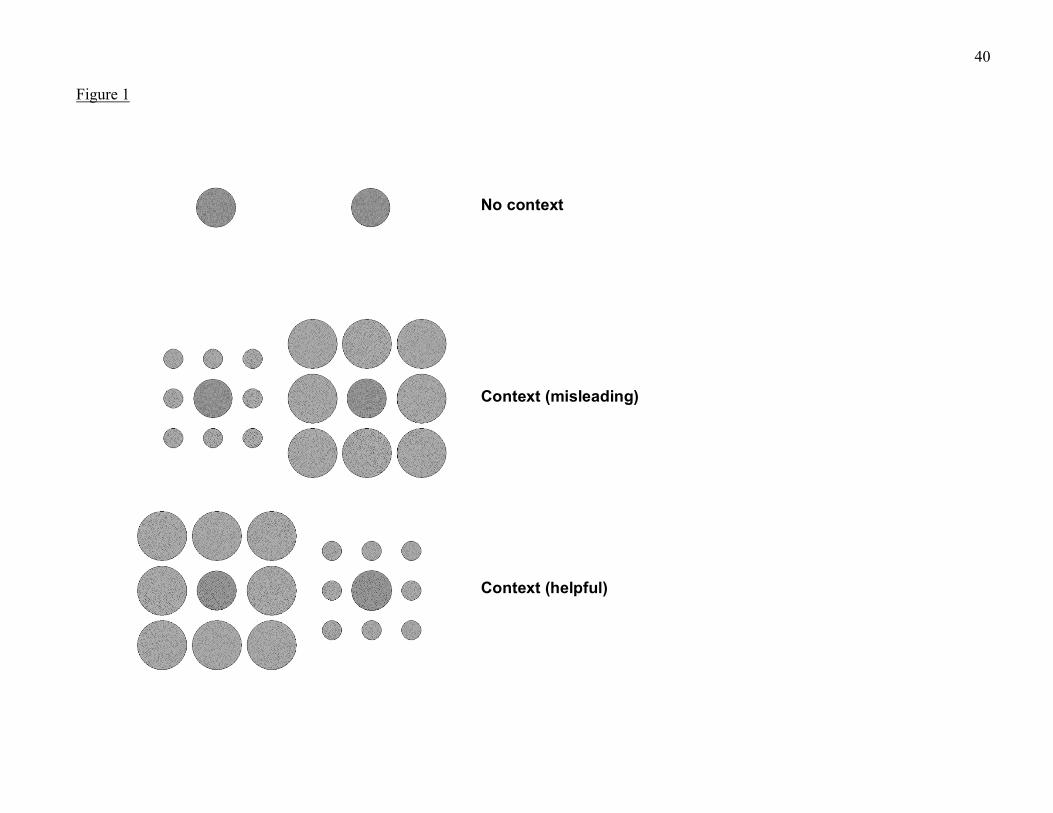
40
Figure 1
No#context#
Context#(misleading)#
Context#(helpful)#
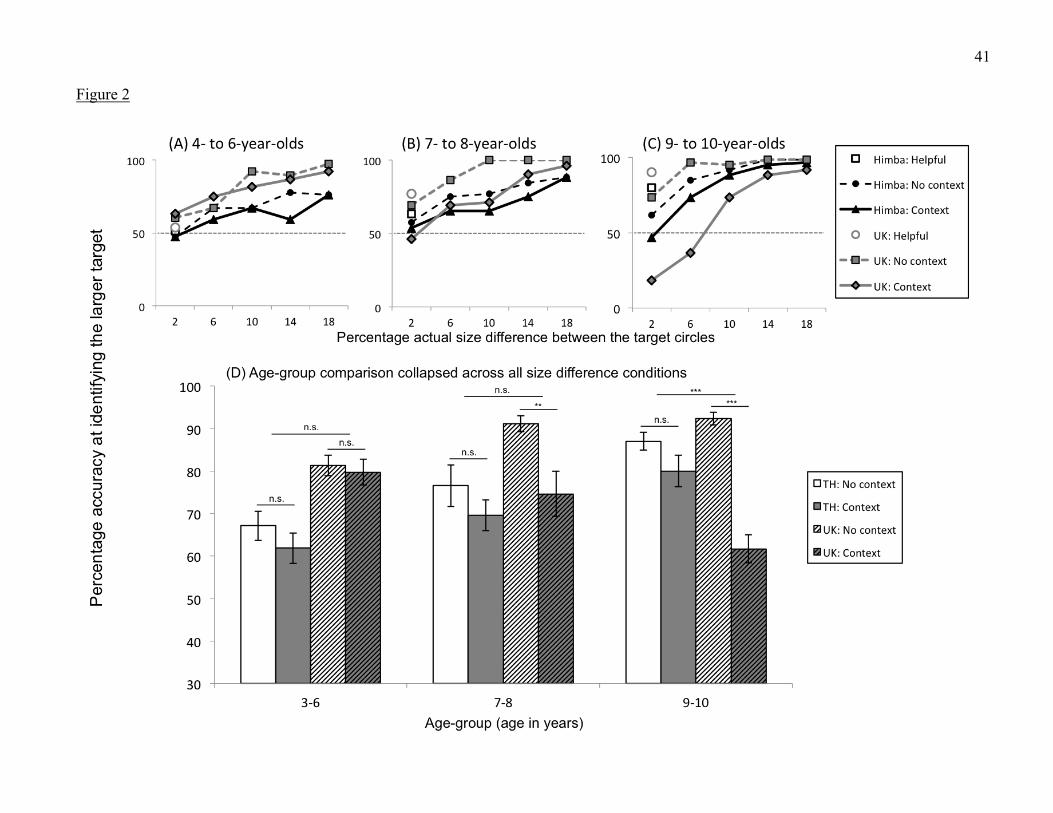
41
Figure 2

42
Figure 3

43
Figure 4
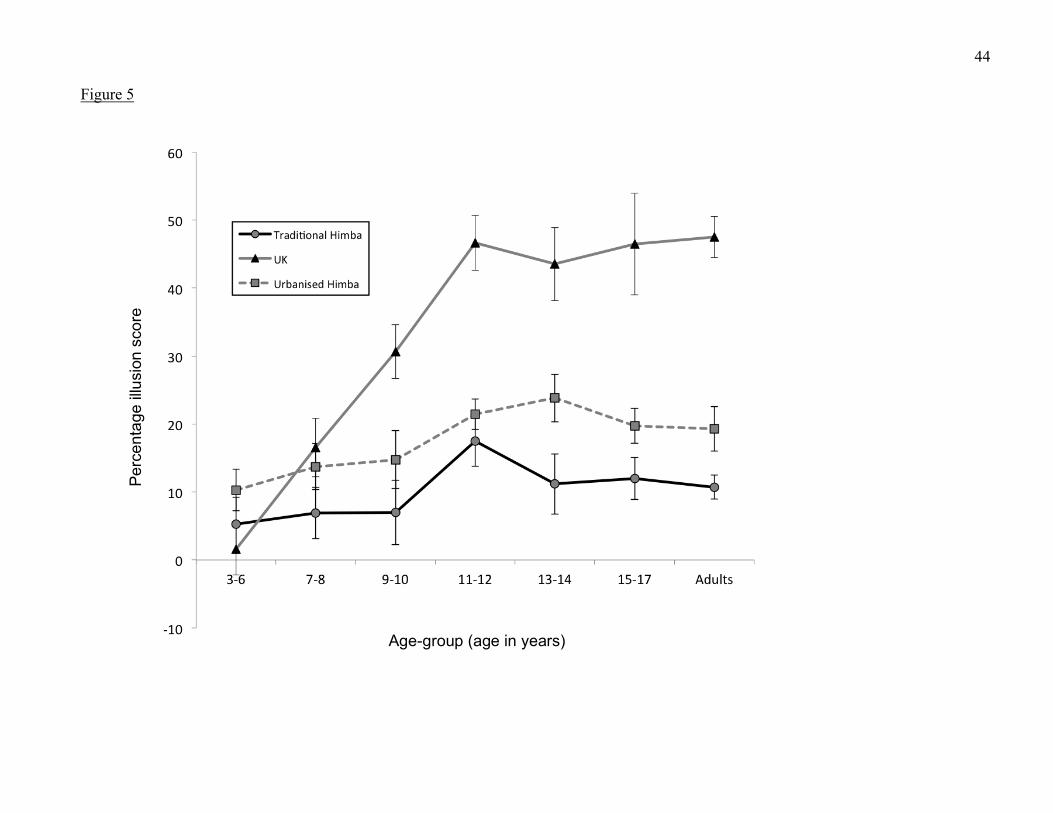
44
!Figure 5!
!Percentage!illusion!score!
Age0group!(age!in!years)
![untitled [research.gold.ac.uk]research.gold.ac.uk/20064/1/Multicultural Conviviality in the Mids… · Web viewThe second step develops the notion of conviviality by identifying the](https://static.fdocuments.us/doc/165x107/5e15864dffc9ab40032628d8/untitled-conviviality-in-the-mids-web-viewthe-second-step-develops-the-notion.jpg)


![Replication and Analysis of Ebbinghaus’ Forgetting Curve · Ebbinghaus [8]gives exacttesting datesforeachoftheshorttime-intervalsbut notforthelon-gerones (24hoursand up).Hence,](https://static.fdocuments.us/doc/165x107/5bdef2e709d3f237288b4a7d/replication-and-analysis-of-ebbinghaus-forgetting-curve-ebbinghaus-8gives.jpg)


