RUNNING HEAD: Breed effect on nutritional value of beef 2...
29
1 RUNNING HEAD: Breed effect on nutritional value of beef 1 2 Fatty acid profile, mineral content and palatability of beef from a multibreed Angus- 3 Brahman population 4 5 S. Flowers, H. Hamblen, J.D. Leal-Gutiérrez, M. A. Elzo, D. D. Johnson, and R. G. Mateescu* 2 6 *Department of Animal Sciences, University of Florida, Gainesville, FL 32608, USA 7 8 9 1 This research was supported by Florida Agricultural Experiment Station Hatch FLA-ANS- 10 005548. 11 2 Correspondence: R. G. Mateescu, University of Florida, 100B Animal Sciences, Gainesville, FL 12 32608, USA. Phone: 352-392-2367 E-mail: [email protected] 13 14
Transcript of RUNNING HEAD: Breed effect on nutritional value of beef 2...

1
RUNNING HEAD: Breed effect on nutritional value of beef 1
2
Fatty acid profile, mineral content and palatability of beef from a multibreed Angus-3
Brahman population 4
5
S. Flowers, H. Hamblen, J.D. Leal-Gutiérrez, M. A. Elzo, D. D. Johnson, and R. G. Mateescu*2 6
*Department of Animal Sciences, University of Florida, Gainesville, FL 32608, USA 7
8
9
1This research was supported by Florida Agricultural Experiment Station Hatch FLA-ANS-10
005548. 11
2Correspondence: R. G. Mateescu, University of Florida, 100B Animal Sciences, Gainesville, FL 12
32608, USA. Phone: 352-392-2367 E-mail: [email protected] 13
14

2
ABSTRACT: 15
Consumers demand meat that is both healthy and palatable, two attributes of meat that 16
are affected by lipid content. Many cattle in the southern US are Bos indicus influenced, as this 17
improves the ability to survive and thrive in these subtropical regions. However, these animals 18
tend to have leaner carcasses and less marbled meat products. Thus, the objective of this study 19
was to examine the effect of percent Brahman genetics on carcass characteristics, palatability, 20
fatty acids profile and minerals content in LM of steers from a multibreed population ranging 21
from 100% Angus to 100% Brahman. Breed effect was significant for birth weight (P = 0.0003), 22
weaning weight (P < 0.0001), HCW (P < 0.0001), dressing percentage (P = 0.0008), ribeye area 23
(P = 0.002), quality grade (P < 0.0001), and marbling score (P < 0.0001), and all these traits 24
except dressing percentage decreased as the percentage of Brahman increased. Among 25
palatability traits, breed group had a significant effect only on tenderness (TEND) and 26
connective tissue (CT) scores (P < 0.0001). Least squares means decreased from Angus (5.75 ± 27
0.13 TEND score and 6.29 ± 0.14 CT score, respectively) to Brahman (4.84 ± 0.10 TEND score 28
and 5.49 ± 0.11 CT score, respectively) as indicated by a significant linear affect. Breed group 29
significantly affected the percentage of several individual fatty acids, saturated fatty acids (SFA) 30
and polyunsaturated fatty acids (PUFA), but not monounsaturated fatty acids (MUFA). The 31
100% Angus group had the highest percentage of SFA at 49.92%, which was significantly higher 32
(P < 0.05) than the SFA percentage in the 50%, 75%, and 100% Brahman breed groups. Brangus 33
animals also had an increased SFA percentage compared to the 100% Brahman animals (P < 34
0.05). No significant effect was identified for the concentration of PUFA across the six breed 35
groups (P = 0.14). Least squares means decreased from 100% Angus to 100% Brahman for 36
concentration of total fat, SFA and MUFA (g/mg meat). The concentration of magnesium (P < 37

3
0.0001), phosphorus (P = 0.06) and potassium (P = 0.06) increased as the percentage of 38
Brahman increased. Our study shows that breed has a significant effect on the fatty acid profile 39
of beef. Cattle with high Brahman percentage, which are characterized by lower marbled meat, 40
will present a more favorable healthfulness profile with reduced content of SFA and MUFA but 41
the same content of PUFA as purebred Angus animals. 42
43
Key words: beef cattle, Bos indicus, healthfulness, mineral content 44
45
INTRODUCTION 46
Brahman genetics are extensively used in crossbreeding programs in the southeastern 47
regions of the United States (Cundiff et al., 2012; Lamy et al., 2012), characterized by hot and 48
humid conditions typical of tropical and subtropical environments. While Brahman cattle are 49
well known for their adaptability in subtropical climates (Hansen, 2004), they tend to produce 50
less marbling within the final beef product (Johnson et al., 1990; Pringle et al., 1997; Elzo et al., 51
2012). Several studies addressing relevant economic traits such as growth, carcass and 52
reproduction in Bos indicus influenced cattle prevalent in the southern US have been published 53
(Riley, 2002; Riley et al., 2012; Elzo et al., 2014; Elzo et al., 2016; Elzo et al., 2017; Leal-54
Gutiérrez et al., 2018), but information regarding fatty acid composition and mineral content are 55
scarce. 56
A recent Beef Demand study (2013, Schroder et al.) identified seven factors as 57
consequential for driving beef demand. Ranked in the order of their relevance to consumers these 58
factors are beef price, food safety, product quality, health, nutrition, social aspects, and 59
sustainability. Given that the industry cannot control price, the report identified food safety, 60
4
product quality, nutritional value and healthfulness as the key attributes that the industry can and 61
should focus on. Beef consumption helps Americans fulfill their daily-recommended dietary 62
intake of protein, by providing 20g of protein per 100g of beef consumed, while also providing 63
many nutrients with positive effects on human health (mono (MUFA) and polyunsaturated fatty 64
acids (PUFA), such as omega-3 and conjugated linoleic acid (CLA), iron, zinc, vitamin B6, etc.). 65
However, beef is also associated with characteristics that are often perceived as negative, such as 66
high levels of saturated fatty acids (SFA) and high caloric content. Knowledge of the role of Bos 67
indicus influenced cattle concerning these areas is essential for the prosperity of the beef industry 68
in the southern US. 69
Intramuscular fat depot or “marbling” is a key factor in determining carcass value. While 70
Bos taurus breeds of cattle, such as Angus, are known for their superior marbling potential, Bos 71
indicus breeds have the tendency to produce less marbled beef products. The amount of 72
intramuscular fat described by marbling and the fatty acid composition determines the 73
healthfulness value of the beef product. Polyunsaturated (PUFA) and monounsaturated fatty 74
acids (MUFA) are known to have cholesterol-lowering properties, and reduce the risk of 75
coronary vascular disease among other healthful attributes. On the contrary, several short chain 76
saturated fatty acids (SFA) are associated with increased risk of coronary vascular disease 77
(Bonanome and Grundy, 1988; Derr et al., 1993; Judd et al., 2002; Brouwer et al., 2010). 78
Breed, along with other factors such as sex, age and diet (Wood et al., 2008; Mateescu, 79
2015), has an impact on both the amount of marbling and the fatty acid composition. Numerous 80
recent reports are available regarding the fatty acid composition of Bos taurus breeds (Nogi et 81
al., 2011; Xu et al., 2013; Buchanan et al., 2015; Ekine-Dzivenu et al., 2017; Zhu et al., 2017), 82
but information on the quality of fat and the healthfulness and nutritional value of beef from Bos 83

5
indicus influenced cattle, in particular Brahman, is scarce (Dinh et al., 2010; Campbell et al., 84
2016). 85
The objective of this study was to characterize the carcass and palatability traits, fatty 86
acid composition, and mineral content in a multibreed cattle population typical to the southern 87
US and estimate the effect of breed composition on nutritional and healthfulness value of beef. 88
89
MATERIALS AND METHODS 90
Animals and Management 91
The research protocol was approved by the University of Florida Institutional Animal 92
Care and Use Committee number 201003744. Cattle used in this study were from the University 93
of Florida multibreed Angus-Brahman herd (Elzo et al., 2014). A total of 230 steers across six 94
breed groups based on the percentages of Angus breed composition were used from this herd: 95
Angus = 100 to 80% (n = 39); 75% Angus = 79 to 65% (n = 33); Brangus = 62.5% (n = 30); 50% 96
Angus = 59 to 40% (n = 42); 25% Angus = 39 to 20% (n = 27); Brahman = 19 to 0% (n = 59). 97
Steers born in 2014 and 2015 were transported to a contract feeder (Quincey Farms, Chiefland, 98
FL) where they were provided a standard feedlot diet consisting of corn, protein, vitamins, and 99
minerals until they reached a subcutaneous fat thickness over the ribeye of approximately 1.27 100
cm assessed thorough ultrasound. The concentrate diet had, on the average, 89.7% of DM, 14.4% 101
of CP, 1.5 Mcal/kg DM of NEm, and 1.1 Mcal/kg DM of NEg. As cattle achieved appropriate 102
degree of back fat thickness, they were transported to a commercial packing plant where they 103
were harvested under USDA FSIS inspection. Steers were harvested in groups of 15-25 animals 104
and the average slaughter age was 18.76±1.13 mo. 105
Carcass Evaluation and Sample Collection 106

6
At 24 hours postmortem, carcasses were ribbed between the 12th and 13th rib, per industry 107
standard and carcass measurements were evaluated for each animal: HCW, dressing percentage 108
(DP), marbling score (MS; 100 to 199 = practically devoid, 200 to 299 = traces, 300 to 109
399=slight, 400 to 499=small, 500 to 599=modest, 600 to 699=moderate, 700 to 799=slightly 110
abundant, 800 to 899=moderately abundant, and 900 to 999=abundant), ribeye area (REA), and 111
fat over the eye (FOE). USDA quality grades and yield grades were calculated according to 112
industry standards. Following carcass evaluation, two 2.54cm thick steaks were removed from 113
the anterior end of the carcass ribbing and transferred to the University of Florida Meat 114
Processing Center (Gainesville, FL). Steaks were wet aged for 14 days, then frozen (-20 °C) until 115
subsequent fatty acid, mineral, tenderness, and sensory analysis. 116
Warner-Bratzler Shear Force and Sensory Panel Analysis 117
One of the two frozen steaks from each animal was thawed at 3°C for 24 hours and 118
cooked on an open-top, electric grill. Steaks were cooked to an internal temperature of 71°C, 119
equivalent to a medium degree of doneness. Internal temperature was monitored using copper-120
constant thermocouples (Omega Engineering Inc., Stamford, CT) located in the geometric center 121
of each steak. Temperature was recorded by a 1100 Labtech Notebook Pro Software version 12.1 122
(Computer Boards Inc., Middleboro, MA). Once cooked, steaks were chilled at 3°C for 24 hours. 123
After chilling, six 1.27 cm cores were removed from each steak parallel to the muscle fibers. 124
Each of the six cores were sheared through the center (crosshead speed of 200 mm/min) with a 125
Warner-Bratzler shear force (WBSF) head attached to a 490 N load cell using an Instron 126
Universal Testing Machine (Instron Corporation, Canton, Massachusetts, USA). 127
The other frozen steak from each animal was handled and cooked in the same manner as 128
the WBSF samples. Once cooked, steaks were cut into 1.27 cm cubes and served warm to trained 129
7
sensory panelists. The sensory panel consisted of 7 to 11 trained members (AMSA, 1995) who 130
evaluated each sample for various meat palatability traits. Sensory panel measurements analyzed 131
by the sensory panelists included: tenderness score (TEND; 1=extremely tough to 8=extremely 132
tender), connective tissue score (CT; 1=abundant amount to 8=none detected), juiciness score 133
(JUIC; 1=extremely dry to 8=extremely juicy), beef flavor score (FLAV; 1=extremely bland to 134
8=extremely intense), and off-flavor score (OFLAV; 1=extreme off- flavor to 6=none detected). 135
Fatty Acid Extraction and Gas Chromatography Analysis 136
After trimming external fat and connective tissue, a thin shaving across the entire steak 137
surface was removed from each steak sample and powdered in liquid nitrogen to obtain a 138
homogenized sample of the steak. Fatty acid extraction and analysis was performed at the W. M. 139
Keck Metabolomics Research Laboratory, Iowa State University (Ames, IA). About 200 mg of 140
finely ground steak samples was extracted into 1mL of 2:1 Chloroform: Methanol mixture. The 141
extracted fats were trans-esterified with 25% Sodium Methoxide in methanol. The resulting Fatty 142
Acid Methyl Esters (FAMES) were extracted into hexane and detected on Agilent 7890A GC-143
FID instrument. One microliter of the sample was injected into an Agilent 7890. A Gas 144
Chromatograph equipped with a flame ionization detector was used for separation and 145
quantification of the FAMEs. The analysis was performed on Agilent CP-Wax 52CB column 146
(15m, 0.32mm, 0.5um). The oven temperature program was as follows. Initial temperature of 147
100°C, increased to 170°C with a ramp of 2°C/min, increased to 180°C with a ramp of 148
0.5°C/min, to a final temperature of 250°C with a ramp of 1°C/min and held for 3min. The inlet 149
temperature was 250°C and detector temperatures were 220°C. Helium was used as the carrier 150
gas. Supelco 37 FAME mix (Catalog # CRM47885 SUPELCO) was used to generate the 151
calibration curve for identification and quantification of FAMES. 152

8
Twenty eight individual fatty acids and three groups of fatty acids based on saturation 153
level (SFA, MUFA, PUFA) were calculated and expressed as percentage of the total fatty acids 154
and as mg/g of tissue. 155
Mineral concentrations 156
Mineral content of LM samples were determined by inductively coupled plasma-optical 157
emission spectroscopy (ICP-OES, SPECTRO Analytical Instruments, Mahwah, NJ). The 158
samples were dried at 105ºC for 18 to 20 h according to AOAC official method 934.01 (Davis 159
and Lin, 2005), and moisture content was calculated. Dried samples were subjected to a closed-160
vessel microwave digestion process (CEM, MDS-2000, Matthews, NC) with 5 mL concentrated 161
nitric acid and 2 mL 30% hydrogen peroxide according to AOAC official methods 999.10 162
(Jorhem and Engman, 2000). The microwave was programmed as follows: 250 watts for 5 min, 163
630 watts for 5 min, 500 watts for 20 min, and 0 watts for 15 min. Digested samples were 164
transferred to 25 mL volumetric flasks and diluted with deionized water. The concentrations of 165
iron, phosphorus, potassium, sodium, magnesium and zinc were then measured by ICP-OES. 166
Statistical Analysis 167
All statistical analyses were performed using SAS 9.4 (SAS Inst. Inc., Cary, NC). The 168
MEANS procedure was used to produce descriptive statistics for fatty acid composition data. 169
Traits were analyzed using the MIXED procedure of SAS. Models for all traits included year of 170
birth as a random effect and breed as fixed effects. Breed-group least squares means were 171
separated using LSMEANS with the PDIFF option. To estimate the linear and quadratic effect of 172
percent Brahman genetics, the breed groups were recoded as 0, 1, 1.5, 2, 3 and 4 indicating 0%, 173
25%, 37.25%, 50%, 75%, and 100% Brahman genetics. The model included year of birth as a 174
random effect and the linear and quadratic breed as a covariate. When the quadratic effect was 175
9
not significant, it was dropped and a model including just the linear effect was used. The 176
intercept from this model estimates the effect of 100% Angus genes (adjusted for random year of 177
birth effect) and the estimated regression coefficients represent the effect of replacing 25% of 178
Angus genes by Brahman genes. 179
180
RESULTS AND DISCUSSION 181
Table 1 presents summary statistics for traits evaluated in this study in a population of 182
230 animals with breed composition ranging from 100% Angus to 100% Brahman. 183
Carcass Characteristics 184
Least squares means of carcass measurements for the six breed groups in this study are 185
presented in Table 2. The carcass data for the total 230 animals is representative of industry 186
average quality and yield grades (Shackelford et al., 2012) and similar to previously reported 187
data on this multibreed population (Elzo et al., 2012; Elzo et al., 2014; Elzo et al., 2016). Breed 188
effect was significant for BWT (P = 0.0003), WWT (P < 0.0001), HCW (P < 0.0001), DP (P = 189
0.0008), REA (P = 0.002), QG (P < 0.0001), and MS (P < 0.0001). No breed differences were 190
identified for FOE which was expected as a direct consequence of animals slaughtered at a 191
similar fat thickness end point. Cattle with the highest percent Brahman (Brahman breed group) 192
had the lowest HCW and REA compared to all other breed groups. This is in agreement with 193
previous studies which reported Angus cattle had heavier HCW and greater REA than Brahman 194
(Peacock et al., 1979; Lunt et al., 1985; Williams et al., 2010, Elzo et al., 2012). 195
Marbling score decreased from Angus (464.12 ± 13.12 units) to Brahman (352.85 ± 196
10.34 units), with the highest percentage Brahman animals having statistically lower marbling 197
scores than all the other breed groups (P < 0.0001). This was also reflected in the QG which 198

10
followed the same trend across breed groups with Brahman having the lowest QG (547.37 ± 5.6) 199
compared to all other breed compositions. It is important to point out that the Angus, 75% Angus 200
and Brangus breed groups had a marbling score higher than the industry average (449 ± 94.8), 201
and the Brahman breed group was within one standard deviation of this average (Shackelford et 202
al., 2012). 203
Table 2 also contains least squares means for the six breed groups for meat palatability 204
traits. No significant differences were found for beef flavor or off flavor across the breed groups. 205
Breed group had a significant effect only on TEND and CT traits recorded during the trained 206
sensory panel (P < 0.0001). A negative linear effect was significant with least squares means 207
decreasing from Angus (5.75 ± 0.13 TEND score and 6.29 ± 0.14 CT score, respectively) to 208
Brahman (4.84 ± 0.10 TEND score and 5.49 ± 0.11 CT score, respectively). Previous reports 209
consistently identified animals with high Brahman influence to have lower sensory tenderness 210
scores and higher connective tissue scores (Johnson et al., 1990; Pringle et al., 1997; Elzo et al., 211
2012). The lower tenderness of Brahman cattle has been attributed to increased postmortem 212
calpastatin activity (Wheeler et al., 1990; Shackelford et al., 1991; Pringle et al., 1997) which 213
results in a reduction in desmin and troponin-T degradation (Phelps et al., 2017). There are two 214
important points related to the tenderness qualities of steaks from Angus, Brahman and their 215
crossbreds evaluated by WBSF or through the sensory panel. When using the WBSF, considered 216
an objective measure of tenderness, no significant differences were detected along the breed 217
composition continuum from purebred Angus to purebred Brahman. The coefficient of variation 218
obtained from a regression analysis of sensory tenderness using WBSF values was 13.34 219
indicating variation in the sensory tenderness which is not captured by the WBSF. However, a 220
statistically significant difference was found when tenderness was evaluated either by the TEND 221
11
or CT score during the trained sensory panel. Among other factors, tenderness as perceived by 222
consumers is determined by the amount and solubility of the connective tissue and the amount of 223
marbling. Marbling has a major effect on the perceived juiciness and a high correlation was 224
reported between tenderness and juiciness (Mateescu et al., 2015), where steaks with high 225
marbling score have superior juiciness and overall liking (Killinger et al., 2004; Okumura et al., 226
2007; Legako et al., 2015). It is however important to highlight the fact that although statistically 227
significant, these differences are insignificant in terms of changes in tenderness that can be 228
perceived by regular, untrained consumers (Watson et al., 2008). These results indicate that meat 229
from Bos indicus influenced cattle tends to be less tender compared to meat from Angus animals, 230
but these differences, when measured objectively using WBSF, are not statistically significant. 231
Moreover, when considering that the minimum difference the average consumer can detect is a 232
0.5 kg difference in WBSF when consuming meat at home (Miller et al., 1995), the differences 233
found in this study are not sufficiently large to be detectable by consumers. These results suggest 234
that selection programs aimed at improving tenderness in these Bos indicus populations are 235
producing the intended results and the historical perception of tougher beef associated with 236
indicine influenced cattle needs to be reevaluated. 237
Breed Effect on Fatty Acid Composition 238
Percentages of the three main fatty acids categories in the overall population were as 239
expected, with approximately 47.52 to 49.92% of the total lipid content being represented by 240
SFA, 45.10 to 46.10% by MUFA, and 3.98 to 7.38% PUFA (Pitchford et al., 2002; Daley et al., 241
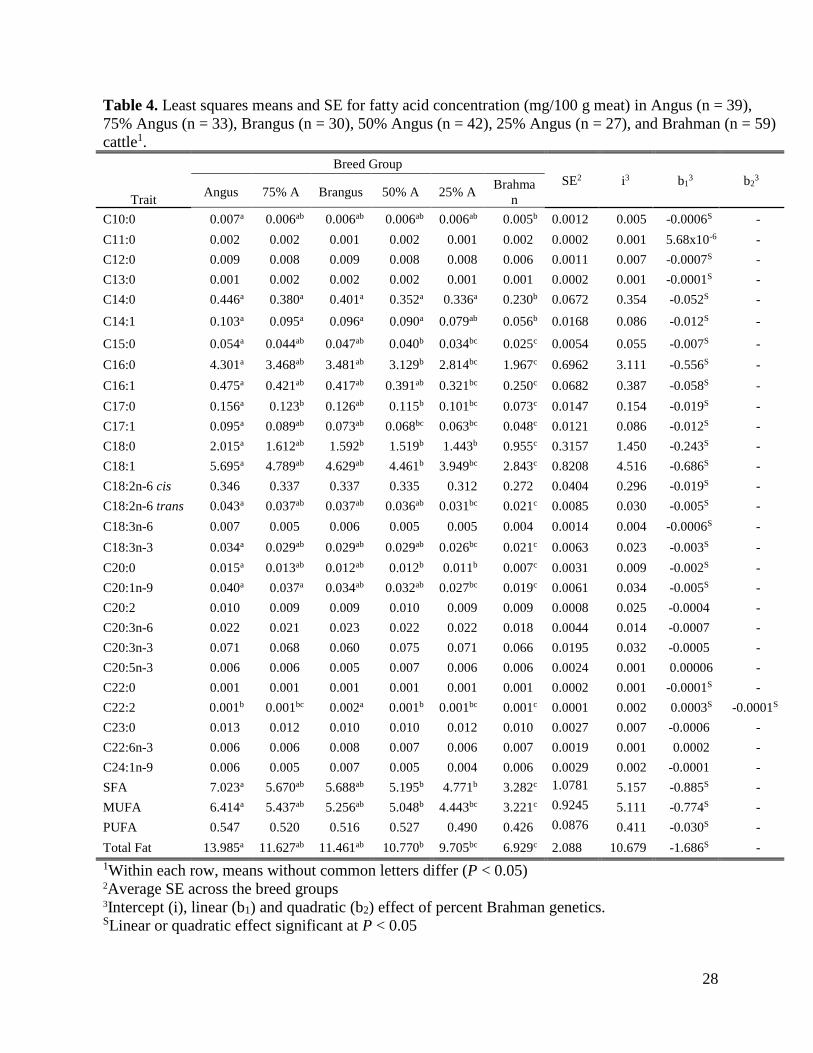
2010; Garmyn et al., 2011). The fatty acid composition in steers from six breed groups, 242
expressed both as percentage of total fatty acids and as mg/100 g muscle, is presented in Tables 3 243
and 4, respectively. 244

12
Breed group significantly affected the percentage of several individual fatty acids, SFA, 245
and PUFA, but not MUFA. The Angus group had the highest percentage of SFA at 49.92%, 246
which was significantly higher than the SFA percentage in the 50%, 75% and 100% Brahman 247
breed groups (P = 0.006, 0.008 and 0.002, respectively). Brangus animals also had a significantly 248
(P = 0.04) higher SFA percentage compared to the 100% Brahman animals. These differences 249
were mainly a consequence of higher percentages of C16:0 and C18:0 in Angus or Brangus 250
compared to animals with higher Brahman composition. 251
The opposite relationship was observed for PUFA, with the percentage of these class of 252
fatty acids increasing as the percentage of Brahman genetics increased. Meat from Brahman 253
steers had the highest percentage of PUFA (7.38 ± 0.39) compared to all other breed groups, 254
while steers from the Angus group had a significantly lower percentage of PUFA compared to 255
the 50%, 75% and 100% Brahman breed groups. 256
The fatty acid concentration (mg/g meat) showed a significant breed group effect for 257
most of the individual fatty acids and for total fat, SFA, and MUFA. No significant effect was 258
identified for the concentration of PUFA across the six breed groups (P = 0.14). Least squares 259
means showed a downward trend from Angus to Brahman for concentration of total fat, SFA and 260
MUFA. For all three fatty acid categories, Angus concentrations were significantly higher than 261
the concentrations in the 50%, 75%, and 100% Brahman breed groups, and the concentration in 262
the 100% Brahman steers was significantly lower than steers from any other breed group. 263
In this study, the LM from Angus cattle was found to have 50% greater amount of 264
intramuscular fat than Brahman cattle. The lower fat content of animals from the Brahman breed 265
group is in agreement with many previous reports (Wood et al., 2008; Mateescu, 2015) 266
describing a lower intramuscular fat content of Bos indicus animals. This greater accumulation of 267

13
fat in Angus animals was achieved by approximately 50% increase in total SFA and MUFA 268
concentration compared to Brahman. This is to be expected, as triacylglycerols deposited into 269
adipocytes are mostly SFA and MUFA from dietary sources and de novo synthesis (Jenkins, 270
1994; Scollan et al., 2014), while the concentration of phospholipids which are rich in PUFA 271
remains constant and relatively independent from the total fat amount. However, several 272
important trends with respect to the healthfulness of the beef products from different breed 273
groups are emerging. On a percentage basis, steaks from animals with a high Brahman 274
percentage had significantly lower SFA and significantly higher PUFA, which suggests a higher 275
healthfulness value of steaks from Brahman cattle. More importantly, the lower SFA is due 276
mostly to a decrease in the percent of short chain SFA (C10:0, C11:0, C12:0 and C16:0) while 277
C18:0 showed no significant difference among breed groups. Palmitic acid (C16:0) is a saturated 278
fatty acid accounting for about 27% of the fatty acids in beef and has been shown to raise serum 279
cholesterol levels (Grundy, 1994) predominantly by increasing the LDL cholesterol levels. This 280
fatty acid accounts for most of the cholesterol-raising activity from beef, thereby increasing the 281
risk of atherosclerosis, cardiovascular disease, and stroke (Brouwer et al., 2010). On the other 282
hand, stearic acid (C18:0) accounts for about 18% of the fatty acid in beef. Its effect on total 283
cholesterol is minimal and not detrimental to human health (Bonanome and Grundy, 1988; Zock 284
and Katan, 1992; Derr et al., 1993; Judd et al., 2002). For practical purposes, stearic acid is 285
essentially neutral in its effects on serum total cholesterol, similar to C18:1 or oleic acid 286
(Grundy, 1994). 287
The second and more important finding is related to the fatty acid concentration on a 288
mg/g meat basis. Most studies on fatty acid composition in beef cattle have reported the 289
normalized percentage of total fatty acids, which describes the lipid quality and is driven by 290

14
strong relationships among fatty acids. Steers with a high Brahman breed composition have 291
leaner meat compared to purebred or high Angus percentage steers and this is accompanied by a 292
high ratio of phospholipid to triacylglycerol in the fat fraction (Scollan et al., 2007; Buchanan et 293
al., 2015). This is expected and it is reflected in the significantly lower total fat content, which is 294
a consequence of significantly lower SFA and MUFA content. However, the amount of PUFA 295
shows no significant difference across the six breed groups, suggesting that meat from Brahman 296
animals would be closely aligned with the international recommendation of lean red meat to be 297
included in a healthy balanced diet (Wyness et al., 2011; McNeill and Van Elswyk, 2012; 298
Cashman and Hayes, 2017). There is an increasing segment of consumers interested in the taste 299
and health benefits of products they consume (Lusk and Parker, 2009; Cashman and Hayes, 300
2017). Recent focus of consumer interest is on weight loss and childhood obesity and the 301
emphasis is on including protein in their diet while looking for lighter options. Leaner beef from 302
Brahman animals could be better-fitted product for this type of consumer. In this study, steaks 303
from Brahman steers had about half of total fat content (6.92 ± 1.01 mg/100 g meat) compared to 304
steaks from Angus cattle (14.06 ± 1.01 mg/100 g meat) as a result of decreased SFA and MUFA 305
concentrations, while the PUFA concentration was not significantly changed. 306
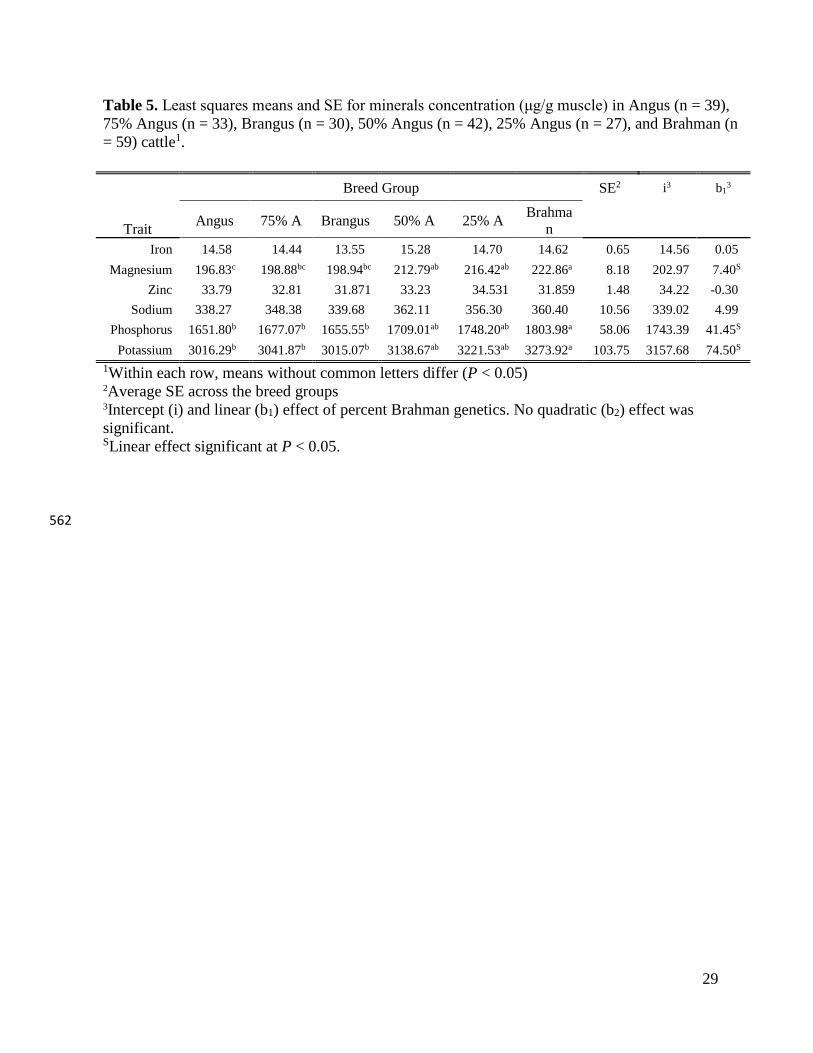
Breed Effect on Mineral Composition 307
Least squares means of minerals concentration (µg/g muscle) are presented in Table 5. 308
The mineral concentration in our study agrees with those of several other studies (Biesalski, 309
2005; O’Neil et al., 2011) documenting the role of beef in providing essential minerals to the 310
human diet, particularly iron, magnesium, phosphorus, potassium, and zinc. When bio-311
availability from other food sources is considered, the amount of iron and zinc provided through 312
consumption of lean beef plays a critical role toward meeting the nutritional requirements of 313

15
these two nutrients and may provide major health benefits (Nicklas et al., 2012). The 314
concentration of these two nutritionally critical minerals is essentially unchanged across breed 315
groups, all having substantial nutritive value. 316
Breed effect was significant for magnesium (P < 0.0001), phosphorus (P = 0.06) and 317
potassium (P = 0.06). The concentration of these three minerals increased with the Brahman 318
percentage in our population as indicated by a significant linear effect. The magnesium 319
concentration in steers from the 100% Angus breed group was significantly lower compared to 320
steers from the 50%, 75%, and 100% Brahman groups, while 75% Angus and Brangus steers 321
had significantly different magnesium concentrations compared to 75% and 100% Brahman 322
steers. Steers from the Brahman breed group had significantly higher phosphorus and 323
potassium concentrations compared to 100% Angus, 75% Angus and Brangus steers. The 324
identical direction of variation for these minerals is supported by the strong and positive 325
genetic correlations reported between magnesium and phosphorus (0.88), magnesium and 326
potassium (0.68), and phosphorus and potassium (0.69) (Mateescu et al., 2013). Magnesium is 327
an essential mineral with important and extensive roles in human health including muscle and 328
nerve function, immune system function, and bone health (Clarkson and Haymes, 1995; 329
Genuis and Bouchard, 2012; Saris et al., 2000; Spiegel, 2011; Tam et al., 2003; Orchard et al., 330
2014). There is an increased interest in the role of magnesium in preventing and managing 331
disorders such as hypertension, cardiovascular disease, and diabetes (Bo and Pisu, 2008; 332
Champagne, 2008; Houston, 2011). However, although statistically significant, the differences 333
reported in the present study are negligible from a practical standpoint when taking into 334
consideration the average content of these minerals and the range for their natural variation 335
presented in this study. Irrespective of the differences found, the current study confirms 336
16
previous reports on the nutritionally beneficial amounts of minerals, particularly iron and zinc, 337
in beef cattle (Mateescu et al., 2013; Ahlberg et al., 2014). Large variation ion the content of 338
these minerals was found within each breed group in the present study. 339
340
CONCLUSION 341
One of the greatest marketing advantages of beef is that it provides a superior eating 342
experience/taste over other protein sources. Over and above this eating experience, beef is a 343
nutrient rich foodstuff. However, it also is perceived to have an unhealthful fatty acid 344
composition. This study confirms that nutrient and fatty acid profiles are not uniform across 345
cattle and variations in fatty acid composition and mineral content is partially attributable to 346
breed composition and other genetic and management factors. As the percentage of Brahman 347
increases, the percent of SFA out of the total fatty acids decreases and the percent of PUFA 348
increases. These observed differences result in a more nutritionally desirable beef product, 349
especially when we consider that the decrease in percent of SFA is mainly due to a decrease in 350
short-chain SFA, which might have a detrimental effect on human health. Probably even more 351
important, the relatively leaner meat of high percent Brahman steers have reduced content of 352
SFA and MUFA but the same content of PUFA as purebred Angus, suggesting this beef product 353
would be of interest for those consumers seeking a low fat, healthy diet. 354
355
LITERATURE CITED 356
Ahlberg, C. M., L. N. Schiermiester, J. T., C. R. Calkins, and M. L. Spangler. 2014. Genome 357
wide association study of cholesterol and poly- and monounsaturated fatty acids, protein, 358
and mineral content of beef from crossbred cattle. Meat Sci. 98:804–814. 359
17
doi:10.1016/j.meatsci.2014.07.030. 360
AMSA. 1995. Research Guidelines for Cookery, Sensory Evaluation and Instrumental 361
Tenderness Measurements of Fresh Meat. American Meat Science Association, Chicago. 362
Biesalski, H.-K. 2005. Meat as a component of a healthy diet - are there any risks or benefits if 363
meat is avoided in the diet? Meat Sci. 70:509–24. doi:10.1016/j.meatsci.2004.07.017. 364
Bonanome, A., and S. M. Grundy. 1988. Effect of Dietary Stearic Acid on Plasma Cholesterol 365
and Lipoprotein Levels. N. Engl. J. Med. 318:1244–1248. 366
doi:10.1056/NEJM198805123181905. 367
Brouwer, I. A., A. J. Wanders, and M. B. Katan. 2010. Effect of animal and industrial Trans fatty 368
acids on HDL and LDL cholesterol levels in humans - A quantitative review. P. H. 369
Reitsma, editor. PLoS One. 5:e9434. doi:10.1371/journal.pone.0009434. 370
Buchanan, J. W., J. M. Reecy, D. J. Garrick, Q. Duan, D. C. Beitz, and R. G. Mateescu. 2015. 371
Genetic parameters and genetic correlations among triacylglycerol and phospholipid 372
fractions in Angus cattle. J. Anim. Sci. 93:522–528. doi:10.2527/jas.2014-8418. 373
Campbell, E. M. G., J. O. Sanders, D. K. Lunt, C. A. Gill, J. F. Taylor, S. K. Davis, D. G. Riley, 374
and S. B. Smith. 2016. Adiposity, lipogenesis, and fatty acid composition of 375
subcutaneous and intramuscular adipose tissues of Brahman and Angus crossbred cattle. 376
J. Anim. Sci. 94:1415–1425. doi:10.2527/jas2015-9954. 377
Cashman, K. D., and A. Hayes. 2017. Red meat’s role in addressing ‘nutrients of public health 378
concern.’ Meat Sci. 132:196–203. doi:10.1016/j.meatsci.2017.04.011. 379
Cundiff, L. V., R. M. Thallman, and L. A. Kuehn. 2012. Impact of Bos indicus Genetics on the 380
Global Beef Industry. In: Beef Improvement Federation 44th Annual Research 381
Symposium and Annual Meeting, Houston, TX, April 18, 2012. p. 147–151. 382

18
Daley, C. A., A. Abbott, P. S. Doyle, G. A. Nader, and S. Larson. 2010. A review of fatty acid 383
profiles and antioxidant content in grass-fed and grain-fed beef. Nutr. J. 9:10. 384
doi:10.1186/1475-2891-9-10. 385
Derr, J., P. M. Kris-Etherton, T. A. Pearson, and F. H. Seligson. 1993. The role of fatty acid 386
saturation on plasma lipids, lipoproteins, and apolipoproteins: II. The plasma total and 387
low-density lipoprotein cholesterol response of individual fatty acids. Metabolism. 388
42:130–134. doi:0026-0495(93)90183-O [pii]. 389
Dinh, T. T. N., J. R. Blanton, D. G. Riley, C. C. Chase, S. W. Coleman, W. A. Phillips, J. C. 390
Brooks, M. F. Miller, and L. D. Thompson. 2010. Intramuscular fat and fatty acid 391
composition of longissimus muscle from divergent pure breeds of cattle. J. Anim. Sci. 392
88:756–766. doi:10.2527/jas.2009-1951. 393
Ekine-Dzivenu, C., M. Vinsky, J. A. Basarab, J. L. Aalhus, M. E. R. Dugan, and C. Li. 2017. 394
Phenotypic and genetic correlations of fatty acid composition in subcutaneous adipose 395
tissue with carcass merit and meat tenderness traits in Canadian beef cattle1. J. Anim. 396
Sci. 95:5184–5196. doi:10.2527/jas2017.1966. 397
Elzo, M. A., D. D. Johnson, J. G. Wasdin, and J. D. Driver. 2012. Carcass and meat palatability 398
breed differences and heterosis effects in an Angus-Brahman multibreed population. 399
Meat Sci. 90:87–92. doi:10.1016/j.meatsci.2011.06.010. 400
Elzo, M. A., R. G. Mateescu, D. D. Johnson, T. L. Scheffler, J. M. Scheffler, C. Carr, D. O. Rae, 401
J. G. Wasdin, M. D. Driver, and J. D. Driver. 2017. Genomic-polygenic and polygenic 402
predictions for nine ultrasound and carcass traits in Angus-Brahman multibreed cattle 403
using three sets of genotypes. Livest. Sci. 202:58–66. doi:10.1016/j.livsci.2017.05.027. 404
Elzo, M. A., R. Mateescu, M. G. Thomas, D. D. Johnson, C. A. Martinez, D. O. Rae, J. G. 405

19
Wasdin, M. D. Driver, and J. D. Driver. 2016. Growth and reproduction genomic-406
polygenic and polygenic parameters and prediction trends as Brahman fraction increases 407
in an Angus-Brahman multibreed population. Livest. Sci. 190:104–112. 408
doi:10.1016/j.livsci.2016.06.011. 409
Elzo, M. A., M. G. Thomas, C. A. Martinez, G. C. Lamb, D. D. Johnson, D. O. Rae, J. G. 410
Wasdin, and J. D. Driver. 2014. Genomic-polygenic evaluation of multibreed Angus-411
Brahman cattle for postweaning feed efficiency and growth using actual and imputed 412
Illumina50k SNP genotypes. Livest. Sci. 159:1–10. doi:10.1016/j.livsci.2013.11.005. 413
Garmyn, A. J., G. G. Hilton, R. G. Mateescu, J. B. Morgan, J. M. Reecy, J. G. Tait, D. C. Beitz, 414
Q. Duan, J. P. Schoonmaker, M. S. Mayes, M. E. Drewnoski, Q. Liu, D. L. Vanoverbeke, 415
R. G. Tait, D. C. Beitz, Q. Duan, J. P. Schoonmaker, M. S. Mayes, M. E. Drewnoski, Q. 416
Liu, and D. L. Vanoverbeke. 2011. Estimation of relationships between mineral 417
concentration and fatty acid composition of longissimus muscle and beef palatability 418
traits. J. Anim. Sci. 89:2849–58. doi:10.2527/jas.2010-3497. 419
Grundy, S. M. 1994. Influence of stearic acid on cholesterol metabolism relative to other long-420
chain fatty acids. Am. J. Clin. Nutr. 60:986S–990S. 421
Hansen, P. . 2004. Physiological and cellular adaptations of zebu cattle to thermal stress. Anim. 422
Reprod. Sci. 82–83:349–360. doi:10.1016/j.anireprosci.2004.04.011. 423
Jenkins, T. C. 1994. Regulation of Lipid Metabolism in the Rumen. J. Nutr. 124:1372S–1376. 424
doi:10.3168/jds.S0022-0302(93)77727-9. 425
Johnson, D. D., R. D. Huffman, S. E. Williams, and D. D. Hargrove. 1990. Effects of percentage 426
Brahman and Angus breeding, age-season of feeding and slaughter end point on feedlot 427
performance and carcass characteristics. J. Anim. Sci. 68:2243–2252. 428
20
doi:10.2527/1990.6871980x. 429
Judd, J. T., D. J. Baer, B. A. Clevidence, P. Kris-Etherton, R. A. Muesing, and M. Iwane. 2002. 430
Dietary cis and trans monounsaturated and saturated FA and plasma lipids and 431
lipoproteins in men. Lipids. 37:123–131. doi:10.1007/s11745-002-0871-9. 432
Killinger, K. M., C. R. Calkins, W. J. Umberger, D. M. Feuz, and K. M. Eskridge. 2004. 433
Consumer sensory acceptance and value for beef steaks of similar tenderness, but 434
differing in marbling level. J. Anim. Sci. 82:3294–3301. doi:/2004.82113294x. 435
Lamy, E., S. Van Harten, E. Sales-baptista, M. M. M. Guerra, A. M. De Almeida, S. Van Harten, 436
E. Sales-baptista, and M. Manuela. 2012. Factors Influencing Livestock Productivity. In: 437
V. Sejian, editor. Environmental Stress and Amelioration in Livestock Production. Vol. 438
9783642292. Springer Berlin Heidelberg, Berlin, Heidelberg. p. 19–51. 439
Leal-Gutiérrez, J. D., M. Elzo, D. Johnson, and R. Mateescu. 2018. Genome-wide association 440
and gene enrichment analyses of meat tenderness in an Angus-Brahman cattle population. 441
In: 11th World Congress on Genetics Applied to Livestock Production. Auckland, New 442
Zealand. 443
Legako, J. F., J. C. Brooks, T. G. O’Quinn, T. D. J. Hagan, R. Polkinghorne, L. J. Farmer, and 444
M. F. Miller. 2015. Consumer palatability scores and volatile beef flavor compounds of 445
five USDA quality grades and four muscles. Meat Sci. 100:291–300. 446
doi:10.1016/j.meatsci.2014.10.026. 447
Lunt, D. K., G. C. Smith, C. E. Murphey, J. W. Savell, Z. L. Carpenter, and H. D. Petersen. 448
1985. Carcass characteristics and composition of Brahman, angus and Brahman x Angus 449
steers fed for different times-on-feed. Meat Sci. 14:137–152. doi:10.1016/0309-450
1740(85)90060-9. 451

21
Lusk, J. L., and N. Parker. 2009. Consumer Preferences for Amount and Type of Fat in Ground 452
Beef. Agric. Appl. Econ. 41:75–90. 453
Mateescu, R. G. 2015. Genetics of meat quality. In: The genetics of cattle. CABI, Wallingford. p. 454
544–571. 455
Mateescu, R. G., A. J. Garmyn, J. G. Tait, Q. Duan, Q. Liu, M. S. Mayes, D. J. Garrick, A. L. 456
Van Eenennaam, D. L. VanOverbeke, G. G. Hilton, D. C. Beitz, and J. M. Reecy. 2013. 457
Genetic parameters for concentrations of minerals in longissimus muscle and their 458
associations with palatability traits in angus cattle. J. Anim. Sci. 91:1067–1075. 459
doi:10.2527/jas.2012-5744. 460
Mateescu, R. G., D. J. Garrick, a. J. Garmyn, D. L. Vanoverbeke, G. G. Mafi, and J. M. Reecy. 461
2015. Genetic parameters for sensory traits in longissimus muscle and their associations 462
with tenderness, marbling score, and intramuscular fat in Angus cattle. J. Anim. Sci. 463
93:21–27. doi:10.2527/jas2014-8405. 464
McNeill, S., and M. E. Van Elswyk. 2012. Red meat in global nutrition. Meat Sci. 92:166–73. 465
doi:10.1016/j.meatsci.2012.03.014. 466
Miller, M. F., L. C. Hoover, K. D. Cook, A. L. Guerra, K. L. Huffman, K. S. Tinney, C. B. 467
Ramsey, H. C. Brittin, and L. M. Huffman. 1995. Consumer Acceptability of Beef Steak 468
Tenderness in the Home and Restaurant. J. Food Sci. 60:963–965. 469
Nicklas, T. A., C. E. O’Neil, M. Zanovec, D. R. Keast, and V. L. Fulgoni. 2012. Contribution of 470
beef consumption to nutrient intake, diet quality, and food patterns in the diets of the US 471
population. Meat Sci. 90:359–363. doi:10.1016/j.meatsci.2011.06.021. 472
Nogi, T., T. Honda, F. Mukai, T. Okagaki, and K. Oyama. 2011. Heritabilities and genetic 473
correlations of fatty acid compositions in longissimus muscle lipid with carcass traits in 474
22
Japanese Black cattle. J. Anim. Sci. 89:615–21. doi:10.2527/jas.2009-2300. 475
O’Neil, C. E., M. Zanovec, D. R. Keast, V. L. Fulgoni, and T. A. Nicklas. 2011. Nutrient 476
contribution of total and lean beef in diets of US children and adolescents: National 477
Health and Nutrition Examination Survey 1999-2004. Meat Sci. 87:250–6. 478
doi:10.1016/j.meatsci.2010.10.020. 479
Okumura, T., K. Saito, T. Nade, S. Misumi, Y. Masuda, H. Sakuma, S. Nakayama, K. Fujita, and 480
T. Kawamura. 2007. Effects of intramuscular fat on the sensory characteristics of M. 481
longissimus dorsi in Japanese Black steers as judged by a trained analytical panel. Asian-482
Australasian J. Anim. Sci. 20:577–581. doi:10.5713/ajas.2007.577. 483
Orchard, T. S., J. C. Larson, N. Alghothani, S. Bout-tabaku, J. A. Cauley, Z. Chen, A. Z. 484
Lacroix, J. Wactawski-wende, and R. D. Jackson. 2014. Magnesium intake , bone 485
mineral density , and fractures : results from the Women ’ s Health Initiative 486
Observational Study. Am. J. Clin. Nutr. 99:926–933. doi:10.3945/ajcn.113.067488.1. 487
Peacock, F. M., A. Z. Palmer, J. W. Carpenter, and M. Koger. 1979. Breed and Heterosis Effects 488
on Carcass Charateristics of Angus, Brahman, Charolais and Crossbred Steers. J. Anim. 489
Sci. 49:391–395. doi:10.2527/jas1979.492391x. 490
Phelps, K. J., D. D. Johnson, M. A. Elzo, C. B. Paulk, and J. M. Gonzalez. 2017. Effect of 491
Brahman genetics on myofibrillar protein degradation, collagen crosslinking, and 492
tenderness of the longissimus lumborum. J. Anim. Sci. 95:5397–5406. 493
Pitchford, W. S., M. P. B. Deland, B. D. Siebert, A. E. O. Malau-Aduli, and C. D. K. Bottema. 494
2002. Genetic variation in fatty acid composition of subcutaneous fat in cattle. J. Anim. 495
Sci. 80:2825–2832. 496
Pringle, T. D., S. E. Williams, B. S. Lamb, D. D. Johnson, and R. L. West. 1997. Carcass 497

23
characteristics, the Calpain proteinase system, and aged tenderness of Angus and 498
Brahman crossbred steers. J. Anim. Sci. 75:2955–2961. 499
Riley, D. 2002. Estimated genetic parameters for carcass traits of Brahman cattle. J. Anim. …. 500
80:955–962. 501
Riley, D. G. D., C. C. Chase, S. W. Coleman, W. a. Phillips, M. F. Miller, J. C. Brooks, D. D. 502
Johnson, and T. a. Olson. 2012. Genetic effects on carcass quantity, quality, and 503
palatability traits in straightbred and crossbred Romosinuano steers. J. Anim. …. 504
90:2159–2166. doi:10.2527/jas2011-4471. 505
Scollan, N. D., N.-J. Choi, E. Kurt, A. V. Fisher, M. Enser, and J. D. Wood. 2007. Manipulating 506
the fatty acid composition of muscle and adipose tissue in beef cattle. Br. J. Nutr. 85:115. 507
doi:10.1079/BJN2000223. 508
Scollan, N. D., D. Dannenberger, K. Nuernberg, I. Richardson, S. MacKintosh, J. F. Hocquette, 509
and A. P. Moloney. 2014. Enhancing the nutritional and health value of beef lipids and 510
their relationship with meat quality. Meat Sci. 97:384–394. 511
doi:10.1016/j.meatsci.2014.02.015. 512
Shackelford, S. D., D. a King, T. L. Wheeler, L. R. Meadows, and M. E. O. Connor. 2012. 513
National Beef Quality Audit – 2011 : Survey of instrument grading assessments of. 514
5152–5158. doi:10.2527/jas2012-5551. 515
Shackelford, S. D., M. Koohmaraie, M. F. Miller, J. D. Crouse, and J. O. Reagan. 1991. An 516
evaluation of tenderness of the longissimus muscle of Angus by Hereford versus 517
Brahman crossbred heifers. J. Anim. Sci. 69:171–177. doi:10.2527/1991.691171x. 518
Watson, R., a. Gee, R. Polkinghorne, and M. Porter. 2008. Consumer assessment of eating 519
quality - Development of protocols for Meat Standards Australia (MSA) testing. Aust. J. 520
24
Exp. Agric. 48:1360–1367. doi:10.1071/EA07176. 521
Wheeler, T. L., J. W. Savell, H. R. Cross, D. K. Lunt, and S. B. Smith. 1990. Mechanisms 522
associated with the variation in tenderness of meat from Brahman and Hereford cattle. J. 523
Anim. Sci. 68:4206–4220. doi:/1990.68113677x. 524
Williams, J. L., I. Aguilar, R. Rekaya, and J. K. Bertrand. 2010. Estimation of breed and 525
heterosis effects for growth and carcass traits in cattle using published crossbreeding 526
studies. J. Anim. Sci. 88:460–466. doi:10.2527/jas.2008-1628. 527
Wood, J. D., M. Enser, A. V. Fisher, G. R. Nute, P. R. Sheard, R. I. Richardson, S. I. Hughes, 528
and F. M. Whittington. 2008. Fat deposition, fatty acid composition and meat quality: A 529
review. Meat Sci. 78:343–58. doi:10.1016/j.meatsci.2007.07.019. 530
Wyness, L., E. Weichselbaum, A. O’Connor, E. B. Williams, B. Benelam, H. Riley, and S. 531
Stanner. 2011. Red meat in the diet: An update. Nutr. Bull. 36:34–77. 532
doi:10.1111/j.1467-3010.2010.01871.x. 533
Xu, L., L. P. Zhang, Z. R. Yuan, L. P. Guo, M. Zhu, X. Gao, H. J. Gao, J. Y. Li, and S. Z. Xu. 534
2013. Polymorphism of SREBP1 is associated with beef fatty acid composition in 535
Simmental bulls. Genet. Mol. Res. 12:5802–5809. doi:10.4238/2013.November.22.7. 536
Zhu, B., H. Niu, W. Zhang, Z. Wang, Y. Liang, L. Guan, P. Guo, Y. Chen, L. Zhang, Y. Guo, H. 537
Ni, X. Gao, H. Gao, L. Xu, and J. Li. 2017. Genome wide association study and genomic 538
prediction for fatty acid composition in Chinese Simmental beef cattle using high density 539
SNP array. BMC Genomics. 18:464. doi:10.1186/s12864-017-3847-7. 540
Zock, P. L., and M. B. Katan. 1992. Hydrogenation alternatives: effects of trans fatty acids and 541
stearic acid versus linoleic acid on serum lipids and lipoproteins in humans. J. Lipid Res. 542
33:399–410. 543

25
Table 1. Summary statistics for carcass quality, meat quality, mineral content and fatty
acid composition of animals available for this study.
Trait N Mean SD Min Max
Carcass quality
BW, kg 230 34.07 6.04 18.14 50.80
WW, kg 230 238.36 40.73 120.20 353.80
HCW, kg 230 333.58 42.15 215 467.65
Dressing Percentage, % 230 60.15 2.94 53.3 70.90
Fat Thickness, cm 230 1.46 0.64 0.28 4.06
Yield Grade 230 3.43 0.80 0.60 8.10
Quality Grade 230 587.77 50.00 490.00 700.00
Meat quality
LM area, cm2 230 77.81 12.09 47.74 129.03
Marbling Score1 230 416.78 89.54 280.00 700.00
WBSF, kg 230 4.52 1.18 2.10 7.90
Tenderness2 230 5.25 0.83 3.00 7.50
Juiciness2 230 4.99 0.66 3.40 6.60
Connective Tissue2 230 5.80 0.88 3.50 7.60
Flavor2 230 5.54 0.46 4.20 6.70
Off Flavor2 230 5.69 0.26 4.60 60.00
Mineral content
Ca, µg/g 230 88.26 43.91 33.14 215.95
Fe, µg/g 230 14.57 3.75 4.76 27.44
K, µg/g 230 3158.86 513.79 1033.66 4658.84
Mg, µg/g 230 210.39 36.13 81.98 347.71
Na, µg/g 230 351.81 59.72 127.35 520.30
P, µg/g 230 1727.31 282.75 559.59 2796.58
Zn, µg/g 230 32.69 7.42 9.19 64.08
Fatty Acid composition
SFA, % 230 48.51 3.85 38.66 64.77
MUFA,% 230 45.79 5.08 36.27 54.66
PUFA, % 230 5.70 2.58 2.69 17.39
SFA, mg/100g meat 230 4.91 3.39 0.46 15.65
MUFA, mg/100g meat 230 4.64 3.13 0.09 13.93
PUFA, mg/100g meat 230 0.49 0.25 0.05 1.85
Total Fat 230 10.04 6.71 1.34 38.26 1Marbling score: 100-199=Devoid, 200-299=traces, 300-399=Slight, 400-499=Small, 500-544 599=Modest, 600-699=Moderate, 700-799=Slightly abundant. 545 2Sensory traits: tenderness, connective tissue, beef flavor intensity, and juiciness on scales form 546 1-8 (1=extremely tough, abundant amount, extremely bland, extremely dry; 8=extremely tender, 547 none detected, extremely intense, extremely juicy). Off flavor was evaluated on a scale from 1-6 548
(1=extreme off- flavor to 6=none detected). 549 550

26
Table 2. Least squares means and SE for carcass and meat quality characteristics in Angus (n =
39), 75% Angus (n = 33), Brangus (n = 30), 50% Angus (n = 42), 25% Angus (n = 27), and
Brahman (n = 59) cattle1.
Trait
Breed Group
Angus 75% A Brangus 50% A 25%
A Brahman SE2 i3 b1
3 b23
Birth Weight, kg 33.40bc 33.79bc 35.99ab 34.69ab 37.52a 31.51c 0.97 32.96 3.174S -0.852S
Weaning Weight, kg 254.25a 246.88a 251.14a 243.65a 238.64a 206.68b 5.73 268.69 4.862 -3.998S
HCW, kg 339.61a 349.00a 350.48a 338.92a 341.30a 304.90b 5.48 368.09 13.654S -5.591S
Dressing Percentage, % 58.88b 60.59a 60.90a 60.27a 61.23a 60.20a 0.38 61.242 1.443S -0.291S
Fat over the eye, cm 1.64 1.42 1.45 1.4 1.44 1.4 0.11 1.676 -0.042 -
Ribeye area, cm2 79.41a 80.77a 81.14a 77.07ab 77.98a 73.23b 1.66 89.766 -1.769S -
Yield Grade 3.57 3.39 3.44 3.54 3.46 3.25 0.13 3.536 -0.066 -
Quality Grade 613.80a 604.24ab 612.20a 590.82b 582.58b 547.37c 7.21 619.59 0.597 -4.255S
Marbling Score4 464.12a 443.02ab 456.48ab 422.95bc 399.01c 352.85d 13.31 486.02 -28.79S -
WBSF, kg 4.38 4.78 4.58 4.63 4.94 4.7 0.17 3.927 0.069 -
Juiciness5 5.15a 5.12a 5.13a 5.04ab 4.87ab 4.80b 0.11 5.049 -0.095S -
Flavor5 5.62 5.59 5.6 5.53 5.45 5.41 0.07 5.427 -0.057S -
Tenderness5 5.75a 5.53ab 5.51ab 5.21bc 5.07cd 4.84d 0.13 5.554 -0.231S -
Connective Tissue5 6.29a 6.00ab 6.02ab 5.84bc 5.49cd 5.49d 0.14 76.19 -0.205S -
Off-flavor5 5.74 5.72 5.73 5.66 5.71 5.7 0.05 5.631 -0.009 -
1Within each row, means without common letters differ (P < 0.05) 551 2Average SE across the breed groups 552 3Intercept (i), linear (b1) and quadratic (b2) effect of percent Brahman genetics. 553 SLinear or quadratic effect significant at P < 0.05 554 4Marbling score: 100-199=Devoid, 200-299=traces, 300-399=Slight, 400-499=Small, 500-555
599=Modest, 600-699=Moderate, 700-799=Slightly abundant. 556 5Sensory traits: tenderness, connective tissue, beef flavor intensity, and juiciness on scales form 557 1-8 (1=extremely tough, abundant amount, extremely bland, extremely dry; 8=extremely tender, 558
none detected, extremely intense, extremely juicy). Off flavor was evaluated on a scale from 1-6 559 (1=extreme off- flavor to 6=none detected). 560 561

27
Table 3. Least squares means and SE for fatty acid proportion (g/100 g of total fatty acids) in
Angus (n = 39), 75% Angus (n = 33), Brangus (n = 30), 50% Angus (n = 42), 25% Angus (n =
27), and Brahman (n = 59) cattle1.
Trait
Breed Group
SE2 i3 b13 b2
3 Angus 75% A Brangus 50% A 25% A
Brahm
an
C10:0 0.05c 0.06bc 0.06bc 0.05bc 0.06b 0.07a 0.003 0.053 -0.001 0.001S
C11:0 0.01b 0.02b 0.02b 0.02b 0.02b 0.04a 0.003 0.024 -0.002 0.002S
C12:0 0.07c 0.08b 0.08b 0.07bc 0.08b 0.09a 0.003 0.069 0.006S -
C13:0 0.01 0.02 0.02 0.01 0.01 0.02 0.002 0.014 0.001S -
C14:0 3.15 3.33 3.52 3.21 3.39 3.26 0.104 3.931 0.011 -
C14:1 0.70 0.82 0.87 0.81 0.83 0.86 0.046 0.833 0.029S -
C15:0 0.39 0.40 0.41 0.38 0.39 0.40 0.013 0.558 0.0008 -
C16:0 30.39a 29.82a 30.03a 28.6b 28.48b 28.51b 0.365 28.751 -0.496S -
C16:1 3.35c 3.67ab 3.73ab 3.56abc 3.41bc 3.76a 0.114 3.736 0.063 -
C17:0 1.16a 1.12a 1.10a 1.10a 1.15a 1.14a 0.038 1.541 -0.0008 -
C17:1 0.70abc 0.79ab 0.62bc 0.61c 0.72abc 0.82a 0.062 0.919 -0.112 0.033S
C18:0 14.47 13.91 13.80 14.00 14.45 13.71 0.326 13.451 -0.115 -
C18:1 41.02 40.30 40.24 41.68 40.73 39.28 0.865 41.768 -0.359 -
C18:2n-6 cis 2.51c 3.37b 3.17bc 3.43b 3.73b 4.8a 0.270 3.298 0.530S -
C18:2n-6 trans 0.29c 0.30bc 0.32ab 0.32a 0.31abc 0.31ab 0.008 0.265 0.023S -0.005S
C18:3n-6 0.04 0.05 0.07 0.05 0.05 0.07 0.009 0.044 0.006S -
C18:3n-3 0.23c 0.25bc 0.26bc 0.27b 0.27b 0.31a 0.008 0.202 0.019S -
C20:0 0.11a 0.11a 0.10ab 0.11a 0.10ab 0.10b 0.003 0.084 -0.003S -
C20:1n-9 0.28 0.30 0.29 0.03 0.27 0.28 0.010 0.319 -0.004 -
C20:2 0.08d 0.08cd 0.08cd 0.09bc 0.10b 0.14a 0.006 0.052 -0.0003 0.004S
C20:3n-6 0.17c 0.21bc 0.23bc 0.23bc 0.26b 0.34a 0.026 0.161 0.039S -
C20:3n-3 0.55c 0.67bc 0.61bc 0.75bc 0.85b 1.18a 0.079 0.443 -0.002 0.039S
C20:5n-3 0.05c 0.05bc 0.06bc 0.06bc 0.07b 0.10a 0.007 0.016 -0.001 0.004S
C22:0 0.01 0.01 0.01 0.01 0.02 0.02 0.002 0.017 0.002S -
C22:2 0.01c 0.01bc 0.02ab 0.02abc 0.02abc 0.02a 0.003 0.034 0.002S -
C23:0 0.10bc 0.13bc 0.09c 0.11bc 0.14ab 0.17a 0.015 0.083 0.017S -
C22:6n-3 0.05c 0.06bc 0.11ab 0.08abc 0.05c 0.12a 0.020 0.009 0.012S -
C24:1n-9 0.05c 0.05c 0.10ab 0.06bc 0.04c 0.10a 0.014 0.025 0.009S -
SFA 49.92a 49abc 49.23ab 47.69bc 48.29ab
c 47.52c 0.602 48.031 -0.566S -
MUFA 46.10 45.93 45.84 47.02 45.99 45.10 0.830 47.531 -0.235 -
PUFA 3.98c 5.06bc 4.93bc 5.29b 5.72b 7.38a 0.391 4.438 0.802S -
1Within each row, means without common letters differ (P < 0.05) 2Average SE across the breed groups 3Intercept (i), linear (b1) and quadratic (b2) effect of percent Brahman genetics. SLinear or quadratic effect significant at P < 0.05
28
Table 4. Least squares means and SE for fatty acid concentration (mg/100 g meat) in Angus (n = 39),
75% Angus (n = 33), Brangus (n = 30), 50% Angus (n = 42), 25% Angus (n = 27), and Brahman (n = 59)
cattle1.
Trait
Breed Group
SE2 i3 b13 b2
3 Angus 75% A Brangus 50% A 25% A
Brahma
n
C10:0 0.007a 0.006ab 0.006ab 0.006ab 0.006ab 0.005b 0.0012 0.005 -0.0006S -
C11:0 0.002 0.002 0.001 0.002 0.001 0.002 0.0002 0.001 5.68x10⁻⁶ -
C12:0 0.009 0.008 0.009 0.008 0.008 0.006 0.0011 0.007 -0.0007S -
C13:0 0.001 0.002 0.002 0.002 0.001 0.001 0.0002 0.001 -0.0001S -
C14:0 0.446a 0.380a 0.401a 0.352a 0.336a 0.230b 0.0672 0.354 -0.052S -
C14:1 0.103a 0.095a 0.096a 0.090a 0.079ab 0.056b 0.0168 0.086 -0.012S -
C15:0 0.054a 0.044ab 0.047ab 0.040b 0.034bc 0.025c 0.0054 0.055 -0.007S -
C16:0 4.301a 3.468ab 3.481ab 3.129b 2.814bc 1.967c 0.6962 3.111 -0.556S -
C16:1 0.475a 0.421ab 0.417ab 0.391ab 0.321bc 0.250c 0.0682 0.387 -0.058S -
C17:0 0.156a 0.123b 0.126ab 0.115b 0.101bc 0.073c 0.0147 0.154 -0.019S -
C17:1 0.095a 0.089ab 0.073ab 0.068bc 0.063bc 0.048c 0.0121 0.086 -0.012S -
C18:0 2.015a 1.612ab 1.592b 1.519b 1.443b 0.955c 0.3157 1.450 -0.243S -
C18:1 5.695a 4.789ab 4.629ab 4.461b 3.949bc 2.843c 0.8208 4.516 -0.686S -
C18:2n-6 cis 0.346 0.337 0.337 0.335 0.312 0.272 0.0404 0.296 -0.019S -
C18:2n-6 trans 0.043a 0.037ab 0.037ab 0.036ab 0.031bc 0.021c 0.0085 0.030 -0.005S -
C18:3n-6 0.007 0.005 0.006 0.005 0.005 0.004 0.0014 0.004 -0.0006S -
C18:3n-3 0.034a 0.029ab 0.029ab 0.029ab 0.026bc 0.021c 0.0063 0.023 -0.003S -
C20:0 0.015a 0.013ab 0.012ab 0.012b 0.011b 0.007c 0.0031 0.009 -0.002S -
C20:1n-9 0.040a 0.037a 0.034ab 0.032ab 0.027bc 0.019c 0.0061 0.034 -0.005S -
C20:2 0.010 0.009 0.009 0.010 0.009 0.009 0.0008 0.025 -0.0004 -
C20:3n-6 0.022 0.021 0.023 0.022 0.022 0.018 0.0044 0.014 -0.0007 -
C20:3n-3 0.071 0.068 0.060 0.075 0.071 0.066 0.0195 0.032 -0.0005 -
C20:5n-3 0.006 0.006 0.005 0.007 0.006 0.006 0.0024 0.001 0.00006 -
C22:0 0.001 0.001 0.001 0.001 0.001 0.001 0.0002 0.001 -0.0001S -
C22:2 0.001b 0.001bc 0.002a 0.001b 0.001bc 0.001c 0.0001 0.002 0.0003S -0.0001S
C23:0 0.013 0.012 0.010 0.010 0.012 0.010 0.0027 0.007 -0.0006 -
C22:6n-3 0.006 0.006 0.008 0.007 0.006 0.007 0.0019 0.001 0.0002 -
C24:1n-9 0.006 0.005 0.007 0.005 0.004 0.006 0.0029 0.002 -0.0001 -
SFA 7.023a 5.670ab 5.688ab 5.195b 4.771b 3.282c 1.0781 5.157 -0.885S -
MUFA 6.414a 5.437ab 5.256ab 5.048b 4.443bc 3.221c 0.9245 5.111 -0.774S -
PUFA 0.547 0.520 0.516 0.527 0.490 0.426 0.0876 0.411 -0.030S -
Total Fat 13.985a 11.627ab 11.461ab 10.770b 9.705bc 6.929c 2.088 10.679 -1.686S -
1Within each row, means without common letters differ (P < 0.05) 2Average SE across the breed groups 3Intercept (i), linear (b1) and quadratic (b2) effect of percent Brahman genetics. SLinear or quadratic effect significant at P < 0.05
29
Table 5. Least squares means and SE for minerals concentration (μg/g muscle) in Angus (n = 39),
75% Angus (n = 33), Brangus (n = 30), 50% Angus (n = 42), 25% Angus (n = 27), and Brahman (n
= 59) cattle1.
Trait
Breed Group SE2 i3 b13
Angus 75% A Brangus 50% A 25% A Brahma
n
Iron 14.58 14.44 13.55 15.28 14.70 14.62 0.65 14.56 0.05
Magnesium 196.83c 198.88bc 198.94bc 212.79ab 216.42ab 222.86a 8.18 202.97 7.40S
Zinc 33.79 32.81 31.871 33.23 34.531 31.859 1.48 34.22 -0.30
Sodium 338.27 348.38 339.68 362.11 356.30 360.40 10.56 339.02 4.99
Phosphorus 1651.80b 1677.07b 1655.55b 1709.01ab 1748.20ab 1803.98a 58.06 1743.39 41.45S
Potassium 3016.29b 3041.87b 3015.07b 3138.67ab 3221.53ab 3273.92a 103.75 3157.68 74.50S
1Within each row, means without common letters differ (P < 0.05) 2Average SE across the breed groups 3Intercept (i) and linear (b1) effect of percent Brahman genetics. No quadratic (b2) effect was
significant. SLinear effect significant at P < 0.05.
562