Run Charts: Theory and Use - Vermont Oxford Network
17
Run Charts: Theory and Use Michael A. Posencheg. M.D. Professor of Clinical Pediatrics Perelman School of Medicine, University of Pennsylvania Associate Chief, Quality Improvement and Patient Safety Division of Neonatology, Children’s Hospital of Philadelphia October 3, 2019
Transcript of Run Charts: Theory and Use - Vermont Oxford Network
Run Charts: Theory and Use
Michael A. Posencheg. M.D.Professor of Clinical Pediatrics
Perelman School of Medicine, University of PennsylvaniaAssociate Chief, Quality Improvement and Patient Safety
Division of Neonatology, Children’s Hospital of PhiladelphiaOctober 3, 2019
Objectives for today
• Review the anatomy of a run chart.• Discuss the statistical basis for analysis.• Explain the rules used to determine variation seen is random
or not.• Show some examples along the way.
• …all in 10 minutes!
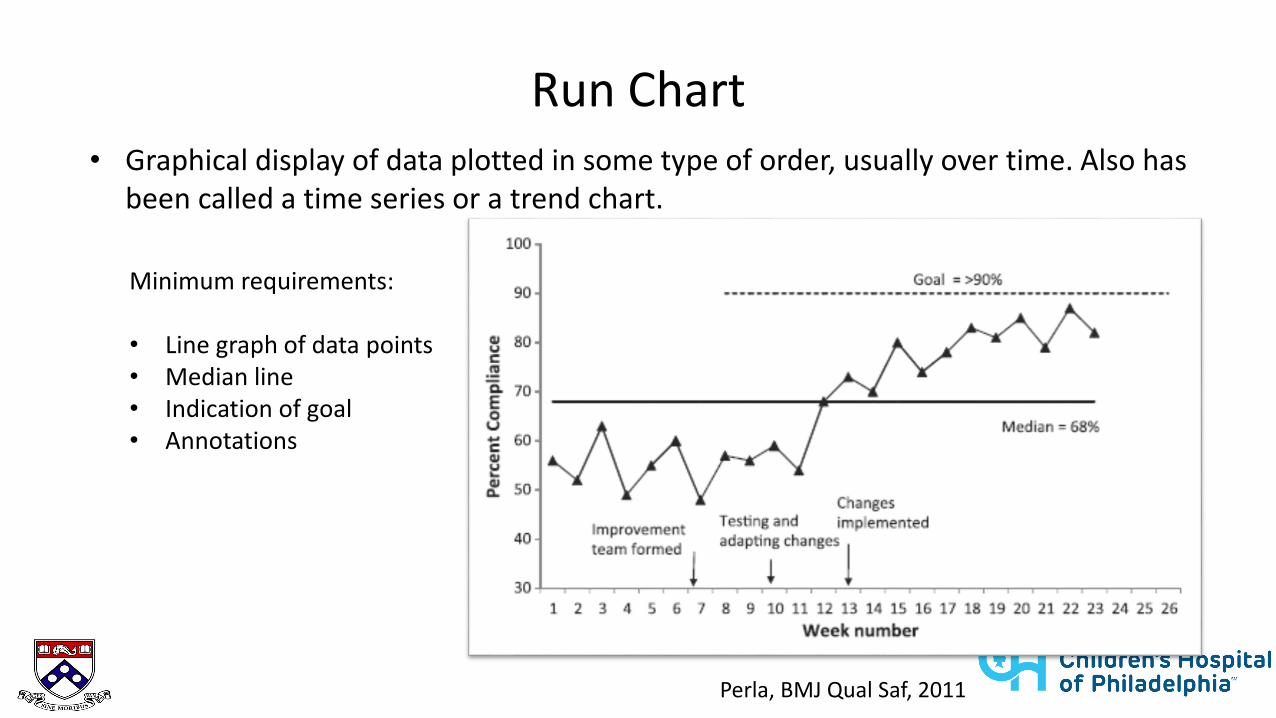
Run Chart• Graphical display of data plotted in some type of order, usually over time. Also has
been called a time series or a trend chart.
Perla, BMJ Qual Saf, 2011
Minimum requirements:
• Line graph of data points• Median line• Indication of goal• Annotations
How many data points do I need to start a run chart?
• Start to plot your data on a run chart as soon as you have some!
• The median will be calculated and continued to be adjusted until you have established a baseline of 10 data points.– 10 patients, 10 days, 10 weeks, 10 months, 10 quarters…
• Why 10?– At least 10 data points are required to apply the probability based
run chart rules.
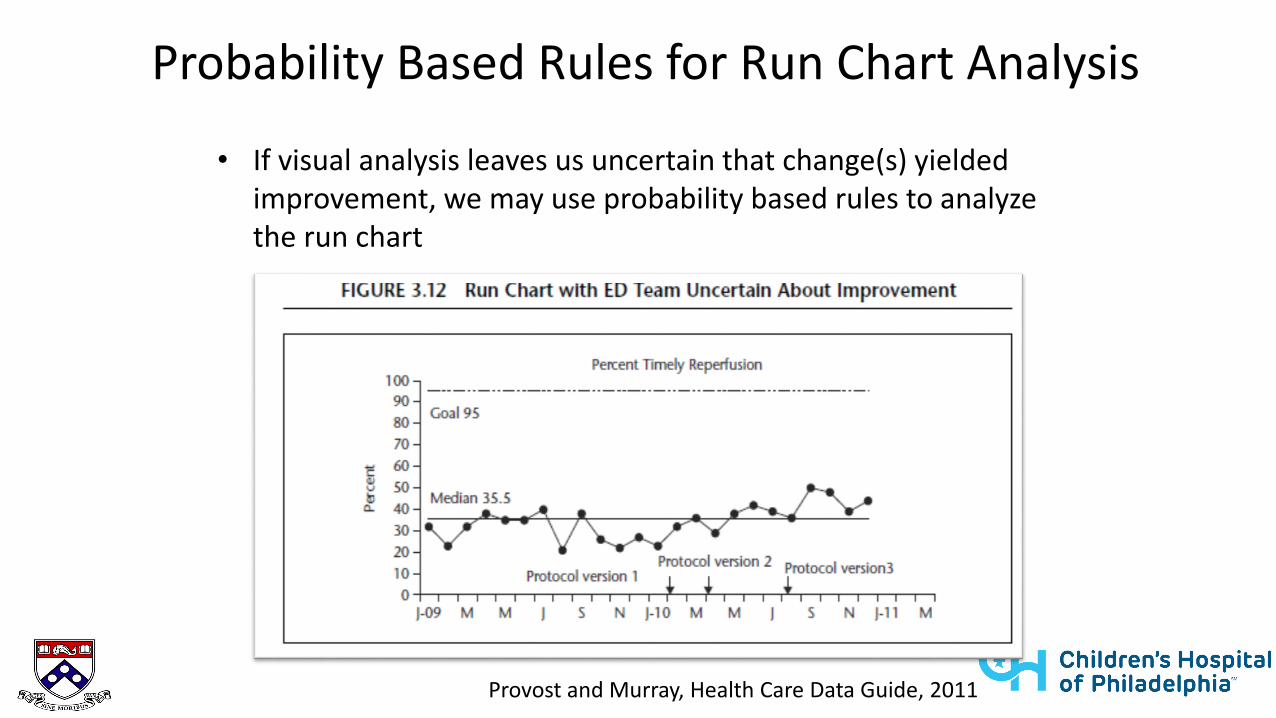
Probability Based Rules for Run Chart Analysis
• If visual analysis leaves us uncertain that change(s) yielded improvement, we may use probability based rules to analyze the run chart
Provost and Murray, Health Care Data Guide, 2011
Perla, BMJ Qual Saf, 2011
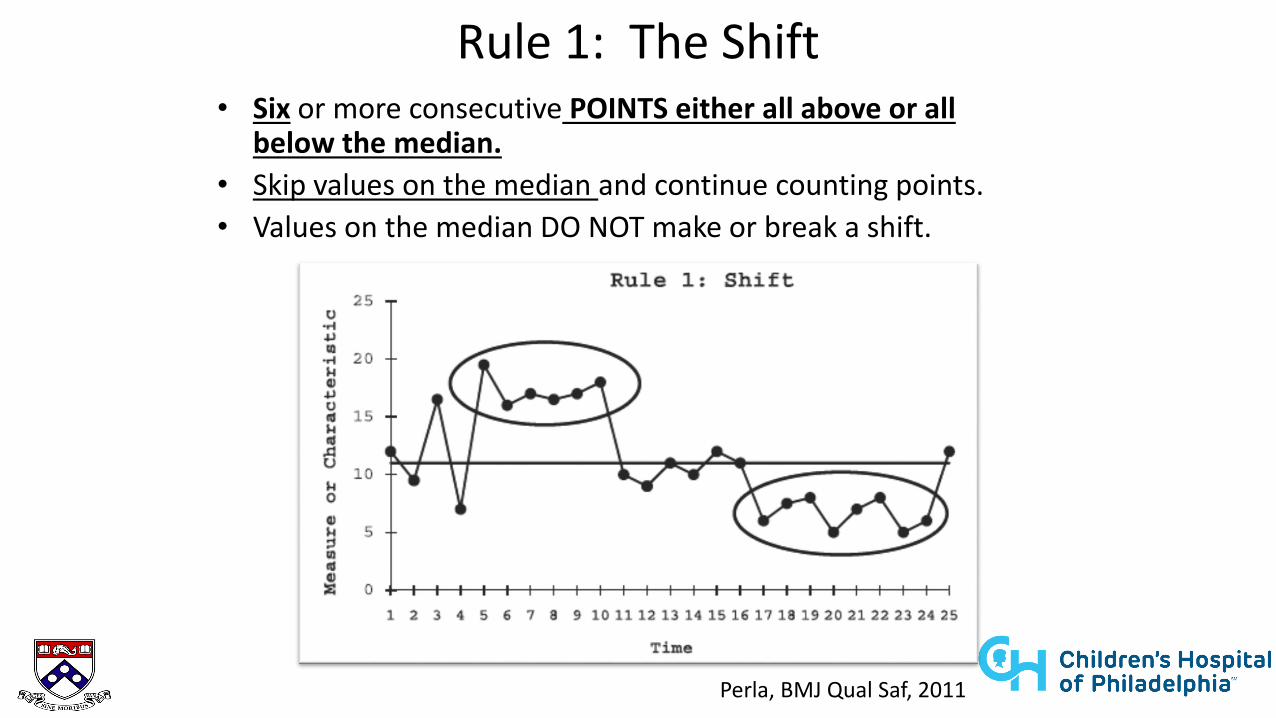
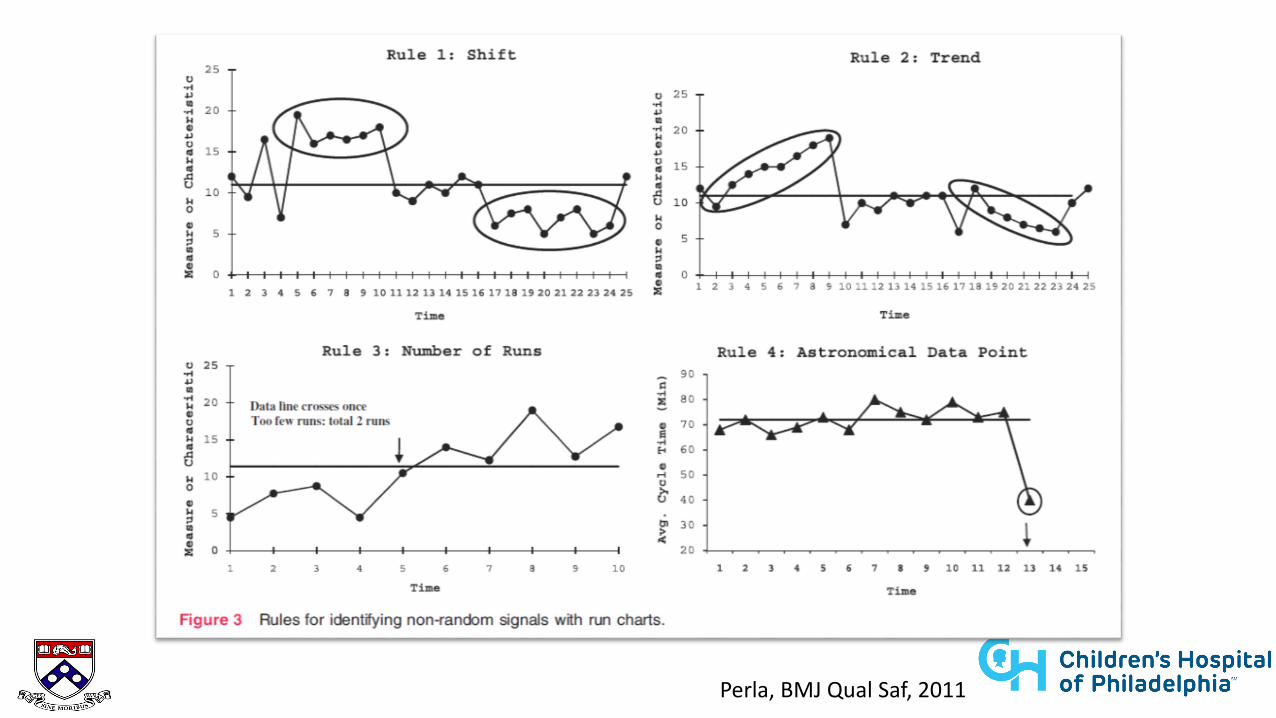
Rule 1: The Shift• Six or more consecutive POINTS either all above or all
below the median.• Skip values on the median and continue counting points. • Values on the median DO NOT make or break a shift.
Perla, BMJ Qual Saf, 2011
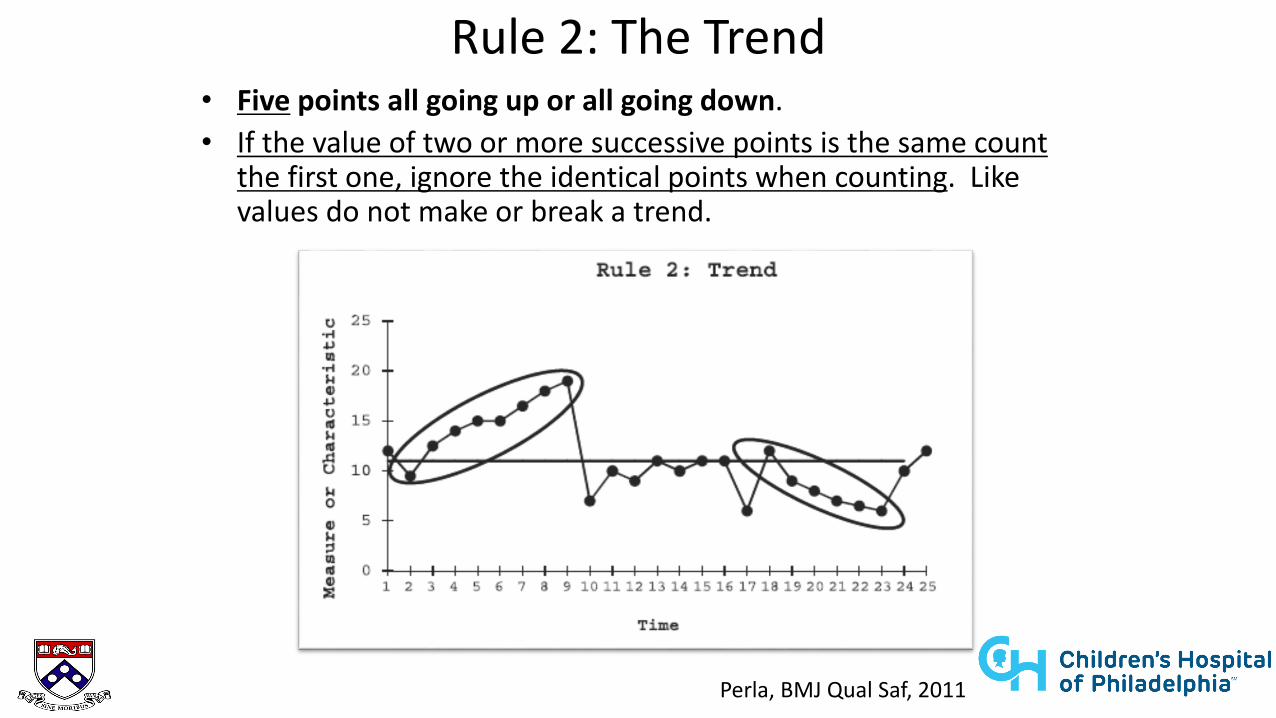
Rule 2: The Trend• Five points all going up or all going down. • If the value of two or more successive points is the same count
the first one, ignore the identical points when counting. Like values do not make or break a trend.
Perla, BMJ Qual Saf, 2011
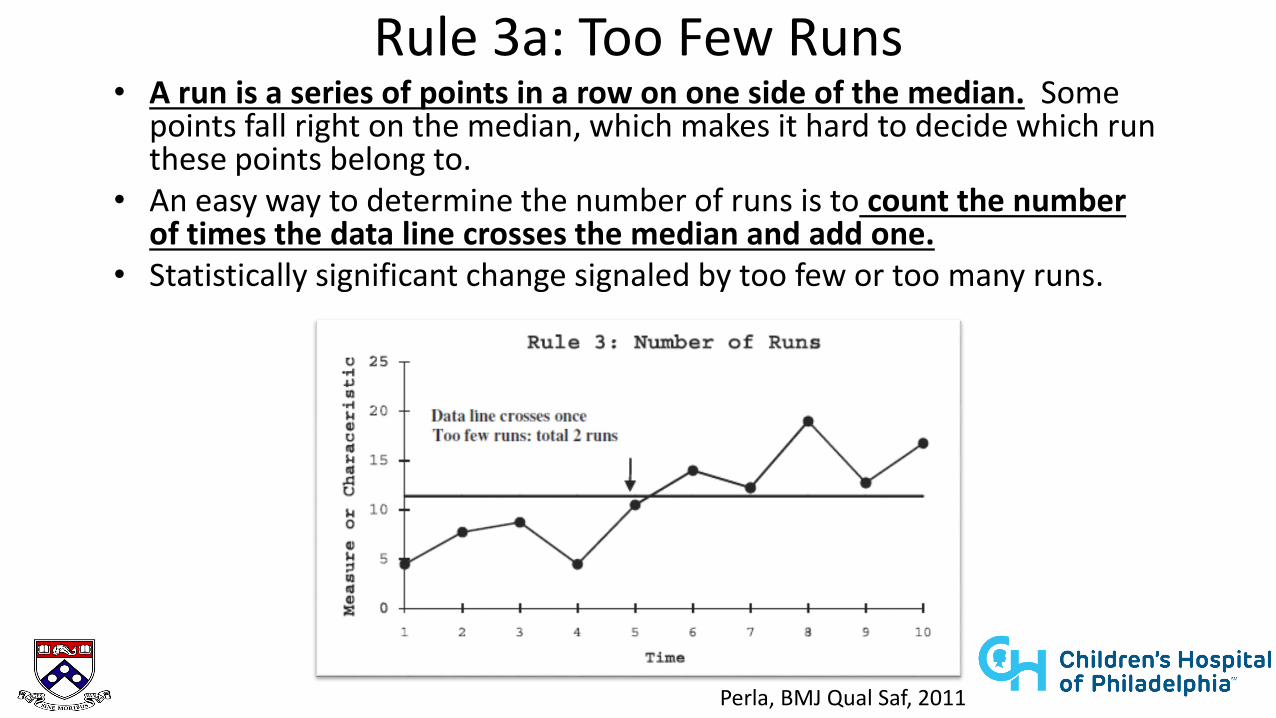
Rule 3a: Too Few Runs• A run is a series of points in a row on one side of the median. Some
points fall right on the median, which makes it hard to decide which run these points belong to.
• An easy way to determine the number of runs is to count the number of times the data line crosses the median and add one.
• Statistically significant change signaled by too few or too many runs.
Perla, BMJ Qual Saf, 2011
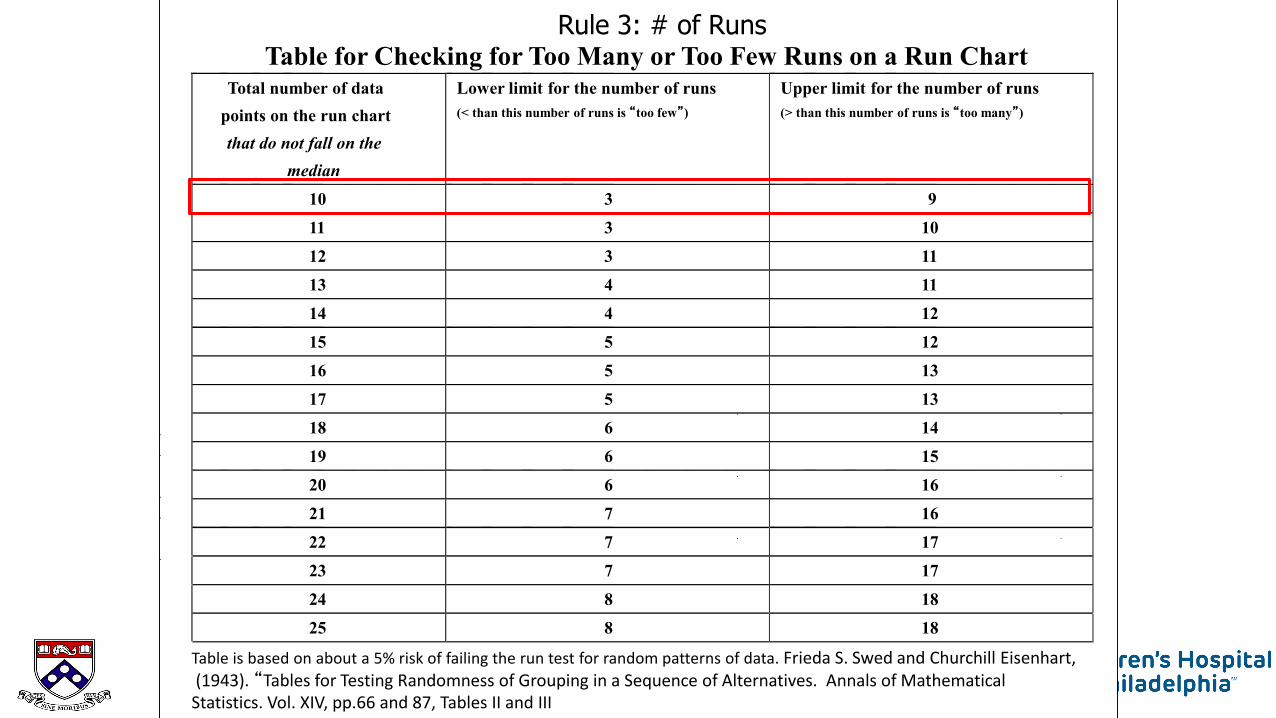
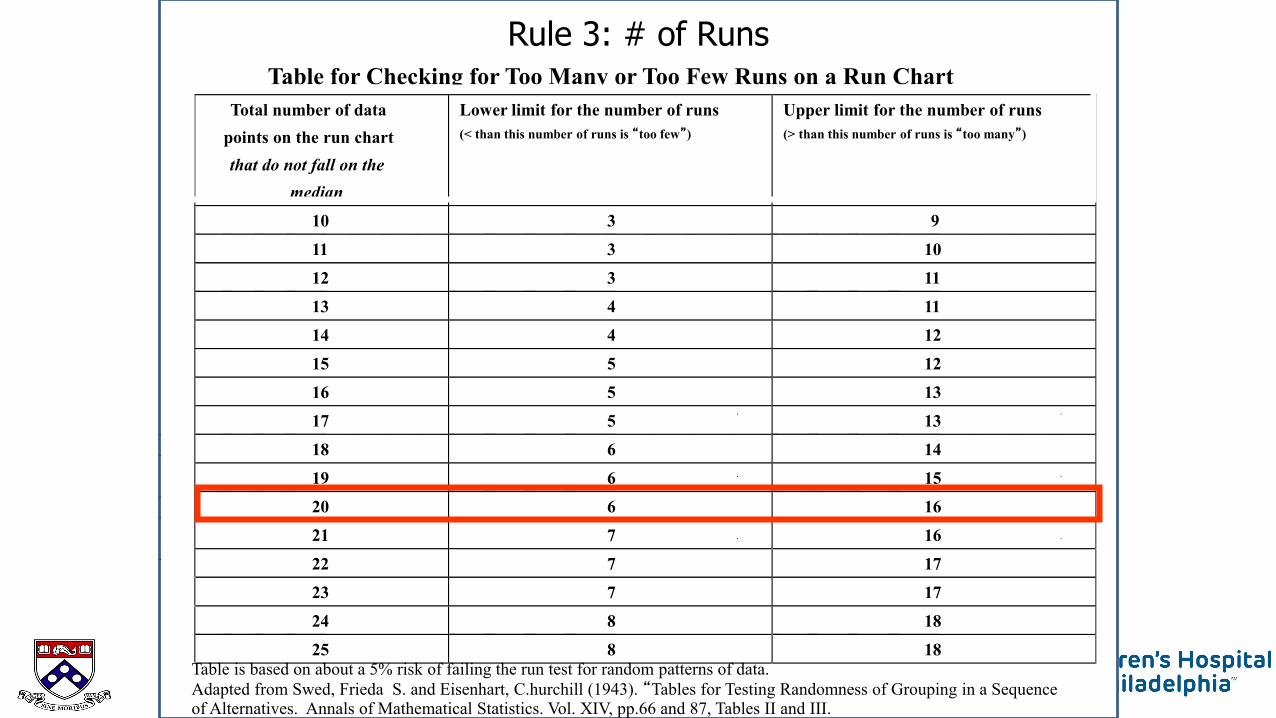
Rule 3: # of RunsTable for Checking for Too Many or Too Few Runs on a Run Chart
Total number of datapoints on the run chartthat do not fall on the
median
Lower limit for the number of runs(< than this number of runs is “too few”)
Upper limit for the number of runs(> than this number of runs is “too many”)
10 3 9
11 3 10
12 3 11
13 4 11
14 4 12
15 5 12
16 5 13
17 5 13
18 6 14
19 6 15
20 6 16
21 7 16
22 7 17
23 7 17
24 8 18
25 8 18
Table is based on about a 5% risk of failing the run test for random patterns of data. Frieda S. Swed and Churchill Eisenhart,(1943). “Tables for Testing Randomness of Grouping in a Sequence of Alternatives. Annals of Mathematical Statistics. Vol. XIV, pp.66 and 87, Tables II and III
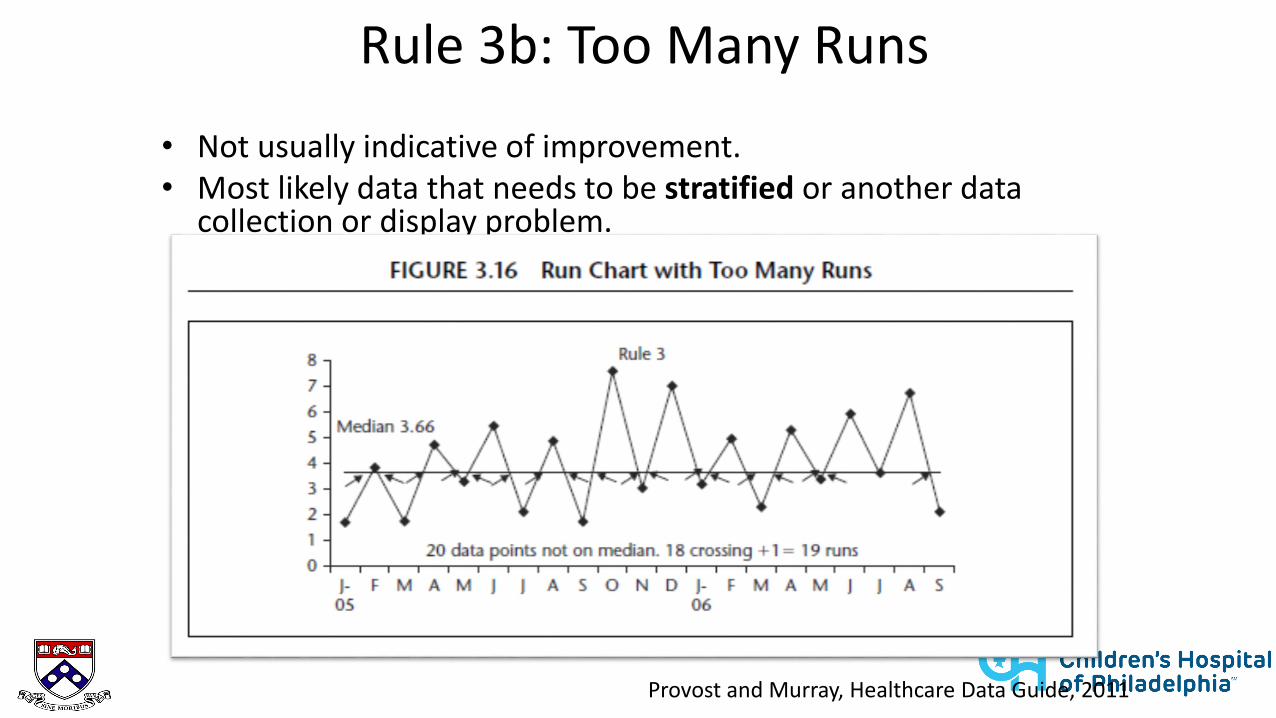
Rule 3b: Too Many Runs
• Not usually indicative of improvement.• Most likely data that needs to be stratified or another data
collection or display problem.
Provost and Murray, Healthcare Data Guide, 2011
Rule 3: # of RunsTable for Checking for Too Many or Too Few Runs on a Run Chart
Total number of datapoints on the run chartthat do not fall on the
median
Lower limit for the number of runs(< than this number of runs is “too few”)
Upper limit for the number of runs(> than this number of runs is “too many”)
10 3 9
11 3 10
12 3 11
13 4 11
14 4 12
15 5 12
16 5 13
17 5 13
18 6 14
19 6 15
20 6 16
21 7 16
22 7 17
23 7 17
24 8 18
25 8 18Table is based on about a 5% risk of failing the run test for random patterns of data.Adapted from Swed, Frieda S. and Eisenhart, C.hurchill (1943). “Tables for Testing Randomness of Grouping in a Sequenceof Alternatives. Annals of Mathematical Statistics. Vol. XIV, pp.66 and 87, Tables II and III.
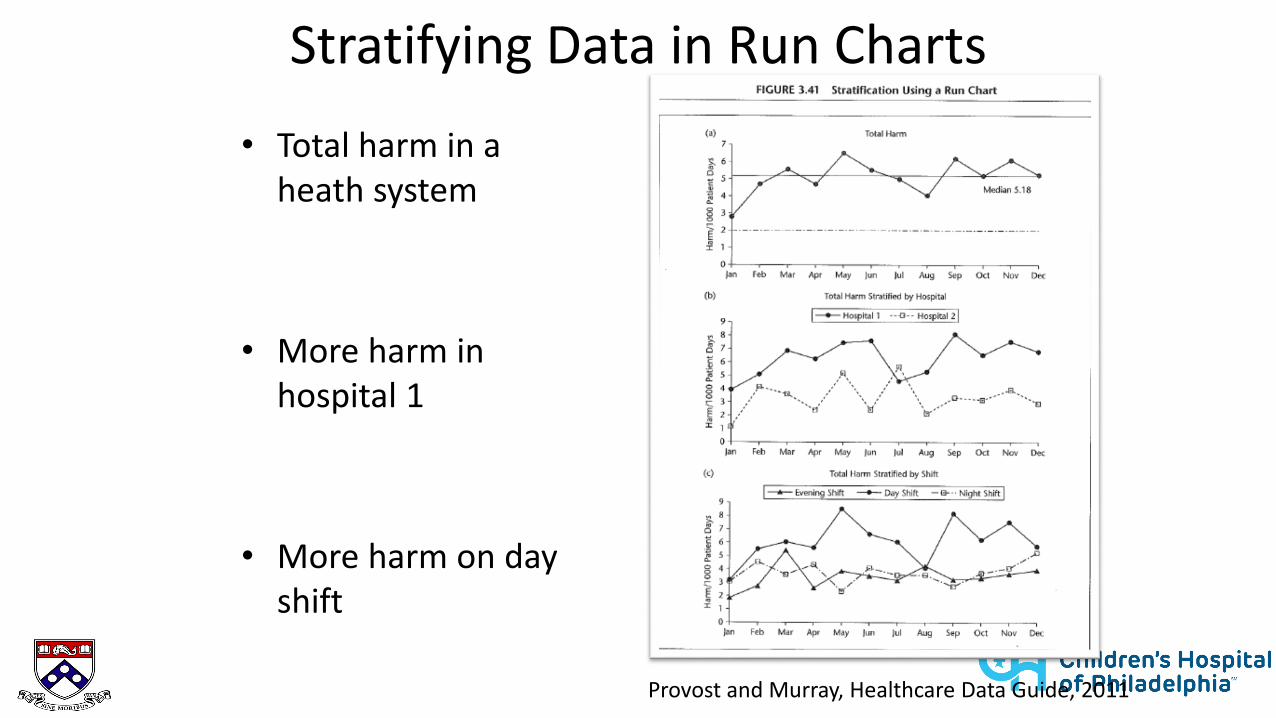
• Total harm in a heath system
• More harm in hospital 1
• More harm on day shift
Stratifying Data in Run Charts
Provost and Murray, Healthcare Data Guide, 2011
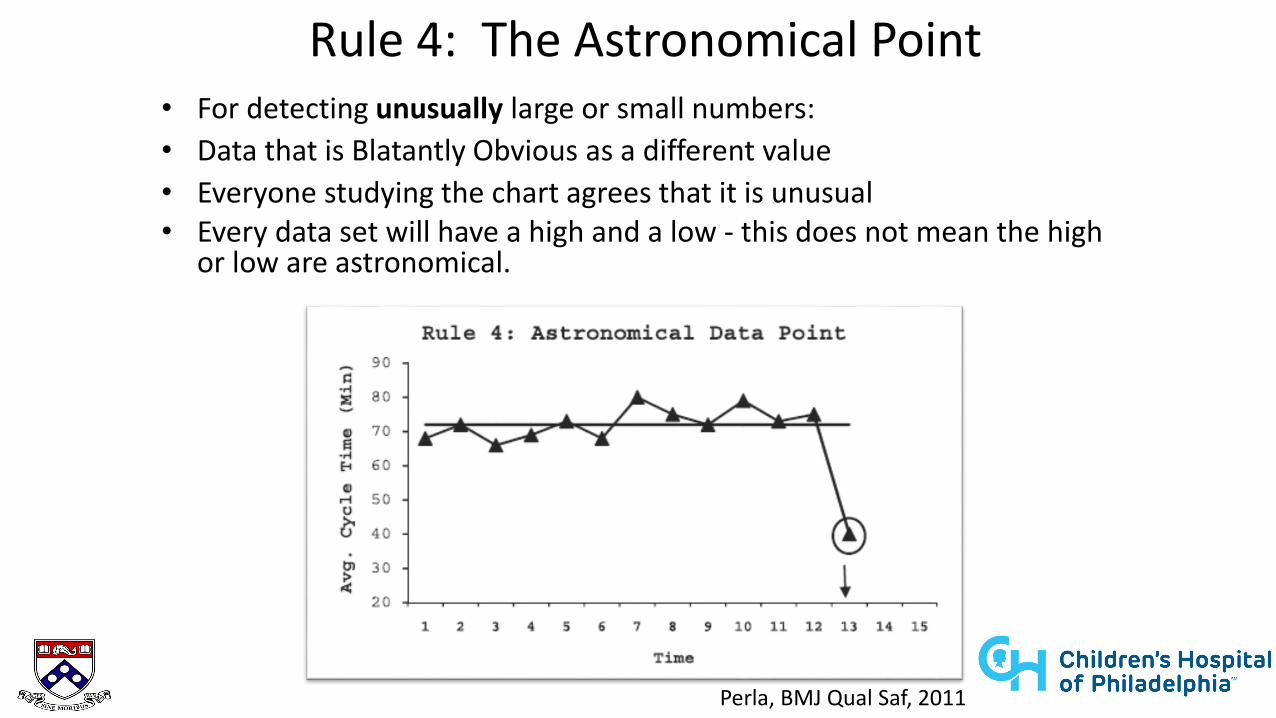
Rule 4: The Astronomical Point• For detecting unusually large or small numbers: • Data that is Blatantly Obvious as a different value• Everyone studying the chart agrees that it is unusual• Every data set will have a high and a low - this does not mean the high
or low are astronomical.
Perla, BMJ Qual Saf, 2011
Why Bother…What Do we Do With A Signal?
• Signals can be evidence of improvement– That changes are adding up to improvement
• Signals can be evidence that things got worse– Changes caused unexpected degradation of process or
outcome– Something else entered the process resulting in a signal
• Action when seeing a signal?– Go learn from signal and take appropriate action
Summary• Start with run charts when beginning a project.
– Use the median as the center line.• Rules to determine if the distribution of data is random
or non-random allow you to detect if there is a signal of improvement.– Rules can be applied after establishing a baseline of at least
10 points.– The shift, trend, and number of runs are based on a α error
of P<0.05.– The astronomical point is subjective.
References
• Perla, et al., The run chart: a simple analytical tool for learning from variation in healthcare processes, BMJ Qual Saf, 2011, 20:46-51.
• Provost and Murray, The Healthcare Data Guide: Learning from Data for Improvement, 2011.