Rubrics: Effectiveness Of Feedback
70
BearWorks BearWorks MSU Graduate Theses Summer 2016 Rubrics: Effectiveness Of Feedback Rubrics: Effectiveness Of Feedback Sadie Louise Winterscheid As with any intellectual project, the content and views expressed in this thesis may be considered objectionable by some readers. However, this student-scholar’s work has been judged to have academic value by the student’s thesis committee members trained in the discipline. The content and views expressed in this thesis are those of the student-scholar and are not endorsed by Missouri State University, its Graduate College, or its employees. Follow this and additional works at: https://bearworks.missouristate.edu/theses Part of the Communication Sciences and Disorders Commons Recommended Citation Recommended Citation Winterscheid, Sadie Louise, "Rubrics: Effectiveness Of Feedback" (2016). MSU Graduate Theses. 2980. https://bearworks.missouristate.edu/theses/2980 This article or document was made available through BearWorks, the institutional repository of Missouri State University. The work contained in it may be protected by copyright and require permission of the copyright holder for reuse or redistribution. For more information, please contact [email protected].
Transcript of Rubrics: Effectiveness Of Feedback

BearWorks BearWorks
MSU Graduate Theses
Summer 2016
Rubrics: Effectiveness Of Feedback Rubrics: Effectiveness Of Feedback
Sadie Louise Winterscheid
As with any intellectual project, the content and views expressed in this thesis may be
considered objectionable by some readers. However, this student-scholar’s work has been
judged to have academic value by the student’s thesis committee members trained in the
discipline. The content and views expressed in this thesis are those of the student-scholar and
are not endorsed by Missouri State University, its Graduate College, or its employees.
Follow this and additional works at: https://bearworks.missouristate.edu/theses
Part of the Communication Sciences and Disorders Commons
Recommended Citation Recommended Citation Winterscheid, Sadie Louise, "Rubrics: Effectiveness Of Feedback" (2016). MSU Graduate Theses. 2980. https://bearworks.missouristate.edu/theses/2980
This article or document was made available through BearWorks, the institutional repository of Missouri State University. The work contained in it may be protected by copyright and require permission of the copyright holder for reuse or redistribution. For more information, please contact [email protected].

RUBRICS: EFFECTIVENESS OF FEEDBACK
A Masters Thesis
Presented to
The Graduate College of
Missouri State University
In Partial Fulfillment
Of the Requirements for the Degree
Master of Science, Communication Sciences and Disorders
By
Sadie Winterscheid
July 2016

ii
Copyright 2016 by Sadie Louise Winterscheid

iii
RUBRICS: EFFECTIVENESS OF FEEDBACK
Communication Sciences and Disorders
Missouri State University, July 2016
Master of Science
Sadie Winterscheid
ABSTRACT
The purpose of this study was to determine how rubrics affect university graduate
students’ receptiveness to feedback, their future college assignments, and if they will use
rubrics in their own classroom. Two surveys were sent to teachers and teacher candidate
graduate students from a Midwestern university. Participants were asked to answer one of
the two surveys depending on whether they had their teaching certificate or were working
to receive their teaching certificate. The participants answered survey questions about
their college experience with rubrics and their experience and opinions of rubrics in their
own, or future, classrooms. The research demonstrated that: (a) college students were
receptive to feedback from rubrics and are actively applying it to future assignments; (b)
college students desire feedback no matter the form or grade attached; (c) grades are
important to university students, but not as important as feedback; and (d) teacher and
teachers candidates used or planned to use rubrics, however, the majority of teacher
candidates believed they were not taught how to make rubrics in their university courses.
Study implications may include that: (a) university and K-12 teachers should emphasis
feedback when using rubrics in their classrooms; and (b) college professors should
prepare future teachers to use rubrics in their classrooms.
KEYWORDS: rubrics, feedback, data-driven decision making, assessment for learning,
grades, teachers, teacher candidates
This abstract is approved as to form and content
_______________________________
Karen Engler, EdD, CED
Chairperson, Advisory Committee
Missouri State University

iv
RUBRICS: EFFECTIVENESS OF FEEDBACK
By
Sadie Winterscheid
A Masters Thesis
Submitted to the Graduate College
Of Missouri State University
In Partial Fulfillment of the Requirements
For the Degree of Master of Science, Communication Sciences and Disorders
July 2016
Approved:
_______________________________________
Karen S. Engler, EdD
______________________________________
James Sottile, PhD
_______________________________________
Letitia White, PhD
_______________________________________
Julie Masterson, PhD: Dean, Graduate College

v
ACKNOWLEDGEMENTS
I would like to thank my thesis committee for your endless support, time, and advice
through this process. I want to specifically thank Dr. Engler who worked tirelessly to help me
achieve success during this process. I am honored to be your first thesis advisee, we did it!
I would also like to thank my family for supporting me throughout my graduate
experience and keeping me grounded. A special thanks to my fiancé, Brandon. Thank you
for your understanding, limitless patience, and support throughout this process.

vi
TABLE OF CONTENTS
Introduction ..........................................................................................................................1
Literature Review.................................................................................................................4
Data-Driven Decision Making .................................................................................4
Rubrics .....................................................................................................................5
Types of Rubrics ......................................................................................................8
Feedback ................................................................................................................10
Use of Rubrics........................................................................................................12
Methods..............................................................................................................................16
Research Design.....................................................................................................16
Participants .............................................................................................................17
Data Collection Instruments ..................................................................................18
Data Collection Procedure and Analysis ...............................................................19
Results ...............................................................................................................................21
Teacher Survey ......................................................................................................22
Teacher Candidate Survey .....................................................................................31
Comparisons Between Participant Groups: Teacher and Teacher Candidates ......38
Discussion ..........................................................................................................................43
Consideration of the Findings ................................................................................45
Limitations .............................................................................................................46
Further Research ....................................................................................................48
Implications............................................................................................................49
References ..........................................................................................................................50
Appendices ........................................................................................................................54
Appendix A. Letter of Consent ..............................................................................54
Appendix B. Survey for Teachers ..........................................................................55
Appendix C. Survey for Teacher Candidates ........................................................59

vii
LIST OF TABLES
1. Demographics of Participants ................................................................................22
2. What University Students Examined First on a Rubric According to Teachers ....24
3. The Reason(s) for Using Grading Rubrics in the Classroom According to Teachers
................................................................................................................................25
4. What University Students Examined First on a Rubric According to Teacher
Candidates ..............................................................................................................33
5. The Reason(s) for Using Grading Rubrics in the Classroom According to Teacher
Candidates ..............................................................................................................34
6. Comparison of Teacher and Teacher Candidate Themes ......................................39

viii
LIST OF FIGURES
1. Frequency of Rubric Use in College Courses According to Teachers ..................23
2. Influence of Grade on Receptiveness of Feedback According to Teachers ..........24
3. Research Question 1 Themes According to Teachers ...........................................27
4. Research Question 2 Themes According to Teachers ...........................................28
5. Research Question 3 Themes According to Teachers. ..........................................30
6. Frequency of Rubric Use in College Courses According to Teacher Candidates .32
7. Influence of Grade on Receptiveness of Feedback According to Teacher Candidates
................................................................................................................................33
8. Research Question 1 Themes According to Teacher Candidates ..........................35
9. Research Question 2 Themes According to Teacher Candidates ..........................36
10. Research Question 4 Themes According to Teacher Candidates ..........................38

1
INTRODUCTION
There is an emphasis on data-driven decision making in education to hold schools
accountable and improve the quality of education students are receiving (Mandinach &
Jackson, 2012). Research has shown that tests alone are not a sufficient way of collecting
data and determining if students are meeting standards (Mandinach & Jackson 2012;
Heritage & Yeagly, 2005; Nichols & Berliner, 2007; Petrides, 2006; Stiggins 2002).
Tests can be a part of “assessment for learning,” (Mandinach & Jackson, 2012, p. 30);
yet, multiple types of assessment, should be used when making academic decisions
(Kortez, 2003). Rubrics may be used as a part of formative assessment as well as on
assignments; therefore rubrics may provide additional information about students’
performance (Brookhart & Chen, 2014, Andrade & Du, 2005).
Rubrics are a prevalent grading tool used by teachers to assess and provide
feedback to their students. Rubrics, also known as scoring guides, are a way to guide
criteria-based assessment and encourage evidence-based decisions in the classroom.
They are used in support of the movement toward “assessment for learning” (Mandinach
& Jackson, 2012, p. 30) instead of the old methodology of learning for assessment
(Nordrum, Evans, & Gustaffon, 2013; Maninach & Jackson, 2012; Lipnevich, McCallen,
Miles & Smith, 2013). Rubrics provide a great visual way to organize feedback from the
teacher or for students to use to assess their own work. They can be a quick and clear
way for teachers to provide feedback to students in a timely manner (Lipnevich et al.,
2013). Rubrics can also help guide teachers through aspects of the criteria they are
looking for in an assignment and standardize their grading.

2
“Assessment for learning” (Mandinach & Jackson, 2012, p. 30) is beneficial for
students as well as teachers (McGatha & Darcy, 2010). Andrade and Du (2005)
conducted a study with 14 undergraduate teacher education students and results showed
when rubrics were given to students in advanced, university students were able to identify
more of the criteria that was expected to be in their assignment. In the study by Andrade
and Du (2005) when given rubrics, the university students received higher scores on their
assignment. It was determined by the study’s participants that rubrics provide “better and
fairer grades, improvements in the quality of work, and less anxiety about assignments”
(Andrade & Du, 2005, p. 5). Students liked knowing the expectations and exactly how
they will be evaluated which improves their performance on the assignment (Hafner &
Hafner, 2003). As Hafner and Hafner (2003) purported, when rubrics are used, students
produced a better product and therefore earned better grades. The grade is supported by
the feedback from the performance level descriptions in the rubric. Though rubrics can
promote learning and help students develop self-assessment skills, there is not much
empirical research to support this theory and the effectiveness of rubrics in the classroom
(Andrade & Du, 2005).
Rubrics can help university students focus on objectives and improve quality of
work, but are students taking the feedback they receive and applying it to future
assignments? If students were to process their feedback and compare their rubrics, there
should be a pattern of weaknesses and strengths to help students target certain areas in
which to improve on future assignments (Andrade & Du, 2005). Still, it is unclear if
provided a grade, students can see past their initial grade to receive and process the
teacher feedback, then apply the feedback to future academic products.

3
The purpose of this study was to determine how rubrics affect university graduate
students receptiveness to feedback, their future college assignments, and if they will use
rubrics in their own classroom. Specific research questions included the following:
1. In what ways do university graduate students apply feedback from rubrics to
future assignments?
2. How does seeing a grade influence university graduate students’ receptiveness
to feedback?
3. How do K-12 teachers apply their experience with rubrics to their own
classrooms?
4. How do teacher candidates intend to apply their experience with rubrics in
their future classrooms?

4
REVIEW OF THE LITERATURE
Data-Driven Decision Making
“Data-driven decision making has become an important topic linked to
accountability, school improvement, and educational reforms” (Mandinach & Jackson,
2012, 11). Data-driven decision making is largely effected by the movement away from
“assessment of learning” and to “assessment for learning” (Mandinach & Jackson, 2012,
p. 30). “Assessment of learning” (Mandinach & Jackson, 2012, p. 30) is assessing
students to see what they have learned through summative measures like a final exam or
standardized testing. “Assessment for learning” is when teachers use data to see how to
guide their instruction.
“Assessment for learning” (Mandinach & Jackson, 2012, p. 30) is often associated
with formative assessment. “Formative assessments are an important tool for students’
learning in three areas: motivation to study, awareness of their own learning and effects
on their learning” (Weurlander, Söderberg, Scheja, Hult, &Wernerson, 2012, p. 752).
Good teachers are continuously performing assessment either formal or informal to
collect data (Petrides, 2006). University professors view assessment as a way to look at
and assess student learning (Jacoby, Heugh, Bax, &Branford, 2014). Formative
assessment can also open a feedback loop between students and professors (Jacoby,
Heugh, Bax, &Branford, 2014, Reeves & Stanford, 2009). In order for assessment and
the feedback loop to be effective both the teacher and the student must be actively and
equally involved in the process (Jacoby, Heugh, Bax, &Branford, 2014).

5
Teachers and school programs are being held accountable for accomplishing the
Adequate Yearly Progress (AYP) (Mandinach & Jackson, 2012). In order to prove that
they have met this goal they must collect data. Data is collected to help improve the
instruction teachers provide to benefit the students. Data can show what students know or
do not know and help a teacher determine if they need to differentiate their instruction
(Kwan, 2011). It is important to gather this data through assessment in ways beyond
standardized tests (Reeves & Standford, 2009). In order for teachers to be data-driven,
they need to collect and analyze data efficiently (Mandinach & Jackson, 2012, Lipnevich
et al., 2013). University instructors understand the importance of formative assessment
however, they do not believe they have the time to implement it well (Lipnevich et al.,
2013). Also, after the teacher obtains data it takes time to determine how to use data
(Petrides, 2006). This need for efficiency may be met by using rubrics.
The remainder of the literature review will continue to demonstrate the
importance of data-driven decision making that has been established and explain how
rubrics may meet the need for efficiency as a way to collect data on a variety of
assignments. Rubrics will be defined and the process of creating them will be described.
Then rubrics will be connected to feedback. Finally, it will be explained how both
students and teachers use rubrics and the importance of why this study is being
performed.
Rubrics
Rubrics have become popular among educators as a form of assessment in the
classroom (Andrade & Du, 2005). Rubrics have been defined differently throughout

6
research, but there are commonalities amongst them. Reddy and Andrade (2010) define
rubrics as “a grid of assessment criteria describing different levels of performance with
clear grades” (p. 435). The level of quality typically ranges from excellent to poor. Each
level of performance, excellent to poor, should have a description of the quality expected
based on the criteria (Brookhart, 2013). Rubrics are concise and typically only one to
two pages (Andrade, 2000). They are a guide to the assignment that lays out the criterion
and level of quality in a visually organized way. When criteria is organized this way, it
can help teachers grade and assess efficiently and contribute to their use of data-driven
decision making.
Data-driven decision making is changing how teachers are approaching the
education of their students. Data needs to be collected efficiently and accurately to guide
teachers’ decisions in the classroom (Lipnevich et al., 2013). Rubrics may meet the need
for this efficiency. Rubrics can be used to the benefit of students and teachers. Rubrics
are a way to provide feedback and grades to students. However, grades may affect the
way students receive feedback.
Teachers use rubrics as a tool for grading. Rubrics provide a clear, easy format
when grading assignments. They may be used to gather data through formative
assessment. Projects, portfolios, and unit assignments are often graded with rubrics
(Andrade, 2000). From these data gathered with the rubrics, teachers may analyze the
data and decide if and how they may need to differentiate instruction (Reddy & Andrade,
2010).
Rubrics are beneficial because they may be used across grade levels: primary,
secondary, and post-secondary (Brookhart & Chen, 2014). They may be used on

7
assignments such as posters, essays, presentations or research papers. These assignments
can be lengthy and challenging to grade. Lipnevich, McCallen, Miles, and Smith (2013)
emphasized that in order to practice formative assessment effectively, teachers need to
give feedback to students quickly which becomes increasingly harder with a greater
number of students. Rubrics are a way to efficiently go through the criteria of a project
and assess where the student met the criteria and with what quality.
Once a rubric is developed it may not only be efficient, but, reliable. In order to
perform quality assessment rubrics must be considered valid and reliable (Heritage &
Yeagley, 2005, Hafner & Hafner, 2010). “The best rubrics allow evaluators and teachers
to draw on their professional knowledge and to use that professional knowledge in ways
that the rating process doesn’t fall victim to personality variations or limitations of human
information processing” (Wolf & Stevens, 2007, p. 13). Rubrics are considered reliable if
multiple people can use the rubric to score the assignment and get similar if not the same
results (Reddy & Andrade, 2010). “Several studies have shown that rubrics can allow
instructors and students to reliably assess performance” (Reddy & Andrade, 2010, p.
441). Reliability of the rubric is important not only to keep consistency between raters,
but also between one rater, or professor, and the work of multiple students (Reeves &
Standford, 2009). Validity is also important when it comes to rubrics to make sure they
are accurately measuring the assignment. Clarity of language is a large part of rubric
validity (Reddy & Andrarde, 2010). When rubrics are well developed they can be
reliable and valid, but professors need to decide what kind of rubric they want to create.
8
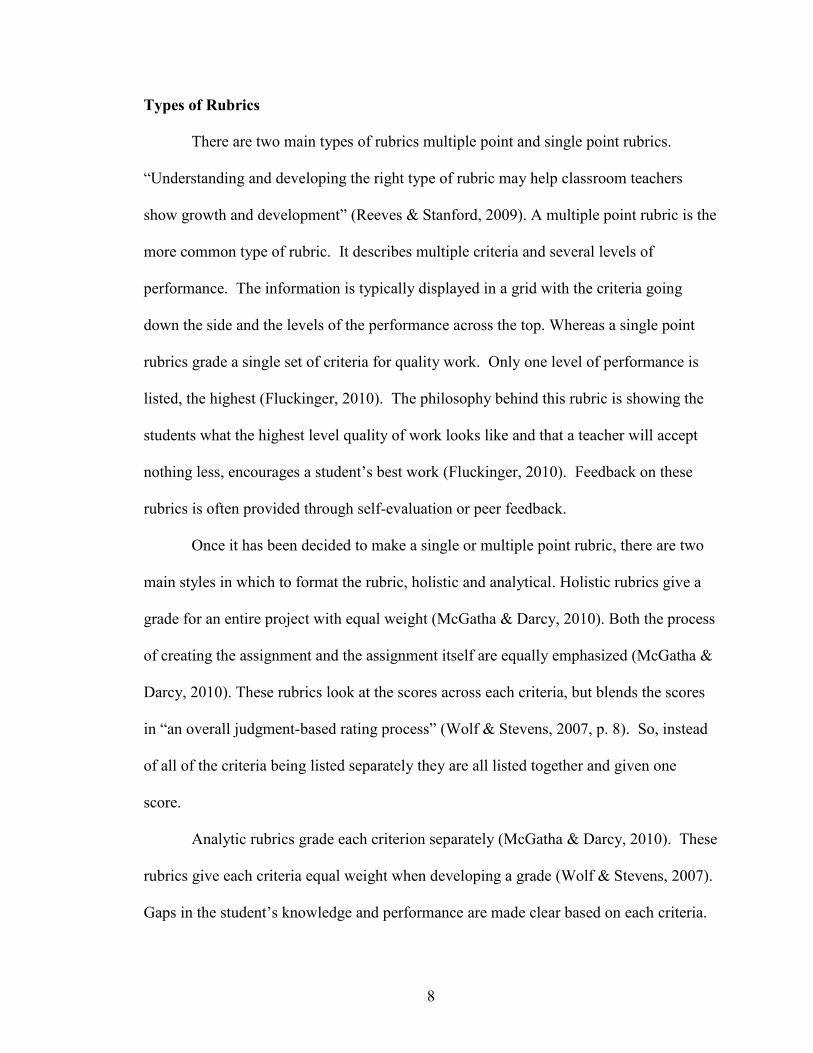
Types of Rubrics
There are two main types of rubrics multiple point and single point rubrics.
“Understanding and developing the right type of rubric may help classroom teachers
show growth and development” (Reeves & Stanford, 2009). A multiple point rubric is the
more common type of rubric. It describes multiple criteria and several levels of
performance. The information is typically displayed in a grid with the criteria going
down the side and the levels of the performance across the top. Whereas a single point
rubrics grade a single set of criteria for quality work. Only one level of performance is
listed, the highest (Fluckinger, 2010). The philosophy behind this rubric is showing the
students what the highest level quality of work looks like and that a teacher will accept
nothing less, encourages a student’s best work (Fluckinger, 2010). Feedback on these
rubrics is often provided through self-evaluation or peer feedback.
Once it has been decided to make a single or multiple point rubric, there are two
main styles in which to format the rubric, holistic and analytical. Holistic rubrics give a
grade for an entire project with equal weight (McGatha & Darcy, 2010). Both the process
of creating the assignment and the assignment itself are equally emphasized (McGatha &
Darcy, 2010). These rubrics look at the scores across each criteria, but blends the scores
in “an overall judgment-based rating process” (Wolf & Stevens, 2007, p. 8). So, instead
of all of the criteria being listed separately they are all listed together and given one
score.
Analytic rubrics grade each criterion separately (McGatha & Darcy, 2010). These
rubrics give each criteria equal weight when developing a grade (Wolf & Stevens, 2007).
Gaps in the student’s knowledge and performance are made clear based on each criteria.

9
A student may do really well on one criteria, but still lose points in another section
(McGatha & Darcy, 2010).
Once a type and style are chosen, a professors or teacher must create the
performance criteria, performance levels and the descriptions of each level of
performance. According to Wolf and Stevens (2007), there are three steps when creating
a rubric: “identifying performance criteria, setting performance levels, and creating
performance descriptions” (Wolf & Stevens, 2007, p. 6-7). First, when “identifying
performance criteria,” (Wolf & Stevens, 2007, p. 6) one must select the behaviors or
characteristics that need to be measured. Wolf and Stevens (2007) believe that the
optimal set of criteria is between three and six criteria. The criteria should also be
“observable and measurable” to make sure the rubric is assessing the desired performance
(Wolf & Stevens, 2007, p. 6)
After “identifying performance criteria” Wolf and Stevens (2007) suggested
setting performance levels. These levels define the different quality in performance
(Reeves & Stanford, 2009). The teacher or professor needs to decide how many
performance levels are necessary for their assessment; typically there are three to six
(Wolf & Stevens, 2007). “The fewer the levels of performance for the rater to consider,
the greater the reliability and efficiency in scoring the performance” (Wolf & Stevens,
2007, p 6). Terms to describe the performance levels can be developmental: “emerging,
developing, arrived” (Wolf & Stevens, 2007, p. 7), mastery-oriented: “below proficient,
proficient, above proficient” (Wolf & Stevens, 2007, p. 7), or different terms that show a
gradation in the level of quality such as: “outstanding, adequate, and needs work”
(Reeves & Stanford, 2009, p. 25).

10
The final step of creating rubric is “creating performance descriptions” (Wolf &
Stevens, 2007, p. 7). The performance descriptions are small paragraphs that describe
what each criteria looks like on each performance level. The paragraphs should be
descriptive, but not an overwhelming amount of text (Wolf & Stevens, 2007). “The rubric
is not intended to replace the instructor but instead to guide and support him or her in
exercising informed judgment.” (Wolf & Stevens, 2007, p. 7) As one reads the criteria
across the levels, the descriptions should be parallel (Wolf & Stevens, 2007). This means
that the descriptions are the same except for the levels of quality, making it clear for the
user to see the difference between levels.
Feedback
Another important part of rubrics is the feedback that the teachers provide through
them. “The fact that students do not understand the feedback they receive is a major
concern” (Jonsson, 2014, p. 841). In order for feedback to be effective, students must
have a knowledge of how they are currently performing, an understanding of what the
desired end product should be, and the students must be engaged in working toward the
desired product (Lipnevich et al., 2013). “If students do not successfully engage with the
feedback that they receive, feedback will not enhance student learning,” (Lipnevich et al.,
2013, p.541).
Individualized feedback can be added to rubrics via a comments section or side
notes from a teacher or professor. Written, detailed feedback is one of the most effective
ways of providing feedback to help students improve their performance (Lipnevich et al.,
2013). If feedback is general or vague it often does not include the information needed

11
for the student to evaluate their performance and see what they need to do to improve
(Lipnevich et al., 2013). Feedback needs to include information and strategies about
where they went wrong or the next step (Lipnevich et al., 2013).
Another issue in feedback is that students do not understand feedback (Jonsson,
2014). Professors work to provide transparency, or “students awareness and purpose of
assessment and assessment criteria” (Jonsson, 2014, p. 840). Nordrum, Evans, and
Gustafsson (2013) performed a study in which data on feedback from rubrics and in-text
comments from “46 reflective texts, 46 questionnaires, and 7 student interviews” was
studied (p. 924). Students typically understood feedback regardless of the method of it
being given, but sometimes struggled with the terminology used by the professor
(Nordrum, Evans, &Gustafsson, 2013).
Jonsson (2014) suggests teaching meta-cognitive strategies and other
instructional interventions to help students understand the criteria on the rubric and the
feedback provided. When the expectations of an assignment are not clear to students,
those students are more likely to struggle on the assignment (Wolf & Stevens, 2007).
Sometimes legibility of the teacher’s handwriting can interfere with the student’s
receptiveness to feedback (Jonsson, 2014). However, that can be addressed on the side of
the teacher. The students may need specific instruction on how to receive and apply
feedback effectively (Jonnson, 2014). Even if students do understand the feedback, it is
still a concern that seeing a grade, or exemplar, may affect how they receive the
feedback.
Students most often receive feedback in the form of a grade, such as letter grades
(i.e. A, B, C, D, and F) or in the form of a percentage (McGatha & Darcy, 2010). These

12
grades on their own are summative and give students no information on how to improve
their work (McGatha & Darcy, 2010). Lipnevich, McCallen, Miles, and Smith (2013)
say that seeing a rubric that breaks down the criteria of the assignment and shows where
the student falls short can help the student understand the grade received (Lipnevich et
al., 2013). However, they admit that there is not much evidence to support this claim.
Use of Rubrics
Students mainly view rubrics in a positive light (Andrade & Du, 2005). They see
rubrics as a guide to assessment (Andrade & Du, 2005). The criteria on the rubrics guided
them through their projects by reminding them to include important aspects the professor
was assessing (Jonsson, 2014). Rubrics remove the guessing of the professor’s
expectations from an assignment (Andrade & Du, 2005). Students are also able to plan
their assignment based off of the information provided in the rubric to make sure they
have all of the required items (Jonsson, 2014)
A variety of studies have been done to determine the student opinion of rubrics.
In a study by Jonsson (2014), students determined “it’s valuable to know what to look for
and think about” (p. 848). These students also claimed that rubrics allowed them to
structure their work, reflect on their performance as they completed the assignment, and
after completing the assignment they were able to see what criteria they missed (Jonsson,
2014). There were some students who did not use the rubric because they did not have to
or want to use the criteria (Jonsson, 2014). Some students also did not understand the
terms used on the rubrics which caused them to miss certain criteria (Jonsson, 2014).

13
Andrade and Du (2005) conducted a study with “fourteen undergraduate teacher
education students” in a focus group (p. 2). The common ideas the students shared were
that rubrics were used by students to “determine a teacher’s expectations, plan
production, check their works in progress, and guide and reflect on feedback from others”
(Andrade & Du, 2005, p. 3). Students said they often had anxiety about not knowing
what teachers expected of them. Rubrics helped to ease that anxiety. Students also
indicated the grades were fairer because they could see exactly why the professor graded
them the way they did (Andrade & Du, 2005).
Students appear to like rubrics, but teachers have conflicting views. Reeves and
Stanford (2009) purported that teachers are not using rubrics because they believe they
are take too much time, are unreliable, invalid, and confuse parents and students.
However, teachers are driven by the need to be data-driven and collect data through
formative assessment beyond testing with different means (Reeves & Stanford, 2009).
When rubrics are thoroughly developed, they can reliably be used to grade a variety of
assignments (Reddy & Andrade, 2010). Teachers and professors also do not need to
come up with rubrics from scratch for every assignment. There are many websites that
have premade rubrics or rubric generators to help teachers build their rubrics (Reeves &
Stanford, 2009).
Teachers can use rubrics in one of three main ways: (a) giving the rubric to
students in advanced, (b) using the rubrics as a grading tool used for a final product, or
(c) a combination of the two. When given to students in advanced, rubrics can help
students make “dependable judgments about the quality of their own work” (Andrade,
Du, & Wang, 2008, p. 3). In a study by Andrade, Du and Wang, (2008) it was purported

14
that when students used rubrics in advance to self-assess their drafts that the quality of
their final product and scores improved.
Rubrics can benefit both teachers and students simultaneously. “The rubric is
valuable to both the instructor and the student as a quick and clear summary of
performance levels across a scoring scale” (Hafner & Hafner, 2010, p. 1510). Students
like the transparency of rubrics and teachers appreciate their efficiency. However,
professors have to do some work to make sure that rubrics are effective. Just handing a
rubric out to students does not automatically improve grades or quality of student work.
When teachers take the time to explain their rubrics and clarify their expectations, the
student performance greatly improves (Jonsson, 2014). It is also challenging for students,
even if they understand the criteria, to translate that criteria into their final product
(Andrade, Wang, Du, & Akawi, 2009). It is the job of the teacher to make sure that the
instruction on the rubrics and feedback are given to the student effectively, however, it is
the job of the student to apply the feedback in the future.
More research is needed on rubrics and their effectiveness. “This review of the
literature showcases a literature that is beyond its infancy, but not yet mature” (Brookhart
& Chen, 2014, p. 361). College students in teacher preparation programs are working to
become future educators. These students are currently on the receiving end of feedback
and will soon be collecting data and providing feedback to their students. It is important
that they make the connection between effective feedback they have received and how to
encourage that in their future students.
Data-driven decision making is pushing teachers and professors to collect data
through a variety of assessments. These data must be collected efficiently and properly

15
developed rubrics can assist in collecting data reliably and efficiently (Lipnevich et al.,
2013). Rubrics can be beneficial to teachers and students, but the question still remains
are students taking that feedback and applying it to future assignments? Students also see
grades as a form of feedback, but, does seeing a grade effect how students receive
feedback? This study was performed to determine how rubrics affect student
receptiveness to feedback and future college students’ assignments.

16
METHODS
The purpose of this study is to determine how rubrics affect student receptiveness
to feedback, how university students apply the feedback from grading rubrics to future
assignments, and how their experience with grading rubrics carries over into their
classroom or will be implemented in their future classroom. The research questions
investigated were:
1. In what ways do university graduate students apply feedback from rubrics to
future assignments?
2. How does seeing a grade influence university graduate students’ receptiveness to
feedback?
3. How do K-12 teachers apply their experiences with rubrics to their own
classrooms?
4. How do teacher candidates intend to apply their experiences with rubrics in their
future classrooms?
Research Design
The research was conducted through a survey, mixed methods design both a
quantitative and qualitative approach. A survey was chosen because data can be collected
quickly and reach a large number of people efficiently through email (Crewswell, 2009;
Drew, Harman, & Hosp, 2008). Surveys examine “the opinions of a large group of people
about a particular topic or issue” (Frankel & Wallen, 1996, p. 367). It was beneficial in
this study to reach a large number of graduate students quickly (Creswell, 2009; Drew,
Hardman, & Hosp, 2008). The survey being sent by email ensures that the participants

17
receive the survey at the same time, as opposed to them being mailed out (Drew,
Hardman, & Hosp, 2008). Quantitative data examines “the variables [which] can be
measured, typically on instruments, so that numbered data … can be analyzed using
statistical procedures” (Creswell, 2009, p. 4). When an idea needs to be further
researched, there are also advantages of using a qualitative approach (Creswell, 2009). In
qualitative design, the researcher analyzes these data by finding themes and trends in the
data (Creswell, 2009). To further investigate the research questions, the researcher chose
to include both quantitative questions for statistical data and qualitative data to find
potential new themes and trends in these data from the perspective of the participants.
Participants
Participants were teacher and teacher candidates who were currently graduate
students from a Midwest University. Surveys were sent to 767 graduate students. The
participants were asked to identify their age, gender, degree sought, and whether they
were a teacher or teacher candidate at the time of the survey. At the time of the study,
teachers were certified teachers and a teacher candidates will be certified to teach at the
end of their graduate program. If students were ineligible for the survey, because they
were neither a teacher or teacher candidate, they were removed from the survey based on
their answer to that specific question. No other prior knowledge was required of the
participants in order to complete the survey.
Informed consent was presented to each participant before he/she completed the
survey (Appendix A). Participants were sent an Informed Consent document by email
that outlined all procedures that would be used during the study (Creswell, 2009; Drew,

18
Hardman, & Hosp, 2008). The document stated that participation was voluntary and that
participants were free to decline without penalty. Participants were informed that
participation in this study posed no anticipated risk other than taking time to complete the
survey. The survey was anticipated to take 15 minutes. They were informed that no one,
including the researcher, would be able to associate the responses with the participants.
Typed responses lowered the risk of identifying the participants, as well as, the setting in
which the survey results were being displayed.
The participants were informed that by entering the survey, they were confirming
that they had read the Informed Consent document and agreed to take the survey (Drew,
Hardman, & Hosp, 2008). Participants were able to withdraw from participation in the
survey at any time without penalty. Prior approval for this project was obtained from
Missouri State University IRB (03/08/16; FY2016-136).
Data Collection Instruments
The surveys were distributed to the participants through SurveyMonkey. Both
surveys, the teacher survey (Appendix B) and the teacher candidate survey (Appendix C),
were sent to all participants. The results of the survey were computed and complied into a
spread sheet through Survey Monkey. The researcher selected the option for the surveys
to be anonymous. SurveyMonkey (2016) states “data that makes your respondents
personally identifiable [will not] be included in your survey results.” The surveys being
anonymous and typed helped the researcher remove potential biases when interpreting
the results (Hatch, 2002). The participants were asked to honestly complete the survey.

19
Results of the survey were analyzed and coded by theme (Frankel & Wallen, 1996).
Quantitative data was calculated through Survey Monkey and IBM-SPSS.
Data Collection Procedure and Analysis
Data was collected from a web-based survey. Emails were sent the graduate
students. The email addresses of the students were inputted into SurveyMonkey by the
Director of Certification at a Midwest university to ensure the anonymity of the
participants. The students were given a two week window to complete the electronic
survey, if they elected to participate. If a 20% return rate of participants was not
achieved in the two week window, the window would be extended to four weeks. A
reminder email was sent out once a week up to three times after the initial email. There
was an incentive for the participants. The participants were informed in the email that
participation in the survey would give them the chance to receive one of two $50.00 Visa
gift cards. The recipients of the gift cards would be randomly selected by the Director of
Certification to ensure that the participants were not known by the researcher. The
survey included a series of multiple choice, yes or no questions, and open-ended
questions, or prompts to complete. Close-ended questions were asked to collect
definitive data by having the participants determine the response that best fits their
opinion or view (Creswell, 2009). Open-ended questions were asked to allow
participants to answer questions freely while reflecting on their experiences related to
rubrics (Creswell, 2009).

20
The data from the quantitative survey questions were analyzed through
SurveyMonkey and IBM-SPSS. The programs calculated percentages for each question
and examined any potential correlations in the data. Open-ended prompts were given to
allow participants to elaborate or share specific experiences. The open-ended survey
responses were coded by the researcher into themes. Common trends in the themes were
compiled to determine how the majority of the participants viewed rubrics through their
answers to the survey questions. Outliers that countered the themes that emerged from the
data were observed and noted when analyzing the responses (Creswell, 2009).

21
RESULTS
The purpose of this study was to determine how rubrics affect university
graduate students receptiveness to feedback, their future college assignments, and if they
will use rubrics in their own classroom. Presented in this chapter is the analysis of data
collected from the two surveys. One survey was designed for teachers, the other survey
was for teacher candidates. First discussed will be the teacher survey’s demographics,
quantitative results, and qualitative results, then the teacher candidate survey’s
demographics, quantitative results and qualitative results, This will be followed by a
comparison of the two surveys’ results, and the limitations of the study.
In this study, participants were categorized into two groups: teachers and teacher
candidates. The participants were sent links to both surveys and asked to pick the
appropriate survey for them. Some participants entered the survey that did not apply to
them, exited the survey after completing demographic questions, and then went to
appropriate survey. The survey was sent to 767 candidates of which 100 participants
entered the teacher survey and 86 participants entered the teacher candidate survey.
Between the two surveys there was a 24% response rate. Participants were asked to fill
out all demographic information before they were asked if they were a certified teacher
or if they would be receiving their teaching certificate upon the completion of their
graduate program. This means that participants who were not applicable for the survey
were not removed until after receiving their demographic information. Some participants
may have been sent to, and completed, the correct survey and some may not have taken
the second survey. This will be discussed further in the limitation section.

22
Teacher Survey
Table 1, in the center column, shows the gender, age, and years of teaching
experience of the 99 participants who completed the teacher survey. Of the participants
85% were female and 15% were male. The age range spanned from 21 to 57 with a mean
of 33, median of 30 years-old and a mode of 27 years-old. The teachers’ certification
ranged from kindergarten through the 12th grade. The years of teaching experience ranged
from 0 to 20 with a median of 5 years and mean of 5 years.
Table 1. Demographics of Participants. Data for teachers and teacher candidates are
divided into gender, age, and years of teach experience.
Demographics Division of Data Teachers (n=99) Teacher Candidates
(n=82)
Female 85% 82%
Gender Male 15% 18%
Range 21-57 21-57
Median 30 30
Age Mode 27 23
Mean
34 33
Range 0-20+ 0
Teaching Median 5 0
Experience Mode 5 0
Mean 6 0
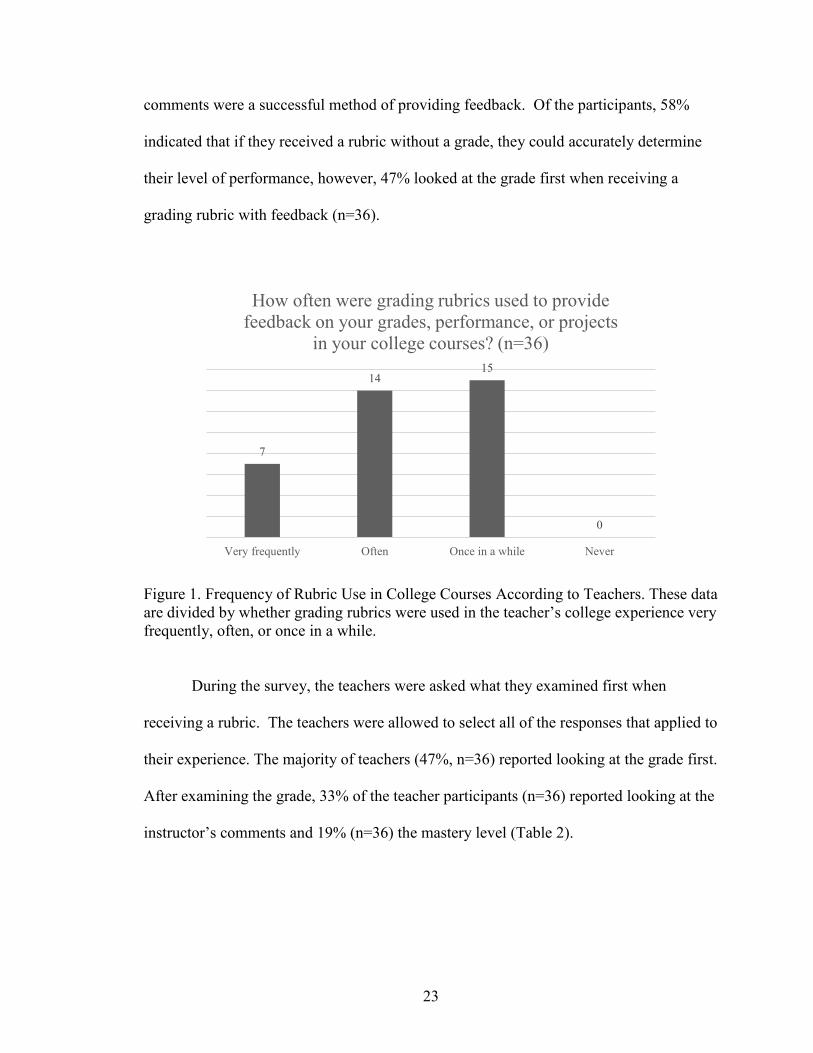
Quantitative Results. During their college years, 81% of the teachers surveyed
(n=53) used rubrics. Figure 1 shows 42% of participants said rubrics were used once in a
while throughout their college experience and 39% said they were used often. When
asked if they believed rubrics provided clarity of instructor feedback, 94% (n=36) agreed.
Less than a third (31%, n=35) indicated that rubrics with scores, but, without written
23
comments were a successful method of providing feedback. Of the participants, 58%
indicated that if they received a rubric without a grade, they could accurately determine
their level of performance, however, 47% looked at the grade first when receiving a
grading rubric with feedback (n=36).
Figure 1. Frequency of Rubric Use in College Courses According to Teachers. These data
are divided by whether grading rubrics were used in the teacher’s college experience very
frequently, often, or once in a while.
During the survey, the teachers were asked what they examined first when
receiving a rubric. The teachers were allowed to select all of the responses that applied to
their experience. The majority of teachers (47%, n=36) reported looking at the grade first.
After examining the grade, 33% of the teacher participants (n=36) reported looking at the
instructor’s comments and 19% (n=36) the mastery level (Table 2).
7
1415
0
Very frequently Often Once in a while Never
How often were grading rubrics used to provide
feedback on your grades, performance, or projects
in your college courses? (n=36)

24
Table 2. What University Students Examined First on a Rubric According to Teachers
(n=36). These data are represented by the percentage of respondents to this survey
question. I
Item on Rubric Percentage
Grade 47%
Instructor comments 33%
My mastery level within the rubric 20%
I do not care about the rubric 0%
I Participants selected as many answers that applied to their experience.
The majority of the teacher participants (47%, n=36) reported examining the
grade first when receiving a completed grading rubrics in their college courses.
Regardless of being given a letter grade high, low, or none at all, over half of the
participants were still receptive to feedback and 40% (n=36) were very receptive to
feedback (Figure 2).
Figure 2. Influence of Grade on Receptiveness of Feedback According to Teachers.
These data are divided by the effect of receiving no letter grade, a high grade, or a low
grade and no teachers responded very unreceptive.
12
16
15
20
19
18
4
1
3
When you received a rubric with no letter
grade on it
When you received a high grade
When you received a low grade
Instructor's feedback receptivness
Very Receptive Receptive Not Receptive Very Unreceptive

25
In their own classrooms, 91% of surveyed teachers have used grading rubrics
(n=46). Of the teachers surveyed, 47% believed their previous experience, with grading
rubrics at the university, affects their use of rubrics in the classroom (n=38). As shown in
Table 3 on the subsequent page, 74% provided rubrics to students in advanced as a guide
to the assignment and 92% agreed their students perform better on assignments when
they are provided a grading rubric in advanced (n=38). Over half of the teachers, (55%,
n=38) also reported that they use rubrics because their school is data-driven and they use
rubrics to collect data. When they use rubrics, 60% (n=38) use their own and pre-made
rubrics and 32% (n=38) use only their self-made rubrics.
Table 3. The Reason(s) for Using Grading Rubrics in the Classroom According to
Teachers (n=38). The percentages are based on the amount of respondents that answered
this survey question. I
Reasons Percentage
To benefit the students by giving them the rubrics as a guide 74%
My school is data-driven and I use rubrics to help collect data 55%
The ease and efficiency of grading 47%
Because I was taught to use rubrics 24%
I do not use rubrics 0%
I Participants selected as many answers that applied to their experience.
Qualitative Results. Each research question had a correlating qualitative survey
question(s). Not all participants answered each question, therefore, each survey question

26
and themes were calculated based on the answers for that particular research question.
Some of the themes overlapped between the research questions, but the themes were
determined and calculated based on the set of answers to the correlating survey question.
Themes for each research question were determined by ideas that were repeated
amongst responses to the open-ended survey questions. Amongst the responses,
something resonated with at least 20% of the pool to be considered a theme. Some
themes were stronger in comparison to others, but weak themes, with 20% or less
participants establishing a theme, were still reported to represent the opinions of all
participants in the study.
To answer the first research question about rubrics use at the university level,
qualitative questions were asked about the benefits of being graded by rubrics and what
they have changed regarding their quality of work from using a grading rubric. When
asked about the benefits of being graded by rubrics, four themes were present:
expectations, feedback, improvements, and grade understanding (Figure 3). The two
strongest themes that resonated with more than 20% of the pool were expectations and
improvements. When asked what benefits they received from using rubrics, 45% (n=35)
reported benefiting from rubrics as a guide to the project and knowing the instructor’s
expectations. One respondent said, “I like to get the rubric before the assignment is
completed to know what the teacher is looking for.” Another reported it benefited them
to “know the specific expectations of the assignment while I can actually do something
about it.” Knowing how to improve and identifying strengths and weaknesses were
important to 22% of the participants. One participant reported, “Rubrics helped me
because then I know what to work on in the future.” The other, weaker trends that

27
emerged were that 14% of participants benefited from the feedback and 14% benefited by
understanding their grade better. A participant reported benefiting from “specific
feedback on what I lacked or did well on an assignment” and another reported, “I had a
clearer understanding of how the assignment was graded.”
Figure 3. Research Question 1 Themes According to Teachers. These data are divided
into the four themes that emerged from qualitative survey questions.
When asked what participants changed regarding their quality of work from using
a grading rubric, 67% (n=31) of participants said they worked to meet all of the
instructors requirements and improve their quality of work. One participant reported, “I
attempt to make sure my work fits all the high levels of mastery when working using a
rubric as a guide.” Of the teachers surveyed, 6% of participants mentioned student
learning and the ability to correct mistakes. Another 10% of participants answered the
question as if the rubrics were being used in their classroom. Those participants
mentioned changing the complexity of the rubric to improve student understanding and
05
101520253035404550
Expectations Feedback Improvement Grade
Understanding
Per
centa
ge
Themes
Research Question 1 Themes According to Teachers

28
using them for consistency of grading. There were also outliers such as one participant
who reported “I don’t believe in them [rubrics].” Another reported “My quality of work
has stayed the same.”
Responses were collected on the second research question about how a grade
affects their receptiveness to feedback. The participants were asked if seeing a grade
affected how receptive they were to feedback. The majority of participants (70%, n=33)
said that the grade had no effect, however, 18% reported being affected by a low score
(Figure 4). Of the participants who reported being affected by a low score, 85% (n=6)
said they would read the feedback more carefully to make improvements. One
respondent noted, “I am more receptive to feedback with a lower score because I know
that there are things I need to improve on.” The theme throughout the responses of two-
thirds of the participants (67%, n=33%) was “feedback.” Students reported wanting to
read the feedback and being receptive to it no matter the grade.
Figure 4. Research Question 2 Themes According to Teachers. These data shown are the
percentages of how teachers report being effected when seeing a grade.
0
10
20
30
40
50
60
70
80
No Effect Effected By Low Grade
Per
cen
tage
Themes
Research Question 2 Themes - Teachers

29
Three qualitative questions were asked to collect data on the third research
question. The questions collected data on how K-12 teachers apply their experience with
rubrics to their own classrooms. When the participants were asked about how their
students benefit from feedback, two major themes developed: expectations and
improvement of student work. Over two-thirds of participants (68%, n=31), reported on
the importance of rubrics as a guide to instruction and a way to convey expectations
(Figure 5). One participant reported, “Students gain the benefits of knowing the
expectations before starting the assignment.” Another stated, “Students can see what the
requirements are before they start the paper. That way they will know exactly what is
expected or why they received the grade they did.” The second theme, improvement of
student work, related to improvements and identifying strengths and weaknesses was
mentioned by 23% of participants. One participant stated, “They [students] know the
specific areas they can improve in.” Another reported, “They learn about areas on which
they need to focus in order to learn and improve.” There were outliers of participants
(6%, n=31) who do not use rubrics with their students. There was also a participant who
reported, “I think there is some benefit however, I do not believe they take it as seriously
at the high school level.”

30
Figure 5. Research Question 3 Themes According to Teachers. Data shown are divided
into the two themes that emerged from qualitative survey questions.
Participants were then asked to reflect on how their personal experience with
grading rubrics has affected their use of grading rubrics in their classroom. Overall,
participants (90%, n=29) benefited and intend to continue rubrics use. The theme of
expectations was clear again when asked this question. Of the participants, 40% (n=29)
mentioned expectations and the clarity rubrics provide as a reason they use rubrics. One
participant stated, “I liked knowing what was expected of me so I like doing that same
things for my students.” Other themes that reoccurred were consistency in grading (10%)
and student improvement (10%). Of the participants, 7% mentioned working with
younger grades and that they used rubrics more to the benefit of the parents than the
students. One of the outliers was the 10% of participants who do not use rubrics. One
participant reported, “I benefited greatly from rubrics but again I have not felt the need to
utilize them a lot at the high school level because the students do not seem to care as
much.”
0
10
20
30
40
50
60
70
80
Expectations Improvement
Per
centa
ge
Themes
Research Question 3 Themes According toTeachers

31
A question not asked by the researcher, but that was generated during this study
from the last survey question was: how do teachers feel seeing a grade on a rubric affects
their students’ receptiveness to feedback? Of the participants, 50% (n=30) reported that
seeing a grade has an effect on their students’ receptiveness to feedback. A participant
stated, “If a student sees a low grade they shut down and are turned off by looking at the
comments.” Another participant mentioned the effect of higher grades as well as lower
grades, “I think a letter grade has an automatic connotation – either ‘I did well and I’m
done’ or ‘I did poorly and I’m done.’” Of the teachers surveyed, 17% reported leaving a
grade off the rubric and 13% reported that they believed seeing a grade does not matter.
One participant stated, “Taking away the letter grade makes the students pay attention to
where they went wrong.” Then another participant said, “I don’t think it affects the
student’s willingness to read the feedback.”’
Teacher Candidate Survey
Eighty-six teacher candidates completed the candidate survey. Teacher
candidates made up 46% of the participants in this survey and 11% of the response rate.
In the survey they were asked if they had their teacher certification or if they would
receive teacher certification on completion of their graduate program. Those who
identified themselves as receiving their initial certification at the graduate level remained
in the survey. Of these participants, 82% were female. The ages of the participants
ranged from 21 to 57 with a mean of 32, a median of 30 years-old and a mode of 23
years-old. Their years of teaching experience ranged from 0 to more than 20 years with a
median of 5 years. See Table 1, page 21.

32
Quantitative Results. During their college years, 100% of the teacher candidates
(n=43) used rubrics. As shown in Figure 6, teacher candidates reported that 45% had
rubrics used often and 37% had rubrics used once in a while during their university
experience (n=38). When asked if they believed rubrics provided clarity of instructor
feedback, 87% agreed (n=38). Less than a fifth (18%, n=39) reported that rubrics with
scores, but without written comments, were a successful method of providing feedback.
Conversely, 50% reported that if they received rubrics without a grade they could
determine their level of performance (n=38).
Figure 6. Frequency of Rubric Use in College Courses According to Teacher Candidates.
These data are divided by the frequency of grading rubric use in college courses.
The teacher candidates were asked what they examined first when receiving a
grading rubric. They were able to select as many answers that applied to their
experience. When receiving a grading rubric, 44% examined the instructor comments
first, followed by 38% of the respondents examined at the grade first (Table 4, n=39).
The minority of teacher candidates examined the mastery level within the rubric first.
7
17
14
0
Very Frequently Often Once in a while Never
How often were grading rubrics used to provide feedback on
your grades, performance, or projects in your college courses?
(n=38)

33
Table 4. What University Students Examined First on a Rubric According to Teacher
Candidates (n=39). The percentages are based on the amount of respondents that
answered this survey question.
Item on Rubric Percentage
Instructor comments 44%
Grade 38%
My mastery level within the rubric 18%
I do not care about the rubric 0%
No matter if there was no grade received, or a high or low grade received, 89% of
participants were receptive or very receptive to instructor feedback (Figure 7). About a
fourth of the participants (26%, n=39) noted not being receptive to feedback when there
was no grade and when there was a high grade, however, no participants reported being
less than receptive to feedback when given a low grade.
Figure 7. Influence of Grade on Receptiveness of Feedback According to Teacher
Candidates. These data are divided by the effect of receiving no letter grade, a high
grade, or a low grade and no teachers responded very unreceptive.
9
19
21
19
18
18
10
2
0
When you received a rubric with no letter
grade on it
When you received a high grade
When you received a low grade
Instructor's feedback receptivness
Very Receptive Receptive Not Receptive Very Unreceptive

34
When in their future classrooms, 92% (n=39) of the participants intend to use
grading rubrics in the classroom. Ninety four percent [94% (n=34)] believed that their
previous experience, with grading rubrics at the university, will affect their use of rubrics
in the classroom, however, 62% of participants report that they were not taught how to
make rubrics in their university courses (n=34). When in their future classrooms, 97% of
the participants will use rubrics to benefit the students by giving the rubrics as a guide
and 67% will use them for ease and efficiency of grading (Table 5, n=33). Forty-two
percent (42%, n=33) also reported using rubrics to be data-driven in their classroom. To
design rubrics, 85% (n=38) of participants intend to use both their own and pre-made
rubrics.
Table 5. The Reason(s) for Using Grading Rubrics in the Classroom According to
Teacher Candidates (n=33). These data are represented by the percentage of respondents
to this survey question. I
Reasons Percentage
To benefit the students by giving them the rubrics as a guide 97%
The ease and efficiency of grading 67%
Being data-driven 42%
Because I was taught to use rubrics 21%
I do not use rubrics 0%
I Participants selected as many answers that applied to their experience.

35
Qualitative Results. The first research question of this study asked how graduate
students apply feedback from rubrics to future assignments. The participants were asked
what benefits they have received from being evaluated by rubrics and three themes
emerged: expectations, feedback, and improvement (Figure 8). Of the teacher candidates,
100% stated that they benefited from being evaluated by rubrics (n=24). Over half of the
participants (54%, n=24), reported benefiting from knowing the expectations. One
participant stated, “When completing an assignment, I would use the rubric as a guide.
Periodically, I would check the rubric as I progressed to see if I was fulfilling the aim of
the assignment.” The benefit of improving on assignments and identifying strengths and
weaknesses was mentioned by 33% of participants. A participant stated, “Grading
rubrics give [gave] me criticism which I use to help me on the next assignments.”
Another said, “I am able to see where I either did well or need more improvement.” Of
the participants, 29% of participants said that they benefited from feedback. One
participant stated, “I tended to get more holistic feedback when graded based on a
rubric.” The 4% of outliers mentioned that they needed more experience to answer this
question.

36
Figure 8. Research Question 1 Themes According to Teacher Candidates (n=24). These
data are divided by themes that emerged from qualitative survey questions.
The second research question in this study asked how a grade influences the
receptiveness to feedback. When participants were asked about how a grade affects their
receptiveness to feedback, 92% (n=24) mentioned they were still receptive to feedback.
Of the participants, 71% specifically said they were not affected by a grade whether it
was high or low (Figure 9). Seeing a low grade affected 25% of participants, but they
reported being more receptive to the feedback to show improvement. One participant
stated, “I tend to take feedback more seriously when the grade is low, as the feedback
generally includes ways to improve.” Seeing a high grade affected 13% of the
participants. They stated that they still read comments, but they tend to be positive with
less feedback on how to improve. A participant said, “If I receive a higher grade, I read
the feedback however it is less important to me.” Another said high grades are, “…just
positive remarks which don’t allow me to improve, rather continue at the level I am
0
10
20
30
40
50
60
Expectations Feedback Improvement
Per
cen
tage
Themes
Research Question 1 Themes According to Candidates

37
currently.” The other 8% of participants were outliers who believed they did not have
experience to answer the question or believed the question was not applicable to them.
Figure 9. Research Question 2 Themes According to Teacher Candidates. These data
shown are the percentages of how teachers report being effected when seeing a grade.
The final research question of this study asked teacher candidates how they intend
to apply their experience with rubrics to their future classrooms. The four themes that
occurred were expectations, feedback, improvement, and teacher benefit (Figure 10).
The majority of the participants (96%, n=23), intend to use rubrics in their future
classroom based off of their experiences. Figure 10 shows, 38% of the participants cited
expectations as a reason they want to use rubrics. “Rubrics provide clarity to
assignments and direction when doing assignments. I will use them so my students know
what I expect and how to get the grade they want.” Feedback was important to 17% of
participants. “I have had positive experiences with rubrics when completing classroom
assignments and receiving grades from them. That will help me when giving students
rubrics and teaching them the importance while also being specific with grading from a
rubric to provide feedback.” 13% of participants specified the importance of
0
20
40
60
80
No Effect Effected By Low Grade Effected by High Grade
Per
cen
tage
Themes
Research Question 2 Themes According to Teacher Candidates

38
improvement. “I find them [rubrics] effective to use because students are able to see
exactly where they did well or need improvement and it has made me want to use them
for that reason.” The final theme was that 13% of teachers report efficiency and
consistency in grading as a reason they will use rubrics. One participant stated, “…how
easy it is to grade the assignment will become time effective.”
Figure 10. Research Question 4 Themes According to Teacher Candidates. Data shown
are divided into the two themes that emerged from qualitative survey questions.
Comparisons Between Participant Groups: Teachers and Teacher Candidates
There were similarities between the teacher and teacher candidate surveys in
both the quantitative and qualitative data. A direct comparison of themes that emerged in
the qualitative questions is displayed in Table 6 on the subsequent page. The quantitative
data and quantitative data also directly coincided with each other. All of the participants
were currently enrolled in a graduate program in the educational field. The participants
0
5
10
15
20
25
30
35
40
Expectations Feedback Improvement Grade
Understanding
Per
centa
ge
Themes
Research Question 4 Themes - Candidates

39
were divided into two categories, teachers and teacher candidates, and directed to the
appropriate survey by whether they currently had or would receive their teacher
certification upon the completion of their graduate program.
Table 6. Comparison of Teacher and Teacher Candidate Themes. Themes are arranged
in descending order of importance to the participants.
Questions Teachers Teacher Candidates
Research Question 1 Expectations Expectations
Application of Feedback Feedback Feedback
Improvement Improvement
Grade Understanding
Research Question 2 No Effect No Effect
Influence of Grade Effected by Low Grade Effected by Low Grade
Effected by High Grade
Research Questions 3 Expectations Expectations
And 4 Improvement Feedback
Rubric Use in Improvement
Classroom Teacher Benefit
Similarities. There was a similar number of participants who took the teacher
survey and the teacher candidate survey. From the 767 potential participants, 99 took the
teacher survey and 86 took the teacher candidate survey. Both groups of participants
who complete the teacher survey and the teacher candidate survey were graduate level
students from a Midwestern university. Each had over 80% female participants and the
participants’ ages ranged from 21-57 with a median of 30 years-old.
Both participant groups, teachers and teacher candidates had gained experience
with rubrics at the university level. Rubrics were used frequently or once in a while in
both experiences. Both groups had the majority agree, at 87% or higher, that rubrics
provided clarity of instructor feedback. Two-thirds of the participants or more in each

40
group indicated that written feedback was necessary in understanding a grade from a
rubrics. In both groups of participants, the majority were receptive or very receptive to
feedback no matter the grade or if a grade was present or not provided. In their
classrooms or future classrooms, 75% or more of the participants use or intend to use
rubrics based on their experience at the university level. Over 92% of both groups
believed that the use of rubrics is beneficial to students.
For the first research question, participants were asked questions on their rubric
use to see if they are applying feedback to future assignments. On both surveys, three
themes occurred: expectations, improvement, and feedback (Table 6). Almost half or
more of each group reported benefiting from knowing the expectations of a teacher from
the rubric. Over a fourth of each group specified the importance of using rubrics to
improve future assignments and identified their strengths and weaknesses. Lastly, 15%
or more of each group cited the importance of the feedback they received from rubrics.
The second research question examined seeing a grade and how it influenced a
student’s receptiveness to feedback. The themes were that seeing a grade had ] minimal
on their receptiveness to feedback and that low grades made them more receptive to
feedback (Table 6). The majority of both groups (70% or more) stated that they were
receptive to feedback regardless of the grade they received. In both groups,
approximately one-fifth of participants reported being affected by a low score and that
low scores caused them to be more receptive to feedback in order to improve in the
future.
The third and fourth research questions examined how the participants use or
intend to use rubrics in their own classrooms. Two themes were common between the

41
two groups: expectations and the improvement of student work (Table 6). The majority
of participants in each group use or intend to use rubrics in their future classroom. Each
group found clarity of expectations and rubrics being a guide to assignments to be one of
the most important reasons to use them. They both believed students performed better
when the expectations are clear and well communicated.
Differences. The participants were split into two categories: teachers and teacher
candidates. This was based on whether they currently had their teaching certification or
would receive it upon completion of their master’s degree. The teachers all had 1 or more
years of teaching experience whereas the teacher candidates did not yet have teaching
experience in their own classroom(s).
During their college experience, 100% of the teacher candidates reported rubrics
use and only 81% of teachers reported rubric use. When given a grading rubric, almost
half of the teachers examined the grade first, whereas almost half of the teacher
candidates examined the instructor comments first. Teacher candidates also reported not
being affected by there being no grade on the rubric.
In their own classrooms, second to benefiting the students as a guide, teachers
used rubrics as a data-driven source (55%, n=38) and teacher candidates said they would
use them for the ease and efficiency of grading (67%, n=38). Though 42% of teacher
candidates still selected being data-driven as a reason to use rubrics. Of teacher
candidates, 85% intend to use both pre-made and their own rubrics and only 60% of
teachers report using both. Thirty-one percent (31%, n=38) of teachers report using only
rubrics they create themselves.

42
For the first research question, participants were asked questions on their rubric
use to see if they applied feedback to future assignments. The teachers had one theme,
grade understanding, in addition to the three themes the two groups shared (Table 6). Of
the teachers, 14% specified that rubrics helped them better understand the grade they
received. When asked what they would change about the quality of their work based on a
rubric, 10% of the teachers answered the question in regard to their own classroom.
The second research question examined how seeing a grade influences a student’s
receptiveness to feedback. Unlike the teacher participants, the teacher candidates
discussed the effect of seeing a high grade (Table 6). When given a grade, 13% of
participants (n=24) specified that high grades made them less receptive to feedback due
to only positive feedback.
The third and fourth research questions examined how the participants use or
intend to use rubrics in their own classrooms. Beyond the two common themes between
the groups, expectations and improvement of student work, the teacher candidates had
two other themes: feedback and teacher benefit (Table 6). The importance of feedback
from rubrics in their future classroom was mentioned by 17% of teacher candidates. Of
the teacher candidates, 13% also stated that continuity of grading and efficiency of
grading was a reason they would use rubrics in their future classroom. These were not
mentioned by the teachers.

43
DISCUSSION
This study was developed to help gain insight into how teachers and
teacher candidates applied feedback from rubrics to their university projects, if grades
influence university graduate students, and how they intend to use rubrics in their
classroom. Data-driven decision been taught and discussed in university classes, and a
topic of professional development in schools in the experience of the researcher.
According to the existing literature rubrics are a way to collect data to aid teachers in
being data driven (Mandinach & Jackson, 2012) and university graduate level students
appear to have a desire to use rubrics based on their experiences at the university level.
University students believed strongly about receiving feedback. This may be
encouraging to college professors, teachers in the graduate programs, and teacher
educators in graduate program. University students seemed to care more about the
feedback and the quality of the feedback than the way they receive the feedback. They
believed that rubrics were more important to help them improve the quality of their work
because they would use it as a guide to the assignment. This study approached rubrics as
a way to collect data and provided feedback, but the participants valued them more when
they were received in advanced so they knew how to approach the assignment and meet
the professors’ expectations.
University graduate students reported that seeing a grade on a grading rubric had
minimal on their receptiveness to feedback whether the grade was high or low. This was
somewhat surprising that neither a low grade (i.e. D or F) nor a high grade (i.e. A or B)
caused them to become unreceptive to feedback. Prior to the research, the researcher

44
believed that either a high grade would cause students to feel they did not need the
feedback; or a low grade would hurt the moral of the student and cause them to not want
to receive potentially negative feedback. On the contrary, most participants knew that
they had put their best effort into their projects and that they wanted feedback on their
work regardless of the grade.
In their own classrooms, teachers indicated that both students and even parents
can benefit from rubrics, but overall did not believe that college prepared them to use
rubrics in their classrooms. This is noteworthy and may be important that college
professors become aware that college students do not believe they were prepared to use
rubrics. This study did not ask how teachers were grading projects beyond rubrics, but
they reported that they believe they were not prepared by college classes to use rubrics.
Rubrics can help with data collection, standardizing of grading, and ease of grading.
Another idea that came from the research was the benefit of using rubrics to help
parents. This was not a question in the study, however, beyond benefiting students and
teachers, parents can potentially benefit. Rubrics can be used to better explain grades to
parents or how the project was graded. The rubrics can also be collected in a portfolio to
show the parents the direct improvement from assignment to assignment or across a
semester. Seeing the growth is important for the teachers and their data, for students to
show them how they are improving, and for parents to help explain student progress.
In contrast to the teachers, teacher candidates are enthusiastic and want to create
and try their own rubrics. They reported that their experiences with rubrics affected how
they will use rubrics in the classroom, but they the majority, 62%, stated that they were
not taught how to make rubrics in their college courses. Even though, the teacher

45
candidates report not being taught to use rubrics, they still want to use them. Hopefully
this means there were strong examples of rubrics use in the classroom, but colleges
should be preparing teachers to create and use grading tools such as a rubrics to help
teachers be data-driven.
Consideration of the Findings
Jonsson (2014) reported the importance of feedback through rubrics and how it
provides clarity of expectations to students. This study confirmed that this is what
university graduate students had rubrics used in their college classrooms and that above
all else they sought feedback from the rubrics about their work. Rubrics help students
determine their current level of performance and where they need to improve (Lipnevich
et al., 2013). The themes that developed in this study supported this theory because
participants strongly reported the desire to use the feedback to improve their work and
wanting feedback.
McGatha and Darcy (2010) report that students most frequently receive feedback
in the form of letter grades. Rubrics provide more information by explaining the grade
through the mastery levels and any instructor comments, however, the grade is still
typically dominant on the rubric. The participants reported that seeing the grade itself
had minimal effect on how they received feedback, but that feedback was the most
important part of the rubric. They confirmed that the grade is meaningless to
understanding the grade without some kind of feedback from the instructor.
Teacher candidates seemed more willing to use rubrics than the teachers who
have had experience in their own classrooms. Lipnevich et al. (2013) report that rubrics

46
can be an efficient way to grade, but maybe this is turning out to not be true for
experienced teachers. Brookhart and Chen (2014) purport that rubrics are a great tool to
use across grade level from elementary to university levels to grade a variety of projects.
The teachers reported that when they use grading rubrics they benefit the student and this
was more prevalent than the benefits that the teachers received from rubrics. Teacher
candidates also reported wanting to use rubrics to benefit the students. Even though they
believe college did not prepare them to use rubrics, they still see the benefits they can
bring to their K-12 students.
Limitations
There were several limitations to this study including the limitation of collecting
through an online survey, quantitative data, qualitative data, and the arrangement of the
survey. Using an online survey system has potential problems due to the risk of
technological issues. There was a potential concern that the email would not reach the
targeted participants for a variety of reasons (i.e. the participant did not utilize his/her
school email, the email went to junk mail, etc.) (Drew, Hardman, & Hosp, 2008).
Technology is imperfect and the survey could have taken too long to load for a
participant or had glitches while a participant was completing the survey.
Surveys can have a low response rate for a variety of reasons beyond the
researcher, however, the researcher took precautions like keeping the survey short,
including an incentive, checking for clarity of instruction, and limiting open-ended
questions (Drew, Hardman, & Hosp, 2008). The survey was taken without supervision or
any more than written explanation. There is no option during the survey for the

47
participant to ask questions or receive clarification, which could lead to a
misinterpretation of the survey questions (Drew, Hardman, & Hosp, 2008). There was no
way, beyond the consent form, to ensure the completeness, integrity, and honesty of the
participant response.
Quantitative responses were collected to look for direct correlations and
percentages of opinion, however, quantitative data can limit the responses of the
participants who may have a different opinion or answer. Qualitative data was used in
this study to gather opinions of the participants. Since the answers were typed into the
survey, they were typically one sentence in length. This limited the responses in
comparison to gathering the qualitative data in an interview format.
A limitation of this study was how the demographic questions were arranged in
the survey. Instead of removing them from the survey based-on whether had received
their teacher certification or would receive their certification upon completion of their
graduate program, the survey process had participants answer all demographic questions
before they were removed. Therefore my survey reported having more participants in the
survey, than actually completed the survey based on their candidacy. For example, in the
teacher survey 33% (n=99) of participants had taught for zero years. Those participants
were potentially teacher candidates who started in the wrong survey. This skewed the
demographic data of the participants. In the demographic information received, there
were participants who started the survey and then were sent the more appropriate survey.
This means there were potentially participants who took portions of each survey before
being removed; effecting the demographic data. After the demographic questions, they
were removed from the survey and directed to the correct survey.

48
Another limitation was the inclusion of certain programs. For example, the
Counseling and Assessment graduate program should have been taken out because it did
not lead to teacher certification, however, teachers may become counselors. To make
sure as many participants were reached as possible, the survey was distributed graduate
programs which included students who do not have and will not receive teacher
certification.
Limitations from this study were that it was designed as a survey without
interviewing participants individually. With interviewing the participants, more in-depth
questions could have been asked and participants could have asked for clarification as
necessary. The researcher could have asked more questions in an interview to truly
understand the thoughts and opinions of the participants. This was based on the
experience of graduate level university students from one Midwestern university.
Further Research
There is more research to be done on rubrics. Rubrics provide feedback, but more
research should be done on the kind of feedback professors and teachers are providing
and the quality of feedback that is being provided. Research should also be done on
professors other than those in teacher education programs. There should also be more
research on how much students are improving from the feedback; how great is the
improvement and are they actually improving in the areas they received feedback on for
the project. Another idea that should be further researched is how teachers, who do not
use rubrics, are grading projects and collecting data on them. It is important for teachers
to collect data and have standardized grading practices for projects that are not straight

49
forward to grade like a worksheet or a test. Research should also be done on if or how
university educator preparation programs are preparing university students to use rubrics
in their own classrooms and if university professors are modelling rubrics use in
university courses. In this study, the teachers’ use of rubrics did not match the level of
enthusiasm teacher candidates have for wanting to use rubrics in the classroom. Research
should be done on the practicality or rubrics and the preparedness of the teachers because
what looks good in theory may not be practical in the classroom.
Implications
The implications this study has for teachers and teacher candidates is the
importance of feedback. When utilizing rubrics, teachers should focus on the feedback
that the rubrics provide. This is how the participants reported that they used rubrics and
the hope is that they apply that in their classroom. College professors, of teacher
education programs, should be preparing future teachers to make and use rubrics in their
own classroom. As university graduate students, it was reported that seeing a grade has
minimal effect, but that younger school-age students may be affected by seeing grades.
Using grades can help with data collection and showing progress of students. The
research study also suggested that it is important to make sure that the feedback from
rubrics is an important part of a rubrics and emphasizing to students the importance of
receiving and applying feedback.

50
REFERENCES
Andrade, H. G. (2000). Using rubrics to promote thinking and learning. Educational
Leadership 57 (5), 13-18. Retrieved from http://www.ascd.org/
publications/educational-leadership/feb00/vol57/num05/Using-Rubrics-to
Promote-Thinking-and-Learning.aspx
Andrade, H. & Du, Y. (2005). Student perspectives on rubric-referenced assessment.
Practical Assessment, Research & Evaluation, 10(3), 1-11. Retrieved from
http://pareonline.net/pdf/v10n3.pdf
Andrade, H. L., Du, Y., & Wang, X. (2008). Putting rubrics to the test: The effect of a
model, criteria generation, and rubric-referenced self-assessment on elementary
school students’ writing. Educational Measurement: Issues and Practice, 27(13),
3-13. Retrieved from http://onlinelibrary.wiley.com.proxy.missouristate.edu/doi/
10.1111/j.17453992.2008.00118.x/abstract
Andrade, H. L., Wang, X., Du, Y., & Akawi, R. L. (2009). Rubric-referenced self-
assessment and self-efficacy for writing. Journal of Educational Research, 102(4),
287-302. Retrieved from http://search.ebscohost.com.proxy. missouristate.edu/
login.aspx?direct=true&db=a9h&AN=36419494&site=ehostlive&scope=site
Brookhart, S. M. (2013). How to create and use rubrics for formative assessment and
grading. Alexandria, VA: ASCD.
Brookhart, S. M & Chen, F. (2014). The quality and effectiveness of descriptive rubrics.
Educational Review, 67(3), 343-368. Retrieved from http://search.ebscohost.com.
proxy.missouristate.edu/login.aspx?direct=true&db=a9h&AN=102855499&site=
ehostlive&scope=site
Creswell, J. W. (2009). Research design: Qualitative, quantitative, and mixed methods
approaches. Los Angeles, CA: SAGE Publications Inc.
Drew, C. J, Hardman, M. L., & Hosp, J. L. (2008). Designing and conducting research in
education. Los Angles, CA: Sage Publications

51
Fluckiger, J. (2010). Single point rubric: a tool for responsible student self-assessment.
Delta Kappa Gamma Bulletin, 76(4), 18-25. Retrieved from http://search.
ebscohost. com.proxy.missouristate.edu/login.aspx?direct=t rue&db=a9h&AN
=524 18300&site=ehost-live&scope=site
Frankel, J. R. & Wallen, N. E. (1996). How to design and evaluate research in education
(3rd ed.). New York, NY: McGraw-Hill Inc.
Hafner, J. & Hafner, P. (2003). Quantitative analysis of the rubric as an assessment tool:
An empirical study of student peer-group rating. International Journal of Science,
25(12), 1509-1528. Retrieved from http://www.tandfonline.com.proxy.missouri
state.edu/doi/pdf/10.1080/0950069022000038268
Hatch, J. A. (2002). Doing qualitative research in education settings. Albany, NY: State
University of New York Press.
Heritage, M., & Yeagley, R. (2005). Data use and school improvement: Challenges and
prospects. In J. L. Herman & E. Haertel (Eds.) Uses and misuses of data for
educational accountability and improvement: 104th yearbook of the National
Society for the Study of Education: Part II. Malden, MA: Blackwell Publishing.
Retrieved from http://onlinelibrary.wiley.com/doi/ 10.1111/j.1744-7984.2005.
00035.x/abstract
IBM Corp. Released 2013. IBM SPSS Statistics for Windows, Version 22.0. Armonk,
NY: IBM Corp.
Jacoby, J. C., Heugh, S., Bax, C., & Brandford-White, C. (2014). Enhancing learning
through formative assessment. Innovations in Education and Teaching
International, 51(1), 72-83. Retrieved from http://search.ebscohost.com.proxy.
missouristate.edu/login.aspx? direct=true&db=a9h&AN=93877846&site=ehost-
live&scope=site
Jonsson, A. (2014). Rubrics as a way of providing transparency in assessment.
Assessment & Evaluation in Higher Education, 39(7), 840-852. Retrieved from
http://dx.doi.org/10.1080/02602938.2013.875117

52
Kortez, D. (2003). Using multiple measures to address perverse incentives and score
inflation. Educational Measurement: Issues and Practice, 22(2), 18-26. Retrieved
from http://online library.wiley.com/doi/10.1111/j.1745-3992.2003.tb00124.
x/abstract
Kwan, F. (2011). Formative assessment: The one-minute paper vs. the daily quiz. Journal
of Instructional Pedagogies, 5, 1-8. Retrieved from http://www.aabri.com/
manuscripts/1 0717.pdf
Lipnevich, A. A., McCallen, L. N., Miles, K. P., & Smith, J. K. (2013). Mind the Gap!
Students’ use of exemplars and detailed rubrics as formative assessment. Springer
Science+Business Media Dordrecht, doi:10.1007/s11251-013-9299-9
Mandinach, E. B. & Jackson, S. S. (2012). Transforming teaching and learning through
data-driven decision. Thousand Oaks, CA: Corwin.
McGatha. M. B., & Darcy, P. (2010). Rubrics at play: Reflect and discuss. Mathematics
Teaching in the Middle School, 15(6), 328-336. Retrieved from http://www.jstor.
org/stable/41183033
Nichols, S. L., & Berliner, D.C. (2007). Collateral damage: How high stakes testing
corrupts America’s schools. Cambridge, MA: Harvard Education Press.
Nordrum, L., Evans, K., & Gustafsson, M. (2013). Comparing student learning
experiences of in-text commentary and rubric-articulated feedback: strategies for
formative assessment, Assessment & Evaluation in Higher Education, 38(8),
919-940. Retrieved from: http://search.ebscohost.com.proxy.missouristate.edu/
login.aspx?direct=true&db=a9h&AN=91281567&site=ehost-live&scope=site
Petrides, L.A. (2006). Using data to improve instruction. THE Journal. 33(9), 33-37.
Retrieved from http://search.ebscohost.com.proxymissouristate.edu/login.aspx?
direct=true&db=a9h&AN=21550975&site=ehost-live&scope=site
Reddy, Y. M., & Andrade, H. (2010). A review of rubric use in higher education.
Assessment & Evaluation in Higher Education, 34(4), 435-448. Retrieved from
http://web.a.ebscohost.com/ehost/detail/detail?vid=7&sid=6da27229-2c64-449d-
9646-b272a776dffe%40sessi onmgr4005&hid=4209&bdata=JnNpdGU9ZWhvc
3QtbGl2ZSZzY29wZT1zaXRl#AN=51095602&db=a9h

53
Reeves, S., & Stanford, B. (2009). Rubrics for the classroom: assessments for students
and teachers. Delta Kappa Gamma Bulletin, 76(1), 24-27. Retried from
http://search.Ebscohost.com.proxy.missouristate.edu/login.aspx?direct= true
&db=eftAN =508099766&site=ehost-live&scope=site
Stiggins, R. (2005). From formative assessment to assessment for learning: A Path to
success on standards-based skills, Phi Delta Kappan, 85(4), 324-328. Retrieved
from http://search.ebscohost.com.proxy.missouristate.edu/login.aspx?
direct=true&db=a9h&AN=1903675 &site=ehost-live&scope=site
SurveyMonkey Inc. [Computer Software]. Palo Alto, CA. Retrieved from
www.surveymonkey.com
Weurlander, M., Soderberg, M., Scheja, M., Hult, H., & Wernerson, A. (2012). Exploring
formative assessment as a tool for learning: Students’ experiences of different
methods of formative assessment. Assessment & Evaluation in Higher Education,
37(6), 747-760. Retrieved from http://search.ebscohost.com.proxy.missouristate.
edu/login.aspx?direct =true&db=a9h&AN=79379255&site=ehost-
live&scope=site
Wolf, K., & Stevens, E. (2007). The role of rubrics in advancing and assessing student
learning. The Journal of Effective Teaching, 7(1), 3-14. Retrieved from
http://www.uncw.edu/cte/et/articles/vol7_1/wolf.pdf

54
APPENDICIES
Appendix A. Letter of Consent
Dear Participant,
Thank you for considering this survey. You have been selected because you are a teacher or
teacher candidate at the graduate level in the College of Education or the College of Health and
Human Services. Your feedback will be used for the thesis “Rubrics: Effectiveness of Feedback.”
This study has been approved by Missouri State’s Internal Review Board (IRB #) and under the
supervision of Dr. Karen Engler. In this survey, you will be asked to reflect upon your personal
experiences with rubrics in your collegiate classrooms and how you have, or intend, to use rubrics
in the classroom. Please answer the questions honestly. There is no anticipation of risk from
taking this survey except for taking fifteen minutes of your time. Participation is voluntary and
you may withdraw from participation at any time without penalty. This survey is anonymous. No
one, including the researcher will, will be able to relate your responses back to you. To maintain
the anonymity of this survey please refrain from naming any fellow students, faculty, coworkers,
or yourself in your responses. All data from this survey is anonymous and will kept online in a
password protected SurveyMonkey account. If you would like to receive the results of this study
after its completion, or have any questions about this survey please contact my thesis supervisor
Dr. Karen Engler at [email protected]. By clicking ENTER SURVEY you are
confirming that you have read the explanation of the study and voluntarily agree to participate.
Sincerely,
Sadie Winterscheid
Graduate Student
CSD-Education of the Deaf or Hard of Hearing
College of Health and Human Services

55
Appendix B. Survey for Teachers
This survey is for those who have taught in their own classroom. If you have not taught
in your own classroom, please return to the email and select the Teacher Candidate
Survey.
1. What is your age?
Dropdown menu age 18 and up
2. What is your gender? (dropdown option)
Male
Female
3. Did you become teacher certified upon completion of your undergraduate degree?
Yes
No
4. What graduate degree are you seeking? (dropdown)
Childhood Education and Family Studies
Counseling, Leadership and Special Education
Reading, Foundations and Technology
Secondary Education
o Agriculture Education
o Art Education
o Biology Education
o Business Education
o Chemistry Education
o Earth Science Education
o English Education
o Family and Consumer Sciences Education
o Geography Education
o History Education
o Mathematics Education
o Natural Science Education
o Physical Education
o Physics Education
o Social Science Education
o Speech and Theatre Education
5. Pick all grades that your certification covers (all that applies).
K-1st-2nd-3rd-4th-5th-6th-7th-8th-9th-10th-11th-12th grade
6. How many years have you taught? (dropdown)

56
Numbers 0-20+
Please answer the following questions by reflecting on your experiences with grading
rubrics at the university level.
7. Were grading rubrics used in your college experiences?
Yes
No, advance to question 16 (have program skip)
8. How often were grading rubrics used to provide feedback on your grades,
performance, or projects in your college courses?
Very frequently--often--once in a while--never
9. Do you feel grading rubrics provided clarity of instructor feedback?
Yes
No
10. Do you feel that receiving a grade and a grading rubric with no written comments
was a successful method of providing feedback?
Yes
No
11. If you received a rubric without a grade, did you believe that you can accurately
determine your current level of performance?
Yes
No
12. What is the first thing you reviewed when receiving a graded rubric?
Instructors comments
Grade
My mastery level within the rubric
I do not care about the rubric
13. When you received a rubric with no letter grade (example A, B, C, D, or F) on it,
how receptive were you to the instructor’s feedback?
Very receptive—receptive—not receptive---very unreceptive
14. When you received a high grade (example “A”) how receptive were you to the
instructor’s feedback?
Very receptive—receptive—not receptive---very unreceptive
15. When you received a low grade (example “D”) how receptive were you to the
instructor’s feedback?
Very receptive—receptive—not receptive---very unreceptive
Please answer the following questions by reflecting on your experience with using rubrics
in your own classroom.
16. Have you used grading rubrics in your classroom?
Yes

57
No- (skip to question 23)
17. Did you feel your previous experience, with grading rubrics at the university,
affect your use of rubrics in your classroom?
Yes
no
18. The reason (s) you used grading rubrics in your own classroom was were: (Select
all that apply)
Because I was taught to use rubrics
To benefit the students by giving them the rubrics as a guide
The ease and efficiency of grading
My school is data-driven and I use rubrics to help collect data
I do not use rubrics
19. How did you design your grading rubrics (i.e. online rubrics, rubrics included in a
curriculum, etc.)?
I create my own rubrics only
I use pre-made rubrics only
I use both my own rubrics and pre-made rubrics
20. Did you provide grading rubrics to students in advanced as a guide to the
assignment?
Yes
No
21. Did you believe your students perform better on assignments when they are
provided a grading rubric in advanced?
Yes
No
22. Do you feel putting a letter grade on your students’ rubric affects how they feel
about the feedback you provided?
Yes
No
Please answer the following questions by reflecting on your experiences with grading
rubrics at the university level.
23. What benefits have you received from being evaluated using a grading rubric?
24. What have you changed regarding the quality of your work from using a grading
rubric?
25. In what ways, if any, did seeing a grade affect your receptiveness to feedback?
(Example: If you see a low grade, do you read all of your feedback and reflect on
it OR do you not want to read your feedback due to the low score?)
If you have taught in your own classroom, please answer questions 26 and 27
26. What benefits do students receive from grading rubrics?
27. How do you think your personal experience with grading rubrics has affected
your use of grading rubrics in your classroom?

58
28. In what way, if any, do you think seeing a letter grade on a rubric affects how
your student receives feedback? (Example: If a student receives a “D,” do you
think they read and understand the feedback?)

59
Appendix C. Survey for Teacher Candidates
This survey is for those who received their teaching certification at the graduate level and
have not taught in their own classroom. If you have taught in your own classroom, please
return to the email and select the Teacher Survey.
1. What is your age?
Dropdown menu age 18 and up
2. What is your gender? (dropdown)
a. Male
b. Female
3. What graduate degree are you seeking? (dropdown)
a. Childhood Education and Family Studies
b. Counseling, Leadership and Special Education
c. Reading, Foundations and Technology
d. Secondary Education
o Agriculture Education
o Art Education
o Biology Education
o Business Education
o Chemistry Education
o Earth Science Education
o English Education
o Family and Consumer Sciences Education
o Geography Education
o History Education
o Mathematics Education
o Natural Science Education
o Physical Education
o Physics Education
o Social Science Education
o Speech and Theatre Education
e. Education of the Deaf and Hard of Hearing
Please answer the following questions by reflecting on your experience with grading
rubrics at the university level.
4. Were grading rubrics used in your college experiences?

60
a. Yes
b. No, advance to question 10
5. How often were grading rubrics used to provide feedback on your grades,
performance, or projects in your college courses?
a. Very frequently--often--once in a while--never
6. Do you feel grading rubrics provided clarity of instructor feedback?
a. Yes
b. No
7. Did you feel that receiving a grade and a rubric with no written comments was a
successful method of providing feedback?
a. Yes
b. No
8. If you receive a rubric without a grade, did you believe that you could accurately
determine your current level of performance?
a. Yes
b. No
9. What is the first thing you reviewed when receiving a grading rubric?
a. Instructors comments
b. Grade
c. My mastery level within the rubric
d. I do not look at it
10. When you received a rubric with no grade on it, how receptive were you to the
instructor’s feedback?
a. Very receptive—receptive—not receptive---very unreceptive
11. When you received a high grade (example “A”) how receptive were you to the
instructor’s feedback?
a. Very receptive—receptive—not receptive---very unreceptive
12. When you received a low grade (example “D”) how receptive were you to the
instructor’s feedback?
a. Very receptive—receptive—not receptive---very unreceptive
Please answer the following questions by thinking about how you will use rubrics in your
future classroom.
13. Do you intend to use grading rubrics in your future classroom?
a. Yes
b. No - (skip to 18)
14. The reason (s) you would use grading rubrics is/are:
a. Because I was taught to use rubrics
b. To benefit the students by giving them the rubrics as a guide
c. The ease and efficiency of grading
d. Being data driven
e. I do not intend use rubrics

61
15. Do you think your experiences with grading rubrics affected how you will use
rubrics in the classroom?
a. Yes
b. No
16. Have you been taught how to make grading rubrics in your college courses?
a. Yes
b. No
17. How do you intend to design your rubrics (i.e. online rubrics, rubrics included in a
curriculum, etc.)?
a. I intend to create my own rubrics only
b. I intend to use pre-made rubrics only
c. I intend to use both my own grading rubrics and pre-made grading rubrics
Please answer the following questions by reflecting on your experiences with grading
rubrics at the university level.
18. What benefits have you received from being evaluated using a grading rubric?
19. What have you changed regarding the quality of your work from using a grading
rubric?
20. In what ways, if any, did seeing a grade affect your receptiveness to feedback?
(Example: If you see a low grade, do you read all of your feedback and reflect on
it?)
Please answer the following questions by thinking about how you will use rubrics in your
future classroom.
21. How have your personal experiences with grading rubrics affected how you will
use rubrics in the classroom?