Rubio's Restaurants, Inc. 2007 Annual...
72
Rubio's Restaurants, Inc. 2007 Annual Report
-
Upload
truongtruc -
Category
Documents
-
view
215 -
download
0
Transcript of Rubio's Restaurants, Inc. 2007 Annual...

Rubio's Restaurants, Inc. 2007 Annual Report


Dear Stockholders, 2007 was a strong year for Rubio’s, marked by the following accomplishments:
• Revenue increased 11.5% from $152.3 million to $169.7 million; • Comparable store sales grew by 6.2% (the highest since 1999); • Rubio’s returned to profitability; • The dining experience improved for our guests; and • Our management team strengthened, inside and outside of our restaurants.
We believe our success was the direct result of the shift in strategy we introduced in late 2006, the hard work of the Rubio’s team, and a vibrant economy for most of the year. During the year we continued to focus on our targeted guests:
Adults 25 to 49 years old – average age 36 with a slight skew toward males – who crave unsurpassed flavorful foods, have limited time for a meal or snack (10 to 30 minutes), and expect to spend $6 to $10 for a meal.
Our research during the year confirmed that our core user is more likely to have above-average income, be college-educated, have a professional job, and eat weekday lunch at Rubio’s. About half of our targeted guests have children living at home, they take care of themselves, and they care about the communities in which they live. We remain steadfast in our belief that Rubio’s can win with better taste than the other major quick-serve restaurants, can beat casual dining restaurants with lower prices and comparable or better food, and can offer a broader variety of high-quality products – especially seafood – than other fast casual Mexican restaurants. The key elements of our strategy are to:
• Win with great-tasting unique products. We introduced a number of limited time taco, burrito and salad products featuring grilled salmon, crispy shrimp, grilled fajitas and Langostino lobster. Over time, our goal is to have great-tasting unique products in each of our product categories that are comparable to our World Famous Fish Taco. We intend to add some of our most successful limited time offers to our regular menu.
• Win in the fast-growing and competitive off-premise space. We introduced our Rubio’s a-Go-Go program to accommodate large orders for catering, workplace meal options and home meal replacement. Rubio’s a-Go-Go uses best-in-class packaging which enables us to deliver high-quality food for off-premise consumption. In late 2007, we tested online ordering for our Rubio’s a-Go-Go menu and rolled it out to the entire Rubio’s system in early 2008. Our target is to grow our off-premise business to over $100,000 per store over the next several years.

• Win in our communities. We expanded our local store marketing capabilities and tactics. Our restaurant managers and neighborhood marketing coordinators have aggressively established themselves as business leaders and partners within their communities. Our restaurant managers have pursued fundraiser sales, Rubio’s a-Go-Go sales and off-site event sales while our neighborhood marketing coordinators have secured community sponsorships and sampling opportunities – all cost-effective ways of reaching our target consumers.
• Win by building market share. We opened 10 new company-owned restaurants and 1 franchised restaurant in 2007. In the first 4 months of 2008, we opened 6 new restaurants. With the weak economy, we are being very selective for new sites and avoiding those areas affected most significantly by sub-prime issues.
We strengthened our organization to successfully execute our growth strategy with two key hires in December 2007. We recruited Marc Simon as our Senior Vice President of Operations. Marc brings extensive business and operations background to the Company as well as a strong record of achieving local store marketing results. We also recruited Ken Hull as Senior Vice President of Development. Ken possesses an impressive record of success over the course of his career. In his short tenure with the Company, he has implemented foresight, analysis, and fiscal discipline to the real estate and construction processes. We continued to automate our processes with scalable systems so that we can grow without adding senior executives at the corporate level. With the senior team we now have in place, we believe we can effectively manage a company twice our size. As such, based on our growth plan over the next 3 to 5 years, our G&A expense as a percentage of sales should drop considerably. In the latter part of the fourth quarter, we experienced a sharp down-turn in transactions. We now clearly recognize that the country was moving into a weak economy, and we have taken steps to address the situation. Our research has shown that even our higher income guests are feeling pinched with higher gas prices, food costs and mortgage payments. Therefore, we have added special meals at attractive prices that offer our guests great value. We want to be sensitive to the financial pressures our guests are experiencing, especially in those communities where there are major sub-prime problems. However, we will also continue to introduce great tasting unique products that are difficult for competitors to replicate. While our stock price has suffered along with almost all the restaurant industry, we continue to believe our strategy is right. Although we would prefer a stronger economy, our goal in 2008 is to protect share, if not gain share, and position the company to take rapid advantage of better times. Ralph Rubio Dan Pittard Chairman President and Chief Executive Officer

Forward Looking Statements Statements made in our annual report to shareholders include forward-looking statements within the meaning of Section 27A of the Securities Act of 1933, as amended, and Section 21E of the Securities Exchange Act of 1934, as amended. All statements, other than statements of historical fact, are statements that could be deemed forward-looking statements, including, but not limited to, statements regarding our future financial position, business strategy and plans and objectives of management for future operations. Forward-looking statements involve known and unknown risks, uncertainties and other factors that may cause our actual results, performance or achievements to be materially different from any future results, performance or achievements expressed or implied by the forward-looking statements. Factors that could cause or contribute to such differences include, but are not limited to, those discussed in Item 1A. “Risk Factors” of our accompanying Annual Report on Form 10-K and those discussed in other documents we subsequently file with the Securities and Exchange Commission. In light of these risks, uncertainties and assumptions, readers are cautioned not to place undue reliance on such forward-looking statements. These forward-looking statements represent beliefs and assumptions only as of the date of this report. Except as required by applicable law, we do not intend to update or revise forward-looking statements contained in this report to reflect future events or circumstances.

[This page intentionally left blank.]

UNITED STATES
SECURITIES AND EXCHANGE COMMISSIONWASHINGTON, D.C. 20549
FORM 10-K
ANNUAL REPORT PURSUANT TO SECTION 13 OR 15(d) OF THE SECURITIESEXCHANGE ACT OF 1934
FOR THE FISCAL YEAR ENDED DECEMBER 30, 2007COMMISSION FILE NUMBER: 000-26125
RUBIO’S RESTAURANTS, INC. (Exact Name of Registrant as Specified in Its Charter)
1902 WRIGHT PLACE, SUITE 300, CARLSBAD, CALIFORNIA 92008 (Address of Principal Executive Offices)
(760) 929-8226 (Registrant’s Telephone Number, Including Area Code)
Securities registered pursuant to Section 12(b) of the Act:
Securities registered pursuant to Section 12(g) of the Act: None
Indicate by check mark if the registrant is a well-known seasoned issuer, as defined in Rule 405 of the Securities Act. Yes No
Indicate by check mark if the registrant is not required to file reports pursuant to Section 13 or Section 15(d) of the Exchange Act. Yes No
Indicate by check mark whether the registrant: (1) has filed all reports required to be filed by Section 13 or 15(d) of the Securities Exchange Act of 1934 during the preceding 12 months (or for such shorter period that the registrant was required to file such reports), and (2) has been subject to such filing requirements for the past 90 days. Yes No
Indicate by check mark if disclosure of delinquent filers pursuant to Item 405 of Regulation S-K is not contained herein, and will not be contained, to the best of the registrant’s knowledge, in definitive proxy or information statements incorporated by reference in Part III of this Form 10-K or any amendment to this Form 10-K.
Indicate by check mark whether the registrant is a large accelerated filer, an accelerated filer or a non-accelerated filer, as defined in Rule 12b-2 of the Act.
Indicate by check mark whether the registrant is a shell company (as defined in Rule 12b-2 of the Act). Yes No
The aggregate market value of the voting stock held by non-affiliates of the registrant based upon the closing sale price of the registrant’s common stock on June 29, 2007 as reported on the NASDAQ Global Market was approximately $74.6 million. This amount excludes 2,519,228 shares of the registrant’s common stock held by the executive officers, directors and each person who beneficially owned 10% or more of the registrant’s outstanding common stock. Exclusion of such shares should not be construed to indicate that any such person possesses the power, direct or indirect, to direct or cause the direction of the management or policies of the registrant or that such person is controlled by or under common control with the registrant.
As of March 25, 2008, there were 9,950,477 shares of the registrant’s common stock, par value $0.001 per share, outstanding.
DOCUMENTS INCORPORATED BY REFERENCE
Portions of our definitive proxy statement for the 2008 annual meeting of stockholders are incorporated by reference into PART III of this annual report on Form 10-K. Our 2008 annual meeting of stockholders is scheduled to be held on July 24, 2008. We intend to file our definitive proxy statement with the Securities and Exchange Commission not later than 120 days after the conclusion of our fiscal year ended December 30, 2007.
DELAWARE 33-0100303
(State or Other Jurisdiction of Incorporation or Organization) (I.R.S. Employer Identification Number)
Title of Each Class Name of Each Exchange on Which Registered
Common Stock, par value $0.001 per share The NASDAQ Global Market
Large accelerated filer Accelerated filer
Non-accelerated filer Smaller reporting company


RUBIO’S RESTAURANTS, INC.
TABLE OF CONTENTS
Page PART I Item 1. Business 4Item 1A. Risk Factors 12Item 1B. Unresolved Staff Comments 18Item 2. Properties 18Item 3. Legal Proceedings 18Item 4. Submission of Matters to a Vote of Security Holders 18 PART II Item 5. Market for Registrant’s Common Equity, Related Stockholder Matters and Issuer Purchases of Equity Securities 19Item 6. Selected Consolidated Financial Data 21Item 7. Management’s Discussion and Analysis of Financial Condition and Results of Operations 22Item 7A. Quantitative and Qualitative Disclosures About Market Risk 29Item 8. Consolidated Financial Statements and Supplementary Data 29Item 9. Changes in and Disagreements With Accountants on Accounting and Financial Disclosure 29Item 9A. Controls and Procedures 29Item 9B. Other Information 30 PART III Item 10. Directors and Executive Officers and Corporate Governance 30Item 11. Executive Compensation 30Item 12. Security Ownership of Certain Beneficial Owners and Management and Related Stockholder Matters 30Item 13. Certain Relationships and Related Transactions, and Director Independence 30Item 14. Principal Accountant Fees and Services 30 PART IV Item 15. Exhibits and Consolidated Financial Statement Schedules 31 Signatures 33
Index to Consolidated Financial Statements F-1
- 3 -
FORWARD-LOOKING STATEMENTS
This report includes statements of our expectations, intentions, plans and beliefs that constitute “forward-looking statements” within the meaning of
Section 27A of the Securities Act of 1933 and Section 21E of the Securities Exchange Act of 1934 and are intended to come within the safe harbor
protection provided by those sections. These forward-looking statements are principally contained in the section captioned “Business” under Item 1 below
and the section captioned “Management’s Discussion and Analysis of Financial Condition and Results of Operations” under Item 7 below. In some cases,
you can identify forward-looking statements by terms such as may, will, should, expect, plan, intend, forecast, anticipate, believe, estimate, predict,
potential, continue or the negative of these terms or other comparable terminology. These forward-looking statements involve a number of risks and
uncertainties, including but not limited to, those factors discussed under “Risk Factors” under Item 1A below and those discussed in other documents we
file with the Securities and Exchange Commission. As a result of these risks and uncertainties, our actual results or performance may differ materially
from any future results or performance expressed or implied by the forward-looking statements. These forward-looking statements represent beliefs and
assumptions only as of the date of this annual report. Except as required by applicable law, we undertake no obligation to release publicly the results of
any revisions or updates to these forward-looking statements to reflect events or circumstances arising after the date of this annual report.
PART I.
Item 1. BUSINESS
As of March 25, 2008, we owned and operated 174 fast-casual Mexican restaurants, three licensed locations, and two franchised restaurants that offer
high-quality, fresh and distinctive Mexican cuisine, at attractive prices; including chargrilled chicken, steak and fresh seafood items such as burritos, tacos
and quesadillas inspired by the Baja, California region of Mexico. We were incorporated in California in 1985 and re-incorporated in Delaware in October
1997. We have two wholly owned subsidiaries, Rubio’s Restaurants of Nevada, Inc., which was incorporated in Nevada in 1997, and Rubio’s Promotions,
Inc., which was incorporated in Arizona in 2007. Our restaurants are located in California, Arizona, Nevada, Colorado and Utah. As of March 25, 2008,
we had approximately 3,400 employees.
RUBIO’S FRESH MEXICAN GRILL® CONCEPT
The Rubio’s Fresh Mexican Grill® concept evolved from the original “Rubio’s, Home of the Fish Taco®” concept, which our co-founder Ralph
Rubio first developed following his college spring break trips to the Baja peninsula of Mexico in the mid-1970s. Ralph and his father, Raphael, opened the
first Rubio’s® restaurant 25 years ago in the Mission Bay area of San Diego, California and introduced fish tacos to America. Building on the initial
success of the concept, we expanded our menu and upgraded our restaurant layout over the years to appeal to a broader customer base, including a concept
name change to Rubio’s Baja Grill® in 1997 to reflect these improvements. In 2002, Rubio’s further evolved, completing a transformation from Rubio’s
original fish taco concept to Rubio’s Fresh Mexican Grill. The Rubio’s concept now features grilled chicken, steak and seafood items as well as our
original, Baja-style World Famous Fish TacosSM. In 2005, we began a multi-year re-imaging program for our existing restaurants so that our interiors and
exteriors display distinctive designs that match our high-quality, fresh food. In 2007, we rolled out Rubio’s A-Go-Go, which features major enhancements
in our to-go, delivery and catering program that include improved packaging, product offerings, order processing and order fulfillment that we believe will
make our program more convenient and attractive for our guests. Since the end of fiscal 2002 through March 2008, the number of company-owned
restaurants has increased from 135 to 174. We believe Rubio’s Fresh Mexican Grill is well positioned as an innovator in the fast-casual Mexican cuisine
segment. The critical elements of our market positioning are as follows:
• FRESHLY PREPARED HIGH-QUALITY FOOD WITH BOLD, DISTINCTIVE TASTES AND FLAVORS. We differentiate ourselves from
competitive restaurants by offering high-quality, flavorful, and made-to-order products using Baja-inspired recipes at attractive prices. Our
menu strategy is predicated on developing unique, distinctive and flavorful products that generate strong guest loyalty. Rubio’s excels with
seafood, and our signature items include our World Famous Fish Tacos, Baja Grill® Burritos with chargrilled chicken or steak and our
authentic Street Tacos. Rubio’s also offers a number of burritos, tacos and quesadillas prepared in a variety of ways featuring grilled, marinated
chicken, steak, pork, shrimp and mahi mahi. In addition, we serve freshly prepared salads and bowls. Our menu also includes HealthMex®
offerings that are lower in fat and calories, and Kid’s Meals designed especially for children. Our guacamole, chips, beans and rice are prepared
fresh daily in our restaurants. Guests may enhance and customize their meals at our complimentary salsa bar that features a variety of freshly
prepared salsas. Our menu is served at lunch and dinner, as well as breakfast in a limited number of our restaurants.
- 4 -

OUR BUSINESS STRATEGIES
Our business objective is to become a leading fast-casual Mexican restaurant brand. To achieve this objective, we are pursuing the following
strategies:
• CASUAL, FUN DINING EXPERIENCE. Our restaurants are designed to create a fun and casual ambiance by capturing the relaxed,
comfortable and colorful atmosphere inspired by the Baja, California region of Mexico. Our design elements include colorful Mexican tiles,
saltwater aquariums with tropical fish, Baja beach photos and tropical prints, surfboards on the walls and authentic palm-thatched patio
umbrellas, or palapas, in most locations. We believe our restaurants have broad appeal to a wide range of guests.
• EXCELLENT DINING VALUE. Our restaurants offer high-quality food typically associated with sit-down, casual dining restaurants, but
generally at prices substantially lower than those found at casual dining restaurants. In addition to attractive prices, we offer the convenience
and service platform of a traditional fast-casual or quick-service format. We provide guests a clean and comfortable environment in which to
enjoy their meals on site. We also offer guests the convenience of take-out service for both individual meals and large party orders. We believe
the strong value we deliver to our guests is critical to generating guest satisfaction, repeat business, and continued loyalty.
• CREATE A DISTINCTIVE CONCEPT AND BRAND. Our restaurants provide guests with a fun and casual dining experience that we believe
helps to promote frequent visits and strong guest loyalty. Our key initiatives are designed to deliver a great guest experience, enhance the
performance of our existing restaurants, and strengthen our brand identity. These initiatives include developing proprietary menu offerings with
bold, intense flavors, upgrading the ambiance of our restaurants, and delivering best-in-class service standards. We strive to promote awareness
and generate trial through regional and local media campaigns and neighborhood brand-building efforts.
• ACHIEVE FAVORABLE RESTAURANT-LEVEL ECONOMICS. We believe we are able to achieve favorable operating results in our core
markets due to the appeal of our concept, careful site selection, cost-effective development, consistent application of our management and
training programs, and a focus on continuously improving our economic model. We utilize centralized and local restaurant information and
accounting systems, which allow our management to monitor and control labor, food and other direct operating expenses on a real-time basis
and provide them with timely access to financial and operating data. We believe we achieve a lower-than-average product cost compared with
our competitors, due to our lower cost and high product mix seafood items versus a less diverse menu made up of higher cost items such as
chicken and steak. As we expand and optimize our menu, we continue to focus on creating highly desirable, high-margin items. We also
believe that our culture and emphasis on training leads to lower employee turnover rates, and higher productivity, compared with industry
averages.
• FOCUS ON BUILDING SALES AT EXISTING RESTAURANTS. We regularly conduct and evaluate marketing research to analyze our
markets, customer base, product mix and competition in order to remain relevant in the eyes of our consumers. Rubio’s marketing mix includes
a combination of regional radio, in-store merchandising, public relations, neighborhood marketing, e-marketing and print media tactics. We
periodically implement new products and promotions to increase traffic in our restaurants.
• ENSURE A HIGH-QUALITY GUEST EXPERIENCE. We strive to provide a consistent, high-quality guest experience in order to generate
frequent visits and customer loyalty. We focus on creating a fun, team-like culture for our restaurant employees which we believe fosters a
friendly and inviting atmosphere for our guests. Through extensive training, experienced restaurant-level management, and rigorous operational
controls, we seek to ensure prompt, friendly and efficient service for our guests. We utilize an interactive voice response, or IVR, and Web-
based guest feedback program to continually monitor our performance against guest expectations. We also seek out and respond to direct
comments and questions from guests who utilize our toll-free guest comment line and “contact us” page on our Web-site.
- 5 -

UNIT ECONOMICS
For purposes of analyzing our store operating results, and to eliminate the effects of start-up, training, and other costs associated with new store
openings, we measure comparable store results on only those units that have been open for at least 15 months. During fiscal 2007, we had 153 units that
were open for over 15 months. These units generated average sales of $1,037,000 per unit, average operating income of $123,000, or 11.9% of sales, and
average operating cash flows of $173,000, or 16.7% of sales. Comparable store sales increased 6.2% in fiscal 2007 following an increase of 2.0% in fiscal
2006 and an increase of 1.2% in fiscal 2005.
These results are not necessarily indicative of our future results or the results we may obtain in other units currently open, or those we may open in the
future.
EXISTING LOCATIONS
The following table sets forth information about our existing restaurants as of March 25, 2008. We own and operate 174 restaurants. We also have two
franchised locations in Las Vegas, Nevada and have licensed our concept to other restaurant operators for three non-traditional locations in the San Diego
and Los Angeles areas of California at Petco Park Stadium in San Diego, the San Diego International Airport food court and the Honda Center in
Anaheim. The majority of our restaurants are in high-traffic retail centers and are not stand-alone units.
We currently lease all of our restaurant locations with the exception of one owned building. We plan to continue to lease substantially all of our future
restaurant locations in order to minimize the cash investment associated with each unit.
Historically, our restaurants have ranged from 1,800 to 3,300 square feet, excluding our smaller, food court locations. We expect the size of our future
sites to range from 2,000 to 2,800 square feet. We intend to continue to develop restaurants that will require, on average, a total cash investment of
approximately $575,000 to $625,000, excluding estimated pre-opening expenses of approximately $50,000 to $60,000 per unit, which includes
approximately $20,000 to $30,000 of non-cash rent expense during the build-out period.
• EXECUTE FOCUSED REGIONAL EXPANSION STRATEGY. We believe that our restaurant concept has significant opportunities for
expansion in both our existing and neighboring markets. An expansion strategy focused primarily on company-owned unit growth will allow us
to grow our brand and maintain the quality of food and service expected by our customers. We generally target high-traffic, high-visibility end-
cap locations in urban and suburban markets with medium to high family income levels. Our three- to five-year expansion plan begins with an
annual unit growth rate of approximately 10% in 2008 and increases to 20% by 2011. We currently plan to open 18 to 22 company-owned
restaurants in fiscal 2008 in our existing geographic markets. The current slow down in housing, combined with general economic climate, has
caused us to focus almost exclusively on sites located in mature trade areas. This narrower focus could limit our growth potential in 2008 and
2009. In addition, we will be required to secure a credit facility or line of credit in 2008 to support our planned restaurant growth. We cannot
assure you that we can secure a credit facility or line of credit on acceptable terms, or at all.
Company-Owned and Operated Locations Opened
Los Angeles Area 72
San Diego Area 44
Phoenix/Tucson Area 29
Denver Area 3
San Francisco Area 11
Sacramento Area 9
Las Vegas Area 4
Salt Lake City Area 2
Total Company-Owned Locations 174
Franchise and Licensed Locations
Los Angeles Area 1
San Diego Area 2
Las Vegas Area 2
Total Franchised and Licensed Locations 5
- 6 -
EXPANSION AND SITE SELECTION
Our expansion strategy targets major metropolitan areas that have attractive demographic characteristics. Once a metropolitan area is selected, we
identify viable trade areas that have high-traffic patterns, strong demographics, such as medium to high family incomes, high education levels and high
density of both daytime employment and residential developments, limited competition and strong retail and entertainment developments. Within a
desirable trade area, we select sites that provide specific levels of visibility, accessibility, parking, co-tenancy and exposure to a large number of potential
guests.
We believe that the quality of our site selection criteria is critical to our continuing success. Therefore, our senior management team is actively
involved in the selection of new sites and markets, personally visiting all new markets and all sites prior to final approval. Each new market and site must
be approved by our Real Estate Site Approval Committee, which consists of members of senior management. This process allows us to analyze each
potential location, taking into account its effect on all aspects of our business, such as marketing, personnel, food service and supply chain dynamics.
Our three- to five-year expansion plan begins with an annual unit growth rate of approximately 10% in 2008, and increases to 20% by 2011. We
currently plan to open 18 to 22 company-owned restaurants in fiscal 2008 in our existing geographic markets. The current slow down in housing,
combined with the general economic climate, has caused us to focus almost exclusively on sites located in mature trade areas. This narrower focus could
limit our growth potential in 2008 and 2009. In addition, we will be required to secure a credit facility or line of credit in 2008 to support our planned
restaurant growth. We cannot assure you that we can secure a credit facility or line of credit on acceptable terms, or at all.
In connection with our strategy to expand into selected markets, we have and will continue to consider franchising our restaurant concept. We
currently have a limited franchising program. As of March 25, 2008, we have one signed franchise development agreement. This agreement represents a
commitment to open five restaurants in five years. The franchisee under this agreement opened its first restaurant in April 2006 and its second restaurant in
August 2007. We are currently evaluating our options with respect to the franchising program, and the management and financial resources that will be
required to build the operational infrastructure needed to support the franchising of our restaurants.
MENU
Our made-to-order menu - including our signature World Famous Fish Tacos - features burritos, soft-shell tacos, enchiladas, quesadillas, nachos and
salads. All our products are made with high-quality ingredients including marinated, chargrilled chicken breast and carne asada steak as well as seafood,
representative of the Baja, California region of Mexico, such as chargrilled mahi mahi, sautéed shrimp and Alaskan Pollock. The menu features most of
Rubio’s favorite tacos bundled as meal combinations, where two tacos are served on plates with beans and chips. The goal of our menu is to maintain our
heritage of offering distinctive fish and seafood items, while also including offerings of chicken, pork and beef items. Side items including our guacamole,
chips, beans and rice and are all made fresh daily in our restaurants. Each of our restaurants also provide self-serve salsa bars where guests may choose
from four different salsas made fresh every day in every restaurant. Our prices - targeted at the consumer who wants to spend $6.00 to $10.00 for a meal -
range from about $1.49 for our snack-size Street Tacos to $6.99 for Grilled Shrimp Quesadillas. Most of our restaurants, other than those located in
Nevada, also offer a selection of imported Mexican and domestic beers.
Our HealthMex menu items, designed to have less than 30% calories from fat and offered in most of our restaurants, include tacos, burritos served on
whole-wheat tortillas, and salads, all made with chargrilled chicken or mahi mahi.
Our Kid’s Meals combine a choice of chicken taquitos, chicken bites, a World Famous Fish Taco, a cheese quesadilla or a bean and cheese burrito,
along with a side dish of beans, rice or chips, and a small drink, churro and a toy surprise.
From time to time, we introduce limited-time-only products and promotions to provide added variety and encourage guest frequency. These products
and promotions include, but are not limited to, Langostino lobster tacos and burritos, grilled Chilean salmon tacos, burritos and salads, and crispy shrimp
tacos and burritos.
DECOR AND ATMOSPHERE
We believe that the decor and atmosphere of our restaurants are critical factors in our guests’ overall dining experience. In 2005, we began a multi-
year re-image program for our existing restaurants so that our interiors and exteriors display distinctive designs that match our high-quality, fresh food.
During 2007, we re-imaged six of our restaurants, which completed our re-imaging program. The Company re-imaged 27 restaurants in 2005 and 75
restaurants in 2006.
- 7 -

MARKETING
Our marketing mix includes a combination of regional radio advertising, in-store merchandising, public relations, neighborhood marketing, e-
marketing and print media tactics. We use radio advertising as a marketing tool to increase brand awareness, attract new guests, and encourage existing
guests to visit more frequently. Our advertising is designed to increase sales and transactions by conveying our brand positioning and creating awareness of
new or limited-time products or promotions.
Local store marketing, public relations, and e-marketing are used to increase community awareness and generate traffic on a local level. A variety of
programs are available for our restaurant general managers to target various business-building opportunities within the local community and trade area
surrounding each restaurant. We believe word-of-mouth advertising is also a key component in attracting and retaining guests.
As part of our expansion strategy, we select markets that we believe will support multiple units and the efficient use of advertising. We sometimes
utilize local public relations initiatives to help establish brand awareness for new restaurants as we build toward media efficiency. We expect our
marketing expenditures to increase as we add new restaurants and focus on building awareness to drive new guests to our units and increase repeat visits
by existing customers.
OPERATIONS
UNIT MANAGEMENT AND EMPLOYEES
We currently have approximately 3,400 employees. Our typical restaurant employs one general manager, one to two assistant managers and 18 to 25
hourly employees, approximately 40% of which are full-time employees and approximately 60% of which are part-time employees. The general manager
is responsible for the day-to-day operations of the restaurant, including food quality, service, staffing and product ordering. We seek to train and develop
from within, or hire experienced general managers and staff and to motivate and retain them by providing opportunities for increased responsibilities and
advancement, as well as performance-based cash incentives. These performance incentives are tied to sales and profitability. All hourly employees in our
restaurants are eligible for self-funded health benefits 60 days after they are hired. All full-time restaurant management employees are eligible for health
benefits the first day of the month following their hire date. Full-time corporate employees are eligible for health benefits on their hire date. Employees
over 21 years of age who have worked for us for more than one year are eligible to participate in our 401(k) plan. Because the members of our executive
leadership team are typically not eligible to participate in our 401(k) plan, the Company adopted a non-qualified, unfunded retirement savings plan
effective December 1, 2007.
We currently employ 2 district general managers and 18 district managers, each of whom reports to 1 of 3 regional directors. These three regional
directors in turn report to a Senior Vice President of Operations. These district managers oversee restaurant management in all phases of operation, as well
as assist in opening new restaurants. These district managers are eligible to participate in our cash bonus plan, and the three regional directors are eligible
to participate in our cash bonus and stock incentive plans.
TRAINING
We strive to maintain quality and consistency in each of our restaurants through the careful training and supervision of personnel and the
establishment of, and adherence to, high standards of personnel performance, food and beverage preparation, guest service, and maintenance of facilities.
We have implemented a training program that is designed to teach new managers the technical and supervisory skills necessary to direct the operations of
our restaurants in a professional and profitable manner. Each manager must successfully complete a five-week training course, which includes hands-on
experience in both the kitchen and dining areas of our restaurants. They are also required to study our operations manuals and to view videotapes relating
to food and beverage handling (particularly food safety and sanitation), preparation and service. In addition, we maintain a continuing education program
to provide our restaurant managers with ongoing training and support. We strive to maintain a team-oriented atmosphere and attempt to instill enthusiasm
and dedication in our employees. We regularly solicit employee suggestions concerning how we can improve our operations in order to be responsive to
both them and our guests.
- 8 -

QUALITY CONTROLS
Our emphasis on superior guest service is complemented by our quality control programs. We utilize an interactive voice response, or IVR, and Web-
based guest feedback program to continually monitor our performance against guest expectations. We also seek out and respond to direct comments and
questions from guests who utilize our toll-free guest comment line and the “contact us” page on our Web-site. District managers are directly responsible
for ensuring that guest comments are addressed appropriately to achieve a high level of guest satisfaction. Our director of quality assurance and food safety
is responsible for ensuring product consistency, quality and safety among our restaurants.
HOURS OF OPERATION
Our restaurants are generally open Sunday through Thursday from 10:30 a.m. until 10:00 p.m., and on Friday and Saturday from 10:30 a.m. to 11:00
p.m.
MANAGEMENT INFORMATION SYSTEMS
All of our restaurants use computerized point-of-sale systems, which are designed to improve operating efficiency, provide corporate management
timely access to financial and marketing data and reduce restaurant and corporate administrative time and expense. These systems record each order and
display the food requests on monitors in the kitchen for the cooks to prepare. The data captured for use by operations and corporate management includes
gross and net sales amounts, cash and credit card receipts and quantities of each menu item sold. Sales and receipt information is transmitted to the
corporate office daily, where it is reviewed and reconciled by the accounting department before being recorded in the accounting system. The daily sales
information is transmitted nightly to the corporate office and distributed to management via an intranet Web page each morning. A Windows-based back
office system is used in all restaurants to manage food cost, labor cost and sales reporting. On a weekly basis, a report of actual food cost compared with
ideal food cost is also generated.
Our corporate systems provide management with operating reports that show restaurant performance comparisons with budget and prior-year results
both for the current accounting period and year-to-date, as well as trend formats by both dollars and percentage of sales. These systems allow us to closely
monitor restaurant sales, cost of sales, labor expense and other restaurant trends on a daily, weekly and monthly basis. We believe these systems enable
both restaurant and corporate management to supervise the operational and financial performance of our restaurants on a real-time basis, and will
accommodate future expansion.
PURCHASING
We strive to obtain consistent high-quality ingredients at competitive prices from reliable sources. To attain operating efficiencies and to provide fresh
ingredients for our food products while obtaining the lowest possible ingredient prices for the required quality, employees at the corporate office control
the purchase of food items from a variety of international, national, regional and local suppliers at negotiated prices. Most food, produce and other products
are shipped from a central distributor directly to the restaurants two to three times per week. We do not maintain a central food product warehouse or
commissary. We do, however, maintain some products in third party warehouses for certain seafood items. Except for our contract with our central
distributor, our contract with Coca-Cola North America FoodService, and several contracts ranging from 6 to 12 months for seafood, chicken and some
beef, we do not have any long-term contracts with our food suppliers. In the past, we have not experienced significant delays in receiving our food and
beverage inventories, restaurant supplies or equipment.
COMPETITION
The restaurant industry is intensely competitive. There are many different segments within the restaurant industry that are distinguished by types of
service, food types and price/value relationships. We position our restaurants in the high-quality, fresh and distinctive, fast-casual Mexican cuisine segment
of the industry. In this segment, our direct competitors include, among others, Baja Fresh, La Salsa, Chipotle and Qdoba. We also compete indirectly with
full-service Mexican restaurants including Chevy’s, On The Border and El Torito as well as fast food restaurants, particularly those focused on Mexican
cuisine, such as El Pollo Loco, Taco Bell and Del Taco. Competition in the fast-casual Mexican cuisine segment is based primarily upon food quality,
taste, service, location, restaurant ambiance and price. Although we believe we compete favorably with respect to each of these factors, many of our direct
and indirect competitors are well-established national, regional or local chains and have substantially greater financial, marketing, personnel and other
resources. We also compete with many other retail establishments for site locations.
- 9 -
TRADEMARKS AND SERVICE MARKS
We have maintained registrations for two trademarks and nine service marks including, but not limited to, “Rubio’s,” “Rubio’s Baja Grill, Home of
the Fish Taco,” “Home of the Fish Taco,” “HealthMex,” “Fish (Pesky) Caricature,” “Baja Grill,” “Best of Baja,” “Rubio’s Crispy Shrimp,” “Rubio’s
Street Tacos,” “Rubio’s Fresh Mexican Grill” and “Beach Mex” with the United States Patents and Trademark Office. In addition, we have filed
“Wrapsaladas,” “Cerveza Time,” “Rubio’s Street Burritos,” “Rubio’s Fish Taco Tuesdays,” “Rubio’s a-Go-Go,” “Tacos a-Go-Go,” “Burritos a-Go-Go,”
“Beach Mex Buffet,” “Baja Box,” “Fiesta Kit,” “Grilled Gourmet Tacos” and “World Famous Fish Tacos.” We believe that our trademarks, service marks
and other proprietary rights have significant value and are important to the marketing of our restaurant concept.
SEASONALITY
Our business is subject to seasonal fluctuations. Historically, sales in most of our restaurants have been higher during the second and third quarters of
each fiscal year, during the warmer spring and summer months, particularly because most of our restaurants offer patio seating. As a result, our highest
earnings generally occur in the second and third quarters of each fiscal year.
GOVERNMENT REGULATION
Our restaurants are subject to licensing and regulation by state and local health, sanitation, safety, fire and other authorities, including licensing and
permit requirements for the sale of alcoholic beverages and food. To date we have not experienced an inability to obtain or maintain any necessary
licenses, permits or approvals. In addition, the development and construction of additional restaurants are also subject to compliance with applicable
zoning, land use and environmental regulations.
SEC FILINGS; INTERNET ADDRESS
Our Internet address is www.rubios.com. We file our Annual Reports on Form 10-K, Quarterly Reports on Form 10-Q, Current Reports on Form 8-K
and amendments to those reports with the SEC and make such filings available, free of charge, on www.rubios.com, as soon as reasonably practicable after
we electronically file such material with, or furnish it to, the SEC. The information found on our website shall not be deemed incorporated by reference by
any general statement incorporating by reference this report into any filing under the Securities Act of 1933 or under the Securities Exchange Act of 1934,
except to the extent we specifically incorporate the information found on our website by reference, and shall not otherwise be deemed filed under such
Acts.
Our filings are also available through the SEC website, www.sec.gov, and at the SEC Public Reference Room at 100 F Street, NE Washington DC
20549. For more information about the SEC Public Reference Room, you can call the SEC at 1-800-SEC-0330.
MANAGEMENT
OUR EXECUTIVE OFFICERS
As of March 25, 2008, our executive officers are as follows:
Name Age Position with the Company
Dan Pittard 58 President and Chief Executive Officer
Frank Henigman 45 Senior Vice President and Chief Financial Officer
Lawrence Rusinko 47 Senior Vice President of Marketing
Marc Simon 55 Senior Vice President of Operations
Gerry Leneweaver 61 Senior Vice President of People Services
Ken Hull 52 Senior Vice President of Development
- 10 -
DAN PITTARD has been President and Chief Executive Officer and a member of our Board of Directors since August 2006. Mr. Pittard’s diverse
background brings unique qualifications for leadership at Rubio’s. He has served in key executive positions at companies including McKinsey &
Company, PepsiCo, Inc. and Amoco Corp. (now part of BP p.l.c.). Mr. Pittard served a wide range of clients as a partner at McKinsey & Company from
1980 to 1992, including consumer companies for whom he helped develop profitable growth strategies and build new organizational capabilities. During
his tenure at PepsiCo, Inc. from 1992 to 1995, he held several senior executive positions including Senior Vice President, Operations for PepsiCo Foods
International, and Senior Vice President and General Manager, New Ventures for Frito-Lay. In this latter position, he worked with Taco Bell Corp. to
create retail products and introduce them into supermarkets. At Amoco Corp. from 1995 to 1998, he served as Group Vice President. As Group Vice
President, he had responsibility for several businesses with over $8 billion in revenues, including Amoco Corp.’s retail business that had 8,000 locations.
During his tenure, he entered into a strategic alliance with McDonald’s Corporation to build joint locations. From 1998 to 1999, Mr. Pittard served as
Senior Vice President, Strategy and Business Development for Gateway, Inc. In 1999, Mr. Pittard formed Pittard Investments LLC, and in 2004, he formed
Pittard Partners LLC. Through these entities, Mr. Pittard has invested in and consulted for private companies. He served on the Board of Novatel Wireless,
a publicly traded company, from 2002 to 2004. Mr. Pittard graduated from the Georgia Institute of Technology with a Bachelor of Science degree in
Industrial Management and received an MBA from the Harvard Graduate School of Business Administration.
FRANK HENIGMAN has been Chief Financial Officer since June 2007, and Senior Vice President and Chief Financial Officer since November
2007. Prior to joining Rubio’s in 2006, Mr. Henigman served as Director of Accounting and Risk Control for Sumitomo Corporation of America/Pacific
Summit Energy LLC located in Newport Beach, California from January 2005 to April 2006. Prior to Sumitomo, Mr. Henigman served as Director of
Finance at Shell Trading Gas & Power Co. from 1998 to 2004. Mr. Henigman holds a Bachelor of Science, Business Administration and Marketing degree
from California State University, Northridge and an MBA, Finance, from University of Southern California. Mr. Henigman has earned the designation of a
Certified Management Accountant, a globally recognized certification for managerial accounting and finance professionals.
LAWRENCE RUSINKO has been Vice President of Marketing since October 2005, and Senior Vice President of Marketing since November 2007.
Prior to joining Rubio’s in 2005, Mr. Rusinko served as Senior Vice President of Marketing at Friendly’s, a family dining and ice cream concept, from July
2003 until May 2005. Prior to that, Mr. Rusinko served for over 8 years at Panera Bread as Director of Marketing from May 1995 until March 1997 and as
Vice President of Marketing from April 1997 until July 2003, and spent 6 ½ years in various marketing positions of progressive responsibility at Taco
Bell. Mr. Rusinko holds a Bachelor of Science degree in Industrial Engineering from Northwestern University and an MBA from the J.L. Kellogg
Graduate School of Management at Northwestern University.
MARC SIMON joined Rubio’s on November 28, 2007 as Senior Vice President of Operations and brings an extensive business and operations
background to the Company. Most recently, he served as Chief Executive Officer for America’s Incredible Pizza Company in Tulsa, Oklahoma from
October 2006 to August 2007. From 1994 to 1998, Mr. Simon worked for McDonald’s Corporation as Vice President for Corporate Development. He led
the team that brought Chipotle Mexican Grill into McDonald’s and later served as Regional Director for Chipotle from 1998 to 2006. Mr. Simon has a
master’s degree in Fine Arts and a master’s degree in Library and Informational Science from Case Western Reserve University and a Bachelor of Arts
degree from Ohio University.
GERRY LENEWEAVER has been Vice President of People Services since June 2005, and Senior Vice President of People Services since November
2007. Prior to joining Rubio’s, Mr. Leneweaver led his own human resources consulting firm, AGL Associates, in Boston, from February 2004 to May
2005. Prior to that, Mr. Leneweaver served as Senior Vice President of Human Resources at American Hospitality Concepts, Inc. (The Ground Round,
Inc.) from May 1999 to February 2004. He has also been in senior management roles at TGI Friday’s, Inc., The Limited, Inc., Atari, Inc., and PepsiCo,
Inc. (Pizza Hut and Frito-Lay). He holds a Bachelor of Science degree in Industrial Relations from LaSalle University in Philadelphia.
KEN HULL joined Rubio’s on December 3, 2007 as Senior Vice President of Development. Most recently, Mr. Hull was Vice President of
Development and Franchising for Frisch’s Restaurants, Inc. in Cincinnati, Ohio from 1999 to 2007. Frisch’s is an operator of Big Boy and Golden Corral
restaurants. Prior to joining Frisch’s in 1999, Mr. Hull served as Director of International Development and Director of International Real Estate for
McDonald’s Corporation. Earlier in his career, Mr. Hull worked for Hardee’s and KFC in Real Estate management positions. Mr. Hull has a Bachelor of
Science degree in Landscape Architecture and Urban Planning from Iowa State University.
- 11 -

Item 1A. RISK FACTORS
Any investment in our common stock involves a high degree of risk. You should consider carefully the following information about these risks,
together with the other information contained in this annual report, before you decide to buy our common stock. The risks and uncertainties described
below are not the only ones we face. Additional risks and uncertainties not presently known to us or that we currently deem immaterial may also impair
our operations. If any of the following risks actually occur, our business would likely suffer and our results could differ materially from those expressed in
any forward-looking statements contained in this annual report including those contained in the section captioned “Business” under Item 1 above and the
section captioned “Management’s Discussion and Analysis of Financial Condition and Results of Operations” under Item 7 below. In such case, the
trading price of our common stock could decline, and you may lose all or part of the money you paid to buy our common stock
WE MAY NOT ACHIEVE OUR EXPECTED REVENUES, COMPARABLE STORE SALES AND OVERALL EARNINGS PER SHARE DUE TO
VARIOUS RISKS THAT AFFECT THE FOOD SERVICE INDUSTRY.
We and other companies in the restaurant industry face a variety of risks that may impact our business and results of operations. Our expected sales
levels and earnings rely heavily on the acceptability and quality of the products we serve. If any variances are experienced with respect to the recognition
of our brand, the acceptance of our promotions in the market, the effectiveness of our advertising campaigns or the ability to manage our ongoing
operations, including the ability to absorb unexpected costs, we could fall short of our revenue and earnings expectations. Factors that could have a
significant impact on earnings include:
One of the most important financial measures to investors in restaurant businesses such as ours is comparable store sales. Investors use this measure
to track our historic performance as well as to compare our trend results against other restaurant businesses. We expect our comparable store sales (which
include company-operated restaurants only and represent the change in period-over-period sales for restaurants that have had at least 15 full months of
operations) in fiscal 2008 to be adversely impacted by weaker consumer spending and the effect of comparing our sales to our record sales in fiscal 2007.
If our comparable store sales are lower than expected by investors or are otherwise disappointing, our stock price may be adversely affected.
IF WE ARE NOT ABLE TO SUCCESSFULLY PURSUE OUR EXPANSION STRATEGY, OUR BUSINESS AND RESULTS OF OPERATIONS
MAY BE ADVERSELY IMPACTED.
Our three to five year expansion plan begins with an annual unit growth rate of approximately 10% in 2008, and increases to 20% by 2011. We
currently plan to open 18 to 22 company-owned restaurants in fiscal 2008 in our existing geographic markets. The current slow down in housing,
combined with the general economic climate, has caused us to focus almost exclusively on sites located in mature trade areas. This narrower focus could
limit our growth potential in 2008 and 2009. In addition, we will be required to secure a credit facility or line of credit in 2008 to support our planned
restaurant growth plan. We cannot assure you that we can secure a credit facility or line of credit on acceptable terms, or at all. If we do not obtain a credit
facility or line of credit, our growth will be significantly limited in 2008. In addition, the terms of any credit facility may impose restrictions on the
operation of our business.
• general economic conditions in our geographic markets, including the economic downturn that commenced during the end of fiscal 2007;
• labor costs for our hourly and management personnel, including increases in federal or state minimum wage requirements;
• the cost, availability and quality of foods and beverages, particularly chicken, beef, fish, cheese and produce;
• costs related to our leases;
• impact of weather and national disasters on revenues and costs of food;
• impact of increased fuel and energy costs;
• timing of new restaurant openings and related expenses;
• the cost of store closings;
• the amount of sales contributed by new and existing restaurants;
• our ability to achieve and sustain profitability on a quarterly or annual basis;
• the ability of our marketing initiatives and operating improvement initiatives to increase sales;
• negative publicity relating to food quality, illness, obesity, injury or other health concerns related to certain foods;
• changes in consumer preferences, traffic patterns and demographics;
• the type, number and location of existing or new competitors in the fast-casual restaurant industry; and
• insurance and utility costs.
- 12 -

In addition, the success of our expansion strategy will depend on a variety of factors, many of which are beyond our control. These factors include,
among others:
If we are not able to successfully address these factors, we may not be able to expand at the rate contemplated and may have to adjust our expansion
strategy, and our business and results of operations may be adversely impacted.
WE MAY NOT PREVAIL IN OUR CURRENT LITIGATION MATTERS.
From time to time, we have been involved in litigation matters related to the operation of our restaurants. As discussed in Item 3, Legal Proceedings
below, we are involved in two litigation matters arising out of California employment law. The Company has and intends to continue to vigorously defend
itself in each of these actions. The outstanding claims or issues in these actions are in the early litigation stages, and we cannot assure you of the eventual
outcome. In addition to these actions, we may also be subject to other employee-related claims or claims by our customers from time to time. Regardless of
merit or eventual outcome, these matters may cause a diversion of our management's time and attention, significant damage awards and the expenditure of
legal fees and expenses. In addition, claims asserted against us may result in adverse publicity. An unfavorable outcome in one or more of these matters or
any future actions brought against the Company could have a material impact on our financial position and results of operations.
WE ARE VULNERABLE TO CHANGES IN CONSUMER PREFERENCES AND ECONOMIC AND OTHER CONDITIONS THAT COULD HARM
OUR BUSINESS, FINANCIAL CONDITION, AND RESULTS OF OPERATIONS AND CASH FLOWS.
Our business, like other restaurant businesses, is affected by changes in consumer tastes, national, regional and local economic conditions,
demographic trends, consumer confidence in the economy and discretionary spending priorities. Factors such as traffic patterns, weather conditions, local
demographics and the type, number and location of competing restaurants may adversely affect the performance of individual locations. In addition,
inflation and increased food and energy costs may harm the restaurant industry in general and our locations in particular. Adverse changes in any of these
factors could reduce consumer traffic or impose practical limits on pricing, which could harm our business, financial condition, results of operations and
cash flows. We cannot assure you that consumers will continue to regard our products favorably or that we will be able to develop new products that
appeal to consumer preferences. Any failure to satisfy consumer preferences could have a materially adverse affect on our business. Our continued success
will depend in part on our ability to anticipate, identify and respond to changing consumer preferences and economic conditions.
OUR BUSINESS MAY BE ADVERSELY AFFECTED BY FOOD-BORNE ILLNESS INCIDENTS, NEGATIVE PUBLICITY OR CLAIMS FROM
OUR GUESTS.
We cannot guarantee that our internal controls and training at our restaurants will be fully effective in preventing all food-borne illnesses.
Furthermore, our reliance on third party suppliers, distributors and warehouse providers makes it difficult to monitor food safety compliance and increases
the risk that food-borne illness would affect multiple locations rather than a single restaurant. Third party food suppliers, distributors and warehouse
providers outside of our control could cause some food-borne illness incidents. New illnesses resistant to our current precautions may develop in the
future, or diseases with long incubation periods could arise, that could give rise to claims or allegations on a retroactive basis. One or more instances of
food-borne illness in one of our restaurants could negatively affect our restaurant sales if highly publicized. This risk exists even if it were later determined
that the illness was wrongly attributed to one of our restaurants. A number of other restaurant chains have experienced incidents related to food borne
illnesses that have had a material adverse impact on their operations, and we cannot assure you that we can avoid a similar impact upon the occurrence of a
similar incident at our restaurants. In addition, we may be subject to liability claims from guests alleging food-related illness, injuries suffered on our
premises or other food quality, health or operational concerns. Adverse publicity resulting from such allegations may materially affect us and our
restaurants, regardless of whether such allegations are true or whether we are ultimately held liable.
• our ability to operate our restaurants profitably;
• our ability to respond effectively to the intense competition in the restaurant industry generally, and in the fast-casual restaurant industry
segment;
• our ability to locate suitable high-quality restaurant sites or negotiate acceptable lease terms;
• our ability to obtain required local, state and federal governmental approvals and permits related to construction of the sites, and the sale
of food and alcoholic beverages;
• our dependence on contractors to construct new restaurants in a timely manner;
• our ability to attract, train and retain qualified and experienced restaurant personnel and management; and
• our ability to control the construction and other costs associated with opening new restaurants.
- 13 -

WE DEPEND UPON A LIMITED NUMBER OF THIRD PARTY SUPPLIERS, DISTRIBUTORS AND WAREHOUSE PROVIDERS.
Our ability to maintain consistent quality menu items depends in part upon our ability to acquire fresh food products and related items, including
essential ingredients used in the Mexican restaurant business from reliable sources in accordance with our specifications. Shortages or interruptions in the
supply of fresh food products caused by unanticipated demand, problems in production or distribution, contamination of food products, an outbreak of
food-borne diseases, inclement weather or other conditions could materially adversely affect the availability, quality and cost of ingredients, which could
adversely affect our business, financial condition, results of operations and cash flows. We have contracts with a limited number of suppliers, distributors
and warehouse providers for our food, beverages and other supplies for our restaurants. If any of our suppliers, distributors or warehouse providers do not
perform adequately or if any one or more of such entities seeks to terminate its agreement or fails to perform as anticipated, or if there is any disruption in
any of our supply relationships or distribution operations for any reason, it could have a material adverse effect on our business, financial condition, results
of operations and cash flows. Our inability to replace our distribution operations and our suppliers in a short period of time on acceptable terms could
increase our costs and could cause shortages at our restaurants of food and other items that may cause our restaurants to remove certain items from a
restaurant’s menu or temporarily close a restaurant. If we temporarily close a restaurant or remove popular items from a restaurant’s menu, that restaurant
may experience a significant reduction in revenue during the time affected by the shortage.
IF WE ARE NOT ABLE TO ANTICIPATE AND REACT TO INCREASES IN OUR FOOD AND LABOR COSTS, OUR PROFITABILITY COULD
BE ADVERSELY AFFECTED.
Our restaurant operating costs principally consist of food and labor costs. Our profitability is dependent on our ability to anticipate and react to
changes in these costs. Various factors beyond our control, including increased food and energy costs, adverse weather conditions, short supply and natural
disasters may affect our food costs. Changes in government regulations could also affect both our food costs and labor costs. We may be unable to
anticipate and react to changing costs, whether through our purchasing practices, menu composition or menu price adjustments in the future. In the event
that cost increases cause us to increase our menu prices, we face the risk that our guests will choose to patronize lower-priced restaurants. Failure to react
in a timely manner to changing food and labor costs, or to retain guests if we are forced to raise menu prices, could have a material adverse effect on our
business and results of operations.
OUR RESTAURANTS ARE CONCENTRATED IN THE WESTERN REGION OF THE UNITED STATES, AND THEREFORE, OUR BUSINESS IS
SUBJECT TO FLUCTUATIONS IF ADVERSE CONDITIONS OCCUR IN THAT REGION.
As of March 25, 2008, all but five of our existing restaurants are located in the western region of the United States. Accordingly, we are susceptible to
fluctuations in our business caused by adverse economic or other conditions in this region, including natural disasters, terrorist activities or similar events.
Our significant investment in, and long-term commitment to, each of our restaurants limits our ability to respond quickly or effectively to changes in local
competitive conditions or other changes that could affect our operations. In addition, some of our competitors have many more units than we do.
Consequently, adverse economic or other conditions in a region, a decline in the profitability of several existing restaurants or the introduction of several
unsuccessful new restaurants in a geographic area, could have a more significant effect on our results of operations than would be the case for a company
with a larger number of restaurants or with more geographically dispersed restaurants.
LABOR AND EMPLOYMENT LAWS AND REGULATIONS, PARTICULARLY STATE MINIMUM WAGE LAWS, MAY IMPACT OUR
BUSINESS.
A substantial number of our employees are subject to various federal and state minimum wage requirements. Many of our employees work in
restaurants located in California and receive salaries equal to or slightly greater than the California minimum wage. California’s current hourly minimum
wage is $8.00. Any increase in the hourly minimum wage in California or other states or jurisdictions where we do business may increase the cost of labor
and reduce our profitability. Additionally, various federal and state laws govern the relationship with our employees and affect our operating costs. In
addition to minimum wage laws discussed above, these laws include:
- 14 -
Significant additional governmental imposed increase in any of these areas could materially affect our business, financial condition and operating
results.
THE RESTAURANT INDUSTRY IS INTENSELY COMPETITIVE AND WE MAY NOT HAVE THE RESOURCES TO COMPETE ADEQUATELY.
The restaurant industry is intensely competitive. There are many different segments within the restaurant industry that are distinguished by types of
service, food types and price/value relationships. We position our restaurants in the high-quality, fresh and distinctive, fast casual Mexican restaurant
segment of the industry. In this segment, our direct competitors include, among others, Baja Fresh, La Salsa, Chipotle and Qdoba. We also compete
indirectly with full-service Mexican restaurants including Chevy’s, On The Border, Chi Chi’s and El Torito and fast food restaurants, particularly those
focused on Mexican food such as El Pollo Loco, Taco Bell and Del Taco. Competition in our industry segment is based primarily upon food quality, price,
restaurant ambiance, service and location. Many of our direct and indirect competitors are well-established national, regional or local chains and have
substantially greater financial, marketing, personnel and other resources than we do. We also compete with many other retail establishments for site
locations. If we are unable to compete effectively in our industry segment, our business and operations will be adversely affected.
OUR FAILURE OR INABILITY TO ENFORCE OUR CURRENT AND FUTURE TRADEMARKS AND TRADE NAMES COULD ADVERSELY
AFFECT OUR EFFORTS TO ESTABLISH BRAND EQUITY.
Our ability to successfully expand our concept will depend on our ability to establish and maintain "brand equity" through the use of our current and
future trademarks, service marks, trade dress and other proprietary intellectual property, including our name and logos. We currently hold two registered
trademarks and have nine service marks relating to our brand and we have filed applications for 12 additional marks. Some or all of the rights in our
intellectual property may not be enforceable, even if registered against any prior users of similar intellectual property or our competitors who seek to
utilize similar intellectual property in areas where we operate or intend to conduct operations. If we fail to enforce any of our intellectual property rights,
we may be unable to capitalize on our efforts to establish brand equity. It is also possible that we will encounter claims from prior users of similar
intellectual property in areas where we operate or intend to conduct operations, which could result in additional expenditures and divert management’s
time and attention from our operations.
WE MAY NOT BE SUCCESSFUL IN IMPLEMENTING AND EXECUTING A FRANCHISE PROGRAM.
In connection with our strategy to expand into selected markets, we have and will continue to consider franchising our restaurant concept. We
currently have a limited franchising program. We started a franchise program by entering into agreements with three franchisee groups between 2001 and
2002. In April 2003, our relationship with one of the franchisee groups was terminated when the group defaulted on its franchise agreement and closed its
franchised location. We re-opened this unit as a company-owned restaurant in May 2003, but subsequently closed it in December 2005. In September
2003, we agreed to acquire a franchisee’s location and then in December 2006 acquired their other restaurant and development territory. In addition, in
June 2006, we acquired all four restaurants owned by the third original franchise group. Currently we have one franchisee that has a five-year, five-unit
development agreement for which they opened their first restaurant in 2006 and their second restaurant in August 2007. Restaurant companies typically
rely on franchise revenues as a significant source of revenues and potential for growth. The opening and success of our franchised restaurants depend on a
number of factors, including availability of suitable sites, our ability to obtain acceptable lease or purchase terms for new locations, permitting and
government regulatory compliance and our ability to meet construction schedules. The franchisees may not have all of the business abilities or access to
financial resources necessary to open our restaurants or to successfully develop or operate our restaurants in their franchise areas in a manner consistent
with our standards. Our inability to successfully execute a franchising program could adversely affect our business and results of operations.
• overtime;
• paid leaves of absence;
• mandatory employee health insurance;
• tax reporting;
• unemployment tax rates;
• workers’ compensation rates; and
• citizenship requirements.
- 15 -

WE MAY BE LOCKED INTO LONG-TERM AND NON-CANCELABLE LEASES AND MAY BE UNABLE TO RENEW LEASES AT THE END OF
THEIR TERMS.
Many of our current leases are non-cancelable and typically have an initial term of 10 years and one or more renewal terms of three or more years that
we may exercise at our option. Leases that we enter into in the future likely will also be long-term and non-cancelable and have similar renewal options. If
we close a restaurant, we may remain committed to perform our obligations under the applicable lease, which would include, among other things, payment
of the base rent for the balance of the lease term. Alternatively, at the end of the lease term and any renewal period for a restaurant, we may be unable to
renew the lease without substantial additional cost, if at all. We may close or relocate the restaurant, which could subject us to construction and other costs
and risks, and could have a material adverse effect on our business. Additionally, the revenue and profit, if any, generated at a relocated restaurant, may not
equal the revenue and profit generated at the existing restaurant.
IF THE AMOUNTS THAT WE HAVE ACCRUED IN CONNECTION WITH THE CLOSURE OF SELECTED STORES ARE INADEQUATE OR WE
CLOSE MORE STORES THAN ANTICIPATED, WE MAY EXPERIENCE ADVERSE EFFECTS ON OUR EARNINGS EXPECTATIONS.
Our accruals for expenses related to store closures are estimates. Estimates are inherently uncertain, and actual results may deviate, perhaps
substantially, from our estimates as a result of the many risks and uncertainties affecting our business, including, but not limited to, those set forth in these
risk factors. The amounts we have recorded for store closures are based on our current assessments of the conditions of these locations. The market for,
and physical condition of, these locations may change in the future and materially affect our future earnings. We review these accruals on a quarterly basis
and may make adjustments that have a material positive or negative impact on our future earnings.
OUR OPERATING RESULTS MAY FLUCTUATE SIGNIFICANTLY DUE TO SEASONALITY AND OTHER FACTORS, WHICH COULD HAVE
A NEGATIVE EFFECT ON THE PRICE OF OUR COMMON STOCK.
Our business is subject to seasonal fluctuations. Historically, sales in most of our restaurants have been higher during the second and third quarters of
each fiscal year. As a result, we generally find our highest earnings occur in the second and third quarters of each fiscal year. Accordingly, results for any
one quarter or for any year are not necessarily indicative of results to be expected for any other quarter or for any other year and should not be relied upon
as the sole measure of our future performance. Comparable unit sales for any particular future period may increase or decrease versus our previous
performance.
THE ABILITY TO ATTRACT AND RETAIN HIGHLY QUALIFIED PERSONNEL TO OPERATE, MANAGE AND SUPPORT OUR
RESTAURANTS IS EXTREMELY IMPORTANT AND OUR FAILURE TO DO SO COULD ADVERSELY AFFECT US.
Our success and the success of our individual restaurants depend upon our ability to attract and retain highly motivated, well-qualified restaurant
operators and management personnel, as well as a sufficient number of qualified employees, including guest service and kitchen staff, to keep pace with
our expansion schedule. Qualified individuals needed to fill these positions are in short supply in some geographic areas. Our ability to recruit and retain
such individuals may delay the planned openings of new restaurants or result in higher employee turnover in existing restaurants, which could have a
material adverse effect on our business or results of operations. We also face significant competition in the recruitment of qualified employees. In addition,
we are heavily dependent upon the services of our officers and key management involved in restaurant operations, marketing, product development,
finance, purchasing, real estate development, information technologies, human resources and administration. The loss of any of these individuals could
have a material adverse effect on our business and results of operations. We generally do not have long-term employment contracts with key personnel.
VARIOUS GOVERNMENT REGULATIONS MAY IMPACT OUR BUSINESS.
The restaurant industry is subject to licensing and regulation by state and local health, sanitation, safety, fire and other authorities, including licensing
requirements and regulations related to the preparation and sale of food and the sale of alcoholic beverages, as well as laws governing our relationships
with employees. See “Labor and Employment Laws and Regulations, Particularly State Minimum Wage Laws May Impact our Business” above. The
inability to obtain or maintain such licenses or to comply with applicable regulations could adversely affect our results of operations. We are also subject to
federal regulation and certain state laws, governing the offer and sale of franchises. Many state franchise laws impose substantive requirements on
franchise agreements, including limitations on non-competition provisions and on provisions concerning the termination or non-renewal of a franchise.
The failure to obtain or retain licenses or approvals to sell franchises could adversely affect us and our franchisees. Changes in, and the cost of compliance
with, government regulations could also have a material adverse effect on our operations.
- 16 -

WE ARE REQUIRED TO EVALUATE OUR INTERNAL CONTROLS UNDER SECTION 404 OF THE SARBANES-OXLEY ACT OF 2002 AND
ANY ADVERSE RESULTS FROM SUCH EVALUATION COULD RESULT IN A LOSS OF INVESTOR CONFIDENCE IN OUR FINANCIAL
REPORTS AND HAVE AN ADVERSE EFFECT ON OUR STOCK PRICE.
Pursuant to Section 404 of the Sarbanes-Oxley Act of 2002, beginning with this annual report on Form 10-K , we will be required to furnish a report
by our management on our internal control over financial reporting. Such report must contain, among other matters, an assessment of the effectiveness of
our internal control over financial reporting and audited consolidated financial statements as of the end of our fiscal year. This assessment must include
disclosure of any material weaknesses in our internal control over financial reporting identified by management. This annual report on Form 10-K does not
require an attestation from the Company’s audit firm. Each year we must perform the system and process documentation and evaluation needed to comply
with Section 404, which is both costly and challenging. During this process, if our management identifies one or more material weaknesses in our internal
control over financial reporting, we will be unable to assert such internal control is effective. If we are unable to assert that our internal control over
financial reporting is effective (or if our auditors are unable to attest that our management’s report is fairly stated or they are unable to express an
unqualified opinion on the effectiveness of our internal controls), investors could lose confidence in the accuracy and completeness of our financial reports,
which could have an adverse effect on our stock price.
Furthermore, our independent registered public accounting firm may be required to attest to whether our assessment of the effectiveness of our internal
control over financial reporting is fairly stated in all material respects, and separately report on whether it believes we maintained effective internal control
over financial reporting. We have in the past discovered, and may in the future discover, areas of internal controls that need improvement. We may be
required to obtain auditor attestation as early as the annual report on Form 10-K for our fiscal year ending December 28, 2008.
OUR CURRENT INSURANCE MAY NOT PROVIDE ADEQUATE LEVELS OF COVERAGE AGAINST LOSSES, CLAIMS OR THE EFFECTS OF
ADVERSE PUBLICITY.
We may incur certain losses that are uninsurable or that we believe are not economically insurable, such as losses due to earthquakes, floods and other
natural disasters. In view of the location of many of our existing and planned restaurants, our operations are particularly susceptible to damage and
disruption caused by earthquakes. Further, although we maintain insurance coverage for employee-related litigation, the deductible per incident is high and
because of the high cost, we carry only limited insurance for the effects of such claims. In addition, punitive damage awards are generally not covered by
insurance. In addition, our insurance does not provide coverage for the type of claims asserted in the two employee actions discussed in Item 3. Legal
Proceedings, below. Any insurance we maintain may not be sufficient to provide coverage against any asserted claims. We also may be unable to maintain
our insurance or obtain insurance in the future on acceptable terms, or at all.
WE MAY INCUR SIGNIFICANT REAL ESTATE RELATED COSTS AND LIABILITIES THAT COULD ADVERSELY AFFECT OUR FINANCIAL
CONDITION.
The majority of our restaurants are leased locations in multi-unit retail centers. The age and condition of the real estate we occupy varies. Some of our
locations may require significant repairs due to normal deterioration or due to sudden and unanticipated incidents, such as plumbing failures. It is difficult
to predict how many of our restaurant locations will require major repairs or refurbishment and it is also difficult to predict what portion of these potential
costs would be covered by insurance. Also, as a lessee of real estate, we are subject to and have received claims that our operations at these locations may
have caused property damage or personal injury to others. The fact that the majority of our restaurants are located in multi-unit retail buildings means that
if there is a plumbing failure or other event in one of our restaurants, neighboring tenants may be affected, which can subject us to liability for property
damage and personal injuries. If we were to incur increased real estate costs and liabilities, it could adversely affect our financial condition and results of
operations.
- 17 -

SALES BY OUR EXISTING STOCKHOLDERS OF A LARGE NUMBER OF SHARES OF OUR COMMON STOCK COULD CAUSE OUR STOCK
PRICE TO DECLINE.
The Company has a limited number of institutional stockholders, each of whom holds more than 5% of the Company’s outstanding stock. The market
price of our common stock could decline as a result of sales by one of these stockholders of a large number of shares of our common stock in the market or
the perception that such sales could occur. These sales also might make it more difficult for us to sell equity securities in the future at a time and at a price
that we deem appropriate.
THE INTERESTS OF OUR CONTROLLING STOCKHOLDERS MAY CONFLICT WITH YOUR INTERESTS.
As of March 25, 2008, our executive officers, directors and entities affiliated with them, in the aggregate, beneficially own approximately 28.7% of
our outstanding common stock. These stockholders may be able to influence the outcome of matters requiring stockholder approval, including the election
of directors and approval of significant corporate transactions. This concentration of ownership may also have the effect of delaying or preventing a change
in control of our Company and could also depress our stock price.
Item 1B. UNRESOLVED STAFF COMMENTS
None.
Item 2. PROPERTIES
Our corporate headquarters, consisting of approximately 16,500 square feet, are located in Carlsbad, California. The principal executive offices of our
two wholly owned subsidiaries, Rubio’s Restaurants of Nevada, Inc. and Rubio’s Promotions, Inc. are also located in Carlsbad, California. We occupy our
headquarters under a lease that was extended until March 31, 2011, with options to extend the lease for an additional eight years. We lease each of our
restaurant facilities with the exception of one restaurant in El Cajon, California where we own the building but lease the land. The majority of our leases
are for 10-year terms and include options to extend the terms. The majority of the leases also include both fixed rate and percentage-of-sales rent
provisions.
Item 3. LEGAL PROCEEDINGS
On March 24, 2005, a former employee of ours filed a California state court action alleging that we failed to provide the former employee with certain
meal and rest period breaks and overtime pay. The matter was moved into arbitration, and the former employee amended the complaint to claim that the
former employee represents a class of potential plaintiffs. The amended complaint alleges that current and former shift leaders who worked in our
California restaurants during specified time periods worked off the clock and missed meal and rest breaks. This case is still in the pre-class certification
discovery stage, and no class has been certified. The Company denies the former employee’s claims, and intends to continue to vigorously defend this
action. Regardless of merit or eventual outcome, this arbitration may cause a diversion of our management's time and attention and the expenditure of
legal fees and expenses. An unfavorable outcome in this matter could have a material impact on our financial position and results of operations.
In March 2007, we reached an agreement to settle a class action lawsuit filed in California state court related to how we classified certain employees
under California overtime laws. The settlement agreement, which was approved by the court in June 2007, provided for an aggregate settlement payment
of $7.5 million. The settlement resulted in a one-time pre-tax charge of $8.0 million in the fourth quarter of fiscal 2006, which includes the settlement
amount and legal costs incurred related to this agreement. We recently learned that approximately 160 current and former employees who qualified to
participate as class members in this class action settlement were not included in the settlement list approved by the court, and some number of these
individuals may file claims to participate in the class action. The Company intends, during the second quarter of 2008, to file a motion requesting the court
to include these individuals in the approved settlement and to provide that their claims are payable out of the aggregate settlement payment. There is no
assurance that the court will grant the Company’s request.
Item 4. SUBMISSION OF MATTERS TO A VOTE OF SECURITY HOLDERS
No matter was submitted to a vote of our stockholders during the quarter ended December 30, 2007.
- 18 -

PART II
Item 5. MARKET FOR THE REGISTRANT’S COMMON EQUITY, RELATED STOCKHOLDER MATTERS AND ISSUER PURCHASES OF
EQUITY SECURITIES
MARKET INFORMATION FOR COMMON STOCK
Our common stock is listed on the NASDAQ Global Market under the symbol “RUBO.” Our common stock began trading on May 21, 1999. The
closing sales price of our common stock as reported on NASDAQ on March 25, 2008 was $6.48. As of March 25, 2008, there were approximately 4,069
beneficial holders of our common stock, including 298 holders of record.
The following table sets forth, for the periods indicated, the high and low closing sales prices for our common stock for each quarter of our two most
recent fiscal years, as regularly reported on NASDAQ. Such quotations represent inter-dealer prices without retail markup, markdown or commission and
may not necessarily represent actual transactions.
DIVIDEND POLICY
Since our initial public offering in May 1999, we have not declared or paid any cash dividends on our common stock. We currently intend to retain all
earnings for the operation and expansion of our business and do not intend to pay any cash dividends in the foreseeable future.
High Low
2006:
First Quarter $ 10.22 8.28
Second Quarter $ 8.75 7.08
Third Quarter $ 9.69 8.50
Fourth Quarter $ 10.50 8.80
2007:
First Quarter $ 11.46 9.01
Second Quarter $ 12.93 10.07
Third Quarter $ 11.12 9.71
Fourth Quarter $ 10.99 8.33
- 19 -

STOCK PERFORMANCE GRAPH
RECENT SALES OF UNREGISTERED SECURITIES
None.
PURCHASE OF EQUITY SECURITIES
There were no repurchases during the fourth quarter of 2007.
- 20 -

Item 6. SELECTED CONSOLIDATED FINANCIAL DATA
Our fiscal year is 52 or 53 weeks, ending the last Sunday in December. Fiscal 2006 included 53 weeks. All other fiscal years presented include 52
weeks.
The following selected consolidated financial data should be read in conjunction with our consolidated financial statements and the notes thereto
appearing elsewhere in this report and with Management’s Discussion and Analysis of Financial Condition and Results of Operations included under Item
7 of this report. These historical results are not necessarily indicative of the results to be expected in the future.
Fiscal Years
2007 2006 2005 2004 2003
(in thousands, except per share data)CONSOLIDATED STATEMENTS OF OPERATIONS DATA:
Restaurant sales $ 169,519 $ 151,995 $ 140,496 $ 137,197 $ 124,786
Franchise and licensing revenues 212 273 261 203 204
Total revenues 169,731 152,268 140,757 137,400 124,990
Costs and expenses:
Cost of sales 48,369 42,079 37,997 37,426 36,052
Restaurant labor 54,364 48,472 45,801 44,791 42,355
Restaurant occupancy and other 39,192 35,987 33,732 31,438 30,471
General and administrative expenses 16,215 23,429 15,844 11,412 10,315
Depreciation and amortization 8,834 8,215 7,764 7,322 6,993
Pre-opening expenses 572 537 147 218 488
Asset impairment and store closure expense (reversal) 274 (405) 275 (10) 2,071
Loss on disposal/sale of property 127 281 520 39 233
Total costs and expenses 167,947 158,595 142,080 132,636 128,978
Operating income (loss) 1,784 (6,327) (1,323) 4,764 (3,988)
Other income (expense), net 302 482 444 154 (6)
Income (loss) before income taxes 2,086 (5,845) (879) 4,918 (3,994)
Income tax (expense) benefit (897) 2,384 651 (1,878) 1,569
Net income (loss) $ 1,189 $ (3,461) $ (228) $ 3,040 $ (2,425)
Net income (loss) per share
Basic $ 0.12 $ (0.36) $ (0.02) $ 0.33 $ (0.27)
Diluted 0.12 (0.36) (0.02) 0.32 (0.27)
Shares used in calculating net income (loss) per share
Basic 9,889 9,592 9,378 9,135 9,093
Diluted 9,889 9,592 9,378 9,388 9,093
SELECTED OPERATING DATA:
Percentage change in comparable store sales (1) 6.2% 2.0% 1.2% 4.3% 1.8%
Percentage change in number of transactions (2) (2.0%) (1.0%) 0.2% 4.0% (3.1%)
Percentage change in price per transaction (3) 8.3% 3.0% 1.0% 0.3% 5.1%
Fiscal Years
2007 2006 2005 2004 2003
CONSOLIDATED BALANCE SHEET DATA:
Cash and cash equivalents $ 3,562 $ 9,946 $ 8,022 $ 7,315 $ 6,483
Total assets 71,068 67,505 58,591 57,188 52,306
Total stockholders’ equity 44,075 40,502 40,965 39,740 35,150
(1) Comparable store sales are computed on a daily basis, and then aggregated to determine comparable store sales on a quarterly or annual basis. A
restaurant is included in this computation after it has been open for 15 months. As a result, a restaurant may be included in this computation for
only a portion of a given quarter or year.
(2) Numbers of transactions are compiled by the Company’s point-of-sales system.
(3) Price per transaction is derived from the Company’s net sales, which reflects discounts and coupons.
- 21 -

Item 7. MANAGEMENT’S DISCUSSION AND ANALYSIS OF FINANCIAL CONDITION AND RESULTS OF OPERATIONS
You should read the following discussion and analysis in conjunction with our financial statements and related notes contained elsewhere in this report. This discussion contains forward-looking statements that involve risks, uncertainties, and assumptions. Our actual results may differ materially from those anticipated in these forward-looking statements as a result of a variety of factors, including those set forth under Item 1A, “Risk Factors” and elsewhere in this report and those discussed in other documents we file with the Securities and Exchange Commission. In light of these risks, uncertainties and assumptions, readers are cautioned not to place undue reliance on such forward-looking statements. These forward looking statements represent beliefs and assumptions only as of the date of this report. Except as required by applicable law, we do not intend to update or revise forward-looking statements contained in this report to reflect future events or circumstances.
OVERVIEW
We opened our first restaurant under the name “Rubio’s, Home of the Fish Taco” in 1983. As of March 25, 2008, we have grown to 179 restaurants, including 174 company-operated, three licensed locations and two franchised locations. We position our restaurants in the high-quality, fresh and distinctive fast-casual Mexican cuisine segment of the restaurant industry. Our business strategy is to become a leading brand in this industry segment.
During 2007, we continued to focus on ways to improve our economic model. We believe that shifting our focus to great taste rather than price and increasing the price of our combo meals were two key drivers for our sales growth in 2007. In addition, we priced our promotional events at higher points and provided our guests with more food and sides than before. We also invested in research to better understand our guests’ needs and how we compare with our competitors. We have commenced a number of additional initiatives with the goal to improve to go orders and catering from a guest convenience view point as well as multiple in-restaurant programs to improve overall service and satisfaction.
Our 2007 average unit volume, which includes restaurants open for at least 12 months, increased from $980,000 to $1,034,000 due to an increase in comparable store sales of 6.2% and the closure of one underperforming restaurant. We opened 10 new restaurants in 2007. All of the new openings in 2007 and 2008 have the new décor that was developed during 2005 and was the basis for our system wide re-imaging program. The majority of these new restaurants are outperforming average weekly sales for their respective markets.
Our three to five year expansion plan begins with an annual unit growth rate of approximately 10% in 2008, and increases to 20% by 2011. We currently plan to open 18 to 22 company-owned restaurants in fiscal 2008 in our existing geographic markets. The current slow down in housing combined with the general economic climate has caused us to focus almost exclusively on sites located in mature trade areas. This narrower focus could limit our growth potential in 2008 and 2009. In addition, we will be required to secure a credit facility or line of credit in 2008 to support our planned restaurant growth plan. We cannot assure you that we can secure a credit facility or line of credit on acceptable terms, or at all.
On the cost and expense side of our economic model, we are experiencing increases in cost of sales. The demand for seafood is ahead of the short-term supply driving up this cost. In addition, we have increased serving sizes to improve our value proposition. The recent changes in strategy have allowed us to experience higher sales, which in turn is allowing us to better leverage some of our fixed costs in labor and occupancy.
General and administrative costs decreased significantly in 2007 primarily due to the expense recorded in 2006 related to the settlement of our class action lawsuit. In 2007, we added key personnel which we believe will help allow us to execute our development plans as well as to better support our restaurants through hiring, developing and training our new team members. As we continue to add new restaurants, we expect to be able to leverage our general and administrative costs at a better rate than we have historically.
CRITICAL ACCOUNTING POLICIES
Our discussion and analysis of our financial condition and results of operations are based upon our consolidated financial statements, which are prepared in accordance with U.S. generally accepted accounting principles (GAAP). The preparation of these consolidated financial statements in accordance with GAAP requires management to make estimates and assumptions that affect the reported amounts of assets and liabilities and the disclosure of contingencies at the date of the consolidated financial statements as well as the reported amounts of revenues and expenses during the reporting period.
Management evaluates these estimates and assumptions on an ongoing basis including those relating to impairment of assets, restructuring charges, contingencies and litigation. Our estimates and assumptions have been prepared on the basis of the most current information available, and actual results could differ from these estimates under different assumptions and conditions.
We have identified the following critical accounting policies that are most important to the portrayal of our financial condition and results of operations and that require management’s most difficult, subjective or complex judgments, often as a result of the need to make estimates about the effect of matters that are inherently uncertain. Note 1 to the consolidated financial statements includes a summary of the significant accounting policies and methods used in the preparation of our consolidated financial statements. The following is a review of the more critical accounting policies and methods used by us:
- 22 -

SHARE-BASED COMPENSATION - The Company accounts for share-based compensation in accordance with Statement No. 123(R), Share-Based
Payment, (SFAS 123R) . Under the provisions of SFAS 123R, share-based compensation cost is estimated at the grant date based on the award’s fair value
as calculated by an option-pricing model and is recognized as expense on a straight-line basis over the requisite service period. The option-pricing models
require various highly judgmental assumptions including volatility, forfeiture rates, and expected option life. If any of the assumptions used in the model
change significantly, share-based compensation expense may differ materially in the future from that recorded in the current period.
ASSET IMPAIRMENT AND STORE CLOSURE EXPENSE (REVERSAL) - We evaluate the carrying value of long-lived assets for impairment
when a restaurant experiences a negative event, including, but not limited to, a significant downturn in sales, a substantial loss of customers, an
unfavorable change in demographics or a store closure. Upon the occurrence of a negative event, we estimate the future undiscounted cash flows for the
individual restaurants that are affected by the negative event. If the projected undiscounted cash flows do not exceed the carrying value of the assets at
each restaurant, we recognize an impairment loss to reduce the assets’ carrying amounts to their estimated fair value (for assets to be held and used) and
fair value less cost to sell (for assets to be disposed of) based on the discounted projected cash flows derived from the restaurant. The most significant
assumptions in the analysis are those used to estimate a restaurant's future cash flows. We use the assumptions in our strategic plan and modify them as
necessary based on restaurant specific information. If the significant assumptions are incorrect, the carrying value of our operating restaurant assets, as
well as the related impairment charge, may be overstated or understated. We estimate that it takes a new restaurant approximately 24 months to reach
operating efficiency. Any restaurant open 24 months or less, therefore, is not included in the analysis of long-lived asset impairment, unless other events or
circumstances arise.
We make decisions to close stores based on their cash flows and anticipated future profitability. We record losses associated with the closure of a
restaurant at the time the unit is closed. These store closure charges primarily represent a liability for the future lease obligations after the closure dates, net
of estimated sublease income, if any. The amount of our store closure liability, and related store closure charges, may decrease if we are successful in
either terminating a lease early or obtaining a more favorable sublease, and may increase if any of our sublessee’s default on their leases.
Asset impairment and store closure expense are estimates that we have recorded based on reasonable assumptions related to our restaurant locations at
this point in time. The conditions regarding these locations may change in the future and could be materially affected by factors such as our ability to
maintain or improve sales levels, our ability to secure subleases, our success at negotiating early termination agreements with lessors, the general health of
the economy and resultant demand for commercial property. Because the factors used to estimate impairment and store closure expense are subject to
change, amounts recorded may not be sufficient, and adjustments may be necessary.
PROPERTY - Property is stated at cost. A variety of costs are incurred in the leasing and construction of restaurant facilities. The costs of buildings
under development include specifically identifiable costs. The capitalized costs include development costs, construction costs, salaries and related costs,
and other costs incurred during the acquisition or construction stage. Salaries and related costs capitalized totaled $323,000, $81,000 and $51,000 for fiscal
years 2007, 2006 and 2005, respectively. Depreciation and amortization of buildings, leasehold improvements, and equipment are computed using the
straight-line method over the shorter of the estimated useful lives of the assets or the initial lease term for certain leased properties (buildings and
improvements range from 1 to 20 years, and equipment 3 to 7 years). For leases with renewal periods at the Company’s option, the Company generally
uses the original lease term, excluding renewal option periods to determine useful lives; if failure to exercise a renewal option imposes an economic
penalty to the Company, management may determine at the inception of the lease that renewal is reasonably assured and include the renewal option period
in the determination of appropriate estimated useful lives. The Company’s policy requires lease-term consistency when calculating the depreciation period,
in classifying the lease, and in computing straight-line rent expense.
SELF-INSURANCE LIABILITIES - We are self-insured for a portion of our workers’ compensation insurance program. Maximum self-insured
retention, including defense costs per occurrence was $350,000 during each of our claim years ended October 31, 2008, 2007, 2006 and 2005. We account
for insurance liabilities based on independent actuarial estimates of the amount of loss incurred. These estimates rely on actuarial observations of industry-
wide and Rubio’s specific historical claim loss development. Our actual loss development may be better or worse than the development estimated by the
actuary. In that event, we will modify the accrual, and our operating expenses will increase or decrease accordingly.
- 23 -

REVENUE RECOGNITION - Revenues from the operation of company-owned restaurants are recognized when sales occur. Franchise revenue is
comprised of (i) area development fees, (ii) new store opening fees, and (iii) royalties. Fees received pursuant to area development agreements under
individual franchise agreements, which grant the right to develop franchised restaurants in future periods in specific geographic areas, are deferred and
recognized as revenue on a pro rata basis as the individual franchised restaurants subject to the development agreements are opened. New store opening
fees are recognized as revenue in the month a franchised location opens. Royalties from franchised restaurants are recorded in revenue as earned. We
recognize a liability upon the sale of our gift cards and recognize revenue when these gift cards are redeemed in our restaurants. Revenues from the portion
of the gift cards that is not expected to be redeemed (breakage) are recognized ratably over three years based on historical and expected redemption trends.
This adjustment is classified as revenues in our consolidated statement of operations.
INCOME TAXES - The Company accounts for uncertainty in income taxes in accordance with FIN 48, which clarifies the accounting for uncertainty
in income taxes recognized in the financial statements in accordance with FAS 109, and provides guidance on the recognition and measurement of a tax
position taken or expected to be taken in a tax return. FIN 48 also provides guidance on derecognition, classification, interest and penalties, accounting in
interim periods, disclosures and transition.
RESULTS OF OPERATIONS
All comparisons under this heading between fiscal 2007, 2006 and 2005 refer to the 52-week period ended December 30, 2007, the 53-week period
ended December 31, 2006 and the 52-week period ended December 25, 2005.
The following table sets forth our operating results, expressed as a percentage of total revenues, with respect to certain items included in our
consolidated statements of operations.
(1) As a percentage of restaurant sales.
The following table summarizes the number of restaurants:
Fiscal Year Ended
December 30,
2007
December 31,
2006
December 25,
2005
Total revenues 100.0% 100.0% 100.0%
Costs and expenses:
Cost of sales (1) 28.5 27.7 27.0
Restaurant labor (1) 32.1 31.9 32.6
Restaurant occupancy and other (1) 23.1 23.7 24.0
General and administrative expenses 9.6 15.4 11.3
Depreciation and amortization 5.2 5.4 5.5
Pre-opening expenses 0.3 0.4 0.1
Asset impairment and store closure expense (reversal) 0.2 (0.3) 0.2
Loss on disposal/sale of property 0.1 0.2 0.4
Operating income (loss) 1.1 (4.2) (0.9)
Other income (expense), net 0.2 0.3 0.3
Income (loss) before income taxes 1.2 (3.8) (0.6)
Income tax (expense) benefit (0.5) 1.6 0.5
Net income (loss) 0.7% (2.3)% (0.2)%
December 30,
2007
December 31,
2006
December 25,
2005
Company-operated 171 162 149
Franchised and licensed locations 5 4 8
Total 176 166 157
- 24 -

Revenues
Total revenues were $169.7 million, $152.3 million and $140.8 million in fiscal 2007, 2006 and 2005, respectively. The increase in revenues in fiscal
2007 as compared with fiscal 2006 resulted from several factors: first, we opened 10 new stores in fiscal 2007, which contributed sales of $2.4 million;
second, stores opened before fiscal 2007 but not yet in our comparable store base contributed sales of $9.1 million; third, comparable store sales
contributed $9.0 million; and fourth, revenue recognized for the portion of the gift card liability that is not expected to be redeemed (breakage) contributed
$0.3 million. The $9.0 million increase attributable to comparable store sales was offset by $2.6 million due to the one extra week in fiscal 2006 as
compared with fiscal 2007. This was further offset by a decrease of $0.8 million in sales from one store that closed in the third quarter of fiscal 2006 and
one store that closed during the second quarter of fiscal year 2007. Units enter the comparable store base after 15 full months of operation. The increase in
comparable store sales in fiscal 2007 from fiscal 2006 was primarily due to an 8.3% increase in the average check amount. Comparable store sales
increased 6.2% in comparison to prior year. The Company’s average unit volume was $1,034,000 compared with $980,000 in fiscal 2006 and $957,000 in
fiscal 2005. The increase in revenues in fiscal 2006 as compared with fiscal 2005 was primarily due to sales of $2.7 million from our nine store openings,
$2.7 million from stores opened before fiscal 2006 but not yet in our comparable store base, $1.5 million from five acquired franchise location and an
increase in comparable store sales of $5.4 million. This increase was offset by a decrease of $0.8 million in sales from the one store that closed in the
fourth quarter of fiscal 2005 and two stores that closed during the third quarter of fiscal year 2006. The increase in comparable stores sales in fiscal 2006
from fiscal 2005 was primarily due to a 3% increase in the average check amount, which was offset by a 1% decrease in the number of transactions.
Costs and Expenses
Cost of sales increased to $48.4 million in fiscal 2007, from $42.1 million in fiscal 2006 and $38.0 million in fiscal 2005, due primarily to an increase
in the number of company-operated restaurants. As a percentage of restaurant sales, cost of sales increased to 28.5% in fiscal 2007, as compared with
27.7% in fiscal 2006 and 27.0% in 2005. The percentage increase in fiscal 2007 as compared with fiscal 2006 is a direct result of higher seafood costs due
to increased demand and reduced supply. Additionally, avocado costs spiked due to a significant shortage in the supply as a result of the freezing weather
in the Western United States in January. The escalation of gasoline prices and increased ethanol sourcing is increasing the cost of corn, which is directly
tied to the costs of chicken, steak, tortillas, cheese and beverage syrup. The cost of transporting food supplies to our distributors has increased and this cost
is passed through to us. Finally, the cost of oil increased due to the transition to the exclusive use of zero trans fat oil in our stores during the third quarter
of 2007. The percentage increase in fiscal 2006 as compared with fiscal 2005 was a direct result of higher seafood costs and transitioning our stores from
pre-cut fish purchases to a pre-battered fish product during early 2006. Branding initiatives such as increased fish portions and enhanced flavors also
impacted the cost of some of the premium products in fiscal 2006. These cost increases were partially offset by lower produce costs, primarily avocados.
Restaurant labor costs increased to $54.4 million in fiscal 2007 from $48.5 million in fiscal 2006 and $45.8 million in fiscal 2005. As a percentage of
restaurant sales, these costs increased to 32.1% in fiscal 2007 compared with 31.9% in fiscal 2006 and decreased compared with 32.6% in fiscal 2005. The
increase in 2007 compared with 2006 is primarily the result of the increase in the minimum wage at the beginning of the fiscal year, increased staffing
levels at the restaurants and the cost of our long term incentive plan for restaurant general managers. We believe the improved staffing also contributed to
the increase in revenues. This decrease in fiscal 2006 as compared with fiscal 2005 was primarily the result of our ability to leverage our costs with the
increase in revenues, lower workers’ compensation expenses, and less labor required due to the switch to the pre-battered fish product.
Restaurant occupancy and other costs increased to $39.2 million in fiscal 2007, from $36.0 million in fiscal 2006 and $33.7 million in fiscal 2005. As
a percentage of restaurant sales, these costs decreased to 23.1% in fiscal 2007 from 23.7% in fiscal 2006 and 24.0% in fiscal 2005. This decrease is
primarily the result of our decision to shift a significant amount of advertising dollars from radio advertising in the Los Angeles and Phoenix markets to
localized neighborhood marketing efforts. The decrease in fiscal 2006 from 2005 was primarily the result of our ability to leverage our costs with the
increase in revenues and the decision to focus advertising expenditure in the Los Angeles market during the fourth quarter to a local marketing approach
versus more expensive radio spots.
- 25 -

General and administrative expenses decreased to $16.2 million in fiscal 2007, from $23.4 million in fiscal 2006 and increased from $15.8 million in
fiscal 2005. As a percentage of revenue, these costs were 9.6% in fiscal 2007, 15.4% in fiscal 2006 and 11.3% in fiscal 2005. General and administrative
expenses in 2006 include the accrual of approximately $8.0 million for the settlement of the class action wage and hour lawsuit and related costs. In
addition, we also expensed approximately $1.0 million in legal fees related to this class action lawsuit. Excluding the one-time accruals in fiscal 2006,
general and administrative expense as a percentage of revenue for fiscal 2007, as compared with fiscal 2006 was relatively flat. The dollar increase was
due to additional head count added during 2006 and share-based compensation expense. Fiscal 2005 expenses were a result of large expenses outside of
our normal restaurant operations support. Legal and professional fees for previous years consolidated financial statement restatements, Sarbanes Oxley
Section 404 compliance efforts and ongoing litigation defense amounted to $1.1 million for the first three quarters of the 2005 fiscal year. In the fourth
quarter of 2005, an additional $2.6 million was recorded related to executive separation of $200,000 severance and $562,000 revaluation of stock options;
legal fees and lobster lawsuit settlement costs of $553,000; other legal and professional fees of $631,000; executive search and relocation expenses of
$404,000 and other miscellaneous expenses of $250,000.
Depreciation and amortization increased to $8.8 million in fiscal 2007, from $8.2 million in fiscal 2006 and $7.8 million in fiscal 2005. This increase
was primarily due to the additional depreciation on the new restaurants added in 2007 and 2006 as well as depreciation associated with the restaurant re-
imaging program. Fiscal 2006 also had one additional week as compared with fiscal 2007 and fiscal 2005.
Pre-opening expenses increased to $572,000 in fiscal 2007, from $537,000 in fiscal 2006 and $147,000 in fiscal 2005. During fiscal 2007, we opened
10 restaurants compared with nine during fiscal 2006 and five during fiscal 2005. Pre-opening costs in 2007 and 2006 also increased from prior years as
we now open our restaurants with a very specific local marketing plan that costs approximately $15,000 per location. Other pre-opening costs include non-
cash rent expense during the build out period of $20,000 to $30,000 per location and compensation expense of approximately $15,000 to $20,000 per
location. The lower costs in fiscal 2005 were also due in part to the fact that one of the restaurants opened in fiscal 2005 was a replacement unit, and, as
such, training costs were minimal.
Asset impairment and store closure expense was comprised of a $274,000 charge in fiscal 2007, as compared with a $405,000 reversal in fiscal 2006
and a $275,000 charge in fiscal 2005. The $274,000 charge in fiscal 2007 was the net effect of an adjustment to store closure reserve of $19,000 for the
sub-lease income for a Salt Lake City, Utah location, which closed in 2001, combined with a charge to impairment of $229,000, for the closure of a Los
Angeles, California area restaurant and a $64,000 adjustment to anticipated sublease income for a restaurant in the Denver, Colorado area that closed in
2001 An additional reversal of $24,000 was recorded in the second quarter of 2006. During the fourth quarter of 2006, the Company reversed $158,000 of
the store closure accrual due to a sub-tenant occupying its space longer than anticipated at the signing of the sub-lease. The $275,000 charge during fiscal
2005 was the net effect of a charge to impairment of $288,000, for the closure of the Portland, Oregon restaurant, combined with a reversal to store closure
of $13,000 based on the recalculation of the closed store accrual for a Phoenix, Arizona restaurant.
Other income, primarily interest, decreased to $302,000 in fiscal 2007, compared with $482,000 in fiscal 2006 and $444,000 in fiscal 2005. The
decrease in interest income in 2007 was due to reduced cash balances, as well as lower interest rates. Fiscal 2006 has one additional week of interest and
investment income as compared with fiscal 2007 and fiscal 2005.
The provision for income taxes for fiscal 2007, 2006 and 2005 is based on the approximate annual effective tax rate applied to the respective period’s
pre-tax book income or loss. Our fiscal 2007 annual income tax provision rate of 43.0% consisted of our statutory blended federal and state income tax
rate applied against our pre-tax book income and increased for the net impact of various items. These items included a decrease of 2.5% for federal tax
credits, an increase of 1.3% for accrued interest under FIN 48, and a one-time increase of 3.2% related to the revaluation of the our state deferred tax asset
to reflect a revised statutory state tax rate. Our fiscal 2006 annual income tax benefit rate of 40.8% consisted of our statutory blended federal and state
income tax rate applied against our pre-tax book loss and increased by the benefit of federal and California targeted employment tax credits that were
claimed. During fiscal 2005, we reduced our fiscal 2005 projected annual rate due to our tax planning initiatives. The 74.1% tax benefit applied to fiscal
2005 comprises the federal and state statutory rate benefit, increased by additional benefit for 2005 federal and California targeted employment tax credits,
tax-exempt interest and for prior year California targeted employment tax credits and Alternative Minimum Tax credits benefited during 2005.
SEASONALITY
Historically, we have experienced seasonal variability in our quarterly operating results with higher sales per restaurant in the second and third
quarters than in the first and fourth quarters. The higher sales in the second and third quarters affect profitability by reducing the impact of our restaurants’
fixed and partially fixed costs, as a percentage of sales. This seasonal impact on our operating results is expected to continue.
- 26 -

INFLATION
The primary areas of our operations affected by inflation are food, supplies, labor, fuel, lease, utility, insurance costs and materials used in the
construction of our restaurants. Substantial increases in costs and expenses, particularly food, supplies, labor, fuel and operating expenses could have a
significant impact on our operating results to the extent that such increases cannot be passed through to our guests. Our leases require us to pay taxes,
maintenance, repairs, insurance and utilities, all of which are subject to inflationary increases. We believe inflation with respect to food, labor, insurance
and utility expenses has had a material impact on our results of operations in 2007, 2006 and 2005.
LIQUIDITY AND CAPITAL RESOURCES
Since we became public in 1999, we have funded our capital requirements through bank debt and cash flows from operations. We generated $5.1
million in cash flows from operating activities in fiscal 2007, $10.9 million in fiscal 2006, and $5.1 million in fiscal 2005. The decrease in cash flows in
fiscal 2007 is primarily due to the first installment payment of $2.5 million related to the previously settled class action lawsuit, the payment of $1.6
million for January 2008 rent at the end of the fourth quarter, and other changes in operating assets and liabilities, partially offset by increased net income
and non-cash expenses, including depreciation, amortization and share-based compensation.
Net cash used in investing activities was $13.0 million in fiscal 2007, compared with $11.5 million in fiscal 2006 and $5.3 million in fiscal 2005. Net
cash used in investing activities in fiscal 2007 was comprised primarily of $13.0 million in capital expenditures. Net cash used in investing activities in
fiscal 2006 included $14.0 million in capital expenditures, $1.1 used to reacquire franchised locations, and $3.1 million in purchases of investments, offset
by $18,000 in proceeds received from the sale of property and $6.8 million in proceeds received from the maturities of investments. The reduction in
capital expenditures in 2007 as compared with 2006 was due to the completion of our re-imaging program offset by expenditures related to one additional
new store opening in 2007 compared with 2006. The increase in capital expenditures in 2006 as compared with 2005 was primarily due to the previously
mentioned increase in new store openings, as well as our re-imaging program. During 2007, we re-imaged six of our restaurants, as compared with 75 in
2006 and 27 in 2005. Net cash used in investing activities in fiscal 2005 included $7.3 million in capital expenditures and $5.2 million in purchases of
investments, partially offset by $7.2 million in proceeds received from the maturities of investments.
Net cash provided by financing activities was $1.5 million in fiscal 2007 compared with $2.5 million in fiscal 2006 and $893,000 fiscal 2005. Net cash
provided by financing activities during fiscal 2007 consisted of proceeds received from exercises of common stock options of $1.2 million and excess tax
benefits from share-based compensation of $284,000. Net cash provided by financing activities in fiscal 2006 also consisted of proceeds from exercises of
common stock options and excess tax benefits from share-based compensation and consisted solely of proceeds from exercises of common stock options in
fiscal 2005.
In 2003, the Company obtained a letter of credit in the amount of $2.0 million related to the Company’s workers’ compensation insurance policy. The
letter of credit is subject to automatic one-year extensions from the expiration date and thereafter, unless notification is made prior to the expiration date. In
December 2004, this letter of credit was increased to $2.9 million. The letter of credit was extended in October of 2004, 2005, 2006 and again in 2007. The
Company was also required, under the terms of the letters of credit, to pledge collateral of $3.0 million in 2007 and 2006, and $3.7 million in 2005.
We currently expect total capital expenditures in 2008 to be approximately $13 million to $15 million for restaurant openings, restaurant re-imaging,
maintenance, and for corporate and information technology. We currently expect that future locations will generally cost between $575,000 and $625,000
per unit, excluding pre-opening expenses. Some units may exceed this range due to the area in which they are built and the specific requirements of the
project. Pre-opening expenses are expected to average between $50,000 and $60,000 per restaurant, which includes approximately $20,000 to $30,000 of
non-cash rent expense during the build-out period.
We believe that the anticipated cash flows from operations combined with our cash and cash equivalents of $3.6 million as of December 30, 2007 will
be sufficient to satisfy our working capital needs, required capital expenditures and class action settlement obligations for the next 12 months. We intend to
secure a credit facility or credit line in order to continue to support our restaurant expansion plans. We cannot assure you that we can secure a credit
facility or credit line to support our expansion plans on acceptable terms, or at all. In addition, changes in our operating plans, changes in our expansion
plans, lower than anticipated sales, increased expenses, potential acquisitions or other events may cause us to seek additional or alternative financing
sooner than anticipated. Additional or alternative financing may not be available on acceptable terms, or at all. Failure to obtain additional or alternative
financing as needed could have a material adverse effect on our business and results of operations.
- 27 -

CONTRACTUAL OBLIGATIONS AND COMMITMENTS
The following represents a comprehensive list of our contractual obligations and commitments as of December 30, 2007:
IMPACT OF RECENTLY ISSUED ACCOUNTING STANDARDS
In September 2006, the FASB issued Statement No. 157, Fair Value Measures (SFAS 157). SFAS 157 defines fair value, establishes a framework for
measuring fair value and enhances disclosures about fair value measures required under other accounting pronouncements, but does not change existing
guidance as to whether or not an instrument is carried at fair value. SFAS 157 is effective for fiscal years beginning after November 15, 2007, the year
beginning December 31, 2007 for the Company. In November 2007, the FASB proposed a one-year deferral of SFAS 157's fair-value measurement
requirements for nonfinancial assets and liabilities that are not required or permitted to be measured at fair value on a recurring basis. The adoption of this
standard is not expected to have a material impact on our consolidated financial statements.
In February 2007, the FASB issued Statement No. 159, The Fair Value Option for Financial Assets and Financial Liabilities - including an
Amendment of FASB Statement No. 115 (SFAS 159). SFAS 159 permits entities to choose to measure many financial instruments and certain other items at
fair value. We have elected not to use the fair value measurement provisions of SFAS 159.
In December 2007, the FASB issued Statement No. 141R (revised 2007), Business Combinations (SFAS 141R). SFAS 141R will change the
accounting for business combinations. Under SFAS 141R, an acquiring entity will be required to recognize all the assets acquired and liabilities assumed
in a transaction at the acquisition-date fair value with limited exceptions. SFAS 141R will change the accounting treatment and disclosures for certain
specific items in a business combination. SFAS 141R becomes effective for us at the beginning of 2009. We are still evaluating the impact of SFAS 141R
on our financial position or results of operations.
In December 2007, the FASB issued Statement No. 160, Noncontrolling Interest in Consolidated Financial Statements (SFAS 160). SFAS 160
clarifies that a non-controlling interest in a subsidiary is an ownership interest in the consolidated entity that should be reported as equity in the
consolidated financial statements. This statement also requires consolidated net income to be reported at amounts that include the amounts attributable to
both the parent and the non-controlling interest and requires disclosure, on the face of the consolidated statement of income, of the amounts of consolidated
net income attributable to the parent and to the non-controlling interest. In addition, this statement establishes a single method of accounting for changes
in a parent’s ownership interest in a subsidiary that does not result in deconsolidation and requires that a parent recognize a gain or loss in net income when
a subsidiary is deconsolidated. SFAS 160 becomes effective for us at the beginning of 2009. This statement will be applied prospectively, except for the
presentation and disclosure requirements, which will be applied retrospectively for all periods presented. We currently do not have any minority or non-
controlling interests in a subsidiary and we do not expect SFAS 160 to have an impact on our consolidated financial statements; however, transactions
between now and the adoption date of SFAS 160 could have an impact on our consolidated financial statements.
Payments Due by Period (in thousands)
Total
Less than
1 year 1 - 3 years 3 - 5 years
After
5 years
Company-operated retail locations and other operating leases $ 65,575 $ 14,559 $ 23,309 $ 12,626 $ 15,081
Settlement of class action lawsuit (1) 5,311 2,699 2,612 — —
$ 70,886 $ 17,258 $ 25,921 $ 12,626 $ 15,081
(1) includes interest at 3% per annum.
- 28 -

Item 7A. QUANTITATIVE AND QUALITATIVE DISCLOSURES ABOUT MARKET RISK
Our market risk exposures are related to our cash, cash equivalents and investments. We invest our excess cash in highly liquid short-term investments
with maturities of less than one year. The portfolio consists primarily of money market instruments. As of December 30, 2007, we had no investments with
maturities in excess of one year. These investments are not held for trading or other speculative purposes. Changes in interest rates affect the investment
income we earn on our investments and, therefore, impact our cash flows and results of operations. Due to the types of our investments and debt
instruments, a 10% change in period-end interest rates or a hypothetical 100-basis-point adverse change in interest rates would not have a significant
negative effect on our financial results.
Many of the prices of food products purchased by us are affected by changes in weather, production, availability, seasonality, fuel and energy costs,
and other factors outside our control. In an effort to control some of this risk, we have entered into some fixed price purchase commitments with terms of
one year or less. We do not believe that these purchase commitments are material to our operations as a whole. In addition, we believe that almost all of
our food and supplies are available from several sources.
Impact of Inflation
The primary areas of our operations affected by inflation are food, supplies, labor, fuel, lease, utility, insurance costs and materials used in the
construction of our restaurants. Substantial increases in costs and expenses, particularly food, supplies, labor, fuel and operating expenses could have a
significant impact on our operating results to the extent that such increases cannot be passed through to our guests. Our leases require us to pay taxes,
maintenance, repairs, insurance and utilities, all of which are subject to inflationary increases. We believe inflation with respect to food, labor, insurance
and utility expense has had a material impact on our results of operations in 2007, 2006 and 2005.
Item 8. CONSOLIDATED FINANCIAL STATEMENTS AND SUPPLEMENTARY DATA
Our consolidated financial statements as of December 30, 2007 and December 31, 2006, and for each of the three fiscal years in the period ended
December 30, 2007 and the report of our independent registered public accountant thereon are included elsewhere in this report. Supplementary unaudited
quarterly financial data for fiscal 2007 and 2006 are included in this report on page F-23.
Item 9. CHANGES IN AND DISAGREEMENTS WITH ACCOUNTANTS ON ACCOUNTING AND FINANCIAL DISCLOSURE
None.
Item 9A. CONTROLS AND PROCEDURES
Conclusion Regarding the Effectiveness of Disclosure Controls and Procedures:
Based on an evaluation of the Company’s disclosure controls and procedures (as defined in Rules 13(a)-15(e) and 15(d)-15(e) of the Securities
Exchange Act of 1934, as amended), as of the end of the Company’s fiscal year ended December 30, 2007, the Company’s Chief Executive Officer and
Chief Financial Officer (its principal executive officer and principal financial officer, respectively) have concluded that the Company’s disclosure controls
and procedures were effective.
Changes in Internal Control over Financial Reporting:
There have been no significant changes in the Company’s internal control over financial reporting that occurred during the Company’s fiscal quarter
ending December 30, 2007 that have materially affected, or are reasonably likely to materially affect, the Company’s internal control over financial
reporting.
Management’s Report on Internal Control over Financial Reporting:
Management is responsible for establishing and maintaining adequate internal control over financial reporting (as defined in Rule 13a-15(f) under the
Exchange Act). The Company’s internal control over financial reporting is designed to provide reasonable assurance to the Company’s management and
Board of Directors regarding the preparation and fair presentation of published financial statements.
- 29 -

Because of its inherent limitations, internal control over financial reporting may not prevent or detect misstatements. Therefore, even those systems
determined to be effective can provide only reasonable assurance with respect to financial statement preparation and presentation.
Management assessed the effectiveness of the Company’s internal control over financial reporting as of December 30, 2007. In making this
assessment, our management used the criteria set forth by the Committee of Sponsoring Organizations of the Treadway Commission (COSO) in Internal
Control - Integrated Framework. Management has concluded that, as of December 30, 2007, the Company’s internal control over financial reporting was
effective based on these criteria.
This annual report does not include an attestation report of the Company’s registered public accounting firm regarding internal control over financial
reporting. Management’s report was not subject to attestation by the Company’s registered public accounting firm pursuant to temporary rules of the
Securities and Exchange Commission that permit the Company to provide only management’s report in this annual report.
Item 9B. OTHER INFORMATION
We adopted a deferred compensation plan, effective on December 1, 2007. Under this plan, beginning on December 31, 2007, our executive officers
and other highly compensated employees and non-employee members of the Board who are not eligible to participate in our 401(k) plan based on their
compensation levels can defer a portion of their compensation and receive contributions from the Company. The intent of this plan is to provide
participants with similar benefits to those benefits we are currently providing to our other employees through our 401(k) plan.
PART III
Item 10. DIRECTORS AND EXECUTIVE OFFICERS AND CORPORATE GOVERNANCE
The information required by this item relating to our directors and our corporate governance is incorporated herein by reference to our definitive proxy
statement to be filed pursuant to Regulation 14A of the Exchange Act for our 2008 annual meeting of stockholders. The information required by this item
relating to our executive officers is included in Item 1, “Our Executive Officers.”
Item 11. EXECUTIVE COMPENSATION
The information required by this item is incorporated by reference to our definitive proxy statement to be filed pursuant to Regulation 14A of the
Exchange Act for our 2008 annual meeting of stockholders.
Item 12. SECURITY OWNERSHIP OF CERTAIN BENEFICIAL OWNERS AND MANAGEMENT AND RELATED STOCKHOLDER MATTERS
The information required by this item is incorporated by reference to our definitive proxy statement to be filed pursuant to Regulation 14A of the
Exchange Act for our 2008 annual meeting of stockholders.
Item 13. CERTAIN RELATIONSHIPS AND RELATED TRANSACTIONS AND DIRECTOR INDEPENDENCE
The information required by this item is incorporated by reference to our definitive proxy statement to be filed pursuant to Regulation 14A of the
Exchange Act for our 2008 annual meeting of stockholders.
Item 14. PRINCIPAL ACCOUNTANT FEES AND SERVICES
The information required by this item is incorporated by reference to our definitive proxy statement to be filed pursuant to Regulation 14A of the
Exchange Act for our 2008 annual meeting of stockholders.
- 30 -

PART IV
Item 15. EXHIBITS AND FINANCIAL STATEMENT SCHEDULES
(a) Financial Statements and Financial Statement Schedules:
The following documents are filed as part of the report:
(1) See the index to our consolidated financial statements on page F-1 for a list of the financial statements being filed herein.
(2) All financial statement schedules are omitted because they are not applicable or the required information is shown in the
consolidated financial statements or other notes thereto.
(3) See the Exhibits under Item 15(b) below for all Exhibits being filed or incorporated by reference herein.
(b) Exhibits:
Number Description
3.1(7) Third Amended and Restated Certificate of Incorporation.
3.2(1) Restated Bylaws (Exhibit 3.4).
3.4(3) Certificate of Amendment of the Bylaws (Exhibit 3.4).
3.5(14) Certificate of Amendment of the Bylaws
4.1(1) Specimen common stock certificate (Exhibit 4.1).
10.1(1) Amended and Restated Investors’ Rights Agreement, dated November 19, 1997 (Exhibit 10.7).
10.2(1) Amendment No. 1 to the Amended and Restated Investors’ Rights Agreement, dated December 31, 1997 (Exhibit 10.8).
10.3(1) Amendment No. 2 to the Amended and Restated Investor’s Rights Agreement, dated May 1998 (Exhibit 10.9).
10.4 (7) Investors’ Rights Agreement Standstill and Extension Agreement between us and Rosewood Capital, L.P. dated March 12, 2004
(Exhibit 10.4).
10.5 (6) Investors’ Rights Agreement Standstill and Extension Agreement between us and Ralph Rubio, dated April 29, 2004 (Exhibit 10.1).
10.6 (8) Investors’ Rights Agreement Standstill and Extension Agreement between us and Rosewood Capital, L.P. dated July 28, 2005 (Exhibit
10.1).
10.7 (8) Investors’ Rights Agreement Standstill and Extension Agreement between us and Ralph Rubio, dated July 28, 2005 (Exhibit 10.2).
10.8(1) Lease Agreement between us and Macro Plaza Enterprises, dated October 27, 1997 (Exhibit 10.15).
10.9(1) First Amendment to Lease Agreement between us and Cornerstone Corporate Centre, LLC, dated October 16, 1998 (Exhibit 10.16).
10.17(1)(2) Form of Indemnification Agreement between us and each of our directors (Exhibit 10.25).
10.18(1)(2) Form of Indemnification Agreement between us and each of our officers (Exhibit 10.26).
10.38(1)(2) Employee Stock Purchase Plan (Exhibit 10.46).
10.39(1)(2) Letter Agreement between us and Host International, Inc., dated May 18, 1999 (Exhibit 10.47).
10.42(4)† Form of Franchise Agreement as of March 15, 2001.
10.51(5)(2) Rubio’s Restaurants, Inc. Deferred Compensation Plan for Non-Employee Directors (Exhibit 10.51).
10.54(5)(2) 1999 Stock Incentive Plan, as amended through March 6, 2003 (Exhibit 10.54).
10.56(7)(2) 1999 Stock Incentive Plan Form of Stock Option Agreement.
10.57(7)(2) 1999 Stock Incentive Plan Form of Addendum to Stock Option Agreement.
10.60(7)(2) 1999 Stock Incentive Plan Form of Stock Issuance Agreement.
10.62(9)(2) Letter Agreement between Gerry Leneweaver and the Company, dated June 1, 2005 (Exhibit 10.2).
10.63(10)(2) Letter Agreement between Lawrence Rusinko and the Company, dated October 7, 2005 (Exhibit 10.1).
- 31 -

All financial statement schedules are omitted because they are not applicable or the required information is shown in the consolidated financial statements
or other notes hereto.
10.64(11)(2) Letter Agreement between Daniel E. Pittard and the Company, dated August 21, 2006 (as corrected).
10.65(12)(2) Form of Restricted Stock Unit Agreement under the Rubio’s Restaurants, Inc. 1999 Stock Incentive Plan.
10.66(12)(2) Rubio’s Restaurants, Inc. Severance Pay Plan.
10.67(13)(2) Rubio’s Restaurants, Inc. 2006 Executive Incentive Plan.
10.68(12)(2) Form of Restricted Stock Unit Agreement under the Rubio’s Restaurants, Inc. 2006 Executive Incentive Plan.
10.69(2) Rubio’s Restaurants, Inc. Deferred Compensation Plan, effective December 1, 2007.
10.70(14) Investors’ Rights Agreement Standstill and Extension Agreement between us and Rosewood Capital, L.P., dated May 7, 2007 (Exhibit
10.8)
10.71(14) Investors’ Rights Agreement Standstill and Extension Agreement between us and Ralph Rubio, dated May 7, 2007 (Exhibit 10.9)
10.72† Sponsorship Agreement between us and the Mighty Ducks Hockey Club, LLC, dated February 28, 2006.
10.73† Beverage Marketing Agreement between us and The Coca-Cola Company, dated September 20, 2007.
10.74† Master Distributor Agreement between us and U.S. Foodservice, Inc., dated January 28, 2008.
10.75† Sponsorship Agreement between us and San Diego Ballpark Funding LLC, dated March 21, 2008.
21.1 Subsidiary List.
23.1 Consent of Independent Registered Public Accounting Firm, KPMG LLP.
24.1 Powers of Attorney (Included under the caption “Signatures”).
31.1 Certification of Chief Executive Officer under Section 302 of the Sarbanes-Oxley Act of 2002.
31.2 Certification of Chief Financial Officer under Section 302 of the Sarbanes-Oxley Act of 2002.
32.1 Certification of Chief Executive Officer under Section 906 of the Sarbanes-Oxley Act of 2002.
32.2 Certification of Chief Financial Officer under Section 906 of the Sarbanes-Oxley Act of 2002.
† The Commission has granted confidential treatment to us with respect to certain omitted portions of this exhibit (indicated by asterisks). We have
filed separately with the Commission an unredacted copy of the exhibit.
(1) Incorporated by reference to the above noted exhibit to our registration statement on Form S-1 (333-75087) filed with the SEC on March 26, 1999,
as amended.
(2) Management contract or compensation plan.
(3) Incorporated by reference to our annual report on Form 10-K filed with the SEC on April 2, 2001.
(4) Incorporated by reference to our annual report on Form 10-K filed with the SEC on April 1, 2002.
(5) Incorporated by reference to our annual report on Form 10-K filed with the SEC on March 24, 2004 and amended on April 6, 2005.
(6) Incorporated by reference to our quarterly report on Form 10-Q filed with the SEC on May 11, 2004.
(7) Incorporated by reference to our annual report on Form 10-K filed with the SEC on April 8, 2005.
(8) Incorporated by reference to our current report on Form 8-K filed with the SEC on August 1, 2005.
(9) Incorporated by reference to our quarterly report on Form 10-Q filed with the SEC on August 5, 2005.
(10) Incorporated by reference to our current report on Form 8-K filed with the SEC on October 14, 2005.
(11) Incorporated by reference to our current report on Form 8-K/A filed with the SEC on August 29, 2006.
(12) Incorporated by reference to our quarterly report on Form 10-Q filed with the SEC on November 6, 2006.
(13) Incorporated by reference to our Definitive Proxy Statement filed with the SEC on June 23, 2006.
(14) Incorporated by reference to our current report on Form 8-K filed with the SEC on December 19, 2007.
(c) Financial Statement Schedules
- 32 -
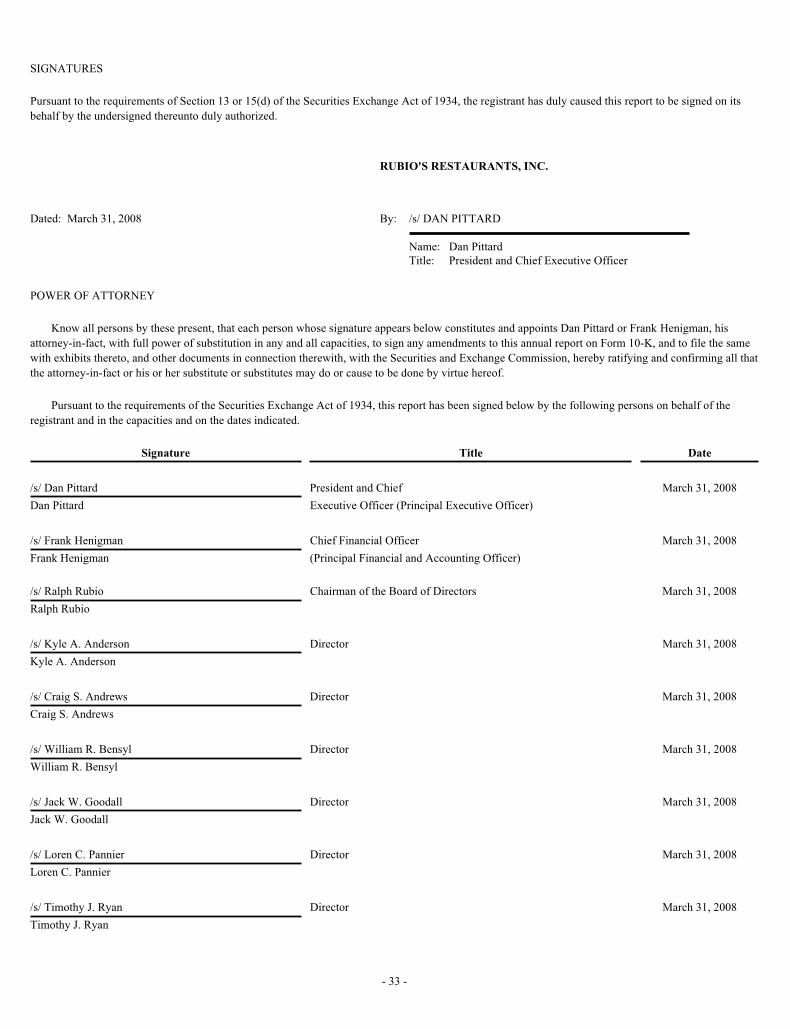
SIGNATURES
Pursuant to the requirements of Section 13 or 15(d) of the Securities Exchange Act of 1934, the registrant has duly caused this report to be signed on its
behalf by the undersigned thereunto duly authorized.
POWER OF ATTORNEY
Know all persons by these present, that each person whose signature appears below constitutes and appoints Dan Pittard or Frank Henigman, his
attorney-in-fact, with full power of substitution in any and all capacities, to sign any amendments to this annual report on Form 10-K, and to file the same
with exhibits thereto, and other documents in connection therewith, with the Securities and Exchange Commission, hereby ratifying and confirming all that
the attorney-in-fact or his or her substitute or substitutes may do or cause to be done by virtue hereof.
Pursuant to the requirements of the Securities Exchange Act of 1934, this report has been signed below by the following persons on behalf of the
registrant and in the capacities and on the dates indicated.
RUBIO'S RESTAURANTS, INC.
Dated: March 31, 2008 By: /s/ DAN PITTARD
Name: Dan Pittard
Title: President and Chief Executive Officer
Signature Title Date
/s/ Dan Pittard President and Chief March 31, 2008
Dan Pittard Executive Officer (Principal Executive Officer)
/s/ Frank Henigman Chief Financial Officer March 31, 2008
Frank Henigman (Principal Financial and Accounting Officer)
/s/ Ralph Rubio Chairman of the Board of Directors March 31, 2008
Ralph Rubio
/s/ Kyle A. Anderson Director March 31, 2008
Kyle A. Anderson
/s/ Craig S. Andrews Director March 31, 2008
Craig S. Andrews
/s/ William R. Bensyl Director March 31, 2008
William R. Bensyl
/s/ Jack W. Goodall Director March 31, 2008
Jack W. Goodall
/s/ Loren C. Pannier Director March 31, 2008
Loren C. Pannier
/s/ Timothy J. Ryan Director March 31, 2008
Timothy J. Ryan
- 33 -

[This page intentionally left blank.]

RUBIO’S RESTAURANTS, INC.
INDEX TO CONSOLIDATED FINANCIAL STATEMENTS
Page
Report of Independent Registered Public Accounting Firm, KPMG LLP F-2
Consolidated Balance Sheets as of December 30, 2007 and December 31, 2006 F-3
Consolidated Statements of Operations for Fiscal Years Ended 2007, 2006 and 2005 F-4
Consolidated Statements of Stockholders’ Equity and Comprehensive Income (Loss) for Fiscal Years Ended 2007, 2006 and 2005 F-5
Consolidated Statements of Cash Flows for Fiscal Years Ended 2007, 2006 and 2005 F-6
Notes to Consolidated Financial Statements F-8
F-1

Report of Independent Registered Public Accounting Firm
The Board of Directors and Stockholders
Rubio’s Restaurants, Inc.:
We have audited the accompanying consolidated balance sheets of Rubio’s Restaurants, Inc. and subsidiaries (the Company) as of December 30, 2007 and
December 31, 2006, and the related consolidated statements of operations, stockholders’ equity and comprehensive income (loss) and cash flows for each
of the years in the three-year period ended December 30, 2007. These consolidated financial statements are the responsibility of the Company’s
management. Our responsibility is to express an opinion on these consolidated financial statements based on our audits.
We conducted our audits in accordance with the standards of the Public Company Accounting Oversight Board (United States). Those standards require
that we plan and perform the audit to obtain reasonable assurance about whether the financial statements are free of material misstatement. An audit
includes examining, on a test basis, evidence supporting the amounts and disclosures in the financial statements. An audit also includes assessing the
accounting principles used and significant estimates made by management, as well as evaluating the overall financial statement presentation. We believe
that our audits provide a reasonable basis for our opinion.
In our opinion, the consolidated financial statements referred to above present fairly, in all material respects, the financial position of Rubio’s Restaurants,
Inc. and subsidiaries as of December 30, 2007 and December 31, 2006, and the results of their operations and their cash flows for each of the years in the
three-year period ended December 30, 2007, in conformity with U.S. generally accepted accounting principles.
As discussed in Note 1 to the consolidated financial statements, the Company adopted the provisions of Statement of Financial Accounting Standards
No. 123 (revised 2004), Share-Based Payment, in fiscal year 2006.
/s/ KPMG LLP
San Diego, California
March 27, 2008
F-2

RUBIO’S RESTAURANTS, INC.
CONSOLIDATED BALANCE SHEETS
(In thousands, except share data)
See notes to consolidated financial statements.
December 30,
2007
December 31,
2006
ASSETS
CURRENT ASSETS:
Cash and cash equivalents $ 3,562 $ 9,946
Other receivables 4,407 1,928
Inventory 1,773 1,380
Prepaid expenses 2,737 835
Deferred income taxes 2,746 1,752
Total current assets 15,225 15,841
PROPERTY, net 40,916 36,909
GOODWILL 519 519
LONG-TERM INVESTMENTS 3,069 3,048
OTHER ASSETS 496 537
DEFERRED INCOME TAXES 10,843 10,651
TOTAL $ 71,068 $ 67,505
LIABILITIES AND STOCKHOLDERS’ EQUITY
CURRENT LIABILITIES:
Accounts payable $ 3,819 $ 2,283
Accrued expenses and other liabilities 14,010 14,937
Store closure accrual 370 84
Total current liabilities 18,199 17,304
STORE CLOSURE ACCRUAL 104 197
DEFERRED INCOME 157 200
DEFERRED RENT AND OTHER LIABILITIES 8,533 9,267
DEFERRED FRANCHISE REVENUE — 35
Total liabilities 26,993 27,003
COMMITMENTS AND CONTINGENCIES (NOTE 6)
STOCKHOLDERS’ EQUITY:
Preferred stock, $.001 par value, 5,000,000 shares authorized, no shares issued or outstanding — —
Common stock, $.001 par value, 35,000,000 shares authorized, 9,949,761 shares issued and outstanding in
2007 and 9,793,491 shares issued and outstanding in 2006 10 10
Paid-in capital 51,108 48,637
Accumulated deficit (7,043) (8,145)
Total stockholders’ equity 44,075 40,502
TOTAL $ 71,068 $ 67,505
F-3
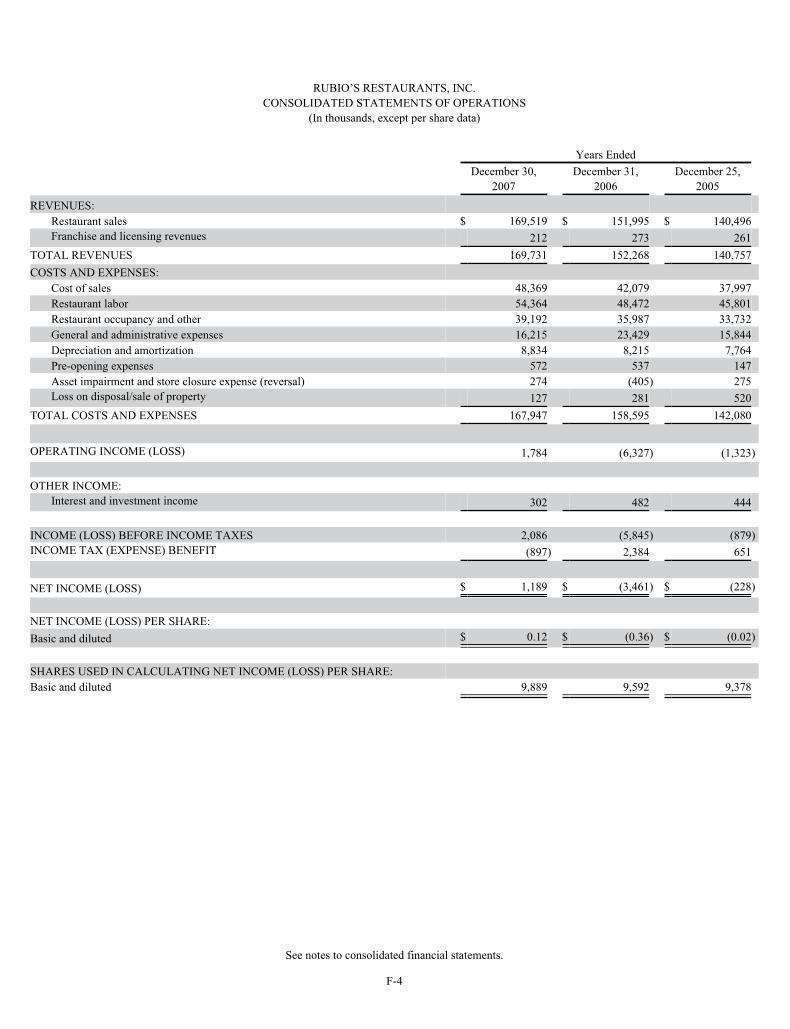
RUBIO’S RESTAURANTS, INC.
CONSOLIDATED STATEMENTS OF OPERATIONS
(In thousands, except per share data)
See notes to consolidated financial statements.
Years Ended
December 30,
2007
December 31,
2006
December 25,
2005
REVENUES:
Restaurant sales $ 169,519 $ 151,995 $ 140,496
Franchise and licensing revenues 212 273 261
TOTAL REVENUES 169,731 152,268 140,757
COSTS AND EXPENSES:
Cost of sales 48,369 42,079 37,997
Restaurant labor 54,364 48,472 45,801
Restaurant occupancy and other 39,192 35,987 33,732
General and administrative expenses 16,215 23,429 15,844
Depreciation and amortization 8,834 8,215 7,764
Pre-opening expenses 572 537 147
Asset impairment and store closure expense (reversal) 274 (405) 275
Loss on disposal/sale of property 127 281 520
TOTAL COSTS AND EXPENSES 167,947 158,595 142,080
OPERATING INCOME (LOSS) 1,784 (6,327) (1,323)
OTHER INCOME:
Interest and investment income 302 482 444
INCOME (LOSS) BEFORE INCOME TAXES 2,086 (5,845) (879)
INCOME TAX (EXPENSE) BENEFIT (897) 2,384 651
NET INCOME (LOSS) $ 1,189 $ (3,461) $ (228)
NET INCOME (LOSS) PER SHARE:
Basic and diluted $ 0.12 $ (0.36) $ (0.02)
SHARES USED IN CALCULATING NET INCOME (LOSS) PER SHARE:
Basic and diluted 9,889 9,592 9,378
F-4

RUBIO’S RESTAURANTS, INC.
CONSOLIDATED STATEMENTS OF STOCKHOLDERS’ EQUITY AND COMPREHENSIVE INCOME (LOSS)
For the Fiscal Years Ended 2007, 2006 and 2005
(In thousands, except share data)
See notes to consolidated financial statements.
Accumulated
Common Stock Other Total Total
Shares Amount
Paid-in-
Capital
Comprehensive
Income (Loss)
Accumulated
Deficit
Stockholders’
Equity
Comprehensive
Income (Loss)
Balance, December 26, 2004 9,306,449 $ 9 $ 44,172 $ 15 $ (4,456) $ 39,740
Exercise of common stock options, including related tax benefit 119,303 — 893 — — 893
Compensation expense - common stock
Options — — 9 — — 9
severance agreement — — 562 — — 562
Net loss — — — — (228) (228) $ (228)
Other comprehensive income:
Net unrealized loss on available-for-sale investments, net of
tax — — — (11) — (11) (11)
Balance, December 25, 2005 9,425,752 9 45,636 4 (4,684) 40,965 $ (239)
Exercise of common stock options, including related tax benefit 367,739 1 2,401 — — 2,402
Compensation expense - common stock
options — — 600 — — 600
Net loss — — — — (3,461) (3,461) (3,461)
Other comprehensive income:
Net unrealized loss on available-for-sale investments, net of
tax — — — (4) — (4) (4)
Balance, December 31, 2006 9,793,491 10 48,637 — (8,145) 40,502 $ (3,465)
Cumulative effective of adoption of
FIN 48 (Note 7) — — — — (87) (87)
Exercise of common stock options, including related tax benefit 156,270 — 1,228 — — 1,228
Compensation expense - common stock
options — — 1,243 — — 1,243
Net income — — — — 1,189 1,189 1,189
Balance, December 30, 2007 9,949,761 $ 10 $ 51,108 $ — $ (7,043) $ 44,075 $ 1,189
F-5

RUBIO’S RESTAURANTS, INC.
CONSOLIDATED STATEMENTS OF CASH FLOWS
(In thousands)
Years Ended
December 30,
2007
December 31,
2006
December 25,
2005
OPERATING ACTIVITIES:
Net income (loss) $ 1,189 $ (3,461) $ (228)
Adjustments to reconcile net income (loss) to net
cash provided by operating activities:
Depreciation and amortization 8,834 8,215 7,764
Share-based compensation expense 1,243 600 9
Stock compensation expense related to severance agreement — — 562
Tax benefit from share-based compensation (284) (121) —
Asset impairment and store closure expense (reversal) 274 (405) 275
Loss on disposal/sale of property 127 281 520
Provision for deferred income taxes (154) (4,544) (2,213)
Changes in assets and liabilities:
Other receivables (2,479) 941 (1,693)
Inventory (393) 10 147
Prepaid expenses (1,902) (335) 85
Other assets 41 (104) (28)
Accounts payable 1,536 205 (259)
Accrued expenses and other liabilities (927) 5,236 836
Store closure accrual (81) (149) (95)
Deferred income (43) (46) (121)
Deferred rent and other liabilities (1,853) 4,521 (458)
Deferred franchise revenue (35) 15 —
Net cash provided by operating activities 5,093 10,859 5,103
INVESTING ACTIVITIES:
Purchases of property (7,595) (7,150) (4,419)
Purchases of leasehold improvements (5,373) (6,859) (2,870)
Acquisition of franchised restaurants — (1,139) —
Proceeds from sale of property — 18 —
Purchases of investments (193) (3,137) (5,231)
Maturities of investments 172 6,809 7,231
Net cash used in investing activities (12,989) (11,458) (5,289)
FINANCING ACTIVITIES:
Proceeds from exercise of common stock options 1,228 2,402 893
Excess tax benefits from shared-based compensation 284 121 —
Net cash provided by financing activities 1,512 2,523 893
INCREASE (DECREASE) IN CASH AND CASH EQUIVALENTS (6,384) 1,924 707
CASH AND CASH EQUIVALENTS AT BEGINNING OF YEAR 9,946 8,022 7,315
CASH AND CASH EQUIVALENTS AT END OF YEAR $ 3,562 $ 9,946 $ 8,022
(continued)
F-6

RUBIO’S RESTAURANTS, INC.
CONSOLIDATED STATEMENTS OF CASH FLOWS, continued
(In thousands)
See notes to consolidated financial statements.
Years Ended
December 30,
2007
December 31,
2006
December 25,
2005
SUPPLEMENTAL DISCLOSURES OF CASH FLOWS INFORMATION:
Cash paid for income taxes $ 1,351 $ 687 $ 2,798
Non-cash investing activities:
Business acquisitions :
Assets acquired:
Property and equipment — 813 —
Goodwill — 326 —
Assets acquired — 1,139 —
Cash paid for acquisitions, net of cash acquired $ — $ 1,139 $ —
F-7
RUBIO’S RESTAURANTS, INC.
NOTES TO CONSOLIDATED FINANCIAL STATEMENTS
YEARS ENDED DECEMBER 30, 2007, DECEMBER 31, 2006 AND DECEMBER 25, 2005
NATURE OF OPERATIONS - Rubio’s Restaurants, Inc. was incorporated in California in 1985 and reincorporated in Delaware in 1997. Rubio’s
Restaurants, Inc. has two wholly-owned subsidiaries, Rubio’s Restaurants of Nevada, Inc., and Rubio’s Promotions, Inc., which was created and
incorporated in the state of Arizona in December 2007, (collectively, the Company). As of December 30, 2007, the Company owns and operates a chain of
171 restaurants, three concessions and two franchise locations, in California, Arizona, Nevada, Colorado, and Utah.
The Company’s 171 restaurants are located more specifically as follows: 71 in the greater Los Angeles, California area, 44 in the San Diego,
California area, 11 in the San Francisco, California area, 9 in the Sacramento, California area, 27 in Phoenix/Tucson, Arizona, 4 in Las Vegas, Nevada, 3
in Denver, Colorado and 2 in Salt Lake City, Utah.
BASIS OF PRESENTATION AND FISCAL YEAR - The consolidated financial statements include the accounts of Rubio’s Restaurants, Inc. and its
wholly-owned subsidiaries. All significant intercompany transactions and accounts have been eliminated in consolidation. The Company operates and
reports on a 52 or 53 week fiscal year ending on the last Sunday of December. Fiscal year 2006, which ended on December 31, 2006, included 53 weeks.
Fiscal years 2007 and 2005, which ended on December 30, 2007 and December 25, 2005, respectively, included 52 weeks. Certain prior year amounts in
the consolidated financial statements have been reclassified to conform to the fiscal 2007 presentation.
References to the Company throughout these notes to the consolidated financial statements are made using the first person notations of “we,” “us” and
“our.”
ACCOUNTING ESTIMATES - The preparation of consolidated financial statements in conformity with U.S. generally accepted accounting
principles requires management to make estimates and assumptions that affect the reported amounts of assets and liabilities and contingencies at the date
of the consolidated financial statements and the reported amounts of revenues and expenses during the year. Actual results may differ from those estimates.
CASH EQUIVALENTS - Cash equivalents consist of money market instruments purchased with an original maturity of three months or less.
INVESTMENTS - At times the Company will make investments that are composed primarily of money market instruments and mutual funds. While
it is the Company’s general intent to hold such securities until maturity, management will occasionally sell particular securities for cash flow purposes.
Therefore, pursuant to Statement of Financial Accounting Standards (SFAS) No. 115, Accounting for Certain Investments in Debt and Equity Securities,
the Company’s investments are classified as available-for-sale based upon the Company’s intent, and are accounted for at fair value. The fair value of such
investments is determined based on quoted market prices at year-end. Unrealized gains and losses on these investments are included as accumulated other
comprehensive income in the consolidated statements of stockholders’ equity and comprehensive income (loss), net of income taxes. Realized gains and
losses on investments sold are determined based on the specific-identification method and are included in interest and investment income. Short-term
investments are investments with original maturities of greater than three months and remaining maturities of less than one year, or investments that are
reasonably expected to be realized in cash or consumed in operations over the next year.
Realized and unrealized gains (losses) on available-for-sale investments were not material for all years presented. As of December 30, 2007 and
December 31, 2006, the fair market value of the Company’s investments was not significantly different from the amortized cost.
Long-term investments valued at $3.1 million at December 30, 2007 and $3.0 million at December 31, 2006 are restricted cash, pledged as collateral
for a standby letter of credit related to the Company’s workers’ compensation policy. These pledged collateral accounts are invested in instruments with
maturities of one year or less but are classified on the Company’s consolidated balance sheet as long-term assets because these investments are restricted,
automatically renewed and reinvested each year. This cash will not be used within a year (Note 5).
1. SUMMARY OF SIGNIFICANT ACCOUNTING POLICIES
F-8

INVENTORY - Inventory consists of food, beverage, paper and restaurant supplies, and is stated at the lower of cost (first-in, first-out method) or
market value.
PROPERTY - Property is stated at cost. A variety of costs are incurred in the leasing and construction of restaurant facilities. The costs of buildings
under development include specifically identifiable costs. The capitalized costs include development costs, construction costs, salaries and related costs,
and other costs incurred during the acquisition or construction stage. Salaries and related costs capitalized totaled $323,000, $81,000 and $51,000 for fiscal
years 2007, 2006 and 2005, respectively. Depreciation and amortization of buildings, leasehold improvements and equipment are computed using the
straight-line method over the shorter of the estimated useful lives of the assets or the initial lease term for certain leased properties (buildings and
improvements range from 1 to 20 years, and equipment 3 to 7 years). For leases with renewal periods at the Company’s option, the Company generally
uses the original lease term, excluding renewal option periods to determine useful lives; if failure to exercise a renewal option imposes an economic
penalty to the Company, management may determine at the inception of the lease that renewal is reasonably assured and include the renewal option period
in the determination of appropriate estimated useful lives. The Company’s policy requires lease-term consistency when calculating the depreciation period,
in classifying the lease and in computing straight-line rent expense.
GOODWILL - Goodwill, which represents the excess of the cost of acquired businesses over the fair value of amounts assigned to assets acquired and
liabilities assumed, is not amortized. Instead, goodwill is assessed for impairment under SFAS No. 142, Goodwill and Other Intangible Assets. SFAS No.
142 requires goodwill to be tested annually at the same time every year, and when an event occurs or circumstances change, such that it is reasonably
possible that an impairment may exist. The Company selected its fiscal year-end as its annual date. As a result of the Company’s assessment at December
30, 2007 and December 31, 2006, no impairment was indicated (Note 3).
ASSET IMPAIRMENT AND STORE CLOSURE EXPENSE (REVERSAL) - The Company evaluates the carrying value of long-lived assets for
impairment when a restaurant experiences a negative event, including, but not limited to, a significant downturn in sales, a substantial loss of customers, an
unfavorable change in demographics or a store closure. Upon the occurrence of a negative event, the Company estimates the future undiscounted cash
flows for the individual restaurants that are affected by the negative event. If the projected undiscounted cash flows do not exceed the carrying value of the
assets at each restaurant, the Company recognizes an impairment loss to reduce the assets’ carrying amounts to their estimated fair values (for assets to be
held and used) and fair value less cost to sell (for assets to be disposed of) based on the estimated discounted projected cash flows derived from the
restaurant. The most significant assumptions in the analysis are those used to estimate a restaurant’s future cash flows. The Company generally uses the
assumptions in its strategic plan and modifies them as necessary based on restaurant-specific information.
The Company makes decisions to close stores based on their cash flows and anticipated future profitability. The Company records losses associated
with the closure of restaurants at the time the unit is closed. These store closure charges primarily represent a liability for the future lease obligations after
the expected closure dates, net of estimated sublease income, if any.
SELF-INSURANCE LIABILITIES - The Company is self-insured for a portion of its workers’ compensation insurance program. Maximum self-
insured retention, including defense costs per occurrence is $350,000. Insurance liabilities are accounted for based on independent actuarial estimates of
the amount of loss incurred. These estimates rely on actuarial observations of industry-wide and Company historical claim loss development, and are
subject to change based on actual loss development.
DEFERRED RENT AND OTHER LIABILITIES - Rent expense on operating leases with scheduled or minimum rent increases is expensed on the
straight-line basis over the initial lease term, which includes the period of time from when the Company takes possession of the leased space until the store
opening date (the build-out period). Deferred rent represents the excess of rent charged to expense over rent payable under the lease agreement. In
connection with certain of the Company’s leases, the landlord has provided the Company with tenant improvement allowances. These lease incentives, as
well as rent holidays, are recorded as long-term liabilities in “Deferred rent and other liabilities” and are amortized over the initial lease term as reductions
to rent expense.
FINANCIAL INSTRUMENTS - The carrying values of cash and cash equivalents, receivables, accounts payable and accrued expenses approximate
fair values due to the short-term nature of these instruments. At December 30, 2007 and December 31, 2006, the Company had no material financial
instruments subject to significant market exposure.
F-9
REVENUE RECOGNITION - Revenues from the operation of company-owned restaurants are recognized when sales occur. Franchise revenue is
comprised of: i) area development fees, ii) new store opening fees, and iii) royalties. Fees received pursuant to area development agreements under
individual franchise agreements, which grant the right to develop franchised restaurants in future periods in specific geographic areas, are deferred and
recognized as revenue on a pro rata basis as the individual franchised restaurants subject to the development agreements are opened. New store opening
fees are recognized as revenue in the period a franchised location opens. Royalties from franchised restaurants are recorded in revenue as earned. The
Company recognizes a liability upon the sale of its gift cards and recognizes revenue when these gift cards are redeemed in its restaurants. Revenues from
the portion of the gift cards that is not expected to be redeemed (breakage) are recognized ratably over three years based on historical and expected
redemption trends. This adjustment is classified as revenues in the Company’s consolidated statements of operations.
Revenue is reported using the net method under Emerging Issues Tax Force bulletin 06-3 How Taxes Collected from Customers and Remitted to
Governmental Authorities Should be Presented in the Income Statement (That Is, Gross versus Net Presentation), (EITF 06-3). EITF 06-3 indicates that
the statement of operations presentation on either a gross basis or a net basis of the taxes within the scope of the issue is an accounting policy decision.
STORE PRE-OPENING EXPENSES - Costs incurred in connection with the training of personnel, occupancy during the build-out period, and
promotion of new store openings are expensed as incurred.
ADVERTISING - Advertising costs incurred to produce media advertising for new campaigns are expensed in the year in which the advertising first
takes place. Other advertising costs are expensed when incurred. Advertising costs are included in restaurant occupancy and other expenses and totaled
$5.0 million for fiscal year 2007, $5.3 million for fiscal year 2006 and $6.0 million for fiscal year 2005.
INCOME TAXES - Deferred tax assets and liabilities are recognized for the future tax consequences attributable to differences between the financial
statement carrying amounts of existing assets and liabilities and their respective tax basis, as well as tax loss and credit carry forwards. Deferred tax assets
and liabilities are measured using enacted tax rates expected to apply to taxable income in the years in which those temporary differences are expected to
be recovered or settled. The Company adopted FASB Interpretation No. 48, Accounting for Uncertainty in Income Taxes - an interpretation of FASB
Statement No. 109, (FIN 48) effective at the beginning of fiscal 2007. FIN 48 specifies the accounting for uncertainties in income taxes by prescribing a
recognition threshold and measurement attribute for the financial statement recognition and measurement of a tax position taken or expected to be taken in
a tax return.
SHARE-BASED PAYMENT - As of December 26, 2005, the Company adopted Statement No. 123(R), Share-Based Payment, (SFAS 123R) using
the modified prospective transition method. Under this method, compensation expense is recognized for new grants beginning in fiscal 2006 and any
unvested grants prior to the adoption of SFAS 123R. The Company recognizes compensation expense on a straight-line basis over the employee's vesting
period or to the date of the employee's eligibility for retirement, if earlier. In accordance with the modified prospective transition method, the consolidated
financial statements for prior periods have not been restated.
SFAS 123R requires the Company to estimate forfeitures in calculating the expense relating to share-based compensation as opposed to recognizing
forfeitures as an expense reduction as they occur. The adjustment to apply estimated forfeitures to previously recognized share-based compensation was
considered immaterial and as such was not classified as a cumulative effect of a change in accounting principle. SFAS 123R also requires companies to
calculate an initial “pool” of excess tax benefits available at the adoption date to absorb any tax deficiencies that may be recognized under SFAS 123R.
The pool includes the net excess tax benefits that would have been recognized if the Company had adopted SFAS 123 for recognition purposes on its
effective date.
The Company elected to calculate the pool of excess tax benefits under the alternative transition method described in FASB Staff Position (FSP) 123-
3, Transition Election Related to Accounting for Tax Effects of Share-Based Payment Awards, which also specifies the method it must use to calculate
excess tax benefits reported on the consolidated statements of cash flows. The excess tax benefits from share-based payment arrangements classified as
financing cash flows of $284,000 and $121,000 for the years ended December 30, 2007 and December 31, 2006, respectively, would not have been
materially different if the Company had not adopted SFAS 123R; however, they would have been classified as operating cash flows rather than as
financing cash flows.
F-10

As a result of adopting SFAS 123R, the Company’s income (loss) before income taxes and net income (loss) were $1,243,000 and $752,000 lower,
respectively in 2007 and $600,000 and $361,000 higher, respectively, in 2006, than if the share-based compensation was still accounted for under
Accounting Principles Board Opinion No. 25, Accounting for Stock Issued to Employees (APB Opinion No. 25). The recognized tax benefit was $491,000
for fiscal 2007 and $239,000 for fiscal 2006. In addition, the Company’s basic and diluted net income per share decreased by $0.08 for fiscal 2007 and its
basic and diluted net loss per share for fiscal 2006 increased by $0.04.
Prior to fiscal year 2006, stock awards were accounted for under APB Opinion No. 25 using the intrinsic method, whereby compensation expense was
recognized for the excess, if any, of the quoted market price of the Company’s common stock at the date of grant over the exercise price. The Company
applied the disclosure provisions of SFAS 123R, as amended, as if the fair value based method had been applied in measuring compensation expense.
The following table summarizes the impact on the Company’s net (loss) income had compensation cost been determined based upon the fair value at
the grant date for awards under the stock option plans consistent with the methodology prescribed under SFAS No. 123R (in thousands, except per share
data):
Refer to Note 8, Share-Based Employee Compensation Plans, for information regarding the assumptions used by the Company in valuing its stock
options.
COMMON STOCK AND EARNINGS PER SHARE - Basic earnings per share is computed by dividing net income or loss by the weighted average
number of common shares outstanding during the period. Diluted earnings per share is computed similar to basic earnings per share, except that the
weighted average number of shares of common stock outstanding is increased to include the effect of potentially dilutive common shares, which are
comprised of stock options and restricted stock awards granted to employees under equity-based compensation plans that were outstanding during the
period. Potentially dilutive common shares are excluded from the diluted earnings per share computation when their effect would be anti-dilutive (Note
10).
CONCENTRATION OF CREDIT RISK - The Company invests its excess cash in money market accounts. The Company has not experienced any
material losses on its cash accounts or other investments.
NEW ACCOUNTING STANDARDS
In September 2006, the FASB issued Statement No. 157, Fair Value Measures (SFAS 157). SFAS 157 defines fair value, establishes a framework for
measuring fair value and enhances disclosures about fair value measures required under other accounting pronouncements, but does not change existing
guidance as to whether or not an instrument is carried at fair value. SFAS No. 157 is effective for fiscal years beginning after November 15, 2007, the year
beginning December 31, 2007 for the Company. In November 2007, the FASB proposed a one-year deferral of SFAS 157's fair-value measurement
requirements for nonfinancial assets and liabilities that are not required or permitted to be measured at fair value on a recurring basis. The adoption of this
standard is not expected to have a material impact on the Company’s consolidated financial statements.
In February 2007, the FASB issued Statement No. 159, The Fair Value Option for Financial Assets and Financial Liabilities-including an Amendment
of FASB Statement No. 115 (SFAS 159). SFAS 159 permits entities to choose to measure many financial instruments and certain other items at fair value.
The Company has elected not to use the fair value measurement provisions of SFAS 159.
2005
Net income (loss), as reported $ (228)
Deduct: Total stock-based employee compensation expense
determined under fair value based method for all awards,
net of related tax effects 1,639
Pro forma net income (loss) $ (1,867)
Income (loss) per share:
Basic - as reported $ (0.02)
Basic - pro forma (0.20)
Diluted - as reported (0.02)
Diluted - pro forma (0.20)
F-11

In December 2007, the FASB issued Statement No. 141R (revised 2007), Business Combinations (SFAS 141R). SFAS 141R will change the accounting for business combinations. Under SFAS 141R, an acquiring entity will be required to recognize all the assets acquired and liabilities assumed in a transaction at the acquisition-date fair value with limited exceptions. SFAS 141R will change the accounting treatment and disclosures for certain specific items in a business combination. SFAS 141R becomes effective for the Company at the beginning of 2009. The Company is still evaluating the impact of SFAS 141R on its financial position or results of operations.
In December 2007, the FASB issued Statement No. 160, Noncontrolling Interest in Consolidated Financial Statements (SFAS 160). SFAS 160 clarifies that a non-controlling interest in a subsidiary is an ownership interest in the consolidated entity that should be reported as equity in the consolidated financial statements. This statement also requires consolidated net income to be reported at amounts that include the amounts attributable to both the parent and the non-controlling interest and requires disclosure, on the face of the consolidated statement of income, of the amounts of consolidated net income attributable to the parent and to the non-controlling interest. In addition, this statement establishes a single method of accounting for changes in a parent’s ownership interest in a subsidiary that does not result in deconsolidation and requires that a parent recognize a gain or loss in net income when a subsidiary is deconsolidated. SFAS 160 becomes effective for the Company at the beginning of 2009. This statement will be applied prospectively, except for the presentation and disclosure requirements, which will be applied retrospectively for all periods presented. The Company does not currently have any minority or non-controlling interests in a subsidiary and it does not expect SFAS 160 to have an impact on its consolidated financial statements; however, transactions between now and the adoption date of SFAS 160 could have an impact on its consolidated financial statements.
2. CONSOLIDATED BALANCE SHEET DETAILS as of December 30, 2007 and December 31, 2006, respectively (in thousands):
2007 2006
OTHER RECEIVABLES:
Tenant improvement receivables $ 874 $ 255
Beverage usage receivables 227 256
Interest receivables 24 42
Credit cards 1,005 846
Income taxes 687 27
Food supplier receivable 917 106
Other 673 396
Total $ 4,407 $ 1,928
INVESTMENTS:
Money Market $ 3,069 $ 3,048
Less: short-term investments — —
Long-term investments $ 3,069 $ 3,048
PROPERTY - at cost:
Building and leasehold improvements $ 57,030 $ 52,161
Equipment and furniture 42,280 38,982
Construction in process 4,696 1,387
104,006 92,530
Less: accumulated depreciation and amortization (63,090) (55,621)
Total $ 40,916 $ 36,909
ACCRUED EXPENSES AND OTHER LIABILITIES:
Compensation $ 2,654 $ 2,764
Workers’ compensation 2,244 2,629
Sales taxes 1,065 1,371
Vacation pay 938 795
Advertising 135 105
Franchise repurchase — 440
Gift cards 845 1,097
Occupancy 998 1,019
Legal and settlement fees regarding class action litigation (Note 6) 2,551 3,041
Other 2,580 1,675
Total $ 14,010 $ 14,937
DEFERRED RENT AND OTHER LIABILITIES:
Deferred rent $ 2,620 $ 2,745
Deferred tenant improvement allowances 1,839 1,352
FIN 48 liability (Note 7) 1,150 —
Legal and settlement fees regarding class action litigation (Note 6) 2,500 5,000
Other 424 169
Total $ 8,533 $ 9,267
F-12

On June 19, 2006, the Company acquired the assets of four previously franchised locations for a total cost of $645,000. The purchase price was
allocated to the assets acquired based upon their estimated fair values consisting of $590,000 related to leasehold improvements and $55,000 related to
furniture and equipment. There was no goodwill in conjunction with the acquisition.
On December 28, 2006, the Company acquired the assets of a previously franchised location for a total cost of $494,000. The purchase price was
allocated to the assets acquired based upon their estimated fair values consisting of $150,000 related to leasehold improvements and $18,000 related to
furniture and equipment. Goodwill in the amount of $326,000 was recognized in conjunction with the acquisition.
Both acquisitions were accounted for under the purchase method of accounting, and the results of each of the restaurant’s operations have been
included in the consolidated financial statements since the acquisition date.
The Company recorded a net asset impairment and store closure accrual of $274,000 during fiscal 2007. This charge was the net effect of a reduction
to store closure of $19,000 for the sub-lease income for a Salt Lake City, Utah location, which closed in 2001, combined with a charge to impairment of
$229,000, for the closure of a Los Angeles, California area restaurant and a $64,000 adjustment to anticipated sublease income for a restaurant in the
Denver, Colorado area that closed in 2001.
The Company recorded a net store closure reversal of $405,000 during fiscal 2006. The reversal was comprised of $223,000 due to the Company
entering into a new sublease agreement at its Portland, Oregon location, while $158,000 was to reflect additional sublease income received. An additional
reversal of $24,000 was recorded in the second quarter of 2006.
The Company recorded a net asset impairment and store closure accrual of $275,000 during fiscal 2005. This charge was the net effect of a charge to
impairment of $288,000, based primarily on the closure of the Portland, Oregon restaurant, combined with a reversal to store closure of $13,000.
The components of the store closure accrual in fiscal 2005, 2006 and 2007 are as follows (in thousands):
3. ACQUISITIONS OF FRANCHISED LOCATIONS
4. ASSET IMPAIRMENT AND STORE CLOSURE ACCRUAL
Accrual
Balance at
December 26,
2004
Store Closure
Expense
Store Closure
Reversal Usage
Accrual
Balance at
December 25,
2005
Accrual for stores closed in 2001 $ 338 $ — $ — $ (66) $ 272
Accrual for stores closed in 2002 317 — (13) (29) 275
Accrual for stores closed in 2005 — 288 — — 288
Total store closure accrual 655 $ 288 $ (13) $ (95) 835
Less: current portion (114) (179)
Non-current $ 541 $ 656
F-13

LETTER OF CREDIT - As of December 30, 2007 and December 31, 2006, the Company obtained a letter of credit in the amount of $2.9 million
related to the Company’s workers’ compensation insurance policy. The letter of credit is subject to automatic one-year extensions from the expiration date
and thereafter, unless notification is made prior to the expiration date. The Company was also required, under the terms of the letters of credit, to pledge
collateral of $3.0 million in 2007 and 2006 (Note 1).
OPERATING LEASES - The Company leases restaurant and office facilities, land, vehicles and office equipment under various operating leases
expiring through 2017. The leases generally provide renewal options from 3 to 10 years. Certain leases are subject to scheduled annual increases or
minimum annual increases based upon the consumer price index, not to exceed specific maximum amounts. Certain leases require contingent percentage
rents based upon sales and other leases pass through common area charges to the Company. Rental expense under these operating leases was $17.8
million, $16.0 million, and $14.6 million for fiscal years 2007, 2006 and 2005, respectively. Contingent percentage rent based on sales included in rental
expense was $666,000, $751,000 and $563,000 for fiscal years 2007, 2006 and 2005, respectively.
Accrual
Balance at
December 25,
2005
Store Closure
Expense
Store Closure
Reversal Usage
Accrual
Balance at
December 31,
2006
Accrual for stores closed in 2001 $ 272 $ — $ (24) $ (54) $ 194
Accrual for stores closed in 2002 275 — (158) (9) 108
Accrual for stores closed in 2005 288 — (223) (87) (21)
Total store closure accrual 835 $ — $ (405) $ (149) 281
Less: current portion (179) (84)
Non-current $ 656 $ 197
Accrual
Balance at
December 31,
2006
Store Closure
Expense
Store Closure
Reversal Usage
Accrual
Balance at
December 30,
2007
Accrual for stores closed in 2001 $ 194 $ 64 $ (19) $ (52) $ 187
Accrual for stores closed in 2002 108 — — (29) 79
Accrual for stores closed in 2005 (21) — — — (21)
Accrual for stores closed in 2008 — 229 — — 229
Total store closure accrual 281 $ 293 $ (19) $ (81) 474
Less: current portion (84) (370)
Non-current $ 197 $ 104
5. CREDIT FACILITIES
6. COMMITMENTS AND CONTINGENCIES
F-14

Future minimum annual lease commitments, including obligations for closed stores and minimum future sublease rentals expected to be received as of
December 30, 2007 are as follows (in thousands):
LITIGATION - In March 2007, the Company reached an agreement to settle a class action lawsuit related to how it classified certain employees under
California overtime laws. The lawsuit was similar to numerous lawsuits filed against restaurant operators, retailers and others with operations in
California. The settlement agreement, which was approved by the court in June 2007, provides for a settlement payment of $7.5 million payable in three
installments. The first $2.5 million installment was paid on August 31, 2007. The second $2.5 million installment is due on or before December 28,
2008. The third and final installment of $2.5 million is due on or before June 28, 2010. The settlement resulted in a one-time pre-tax charge of $8.0
million in the fourth quarter of fiscal 2006, which includes the settlement amount and legal costs incurred related to this agreement. In fiscal 2006, the
$8.0 million settlement liability was accrued on the consolidated balance sheet in “Accrued expenses and other liabilities” and “Deferred rent and other
liabilities” in the amounts of $3.0 million and $5.0 million, respectively. As of December 30, 2007, the remaining balance of $5.0 million, plus accrued
interest of $50,000, was accrued in “Accrued expenses and other liabilities” and “Deferred rent and other liabilities” in the amounts of $2.6 million and
$2.5 million, respectively. The Company recently learned that approximately 160 current and former employees who qualified to participate as class
members in this class action settlement were not included in the settlement list approved by the court, and some number of these individuals may file
claims to participate in the class action. The Company intends, during the second quarter of 2008, to file a motion requesting the court to include these
individuals in the approved settlement and to provide that their claims are payable out of the aggregate settlement payment. There is no assurance that the
court will grant the Company’s request.
On March 24, 2005, a former employee of the Company filed a California state court action alleging that the Company failed to provide the former
employee with certain meal and rest period breaks and overtime pay. The parties moved the matter into arbitration, and the former employee amended the
complaint to claim that the former employee represents a class of potential plaintiffs. The amended complaint alleges that current and former shift leaders
who worked in the Company's California restaurants during specified time periods worked off the clock and missed meal and rest breaks. This case is still
in the pre-class certification discovery stage, and no class has been certified. The Company denies the former employee’s claims, and intends to continue
to vigorously defend this action. Regardless of merit or eventual outcome, this arbitration may cause a diversion of our management's time and attention
and the expenditure of legal fees and expenses. An unfavorable outcome in this matter could have a material impact on our financial position and results
of operations.
The Company is involved in various other claims and legal actions arising in the ordinary course of business. In the opinion of management, the
ultimate disposition of these matters will not have a material adverse effect on the Company’s consolidated financial position, results of operations, or
liquidity.
FISCAL YEAR
Company
operated retail
locations and
other
Sublease
income (A)
2008 $ 14,559 $ (489)
2009 12,973 (699)
2010 10,336 (656)
2011 7,283 (263)
2012 5,343 (165)
Thereafter 15,081 (218)
$ 65,575 $ (2,490)
(A) The Company has subleased buildings to others, primarily as a result of closing certain underperforming company-operated locations. These
leases provide for fixed payments with contingent rents when sales exceed certain levels. Sublessees generally bear the cost of maintenance,
insurance, and property taxes. The Company directly pays the rent on these master leases, and then collects associated sublease rent amounts
from its sublessees. These obligations are the responsibility of the Company should the subleasee not perform under the sublease.
F-15

EMPLOYEE SAVINGS PLAN - The Company has a defined contribution 401(k) plan. This plan allows eligible employees to contribute a percentage
of their salary, subject to annual limits, to the plan. The Company matches 25% of each eligible employee’s contributions up to 6% of gross salary. The
Company’s contributions vest over a five-year period. The Company contributed $73,000, $48,000 and $77,000 for fiscal years 2007, 2006 and 2005,
respectively.
The components of the income tax (expense) benefit for fiscal years 2007, 2006 and 2005 are as follows (in thousands):
The income tax (expense) benefit differs from the federal statutory rate because of the effect of the following items for fiscal years 2007, 2006 and
2005:
In 2005, the effective state benefit rate significantly increased as a result of tax-exempt interest and California targeted employment tax credits
claimed during 2005 for the 2005 tax year and, on amended returns, for all prior years not subject to a statute of limitation. These credit claims resulted
from a state tax credit study the Company concluded during 2005. Additionally, the Company recorded a benefit in 2005 for a California Alternative
Minimum Tax Credit carryforward from prior years that it had not previously recorded, which was immaterial to the consolidated financial statements. In
2006, the effective state tax benefit rate was higher than the statutory state rate net of federal tax benefit as a result of California targeted employment tax
credit claimed. The reacquisition of locations in Nevada shifted some of the Company’s operations into a jurisdiction that does not impose income taxes.
In 2007, the Company reduced its blended statutory state tax rate to 5.6% (net of federal benefit for state taxes) to reflect this shift. Because FAS 109
requires the valuation of deferred tax assets at the tax rate at which the Company expects to recover them, the Company wrote down its state deferred tax
asset to reflect the lower state tax rate. The result was a one-time charge to the provision that increased the Company’s overall effective state tax rate by
3.2%.
For the years ended December 30, 2007 and December 31, 2006, the Company’s combined federal and state income tax receivables were $687,000
and $27,000, respectively.
Deferred income taxes are provided to reflect temporary differences in the basis of net assets for income tax and financial reporting purposes, as well
as available tax credits. The tax-effected temporary differences and credit carryforwards comprising the Company’s deferred income taxes as of December
30, 2007 and December 31, 2006 are as follows (in thousands):
7. INCOME TAXES
2007 2006 2005
Federal (expense) benefit:
Current $ (799) $ (1,788) $ (1,282)
Deferred 233 3,637 1,486
State (expense) benefit:
Current (222) (372) (280)
Deferred (59) 907 727
Interest expense, gross of tax benefits (50) — —
Total income tax (expense) benefit $ (897) $ 2,384 $ 651
2007 2006 2005
Statutory rate 34.0% 34.0% 34.0%
State income taxes, net of federal benefit 9.1 6.0 25.2
State alternative minimum tax credit, net of federal benefit 0.0 0.0 8.2
Interest expense, net of tax benefits 1.4 0.0 0.0
Non-deductible items 0.5 (0.2) (1.0)
Credits (2.7) 1.0 2.9
Tax-exempt interest 0.0 0.0 4.8
Other 0.7 0.0 0.0
Effective tax (expense) benefit rate 43.0% 40.8% 74.1%
F-16

The Company has State Enterprise Zone credit carryforwards as of December 30, 2007 and December 31, 2006 of $230,000 and $233,000,
respectively. State income tax credits will carry forward indefinitely and may be used to offset future State income tax. The Company believes that the
remaining deferred tax assets will be realized through future taxable income or alternative tax strategies.
The Company adopted FIN 48 effective January 1, 2007 and as of the date of adoption established a total amount of unrecognized tax benefits of $1.1
million, exclusive of accrued interest. Of this total, $11,000 related to permanent differences and resulted in a reduction, net of federal tax benefits of
$7,000 to the Company’s opening retained earnings as of the adoption date. The remainder of this balance consisted of temporary differences and resulted
in the creation of additional deferred tax assets. A reconciliation of the beginning and ending amount of unrecognized tax benefits is as follows (in
thousands):
As of December 30, 2007, the unrecognized tax benefits, net of their federal tax benefits, that would negatively impact the Company’s effective tax
rate if recognized were $7,000.
A significant portion of the Company’s balance of unrecognized tax benefits as of December 30, 2007 related to an uncertain tax position for worker’s
compensation costs. In the fourth quarter of 2007, the Company filed a request to change its accounting method for this tax position with the IRS. If the
IRS approves the request, the Company will be required to increase its current tax expense over a four-year period beginning with its 2007 tax return. It is
reasonably possible that this outcome would reduce the Company’s balance of unrecognized tax benefits by a range of $900,000 to $1 million in the next
12 months. The Company is not aware of any other event that might significantly impact the balance of unrecognized tax benefits in that period.
As of December 30, 2007, the Company’s open tax years for federal purposes are 2004, 2005, 2006 and 2007. The Company’s open years for
California are 2001 through 2007. As of December 30, 2007, the only tax years under examination by a major tax jurisdiction were the Company’s 2003
and 2004 tax years. At this time, the examining jurisdiction had not communicated any proposed adjustments to the Company’s tax liabilities and the
Company expects to finalize the examination without material adjustment by mid-2008.
The Company has historically classified interest expense and penalties on income tax liabilities and interest income on income tax refunds as
additional income tax expense or benefit, respectively and will continue to do so under FIN 48. As of the adoption of FIN 48, the Company accrued
$131,000 of interest expense, gross of its related tax benefits and recorded $87,000 net of tax to cumulative effect of adoption of FIN 48 in the
accompanying statement of stockholders’ equity and comprehensive income (loss). During the year 2007, the Company accrued additional interest of
$50,000 related to its unrecognized tax benefits and had a balance of accrued interest of $181,000 as of December 30, 2007.
2007 2006
Accruals currently not deductible $ 1,626 $ 678
Deferred rent 1,222 1,294
Difference between book and tax basis of property 7,579 6,430
State taxes 224 291
Deferred compensation 939 474
Deferred income 6 80
Accrued legal settlement 1,979 3,203
Other 14 (47)
Net deferred income tax asset $ 13,589 $ 12,403
Net current deferred income tax asset $ 2,746 $ 1,752
Net non-current deferred income tax asset $ 10,843 $ 10,651
Balance at January 1, 2007 $ 1,121
Gross increases for tax positions taken in prior years 39
Gross decreases for tax positions taken in prior years (308)
Gross increases for tax positions taken in the current year 192
Balance at December 30, 2007 $ 1,044
F-17

1999 STOCK INCENTIVE PLAN - On March 18, 1999 and March 24, 1999, the Board of Directors and the stockholders, respectively, of the
Company approved the 1999 Stock Incentive Plan (the 1999 Plan). All outstanding options under the 1995 Stock Option/Stock Issuance Plan and the 1998
Stock Option/Stock Issuance Plan (collectively, the “predecessor plans”) were incorporated into the 1999 Plan. No further grants will be made under the
predecessor plans. The 1999 Plan is administered by the Company’s Compensation Committee with respect to the officers and directors of the Company
and by the Company’s Board of Directors with respect to other eligible employees and consultants of the Company (the Compensation Committee or the
Board of Directors, as applicable, the “1999 Plan Administrator”).
The stock issuable under the 1999 Plan consists of shares of authorized but unissued or reacquired common stock, including shares repurchased by the
Company on the open market. A total of 3,625,113 shares of common stock are currently authorized for issuance under the 1999 Plan, which includes the
shares subject to outstanding options under the predecessor plans. The number of shares of common stock reserved for issuance under the 1999 Plan will
automatically increase on the first trading day in January each year. The increase will be equal to 3% of the total number of shares of common stock
outstanding as of the last trading day in December of the preceding year, not to exceed 450,000 shares in any given year. In addition, no participant in the
1999 Plan may be granted stock options, separately exercisable stock appreciation rights and direct stock issuances for more than 500,000 shares of
common stock in the aggregate per calendar year. Each option has a maximum term of 10 years, or 5 years in the case of any greater than 10% stockholder,
and is subject to earlier termination in the event of the optionee’s termination of service.
The 1999 Plan is divided into five separate components: (1) the discretionary option grant program, (2) the stock issuance program, (3) the salary
investment option grant program, (4) the automatic option grant program and (5) the director fee option grant program. The salary investment option grant
program has never been implemented, and the automatic option grant program and the director fee option grant program have been discontinued.
The discretionary option grant and stock issuance programs provide for the issuance of incentive and non-statutory options for eligible employees and
service providers, and stock issuances and share right awards, including restricted stock units, for cash or in consideration for services rendered. The option
exercise price per share is fixed by the 1999 Plan Administrator in accordance with the following provisions: (1) the exercise price shall not be less than
100% of the fair market value per share of the common stock on the date of grant, and (2) if the person to whom the option is granted is a greater-than-
10%-stockholder, then the exercise price per share shall not be less than 110% of the fair market value per share of the common stock on the date of grant.
Each option shall be exercisable at such time or times, during such period and for such number of shares as shall be determined by the 1999 Plan
Administrator as set forth in the related individual option agreements. Generally, options granted under the 1999 Plan have become exercisable at a rate of
20% after one year of service, with the balance becoming exercisable monthly over the next four years. Since 2003, the Company has granted options to
eligible employees that became exercisable over various shorter periods of time. Stock issuances and share right awards, including restricted stock units,
may be issued for past services rendered to the Company without any cash payment. In addition, the 1999 Plan Administrator can determine a purchase
price to be paid in cash or check that will not be less than the fair market value of the common stock on the issuance date.
The salary investment option grant program, if implemented, would be available to executive officers and other highly compensated eligible
employees. However, in October 2004, Congress enacted Internal Revenue Code Section 409A, which imposes difficult conditions on participants under
the salary investment option grant program. For this reason, it is unlikely the Company will implement the salary investment option grant program.
The automatic option grant program was available to non-employee board members through 2005. Eligible individuals would automatically receive an
option grant for 15,000 to 25,000 shares on the date of their initial election to the board provided that they had not been previously employed by the
Company. In addition, in the past, at the date of each annual meeting of stockholders, each non-employee board member would automatically be granted
an option to purchase 5,000 shares of common stock, provided that the individual had served on the board for at least six months. All grants under the
automatic option grant program vested immediately upon issuance. The exercise price per share was equal to 100% of the fair market value of the common
stock on the date of grant. In April 2006, the Company’s board indefinitely suspended the annual option grants under the automatic option grant program.
8. SHARE-BASED COMPENSATION PLANS
F-18
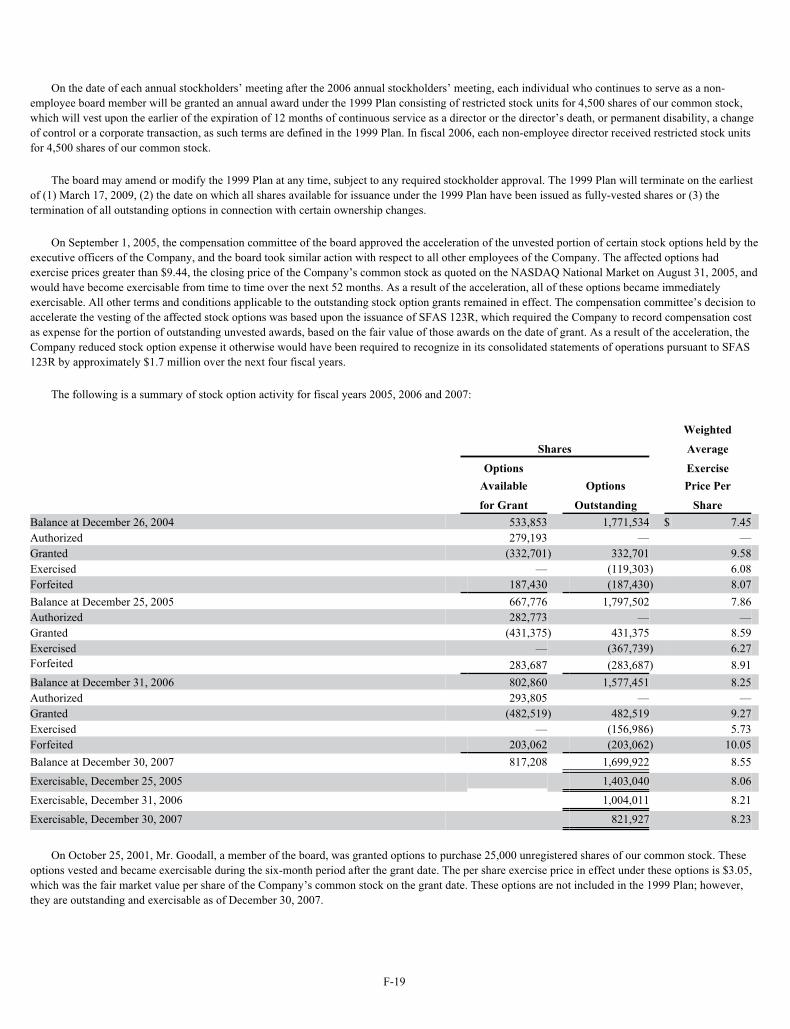
On the date of each annual stockholders’ meeting after the 2006 annual stockholders’ meeting, each individual who continues to serve as a non-
employee board member will be granted an annual award under the 1999 Plan consisting of restricted stock units for 4,500 shares of our common stock,
which will vest upon the earlier of the expiration of 12 months of continuous service as a director or the director’s death, or permanent disability, a change
of control or a corporate transaction, as such terms are defined in the 1999 Plan. In fiscal 2006, each non-employee director received restricted stock units
for 4,500 shares of our common stock.
The board may amend or modify the 1999 Plan at any time, subject to any required stockholder approval. The 1999 Plan will terminate on the earliest
of (1) March 17, 2009, (2) the date on which all shares available for issuance under the 1999 Plan have been issued as fully-vested shares or (3) the
termination of all outstanding options in connection with certain ownership changes.
On September 1, 2005, the compensation committee of the board approved the acceleration of the unvested portion of certain stock options held by the
executive officers of the Company, and the board took similar action with respect to all other employees of the Company. The affected options had
exercise prices greater than $9.44, the closing price of the Company’s common stock as quoted on the NASDAQ National Market on August 31, 2005, and
would have become exercisable from time to time over the next 52 months. As a result of the acceleration, all of these options became immediately
exercisable. All other terms and conditions applicable to the outstanding stock option grants remained in effect. The compensation committee’s decision to
accelerate the vesting of the affected stock options was based upon the issuance of SFAS 123R, which required the Company to record compensation cost
as expense for the portion of outstanding unvested awards, based on the fair value of those awards on the date of grant. As a result of the acceleration, the
Company reduced stock option expense it otherwise would have been required to recognize in its consolidated statements of operations pursuant to SFAS
123R by approximately $1.7 million over the next four fiscal years.
The following is a summary of stock option activity for fiscal years 2005, 2006 and 2007:
On October 25, 2001, Mr. Goodall, a member of the board, was granted options to purchase 25,000 unregistered shares of our common stock. These
options vested and became exercisable during the six-month period after the grant date. The per share exercise price in effect under these options is $3.05,
which was the fair market value per share of the Company’s common stock on the grant date. These options are not included in the 1999 Plan; however,
they are outstanding and exercisable as of December 30, 2007.
Weighted
Shares Average
Options Exercise
Available Options Price Per
for Grant Outstanding Share
Balance at December 26, 2004 533,853 1,771,534 $ 7.45
Authorized 279,193 — —
Granted (332,701) 332,701 9.58
Exercised — (119,303) 6.08
Forfeited 187,430 (187,430) 8.07
Balance at December 25, 2005 667,776 1,797,502 7.86
Authorized 282,773 — —
Granted (431,375) 431,375 8.59
Exercised — (367,739) 6.27
Forfeited 283,687 (283,687) 8.91
Balance at December 31, 2006 802,860 1,577,451 8.25
Authorized 293,805 — —
Granted (482,519) 482,519 9.27
Exercised — (156,986) 5.73
Forfeited 203,062 (203,062) 10.05
Balance at December 30, 2007 817,208 1,699,922 8.55
Exercisable, December 25, 2005 1,403,040 8.06
Exercisable, December 31, 2006 1,004,011 8.21
Exercisable, December 30, 2007 821,927 8.23
F-19

The following table summarizes information as of December 30, 2007 concerning currently outstanding and exercisable options:
Stock Options - The following table summarizes stock option activity for fiscal year 2007:
In 2007 and 2006, the aggregate intrinsic value of stock options (the amount by which the market price of the stock on the date of exercise exceeded
the market price of the stock on the date of grant) exercised was $900,000 and $828,000, respectively.
Compensation cost, which was determined using the weighted average fair value at the date of grant, was $4.61 and $4.87 for options granted during
2007 and 2006, respectively. The fair value of each option grant was estimated on the date of grant using the Black-Scholes option-pricing model. For
fiscal 2007, the assumptions used were: an expected dividend of zero; an expected stock price volatility of 45%; a risk-free interest rate of 3.9% and
expected lives of options of 6.4 years. For fiscal 2006, the assumptions used were: an expected dividend of zero; an expected stock price volatility of 53%;
a risk-free interest rate of 4.7% and expected lives of options of 6.3 years. For fiscal 2005, the assumptions used were: an expected dividend of zero; an
expected stock price volatility of 60%; a risk-free interest rate of 4.4% and expected lives of options of 3 years. As of December 30, 2007, there was
$1,916,452 of unrecognized compensation expense related to non-vested option awards that is expected to be recognized over a weighted average period of
2.4 years. As of December 31, 2006, there was $1,387,724 of unrecognized compensation expense related to non-vested option awards that is expected to
be recognized over a weighted average period of 2.2 years. The pro forma compensation cost, which was determined using the weighted average fair
values at the date of grant, for options granted during 2005 was $3.97 per share.
The estimated fair value of options granted is subject to the assumptions made, and if the assumptions change, the estimated fair value amounts could
be significantly different.
Included in general and administrative and restaurant labor expenses on the consolidated statements of operations is stock compensation expense
measured and recognized at $1,243,000 in 2007, $600,000 in 2006, and $571,000 in 2005. The $571,000 recognized in 2005 includes $562,000 of
compensation expense related to stock options held by the Company’s former chief executive officer. These stock options were expensed as part of a
severance agreement with the former chief executive officer.
Options Outstanding Options Exercisable
Range of Exercise Prices
Number
Outstanding
Weighted
Average
Remaining
Contractual
Life
(Years)
Weighted
Average
ExercisePrice
Number
Exercisable
Weighted
Average
Exercise
Price
$ 2.90 - $ 4.97 143,280 4.15 $ 3.92 141,775 $ 3.92
5.00 - 6.50 114,735 4.64 6.04 111,326 6.05
7.00 - 9.87 1,192,557 8.27 8.80 385,476 8.87
10.00 - 11.50 125,173 6.97 10.09 59,173 10.09
12.00 - 15.06 124,177 6.82 12.26 124,177 12.26
1,699,922 7.47 8.55 821,927 $ 8.23
Options
Weighted
Average
Exercise Price
Aggregate
Intrinsic Value
Weighted
Average
Remaining Term
Outstanding at beginning of period 1,577,451 $ 8.25
Granted 482,519 9.27
Exercised (156,986) 5.73
Forfeited (203,062) 10.05
Outstanding at end of period 1,699,922 $ 8.55 $ 1,006,303 7.47
Exercisable at end of period 821,927 $ 8.23 $ 943,933 5.56
F-20

1999 EMPLOYEE STOCK PURCHASE PLAN - On March 18, 1999 and March 24, 1999, the board and stockholders, respectively, approved the
1999 Employee Stock Purchase Plan (ESPP), which became effective upon the completion of the Company’s initial public offering. The ESPP allows
eligible employees, as specified in the ESPP, to purchase shares of common stock in semi-annual intervals through payroll deductions under this plan. The
accumulated payroll deductions will be applied to the purchase of shares on the employee’s behalf at a price per share equal to 85% of the lower of (1) the
fair market value of the Company’s common stock at the date of entry into the current offering period or (2) the fair market value on the purchase date. An
initial reserve of 200,000 shares of common stock has been authorized for issuance under the ESPP. The board may alter, suspend or discontinue the
ESPP. However, certain amendments to the ESPP may require stockholder approval. There has been no activity under the ESPP.
NON-EMPLOYEE DEFERRED COMPENSATION PLAN - The Company adopted a non-employee deferred compensation plan on March 6, 2003.
Under this plan, non-employee directors can defer fees into either a cash account or into discounted options under the Company’s 1999 Plan. Any deferrals
into cash are credited to a cash account that will accrue earnings at an annual rate of 2% above the prime lending rate. At the time of election, a participant
must choose the dates on which the cash benefit will be distributed. In October 2004, Congress enacted Internal Revenue Code Section 409A governing
deferred compensation. The Company operates the deferred compensation plan in accordance with Section 409A. Because Section 409A restricts the use
of discounted stock options, the Company will evaluate the extent to which that portion of the non-employee deferred compensation plan will be
implemented in the future.
2006 EXECUTIVE INCENTIVE PLAN - On July 27, 2006, the stockholders of the Company approved the Rubio’s Restaurants, Inc. 2006 Executive
Incentive Plan (the EIP). The purpose of the EIP is to motivate executive officers and other members of senior management with the grant of long-term
performance based stock or cash awards.
The EIP is administered by the compensation committee of the board, which will select participants eligible to receive awards, usually in the form of
restricted stock units, determine the amount of each award and the measurement periods for evaluating participant performance, and establish for each
measurement period (i) the performance goals, based on business criteria, and the target levels of performance for each participant, and (ii) a payout
formula or matrix for calculating a participant’s award based on actual performance. Performance goals may be based on one or more of the following
business criteria: return on equity, assets or invested capital; stockholder return, actual or relative to an appropriate index (including share price or market
capitalization); actual or growth in revenues, orders, operating income, or net income (with or without regard to amortization/impairment of goodwill); free
cash flow generation, operational performance, including asset turns, revenues per employee or per square foot, or comparable store sales; or individually
designed goals and objectives that are consistent with the participant’s specific duties and responsibilities and that are designed to improve the financial
performance of the Company or a specific division, region or subsidiary.
At the end of each measurement period, the compensation committee will determine the extent to which the performance goals for each participant
were achieved. Stock awards and restricted stock units under the EIP are payable from the Company’s 1999 Plan or any stock option, equity incentive or
similar plan that may be adopted by the Company in the future, or in cash, at the option of the Company. No participant may receive an award of more
than 300,000 shares under the EIP in any one fiscal or calendar year.
The Company granted market performance vested stock awards to certain employees under the EIP in fiscal years 2006 and 2007. These awards
represent a right to receive a certain number of shares of common stock upon achievement of share price performance goals at the end of one-year, two-
year and three-year periods. The first three performance periods end on December 20, 2007, 2008 and 2009, respectively. SFAS No. 123R requires that the
valuation of market condition awards considers the likelihood that the market condition will be satisfied rather than assuming that the award is vested on
the award date. Because the share-price compounded annual growth rate targets represent a more difficult threshold to meet before payout, with greater
uncertainty that the market condition will be satisfied, these awards have a lower fair value than those that vest based solely on the passage of time.
However, compensation expense is required to be recognized under SFAS No. 123R for an award regardless of when, if ever, the market condition is
satisfied. The Company determined the fair value on the date of grant of $4.27, $4.48 and $4.78 for the awards with performance periods ending in 2007,
2008 and 2009, respectively. The fair value of each option grant was estimated on the date of grant using a stochastic model, under the following
assumptions: an expected dividend of zero; expected stock price volatility of 25.7%, 32.2% and 37.8% for the awards with performance periods ending in
2007, 2008 and 2009, respectively, and; risk-free interest rate of 4.9%, 4.6% and 4.5% for the awards with performance periods ending in 2007, 2008 and
2009, respectively. The compensation associated with these shares is being expensed over the service period. The amount of compensation expense
recorded was $173,000 and $6,000 for fiscal 2007 and 2006, respectively. The expected cost for all awards granted is based on the fair value on the date of
grant, as it is the Company’s intent to settle these awards with shares of common stock. These stock awards are payable under the 1999 Plan.
F-21

Restricted Stock Units - The following table summarizes restricted stock unit activity during fiscal years 2006 and 2007:
As of December 30, 2007, there was $270,015 of unrecognized compensation expense related to non-vested restricted stock unit awards that is
expected to be recognized over a weighted average period of 1.16 years. For the fiscal year ended December 31, 2006, there was $524,407 of unrecognized
compensation expense related to non-vested restricted stock unit awards that is expected to be recognized over a weighted average period of 1.96 years.
EXECUTIVE DEFERRED COMPENSATION PLAN - The Company adopted a deferred compensation plan, effective on December 1, 2007. Under
this plan, beginning on December 31, 2007, the Company’s management and other highly compensated employees and non-employee members of the
board who are not eligible to participate in the Company’s 401(k) plan based on their compensation levels can defer a portion of their compensation and
receive contributions from the Company. The Plan is not intended to meet the qualification requirements of Section 401(a) of the Internal Revenue Code of
1986, as amended, but is intended to meet the requirements of Section 409A of the Internal Revenue Code, and to be an unfunded arrangement providing
deferred compensation to eligible employees who are part of a select group of management or highly compensated employees within the meaning of
Sections 201, 301 and 401 of the Employee Retirement Income Security Act of 1974, as amended.
The following is a listing of the Company’s related-party transactions:
Craig Andrews, a Company director, is a shareholder in the law firm of Heller Ehrman, LLP, which serves as our legal counsel for general corporate
and other matters. During fiscal 2007, 2006 and 2005, the Company paid Heller Ehrman, LLP $258,963, $736,691 and $466,427, respectively, for legal
services.
Timothy Ryan, a Company director, entered into a consulting agreement with the Company effective September 1, 2005 to provide certain marketing
services to the Company. The agreement terminated in December 2005. Under the terms of the agreement, Mr. Ryan received consulting fees of $25,000
per month. Through December 25, 2005, $80,000 was paid to Mr. Ryan under the consulting agreement. Mr. Ryan also received a bonus of $100,000
under his consulting agreement, which was paid in 2006.
Sheri Miksa, a Company director and President and CEO until she resigned December 19, 2005, received severance of $200,000 and had her stock
options vesting schedule extended an additional 6 months. This extension created stock option expense of $562,000. Both amounts were expensed in fiscal
2005.
Restricted Stock Units
(# of shares)
2007 2006
Outstanding at beginning of period 117,822 —
Awards granted 27,000 117,822
Awards forfeited (14,998) —
Shares vested (44,287) —
Non-vested shares at end of period 85,537 117,822
Weighted Average Grant Date Fair Value $ 6.32 $ 5.22
9. RELATED PARTIES
F-22

In July 2005, the Company entered into agreements with Rosewood Capital, L.P. or Rosewood, and Ralph Rubio, who at the time was Chairman of
the Board and Chief Executive Officer, to extend the registration rights held by Rosewood and Mr. Rubio under an investor’s rights agreement entered into
prior to the Company’s initial public offering. Under these agreements, the expiration date of the registration rights granted to Rosewood and Mr. Rubio
was extended from May 2006 to December 31, 2007. Further, as part of the extension agreements, Rosewood and Mr. Rubio agreed that they would not
demand that the Company register their stock prior to March 31, 2006. Neither Mr. Rubio nor Mr. Anderson, a Company director, voted on the approval of
the transaction with respect to these extension agreements. In May 2007, the Company, Rosewood and Mr. Rubio, who at the time was Chairman of the
Board, entered into agreements to further extend the registration rights held by Rosewood and Mr. Rubio from December 31, 2007 to June 30, 2009. As
part of these extension agreements, Rosewood and Mr. Rubio agreed that they would not demand that the Company register their stock prior to June 30,
2009. Neither Mr. Rubio nor Mr. Anderson, a Company director and affiliated with Rosewood, voted on the approval of the transaction with respect to
these extension agreements.
A reconciliation of basic and diluted net income (loss) per share in accordance with SFAS No. 128, Earnings per Share, is as follows (in thousands,
except per share data):
For fiscal years 2006 and 2005 common stock options of 15,958 and 268,119 were not included in the computation of diluted earnings per share as
their impact would have been anti-dilutive.
The Company owns and operates high-quality, fast-casual Mexican restaurants under the name “Rubio’s Fresh Mexican Grill,” with restaurants
primarily in California, Arizona, Nevada, Colorado and Utah. In accordance with SFAS No. 131, Disclosures about Segments of an Enterprise and Related
Information, the Company currently considers its business to consist of one reportable operating segment.
The following is summarized unaudited quarterly financial data (in thousands, except per share data) for fiscal 2007 and 2006:
10. NET INCOME (LOSS) PER SHARE
Fiscal Years
2007 2006 2005
Numerator
Basic:
Net income (loss) $ 1,189 $ (3,461) $ (228)
Denominator
Basic:
Weighted average common shares outstanding 9,889 9,592 9,378
Diluted:
Effect of dilutive securities:
Common stock options — — —
Total weighted average common and potential common shares outstanding 9,889 9,592 9,378
Net income (loss) per share:
Basic $ 0.12 $ (0.36) $ (0.02)
Diluted $ 0.12 $ (0.36) $ (0.02)
11. SEGMENT INFORMATION
12. SELECTED QUARTERLY FINANCIAL DATA (UNAUDITED)
Fiscal 2007
First Quarter Second Quarter Third Quarter Fourth Quarter
Total revenues $ 40,979 $ 43,048 $ 43,993 $ 41,710
Operating income (loss) 236 743 1,250 (444)
Net income (loss) 196 503 732 (242)
Basic net income (loss) per share 0.02 0.05 0.07 (0.02)
Diluted net income (loss) per share $ 0.02 $ 0.05 $ 0.07 $ (0.02)
F-23

Operating income (loss) and net income (loss) per share is computed independently for each of the quarters presented and therefore may not sum to
the annual amount for the year.
Total revenues in the fourth quarter 2007 included $382,000 for the portion of the gift card liability that is not expected to be redeemed (breakage).
Included in general and administrative expense in the fourth quarter of 2006 was a charge for $8.0 million, for legal and related fees associated with
the settlement of outstanding class action litigation (Note 6).
Fiscal 2006
First Quarter Second Quarter Third Quarter Fourth Quarter
Total revenues $ 35,083 $ 37,152 $ 38,754 $ 41,279
Operating income (loss) 212 572 835 (7,946)
Net income (loss) 192 439 600 (4,692)
Basic net income (loss) per share 0.02 0.05 0.06 (0.48)
Diluted net income (loss) per share $ 0.02 $ 0.05 $ 0.06 $ (0.48)
F-24

EXHIBIT 23.1
Consent of Independent Registered Public Accounting Firm
The Board of Directors
Rubio’s Restaurants, Inc.:
We consent to the incorporation by reference in the registration statements (Nos. 333-79003, 333-84440, 333-86540, 333-115959, 333-124652, 333-
133359 and 333-143545) on Forms S-8 of Rubio’s Restaurants, Inc. of our report dated March 27, 2008, with respect to the consolidated balance sheets of
Rubio’s Restaurants, Inc. as of December 30, 2007 and December 31, 2006, and the related consolidated statements of operations, stockholders’ equity and
comprehensive income (loss) and cash flows for each of the years in the three-year period then ended December 30, 2007, which report appears in the
December 30, 2007 annual report on Form 10-K of Rubio’s Restaurants, Inc.
Our report on the consolidated financial statements dated March 27, 2008, contains an explanatory paragraph that states that the Company adopted the
provisions of Statement of Financial Accounting Standards No. 123 (revised 2004), Share-Based Payment, in fiscal year 2006.
/s/ KPMG LLP
San Diego, California
March 27, 2008
Exhibit 31.1
CERTIFICATION PURSUANT TO RULES 13a-14 AND 15d-14
OF THE 1934 SECURITIES EXCHANGE ACT
I, Dan Pittard, certify that:
1. I have reviewed this annual report on Form 10-K of Rubio’s Restaurants, Inc.;
2. Based on my knowledge, this report does not contain any untrue statement of a material fact or omit to state a material fact necessary to make the
statements made, in light of the circumstances under which such statements were made, not misleading with respect to the period covered by this report;
3. Based on my knowledge, the financial statements, and other financial information included in this report, fairly present in all material respects the
financial condition, results of operations and cash flows of the registrant as of, and for, the periods presented in this report;
4. The registrant’s other certifying officers and I are responsible for establishing and maintaining disclosure controls and procedures (as defined in
Exchange Act Rules 13a-15(e) and 15d-15(e)) and internal control over financial reporting (as defined in Exchange Act Rules 13a-15(f) and 15d-15(f)) for
the registrant and have:
a) designed such disclosure controls and procedures, or caused such disclosure controls and procedures to be designed under our supervision, to ensure
that material information relating to the registrant, including its consolidated subsidiaries, is made known to us by others within those entities,
particularly during the period in which this report is being prepared;
b) designed such internal control over financial reporting, or caused such internal control over financial reporting to be designed under our
supervision, to provide reasonable assurance regarding the reliability of financial reporting and the preparation of financial statements for external
purposes in accordance with generally accepted accounting principles;
c) evaluated the effectiveness of the registrant’s disclosure controls and procedures and presented in this report our conclusions about the effectiveness
of the disclosure controls and procedures, as of the end of the period covered by this report based on such evaluation; and
d) disclosed in this report any change in the registrant’s internal control over financial reporting that occurred during the registrant’s most recent fiscal
quarter (the registrant’s fourth fiscal quarter in the case of an annual report) that has materially affected, or is reasonably likely to materially affect, the
registrant’s internal control over financial reporting; and
5. The registrant’s other certifying officers and I have disclosed, based on our most recent evaluation of internal control over financial reporting, to the
registrant’s auditors and the audit committee of the registrant’s board of directors (or persons performing the equivalent functions):
a) all significant deficiencies and material weaknesses in the design or operation of internal control over financial reporting, which are reasonably
likely to adversely affect the registrant's ability to record, process, summarize and report financial information; and
b) any fraud, whether or not material, that involves management or other employees who have a significant role in the registrant’s internal control over
financial reporting.
Date: March 31, 2008
/s/ DAN PITTARD
Dan Pittard
President and Chief Executive Officer
(principal executive officer)

Exhibit 31.2
CERTIFICATION PURSUANT TO RULES 13a-14 AND 15d-14
OF THE 1934 SECURITIES EXCHANGE ACT
I, Frank Henigman, certify that:
1. I have reviewed this annual report on Form 10-K of Rubio’s Restaurants, Inc.;
2. Based on my knowledge, this report does not contain any untrue statement of a material fact or omit to state a material fact necessary to make the
statements made, in light of the circumstances under which such statements were made, not misleading with respect to the period covered by this report;
3. Based on my knowledge, the financial statements, and other financial information included in this report, fairly present in all material respects the
financial condition, results of operations and cash flows of the registrant as of, and for, the periods presented in this report;
4. The registrant’s other certifying officers and I are responsible for establishing and maintaining disclosure controls and procedures (as defined in
Exchange Act Rules 13a-15(e) and 15d-15(e)) and internal control over financial reporting (as defined in Exchange Act Rules 13a-15(f) and 15d-15(f)) for
the registrant and have:
a) designed such disclosure controls and procedures, or caused such disclosure controls and procedures to be designed under our supervision, to ensure
that material information relating to the registrant, including its consolidated subsidiaries, is made known to us by others within those entities,
particularly during the period in which this report is being prepared;
b) designed such internal control over financial reporting, or caused such internal control over financial reporting to be designed under our
supervision, to provide reasonable assurance regarding the reliability of financial reporting and the preparation of financial statements for external
purposes in accordance with generally accepted accounting principles;
c) evaluated the effectiveness of the registrant’s disclosure controls and procedures and presented in this report our conclusions about the effectiveness
of the disclosure controls and procedures, as of the end of the period covered by this report based on such evaluation; and
d) disclosed in this report any change in the registrant’s internal control over financial reporting that occurred during the registrant’s most recent fiscal
quarter (the registrant’s fourth fiscal quarter in the case of an annual report) that has materially affected, or is reasonably likely to materially affect, the
registrant’s internal control over financial reporting; and
5. The registrant’s other certifying officers and I have disclosed, based on our most recent evaluation of internal control over financial reporting, to the
registrant’s auditors and the audit committee of the registrant’s board of directors (or persons performing the equivalent functions):
a) all significant deficiencies and material weaknesses in the design or operation of internal control over financial reporting, which are reasonably
likely to adversely affect the registrant's ability to record, process, summarize and report financial information; and
b) any fraud, whether or not material, that involves management or other employees who have a significant role in the registrant’s internal control over
financial reporting.
Date: March 31, 2008
/s/ Frank Henigman
Frank Henigman
Chief Financial Officer
(principal accounting officer)

EXHIBIT 32.1
CERTIFICATION PURSUANT TO
18 U.S.C. SECTION 1350
AS ADOPTED PURSUANT TO SECTION 906
OF THE SARBANES-OXLEY ACT OF 2002
I, Dan Pittard, President and Chief Executive Officer of Rubio’s Restaurants, Inc. (the Company), do hereby certify, pursuant to 18 U.S.C. Section 1350, as
adopted pursuant to Section 906 of the Sarbanes-Oxley Act of 2002, that, to my knowledge:
(a) the Annual Report on Form 10-K of the Company for the fiscal year ended December 30, 2007, as filed with the Securities and Exchange
Commission (the Report), fully complies with the requirements of Section 13(a) or 15(d) of the Securities Exchange Act of 1934; and
(b) the information contained in the Report fairly presents, in all material respects, the financial condition and results of operations of the
Company.
Dated: March 31, 2008
/s/ Dan Pittard
Dan Pittard
President and Chief Executive Officer

EXHIBIT 32.2
CERTIFICATION PURSUANT TO
18 U.S.C. SECTION 1350
AS ADOPTED PURSUANT TO SECTION 906
OF THE SARBANES-OXLEY ACT OF 2002
I, Frank Henigman, Chief Financial Officer of Rubio’s Restaurants, Inc. (the Company), do hereby certify, pursuant to 18 U.S.C. Section 1350, as adopted
pursuant to Section 906 of the Sarbanes-Oxley Act of 2002, that, to my knowledge:
(a) the Annual Report on Form 10-K of the Company for the fiscal year ended December 30, 2007, as filed with the Securities and Exchange
Commission (the Report), fully complies with the requirements of Section 13(a) or 15(d) of the Securities Exchange Act of 1934; and
(b) the information contained in the Report fairly presents, in all material respects, the financial condition and results of operations of the
Company.
Dated: March 31, 2008
/s/ Frank Henigman
Frank Henigman
Chief Financial Officer

[This page intentionally left blank.]

Corporate and Stockholder Information
Board of Directors Ralph Rubio Chairman, Rubio's Restaurants, Inc.
Kyle A. Anderson Managing Director, Rosewood Capital (Investment Management)
Timothy J. Ryan Former President/CEO, Diedrich Coffee, Inc. (Coffee Company)
Craig S. Andrews Partner, DLA Piper US, LLP (Law Firm)
Jack W. Goodall Former Chairman, Jack in the Box Inc. (Restaurant)
Loren C. Pannier Former Chief Financial Officer, CKE Restaurants, Inc. (Restaurant)
William R. Bensyl Former Senior Vice President of Personnel, PepsiCo, Inc.
Daniel E. Pittard President and Chief Executive Officer, Rubio's Restaurants, Inc.
Executive ManagementRalph Rubio Chairman of the Board
Daniel E. Pittard President and Chief Executive Officer
Frank E. Henigman Senior Vice President and Chief Financial Officer
Marc S. Simon Senior Vice President, Operations
Lawrence A. Rusinko Senior Vice President, Marketing
A. Gerald Leneweaver Senior Vice President, People Services
Kenneth C. Hull Senior Vice President, Development
Legal CounselDLA Piper US, LLP 4365 Executive Drive, Suite 1100 San Diego, California 92121 (858) 677-1400
Registrar and Transfer Agent Computershare Trust Company, N.A. 250 Royall Street Canton, MA 02021 (800) 962-4284
Independent Registered Public Accounting FirmKPMG LLP 750 B Street, Suite 1500 San Diego, CA 92101 (619) 233-8000
Franchise Information Inquiries regarding franchise opportunities can be sent in writing to the Franchise Department at the restaurant support center.
InquiriesCorrespondence regarding stock transfer requirements, address changes and lost certifications should be sent to the Transfer Agent. Other inquiries should be directed to Investor Relations at the restaurant support center.
Annual MeetingJuly 24, 2008 10:00 a.m. Pacific Daylight Savings Time Edwards Theatres 1180 West San Marcos Boulevard San Marcos, California 92069
World Wide Web Address www.rubios.com
Company, product, financial and stockholder information, including press releases, quarterly earning announcements, and periodic and current SEC reports are available at the Rubio's Restaurants, Inc. web site.
Restaurant Support Center Rubio's Restaurants, Inc. 1902 Wright Place, Suite 300 Carlsbad, California 92008 (760) 929-8226, Fax (760) 602-5199