Rubbertown Health Consultation August 2006 · Rubbertown Health Consultation 2.0 Background and...
80
Health Consultation RUBBERTOWN INDUSTRIAL AREA JEFFERSON COUNTY, KENTUCKY AUGUST 3, 2006 U.S. DEPARTMENT OF HEALTH AND HUMAN SERVICES Public Health Service Agency for Toxic Substances and Disease Registry Division of Health Assessment and Consultation Atlanta, Georgia 30333
Transcript of Rubbertown Health Consultation August 2006 · Rubbertown Health Consultation 2.0 Background and...
Health Consultation
RUBBERTOWN INDUSTRIAL AREA
JEFFERSON COUNTY, KENTUCKY
AUGUST 3, 2006
U.S. DEPARTMENT OF HEALTH AND HUMAN SERVICES Public Health Service
Agency for Toxic Substances and Disease Registry Division of Health Assessment and Consultation
Atlanta, Georgia 30333

Health Consultation: A Note of Explanation
An ATSDR health consultation is a verbal or written response from ATSDR to a specific request for information about health risks related to a specific site, a chemical release, or the presence of hazardous material. In order to prevent or mitigate exposures, a consultation may lead to specific actions, such as restricting use of or replacing water supplies; intensifying environmental sampling; restricting site access; or removing the contaminated material.
In addition, consultations may recommend additional public health actions, such as conducting health surveillance activities to evaluate exposure or trends in adverse health outcomes; conducting biological indicators of exposure studies to assess exposure; and providing health education for health care providers and community members. This concludes the health consultation process for this site, unless additional information is obtained by ATSDR which, in the Agency’s opinion, indicates a need to revise or append the conclusions previously issued.
You May Contact ATSDR TOLL FREE at 1-888-42ATSDR
or Visit our Home Page at: http://www.atsdr.cdc.gov
HEALTH CONSULTATION
RUBBERTOWN INDUSTRIAL AREA
JEFFERSON COUNTY, KENTUCKY
Prepared by:
U.S. Department of Health and Human Services Agency for Toxic Substances and Disease Registry

Rubbertown Health Consultation
Table of Contents List of Abbreviations ..................................................................................................................... iii 1.0 Summary ..............................................................................................................................1 2.0 Background and Statement of Issues ...................................................................................3
2.1 Rubbertown Industrial Area.............................................................................................3 2.2 Demographics ..................................................................................................................4 2.3 Air Monitoring Programs.................................................................................................4 2.4 Risk Assessment and Health Consultation ......................................................................5
3.0 Environmental Data .............................................................................................................7 3.1 Pollutants Monitored........................................................................................................7 3.2 Monitoring Methods ........................................................................................................73.3 Monitoring Locations.......................................................................................................8 3.4 Monitoring Schedule........................................................................................................8 3.5 Data Quality .....................................................................................................................9 3.6 Data Results ...................................................................................................................10
4.0 Discussion ..........................................................................................................................11 4.1 August 2000 Air Sampling Event ..................................................................................13 4.2 April 2000 to April 2001 Routine Air Sampling Program ............................................14 4.3 Chemical Mixtures.........................................................................................................34
5.0 Child Health Considerations ..............................................................................................356.0 Conclusions........................................................................................................................36 7.0 Recommendations..............................................................................................................36 8.0 Public Health Action Plan..................................................................................................37 9.0 ATSDR Preparers ..............................................................................................................38 10.0 ATSDR Reviewers.............................................................................................................38 11.0 References..........................................................................................................................39 Appendix A. Figures......................................................................................................................48
Figure 1. Toxic Release Inventory (TRI) Facilities and West Louisville Air Station Locations...................................................................................................................49
Figure 2. Demographic Statistics within the Industrial Area.....................................................50 Figure 3. Demographic Statistics within One Mile of the Industrial Area ................................51
Appendix B. Tables .......................................................................................................................52 Table 1. Monitoring Location Descriptions in West Louisville ................................................52 Table 2. Summary of VOC Monitoring Data Collected by EPA ..............................................53 Table 3. Summary of VOC Monitoring Data Collected by U of L ...........................................54 Table 4. Summary of SVOC Monitoring Data Collected by EPA ............................................55
i
Rubbertown Health Consultation
Table 5. Summary of Metal and Trace Element Monitoring Data Collected by EPA ..............56 Table 6. Summary of Pesticide Monitoring Data Collected by EPA ........................................57 Table 7. EPA Average Concentrations by Station.....................................................................58 Table 8. U of L Average Concentrations by Station..................................................................59 Table 9. Cancer Risk Estimates Using EPA Station Averages..................................................60 Table 10. Cancer Risk Estimates Using U of L Station Averages ............................................61 Table 11. ATSDR Estimated Cancer Risk Category Definitions for Rubbertown ...................62
Appendix C. Derivation of Comparison Values ............................................................................63 Appendix D. Comparison of Public Health Assessments and Risk Assessments .........................72
ii

CV
Rubbertown Health Consultation
List of Abbreviations
ACGIH APCD ATSDR CBEP CEL CREG CSF
EMEG EPA IRIS IUR LOAEL µg/m3
MRL NA NIOSH NOAEL OAQPS OSHA PAH PCB PEL PHA ppb ppm RBC REL RfC RfD STEL SVOC TDI TLV TRI U of L VOC WLATS
American Conference of Governmental Industrial Hygienists Air Pollution Control District Agency for Toxic Substances and Disease Registry community-based environmental protection cancer effect level cancer risk evaluation guide cancer slope factor comparison value environmental media evaluation guide U.S. Environmental Protection Agency Integrated Risk Information System inhalation unit risk lowest-observed-adverse-effect-level micrograms per cubic meter minimal risk level not applicable National Institute for Occupational Safety and Health no-observed-adverse-effect-level Office of Air Quality Planning and Standards Occupational Safety and Health Administration polycyclic aromatic hydrocarbon polychlorinated biphenyl permissible exposure limit public health assessment parts per billion parts per million risk-based concentration recommended exposure limit reference concentration reference dose short-term exposure limit semi-volatile organic compound tolerable daily intake threshold limit value Toxics Release Inventory University of Louisville volatile organic compound West Louisville Air Toxics Study
iii

Rubbertown Health Consultation
1.0 Summary
Rubbertown is a highly industrialized area in West Louisville, Kentucky, where several large chemical and materials manufacturing facilities operate. Local residents are concerned about their exposure to ambient (outdoor) air in the West Louisville area.
In this health consultation, the Agency for Toxic Substances and Disease Registry (ATSDR) addresses the question of whether exposure to the levels of ambient air chemicals detected in and around West Louisville could result in harmful health effects. During 2000 and 2001, ambient air samples were collected from 12 monitoring locations in West Louisville and analyzed for a variety of chemicals. Several of the chemicals detected in West Louisville air exhibited significant spatial variations, with their highest concentrations consistently measured at monitoring locations nearest to and in the Rubbertown industrial area. This pattern indicates that West Louisville residents are exposed to chemicals in the ambient air emitted from numerous Rubbertown industrial area sources.
ATSDR notes that the ambient air was monitored only once every 12 days, and not continuously. For the purpose of this health consultation, however, ATSDR assumed that the limited ambient air data were representative of air concentrations throughout the entire year. ATSDR also notes several studies of other communities have shown that exposures to chemicals from indoor air sources may be greater than exposures from outdoor air sources. However, because relevant indoor air data were lacking, ATSDR assumed that indoor air exposures were comparable to outdoor air exposures for this health consultation.
Based on its initial screen of more than 175 chemicals, ATSDR identified 29 chemicals for further consideration in this health consultation. ATSDR first evaluated each of these 29 chemicals in West Louisville air on a chemical-by-chemical basis to determine (1) where site-specific doses lie in relation to the observed effects levels reported in the epidemiologic and experimental studies of interest, and (2) whether differences between these studies and the exposure scenario being evaluated make health effects more or less likely. ATSDR concludes that long-term exposure to each of these chemicals individually is unlikely to cause harmful noncancer health effects in West Louisville residents. Long-term exposure to air toxics in the West Louisville area is associated with a low increased risk of developing cancer. Of particular concern is the risk of developing cancer from exposure to 1,3-butadiene, a known human carcinogen, in the industrial area.
Although relatively few studies have been conducted to assess toxic interactions in low dose ranges, ATSDR also evaluated the chemical levels detected in West Louisville air with respect to the available chemical mixtures studies. ATSDR concludes that the combined exposure to all of these chemicals at the levels detected in West Louisville air would not be expected to produce noncancer harmful health effects in exposed residents. However, several stations exceed a cumulative cancer risk estimate of 1 × 10⁻⁴ (one case in ten thousand persons), which ATSDR considers a level of concern for lifetime cancer risk due to additivity. Therefore, the combined
1
Rubbertown Health Consultation
exposure to all of these chemicals is associated with a low increased risk of developing cancer, especially in the industrial area.
From a health perspective, ATSDR supports measures to reduce the levels of chemical carcinogens released into the environment. Because (1) ambient air sampling data were limited, (2) indoor air chemical levels may have been greater than ambient air chemical levels, and (3) relatively few chemical mixtures studies are available to assess toxic interactions in low dose ranges, ATSDR considers it a prudent public health measure to reduce or eliminate releases of chemical carcinogens into West Louisville air wherever possible.
Based on its evaluation, ATSDR recommends (1) continued tracking of air pollutants in the Rubbertown industrial area to ensure future chemical concentrations remain below levels that may cause harmful noncancer health effects, and (2) reducing or eliminating releases of chemical carcinogens into West Louisville air wherever possible.
Since October 2001, six air monitors have been operated and maintained in West Louisville. In May 2003, the Louisville Metro government began seeking butadiene emission reductions from three stationary Rubbertown industrial area sources. In June 2005, the Louisville Metro Air Pollution Control District Board approved the Strategic Toxic Air Reduction (STAR) program to improve air quality and public health. The STAR program is a set of regulations that will require companies that release higher levels of toxic chemicals into the air to significantly reduce emissions. This follows the overall goals of the U.S. Environmental Protection Agency’s Air Toxics Strategy, which provides an integrated framework for addressing air toxics in urban areas by looking at stationary, mobile, and indoor source emissions. ATSDR also supports the goals and objectives of this strategy and our recommendations are consistent with this support.
Air toxics pose a special concern in urban areas like West Louisville where large numbers of people, often including minority and low-income communities, live near a variety of sources that emit toxic air pollutants. Individually, some of these sources may not emit large amounts of toxic pollutants. However, all of these pollution sources combined can potentially increase air toxics to levels of public health concern, especially for sensitive subpopulations like children and the elderly.
2
Rubbertown Health Consultation
2.0 Background and Statement of Issues Rubbertown is an industrial area located in West Louisville, Jefferson County, Kentucky. In 1992, ATSDR received a petition to evaluate whether pollution from the Rubbertown industrial area posed a public health hazard to nearby residents. Community members expressed concerns about cancer and respiratory problems among West Louisville residents. In response to these concerns, ATSDR compiled and reviewed available environmental monitoring and health outcome data in a Public Health Assessment (PHA) released September 30, 1998.
Data evaluated in the PHA were limited. For air, the primary exposure pathway of concern, monitoring for pollutants consisted of two studies (conducted from 1956–1957 and during 1988) that sampled for a range of substances, and yearly monitoring conducted since 1980 for a group of six pollutants. In the 1988 study, the sole monitoring location was in downtown Louisville, so these data were of questionable relevance to West Louisville.
Because of the lack of relevant air sampling data, ATSDR concluded in the 1998 PHA that the Rubbertown industrial area posed an indeterminate public health hazard. At that time, the U.S. Environmental Protection Agency (EPA) Region 4 initiated a community-based environmental protection (CBEP) program in West Louisville that included an air toxics monitoring study. In addition, air data were collected through a collaborative air monitoring effort by the University of Louisville (U of L). The 1998 PHA recommended that when these additional air data became available, ATSDR should evaluate them for public health significance.
In response, this health consultation is an evaluation of the EPA and U of L data to determine whether West Louisville residents are currently exposed to various chemicals in ambient air in their community at levels that might be associated with harmful health effects. Attributing airborne exposures to individual sources is often an extremely difficult task, especially in urban areas like Rubbertown. Because of the uncertainty in determining the extent to which each individual source in Rubbertown contributes to general air pollution, ATSDR’s evaluation does not provide quantitative estimates of each source’s impact on levels of air pollution.
2.1 Rubbertown Industrial Area
Rubbertown, consisting of numerous facilities, is an industrial area located in West Louisville, Kentucky. The petrochemical industrialization of the area began in 1918 when Standard Oil of Kentucky began construction of its Riverside Refinery. Soon afterward, other industries began opening plants that manufacture a variety of chemical and industrial products. Easy access to railroads and waterways made Rubbertown a prime choice for government selection as a base for the manufacture of synthetic rubber during World War II. In 1941, several facilities were built as defense plants under the supervision of the Office of Production Management, a United States government agency. Many of these facilities have changed ownership over the years.
According to EPA’s Toxics Release Inventory (TRI), industries in the Rubbertown industrial area release large quantities of toxic substances into the air. Estimates of the annual air emissions of many chemicals can be found at http://www.epa.gov/triexplorer/. TRI data provide ATSDR staff with a general overview of the potential chemicals in an area. However, the TRI regulations only require facilities in certain industries to disclose releases for specific hazardous chemicals.
3
Rubbertown Health Consultation
The regulations do not require that all facilities report and do not address all chemicals. In addition, information in the TRI database does not represent measured concentrations; rather, it represents industry-reported estimates of emissions. The accuracy of these estimates of emissions is not known. Furthermore, while TRI data typically capture large stationary sources of emission releases, smaller stationary sources are not captured. These smaller stationary sources could include offices and residences, gasoline stations, and dry cleaners. Additionally, TRI data do not capture mobile sources, like automobiles, trucks, buses, and motorcycles. These mobile sources may be a significant source of outdoor air pollution, including such chemicals as benzene, 1,3-butadiene and formaldehyde.
Although there are limitations, ATSDR staff did review TRI air emission data. However, it must be emphasized that TRI information on releases of chemicals to the environment are not a direct measure of exposure. Nor can TRI data be used to determine the definitive source of a particular chemical found in the air at one of the West Louisville air monitors. Instead, ATSDR reviewed TRI air emission data only to note qualitatively whether a chemical of concern in the air potentially may be related to a nearby facility’s air emissions based on spatial trends. ATSDR used the facility information in the TRI database to map the locations of several facilities in the Rubbertown area with respect to the location of the West Louisville air monitors (see Figure 1). For the purpose of this health consultation, ATSDR refers to the pink shaded area in Figure 1 as the “Rubbertown industrial area.” Land use in this pink shaded area is both industrial and residential.
2.2 Demographics
Several residential neighborhoods exist within the ATSDR-defined boundaries of the industrial area. According to the 2000 Census of Population and Housing, 1,416 persons resided in 629 households within the Rubbertown industrial area. Of these, 86.2% were white and 11.0% black. The demographic statistics indicated 126 children aged 6 years or younger and 201 adults aged 65 years or older (Bureau of the Census 2001). Figure 2 provides additional demographic statistics for the industrial area.
For locations within 1 mile of the Rubbertown industrial area, 30,461 persons resided in 13,303 households. Of these, 36.9% were white and 61.0% black. The demographic statistics indicated 2,920 children aged 6 years or younger and 4,782 adults aged 65 years or older (Bureau of the Census 2001). Figure 3 provides additional demographic statistics for locations within 1 mile of the Rubbertown industrial area.
2.3 Air Monitoring Programs
In 2000 and 2001, EPA collected ambient air data during the West Louisville Air Toxics Study (WLATS). The objective of WLATS was to “determine if residents of the neighborhoods surrounding the Rubbertown area were being exposed to airborne concentrations of hazardous air pollutants that might pose unacceptable health risks” (EPA 2002a). Similarly, U of L collected ambient air data for a program that was designed to “characterize the airborne concentrations of toxic air pollutants in areas of West Louisville” (Sciences International 2003).
4
Rubbertown Health Consultation
2.4 Risk Assessment and Health Consultation
In October 2003, Sciences International, Inc. prepared a risk assessment for the Louisville Metro Air Pollution Control District (APCD) and West Jefferson County Community Task Force. The risk assessment provided an evaluation of the air data collected by EPA and U of L in 2000 and 2001 to determine if residents of the West Louisville area were being exposed to air pollutants via inhalation that could pose unacceptable risks to human health (Science International 2003). The Science International risk assessment uses a 1 × 10⁻⁶ (one case per million persons) threshold to identify acceptable risks. The results for the chronic risk assessment indicated that all of the monitors in the program, including background monitors, exceed an acceptable 1 × 10⁻⁶
lifetime cancer risk. These cancer risk levels also exceed the target risk management level of 1 × 10⁻⁶ identified in the West Jefferson County Community Task Force Risk Management Plan (WJCCTF 2003). This health consultation concludes that long-term exposure to air toxics in the West Louisville area is associated with a low risk of developing cancer.
The risk assessment and health consultation reports provide two different, yet complementary, perspectives about the potential impacts of air toxics on West Louisville residents. Both types of assessments attempt to address the potential human health effects of low-level environmental exposures, but they are approached differently and are used for different purposes. One needs to understand these differences to know how to interpret and integrate the information generated by each of these assessments.
1. A quantitative risk assessment is used by regulators as part of site investigations to determine the extent to which site action is needed. The risk assessment provides a numeric estimate of theoretical risk or hazard, assuming no action takes place. By design, it generally uses standard (default) protective exposure assumptions when evaluating site risk. Under quantitative cancer risk assessment methodology, site-specific cancer doses and airborne concentrations are multiplied by EPA's cancer slope factors (CSFs) or inhalation unit risks (IURs), respectively, to estimate theoretical cancer risk. EPA’s CSFs and IURs are generated from mathematical models applied to epidemiologic or experimental data for carcinogenic effects. These models extrapolate from higher experimental doses to lower environmental doses. The screening level Sciences International, Inc. risk assessment used a series of health protective assumptions to derive conservative estimates of the potential cumulative long-term risk posed to people who live in the West Louisville area (the potential for acute exposures of public health concern was also evaluated, but none was identified). For example, risk assessment frequently uses high-end estimates of chemical concentrations (e.g., 95% upper confidence limits of the arithmetic mean) to represent chronic lifetime exposures and the summing of risks across chemicals when monitoring data suggest a mixture of chemicals were present. The application of such conservative assumptions is a common approach used by risk assessors to balance the need to protect public health with the substantial uncertainties that are sometimes inherent in the data used to perform the assessment. For example, the monitoring effort only collected about 31 discreet 24-hour samples (one sample every 12 days) over the course of the one-year study timeframe. The screening-level risk assessment, in acknowledgement of this small data set, applied a series of conservative
5
Rubbertown Health Consultation
assumptions to develop estimates of risk that are unlikely to underestimate long-term exposure (although they may overestimate it).
2. ATSDR uses a public health evaluation to identify possible harmful exposures and to recommend actions needed to protect public health. ATSDR considers the same environmental data as the risk assessment, but focuses more closely on site-specific exposure conditions to determine • where site-specific doses lie in relation to the observed effects levels reported in the
epidemiologic and experimental studies of interest, and • whether differences between study data and the exposure scenario being evaluated
make health effects more or less likely. This evaluation provides a more qualitative evaluation of possible harmful health effects.
For example, risk assessments use high-end estimates of chemical concentrations (95% upper confidence limits) to determine whether unacceptable levels exist; ATSDR typically uses average concentrations in its evaluation of potential long-term harmful health effects. Although lower than high-end estimates, ATSDR finds average concentrations more likely to represent concentrations people are continuously exposed to over their lifetime. ATSDR develops its own screening values for most noncarcinogens, but bases its cancer-based screening values on EPA’s CSFs and IURs. Although ATSDR may also utilize numerical cancer risk estimates, the agency considers such estimates from the perspective of the variables and assumptions involved in their derivation and in the broader context of biomedical opinion, host factors, and actual exposure conditions. ATSDR carefully considers the actual parameters of environmental exposures in evaluating the assumptions and variables relating to both toxicity and exposure. ATSDR notes that a careful review of the epidemiologic and experimental studies must be undertaken before making conclusions about potential cancer risks (ATSDR 2005). After an initial review of more than 175 chemicals, ATSDR identified 29 chemicals for further consideration in this health consultation. This health consultation carefully evaluates each of these 29 chemicals by comparing concentrations detected in West Louisville air against concentrations that have been shown to elicit actual health effects in animals and humans. The result is a series of statements about the likelihood of adverse health outcomes occurring in the people living in the West Louisville area at the time the air monitoring data were collected. For the purpose of this health consultation, ATSDR assumed the measured chemical concentrations during those 31 sampling days were representative of air concentrations throughout the entire year.
Following the release of the risk assessment, the Louisville Metro APCD Board approved the Strategic Toxic Air Reduction (STAR) Program to improve air quality and public health. The STAR program is a set of regulations that will require companies that release higher levels of toxic chemicals into the air to significantly reduce emissions. This follows the overall goals of the EPA’s Air Toxics Strategy, which provides an integrated framework for addressing air toxics in urban areas by looking at stationary, mobile, and indoor source emissions. ATSDR also
6

Rubbertown Health Consultation
supports the goals and objectives of this strategy and our recommendations are consistent with this support. In summary, actions based on a quantitative risk assessment represent a prudent public health approach—that of prevention. The risk assessment helps regulatory officials determine strategies that will ensure overall protection of human health and the environment. The ATSDR public health evaluation provides perspective on what the risk estimates mean for the community. The ATSDR process identifies chemicals of potential concern and explains whether exposures to those chemicals are likely to be harmful under site-specific conditions. ATSDR’s recommendations, like the risk assessment recommendations, also represent a prudent public health approach—that is, to reduce or prevent harmful exposures to toxic chemicals. For further information see Appendix D, which provides a general side-by-side comparison of public health assessments and risk assessments.
3.0 Environmental Data As part of ATSDR’s evaluation, available ambient (outdoor) environmental monitoring data were reviewed. Several recent studies suggest that indoor air levels of volatile chemicals may be greater than their outdoor air concentrations (Payne-Sturges et al. 2004; Sexton et al. 2004; Phillips et al. 2005; Weisel et al. 2005). For this health consultation, ATSDR assumed that indoor air concentrations were comparable to outdoor air concentrations. For the 2000 and 2001 ambient air sampling data, ATSDR staff reviewed the pollutants monitored, monitoring methods, monitoring locations, monitoring schedule, data quality, and data results. The following text outlines this review.
3.1 Pollutants Monitored
EPA’s ambient air monitoring focused on the majority of air toxics emitted in the Rubbertown area of West Louisville (EPA 2002a). EPA monitored for six groups of pollutants: volatile organic compounds (VOCs), semi-volatile organic compounds (SVOCs), formaldehyde, reactive aerosols (hydrogen chloride and hydrogen fluoride), metals and trace elements, and pesticides and polychlorinated biphenyls (PCBs). Overall, EPA routinely monitored ambient air concentrations of more than 175 chemicals, including more than half of the air toxics that industrial facilities in Jefferson County reportedly released to the air in 2001 (EPA 2003a).
U of L’s monitoring program analyzed for ambient air concentrations of 77 VOCs. EPA’s monitoring program analyzed for the same set of 77 VOCs as well as bromochloromethane.
3.2 Monitoring Methods
EPA used well-established methods to collect and analyze air samples. Specifically, VOCs were measured using EPA Method TO-15 (EPA 1999a); SVOCs were measured using EPA Method TO-13A (EPA 1999b); formaldehyde was measured using EPA Method TO-11A (EPA 1999c); reactive aerosols were measured using Method KY-4650 published by the Kentucky Division of Environmental Services; and metals and trace elements were measured following guidelines of EPA Method IO-3.5 (EPA 1999d). EPA’s summary report did not specify the sampling and analytical method for pesticides and PCBs and followup efforts by ATSDR, including telephone calls and emails to EPA, did not uncover the specific method. Although EPA considered many
7

Rubbertown Health Consultation
groups of compounds, VOCs were the main focus (EPA 2002a). Only one round of sampling took place for pesticides and PCBs; EPA routinely monitored all other chemicals.
Before initiating its sampling, EPA (2002a) determined that “…the detection limits were of adequate sensitivity for the majority of the target compounds to support a risk assessment.” Thus, EPA’s sampling data were based on methodologies with acceptable measurement sensitivity.
None of the information ATSDR received specifies exactly which methods U of L used to measure ambient air concentrations of VOCs. However, discussions with EPA and U of L and text on the West Jefferson County Community Task Force Web page [http://www.louisville.edu/org/wjcctf/] suggest that the U of L sampling followed EPA Method TO-15A (WJCCTF 2004). This is a well-established method for measuring air concentrations of VOCs.
3.3 Monitoring Locations
The samples EPA analyzed came from six monitoring locations (see Figure 1). Table 1 presents additional information on these locations (Stations # 1–6), which included maximum impact locations, community exposure locations, an urban control location, and a nonurban background location. EPA colocated sampling devices at one monitoring location to quantify the precision of their field measurements.
The database that U of L provided includes sampling results from eight monitoring stations (Station # 1, Station # 2, and Stations # 7–12), although they did not operate sampling equipment at Station # 1. Table 1 identifies the seven locations where U of L operated sampling equipment, and Figure 1 shows their locations. U of L’s monitoring locations include both potential maximum impact sites and community exposure sites. U of L operated colocated sampling equipment at one monitoring station.
Photographs on the Western Jefferson County Community Task Force web site show the placement of monitoring equipment at the monitoring locations (WJCCTF 2004).1 At Station # 2, U of L’s equipment is colocated with EPA’s, and all equipment is within a fenced-in area.
3.4 Monitoring Schedule
EPA’s monitoring schedule called for 24-hour average air samples to be collected at each location once every 12 days. EPA collected the first valid sample on April 18, 2000, and the last on April 28, 2001. During this window, EPA scheduled about 31 sampling dates at each location for VOCs, SVOCs, formaldehyde, reactive aerosols, and metals and trace elements. Such a schedule ensures that, over the course of the entire program, EPA collected samples on all days of the week and during all months of the year. ATSDR notes, though, that sampling 31 days at each location during an entire year represents only a small fraction (about 8.5%) of the year. This equates to a snapshot of chronic exposure conditions. However, for the purpose of this health consultation, ATSDR assumed the measured chemical concentrations during those 31 sampling days were representative of air concentrations throughout the entire year.
1 The ATSDR numbering scheme for the stations is different from the Web site for the West Jefferson County Community Task Force.
8
Rubbertown Health Consultation
The only exception to EPA’s sampling schedule was for the August 2000 pesticide and PCB sampling event. Over the entire year of monitoring, only one pesticide and PCB sampling event occurred. This sampling event was part of a special study to assist with a separate site-specific evaluation, and the results reportedly were not intended to be included among the WLATS monitoring data.
U of L conducted ambient air monitoring in two phases. Phase I was conducted from July to November 1999. This health consultation does not review the Phase I results, which were a qualitative (not quantitative) analysis of VOC air pollutants (WJCCTF 2004). During Phase II, U of L collected 24-hour average air samples at each monitoring location once every 12 days. Additionally, U of L measured VOCs in grab samples that were collected by manually opening the canister valve and rapidly filling the canister. According to U of L, these grab samples do not adhere to the quality control criteria of the sampling method; field personnel reportedly collected grab samples in cases when they noticed that the field equipment failed to collect a 24-hour average sample.
3.5 Data Quality
The analyses, conclusions, and recommendations in this health consultation are valid only if the referenced documents are complete and reliable. Both EPA and U of L provided their air sampling results to ATSDR in electronic form (EPA 2003c; U of L 2003). In the following paragraphs, ATSDR notes data quality issues related to these data sets.
EPA’s sampling included sufficient and appropriate quality control and quality assurance measures, such as following well-established methods, analyzing blank samples, using colocated monitoring stations, adhering to standard operating procedures, certifying sampling equipment before deployment to the field, and applying extensive data validation procedures. EPA conducted sampling in accordance with a quality assurance project plan.
EPA’s summary report does acknowledge some difficulties encountered with laboratory analytical equipment, but none of these difficulties appear to have compromised the quality of the overall data set. For example, problems with laboratory equipment caused some holding times to be exceeded during the program and caused some samples to be sent to another laboratory for analysis for a short period. EPA used qualifiers and remarks to log data quality concerns associated with these and other unforeseen events.
Although the sampling data that U of L provided have reportedly undergone an internal quality assurance review, no written summary of the quality of U of L's data appears to be available. ATSDR assessed data quality using multiple approaches, such as discussing data quality with laboratory officials and quantifying measurement precision and accuracy from the data provided.
ATSDR did not summarize or evaluate U of L's data from Station # 1 in this health consultation because the U of L measurements at this station were very incomplete and more reliable data from the EPA were available for this location. Several observations also suggest that some of U of L’s monitoring data from the other seven stations might not be of a known or high quality. First, the monitoring program had very low completeness and poor agreement between some chemical concentrations reported for U of L’s colocated sampling station data. Second, trends among the colocated measurements suggest that some of U of L’s sampling canisters or sampling
9
Rubbertown Health Consultation
equipment might have been contaminated during parts of the sampling program. Third, comparison of U of L’s sampling data and EPA’s sampling data from a colocated station (Station # 2) in some instances showed very poor agreement. With the exception of the data from Station # 1, ATSDR evaluated the U of L data for public health significance in this health consultation. However, when applicable, ATSDR further clarified a specific chemical’s data quality issues (see Discussion, Section 4).
3.6 Data Results
As an initial screen, ATSDR reviewed the EPA and U of L air data for each chemical to determine whether the maximum detected chemical concentration in West Louisville air is above the chemical’s protective health-based comparison values (CVs). Health-based CVs are estimates of daily human exposure to a chemical that are not likely to result in adverse health effects over a specified duration of exposure. ATSDR CVs are developed for specific media (air, water, and soil) and for specific durations of exposure (acute, intermediate, and chronic). This initial screen also identified those chemicals with no CVs.
Some of the CVs and health guidelines used by ATSDR scientists include ATSDR’s cancer risk evaluation guides (CREGs), environmental media evaluation guides (EMEGs), and minimal risk levels (MRLs). If an ATSDR CV is not available for a particular chemical, ATSDR sometimes screens environmental data with CVs developed by other sources, including the EPA’s reference concentrations (RfCs) and EPA’s Region III risk-based concentrations (RBCs). These CVs and health guidelines, as well as all other health-based screening criteria, represent conservative levels of safety; they are not thresholds of toxicity. Although concentrations at or below a CV may reasonably be considered safe, concentrations above a CV will not necessarily be harmful. To ensure that they will protect even the most sensitive populations (such as children or the elderly), CVs are intentionally designed to be much lower, usually by two or three orders of magnitude,2 than the corresponding no-observed-adverse-effect-levels (NOAELs) or lowest-observed-adverse-effect-levels (LOAELs) on which the CVs were based. Most NOAELs and LOAELs are established in laboratory animals; relatively fewer are derived from epidemiologic (chiefly occupational) studies. All ATSDR health-based CVs are nonenforceable and used for screening purposes only. See Appendix C for information on the derivation and intended use of comparison values used in this health consultation.
ATSDR regularly updates its environmental and health guidelines. Detailed information about ATSDR's substance-specific health guidelines (MRLs) are provided in ATSDR's Toxicological Profiles. When determining what environmental guideline value to use, ATSDR follows a general hierarchy. Hierarchy 1 includes ATSDR environmental guidelines such as CREGs and chronic EMEGs. In the absence of these values, Hierarchy 2 values (including ATSDR intermediate EMEGs), may be selected. When ATSDR environmental guidelines listed in the hierarchy are unavailable, those from other sources are considered (ATSDR 2005).
2 “Order of magnitude” refers to an estimate of size or magnitude expressed as a power of ten. An increase of one order of magnitude is the same as multiplying a quantity by 10, an increase of two orders of magnitude equals multiplication by 100, an increase of three orders of magnitude is equivalent of multiplying by 1000, and so on. Likewise, a decrease of one order of magnitude is the same as multiplying a quantity by 0.1 (or dividing by 10), a decrease of two orders of magnitude is the equivalent of multiplying by 0.01 (or dividing by 100), and so on.
10

Rubbertown Health Consultation
ATSDR selects chemicals for further consideration if either (a) their maximum concentrations exceed a relevant CV, or (b) there are no CVs listed for them. Based on its initial screen of more than 175 chemicals, ATSDR identified 29 chemicals for further consideration. These chemicals include 14 VOCs (acrylonitrile, benzene, bromoform, 1,3-butadiene, carbon tetrachloride, chloroform, chloroprene, 1,2-dichloroethane, ethyl acrylate, methylene chloride, toluene, 1,1,2-trichloroethane, 1,2,4-trimethylbenzene, and vinyl chloride), 4 SVOCs (acenaphthylene, 2nitrophenol, N-nitrosodi-n-propylamine, and phenanthrene), 5 metals (aluminum, arsenic, cadmium, chromium, and manganese), 5 pesticides (alpha-chlordene, beta-chlordene, chlordene, dieldrin, and toxaphene), and formaldehyde. Tables 2–6 provide data for each of these chemicals including the number of valid samples collected, the range of concentrations, the station number (and date) of the highest concentration, and the CV.
4.0 Discussion In this section, ATSDR addresses the question of whether exposure to the levels of air chemicals detected in and around West Louisville could result in harmful health effects. While the relative toxicity of a chemical is important, the human body’s response to a chemical exposure is determined by several additional factors. These include
• the concentration (how much) of the chemical to which the person was exposed,
• the amount of time (how long) the person was exposed, and
• the route by which the person was exposed (through breathing, eating, drinking, or direct contact with something containing the chemical).
Lifestyle factors (for example, occupation and personal habits) have a major impact on the likelihood, magnitude, and duration of exposure. Individual characteristics such as age, sex, nutritional status, overall health, and genetic constitution affect how the human body absorbs, distributes, metabolizes, and eliminates a contaminant. A unique combination of all these factors will determine the individual's physiologic response to a chemical contaminant and any harmful health effects the individual could suffer as a result of the chemical exposure.
ATSDR notes that low levels of some chemicals in the air may exacerbate respiratory symptoms in sensitive individuals. For this health consultation, “sensitive individuals” are those with preexisting respiratory conditions that lead to any kind of compromised lung function, including asthma, emphysema, influenza, and chronic bronchitis. Sensitive individuals include those with allergic reactions to certain chemicals. Allergic reactions do not exhibit the same relatively predictable dose-response behavior as non-allergic reactions. In addition, other factors may affect respiratory health. For example, cold air and warm, humid air are known to aggravate respiratory ailments in sensitive individuals. Urban areas, like the Rubbertown industrial area in West Louisville, are known to have increased levels of air pollution that can adversely affect sensitive individuals. In general, ATSDR would advise sensitive individuals to stay indoors as a protective public health measure whenever air pollution is worse than usual. For information on air quality, the AIRNow web site at http://airnow.gov/ provides the public with easy access to national air quality information, daily air quality forecasts, and real-time air quality conditions for over 300 cities across the United States (including Louisville, KY). The URL also provides links to more detailed state and local air quality Web sites.
11
Rubbertown Health Consultation
West Louisville residents are exposed to ambient urban air pollution. Inhalation is the main route of exposure. Based on its initial screen of more than 175 chemicals, ATSDR identified 29 chemicals for further consideration because either (1) their maximum concentrations exceed a relevant CV, or (2) there are no CVs listed for them. When a health guideline is exceeded, a first step in understanding the public health significance of exceeding that guideline is to review and understand the basis for that guideline. Understanding the applicability and strength of the study data is a primary tool in evaluating whether site exposures are likely to cause harm. The goal of the analysis is to determine where site-specific doses lie in relation to the observed effects levels reported in the studies of interest and whether differences between study data and the exposure scenario being evaluated make health effects more or less likely (ATSDR 2005).
When developing health guidelines such as MRLs, ATSDR toxicologists extensively study the toxicologic literature and weigh the scientific data. Reviewing the basis for an MRL or other health guideline as part of a site-specific analysis in no way diminishes the importance of the health guideline; rather, it serves as a means of gaining perspective on how strongly the supporting toxicologic data suggest that harmful exposures have occurred or might occur under site-specific exposure conditions (ATSDR 2005).
Two key steps in this analysis involve (1) comparing site exposure doses with observed effect levels reported in critical studies and (2) carefully considering study parameters in the context of site exposures (ATSDR 2005). This analysis requires the examination and interpretation of reliable substance-specific health effects data. This includes reviews of epidemiologic (human) and experimental (animal) studies. Clearly, a study based on human data holds the greatest weight in describing relationships between a particular exposure and a human health effect. Fewer uncertainties exist about potential outcomes documented in well-designed epidemiologic studies. Therefore, understanding the strengths and weaknesses of the epidemiologic studies will help determine the suitability of a particular study in supporting and drawing public health conclusions (ATSDR 2005).
ATSDR scientists evaluate the relevance of animal data to humans on a case-by-case basis. Numerous considerations affect the quality of experimental data and its relevance to site-specific exposures. As a general guide, these factors (as well as many others not mentioned here) are considered:
• The relevance of the findings is influenced by how the test animal received its dose (e.g., gavage/water, gavage/oil, water, food, or vapor). Often, the exposure route in experimental studies is different from the route by which people living near a site could be exposed. These differences can influence the likelihood of adverse health effects.
• In addition to the method of dosing described above, the dosing regimen can influence the absorption and ultimately the observed effects. For example, were animals dosed continuously or intermittently? Were animals dosed over the short-term or long-term?
• Bioavailability is factored into the analysis when there is evidence that the chemical form at the site is more or less bioavailable than the chemical form used in the studies.
• Understanding the biologic changes that ultimately lead to clinical disease in a test animal aids in determining how well animal data might predict the same type of adverse effect in humans. For example, ATSDR might note if the animal mode of action is
12
Rubbertown Health Consultation
plausible in humans. Metabolism or mechanistic data, if available, could provide insight whether observed effects might be unique to, or different in, the study animal compared to humans. In the absence of such data, ATSDR assumes that similar effects would occur in humans.
Overall, assessing the relevance of available epidemiologic and experimental studies with respect to site-specific exposures requires both technical expertise and professional judgment. Because of uncertainties regarding exposure conditions and the adverse effects associated with environmental levels of exposure, definitive answers about whether health effects actually will or will not occur are not always possible. However, providing a framework that puts site-specific exposures and the potential for harm in perspective is possible and is one of the primary goals of ATSDR’s public health evaluation process (ATSDR 2005). In the following sections, ATSDR describes the key points of its site-specific analysis for each of the 29 chemicals chosen for further evaluation.
4.1 August 2000 Air Sampling Event
On August 28, 2000, EPA conducted one round of pesticide and PCB sampling (see Table 6). It is important to note that the chemical levels detected during this one sampling event might not accurately characterize typical chemical levels in West Louisville air throughout the year. However, for the purpose of this health consultation, ATSDR assumed that the levels would not vary by more than an order of magnitude in our evaluation. With the exception of a PCB congener detected once at a level below ATSDR’s CREG, no other PCBs were detected during this sampling event. Based on ATSDR’s initial data screen, five pesticides (alpha-chlordene, beta-chlordene, chlordene, dieldrin, and toxaphene) were considered for further evaluation.
Chlordene and Its Isomers
Chlordene (as well as its isomers—alpha-chlordene and beta-chlordene) is an intermediary product used in the manufacture of the insecticides chlordane and heptachlor (HSDB 2004). During the one round of pesticide sampling, EPA detected isomers of chlordene in 6 of 11 air samples. The maximum concentration detected by EPA was 0.000085 micrograms per cubic meter (µg/m3).
Chlordene was selected for discussion because no comparison values exist for this chemical. As a surrogate screening value, ATSDR used the CREGs for heptachlor and chlordane (0.0008 µg/m3 and 0.01 µg/m3, respectively). These CREGs are greater than the maximum concentrations of chlordene isomers detected in West Louisville air. Chlordene is 50 times less potent than heptachlor to houseflies with regard to acute toxicity (HSDB 2004). Because (a) chlordene is less toxic than either heptachlor or chlordane, and (b) its maximum detected concentration is less than the CVs for both heptachlor and chlordane, the available data for August 28, 2000, suggest that chlordene would not be expected to harm exposed West Louisville residents.
Dieldrin
From the 1950s until 1970, dieldrin was a widely used pesticide for crops like corn and cotton. Because of concerns about damage to the environment and potentially to human health, EPA banned all uses of dieldrin in 1974, except to control termites. In 1987, EPA banned all uses (ATSDR 2002). During the one round of pesticide sampling, EPA detected dieldrin in 2 out of 5
13
Rubbertown Health Consultation
air samples. One of those detections (0.00021 µg/m3) is essentially equivalent to the CREG (0.0002 µg/m3). The ATSDR inhalation CREG is based on mouse liver tumors resulting from high oral doses. At this time, there are no animal or human studies that indicate the carcinogenic potential of dieldrin via the inhalation route (ATSDR 2002). Because dieldrin levels are essentially equivalent to the CREG, the available data for August 2000 suggest that dieldrin in air is unlikely to harm exposed West Louisville residents.
Toxaphene Toxaphene was one of the most heavily used insecticides in the United States until 1982, when it was canceled for most uses; all uses were banned in 1990 (ATSDR 1996). EPA detected toxaphene in 1 out of 5 air samples. This one detection (0.015 µg/m3) exceeds the toxaphene CREG of 0.003 µg/m3. No studies have been located regarding cancer effects in animals or humans following inhalation exposure to toxaphene (ATSDR 1996). (As with dieldrin, the ATSDR inhalation CREG is based on animal studies with high oral doses.) The limited data suggest that toxaphene in air is not likely to result in adverse health effects in exposed West Louisville residents.
4.2 April 2000 to April 2001 Routine Air Sampling Program
Between April 2000 and April 2001, air samples were collected and analyzed every 12 days. Although the data were limited, for the purpose of this health consultation, ATSDR assumed the chemical concentrations measured during the 31 sampling days were representative of air concentrations throughout the entire year. This assumption was considered reasonable because samples were collected on all days of the week and during all months of the year. ATSDR’s initial data screen identified 24 contaminants for further consideration. These contaminants include 14 VOCs (acrylonitrile, benzene, bromoform, 1,3-butadiene, carbon tetrachloride, chloroform, chloroprene, 1,2-dichloroethane, ethyl acrylate, methylene chloride, toluene, 1,1,2-trichloroethane, 1,2,4-trimethylbenzene, and vinyl chloride), 4 SVOCs (acenaphthylene, 2nitrophenol, N-nitrosodi-n-propylamine, and phenanthrene), 5 metals (aluminum, arsenic, cadmium, chromium, and manganese), and formaldehyde.
For each of the 24 chemicals, ATSDR reviewed the frequency of detection and the range of measured concentrations (see Tables 2–5). ATSDR calculated each station’s average ambient air concentration for those chemicals detected most frequently (Tables 7 and 8). All nondetects were set at concentrations equal to one-half the detection limit for the calculations of station averages. To determine the presence of spatial trends for those chemicals detected most frequently, ATSDR looked at the magnitude of the chemical concentration difference between station averages, the number of samples at each station, and the variance (the averaged squared deviation from the mean) among the measured concentrations at each station. For additional perspective related to spatial trends, ATSDR reviewed TRI air emission data to note qualitatively whether a chemical of concern in the air could be potentially related to a nearby facility’s air emissions. Typical levels of several ubiquitous chemicals found in the air in rural and urban areas of the United States (as reported in ATSDR’s Toxicological Profiles) were mentioned to put site-specific concentrations into perspective for the reader, and not to imply the acceptability of the levels from a public health perspective. For additional information regarding air toxics
14
Rubbertown Health Consultation
around the country, ATSDR suggests that readers access EPA’s 1999 National Air Toxics Assessment (NATA) risk characterization at http://www.epa.gov/ttn/atw/nata1999/.
As part of its evaluation, ATSDR calculated cancer risk estimates for some chemical carcinogens of potential interest (see Tables 9 and 10). To calculate estimates, each chemical’s average concentration is multiplied by its EPA IUR. These cancer risk estimates are expressed as a probability; that is, the proportion of a population that may be affected by a carcinogen during a lifetime of exposure (24 hours/day, 365 days/year, for 70 years). For example, an estimated cancer risk of 2 × 10⁻⁶ represents potentially two excess cancer cases in a population of one million over a lifetime of continuous exposure.
Different organizations (e.g., ATSDR, EPA, etc.) have different perspectives on what constitutes a minimal level of concern for increased lifetime cancer risk. For this health consultation, ATSDR developed its own site-specific guidelines to assist in describing its evaluation of the levels of estimated cancer risk posed by Rubbertown air toxics (see Table 11). For example, ATSDR finds that cancer risk estimates less than 1 × 10⁻⁵ typically indicate that epidemiologic and experimental studies would support a finding of “no increased cancer risk.”
For each of the 24 chemicals, ATSDR reviewed the available data on the levels of each chemical known to cause adverse health effects in animals and humans. The following text outlines ATSDR’s evaluation of the public health implications of the site-specific chemicals of interest.
Acenaphthylene
A natural polycyclic aromatic hydrocarbon (PAH) component of crude oil and coal tar, acenaphthylene is released by both natural and artificial combustion sources. Acenaphthylene is one of the few PAHs that are produced commercially in the United States, and one of the most abundant PAHs in emissions from residential wood burning.
EPA detected acenaphthylene in 9 of 167 air samples. The detected concentrations range from 0.0034 µg/m3 to 0.0081 µg/m3. All nine detected concentrations were estimated concentrations (i.e., J-qualified values) and therefore were at levels where one would expect to see variability among the measurements. The nine detections occurred at five different monitoring locations, including the urban control location, during November and December of 2000. The sampling data provide no clear evidence of notable spatial variations in acenaphthylene levels. The TRI database does not report information on air emissions for the chemical acenaphthylene. The atmospheric lifetime of acenaphthylene is on the order of a few hours.
Tricyclic PAHs like acenaphthylene and acenaphthene are relatively nontoxic (ATSDR 1995). No ATSDR health-based CVs exist for acenaphthylene; the chemical is not genotoxic and EPA considers it “not classifiable as to human carcinogenicity.” Therefore, as a surrogate screening value, ATSDR used a CV for a very similar compound, acenaphthene or 1,8-dihydroacenaphythalene. (The addition of two hydrogen atoms across the non-benzene double bond converts acenaphthylene into acenaphthene.) Acenaphthene has a noncancer RBC of 220 µg/m3. This RBC represents a concentration in ambient air that is considered unlikely to cause adverse health effects over a lifetime of chronic exposure. The maximum concentration of acenaphthylene detected in West Louisville air is several orders of magnitude lower than the acenaphthene RBC. In addition, this RBC is based on chronic (long-term) exposure, but the EPA
15
Rubbertown Health Consultation
air data indicate acenaphthylene is detected sporadically. Therefore, levels of acenaphthylene detected in ambient air would not be expected to harm exposed West Louisville residents.
Acrylonitrile
Acrylonitrile is a colorless, liquid, man-made chemical with a sharp, onionlike or garliclike odor. It is used to make other chemicals such as plastics, synthetic rubber, and acrylic fibers. Because acrylonitrile evaporates easily, most of it is released to the air from facilities where it is produced and used (ATSDR 1990).
EPA detected acrylonitrile only once in 165 air samples. The concentration in this one sample was 1.9 µg/m3. U of L detected acrylonitrile in 38 of 89 samples. Across the seven U of L monitoring stations, the highest average concentration was 0.45 µg/m3 at Station # 2 (maximum impact and community exposure location within the industrial area). The average concentrations for the other six U of L stations range from 0.22 µg/m3 to 0.34 µg/m3. According to the 2000 and 2001 TRI data, one facility located in the Rubbertown industrial area (Zeon) ranks in the top five highest air emission sources in the country for acrylonitrile. Two other air emission sources in Rubbertown are American Synthetic Rubber and Rohm & Haas. Station # 2 is surrounded by these three facilities.
Detected levels of acrylonitrile in West Louisville air do not exceed health-based screening values for lifetime noncancer effects. ATSDR therefore concludes that the levels of acrylonitrile in West Louisville air are not likely to produce noncancer harmful health effects in exposed residents.
However, acrylonitrile concentrations exceed the health-based screening value for lifetime cancer effects, specifically its CREG of 0.01 µg/m3. When a comparison value like a CREG is exceeded, understanding the applicability and strength of the study data is a primary tool in evaluating whether site exposures are likely to cause harm. The lowest inhalation cancer effect level (CEL) for multiple tumors, including brain tumors is 20 parts per million (ppm), which is equivalent3 to 43,400 µg/m3, in rats exposed 6 hours/day, 5 days/week, for 2 years (ATSDR 1990)—essentially a lifetime for a rat. However, there is no similarity between the types of cancer induced in rodents and those that have been potentially associated with occupational (i.e., worker) exposure (NTP 2001). Therefore, a careful review of the epidemiologic studies is necessary to provide perspective on whether the data suggest that harmful exposures might occur under site-specific exposure conditions.
The first acrylonitrile epidemiologic study (O’Berg 1980) analyzed cancer incidence and mortality in 1,345 male textile workers potentially exposed to acrylonitrile for six or more months between 1956 and 1976. EPA’s Integrated Risk Information System (IRIS) database states that exposures in the study ranged from 5–20 ppm (10,900–43,400 µg/m3) (EPA 2003b). Although cancer incidence did not achieve statistical significance during the study period (1956–
3 In water or soil, 20 ppm would be equivalent to 20,000 µg/m3. However, because air is a gas whose volume depends on its temperature and pressure, the conversion of ppm to µg/m3 depends upon both the volume of the gas and the molecular weight of the aerosolized toxicant. The conversion is typically calculated according to the equation µg/m3 = [(1000 × ppm) (gram molecular weight of the substance)] ÷ 24.45, where 24.45 is the molar volume of air at STP conditions (25°C and 760 torr) (AGCIH 2004).
16

Rubbertown Health Consultation
1976), lung cancer excesses reported by O’Berg (1980) did achieve statistical significance during a restricted period of time (1970–1976). Regarding the other nine occupational studies published prior to 1983, five were negative, three reported statistically significant increases of lung cancer, and one reported a nonsignificant increase in cancer mortality (EPA 2003b). The great majority of studies published after 1983 (including a 1985 follow-up study by O’Berg and colleagues) did not report lung cancer excesses (Ward and Starr 1993). Based on the exposure levels reported in IRIS for the 1980 O’Berg study, acrylonitrile levels in West Louisville air are several orders of magnitude below levels potentially associated with lung cancer in workers. ATSDR’s examination and interpretation of reliable substance-specific health effects data find the detected levels of acrylonitrile in West Louisville air are unlikely to produce cancerous effects in area residents.
As an additional measure, ATSDR calculated cancer risk estimates for each U of L station (see Table 10). Based on U of L station averages, the estimates range from 1.5 × 10⁻⁵ (Stations # 10 and # 11, community exposure locations) to 3.06 × 10⁻⁵ (Station # 2, maximum impact and community exposure location within the industrial area). ATSDR’s cancer risk estimates suggest “no apparent increased cancer risks” for acrylonitrile air exposures in West Louisville (Table 11). As defined by ATSDR for this health consultation, the “no apparent increased cancer risk” category indicates that exposures are not likely to result in a cancerous adverse impact to human health. However, ATSDR considers it a prudent public health measure to reduce or eliminate releases of chemical carcinogens like acrylonitrile into West Louisville air wherever possible.
Aluminum
Aluminum is the most abundant metal. It occurs naturally in soil, water, and air. High levels in the environment can be caused by the mining and processing of its ores and by the production of aluminum metal, alloys, and compounds. Small amounts of aluminum are released into the environment from coal-fired power plants and incinerators. Virtually all food, water, and air contain some aluminum (ATSDR 1999a).
EPA detected aluminum in 139 of 151 air samples. The average concentrations from each station range from 0.15 µg/m3 (Station # 6, nonurban background location) to 3.6 µg/m3 (Station # 2, maximum impact and community exposure location within the industrial area). This spatial difference most likely reflects the fact that Station # 2 is the monitoring station closest to Eckart America, one of the highest aluminum (fume or dust) air emission sources in the country, according to 2000 and 2001 TRI data.
The aluminum concentration in 13 of 151 samples (8.6%) exceeded the noncancer RBC (3.7 µg/m3), a level considered safe for a lifetime of exposure. Ten of the 13 detections above the comparison value were at Station # 2. The other three were at Station #1 (maximum impact location). This station had the second highest average concentration for aluminum (0.97 µg/m3). Although some 24-hour aluminum concentrations exceed the RBC, the average aluminum concentrations for all stations are lower than the noncancer RBC and are two orders of magnitude below known adverse health effect levels. Therefore, ATSDR concludes the levels of aluminum detected in West Louisville air are not likely to harm local residents.
17

Rubbertown Health Consultation
Arsenic
Arsenic occurs naturally in soil and minerals and therefore it may enter the air from wind-blown dust. Arsenic is associated with ores mined for metals, such as copper and lead, and may enter the environment during the mining and smelting of these ores. Small amounts of arsenic also may be released into the atmosphere from coal-fired power plants and incinerators because coal and waste products often contain some arsenic. Mean levels in ambient air in the United States have been reported to range from less than 0.001 to 0.003 µg/m3 in remote areas and from 0.02 to 0.03 µg/m3 in urban areas (ATSDR 2000a).
EPA detected arsenic in 149 of 151 air samples. All 149 detections exceed the arsenic CREG of 0.0002 µg/m3 for continuous lifetime exposure to arsenic in ambient air. No noncancer ATSDR CVs are available for arsenic in air. The maximum concentration (0.011 µg/m3) was detected at Station # 3 (community exposure location within the industrial area). The average concentrations from each monitoring station exhibit modest spatial variations, ranging from 0.0011 µg/m3
(Station # 5, urban control location) to 0.0020 µg/m3 (Station # 2, maximum impact and community exposure location within the industrial area). These average levels measured throughout West Louisville air (an urban location) are not elevated compared to mean arsenic levels in ambient air in remote areas (0.001–0.003 µg/m3) (ATSDR 2000a). As stated previously, typical levels found in the air were mentioned by ATSDR to put site-specific concentrations into perspective for the reader, not to imply the acceptability of the levels from a public health perspective. Although TRI data for 2000 and 2001 do not indicate any facilities in the Rubbertown industrial area as being large arsenic air sources, TRI data do not capture smaller stationary and mobile emission sources.
The lowest reported human inhalation CEL is 50 µg/m3 for lung cancer in workers exposed to inorganic arsenic in air for from 3 months to 30 years at a copper smelter (ATSDR 2000a). The average concentrations of arsenic detected in West Louisville air are well below all human inhalation NOAELs, LOAELs and CELs reported for inorganic arsenic in ATSDR’s 2000 Toxicological Profile. As an additional measure, ATSDR calculated cancer risk estimates for each EPA station (see Table 9). On the basis of EPA station averages, these estimated risks for arsenic range from 4.73 × 10⁻⁶ (Station # 5, urban control location) to 8.6 × 10⁻⁶ (Station # 2, maximum impact and community exposure location within the industrial area). ATSDR’s cancer risk estimates and evaluation of the available studies suggest “no increased cancer risks” for arsenic air exposures in West Louisville (see Table 11). Overall, ATSDR concludes that the arsenic levels detected in West Louisville air are not likely to harm exposed West Louisville residents. However, ATSDR considers it a prudent public health measure to reduce or eliminate releases of chemical carcinogens like arsenic into West Louisville air wherever possible.
Benzene
Benzene is a common solvent isolated from coal tar and crude oil. Outdoor (ambient) air concentrations in the United States average 6 µg/m3 (1.9 ppb) and range from 2 to 19 µg/m3
(0.6–5.9 ppb). Levels in urban areas are generally higher than those in rural areas. Average rural background levels of benzene in air historically range from 0.1 to 17 ppb (IARC 1982). However, since 1986, statewide average levels at about 20 sites throughout California fluctuated between 1.6 and 2.2 ppb (5.12–7.04 µg/m3) until 1993 and 1994, when they dropped to about
18

Rubbertown Health Consultation
1.25 ppb (4 µg/m3)—probably due to various actions taken to reduce automobile emissions (Wallace 1996). Average levels were higher in winter and lower in summer (ATSDR 1997a).
EPA detected benzene in 160 of 180 air samples. The maximum concentration of benzene detected all year was 10 µg/m3. U of L detected benzene in 122 of 127 samples, and the maximum concentration detected all year was 13.2 µg/m3. The highest average concentration observed at an EPA monitoring location is 2.1 µg/m3 (Station # 1, maximum impact location), and the highest average concentration at a U of L monitoring location is 2.4 µg/m3 (Station #7, community exposure location). These average ambient levels of benzene are below those found in California and similar to those found in other areas of the country.
The Chevron Louisville Terminal and Marathon Oil Terminals reported benzene emissions to the 2000 and 2001 TRI. The highest ranking facility (Marathon Oil Terminal (K)) is closest to Stations # 2 and # 3 and not where the highest benzene levels were observed. The observed benzene levels might result from mobile emissions sources, like automobiles, rather than being influenced mainly by large stationary sources at Rubbertown. As stated previously, TRI data do not capture smaller stationary and mobile emission sources.
Both the EPA and U of L detected benzene at concentrations higher than the CREG of 0.01 µg/m3. The lowest human effect levels reported in ATSDR’s Toxicological Profile for Benzene (ATSDR 1997a) are 690 ppb (2,200 ug/m3) for leukopenia (Xia et al. 1995) and 300 ppb (960 ug/m3) for leukemia (Ott et al. 1978). These values (690 ppb and 300 ppb) represent the lowest measured concentrations in a range of industrial hygiene measurements in each facility in the two studies, which were 690–140,000 ppb and 300–35,000 ppb, respectively. Use of the lowest measured concentration as an indicator of exposure in the facilities is conservative and will likely underestimate actual exposures. Assuming a normal dose-response relationship, in which lower doses are less toxic than higher ones, any adverse effects caused by benzene would be expected to occur in workers exposed to the higher, rather than the lower end of those exposure ranges. This expectation is consistent with the epidemiologic and toxicologic literature (Paustenbach et al. 1992; Rinsky et al. 1987; Wong 1995). An update of the Ott study (Bond et al. 1986) noted that “workers who died of leukemia had the potential for unquantified, but potentially high, exposures to benzene.” Benzene levels in West Louisville air are orders of magnitude below levels associated with cancer in workers.
As an additional measure, ATSDR calculated cancer risk estimates for each station (Tables 9 and 10). On the basis of EPA station averages, these estimates for benzene range from 5.77 × 10⁻⁶
(Station # 6, nonurban background location) to 1.64×10⁻⁵ (Station # 1, maximum impact location). On the basis of U of L station averages, these estimates for benzene range from 6.79 × 10⁻⁶ (Station # 9, community exposure location) to 1.87 × 10⁻⁵ (Station # 7, community exposure location). ATSDR’s cancer risk estimates and evaluation of the available studies suggest “no apparent increased cancer risks” for benzene air exposures in West Louisville (see Table 11). ATSDR concludes that benzene levels in West Louisville air are unlikely to be associated with any cancerous or noncancerous adverse health effects. However, ATSDR considers it a prudent public health measure to reduce or eliminate releases of chemical carcinogens like benzene into West Louisville air wherever possible.
19
Rubbertown Health Consultation
Bromoform
Bromoform is a colorless to yellow, heavy, nonburnable liquid with a sweetish odor. In the past, bromoform was used by industry to dissolve dirt and grease and to make other chemicals. Currently, bromoform is only produced in small amounts for use in laboratories and in geological and electronics testing (ATSDR 2003a).
Bromoform was not detected in any of the samples that EPA analyzed. U of L detected bromoform in 7 of 121 samples. The maximum concentration of 34.9 µg/m3 (Station # 7, community exposure location) was detected on June 29, 2000. No facilities in the Rubbertown industrial area reported bromoform air emissions to the 2000 or 2001 TRI, although TRI data do not capture smaller stationary and mobile emission sources.
Although no ATSDR inhalation noncancer CV is available for bromoform, the maximum concentration is two orders of magnitude lower than the 8-hour threshold limit value (TLV) of 500 ppb (5,170 µg/m3). The TLV, according to the American Conference of Governmental Industrial Hygienists (ACGIH), is the time-weighted average concentration for a normal 8-hour workday and a 40-hour workweek to which nearly all workers may be repeatedly exposed, day after day, without adverse effect (ACGIH 2004). TLVs, which were designed to protect healthy workers, are usually higher than ATSDR health-based comparison values, which were designed to protect the health of the general population, including the very young and the elderly. TLVs are mentioned by ATSDR to put site-specific concentrations of contaminants into perspective for the reader, especially when no other nonoccupational, noncancer CVs are available.
Overall, five of the seven U of L detections occurred on July 23, 2000, with concentrations ranging from 8.7 µg/m3 to 15.6 µg/m3. The seven U of L detections all exceed the bromoform CREG of 0.9 µg/m3; however, chronic exposure is not occurring, so no cancerous adverse health effects would be expected. The detected levels and frequency of detection of bromoform in West Louisville air are unlikely to be harmful to human health.
1,3-Butadiene
1,3-Butadiene is a colorless gas that is widely found in urban air from various sources, including rubber and plastic production, auto exhaust, gasoline stations, and cigarette smoke. EPA detected 1,3-butadiene in 71 of 180 air samples and the U of L detected 1,3-butadiene in 73 of 121 air samples. The average 1,3-butadiene concentrations for EPA’s monitoring stations were 0.36–4.5 µg/m3, and the averages for U of L’s monitoring stations were 0.53–3.4 µg/m3. Trends among EPA’s data indicate that the average concentrations measured at Stations # 2 and # 3, which are both community exposure locations within the industrial area, are approximately 5–10 times higher than the average levels observed at the other stations. U of L’s data also indicate that the average concentration measured at Station # 2 is higher than the other stations.
The spatial variations are most likely related to the presence of local air emission sources. On the basis of the 2000 and 2001 TRI data, one Rubbertown facility (American Synthetic Rubber) is among the top five highest self-reported 1,3-butadiene emitters in the country. Two other Rubbertown facilities (Rohm & Haas and Zeon) are within the top 100 nationwide. Stations # 2 and # 3 are nearest to these facilities. The concentrations of 1,3-butadiene at these locations are clearly elevated relative to the other stations.
20
Rubbertown Health Consultation
The maximum 24-hour concentrations detected by EPA (51 µg/m3) and by U of L (13.5 µg/m3) exceed EPA’s 1,3-butadiene RfC of 2 µg/m3. The highest average concentrations measured at Station # 2 (4.5 µg/m3) and Station # 3 (3.3 µg/m3) are slightly above the RfC of 2 µg/m3. All other average concentrations from stations located within the West Louisville community are below this 1,3-butadiene RfC. The RfC is an estimate of a concentration of a substance in air that EPA considers unlikely to cause noncancer adverse health effects over a lifetime of continuous exposure. Because (a) average concentrations at Stations # 2 and # 3 are just slightly above this RfC and (b) all other average concentrations from stations in West Louisville are below this RfC, exposure to 1,3-butadiene is not likely to result in noncancerous adverse health effects.
All 1,3-butadiene detections by EPA and U of L are above the ATSDR CREG of 0.03 µg/m3. The lowest CEL reported in ATSDR’s Toxicological Profile for 1,3-Butadiene (ATSDR 1992a) is 6.25 ppm (or 13,827 µg/m3) in female mice treated for 65 weeks (roughly half a lifetime for a mouse). Mice may be more sensitive than humans to the effects of 1,3-butadiene (Melnick et al. 1989; Melnick et al. 1990; Boogaard et al. 2001). The 1,3-butadiene concentrations in West Louisville air are well below this animal CEL.
Regarding the epidemiologic studies, the largest 1,3-butadiene study is a retrospective cohort study of over 15,000 styrene-butadiene rubber workers employed between 1943 and 1991 in eight plants studied at the University of Alabama at Birmingham (UAB cohort), with a maximum of 49 years of followup (Delzell et al. 1996; EPA 2002b). This study found a statistically significant association between worker exposure to 1,3-butadiene and mortality due to leukemia. The excess of leukemia deaths were mostly in men over 55 who had been employed before 1960. The observed association between excess leukemia deaths and butadiene exposure from the UAB cohort was weaker in the study update (Delzell et al. 2001). In the study update, increased relative risks were statistically significant only in the highest exposure category (Delzell et al. 2001).
As an additional protective measure, ATSDR calculated cancer risk estimates for each station (see Tables 9 and 10). Based on station averages, these estimates for 1,3-butadiene exceed 1 × 10⁻⁴ at Station # 2 (maximum impact and community exposure location within the industrial area) and approach 1 × 10⁻⁴ at Station # 3 (community exposure location within the industrial area). ATSDR’s cancer risk estimates suggest there are “low increased cancer risks” for 1,3-butadiene air exposures in West Louisville (Table 11). ATSDR finds long-term exposure to 1,3-butadiene in outdoor air is associated with a low increased risk of developing cancer, especially in the industrial area.
With regard to short-term exposures, the maximum concentration of 1,3-butadiene detected by U of L in a grab (instantaneous) sample is 88.2 µg/m3. The NOAEL established for acute neurological effects in humans is 8,000 ppm, or about 17,700,000 µg/m3 (ATSDR 1992a). The Occupational Safety and Health Administration’s (OSHA) short-term exposure limit (STEL) for 1,3-butadiene is 5 ppm, or 11,063 µg/m3. The highest instantaneous concentration (88.2 µg/m3) measured in West Louisville air is several orders of magnitude below the NOAEL and STEL values. Therefore, acute noncancer adverse health effects are unlikely.
Overall, ATSDR considers that 1,3-butadiene in West Louisville air, at the levels measured, is not likely to produce noncancer harmful effects in currently exposed residents. Long-term
21

Rubbertown Health Consultation
exposure to 1,3-butadiene is associated with a low increased risk of developing cancer, especially in the industrial area. ATSDR considers it a prudent public health measure to reduce or eliminate releases of chemical carcinogens like 1,3-butadiene into West Louisville air wherever possible.
Cadmium
Cadmium is an element that occurs naturally in the earth's crust. It has many uses in industry and consumer products, mainly in batteries, pigments, metal coatings, plastics, and some metal alloys. Mean levels of cadmium in ambient air range from less than 0.001 µg/m3 in remote areas to 0.003–0.04 µg/m3 in urban areas (ATSDR 1999b).
EPA detected cadmium in roughly half (73 of 151) of its air samples. The concentrations detected in 30 samples are above the cadmium CREG of 0.0006 µg/m3. For monitoring locations within the Rubbertown industrial area (Stations # 1–3), the average concentrations range from 0.00047 µg/m3 to 0.00099 µg/m3; at a community exposure location (Station # 4), the average level is 0.00046 µg/m3; at the urban control location (Station # 5), the average level is 0.00060 µg/m3; and the average level at the nonurban background location (Station # 6) is 0.00036 µg/m3. ATSDR did not see any notable spatial or temporal (i.e., seasonal) trends. These average levels measured throughout West Louisville air are not elevated compared to mean cadmium levels in ambient air in the United States. TRI data for 2000 and 2001 do not indicate that any of the facilities in the Rubbertown industrial area are large cadmium air sources, although as stated previously, TRI data do not capture smaller stationary and mobile emission sources.
Average cadmium concentrations in West Louisville air are all comparable to the CREG (0.0006 µg/m3). The lowest inhalation CEL for cadmium (as CdCl2) published in ATSDR’s Toxicological Profile is 13.4 µg/m3 (ATSDR 1999). Average cadmium air concentrations are several orders of magnitude below this CEL. As an additional measure, ATSDR calculated cancer risk estimates for each EPA station (see Table 9). Based on EPA station averages, these estimates for cadmium range from 6.48 × 10⁻⁷ (Station # 6, nonurban background location) to 1.78 × 10⁻⁶ (Station # 3, community exposure location within the industrial area). ATSDR’s cancer risk estimates and evaluation of the available studies suggest there are “no increased cancer risks” for cadmium air exposures in West Louisville (see Table 11). ATSDR concludes that cadmium levels in West Louisville air are unlikely to produce adverse health effects in exposed residents. However, ATSDR considers it a prudent public health measure to reduce or eliminate releases of chemical carcinogens like cadmium into West Louisville air wherever possible.
Carbon Tetrachloride
Carbon tetrachloride (CCl4) is a clear liquid that evaporates very easily. It does not occur naturally, but has been produced in large quantities to make refrigeration fluid and propellants for aerosol cans. Since many refrigerants and aerosol propellants have been found to affect Earth's ozone layer, the production of these chemicals (including carbon tetrachloride) is being phased out. Consequently, the manufacture and use of CCl4 will probably decline a great deal in the future. Because of past and present releases, background levels of CCl4 are found in air, water, and soil. Concentrations in air of 0.1 ppb (0.63 µg/m3) are common around the world, with somewhat higher levels of 0.2–0.6 ppb (1.3–3.8 µg/m3) often found in cities (ATSDR 2003b).
22
Rubbertown Health Consultation
Both EPA and U of L detected carbon tetrachloride in at least 70% of their samples. The measured levels displayed little variability: average concentrations across all of the EPA and U of L stations range from 0.58 µg/m3 to 0.74 µg/m3. TRI data for 2000 and 2001 do not indicate any facilities in the Rubbertown industrial area as being large CCl4 air sources, although as stated previously, TRI data do not capture smaller stationary and mobile emission sources. The average CCl4 levels fall within the range of concentrations that are routinely measured in urban and suburban locations around the country, regardless of geographical location and population density (EPA 1999e).
All detected concentrations are above the carbon tetrachloride CREG of 0.07 µg/m3, but below the chronic MRL of 30 ppb (19 µg/m3). Because no inhalation CELs are listed for either animals or humans in ATSDR’s Toxicological Profile for Carbon Tetrachloride (ATSDR 2003b), the inhalation CREG was extrapolated from the results of oral studies in animals. Rodent liver tumors were observed in the available positive oral studies. The lowest CEL was 20 mg/kg per day in mice treated by gavage for 120 days (ATSDR 2003b). To inhale an equivalent amount over a 24-hour period, the concentration of CCl4 in air would be around 70,000 µg/m3. The highest level of carbon CCl4 detected in West Louisville air was several orders of magnitude lower than this concentration. And, only about 70% of the air that is inhaled reaches the alveoli where it could be absorbed into the bloodstream (Guyton and Hall 1996).
As an additional measure, ATSDR calculated cancer risk estimates for each station (see Tables 9 and 10). On the basis of EPA station averages, these estimates for carbon tetrachloride range from 9.75 × 10⁻⁶ (Station # 1, maximum impact location) to 1.08 ×10⁻⁵ (Station # 3, community exposure location within the industrial area). On the basis of U of L station averages, these estimates for carbon tetrachloride range from 8.7 × 10⁻⁶ (Station # 7, community exposure location) to 1.11 × 10⁻⁵ (Station # 11, community exposure location). ATSDR’s cancer risk estimates and evaluation of the available studies suggest “no apparent increased cancer risks” for CCl4 air exposures in West Louisville (see Table 11). ATSDR concludes that the concentrations of CCl4 detected in West Louisville air are not likely to harm exposed residents. However, ATSDR considers it a prudent public health measure to reduce or eliminate releases of chemical carcinogens like carbon tetrachloride into West Louisville air wherever possible.
Chloroform
Chloroform is a colorless liquid with a pleasant, nonirritating odor and a slightly sweet taste. Most of the chloroform found in the environment comes from industry. Chloroform mostly enters the environment from chemical companies and paper mills. It is also found in waste water from sewage treatment plants and drinking water (small amounts of chloroform are formed as an unwanted product during the process of adding chlorine to water). Chloroform can enter the air directly from factories that make or use it. There are many ways for chloroform to enter the environment and small amounts of it are likely to be found almost everywhere (ATSDR 1997b).
The maximum concentration of chloroform detected by U of L in a grab (instantaneous) sample was 7.7 µg/m3. This concentration is below ATSDR’s acute EMEG of 100 ppb (488 µg/m3) and is unlikely to harm exposed residents.
Both EPA and U of L detected chloroform in roughly one third of their 24-hour samples and all of those detections are above the CREG of 0.04 µg/m3. At the EPA monitoring locations,
23
Rubbertown Health Consultation
average concentrations range from 0.61 µg/m3 (Station # 1, maximum impact location) to 2.1 µg/m3 (Station # 3, community exposure location within the industrial area). Average concentrations at U of L’s monitoring locations range from 0.36 µg/m3 (Station # 12, community exposure location) to 1.1 µg/m3 (Station # 2, maximum impact and community exposure location within the industrial area). Similar to the U of L data, Table 7 shows that the EPA average concentration at Station # 2 was also 1.1 µg/m3. Stations # 2 and # 3 are nearest to one facility (Du Pont Louisville Plant) in the Rubbertown area known to emit chloroform into the ambient air. There were no noted temporal trends in the data provided to ATSDR.
Chloroform is not likely to be carcinogenic by any route of exposure under exposure conditions that do not cause cytotoxicity and cell regeneration (EPA 2002c). In other words, only combinations of high doses and long durations of exposure sufficient to kill cells and induce compensatory cell division (a response analogous to wound healing) might also cause cancer. Chloroform levels detected in West Louisville air are unlikely to result in either cytotoxicity or cancer. The highest average concentration of chloroform detected at West Louisville (2.1 µg/m3) would result in doses below EPA’s reference dose (RfD) of 10 µg/kg per day, which that agency considers protective against cancer and noncancer effects over a lifetime of chronic exposure (EPA 2002c).
As an additional measure, ATSDR calculated cancer risk estimates for each station (see Tables 9 and 10). Based on EPA station averages, these estimates for chloroform range from 1.40 × 10⁻⁵
(Station # 1, maximum impact location) to 4.83 × 10⁻⁵ (Station # 3, community exposure location within the industrial area). Based on U of L station averages, these estimates for chloroform range from 8.28×10⁻⁶ (Station # 12, community exposure location) to 2.53 × 10⁻⁵
(Station # 2, maximum impact and community exposure location). ATSDR’s cancer risk estimates suggest “no apparent increased cancer risks” for chloroform air exposures in West Louisville (see Table 11). However, ATSDR considers it a prudent public health measure to reduce or eliminate releases of chemical carcinogens into West Louisville air wherever possible.
Chloroprene (2-chloro-1,3-butadiene)
Chloroprene occurs as a colorless, mobile, flammable, and volatile liquid that is slightly soluble in water. Chloroprene is polymerized to form polychloroprene (neoprene), a synthetic rubber used for wire and cable covers, gaskets, automotive parts, adhesives, caulks, flame-resistant cushioning and other applications requiring chemical, oil and weather resistance or high gum strength (EPA 2004a).
EPA detected chloroprene in 55 of 165 air samples, and 13 of those 55 detections exceed EPA’s Office of Air Quality Planning and Standards (OAQPS) toxicity value of 7 µg/m3, which is based on noncancer effects. U of L detected chloroprene in 26 of 89 samples, and 8 of those 26 detections exceed the OAQPS toxicity value. The average concentrations at EPA’s stations in West Louisville range from 0.51 µg/m3 (Station # 6, nonurban background location) to 19 µg/m3
(Station # 2, maximum impact and community exposure location within the industrial area). The average concentrations calculated from U of L’s data exhibit a nearly identical data range: 0.46 µg/m3 (Station # 9, community exposure location) to 19 µg/m3 (Station # 2, maximum impact and community exposure location within the industrial area). The clear spatial trend as well as the similarity between the data at the colocated monitoring location is notable. These sampling
24
Rubbertown Health Consultation
data point to a potential local air emissions source. According to the 2000 and 2001 TRI data, one facility (DDE Louisville) in Rubbertown is the nation’s largest air emission source of chloroprene. Further, this facility is nearest to Station # 2 where the highest average concentrations were detected by both EPA and U of L.
The maximum 24-hour concentration detected by EPA was 170 µg/m3 (0.047 ppm), which is orders of magnitude lower than the 8-hour TLV of 10 ppm (36,212 µg/m3). As stated previously, TLVs are developed for worker safety and are mentioned by ATSDR only to put site-specific concentrations of contaminants into perspective for the reader. At high concentrations in air, chloroprene is a mucous membrane irritant and a primary pulmonary irritant. Symptoms of chronic exposure to ≥200 milligrams per cubic meter (or 200,000 µg/m3) in workers were fatigue, pressure and pain in the chest, giddiness, and irritability. Dermatitis and hair loss occurred in some cases (EPA 1985). Concentrations detected in West Louisville air are several orders of magnitude below this adverse health effect level. Therefore, noncancer adverse health effects are unlikely.
Recent studies on the genotoxicity of chloroprene have been uniformly negative (NTP 2002). And, two occupational studies of cancer in chloroprene exposed workers, one in the United States (Pell 1978) and one in Russia (Bulbulyan et al. 1998), failed to detect a consistent excess of cancer at any site (IARC 1999). The exposures in the two previously mentioned studies combined occurred from the 1930s to the 1970s. In the 1970s, exposure to chloroprene for gluers was in the order of 20,000 µg/m3. This level is much greater than the concentrations detected in West Louisville air. ATSDR concludes it is unlikely that average levels of chloroprene in air would harm exposed West Louisville residents. However, ATSDR considers it a prudent public health measure to reduce or eliminate releases of chemical carcinogens into West Louisville air whenever possible.
Chromium (Total)
Chromium is present in the environment in several different forms. The most common forms are chromium (0), chromium (III), and chromium (VI). No taste or odor is associated with chromium compounds. Chromium (III) is an essential nutrient. Chromium (VI) and chromium (0) are generally produced by industrial processes. Breathing in high levels of chromium (VI), such as in a compound known as chromic acid or chromium (VI) trioxide, can cause irritation to the nose, and long-term exposure to chromium (VI) has been associated with lung cancer in workers (ATSDR 2000b).
EPA detected total (i.e., unspeciated) chromium in all 151 samples. The average concentrations at EPA’s stations range from 0.0027 µg/m3 (at both Station # 5, urban control location and Station # 6, nonurban background location) to 0.0047 µg/m3 (Station # 4, community exposure location). The maximum EPA detected concentration (0.024 µg/m3) is comparable to typical atmospheric levels of total chromium (0.01–0.03 µg/m3) in urban areas of the United States (ATSDR 2000b; Fishbein 1984). Although TRI data for 2000 and 2001 do not indicate any facilities in the West Louisville area as being large chromium air sources, TRI data do not capture smaller stationary and mobile emission sources.
Essentially 100% of the chromium issuing from chrome plating facilities and various types of industrial cooling towers is chromium (VI); but, over 99% of the total chromium associated with
25

Rubbertown Health Consultation
chrome ore refining and the combustion of coal and oil is chromium (III) (ATSDR 2000b, Table 5-1). In a study of 25 industrial sites in Hudson County New Jersey, the ratio of chromium (VI) to total chromium outdoors ranged from 0.6% to 18% (ATSDR 2000b). Thus, the specific chromium (VI): chromium (III) ratio at Rubbertown will strongly depend on the types of industry in the vicinity.
Atmospheric chromium is present primarily in particulate form. Most particulate chromium is not bioavailable and most of that which is bioavailable is chromium (III), rather than chromium (VI) (ATSDR 2000b). However, as a conservative measure, ATSDR assumed the total chromium detected in West Louisville air was 100% chromium (VI). There are three noncancer CVs for chromium (VI). ATSDR’s only noncancer CV for chromium (VI) in air is an intermediate EMEG of 1 µg/m3. The maximum concentration of total chromium detected (0.024 µg/m3) in West Louisville air is less than this EMEG. Although the maximum concentration detected in West Louisville air is higher than the EPA RfC for chromium (VI) (0.008 µg/m3) as chromic acid mist or dissolved aerosol, average concentrations (0.0027–0.0047 µg/m3) are all below this RfC. However, the total chromium measured in West Louisville air was most likely in particulate form and should, therefore, be compared to EPA’s RfC of 0.1 µg/m3 for particulate chromium (VI). The EPA particulate RfC is higher than the average concentrations at each station as well as the maximum level of airborne total chromium detected in West Louisville air.
All 151 EPA detections of total chromium exceeded the CREG of 0.00008 µg/m3 for chromium (VI). Long-term exposures to chromium (VI) have been associated with lung cancer in workers, but at levels much higher than those found in the natural environment. Breathing in small amounts of chromium (VI) for short or long periods does not cause adverse health effects in most people (ATSDR 2000b). Overall, based on the exposure levels reported in the epidemiologic studies, total chromium levels in West Louisville air are well below levels potentially associated with lung cancer in workers. The information available to ATSDR at this time suggests that the detected levels of total chromium in West Louisville air are unlikely to produce cancer in West Louisville residents.
ATSDR calculated cancer risk estimates as an additional protective measure (see Table 9). Based on EPA station averages, the estimate for Station # 4 (community exposure location) is 5.64 × 10⁻⁵. The estimates for the other five EPA stations range from 3.24 × 10⁻⁵ (urban control and nonurban background locations) to 5.28 × 10⁻⁵ (maximum impact and community exposure location). ATSDR’s cancer risk estimates suggest “no apparent increased cancer risks” for chromium air exposures in West Louisville (see Table 11). However, ATSDR considers it a prudent public health measure to reduce or eliminate releases of chemical carcinogens into West Louisville air wherever possible.
1,2-Dichloroethane
1,2-Dichloroethane is a clear, manufactured liquid not found naturally in the environment. At this time, the most common use of 1,2-dichloroethane is to make vinyl chloride, although it is also used as a solvent and is added to gasoline to remove lead (ATSDR 2001).
U of L did not detect 1,2-dichloroethane in any samples, and EPA detected 1,2-dichloroethane in only one sample over the entire monitoring program. The 2000 and 2001 TRI data do not list any facilities in the Rubbertown industrial area that reported air emissions of 1,2-dichloroethane,
26

Rubbertown Health Consultation
although TRI data do not capture smaller stationary and mobile emission sources. The one detection that EPA measured (0.31 µg/m3) at Station # 4 (community exposure site) is below the 1,2-dichloroethane chronic MRL of 600 ppb (2,400 µg/m3), although it is above ATSDR’s CREG. Because chronic exposure is not occurring, cancerous adverse health effects would not be expected. ATSDR concludes it is unlikely 1,2-dichloroethane in air would harm exposed West Louisville residents.
Ethyl Acrylate
Ethyl acrylate is used in the manufacture of water-based latex paints and adhesives, textile and paper coatings, leather finish resins, and in the production of acrylic fibers. Ethyl acrylate may be released into the environment in fugitive and stack emissions or in wastewater during its production and use (EPA 2004b). A volatile component of pineapple concentrate and Beaufort cheese, ethyl acrylate was also formerly used as a food additive for flavor and fragrance (HSDB 2004).
EPA detected ethyl acrylate in 10 out of 167 samples, while U of L did not detect this compound at any of its monitoring stations. All but one of EPA’s detections were estimated values (0.35– 1.70 µg/m3). EPA did not detect ethyl acrylate at the urban control (Station # 5) or nonurban locations (Station # 6). According the 2000 and 2001 TRI, three facilities located in the Rubbertown industrial area (Arkema, Rohm & Haas, and Zeon) have ranked in the top five highest air emission sources in the country for ethyl acrylate. All of the EPA detections occurred at Stations # 1–3 (locations within the industrial area). Ethyl acrylate was detected 4% of the time at Station # 1, 21% of the time at Station # 2, and 11% of the time at Station # 3.
ATSDR does not have any CVs for ethyl acrylate. The TLV is currently set at 5 ppm (20,500 µg/m3). The OSHA permissible exposure limit (PEL) is 25 ppm (102,500 µg/m3) for 8-hour daily exposures. The PEL is a level of a substance in air considered safe for worker exposure every day for an entire work life. These occupational levels are several orders of magnitude higher than the concentrations detected in West Louisville air.
The main effects of exposure to high concentrations of ethyl acrylate in humans are irritation of eyes, nose, and throat, and potential skin sensitization. Prolonged exposure to levels of about 50 ppm (204,700 µg/m3) have been known to cause drowsiness, headache, and nausea (OSHA 1999). However, monkeys exposed to 26.2 ppm in air (107,300 µg/m3) for 130 7-hour periods showed no signs of toxicity (OSHA 1999).
Levels of ethyl acrylate are well below levels known to cause adverse effects in animals and humans. ATSDR concludes that the levels of ethyl acrylate detected in West Louisville air are unlikely to produce adverse health effects in exposed residents.
Formaldehyde
Formaldehyde is a colorless, flammable gas at room temperature with a pungent, distinct odor. It occurs from both natural and man made sources. Formaldehyde is used in many industries such as in the production of fertilizer, paper, plywood, and cosmetics. Automobile exhaust from cars without catalytic converters or those using oxygenated gasoline also contain formaldehyde. Formaldehyde is also formed in the atmosphere from other chemicals. At home, formaldehyde is produced by cigarettes and other tobacco products, gas cookers, and open fireplaces. It is also
27
Rubbertown Health Consultation
used as a preservative in some foods. Formaldehyde is found in rural areas at about 0.2 ppb (0.25 µg/m3) in outdoor air, and in suburban areas, levels are about 2–6 ppb (2.5–7.5 µg/m3) (ATSDR 1999c).
Formaldehyde is a ubiquitous component of urban atmospheres. It was detected by EPA in all 140 air samples. The maximum concentration detected was 6.1 µg/m3 at Station # 1 (a maximum impact location). Average concentrations across the monitoring stations range from 0.71 µg/m3
(Station # 6, nonurban background location) to 2.5 µg/m3 (Station # 1, maximum impact location). According to 2000 and 2001 TRI data, two facilities (Hexion Specialty Chemicals and Rohm & Haas) in the Rubbertown industrial area emit formaldehyde, but these facilities are not located near Station # 1. As stated previously, however, TRI data do not capture smaller stationary and mobile source emissions. Overall, these formaldehyde levels are not unusually elevated when compared to those routinely measured in urban and suburban settings (EPA 1999e).
Average concentrations at all stations as well as the maximum 24-hour concentration of 6.1 µg/m3 are all below ATSDR’s chronic MRL of 8 ppb (10 µg/m3). Therefore, noncancerous adverse health effects are not likely.
EPA detected formaldehyde in 139 air samples at levels greater than the CREG (0.08 µg/m3). The animal evidence consists primarily of nasal tumors induced in rodents chronically exposed to formaldehyde at levels of 5–10 ppm (6,250–12,500 µg/m3). Most humans would find these levels unbearable because formaldehyde has a suffocating, highly irritating odor that humans can detect at 0.5–1.0 ppm (625–1,250 µg/m3) (ATSDR 1999c). A NOAEL of 2 ppm (2,500 µg/m3) was established for nasal tumors in the rat study (Kerns et al. 1983; EPA 1998). Formaldehyde levels in West Louisville are orders of magnitude below the animal NOAEL.
More than 40 epidemiologic studies have examined the potential for occupational formaldehyde exposure to cause cancer in humans (ATSDR 1999c). Although some epidemiologic studies do not support the existence of a causal link between formaldehyde exposure and human cancer, a few studies produced statistically significant results (McLaughlin 1994; ECETOC 1995; ATSDR 1999c). EPA and the Chemical Industry Institute of Toxicology consider that “a weak association with nasopharyngeal cancer cannot be completely ruled out” (CIIT 1998; ATSDR 1999c). Overall, the formaldehyde levels in West Louisville air are below levels potentially associated with nasopharyngeal cancer in workers.
As an additional measure, ATSDR calculated cancer risk estimates for each EPA station (see Table 9). For these calculations, ATSDR used EPA’s OAQPS cancer inhalation unit risk (IUR)
3for formaldehyde of 5.5 × 10⁻⁹ (µg/m )–1 instead of the IUR that is currently listed in IRIS of 1.3 3× 10⁻⁵ (µg/m )–1. This less conservative IUR is currently recommended by EPA’s Office of Air
and Radiation for use in screening level inhalation risk assessments. Of note, the toxicological database for formaldehyde is currently undergoing an IRIS review that may result in new potency factors (both cancer and noncancer) for this chemical. Based on EPA station averages, the cancer risk estimates for formaldehyde range from 6.05 × 10⁻⁹ (Station # 5, urban control location) to 1.38 × 10⁻⁸ (Station # 1, maximum impact location). ATSDR’s cancer risk estimates and evaluation of the available studies suggest “no increased cancer risks” for formaldehyde air exposures in West Louisville (see Table 11). ATSDR concludes that the concentrations of
28

Rubbertown Health Consultation
formaldehyde detected in West Louisville air are not likely to harm exposed residents. However, ATSDR considers it a prudent public health measure to reduce or eliminate releases of chemical carcinogens into West Louisville air whenever possible.
Manganese
Manganese is an essential trace element and is necessary for good health. It is a naturally occurring substance found in many types of rock. Sources of airborne manganese include iron- and steel-producing plants, power plants, coke ovens, and dust from uncontrolled mining operations. Because manganese is a natural component of the environment, low levels are found in water, air, soil, and food (ATSDR 2000c). Typical levels of manganese in air are 0.02 µg/m3
(ATSDR 2000c).
Manganese was detected by EPA in 150 out of 151 air samples. Only 4 of those 150 detections exceed the chronic EMEG of 0.04 µg/m3. Average concentrations across the monitoring stations range from 0.006 µg/m3 (Station # 6, nonurban background location) to 0.020 µg/m3 (Station # 4, community exposure location). TRI data for 2000 and 2001 do not indicate any facilities in the Rubbertown industrial area as being large manganese air sources, although TRI data do not capture smaller stationary and mobile source emissions. Average concentrations in West Louisville air are all below the chronic EMEG. Therefore, no adverse effects would be expected to result from exposure to manganese in West Louisville air.
Methylene Chloride
Methylene chloride is a colorless liquid having a mild, sweet odor that evaporates easily and does not easily burn. It is widely used as an industrial solvent and paint stripper. Methylene chloride does not appear to occur naturally in the environment. Most of the methylene chloride released to the environment results from its use as an end product by various industries and the use of aerosol products and paint removers in the home (ATSDR 2000d).
EPA detected methylene chloride in 53% of its samples, but none of these levels are greater than ATSDR’s CREG of 3 µg/m3. U of L detected methylene chloride in 93% of its samples, with 39 of those detections exceeding the CREG. While both EPA and U of L detected methylene chloride in their samples, there are notable differences in the range of concentrations detected. The average concentrations at EPA’s stations range from 0.45 µg/m3 to 0.76 µg/m3, while the average concentrations in U of L’s monitoring stations range from 2.4 µg/m3 to 9.2 µg/m3. The difference between the EPA data and U of L data may be the result of measurement error by U of L. (See Section 2.7 for information on data quality issues). Methylene chloride is known to be a common laboratory contaminant. There are no statistically significant differences between the average methylene chloride concentrations at EPA’s potential maximum impact locations and the average methylene chloride concentration at the urban control location. Two facilities (Arkema and DDE Louisville) in the Rubbertown industrial area have reported air releases of methylene chloride according to the 2000 TRI. As stated previously, TRI data do not capture smaller stationary and mobile source emissions. ATSDR has greater confidence overall in the quality of the EPA data set. All methylene chloride concentrations detected at this site are below ATSDR’s chronic MRL of 300 ppb (1,000 µg/m3).
29

Rubbertown Health Consultation
All concentrations are also well below the lowest levels known to cause cancer in laboratory animals (500 ppm, or about 1.7 × 10⁶ µg/m3) (ATSDR 2000d). Methylene chloride carcinogenicity in animals appears to be a high-dose, species-specific phenomenon (Sherratt et al. 2002; Green 1997). No excess risk of death from malignant neoplasms has been detected in workers exposed to methylene chloride at levels up to 475 ppm (1.6 × 10⁶ µg/m3) (ATSDR 2000d). As an additional measure, ATSDR calculated cancer risk estimates for each station (see Tables 9 and 10). Based on EPA station averages, these estimates for methylene chloride range from 1.08 × 10⁻⁷ (Station # 6, nonurban background location) to 3.04 × 10⁻⁷ (Station #3, community exposure location within the industrial area). Based on U of L station averages, these estimates for methylene chloride range from 9.6×10⁻⁷ (Stations # 9 and # 12, both community exposure locations) to 3.68 × 10⁻⁶ (Station # 8, community exposure location). ATSDR’s cancer risk estimates and evaluation of the available studies suggest “no increased cancer risks” for methylene chloride air exposures in West Louisville (see Table 11). The levels of methylene chloride detected in West Louisville air would not be expected to harm exposed residents. However, ATSDR considers it a prudent public health measure to reduce or eliminate releases of chemical carcinogens into West Louisville air wherever possible. 2-Nitrophenol
2-Nitrophenol is a water-soluble solid that is used as an intermediate in the synthesis of a number of organophosphate pesticides and some medical products. EPA detected 2-nitrophenol in 41of 167 air samples; the maximum detected concentration was 0.1 µg/m3. Average concentrations across the monitoring stations range from 0.015 µg/m3 (Station # 5, urban control location) to 0.022 µg/m3 (Station # 2, maximum impact and community exposure location within the industrial area). The chemical concentration differences between station averages exhibit no clear spatial trends (see Table 7). TRI data for 2000 and 2001 do not indicate any facilities in the Rubbertown industrial area as being 2-nitrophenol air sources, although TRI data do not capture smaller stationary and mobile source emissions.
There are no comparison values available for 2-nitrophenol. Nor are any carcinogenicity studies using the oral or inhalation routes available for 2-nitrophenol. High levels are slightly irritating to the skin in humans, but nonirritating to the eye. The lowest inhalation LOAEL in ATSDR’s Toxicological Profile for Nitrophenols (ATSDR 1992b) is 30,000 µg/m3 for cataracts in 11 of 30 rats exposed to 4-nitrophenol 6 hours/day, 5 days/week, for 4 weeks. 4-Nitophenol is more toxic than 2-nitrophenol. This LOAEL for 4-nitrophenol is many orders of magnitude greater than the levels of 2-nitrophenol detected in West Louisville air. ATSDR concludes that no adverse health effects are likely to result from exposure to 2-nitrophenol in West Louisville air.
N-nitrosodi-N-propylamine
N-nitroso compounds are produced primarily as research chemicals and not for commercial purposes. N-nitrosodi-n-propylamine has been found as a contaminant in the substituted dinitrotrifluralin herbicides, and thus may be released into the environment when these herbicides are used and from spills (HSDB 2004). It has been detected in wastewater effluent, in secondary effluent from a textile plant, and in cigarette smoke (HSDB 2004).
30

Rubbertown Health Consultation
EPA detected N-nitrosodi-n-propylamine only once in 167 air samples. This one detection was at Station #6 (nonurban background location) at a level almost 30 times greater than the cancer-based RBC. However, chronic exposure is not occurring, so cancerous adverse health effects would not be expected. Considering that none of the monitors in the Rubbertown industrial area detected N-nitrosodi-n-propylamine, this solitary detect in a nonurban background location may reflect laboratory contamination. Alternatively, levels this low (0.029 µg/m3, or 5.4 parts per trillion) could reflect the presence in air of cigarette smoke or weed-killer residue. Available data suggest that this level of N-nitrosodi-n-propylamine in air would not harm exposed residents.
Phenanthrene
Phenanthrene is a relatively nontoxic, noncarcinogenic PAH which, as a product of incomplete combustion of fossil fuels and wood, is ubiquitous in the environment. Phenanthrene is used in the manufacture of dyestuffs and explosives and in biological research (ATSDR 1995). It may be found in ambient air, surface and drinking water, and in foods.
EPA detected phenanthrene in nearly 80% of their air samples. The average concentrations range from 0.013 µg/m3 (observed both at a community exposure location with the industrial area and at the urban control location) to 0.029 µg/m3 (at a maximum impact location). None of the Rubbertown facilities reported phenanthrene air emissions to TRI in reporting year 2000 or 2001, although TRI data do not capture smaller stationary and mobile source emissions.
Although neither EPA nor ATSDR have any health-based CVs for phenanthrene, it does not appear to be either genotoxic or carcinogenic. In fact, phenanthrene inhibits tumor production by carcinogenic PAHs like benzo[a]pyrene and dibenzo[ah]athracene. As a surrogate screening value, ATSDR used the RBC of anthracene, another noncarcinogenic PAH with a very similar structure. The anthracene RBC (1,100 µg/m3) is several orders of magnitude higher than the maximum concentration (0.19 µg/m3) of phenanthrene detected in West Louisville air. Therefore, the levels of phenanthrene detected in West Louisville air are not likely to produce adverse health effects in exposed residents.
Toluene
Toluene is a clear, colorless liquid with a distinctive smell. It is produced in the process of making gasoline and other fuels from crude oil, in making coke from coal, and as a by-product in the manufacture of styrene. Toluene is used in making paints, paint thinners, fingernail polish, lacquers, adhesives, and rubber, as well as in some printing and leather tanning processes. Background levels of toluene in air in remote areas were found to be quite low (0.05 ppb, or 0.19 µg/m3), but levels of 0.27–7.98 ppb (or 1.0–31 µg/m3) were observed in suburban and urban areas (ATSDR 2000e).
EPA detected toluene in 173 of 180 air samples and the U of L detected toluene in 124 of 127 air samples. The average toluene concentrations for EPA’s monitoring stations range from 1.3 µg/m3 (Station # 6, nonurban control location) to 24 µg/m3 (Station # 2, maximum impact and community exposure location within the industrial area). The averages for U of L’s monitoring stations range from 7.6 µg/m3 (Station # 12, community exposure location) to 57 µg/m3 (Station # 2, maximum impact and community exposure location within the industrial area). Trends among EPA’s data indicate that the average concentrations clearly show significant spatial
31

Rubbertown Health Consultation
variations in toluene levels. It is notable that the highest average concentrations for both EPA and U of L occurred at Station # 2. Many Rubbertown facilities (American Synthetic Rubber, Ashland Distribution, Chevron, Cone Solvents, DDE Louisville, Superior Solvents & Chemicals, Rohm & Haas, and the Marathon Oil Terminals) reported toluene air releases according to the 2000 and 2001 TRI. American Synthetic Rubber and Rohm & Haas, which are located near Station # 2, rank in the top 100 highest air emission sources in the country for toluene.
Only one toluene concentration (346.9 µg/m3, measured by U of L) during the entire monitoring program exceeds a health-based CV (300 µg/m3, an EMEG based on chronic exposure). All average concentrations are considerably lower than this chronic EMEG. Therefore, the levels of toluene detected in West Louisville air would not be expected to harm exposed residents.
1,1,2-Trichloroethane
1,1,2-Trichloroethane is a colorless, sweet-smelling liquid. Low levels of 1,1,2-trichloroethane may be found in outdoor air. The main source of this 1,1,2-trichloroethane is thought to be industries that use it as a solvent. Because the industries that produce 1,1,2-trichloroethane or use it to make other chemicals often recycle or burn their waste, releases of 1,1,2-trichloroethane by these industries should not be major sources of pollution (ATSDR 1989).
1,1,2-Trichloroethane was detected rarely during the monitoring program: in 4 out of the 180 samples that EPA analyzed and in 2 out of the 127 samples that U of L analyzed. All four EPA detections were estimated values (0.32–0.42 µg/m3) and occurred at various monitoring locations. Both of U of L’s detections occurred on the same day (3.4 µg/m3 and 3.5 µg/m3), but at different monitoring locations. No industrial facilities in Rubbertown reported air emissions of 1,1,2-trichloroethane to the 2000 or 2001 TRI, although TRI data do not account for smaller stationary and mobile emission sources.
For purposes of comparison, the OSHA exposure limit for repeated exposure during an 8-hour workday, 40-hour workweek is 10 ppm (45,000 µg/m3). This OSHA value is about 10,000 times higher than the highest 1,1,2-trichloroethane concentration detected (3.5 µg/m3) in West Louisville air. The four EPA detections and two U of L detections of 1,1,2-trichloroethane, as well as the detection limit for most sampling rounds, are above the 1,1,2-trichloroethane CREG of 0.06 µg/m3. However, no animal or human data are available to indicate whether 1,1,2-trichloroethane is carcinogenic via the inhalation route (ATSDR 1989). (The ATSDR inhalation CREG is based on mouse liver tumors resulting from high oral doses.) ATSDR concludes that adverse health effects would not be expected in West Louisville residents.
1,2,4-Trimethylbenzene
1,2,4-Trimethylbenzene is a colorless, flammable liquid. It occurs naturally in coal tar and petroleum crude oil. The largest users of 1,2,4-trimethylbenzene are chemical companies that make trimellitic anhydride. Companies also use it to make dyes and drugs (EPA 1994).
EPA and U of L detected 1,2,4-trimethylbenzene in 62% and 13% of samples, respectively. EPA’s data suggest that average concentrations of 1,2,4-trimethylbenzene do not vary considerably from one station to the next. The highest average level of 0.94 µg/m3 (Station # 4, community exposure location) is only slightly higher than the average level of 0.65 µg/m3
(Station # 5, urban control location). According to 2000 and 2001 TRI data, a few facilities
32
Rubbertown Health Consultation
(Ashland Distribution, Chevron, and the Marathon Oil Terminals) in Rubbertown reported emissions of 1,2,4-trimethylbenzene, although none ranked within the top 100 air emission sources in the county.
For purposes of comparison, the NIOSH recommended exposure limit (REL) of 25 ppm (125,000 µg/m3) is several orders of magnitude higher than the levels of 1,2,4-trimethylbenzene detected in West Louisville air. Only one measured concentration (6.3 µg/m3) exceeds a health-based CV (6.2 µg/m3, a noncancer RBC). All average concentrations are considerably lower than the 1,2,4-trimethylbenzene RBC for chronic exposures. No adverse health effects would be expected.
Vinyl Chloride
Vinyl chloride is a colorless, flammable gas at normal temperatures, with a mild, sweet odor. It is a manufactured chemical that is used to make a common plastic product called polyvinyl chloride (PVC). PVC is used to make a variety of plastic products, including pipes, wire and cable coatings, and furniture and automobile upholstery (ATSDR 2004b).
EPA detected vinyl chloride at Stations # 1 and # 4 about 3% of the time, and at Station # 2 about 10% of the time. U of L detected vinyl chloride at Station # 2 about 11% of the time, at Station # 7 about 36% of the time, at Station # 8 about 6% of the time, at Station # 10 about 7% of the time, and at Station # 12 about 10% of the time. Vinyl chloride was not detected at the other EPA and U of L stations.
The maximum concentration observed at an EPA monitoring location is 1.0 µg/m3 (Station # 1, maximum impact location), and the maximum concentration at a U of L monitoring location is 5.3 µg/m3 (Station # 2, maximum impact and community exposure location within the industrial area). The large number of nondetects at most stations prevents a meaningful calculation of average concentrations, especially considering that the measured values are close to the reported detection limits where measurement variability tends to be greatest. According to the 2000 and 2001 TRI data, air emission sources of vinyl chloride exist in Rubbertown (Noveon and Oxy Vinyls). Although most of the stations where vinyl chloride was detected are nearest to these facilities, emissions from these facilities apparently do not cause ambient air concentrations of vinyl chloride to consistently reach detectable levels at most of the monitoring locations.
Vinyl chloride has neurotoxic properties at concentrations greater than 4,000 ppm (1.04 × 10⁷
µg/m3) in air (ATSDR 2004b). The lowest known noncancer effect level for vinyl chloride in air is 10,000 ppb (26,000 µg/m3) for increased relative liver weight in rats exposed 6 hours/day, 6 days/week, for 6 months. The lowest known CEL for vinyl chloride in air is 5,000 ppb (13,000 µg/m3) for mammary gland cancer in rats exposed 4 hours/day, 5 days/week, for 1 year (ATSDR 2004b). The maximum concentration (5.3 µg/m3) detected in West Louisville air is several orders of magnitude lower than the lowest known effect levels in rats for noncancer and cancer effects.
In humans, cancer risk from vinyl chloride exposure appears to be limited to hepatic angiosarcoma and is concentrated among workers with high inhalation exposures―at least 1 year above 50,000 ppb (130,000 µg/m3) (Falk and Steenland 1998). This type of cancer is very rare in the general population. Even in workers with a history of occupational exposure to vinyl chloride, the incidence of angiosarcoma of the liver is relatively low, being confined almost
33
Rubbertown Health Consultation
exclusively to PVC production workers—especially those who used to manually clean the inner walls of large vinyl chloride reactor vessels. Elevated levels of angiosarcoma of the liver have not been seen in other individuals involved in the production or use of vinyl chloride. This low and limited occurrence of increased risk would seem to suggest that the carcinogenic potency of vinyl chloride is also relatively low (Williams and Weisburger 1991). The levels of vinyl chloride detected in West Louisville air would not be expected to produce adverse health effects in exposed residents. However, ATSDR considers it a prudent public health measure to reduce or eliminate releases of chemical carcinogens into West Louisville air whenever possible.
4.3 Chemical Mixtures
The approach that ATSDR has outlined thus far in this health consultation focuses largely on evaluating chemical-specific exposures. That is, the likelihood of adverse health effects was evaluated on a chemical-by-chemical basis for the ambient air exposure pathway. In reality, exposures can involve multiple chemicals. ATSDR’s approach for the assessment of exposure to chemical mixtures includes reviewing available chemical mixtures studies for noncancer and cancer health effects.
1. Noncancer health effects. Relatively few studies have assessed toxic interactions of noncarcinogenic chemicals in low dose ranges. The studies that do exist suggest that a mixture produces no adverse health effects in dosed animals when the components of that mixture are present at levels below their respective no-observed-adverse-effect levels (NOAEL)—i.e., at concentrations that would have produced no adverse effects in animals treated separately with those component chemicals (Wade et al. 2002; Feron et al. 1993; Jonker et al. 1990; Jonker et al. 1993a; Jonker et al. 1993b; Groten et al. 1991). In two of these experiments (Jonker et al. 1993a; Jonker et al. 1993b), all of the component chemicals affected the same target organ, but through different mechanisms. In two others (Jonker et al. 1990; Groten et al. 1991), the chemicals had different target organs and exhibited different modes of action, as do most chemicals in typical environmental mixtures. Subsequent experiments have shown similar results (Feron et al. 1995; Groten et al. 1997).
For every chemical detected in West Louisville air, the maximum, as well as the average, concentrations detected would result in inhalation doses orders of magnitude lower than all known levels of effect. Therefore, based on the available chemical mixture studies, ATSDR concludes that the combined exposure to all of these chemicals at the levels detected in West Louisville air is unlikely to produce harmful noncancer health effects in exposed residents.
2. Cancer health effects. Relatively few studies have assessed toxic interactions of carcinogenic chemicals in low dose ranges. In one study, Hasegawa et al. (1994) administered 10 carcinogenic heterocyclic amines in combination to rats at one hundredth of the doses known to be carcinogenic individually. The effects did not differ significantly from controls. This animal study suggests that exposure to a mixture of chemicals carcinogens will not result in cancer at levels one hundred times lower than each chemical’s individual cancer effect level.
34
Rubbertown Health Consultation
As described in Section 4.2, ATSDR calculated cancer risk estimates for several chemical carcinogens. Based on these individual chemical cancer risk estimates, 1,3-butadiene was the only chemical to exceed 1 × 10⁻⁴ (at Station # 2, maximum impact and community exposure location within the industrial area) and approach 1 × 10⁻⁴ (at Station # 3, community exposure location within the industrial area). Because 1,3-butadiene individually exceeds and approaches 1 × 10⁻⁴, ATSDR chose to further evaluate the potential for interactive effects of 1,3-butadiene with other chemicals. Of the chemical carcinogens detected in West Louisville air, 1,3-butadiene and benzene have the same organ system (bone marrow) as a target for carcinogenic effects. However, no experimental studies have been designed to assess the health effects from exposure to a chemical mixture of 1,3-butadiene and benzene. Epidemiologic evidence of interactions involving 1,3-butadiene and benzene is inconclusive, but suggests independent action (Macaluso et al. 1996). Because there is no compelling evidence supporting a greater than or less than additive model, ATSDR’s approach for evaluating cumulative exposures to chemical carcinogens in this health consultation is to assume additivity.
Assuming additive effects, the cumulative cancer risk estimate for each station is the sum of the individual chemical risk estimates. If the sum of the cancer risks exceeds a level of concern for significant impact on lifetime cancer risk, the mixture constitutes a potential health hazard due to additivity. ATSDR’s approach is to select a risk of 1 × 10⁻⁴ as the level of concern for cumulative cancer risk (ATSDR 2004c). Several stations, especially those in the industrial area, exceed a cumulative cancer risk estimate of 1 × 10⁻⁴ (Tables 9 and 10). Therefore, the combined exposure to all of these chemicals is associated with a low increased risk of developing cancer, especially in the industrial area.
ATSDR recognizes there are uncertainties in evaluating the cumulative effects of chemical mixtures. Because relatively few chemical mixtures studies have assessed toxic interactions in low dose ranges and because several carcinogenic chemicals exhibited significant spatial trends, ATSDR considers it a prudent public health measure to reduce or eliminate releases of chemical carcinogens into West Louisville air wherever possible.
5.0 Child Health Considerations Children could be at greater risk than adults from certain kinds of exposure to hazardous substances. A child’s lower body weight results in a greater dose of hazardous substance per unit of body mass. Playing children also engage in more active outdoor activities than most adults, which can lead to a higher rate of inhalation. If toxic exposure levels are high enough during critical growth stages, the developing body systems of children can sustain permanent damage. The inhalation comparison values used by ATSDR are generally protective of both adults and children. Considering the levels of contaminants and their frequency of detection in West Louisville air, no exposure-related noncancer adverse health effects in exposed children would be expected to result over a lifetime of site-specific exposures. However, long-term exposure to air toxics in the West Louisville area is associated with a low risk of developing cancer (see Section 4).
35
Rubbertown Health Consultation
6.0 Conclusions Several of the chemicals detected in West Louisville air exhibited significant spatial variations, with their highest concentrations consistently measured at monitoring locations nearest to and in the Rubbertown industrial area. This pattern indicates that West Louisville residents are exposed to chemicals in the air emitted from numerous Rubbertown industrial area sources. Although the air data were limited, for the purpose of this health consultation, ATSDR considered that the measured chemical concentrations during the 31 sampling days were representative of air concentrations throughout the entire year. ATSDR also assumed indoor air exposures were comparable to outdoor air exposures.
Based on its initial screen of more than 175 chemicals, ATSDR identified 29 chemicals for further consideration in this health consultation. ATSDR first evaluated on a chemical-by-chemical basis the detected levels of these 29 chemicals in West Louisville air within the context of the available data on levels known to cause adverse health effects in animals and humans. ATSDR concludes that long-term exposure to each of these chemicals individually is unlikely to cause harmful noncancer health effects in West Louisville residents. Long-term exposure to air toxics in the West Louisville area is associated with a low increased risk of developing cancer. Of particular concern is the risk of developing cancer for exposure to1,3-butadiene, a known human carcinogen, in the industrial area.
Although relatively few studies have assessed toxic interactions in low dose ranges, ATSDR also evaluated the chemical levels detected in West Louisville air with respect to the available chemical mixtures studies. ATSDR concludes that the combined exposure to all of these chemicals at the levels detected in West Louisville air would not be expected to produce harmful noncancer health effects in exposed residents. However, several stations exceed a cumulative cancer risk estimate of 1 × 10⁻⁴, which ATSDR considers a level of concern for lifetime cancer risk due to additivity. Therefore, the combined exposure to all of these chemicals is associated with a low increased risk of developing cancer, especially in the industrial area
Because (a) indoor air chemical levels may have been greater than ambient air chemical levels, (b) ambient air sampling data were limited, and (c) relatively few chemical mixtures studies exist to assess toxic interactions in low dose ranges, ATSDR considers it a prudent public health measure to reduce or eliminate releases of chemical carcinogens into West Louisville air wherever possible.
7.0 Recommendations
• Continue to track air pollutants in the Rubbertown industrial area of West Louisville to ensure chemical concentrations remain below levels that may cause noncancer harmful health effects.
• Reduce or eliminate releases of chemical carcinogens into West Louisville air wherever possible.
36

Rubbertown Health Consultation
8.0 Public Health Action Plan The purpose of the public health action plan (PHAP) is to ensure that this evaluation not only identifies potential and ongoing public health hazards, but also provides a plan of action designed to mitigate and prevent adverse human health effects resulting from exposure to hazardous substances in the environment. The public health actions that are completed, ongoing, and planned are listed below.
Completed Actions
On September 30, 1998, ATSDR released a public health assessment for the Rubbertown industrial area. Because of the lack of relevant air sampling data, ATSDR concluded in the PHA that the Rubbertown industrial area posed an indeterminate public health hazard and recommended ambient air monitoring. Shortly thereafter, the EPA Region 4, the West Jefferson County Community Task Force, and the Louisville Metro Air Pollution Control District (APCD) initiated a community-based environmental protection program. In addition, air data were collected through a collaborative air monitoring effort by the University of Louisville (U of L). This health consultation evaluates these West Louisville air data collected from approximately April 2000 to April 2001.
Ongoing Actions
Since October 2001, six air monitors have been operated and maintained in West Louisville. In May 2003, the Louisville Metro government began seeking butadiene emission reductions from three stationary Rubbertown industrial area sources. In June 2005, the Louisville Metro APCD approved the Strategic Toxic Air Reduction (STAR) program to improve air quality and public health. Through the STAR program, the APCD will monitor sources of chemical releases into the air. The APCD will work to reduce unacceptable risks that result from poor air quality in the West Louisville community.
Planned Actions
The long-term goal of the STAR program is to have a comprehensive program in the community that addresses the toxic emissions of all sources. This follows the overall goals of the U.S. EPA’s Air Toxics Strategy, which provides an integrated framework for addressing air toxics in urban areas by looking at stationary, mobile, and indoor source emissions. ATSDR also supports the goals and objectives of this strategy and our recommendations are consistent with this support.
37
Rubbertown Health Consultation
9.0 ATSDR Preparers Danielle M. Langmann, MS Environmental Health Scientist Health Consultations Team Exposure Investigation and Consultation Branch Division of Health Assessment and Consultation
Frank C. Schnell, PhD, DABT Toxicologist Exposure Investigations Team Exposure Investigation and Consultation Branch Division of Health Assessment and Consultation
10.0 ATSDR Reviewers Robert Safay Senior Regional Representative Region IV Division of Regional Operations
CDR Peter Kowalski, MPH, CIH Team Leader Health Consultations Team Exposure Investigation and Consultation Branch Division of Health Assessment and Consultation
Susan McAfee Moore Chief Exposure Investigation and Consultation Branch Division of Health Assessment and Consultation
Kenneth Orloff, PhD Associate Director for Science Division of Health Assessment and Consultation
38

Rubbertown Health Consultation
11.0 References [ACGIH] American Conference of Governmental Industrial Hygenists 2004. TLVs and BEIs based on the documentation of the threshold limit values for chemical substances and physical agents & biological exposure indices. Cincinnati: Signature Publications.
[ATSDR] Agency for Toxic Substances and Disease Registry. 1989. Toxicological profile for 1,1,2-trichloroethane. Atlanta: US Department of Health and Human Services.
[ATSDR] Agency for Toxic Substances and Disease Registry. 1990. Toxicological profile for acrylonitrile. Atlanta: US Department of Health and Human Services.
[ATSDR] Agency for Toxic Substances and Disease Registry. 1992a. Toxicological profile for 1,3-butadiene. Atlanta: US Department of Health and Human Services.
[ATSDR] Agency for Toxic Substances and Disease Registry. 1992b. Toxicological profile for nitrophenols. Atlanta: US Department of Health and Human Services.
[ATSDR] Agency for Toxic Substances and Disease Registry. 1995. Toxicological profile for polycyclic aromatic hydrocarbons (PAHs). Atlanta: US Department of Health and Human Services.
[ATSDR] Agency for Toxic Substances and Disease Registry. 1996. Toxicological profile for toxaphene (update). Atlanta: US Department of Health and Human Services.
[ATSDR] Agency for Toxic Substances and Disease Registry. 1997a. Toxicological profile for benzene (update). Atlanta: US Department of Health and Human Services.
[ATSDR] Agency for Toxic Substances and Disease Registry. 1997b. Toxicological profile for chloroform (update). Atlanta: US Department of Health and Human Services.
[ATSDR] Agency for Toxic Substances and Disease Registry. 1999a. Toxicological profile for aluminum (update). Atlanta: US Department of Health and Human Services.
[ATSDR] Agency for Toxic Substances and Disease Registry. 1999b. Toxicological profile for cadmium (update). Atlanta: US Department of Health and Human Services.
[ATSDR] Agency for Toxic Substances and Disease Registry. 1999c. Toxicological profile for formaldehyde. Atlanta: US Department of Health and Human Services.
[ATSDR] Agency for Toxic Substances and Disease Registry. 2000a. Toxicological profile for arsenic (update). Atlanta: US Department of Health and Human Services.
[ATSDR] Agency for Toxic Substances and Disease Registry. 2000b. Toxicological profile for chromium (update). Atlanta: US Department of Health and Human Services.
39
Rubbertown Health Consultation
[ATSDR] Agency for Toxic Substances and Disease Registry. 2000c. Toxicological profile for manganese (update). Atlanta: US Department of Health and Human Services.
[ATSDR] Agency for Toxic Substances and Disease Registry. 2000d. Toxicological profile for methylene chloride (update). Atlanta: US Department of Health and Human Services.
[ATSDR] Agency for Toxic Substances and Disease Registry. 2000e. Toxicological profile for toluene (update). Atlanta: US Department of Health and Human Services.
[ATSDR] Agency for Toxic Substances and Disease Registry. 2001. Toxicological profile for 1,2-dichloroethane (update). Atlanta: US Department of Health and Human Services.
[ATSDR] Agency for Toxic Substances and Disease Registry. 2002. Toxicological profile for aldrin and dieldrin. Atlanta: US Department of Health and Human Services.
[ATSDR] Agency for Toxic Substances and Disease Registry. 2003a. Toxicological profile for bromoform (update). Atlanta: US Department of Health and Human Services.
[ATSDR] Agency for Toxic Substances and Disease Registry. 2003b. Toxicological profile for carbon tetrachloride (update) draft for public comment. Atlanta: US Department of Health and Human Services.
[ATSDR] Agency for Toxic Substances and Disease Registry. 2004a. Toxicological profile for 1,4-dichlorobenzene (update) draft for public comment. Atlanta: US Department of Health and Human Services.
[ATSDR] Agency for Toxic Substances and Disease Registry. 2004b. Toxicological profile for vinyl chloride (update) draft for public comment. Atlanta: US Department of Health and Human Services.
[ATSDR] Agency for Toxic Substances and Disease Registry. 2004c. Guidance manual for the assessment of joint toxic action of chemical mixtures. Atlanta: US Department of Health and Human Services.
[ATSDR] Agency for Toxic Substances and Disease Registry. 2005. Public health assessment guidance manual (update). Atlanta: US Department of Health and Human Services.
Bond GG, McLaren EA, Baldwin CL, Cooke RR. 1986. An update of mortality among chemical workers exposed to benzene. Br J Ind Med 43:685–691.
Bond JA, Medinsky MA. 2001. Insights into the toxicokinetics and toxicodynamics of 1,3-butadiene. Chem Biol Interact 135-136:599–614.
40

Rubbertown Health Consultation
Boogaard, PJ, van Sittert, NJ, Megans HJ. 2001. Urinary metabolites and haemoglobin adducts as biomarkers of exposure to 1,3-butadiene: a basis for 1,3-butadiene cancer risk assessment. Chem Biol Interact 135-136: 695–701.
Bulbulyan MA, Changuina OV, Zaridze DG, Astashevsky SV, Cilin D, Boffetta P. 1998. Cancer mortality among shoe workers exposed to chloroprene. Cancer, Causes, and Control 9:381–7.
Bureau of the Census. 2001. 2000 Census of population and housing, summary tape file 1A [machine-readable data files]. Washington, DC: US Department of Commerce.
[CIIT] Chemical Industry Institute of Toxicology. 1998. Formaldehyde risk assessment meeting. November 14, 1997. Research Triangle Park, NC.
Conolly RB, Kimbell JS, Janszen D, Schlosser PM, Kalisak D, Preston J, Miller FJ. 2004. Human respiratory tract cancer risks of inhaled formaldehyde: dose-response predictions derived from biologically-motivated computational modeling of a combined rodent and human dataset. Toxicol Sci. 2004 Nov;82(1):279–96.
Cunningham ML, Elwell MR, Matthews HB. 1994. Relationship of carcinogenicity and cellular proliferation induced by mutagenic noncarcinogens vs carcinogens. Fundamental and Applied Toxicology 23:363–9.
Delzell E, Sathiakumar N, Hovinga M, Macaluso M, Julian J, Larson R, Cole P, Muir DC. 1996. A follow-up study of synthetic rubber workers. Toxicology 113(1-3):182–9.
Delzell E, Macaluso M, Sathiakumar N, Mathews R. 2001. Leukemia and exposure to 1,3-butadiene, styrene and dimethyldithiocarbamate among workers in the synthetic rubber industry. Chem Biol Interact 135-136:515–34.
[ECETOC] European Chemical Industry Ecology and Toxicology Centre. 1995. Technical report No. 65. Formaldehyde and human cancer risk. Brussels: European Chemical Industry Ecology and Toxicology Centre.
[EPA] US Environmental Protection Agency. 1985. A summary overview of health effects associated with chloroprene: health issue assessment. Washington: US Environmental Protection Agency. EPA/600/8-85/011F.
[EPA] US Environmental Protection Agency. 1994. Chemicals in the environment: 1,2,4-trimethylbenzene (CAS NO. 95-63-6). OPPT Chemical Fact Sheet, EPA 749-F-94-022. Available at: http://www.epa.gov/opptintr/chemfact/f_trimet.txt.
[EPA] US Environmental Protection Agency. 1998. Integrated risk information system database. Formaldehyde. File last revised on January 2, 1998. Available at: http://www.epa.gov/iris/subst/0419.htm#carc
41
Rubbertown Health Consultation
[EPA] US Environmental Protection Agency. 1999a. Compendium method TO-15: determination of volatile organic compounds (VOCs) in air collected in specially-prepared canisters and analyzed by gas chromatography/ mass spectrometry (GC/MS). EPA Office of Research and Development. EPA/625/R-96/010b. Available at: http://www.epa.gov/ttn/amtic/files/ambient/airtox/to-15r.pdf
[EPA] US Environmental Protection Agency. 1999b. Compendium Method TO-13A: Determination of polycyclic aromatic hydrocarbons (PAHs) in ambient air using gas chromatography/mass spectrometry (GC/MS). EPA Office of Research and Development. EPA/625/R-96/010b. Available at: http://www.epa.gov/ttn/amtic/files/ambient/airtox/to-13arr.pdf
[EPA] US Environmental Protection Agency. 1999c. Compendium Method TO-11A: Determination of formaldehyde in ambient air using adsorbent cartridge followed by high performance liquid chromatograph (HPLC). EPA Office of Research and Development. EPA/625/R-96/010b. Available at: http://www.epa.gov/ttn/amtic/files/ambient/airtox/to-11ar.pdf
[EPA] US Environmental Protection Agency. 1999d. Compendium Method IO-3.5: Determination of metals in ambient particulate matter using inductively coupled plasma/mass spectrometry (ICP/MS). EPA Office of Research and Development. EPA/625/R-96/010a. Available at: http://www.epa.gov/ttnamti1/files/ambient/inorganic/mthd-3-5.pdf
[EPA] US Environmental Protection Agency. 1999e. 1997 Urban Air Toxics Monitoring Program. Prepared for the U.S. Environmental Protection Agency by Eastern Research Group, Inc. January 1999.
[EPA] US Environmental Protection Agency. 2002a. West Louisville Air Toxics Monitoring Study Results. US Environmental Protection Agency, Region 4, Science and Ecosystem Support Division. February 7, 2002.
[EPA] US Environmental Protection Agency. 2002b. Integrated risk information system database. 1,3-Butadiene. File last revised on November 5, 2002. Available at: http://www.epa.gov/iris/subst/0139.htm
[EPA] US Environmental Protection Agency. 2002c. Integrated risk information system database. Chloroform. File last revised on March 26, 2002. Available at: http://www.epa.gov/iris/subst/0025.htm
[EPA] US Environmental Protection Agency. 2003a. Toxic Release Inventory. Data downloaded from: www.epa.gov/tri. Site accessed on October 23, 2003.
[EPA] US Environmental Protection Agency. 2003b. Integrated risk information system database. Acrylonitrile. File last revised on July 30, 2003. Available at: http://www.epa.gov/iris/subst/0206.htm
42
Rubbertown Health Consultation
[EPA] US Environmental Protection Agency. 2003c. West Louisville air monitoring results. EPA air results database provided on compact disc (CD) by Danny France, EPA, on September 30, 2003. Athens (GA): Environmental Protection Agency, Region 4.
[EPA] US Environmental Protection Agency. 2004a. Technology transfer network, air toxics website. Chloroprene (2-chloro-1,3-butadiene). File last updated on June 16, 2004. Available at: http://www.epa.gov/ttn/atw/hlthef/chloropr.html#ref4
[EPA] US Environmental Protection Agency. 2004b. Technology transfer network, air toxics website. Ethyl acrylate. File last updated on November 9, 2004. Available at: http://www.epa.gov/ttn/atw/hlthef/ethylacr.html
Falk H, Steenland NK. 1998. Vinyl chloride and polyvinyl chloride. In: Rom WN, editor. Environmental and occupational medicine, 3rd Ed., Philadelphia: Lippincott-Raven Publishers.
Feron VJ, Jonker D, Groten JP, Horbach GJMJ, Cassee FR, Schoen ED et al. 1993. Combination technology: from challenge to reality. Toxicol Trib 14:1–3.
Feron VJ, Groten JP, van Zirge JA, Cassee FR, Jonker D, van Bladeren PJ. 1995. Toxicity studies in rats of simple mixtures of chemicals with the same or different target organs. Toxicology Letters 82–83:505–12.
Fishbein L. 1984. Overview of analysis of carcinogenic and/or mutagenic metals in biological and environmental samples. I. Arsenic, beryllium, cadmium, chromium and selenium. Int J Environ Anal Chem 17:113–70.
Green, T. 1997. Methylene chloride induced mouse liver and lung tumours: an overview of the role of mechanistic studies in human safety assessment. Hum Exp Toxicol 16:3–13.
Groten JP, Sinkeldam EJ, Luten JB, Van Bladern PJ. 1991. Interaction of dietary calcium, potassium, magnesium, manganese, copper, iron, zinc, and selenium with the accumulation and oral toxicity of cadmium in rats. Food Chem Toxicol 4:249–58.
Groten JP, Schoen ED, van Bladeren PJ, Kuper CF, van Zorge JA, Feron VJ. 1997. Subacute toxicity of a mixture of nine chemicals in rats: detecting interactive effects with a fractionated two-level factorial design. Fundam Appl Toxicol 36:15–29.
Guyton AC, Hall JE. 1996. Pulmonary ventilation. In: Guyton, AC, Hall, JE, editors. Textbook of medical physiology, 9th ed, Philadelphia: W.B. Saunders Company p. 484–5.
Hasegawa R, Miyata E, Futakuchi M, Hagiwara A, Nagao M, Sugimura T, Ito N. 1994. Synergistic enhancement of hepatic foci development by combined treatment of rats with 10 heterocyclic amines at low doses. Carcinogenesis 15:1037–41.
43
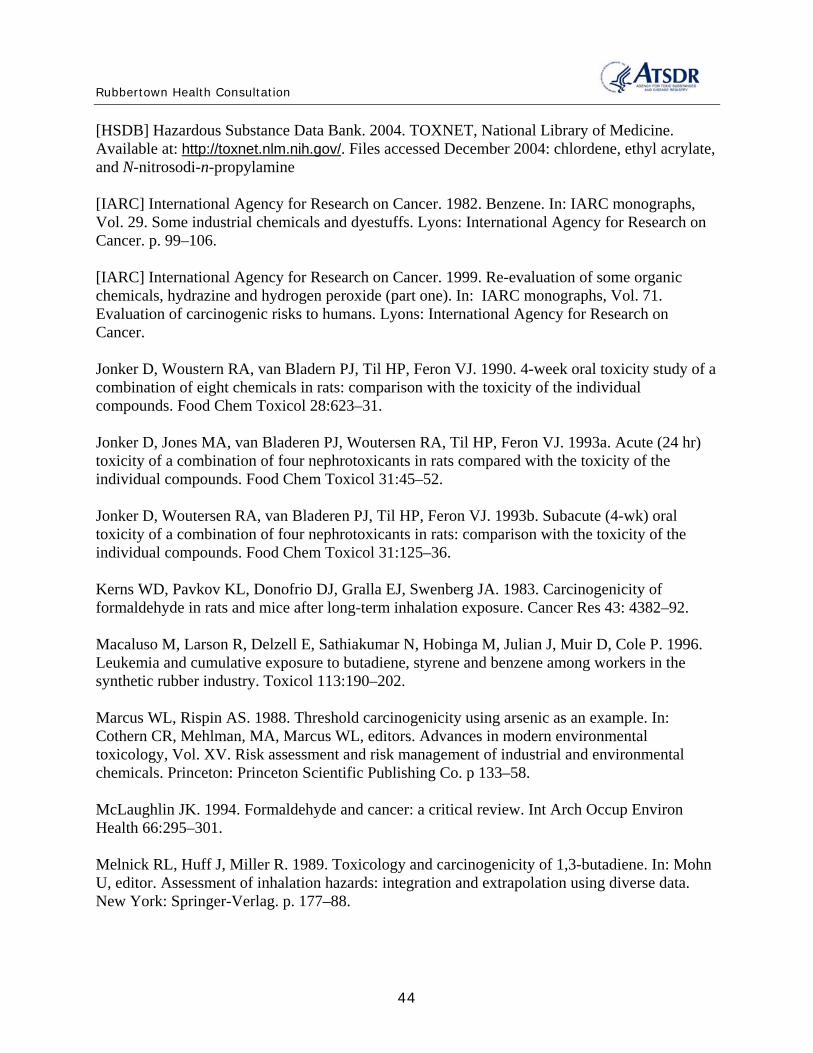
Rubbertown Health Consultation
[HSDB] Hazardous Substance Data Bank. 2004. TOXNET, National Library of Medicine. Available at: http://toxnet.nlm.nih.gov/. Files accessed December 2004: chlordene, ethyl acrylate, and N-nitrosodi-n-propylamine
[IARC] International Agency for Research on Cancer. 1982. Benzene. In: IARC monographs, Vol. 29. Some industrial chemicals and dyestuffs. Lyons: International Agency for Research on Cancer. p. 99–106.
[IARC] International Agency for Research on Cancer. 1999. Re-evaluation of some organic chemicals, hydrazine and hydrogen peroxide (part one). In: IARC monographs, Vol. 71. Evaluation of carcinogenic risks to humans. Lyons: International Agency for Research on Cancer.
Jonker D, Woustern RA, van Bladern PJ, Til HP, Feron VJ. 1990. 4-week oral toxicity study of a combination of eight chemicals in rats: comparison with the toxicity of the individual compounds. Food Chem Toxicol 28:623–31.
Jonker D, Jones MA, van Bladeren PJ, Woutersen RA, Til HP, Feron VJ. 1993a. Acute (24 hr) toxicity of a combination of four nephrotoxicants in rats compared with the toxicity of the individual compounds. Food Chem Toxicol 31:45–52.
Jonker D, Woutersen RA, van Bladeren PJ, Til HP, Feron VJ. 1993b. Subacute (4-wk) oral toxicity of a combination of four nephrotoxicants in rats: comparison with the toxicity of the individual compounds. Food Chem Toxicol 31:125–36.
Kerns WD, Pavkov KL, Donofrio DJ, Gralla EJ, Swenberg JA. 1983. Carcinogenicity of formaldehyde in rats and mice after long-term inhalation exposure. Cancer Res 43: 4382–92.
Macaluso M, Larson R, Delzell E, Sathiakumar N, Hobinga M, Julian J, Muir D, Cole P. 1996. Leukemia and cumulative exposure to butadiene, styrene and benzene among workers in the synthetic rubber industry. Toxicol 113:190–202.
Marcus WL, Rispin AS. 1988. Threshold carcinogenicity using arsenic as an example. In: Cothern CR, Mehlman, MA, Marcus WL, editors. Advances in modern environmental toxicology, Vol. XV. Risk assessment and risk management of industrial and environmental chemicals. Princeton: Princeton Scientific Publishing Co. p 133–58.
McLaughlin JK. 1994. Formaldehyde and cancer: a critical review. Int Arch Occup Environ Health 66:295–301.
Melnick RL, Huff J, Miller R. 1989. Toxicology and carcinogenicity of 1,3-butadiene. In: Mohn U, editor. Assessment of inhalation hazards: integration and extrapolation using diverse data. New York: Springer-Verlag. p. 177–88.
44
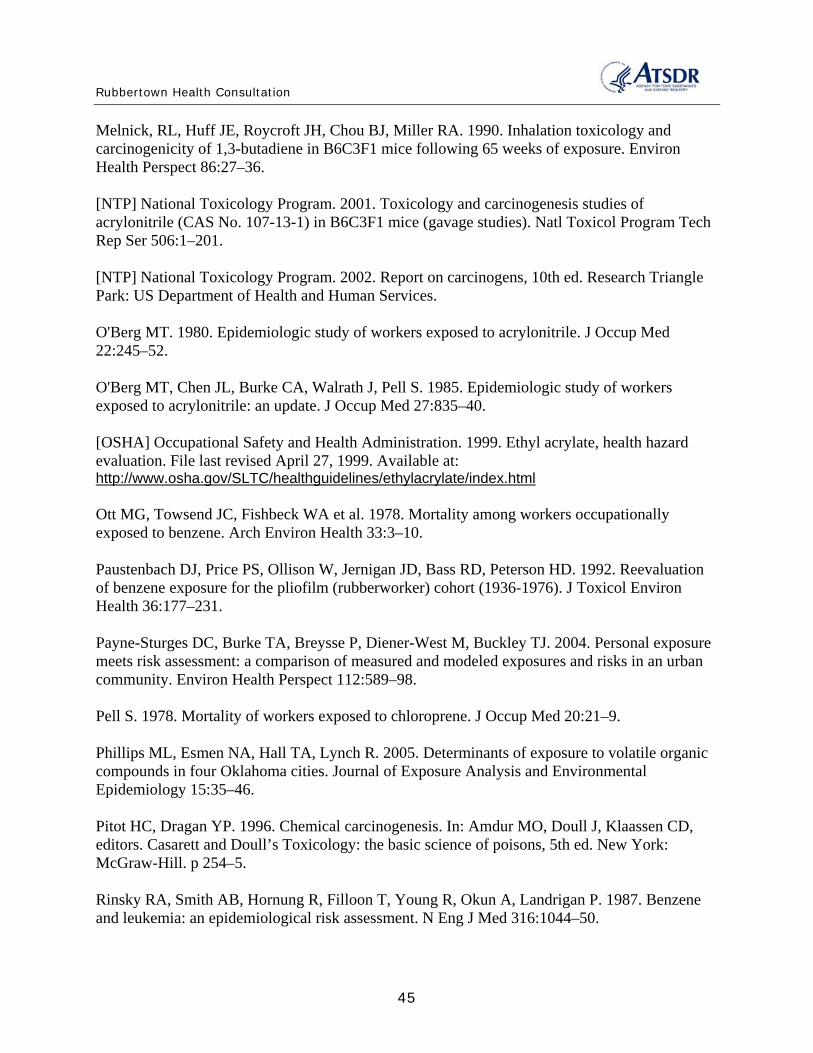
Rubbertown Health Consultation
Melnick, RL, Huff JE, Roycroft JH, Chou BJ, Miller RA. 1990. Inhalation toxicology and carcinogenicity of 1,3-butadiene in B6C3F1 mice following 65 weeks of exposure. Environ Health Perspect 86:27–36.
[NTP] National Toxicology Program. 2001. Toxicology and carcinogenesis studies of acrylonitrile (CAS No. 107-13-1) in B6C3F1 mice (gavage studies). Natl Toxicol Program Tech Rep Ser 506:1–201.
[NTP] National Toxicology Program. 2002. Report on carcinogens, 10th ed. Research Triangle Park: US Department of Health and Human Services.
O'Berg MT. 1980. Epidemiologic study of workers exposed to acrylonitrile. J Occup Med 22:245–52.
O'Berg MT, Chen JL, Burke CA, Walrath J, Pell S. 1985. Epidemiologic study of workers exposed to acrylonitrile: an update. J Occup Med 27:835–40.
[OSHA] Occupational Safety and Health Administration. 1999. Ethyl acrylate, health hazard evaluation. File last revised April 27, 1999. Available at: http://www.osha.gov/SLTC/healthguidelines/ethylacrylate/index.html
Ott MG, Towsend JC, Fishbeck WA et al. 1978. Mortality among workers occupationally exposed to benzene. Arch Environ Health 33:3–10.
Paustenbach DJ, Price PS, Ollison W, Jernigan JD, Bass RD, Peterson HD. 1992. Reevaluation of benzene exposure for the pliofilm (rubberworker) cohort (1936-1976). J Toxicol Environ Health 36:177–231.
Payne-Sturges DC, Burke TA, Breysse P, Diener-West M, Buckley TJ. 2004. Personal exposure meets risk assessment: a comparison of measured and modeled exposures and risks in an urban community. Environ Health Perspect 112:589–98.
Pell S. 1978. Mortality of workers exposed to chloroprene. J Occup Med 20:21–9.
Phillips ML, Esmen NA, Hall TA, Lynch R. 2005. Determinants of exposure to volatile organic compounds in four Oklahoma cities. Journal of Exposure Analysis and Environmental Epidemiology 15:35–46.
Pitot HC, Dragan YP. 1996. Chemical carcinogenesis. In: Amdur MO, Doull J, Klaassen CD, editors. Casarett and Doull’s Toxicology: the basic science of poisons, 5th ed. New York: McGraw-Hill. p 254–5.
Rinsky RA, Smith AB, Hornung R, Filloon T, Young R, Okun A, Landrigan P. 1987. Benzene and leukemia: an epidemiological risk assessment. N Eng J Med 316:1044–50.
45

Rubbertown Health Consultation
Sciences International. 2003. West Louisville air toxics risk assessment, final report. Prepared for the Metro Louisville Air Pollution Control District and the West Jefferson County Community Task Force by Sciences International, Inc., May 5, 2003.
Sexton K, Adgate JL, Mongin SJ, Pratt GC, Ramachandran G, Stock, TH, Morandi MT. 2004. Evaluating differences between measured personal exposures to volatile organic compounds and concentrations in outdoor and indoor air. Environ Sci Technol 38:2593–602.
Sherratt PJ, Williams S, Foster J, Kernohan N, Green T, Hayes JD. 2002. Direct comparison of the nature of mouse and human GST T1-1 and the implications on dichloromethane carcinogenicity. Toxicol Appl Pharmacol 179:89–97.
[SOT] Society of Toxicology. 1981. Re-examination of the ED01 Study. Fundam Appl Toxicol 1:27–128.
[U of L] University of Louisville. 2003. West Louisville air monitoring results. Air results spreadsheet provided via email by Mark Schreck, U of L, on October 2, 2003. Louisville: University of Louisville, Kentucky.
Waddel WJ. 2003. Thresholds of carcinogenesis in the ED01 study. Toxicol Sci 72:158–63.
Wade MG, Foster WG, Younglai EV, McMahon A, Leingartner K, Yagminas, A, et al. 2002. Effects of subchronic exposure to a complex mixture of persistent contaminants in male rats: systemic, immune, and reproductive effects. Toxicol Sci 67:131–42
Wallace L. 1996. Environmental exposure to benzene: an update. Environ Health Perspect 104:1129–36.
Ward CE, Starr TB. 1993. Comparison of cancer risks projected from animal bioassays to epidemiologic studies of acrylonitrile-exposed workers. Regul Toxicol Pharmacol 18:214–32.
Weisel CP, Zhang J, Turpin BJ, Morandi MT, Colome S, Stock TH, et al. 2005. Relationship of indoor, outdoor and personal air (RIOPA) study: study, design, methods and quality assurance/control results. J Expo Anal Env Epid 15:123–37.
[WJCCTF] West Jefferson County Community Task Force. 2003. West Louisville air toxics study, risk management plan, part 1, process and framework. Available at: http://unixfp.iglou.com/apcd/toxics_risk/wlats_risk_mgmt_plan.pdf.
[WJCCTF] West Jefferson County Community Task Force. 2004. West Jefferson County Community Task Force web page. Site last accessed on December 22, 2004. Available at: http://www.louisville.edu/org/wjcctf/.
46

Rubbertown Health Consultation
Williams GM, Weisburger JH. 1991. Chemical carcinogenesis. In: Amdur MO, Doull J, Klaassen CD, editors. Casarett and Doull’s Toxicology: the basic science of poisons, 4th ed. New York: Pergamon Press.
Wong O. 1995. Risk of acute myeloid leukemia and multiple myeloma in workers exposed to benzene. Occup Environ Med 52:380–4.
Xia ZL, Jin XP, Lu PL, Gu XQ, LaPorte RE, Tajima N. 1995. Ascertainment corrected prevalence rate (ACPR) of leukopenia in workers exposed to benzene in small-scale. industries calculated with capture-recapture methods. Biomed Environ Sci 8:30–4. Cited in: Agency for Toxic Substances and Disease Registry. 1997. Toxicological profile for benzene. Atlanta: US Department of Health and Human Services.
47

Rubbertown Health Consultation
Appendix A. Figures
48
#
#*
#*
#*
#*
#*
#*
#*
#*
#*
#*
!(
!(
!(!(!(!(!(
!(
!(
!(!(
!(!(
!(
!(
!(
!(
!(
!(
!(!(
!(
!(
!(
!(!(!(!(
!(
!(
!(!(
!(
!(
!(!(!(
!(
!(
!(
!(!(
!(!(
!(!(!(
!(!(!(
!(!(!(
!(
!(
!(!(
!(
!(!(
!(!(!(!(!(
!(
!(!(
!(
!(
!(!(!(!(!(!(!(!(!(!(!(
!(!(!(!(!(!(!(!(!(!(!(!(!(!(!(
!(!(
!(!(!(!(
!(!(!(!(!(
!(
!(!(!(
!(!(
!(
!(!(!(
!(!(
!(
!(!(
!(!(
!(!(
!(
!(
!(!(!(
!(
!(!(
!(!(!(!(!(
!(
!(!(
!(!(!(
!(
!(!(
!(
!(
!(!(
!(
!(!(!(!(
!(
!(
§̈¦264
Cane R
un R
oad
Ralph Ave.Marathon Oil Co. Terminal (A)
O h
i o
R
i v e
rIndiana
12
Du Pont Louisville PlantNoveon Inc.Zeon Chemicals L.P.
Polyone Corp.
DDE LouisvilleRohm & Hass Co.
Cone Solvents, Inc.
Eckart America Corp.
Hexion SpecialtyChemicals, Inc.
Carbide Inds. L.L.C.
American Synthetic Rubber Co., L.L.C.
Arkema, Inc.
Ashland Distribution Co.
Oxy Vinyls L.P. Louisville
Superior Solvents & Chemicals
Marathon Oil Co. Terminal (K)
Chevron Louisville Terminal/ Lubricants Blend Plant
L o u i s v i l l eL o u i s v i l l e
S h i v e l yS h i v e l y
S t . D e n n i sS t . D e n n i s
N e w A l b a n yN e w A l b a n y
P l e a s u r e R i d g e P a r kP l e a s u r e R i d g e P a r kP l e a s u r e R i d g e P a r kP l e a s u r e R i d g e P a r k
9
8
7
4
3
2
1
11
10
#
Source: 2004 Revisions -MS TerraServer and LOJIC map in PDF form
0.5 0 0.5 Miles
ksl_10-18-2005
#* Air StationsProperty Boundaries 2004
Figure 1: Toxic Release Inventory (TRI) Facilitiesand West Louisville Air Station LocationsRubbertown Industrial Area
FOR INTERNAL AND EXTERNAL RELEASEAGENCY FOR TOXIC SUBSTANCES AND DISEASE REGISTRY
UNITED STATES DEPARTMENT OF HEALTH AND HUMAN SERVICES
Jefferson County
Site

§̈¦I 264Cane R
un R
d
Ohi
o R
iver
Camp Ground Rd
Base Map Source: Geographic Data Technology, May 2005.Site Boundary Data Source: ATSDR Public Health GIS Program, May 2005.
Demographics Statistics Source: 2000 U.S. Census* Calculated using an area-proportion spatial analysis technique** People who identify their origin as Hispanic or Latino may be of any race.
°
Demographic Statistics Within Area of Concern*
Total Population
White AloneBlack AloneAm. Indian & Alaska Native AloneAsian AloneNative Hawaiian & Other Pacific Islander AloneSome Other Race AloneTwo or More Races
Hispanic or Latino**
Children Aged 6 and YoungerAdults Aged 65 and OlderFemales Aged 15 to 44
Total Housing Units
K Y
W V
Adults 65 Years and Older Females Aged 15 to 44
Population Density Children 6 Years and YoungerSource: 2000 U.S. Census Source: 2000 U.S. Census
Source: 2000 U.S. Census Source: 2000 U.S. Census
1,416
1,220156
70 15
28 9
129201295
629
Site Location: Jefferson County, KY
GENERATED: 10-14-2005
FOR INTERNAL AND EXTERNAL RELEASE
Figure 2: Demographic Statistics Within the Industrial Area
Coordinate System (All Panels): NAD 1983 StatePlane Kentucky North FIPS 1601 Feet
0 0.4 0.8 1.2
Miles
0 0.4 0.8 1.2
Miles
0 0.4 0.8 1.2
Miles
0 0.4 0.8 1.2
Miles
By US Census Block
Zero Population *
1 - 4,999 *
5,000 - 9,999 *
10,000 and Above *
* Per Square Mile
By US Census Block
Zero Population
1 - 9 Children
10 - 20 Children
> 20 Children
By US Census Block
Zero Population
1 - 9 Females
10 - 20 Females
> 20 Females
By US Census Block
Zero Population
1 - 9 Adults
10 - 20 Adults
> 20 Adults
Rubbertown Industrial AreaWest Louisville, KY
xxxbufferlegendxxx
0 0.5 1 1.5 Miles
Legend
Industrial Area
GRASPMASTER 9.1 [BETA] -
AGENCY FOR TOXIC SUBSTANCES AND DISEASE REGISTRY | UNITED STATES DEPARTMENT OF HEALTH AND HUMAN SERVICES
Ohi
o
River
§̈¦I 264Cane R
un R
d
CAMP GROUND RD
Base Map Source: Geographic Data Technology, May 2005.Site Boundary Data Source: ATSDR Public Health GIS Program, May 2005.
Demographics Statistics Source: 2000 U.S. Census* Calculated using an area-proportion spatial analysis technique** People who identify their origin as Hispanic or Latino may be of any race.
°
Demographic Statistics Within One Mile of Site*
Total Population
White AloneBlack AloneAm. Indian & Alaska Native AloneAsian AloneNative Hawaiian & Other Pacific Islander AloneSome Other Race AloneTwo or More Races
Hispanic or Latino**
Children Aged 6 and YoungerAdults Aged 65 and OlderFemales Aged 15 to 44
Total Housing Units
K Y
W V
Adults 65 Years and Older Females Aged 15 to 44
Population Density Children 6 Years and YoungerSource: 2000 U.S. Census Source: 2000 U.S. Census
Source: 2000 U.S. Census Source: 2000 U.S. Census
30,461
11,23418,586
5864
6
111402
234
2,9204,7826,487
13,303
Site Location: Jefferson County, KY
GENERATED: 10-14-2005
FOR INTERNAL AND EXTERNAL RELEASE
Figure 3: Demographic Statistics Within One Mile of Industrial Area
Coordinate System (All Panels): NAD 1983 StatePlane Kentucky North FIPS 1601 Feet
0 0.5 1 1.5
Miles
0 0.5 1 1.5
Miles
0 0.5 1 1.5
Miles
0 0.5 1 1.5
Miles
By US Census Block
Zero Population *
1 - 4,999 *
5,000 - 9,999 *
10,000 and Above *
* Per Square Mile
By US Census Block
Zero Population
1 - 9 Children
10 - 20 Children
> 20 Children
By US Census Block
Zero Population
1 - 9 Females
10 - 20 Females
> 20 Females
By US Census Block
Zero Population
1 - 9 Adults
10 - 20 Adults
> 20 Adults
Rubbertown Industrial AreaWest Louisville, KY
xxxbufferlegendxxx
0 1 2 3 Miles
One Mile Buffer
Legend
Industrial Area
GRASPMASTER 9.1 [BETA] -
AGENCY FOR TOXIC SUBSTANCES AND DISEASE REGISTRY | UNITED STATES DEPARTMENT OF HEALTH AND HUMAN SERVICES

Rubbertown Health Consultation
Appendix B. Tables Table 1. Monitoring Location Descriptions in West Louisville*
Station number† Station name Description‡
Laboratory that analyzed samples
Pollutants measured
1§ Louisville Police Firearms Training Maximum impact site EPA and
U of L
VOCs, SVOCs, formaldehyde,
metals, reactive aerosols, PCBs, and pesticides
2¶ Ralph Avenue and Campground Road
Maximum impact and neighborhood population exposure site
EPA and U of L
3 Old Lake Dreamland Fire Department
Neighborhood population exposure site EPA
4 St. Stephens Baptist Church
Neighborhood population exposure site EPA
5 University of Louisville, Shelby Campus
Anthropogenic urban activity control site near a major traffic corridor, considered an urban background monitor
EPA
6 Otter Creek Park Background site in public park 24 miles southwest of study area in predominantly upwind direction
EPA
7 Southwick Community Center
Neighborhood population exposure site U of L
VOCs
8 Farnsley Middle School Neighborhood population exposure site U of L
9 Chickasaw Park Neighborhood population exposure site U of L
10 New Lake Dreamland Fire Department
Neighborhood population exposure site U of L
11 Martin Luther King Elementary School
Neighborhood population exposure site U of L
12 Cane Run Elementary School
Neighborhood population exposure site U of L
* Refer to Figure 1 for a map of the monitoring stations. † The numbering shown here is consistent with the station numbering used in the risk assessment completed by Sciences International
(see Section 2.4) Note that the Web site for the West Jefferson County Community Task Force uses a different numbering scheme. ‡ The descriptions provided here are consistent with the risk assessment descriptions. ' Both EPA and the U of L laboratories analyzed samples from Station 1. & Both EPA and the U of L laboratories operated colocated sampling devices at Station # 2.
EPA Environmental Protection Agency PCBs polychlorinated biphenyls SVOCs semi-volatile organic compounds U of L University of Louisville VOCs volatile organic compounds
52
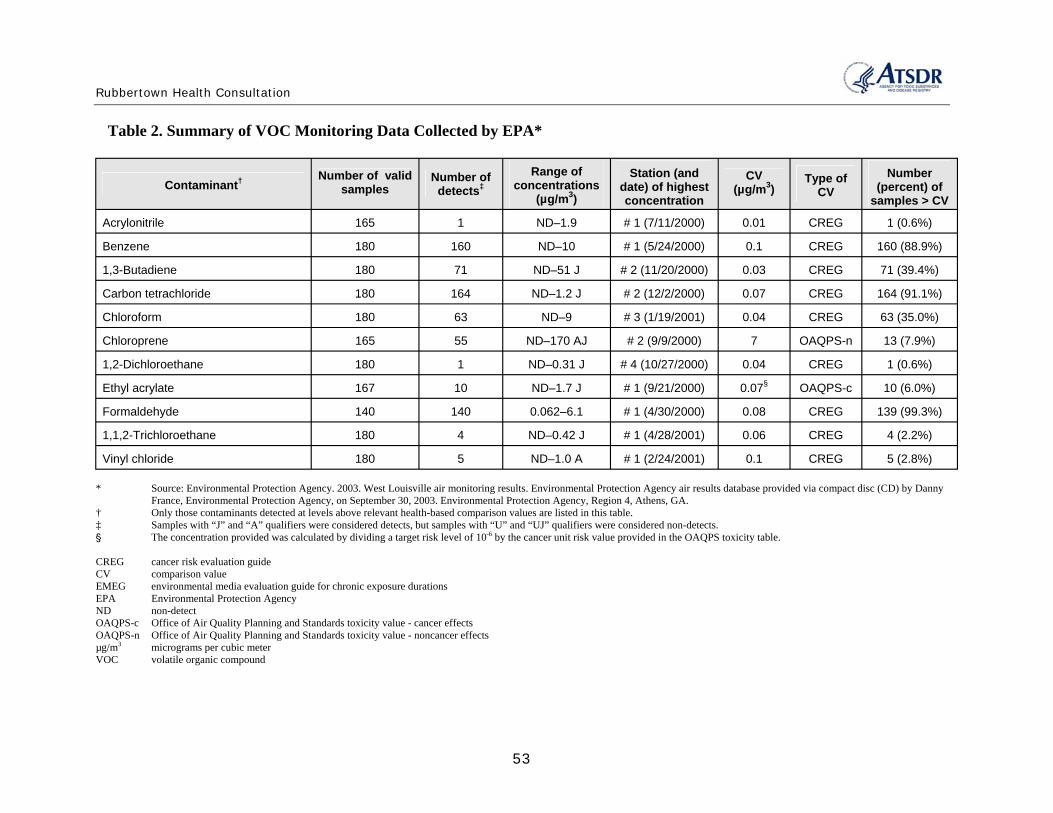
Rubbertown Health Consultation
Table 2. Summary of VOC Monitoring Data Collected by EPA*
Contaminant† Number of valid samples
Number of detects‡
Range of concentrations
(µg/m3) Station (and
date) of highest concentration
CV (µg/m3) Type of
CV Number
(percent) of samples > CV
Acrylonitrile 165 1 ND–1.9 # 1 (7/11/2000) 0.01 CREG 1 (0.6%)
Benzene 180 160 ND–10 # 1 (5/24/2000) 0.1 CREG 160 (88.9%)
1,3-Butadiene 180 71 ND–51 J # 2 (11/20/2000) 0.03 CREG 71 (39.4%)
Carbon tetrachloride 180 164 ND–1.2 J # 2 (12/2/2000) 0.07 CREG 164 (91.1%)
Chloroform 180 63 ND–9 # 3 (1/19/2001) 0.04 CREG 63 (35.0%)
Chloroprene 165 55 ND–170 AJ # 2 (9/9/2000) 7 OAQPS-n 13 (7.9%)
1,2-Dichloroethane 180 1 ND–0.31 J # 4 (10/27/2000) 0.04 CREG 1 (0.6%)
Ethyl acrylate 167 10 ND–1.7 J # 1 (9/21/2000) 0.07§ OAQPS-c 10 (6.0%)
Formaldehyde 140 140 0.062–6.1 # 1 (4/30/2000) 0.08 CREG 139 (99.3%)
1,1,2-Trichloroethane 180 4 ND–0.42 J # 1 (4/28/2001) 0.06 CREG 4 (2.2%)
Vinyl chloride 180 5 ND–1.0 A # 1 (2/24/2001) 0.1 CREG 5 (2.8%)
* Source: Environmental Protection Agency. 2003. West Louisville air monitoring results. Environmental Protection Agency air results database provided via compact disc (CD) by Danny France, Environmental Protection Agency, on September 30, 2003. Environmental Protection Agency, Region 4, Athens, GA.
† Only those contaminants detected at levels above relevant health-based comparison values are listed in this table. ‡ Samples with “J” and “A” qualifiers were considered detects, but samples with “U” and “UJ” qualifiers were considered non-detects. ' The concentration provided was calculated by dividing a target risk level of 10-6 by the cancer unit risk value provided in the OAQPS toxicity table.
CREG cancer risk evaluation guide CV comparison value EMEG environmental media evaluation guide for chronic exposure durations EPA Environmental Protection Agency ND non-detect OAQPS-c Office of Air Quality Planning and Standards toxicity value - cancer effects OAQPS-n Office of Air Quality Planning and Standards toxicity value - noncancer effects µg/m3 micrograms per cubic meter VOC volatile organic compound
53
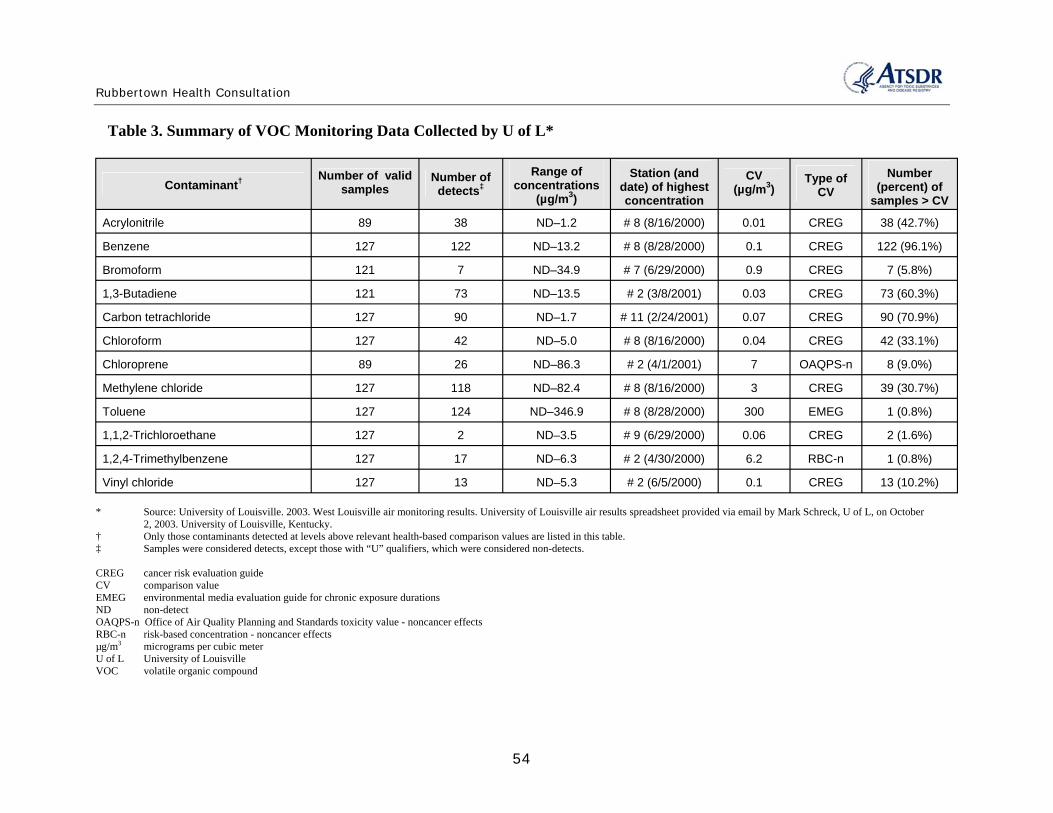
Rubbertown Health Consultation
Table 3. Summary of VOC Monitoring Data Collected by U of L*
Contaminant† Number of valid samples
Number of detects‡
Range of concentrations
(µg/m3) Station (and
date) of highest concentration
CV (µg/m3) Type of
CV Number
(percent) of samples > CV
Acrylonitrile 89 38 ND–1.2 # 8 (8/16/2000) 0.01 CREG 38 (42.7%)
Benzene 127 122 ND–13.2 # 8 (8/28/2000) 0.1 CREG 122 (96.1%)
Bromoform 121 7 ND–34.9 # 7 (6/29/2000) 0.9 CREG 7 (5.8%)
1,3-Butadiene 121 73 ND–13.5 # 2 (3/8/2001) 0.03 CREG 73 (60.3%)
Carbon tetrachloride 127 90 ND–1.7 # 11 (2/24/2001) 0.07 CREG 90 (70.9%)
Chloroform 127 42 ND–5.0 # 8 (8/16/2000) 0.04 CREG 42 (33.1%)
Chloroprene 89 26 ND–86.3 # 2 (4/1/2001) 7 OAQPS-n 8 (9.0%)
Methylene chloride 127 118 ND–82.4 # 8 (8/16/2000) 3 CREG 39 (30.7%)
Toluene 127 124 ND–346.9 # 8 (8/28/2000) 300 EMEG 1 (0.8%)
1,1,2-Trichloroethane 127 2 ND–3.5 # 9 (6/29/2000) 0.06 CREG 2 (1.6%)
1,2,4-Trimethylbenzene 127 17 ND–6.3 # 2 (4/30/2000) 6.2 RBC-n 1 (0.8%)
Vinyl chloride 127 13 ND–5.3 # 2 (6/5/2000) 0.1 CREG 13 (10.2%)
* Source: University of Louisville. 2003. West Louisville air monitoring results. University of Louisville air results spreadsheet provided via email by Mark Schreck, U of L, on October 2, 2003. University of Louisville, Kentucky.
† Only those contaminants detected at levels above relevant health-based comparison values are listed in this table. ‡ Samples were considered detects, except those with “U” qualifiers, which were considered non-detects.
CREG cancer risk evaluation guide CV comparison value EMEG environmental media evaluation guide for chronic exposure durations ND non-detect OAQPS-n Office of Air Quality Planning and Standards toxicity value - noncancer effects RBC-n risk-based concentration - noncancer effects µg/m3 micrograms per cubic meter U of L University of Louisville VOC volatile organic compound
54

Rubbertown Health Consultation
Table 4. Summary of SVOC Monitoring Data Collected by EPA*
Contaminant† Number of valid samples
Number of detects‡
Range of concentrations
(µg/m3) Station (and date) of
highest concentration
CV (µg/m3) Type of CV
Number (percent) of
samples > CV Acenaphthylene 167 9 ND–0.0081 J # 2 (12/26/2000) NA NA NA
2-Nitrophenol 167 41 ND–0.1 # 3 (10/27/2000) NA NA NA
N-Nitrosodi-n-propylamine 167 1 ND–0.029 J # 6 (7/11/2000) 0.00089 RBC-c 1 (0.6%)
Phenanthrene 167 132 ND–0.19 # 4 (7/23/2000) NA NA NA
* Source: Environmental Protection Agency. 2003. West Louisville air monitoring results. Environmental Protection Agency air results database provided via compact disc (CD) by Danny France, Environmental Protection Agency, on September 30, 2003. Environmental Protection Agency, Region 4, Athens, GA.
† Only those contaminants detected at levels above relevant health-based comparison values are listed in this table. ‡ Samples with “J” and “A” qualifiers were considered detects, but samples with “U” and “UJ” qualifiers were considered non-detects.
CV comparison value EPA Environmental Protection Agency NA not applicable (no ATSDR or EPA comparison value available) ND non-detect RBC-c risk-based concentration - cancer effects µg/m3 micrograms per cubic meter SVOC semi-volatile organic compound
55
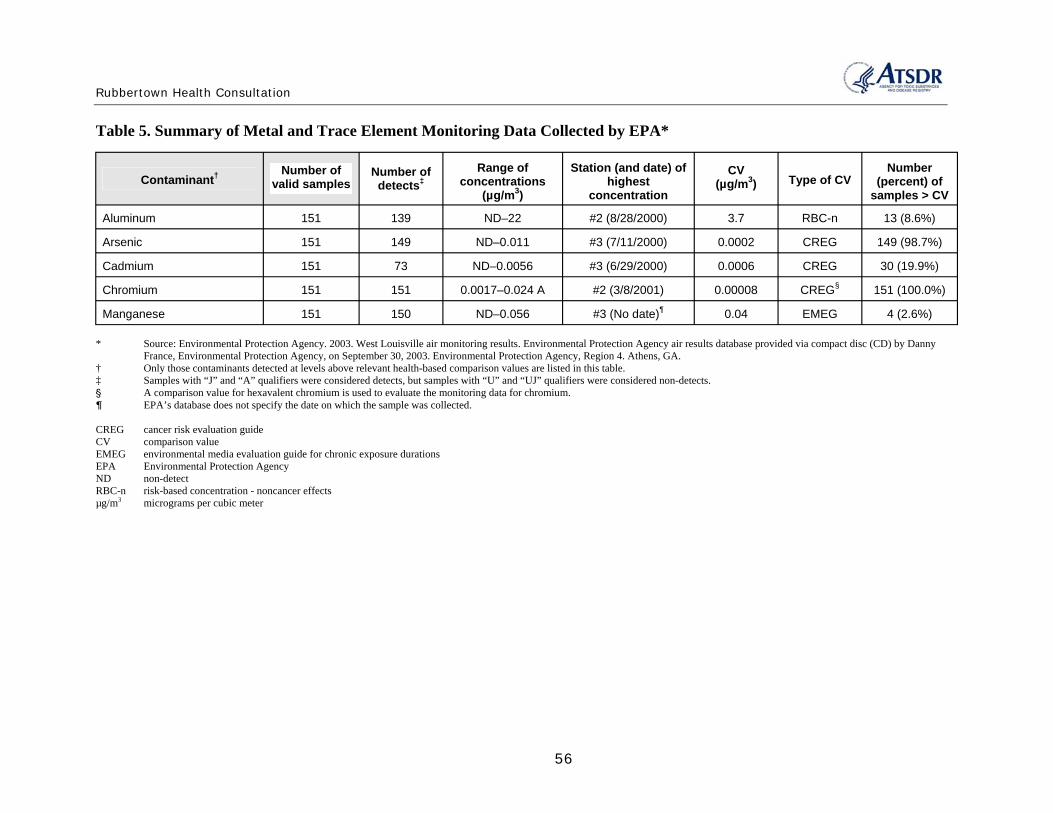
Rubbertown Health Consultation
Table 5. Summary of Metal and Trace Element Monitoring Data Collected by EPA*
Contaminant† Number of valid samples
Number of detects‡
Range of concentrations
(µg/m3) Station (and date) of
highest concentration
CV (µg/m3) Type of CV
Number (percent) of
samples > CV Aluminum 151 139 ND–22 #2 (8/28/2000) 3.7 RBC-n 13 (8.6%)
Arsenic 151 149 ND–0.011 #3 (7/11/2000) 0.0002 CREG 149 (98.7%)
Cadmium 151 73 ND–0.0056 #3 (6/29/2000) 0.0006 CREG 30 (19.9%)
Chromium 151 151 0.0017–0.024 A #2 (3/8/2001) 0.00008 CREG§ 151 (100.0%)
Manganese 151 150 ND–0.056 #3 (No date)¶ 0.04 EMEG 4 (2.6%)
* Source: Environmental Protection Agency. 2003. West Louisville air monitoring results. Environmental Protection Agency air results database provided via compact disc (CD) by Danny France, Environmental Protection Agency, on September 30, 2003. Environmental Protection Agency, Region 4. Athens, GA.
† Only those contaminants detected at levels above relevant health-based comparison values are listed in this table.‡ Samples with “J” and “A” qualifiers were considered detects, but samples with “U” and “UJ” qualifiers were considered non-detects.' A comparison value for hexavalent chromium is used to evaluate the monitoring data for chromium.& EPA’s database does not specify the date on which the sample was collected.
CREG cancer risk evaluation guide CV comparison value EMEG environmental media evaluation guide for chronic exposure durations EPA Environmental Protection Agency ND non-detect RBC-n risk-based concentration - noncancer effects µg/m3 micrograms per cubic meter
56

Rubbertown Health Consultation
Table 6. Summary of Pesticide Monitoring Data Collected by EPA*
Contaminant† Number of
valid samples
Number of detects‡ Range of
concentrations (µg/m3) Station (and date) of
highest concentration
CV (µg/m3) Type of CV
Number (percent) of
samples > CV alpha-Chlordene 2 1 ND–0.000028 J #3 (8/28/2000) NA NA NA
beta-Chlordene 4 4 0.000036 J–0.000066 J #3 (8/28/2000) NA NA NA
Chlordene 5 1 ND–0.000085 J #2 (8/28/2000) NA NA NA
Dieldrin 5 2 ND–0.00021 #4 (8/28/2000) 0.0002 CREG 1 (20.0%)
Toxaphene 5 1 ND–0.015 J #4 (8/28/2000) 0.003 CREG 1 (20.0%)
* Source: Environmental Protection Agency. 2003. West Louisville air monitoring results. Environmental Protection Agency air results database provided via compact disc (CD) by Danny France, Environmental Protection Agency, on September 30, 2003. Environmental Protection Agency, Region 4. Athens, GA.
† Only those contaminants detected at levels above relevant health-based comparison values are listed in this table. ‡ Samples with “J” and “A” qualifiers were considered detects, but samples with “U” and “UJ” qualifiers were considered non-detects.
CREG cancer risk evaluation guide CV comparison value EPA Environmental Protection Agency NA not applicable (no ATSDR or EPA comparison value available) ND non-detect µg/m3 micrograms per cubic meter
57
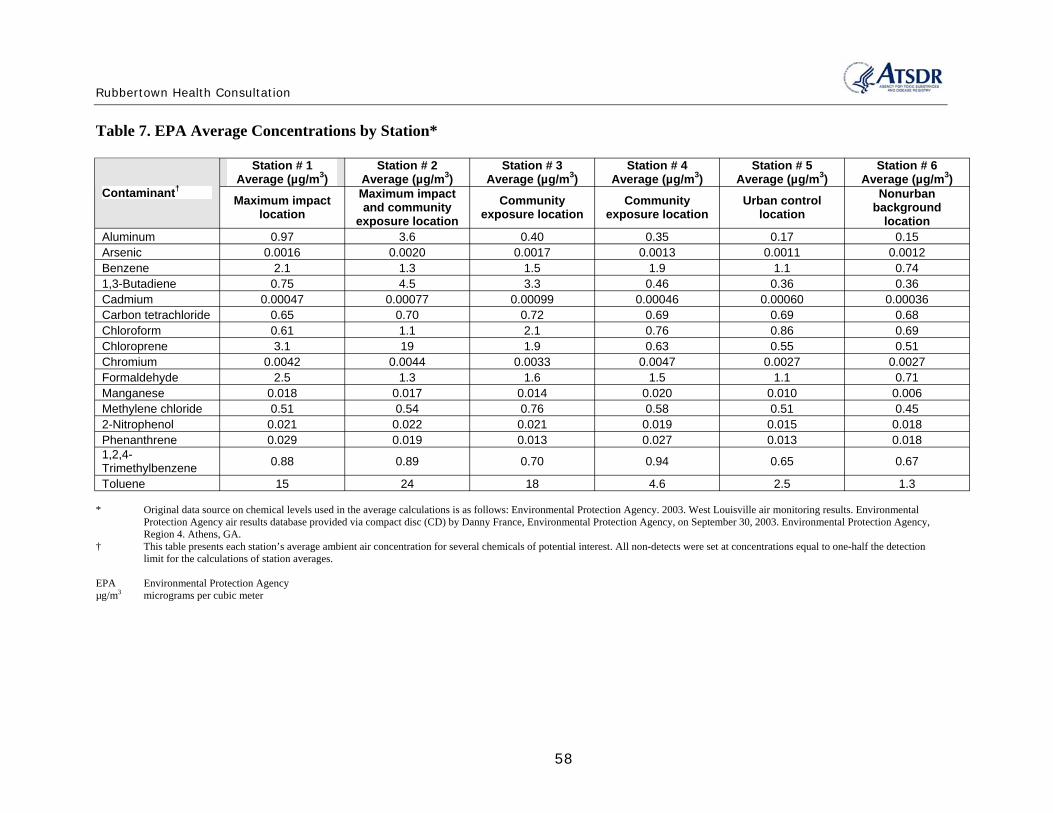
Rubbertown Health Consultation
Table 7. EPA Average Concentrations by Station*
Contaminant†
Station # 1 Average (µg/m3)
Station # 2 Average (µg/m3)
Station # 3 Average (µg/m3)
Station # 4 Average (µg/m3)
Station # 5 Average (µg/m3)
Station # 6 Average (µg/m3)
Maximum impact location
Maximum impact and community
exposure location Community
exposure location Community
exposure location Urban control
location Nonurban
background location
Aluminum 0.97 3.6 0.40 0.35 0.17 0.15 Arsenic 0.0016 0.0020 0.0017 0.0013 0.0011 0.0012 Benzene 2.1 1.3 1.5 1.9 1.1 0.74 1,3-Butadiene 0.75 4.5 3.3 0.46 0.36 0.36 Cadmium 0.00047 0.00077 0.00099 0.00046 0.00060 0.00036 Carbon tetrachloride 0.65 0.70 0.72 0.69 0.69 0.68 Chloroform 0.61 1.1 2.1 0.76 0.86 0.69 Chloroprene 3.1 19 1.9 0.63 0.55 0.51 Chromium 0.0042 0.0044 0.0033 0.0047 0.0027 0.0027 Formaldehyde 2.5 1.3 1.6 1.5 1.1 0.71 Manganese 0.018 0.017 0.014 0.020 0.010 0.006 Methylene chloride 0.51 0.54 0.76 0.58 0.51 0.45 2-Nitrophenol 0.021 0.022 0.021 0.019 0.015 0.018 Phenanthrene 0.029 0.019 0.013 0.027 0.013 0.018 1,2,4-Trimethylbenzene 0.88 0.89 0.70 0.94 0.65 0.67
Toluene 15 24 18 4.6 2.5 1.3
* Original data source on chemical levels used in the average calculations is as follows: Environmental Protection Agency. 2003. West Louisville air monitoring results. Environmental Protection Agency air results database provided via compact disc (CD) by Danny France, Environmental Protection Agency, on September 30, 2003. Environmental Protection Agency, Region 4. Athens, GA.
† This table presents each station’s average ambient air concentration for several chemicals of potential interest. All non-detects were set at concentrations equal to one-half the detection limit for the calculations of station averages.
EPA Environmental Protection Agency µg/m3 micrograms per cubic meter
58
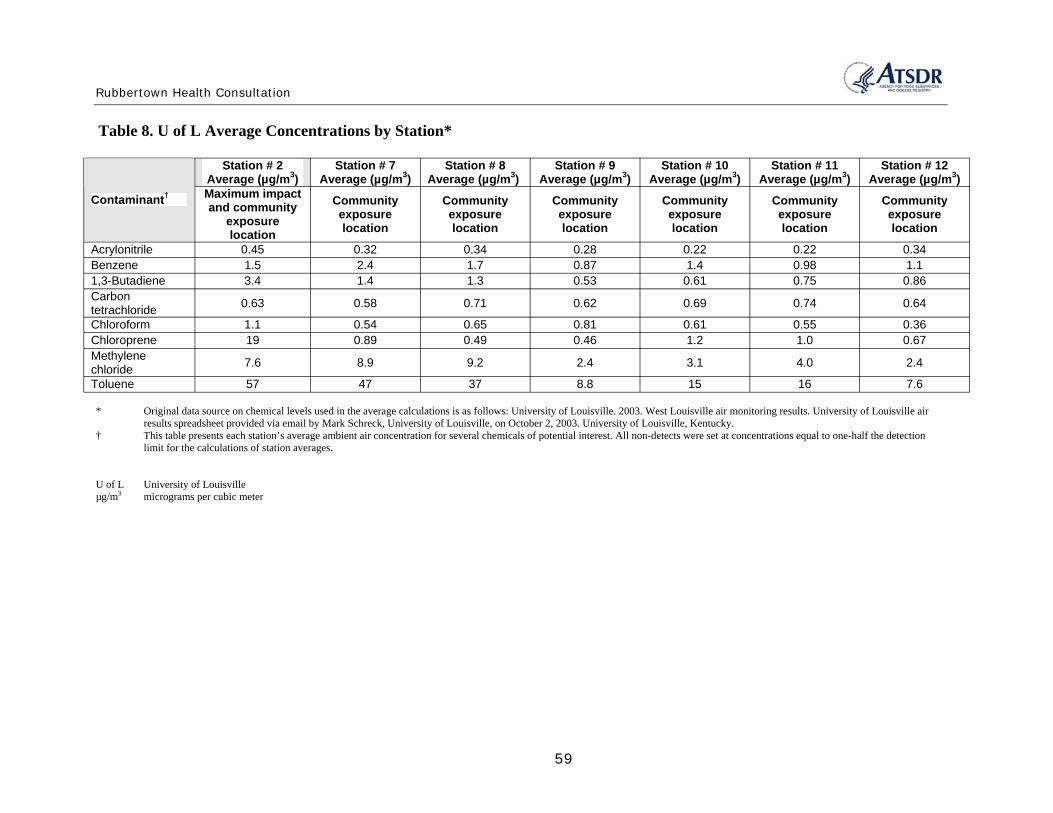
Rubbertown Health Consultation
Table 8. U of L Average Concentrations by Station*
Contaminant†
Station # 2 Average (µg/m3)
Station # 7 Average (µg/m3)
Station # 8 Average (µg/m3)
Station # 9 Average (µg/m3)
Station # 10 Average (µg/m3)
Station # 11 Average (µg/m3)
Station # 12 Average (µg/m3)
Maximum impact and community
exposure location
Community exposure location
Community exposure location
Community exposure location
Community exposure location
Community exposure location
Community exposure location
Acrylonitrile 0.45 0.32 0.34 0.28 0.22 0.22 0.34 Benzene 1.5 2.4 1.7 0.87 1.4 0.98 1.1 1,3-Butadiene 3.4 1.4 1.3 0.53 0.61 0.75 0.86 Carbon tetrachloride 0.63 0.58 0.71 0.62 0.69 0.74 0.64
Chloroform 1.1 0.54 0.65 0.81 0.61 0.55 0.36 Chloroprene 19 0.89 0.49 0.46 1.2 1.0 0.67 Methylene chloride 7.6 8.9 9.2 2.4 3.1 4.0 2.4
Toluene 57 47 37 8.8 15 16 7.6
* Original data source on chemical levels used in the average calculations is as follows: University of Louisville. 2003. West Louisville air monitoring results. University of Louisville air results spreadsheet provided via email by Mark Schreck, University of Louisville, on October 2, 2003. University of Louisville, Kentucky.
† This table presents each station’s average ambient air concentration for several chemicals of potential interest. All non-detects were set at concentrations equal to one-half the detection limit for the calculations of station averages.
U of L University of Louisville µg/m3 micrograms per cubic meter
59

Rubbertown Health Consultation
Table 9. Cancer Risk Estimates Using EPA Station Averages*
Contaminant†
Station # 1 Station # 2 Station # 3 Station # 4 Station # 5 Station # 6 Maximum Impact
Location Maximum impact and community exposure
location Community
Exposure Location Community
Exposure Location Urban Control
Location Nonurban
Background Location
Canc
er ris
k‡
Perce
ntco
ntribu
tion
to cu
mulat
ive
canc
er ris
k
Canc
er Ri
sk
Perce
ntco
ntribu
tion
to cu
mulat
ive
canc
er ris
k
Canc
er ris
k
Perce
ntco
ntribu
tion
to cu
mulat
ive
canc
er ris
k
Canc
er ris
k
Perce
ntco
ntribu
tion
to cu
mulat
ive
canc
er ris
k
Canc
er ris
k
Perce
ntco
ntribu
tion
to cu
mulat
ive
canc
er ris
k
Canc
er ris
k
Perce
ntco
ntribu
tion
to cu
mulat
ive
canc
er ris
k
Arsenic 6.88E–06 5.7 8.60E–06 3.5 7.31E–06 3.3 5.59E–06 4.7 4.73E–06 5.4 5.16E–06 6.4 Benzene 1.64E–05 13.6 1.01E–05 4.1 1.17E–05 5.3 1.48E–05 12.4 8.58E–06 9.7 5.77E–06 7.1 1,3-Butadiene 2.25E–05 18.6 1.35E–04 55.3 9.90E–05 45.2 1.38E–05 11.5 1.08E–05 12.3 1.08E–05 13.3 Cadmium 8.46E–07 0.7 1.39E–06 0.6 1.78E–06 0.8 8.28E–07 0.7 1.08E–06 1.2 6.48E–07 0.8 Carbon tetrachloride 9.75E–06 8.1 1.05E–05 4.3 1.08E–05 4.9 1.04E–05 8.7 1.04E–05 11.8 1.02E–05 12.6 Chloroform 1.40E–05 11.6 2.53E–05 10.4 4.83E–05 22.1 1.75E–05 14.6 1.98E–05 22.5 1.59E–05 19.6 Chromium 5.04E–05 41.7 5.28E–05 21.6 3.96E–05 18.1 5.64E–05 47.2 3.24E–05 36.8 3.24E–05 40.0 Formaldehyde 1.38E–08 0.01 7.15E–09 0.003 8.8E–09 0.004 8.25E–09 0.007 6.05E–09 0.007 3.91E–09 0.005 Methylene chloride 2.04E–07 0.2 2.16E–07 0.1 3.04E–07 0.1 2.32E–07 0.2 2.04E–07 0.2 1.80E–07 0.2 Cumulative cancer risk§ 1.21E–04 2.44E–04 2.19E–04 1.20E–04 8.80E–05 8.11E–05
* Original data source on chemical levels is as follows: Environmental Protection Agency. 2003. West Louisville air monitoring results. Environmental Protection Agency air results database provided via compact disc (CD) by Danny France, Environmental Protection Agency, on September 30, 2003. Environmental Protection Agency, Region 4. Athens, GA.
† This table presents cancer risk estimates for several chemicals of potential interest. ‡ To derive cancer risk estimates, each chemical’s average concentration (see Table 7 for EPA chemical averages) is multiplied by its EPA inhalation unit risk. These estimates are expressed
as a probability; that is, the proportion of a population that may be affected by a carcinogen during a lifetime of exposure (24 hours/day, 365 days/year, for 70 years). For example, an estimated cancer risk of 2 × 10⁻⁶ (which would be designated in the table as 2.00E–06) represents a possible 2 excess cancer cases in a population of 1 million.
' Assuming additive effects, the cumulative cancer risk estimate for each station is the sum of the individual chemical risk estimates.
EPA Environmental Protection Agency
60
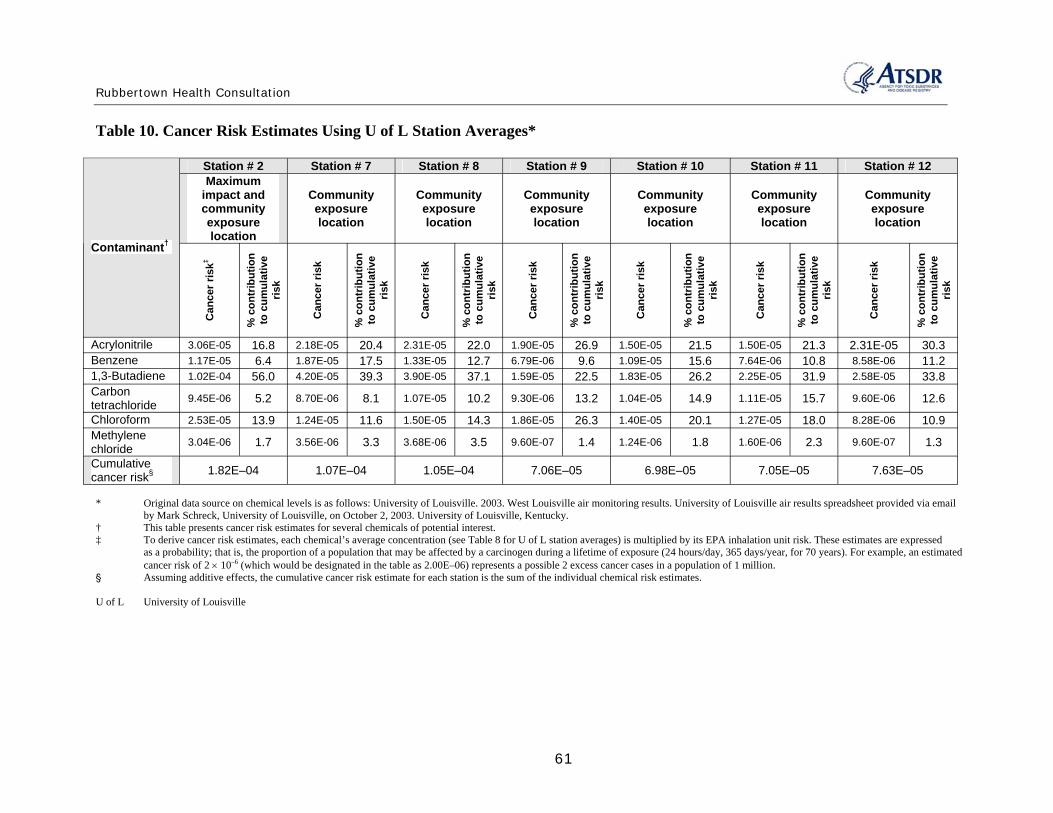
Rubbertown Health Consultation
Table 10. Cancer Risk Estimates Using U of L Station Averages*
Contaminant†
Station # 2 Station # 7 Station # 8 Station # 9 Station # 10 Station # 11 Station # 12 Maximum
impact and community exposure location
Community exposure location
Community exposure location
Community exposure location
Community exposure location
Community exposure location
Community exposure location
Canc
er ris
k‡
% co
ntribu
tion
to cu
mulat
ive
risk
Canc
er ris
k
% co
ntribu
tion
to cu
mulat
ive
risk
Canc
er ris
k
% co
ntribu
tion
to cu
mulat
ive
risk
Canc
er ris
k
% co
ntribu
tion
to cu
mulat
ive
risk
Canc
er ris
k
% co
ntribu
tion
to cu
mulat
ive
risk
Canc
er ris
k
% co
ntribu
tion
to cu
mulat
ive
risk
Canc
er ris
k
% co
ntribu
tion
to cu
mulat
ive
risk
Acrylonitrile 3.06E-05 16.8 2.18E-05 20.4 2.31E-05 22.0 1.90E-05 26.9 1.50E-05 21.5 1.50E-05 21.3 2.31E-05 30.3 Benzene 1.17E-05 6.4 1.87E-05 17.5 1.33E-05 12.7 6.79E-06 9.6 1.09E-05 15.6 7.64E-06 10.8 8.58E-06 11.2 1,3-Butadiene 1.02E-04 56.0 4.20E-05 39.3 3.90E-05 37.1 1.59E-05 22.5 1.83E-05 26.2 2.25E-05 31.9 2.58E-05 33.8 Carbon tetrachloride 9.45E-06 5.2 8.70E-06 8.1 1.07E-05 10.2 9.30E-06 13.2 1.04E-05 14.9 1.11E-05 15.7 9.60E-06 12.6
Chloroform 2.53E-05 13.9 1.24E-05 11.6 1.50E-05 14.3 1.86E-05 26.3 1.40E-05 20.1 1.27E-05 18.0 8.28E-06 10.9 Methylene chloride 3.04E-06 1.7 3.56E-06 3.3 3.68E-06 3.5 9.60E-07 1.4 1.24E-06 1.8 1.60E-06 2.3 9.60E-07 1.3
Cumulative cancer risk§ 1.82E–04 1.07E–04 1.05E–04 7.06E–05 6.98E–05 7.05E–05 7.63E–05
* Original data source on chemical levels is as follows: University of Louisville. 2003. West Louisville air monitoring results. University of Louisville air results spreadsheet provided via email by Mark Schreck, University of Louisville, on October 2, 2003. University of Louisville, Kentucky.
† This table presents cancer risk estimates for several chemicals of potential interest. ‡ To derive cancer risk estimates, each chemical’s average concentration (see Table 8 for U of L station averages) is multiplied by its EPA inhalation unit risk. These estimates are expressed
as a probability; that is, the proportion of a population that may be affected by a carcinogen during a lifetime of exposure (24 hours/day, 365 days/year, for 70 years). For example, an estimated cancer risk of 2 × 10⁻⁶ (which would be designated in the table as 2.00E–06) represents a possible 2 excess cancer cases in a population of 1 million.
' Assuming additive effects, the cumulative cancer risk estimate for each station is the sum of the individual chemical risk estimates.
U of L University of Louisville
61
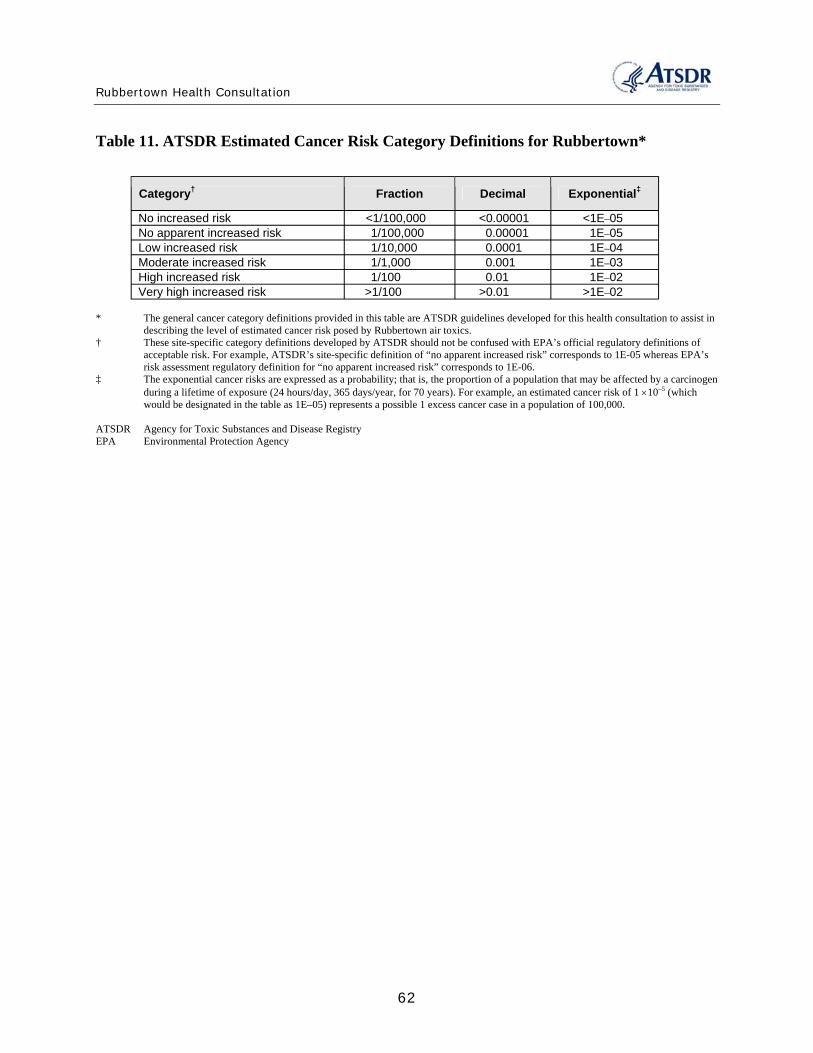
Rubbertown Health Consultation
Table 11. ATSDR Estimated Cancer Risk Category Definitions for Rubbertown*
Category† Fraction Decimal Exponential‡
No increased risk <1/100,000 <0.00001 <1E–05 No apparent increased risk 1/100,000 0.00001 1E–05 Low increased risk 1/10,000 0.0001 1E–04 Moderate increased risk 1/1,000 0.001 1E–03 High increased risk 1/100 0.01 1E–02 Very high increased risk >1/100 >0.01 >1E–02
* The general cancer category definitions provided in this table are ATSDR guidelines developed for this health consultation to assist in describing the level of estimated cancer risk posed by Rubbertown air toxics.
† These site-specific category definitions developed by ATSDR should not be confused with EPA’s official regulatory definitions of acceptable risk. For example, ATSDR’s site-specific definition of “no apparent increased risk” corresponds to 1E-05 whereas EPA’s risk assessment regulatory definition for “no apparent increased risk” corresponds to 1E-06.
‡ The exponential cancer risks are expressed as a probability; that is, the proportion of a population that may be affected by a carcinogen during a lifetime of exposure (24 hours/day, 365 days/year, for 70 years). For example, an estimated cancer risk of 1 ×10⁻⁵ (which would be designated in the table as 1E–05) represents a possible 1 excess cancer case in a population of 100,000.
ATSDR Agency for Toxic Substances and Disease Registry EPA Environmental Protection Agency
62

Rubbertown Health Consultation
Appendix C. Derivation of Comparison Values The Agency for Toxic Substances and Disease Registry (ATSDR) has developed health and environmental guidelines to use when conducting the screening analysis and evaluating exposures to substances found at sites under investigation. The information provided in this appendix was compiled directly from ATSDR’s Public Health Assessment Guidance Manual (ATSDR 2005). The purpose of this appendix is to provide information on those health and environmental guidelines used for screening purposes in the Rubbertown health consultation. For further information on ATSDR’s public health assessment process and comparison values, please refer to the guidance manual available at http://www.atsdr.cdc.gov/HAC/HAGM/.
ATSDR, in cooperation with the U.S. Environmental Protection Agency (EPA), has developed a priority list of hazardous substances found at hazardous waste sites, as directed under the Comprehensive Environmental Response, Compensation, and Liability Act (CERCLA), as amended by the Superfund Amendment and Reauthorization Act of 1986 (SARA). For those substances most commonly found, ATSDR has prepared Toxicological Profiles that include an examination, summary, and interpretation of available toxicologic and epidemiologic data. Based on these data, ATSDR has derived health and environmental guidelines.
ATSDR health guidelines are substance-specific doses or concentrations derived using toxicologic information. Where adequate dose-response data exist, health guidelines are derived for both the ingestion or inhalation routes of exposure. Health guidelines include ATSDR's minimal risk levels (MRLs). No health guidelines have been developed by ATSDR for dermal exposures.
ATSDR environmental guidelines are media-specific substance concentrations derived from health guidelines using default exposure assumptions. ATSDR environmental guidelines include environmental media evaluation guides (EMEGs) and cancer risk evaluation guides (CREGs) that are available for contact with substances in water, soil, and air. No environmental guidelines have been developed by ATSDR for contact with contaminants in food or biota.
In addition to comparison values derived by ATSDR, other federal and some state agencies have developed similar types of health-based guidelines for concentrations of substances in water, soil, air, and food. ATSDR staff may use these comparison values, when appropriate, to screen substances detected in various site media.
This appendix provides a description of comparison values available from ATSDR, as well as other sources, that were used to screen the West Louisville air data. ATSDR comparison values included MRLs, EMEGs, and CREGs. Non-ATSDR comparison values discussed in this appendix include: EPA’s reference doses (RfDs), reference concentrations (RfCs), cancer slope factors (CSFs), inhalation unit risks (IURs), Region III risk-based concentrations (RBCs), and Office of Air Quality Planning and Standards (OAQPS) toxicity values; Occupational Safety and Health Administration’s (OSHA’s) permissible exposure limits (PELs) and short-term exposure limit (STELs); National Institute for Occupational Safety and Health’s (NIOSH’s) recommended exposure limit (RELs); and American Conference of Governmental Industrial Hygienist’s (ACGIH’s) threshold limit values (TLVs).
63

Rubbertown Health Consultation
For each guideline discussed, a definition and description of the derivation and applicability or intended use are provided. When available, a website reference is also provided.
1.0. ATSDR Health and Environmental Guidelines
1.1. MRLs
ATSDR’s minimal risk levels (MRLs) are an estimate of the daily human exposure to a substance that is likely to be without appreciable risk of adverse health effects during a specified duration of exposure. MRLs are based only on noncarcinogenic effects. MRLs are screening values only and are not indicators of health effects. Exposures to substances at doses above MRLs will not necessarily cause adverse health effects and should be further evaluated.
ATSDR has derived MRLs when reliable and sufficient data exist to identify the target organ(s) of effect or the most sensitive health effects(s) for a specific duration for a given route of exposure. MRLs are set below levels that might cause adverse health effects in most people, including sensitive populations. MRLs are derived for acute (1-14 days), intermediate (15-364 days), and chronic (365 days and longer) durations. MRLs are generally based on the most sensitive chemical-induced endpoint considered to be relevant to humans. Serious health endpoints (e.g., irreparable damage to the liver or kidneys, or birth defects) are not used as a basis for establishing MRLs.
MRLs are derived for substances by factoring the most relevant documented no-observed-adverse-effects level (NOAEL) or lowest-observed-adverse-effects level (LOAEL) and an uncertainty factor. Inhalation MRLs are exposure concentrations expressed in units of parts per billion (ppb) for gases and volatiles, or micrograms per cubic meter (µg/m3) for particles. Inhalation MRLs are derived for continuous, 24-hour a day exposures. The specific approach used to derive MRLs for individual substances are detailed in ATSDR's Toxicological Profile for each substance available at http://www.atsdr.cdc.gov/toxpro2.html.
Most MRLs contain a degree of uncertainty because of the lack of precise toxicologic information about the people who might be most sensitive (e.g., children, elderly, those with preexisting illnesses) to the effects of environmental contamination. ATSDR uses a conservative (i.e., protective) approach to address this uncertainty. This is consistent with the public health principle of prevention. Although human data are preferred, MRLs often must be based on animal studies because relevant human studies are lacking. In the absence of evidence to the contrary, ATSDR assumes that humans are more sensitive to the effects of hazardous substances than animals and that certain persons may be particularly sensitive. Uncertainties are accounted for by applying “uncertainty factors” to the NOAEL. For example, an uncertainty factor of between 1 and 10 may be applied for extrapolation from animal doses to human doses and/or to account for sensitive individuals. When more than one uncertainty factor is applied, the uncertainty factors are multiplied. In this example, the combined uncertainty factor would be 100: 10 for the extrapolation to humans and 10 to account for sensitive individuals.
ATSDR derives MRLs on the assumption that exposures are occurring to a single substance and that only noncarcinogenic health effects might occur. At hazardous waste sites, people are
64
Rubbertown Health Consultation
usually exposed to a mixture of substances. MRLs also account only for noncarcinogenic toxic effects of substances.
MRLs are intended to serve only as a screening tool to help ATSDR staff decide whether to more closely evaluate exposures to a substance found at a site. MRLs are not intended to define cleanup or action levels. Exposure doses above the MRL does not necessarily mean that adverse health effects will occur.
1.2. EMEGs
ATSDR’s environmental media evaluation guides (EMEGs) represent concentrations of substances in water, soil, and air to which humans may be exposed during a specified period of time (acute, intermediate, or chronic) without experiencing adverse health effects. EMEGs have been calculated for substances for which ATSDR has developed Toxicological Profiles using information about the substance toxicity (MRLs) and default exposure assumptions. For exposure to substances in the air, EMEGs are expressed as air concentrations and are the same for adults and children.
EMEGs are used when conducting an environmental guideline comparison during a screening analysis to quickly evaluate large quantities of data for a site under investigation. Substances found at concentrations below EMEGs are not expected to pose public health hazards. Substances found at concentrations above EMEGs require further evaluation before drawing a public health conclusion. EMEGs are screening values only, and not indicators of adverse public health effects. Substances found at concentrations above EMEGs will not necessarily cause adverse health effects and should be further evaluated.
ATSDR makes three assumptions when deriving EMEGs: (1) exposures are occurring through contact with a single medium (e.g., water or air) via a single route (e.g., ingestion or inhalation), (2) exposures are involving a single substance, and (3) only noncarcinogenic health effects might occur.
EMEGs are based on toxicity information (MRLs), which consider noncarcinogenic toxic effects of chemicals, including their developmental and reproductive toxicity. MRLs do not consider potential genotoxic or carcinogenic effects of a substance. Because some substances have both noncarcinogenic and carcinogenic effects, ATSDR has derived CREGs to consider potential carcinogenic effects of a substance.
EMEGs for inhalation exposures to airborne contaminants are derived from the chronic inhalation MRLs presented in the ATSDR Toxicological Profiles or ATSDR's HazDat database. The inhalation MRLs are expressed in concentration units of µg/m3 or ppb. Therefore, the air EMEG for a chemical is the same as its MRL, and no mathematical calculation is required. The same air EMEG value is used for all segments of the population. For chemical substances that exist in a vapor form at standard temperature and pressure (STP), the value is given in ppb (volume basis); for substances that are solids at STP, the value is given in µg/m3.
ATSDR MRLs are derived for continuous, 24-hour-a-day exposures. In many instances, inhalation exposures from a site may be less than 24 hours per day. Therefore, the use of air
65
Rubbertown Health Consultation
EMEGs based on MRLs to assess these situations would provide a conservative approach for identifying air contaminants of potential health concern.
For some chemicals, there may be experimental toxicity data for which the chemical was administered orally, but none for which the chemical was administered by inhalation. Significant differences may exist in the toxicity of the chemical for oral exposure compared to inhalation because of differences in the absorption, metabolism, distribution, and site-specific toxicity of the chemical. Therefore, an air EMEG is derived only from a MRL based on an inhalation study.
1.3. CREGs
ATSDR’s cancer risk evaluation guides (CREGs) are media-specific comparison values that are used to identify concentrations of cancer-causing substances that are unlikely to result in an increase of cancer rates in an exposed population. ATSDR develops CREGs using EPA's cancer slope factor (CSF) or inhalation unit risk (IUR), a target risk level (10–6), and default exposure assumptions. The target risk level of 10–6 represents a theoretical risk of one excess cancer case in a population of one million. CREGs are only available for adult exposures—no CREGs specific to childhood exposures are available.
In developing the CREGs, ATSDR assumes that (1) exposures occur through contact to a single medium, (2) exposures occur to a single substance, and (3) only cancer health effects will occur. CREGs serve as a screening tool for evaluating concentrations of carcinogens during an environmental guideline comparison. CREGs are based on theoretical estimates of cancer risk. Therefore, CREGs should serve only as a screening tool and not as an indication that cancer is expected or predicted.
To derive the air CREGs, ATSDR uses IURs developed by EPA. Because toxicity studies of inhalation Derivation of a CREG for Inhalation exposures express doses as concentrations, the IURs are CREG = TR / IUR estimates of the theoretical risk of cancer associated with a carcinogen expressed in concentration units. As where,
such, no exposure parameters for intake rate or body CREG = cancer risk inhalation guide (µg/m3)weight are needed to derive CREGs for inhalation TR = target risk level (10-6)
-1]exposure. However, ATSDR assumes that exposure is IUR = inhalation unit risk [(µg/m3)
continuous—occurring for 24 hours a day.
2.0. Non-ATSDR Health and Environmental Guidelines
2.1. RfDs and RfCs
EPA developed chronic reference doses (RfDs) for ingestion and reference concentrations (RfCs) for inhalation. These are estimates of daily exposures to a substance that are likely to be without a discernable risk of deleterious effects to the general human population (including sensitive subgroups) during a lifetime of exposure. The Integrated Risk Information System (IRIS), prepared and maintained by the EPA, is an electronic database containing information on human health effects that may result from exposure to various chemicals in the environment.
66

Rubbertown Health Consultation
IRIS contains information on RfDs and RfCs, as well as other reference guidelines, and is available at http://www.epa.gov/iris/intro.htm.
RfDs and RfCs are doses derived from the NOAEL or LOAEL by application of uncertainty factors and an additional modifying factor that is based on a professional judgment of the entire database of the chemical. EPA includes uncertainties sometimes spanning orders of magnitude to ensure that the potential for health effects is not underestimated.
RfDs and RfCs are based on the assumption that thresholds exist for certain toxic effects such as cell death or organ damage. RfDs and RfCs are derived for the noncarcinogenic health effects of compounds that are also carcinogens. RfDs and RfCs are also derived assuming exposure to a single substance in a single media. Doses less than the RfD or RfC are not expected to be associated with health risks. However, doses less than the RfD or RfC are not necessarily "acceptable," and doses in excess of the RfD or RfC are not necessarily "unacceptable."
2.2. CSFs and IURs
EPA evaluates the potential carcinogenicity of a substance using a two-step process: a qualitative weight-of-evidence approach and a quantitative assessment to define the relationship between dose and the likelihood of a theoretical increase in cancer cases in a population.
As a result of a qualitative evaluation of information relevant to carcinogenicity and the quality of the information, EPA assigns cancer classifications to suspected carcinogenic substances. For known or possible carcinogens, cancer slope factors (CSFs) and inhalation unit risks (IURs) are used as a quantitative indication of the carcinogenicity of a substance. A CSF is an estimate of possible increases in cancer cases in a population. A CSF is expressed in dose units [(mg/kg/day)–1] to allow for comparison with calculated oral doses. An IUR is an estimate of
–1]theoretical increases in cancer cases in a population expressed in concentration units [(µg/m3)to allow for comparison with site-specific air concentrations. Because there can be differences in the carcinogenicity of a substance depending on the route of exposure, a CSF for ingestion exposures or IUR for inhalation exposures are not applied to a different route of exposure unless there is adequate justification for this assumption.
CSFs and IURs are usually derived from animal experiments that involve exposures to a single substance by a single route of exposure (i.e., ingestion or inhalation). EPA extrapolates CSFs and IURs from experimental data of increased tumor incidences at high doses to estimate theoretical cancer rate increases at low doses. The experimental data often represent exposures to chemicals at concentrations orders of magnitude higher than concentrations found in the environment.
Historically, EPA has used mathematical models, which apply a number of uncertainties and conservative assumptions, to manipulate the experimental data and extrapolate possible health outcomes from high doses to low doses. These mathematical models assume that there are no thresholds for cancer effects (or low dose linearity)—a single molecule of a carcinogen is assumed to be able to cause cancer.
As scientists learn more about how carcinogens produce tumorogenic responses in animals and humans (i.e., the mechanism of action), they are finding that some carcinogens exhibit thresholds. In light of the evolving science, EPA's more recent guidelines call for more emphasis
67

Rubbertown Health Consultation
on analyzing the dose-response data before invoking low-dose linear defaults as described above. The new guidelines call for closer examination of substance-specific modes and mechanisms of action. This procedure "weighs" the available evidence, invoking a two-step dose-response process: (1) modeling the observed data to the "point of departure" and (2) extrapolating to lower doses. When data are sufficient, nonlinear extrapolation may be considered. In the absence of adequate data showing nonlinear dose-response, the guidelines call for defaulting to linear assumptions.
EPA develops CSFs and IURs as a result of a quantitative evaluation of a suspected carcinogenic substance. CSFs and IURs are combined with information about exposure doses to estimate a theoretical increase in cancer cases in a population. Under the quantitative risk assessment method, site-specific cancer doses and concentrations are multiplied by EPA's CSFs or IURs, respectively. This exercise estimates a theoretical excess cancer risk expressed as the proportion of a population that may be affected by a carcinogen during a lifetime of exposure. For example, an estimated cancer risk of 2 x 10⁻⁶ represents a possible 2 excess cancer cases in a population of 1 million. Because of the uncertainties and conservatism inherent in deriving the CSFs and IURs, this is only an estimate of risk.
Although ATSDR recognizes the utility of numerical risk estimates in risk analysis, the agency considers such estimates in the context of the variables and assumptions involved in their derivation and in the broader context of biomedical opinion, host factors, and actual exposure conditions. The actual parameters of environmental exposures must be given carefully considered in evaluating the assumptions and variables relating to both toxicity and exposure (ATSDR 1993).
2.3. Region III RBCs
EPA’s Region III Risk Based Concentrations (RBCs) are guidelines used to assess the potential for harm from chemicals found at a hazardous waste site. They are developed by combining a substance's toxicologic properties with “standard” scenarios for encountering the substance. EPA's measures of a substance's toxicologic properties are the RfD and CSF. The RfD is the dose of a chemical not expected to result in noncarcinogenic health effects, and the CSF is the cancer risk per unit dose. The exposure parameters are generic and are intended to be overly conservative and protective of most populations. EPA uses these standard exposures to determine the exposure dose equivalent of the RfD or target cancer risk level. EPA Region III has compiled RBCs for 400 to 500 substances in soil, air, water, and fish. RBCs are presented by EPA Region III in the RBC Table, which is generally updated every 6 months and is available at http://www.epa.gov/reg3hwmd/risk/human/index.htm.
EPA Region III developed the RBC Table as a tool to aid risk assessors in screening substances at hazardous waste sites. RBCs are also used for responding to citizen inquiries and spot-checking baseline risk assessments.
RBCs have some important limitations. Each RBC is estimated assuming a person is exposed to a single substance in a single media. They do not consider the transfer of substances from soil to air or dermal contact with a substance. Toxicity information in the RBC Table was calculated by hand, and though the Table has been checked several times, it may contain errors. Therefore, EPA Region III emphasizes that RBCs are not intended to be used as regulatory cleanup goals.
68
Rubbertown Health Consultation
RBCs do not consider site-specific exposure scenarios because they are derived from generic exposure parameters. However, ATSDR uses them as an initial screening tool for substances found in site media.
2.4. OAQPS Toxicity Values
EPA’s Office of Air Quality Planning and Standards (OAQPS) tabulated dose-response assessments for evaluating hazardous air pollutants. Two separate tables present OAQPS toxicity values for long-term (chronic) inhalation and oral exposures and values for short-term (acute) inhalation exposures, and both tables are available at http://www.epa.gov/ttn/atw/toxsource/summary.html.
The tables compile assessments from various sources for many of the 188 substances listed as hazardous air pollutants (“air toxics”) under the Clean Air Act Amendments of 1990. Sources of chronic dose-response assessments were arranged in priority order according to conceptual consistency with EPA risk assessment guidelines and level of peer review. For example, draft RfCs, RfDs, and IURs under development for the EPA IRIS process were given first priority on a case-by-case basis, where such assessments have already undergone external peer review and subsequent revision. Where externally peer reviewed IRIS draft assessments were not selected to supersede existing EPA IRIS values, the OAQPS chronic inhalation toxicity table shows current IRIS information. For substances lacking current IRIS assessments, ATSDR chronic MRLs received next preference, followed by other agency’s values described at http://www.epa.gov/ttn/atw/toxsource/chronicpriority.html.
The numbers in the tables support hazard identification and dose-response assessment, as defined in the National Academy of Sciences (NAS) risk assessment paradigm, for estimating the risk of contracting cancer and the level of hazard associated with adverse health effects other than cancer. Each assessment in the tables is best visualized as an estimate within a range of possible values, surrounded uncertainty and variability. This range of possible values may change as better data become available.
Because the OAQPS toxicity tables include comparison values previously presented in this appendix, the table values have the same limitations (see RfCs, RfDs, IURs, and MRLs). The OAQPS toxicity values are generally appropriate for screening-level risk assessments, including assessments to select contaminants, exposure routes, or emission sources of potential concern, or to help set priorities for further research. For more complex, refined risk assessments developed to support regulatory decisions for single sources or substances, one is recommended to evaluate dose-response in detail for each "risk driver" to incorporate appropriate new toxicological data.
2.5. PELs and STELs
OSHA’s permissible exposure limits (PELs) were developed to provide safe and healthful working conditions, as mandated by Occupational Safety and Health Act of 1970. PELs are maximum exposure limits for certain airborne contaminants in the workplace, based on health criteria and technical feasibility. They are designed to ensure, to the extent feasible, that no employee suffers impairment of health or functional capacity even if regularly exposed to a substance throughout his/her working life. Further information on PELs is available at http://www.osha-slc.gov/SLTC/pel/index.html.
69
Rubbertown Health Consultation
PELs are usually listed as 8-hour time-weighted averages (TWA). The level may be exceeded at points in time, but the sum of the exposure levels averaged over 8 hours must not exceed the limit. In some cases, ceiling and peak levels are listed in place of, or in addition to, the 8-hour TWA. Ceiling values cannot be exceeded at any time. During a designated time period, substance concentrations may reach, but never exceed, a peak level.
OSHA’s short-term exposure limit (STEL) is a 15-minute TWA which should not be exceeded at any time during a workday even if the 8-hour TWA is within the PEL. Exposures at the STEL should not exceed 15 minutes and should not be repeated more than four times per day. There should be at least a 60-minute interval between successive exposures at the STEL. A STEL is recommended only in cases in which toxic effects have been reported from high short-term exposures in either animals or humans. It is not a separate, independent exposure limit, but rather a supplement to the PEL.
PELs and STELs are enforceable regulatory standards for contaminants in the workplace and are revised as new information becomes available. If an employee is exposed to an OSHA-regulated substance at a level exceeding the PEL or STEL, the employer must comply with the substance-specific health standards listed in 29 CFR part 1910 to reduce the exposure.
It is important to understand that PELs and STELs apply to healthy adult employees working 40hour weeks and not to the general population—including children, the elderly, and the sick— who may be subject to continuous environmental exposure. As such, ATSDR only uses these values to put site-specific concentrations of contaminants into perspective for the reader, especially when no other non-occupational comparison values are available.
2.6. RELs
Under the authority of OSHA of 1970, NIOSH develops and periodically revises recommended exposure limits (RELs), which are exposure limits for potentially hazardous substances or conditions in the workplace. RELs, as well as PELs, can be found in the NIOSH Pocket Guide to Chemical Hazards, which is available at http://www.cdc.gov/niosh/npg/npg.html.
RELs are available for airborne contaminants in the workplace. The RELs are developed as 8- or 10-hour TWAs or ceiling levels, as discussed under the definition and use of PELs. RELs are published and transmitted to OSHA and the Mine Safety and Health Administration for use in promulgating legal standards.
Similar to PELs and STELs, RELs apply to healthy adult employees working 40-hour weeks and not to the general population, who may be subject to continuous environmental exposure. As with PELs and STELs, ATSDR only uses RELs to put site-specific concentrations of contaminants into perspective for the reader, especially when no other non-occupational comparison values are available.
2.7. TLVs
ACGIH is an organization concerned with industrial health and occupational health and safety (further information about ACGIH is available at http://www.acgih.org/home.htm). ACGIH has developed threshold limit values (TLVs), which are airborne concentrations of substances that are not believed to cause harmful effects in workers exposed regularly. ACGIH develops and
70
Rubbertown Health Consultation
updates TLVs based on toxicity information from industrial exposures, animal studies, and human studies, if available. ACGIH stresses that TLVs for individual substances may be based on different toxicologic studies and endpoints.
TLVs are developed as a TWA for exposures 8 hours a day during a 40 hour work week and as TWA for short-term (15 minute) exposures, and as ceiling levels that should never be exceeded. TLVs are intended only as guidelines for protecting worker safety and do not represent an enforceable standard or finite level of toxicity.
Similar to the OSHA and NIOSH values, TLVs apply to healthy adult employees working 40hour weeks and not to the general population, who may be subject to continuous environmental exposure. ATSDR only uses TLVs to put site-specific concentrations of contaminants into perspective for the reader, especially when no other non-occupational comparison values are available
References:
[ATSDR] Agency for Toxic Substances and Disease Registry. 1993. Cancer policy framework. Atlanta: US Department of Health and Human Services.
[ATSDR] Agency for Toxic Substances and Disease Registry. 2005. Public health assessment guidance manual (update). Atlanta: US Department of Health and Human Services.
71
Rubbertown Health Consultation
Appendix D. Comparison of Public Health Assessments and Risk Assessments
72
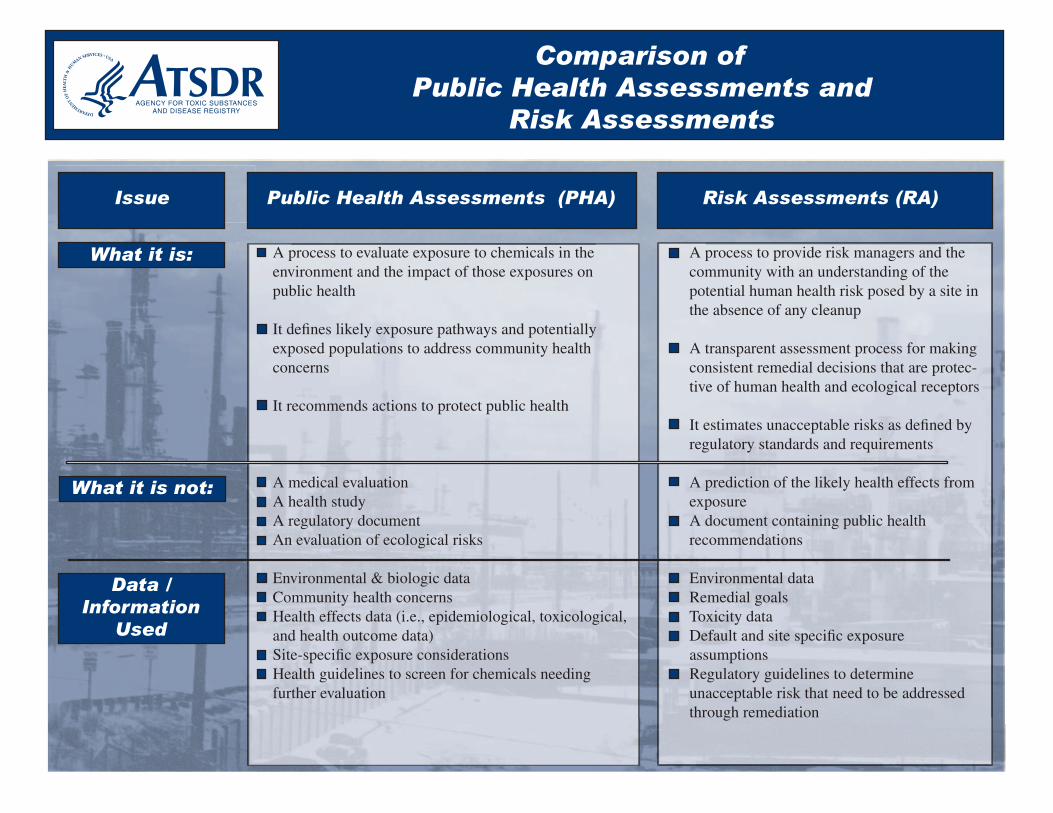
Public Health Assessments and Risk Assessments
Issue Public Health Assessments (PHA) Risk Assessments (RA)
public health
concerns
It recommends actions to protect public health
A health study
Community health concerns
and health outcome data)
Health guidelines to screen for chemicals needing
community with an understanding of the potential human health risk posed by a site in
A transparent assessment process for making consistent remedial decisions that are protec-
A document containing public health recommendations
Remedial goals
assumptions
unacceptable risk that need to be addressed through remediation
/
Used
Comparison of
A process to evaluate exposure to chemicals in the environment and the impact of those exposures on
It defines likely exposure pathways and potentially exposed populations to address community health
A medical evaluation
A regulatory document An evaluation of ecological risks
Environmental & biologic data
Health effects data (i.e., epidemiological, toxicological,
Site-specific exposure considerations
further evaluation
A process to provide risk managers and the
the absence of any cleanup
tive of human health and ecological receptors
It estimates unacceptable risks as defined by regulatory standards and requirements
A prediction of the likely health effects from exposure
Environmental data
Toxicity data Default and site specific exposure
Regulatory guidelines to determine
What it is:
What it is not:
Data Information
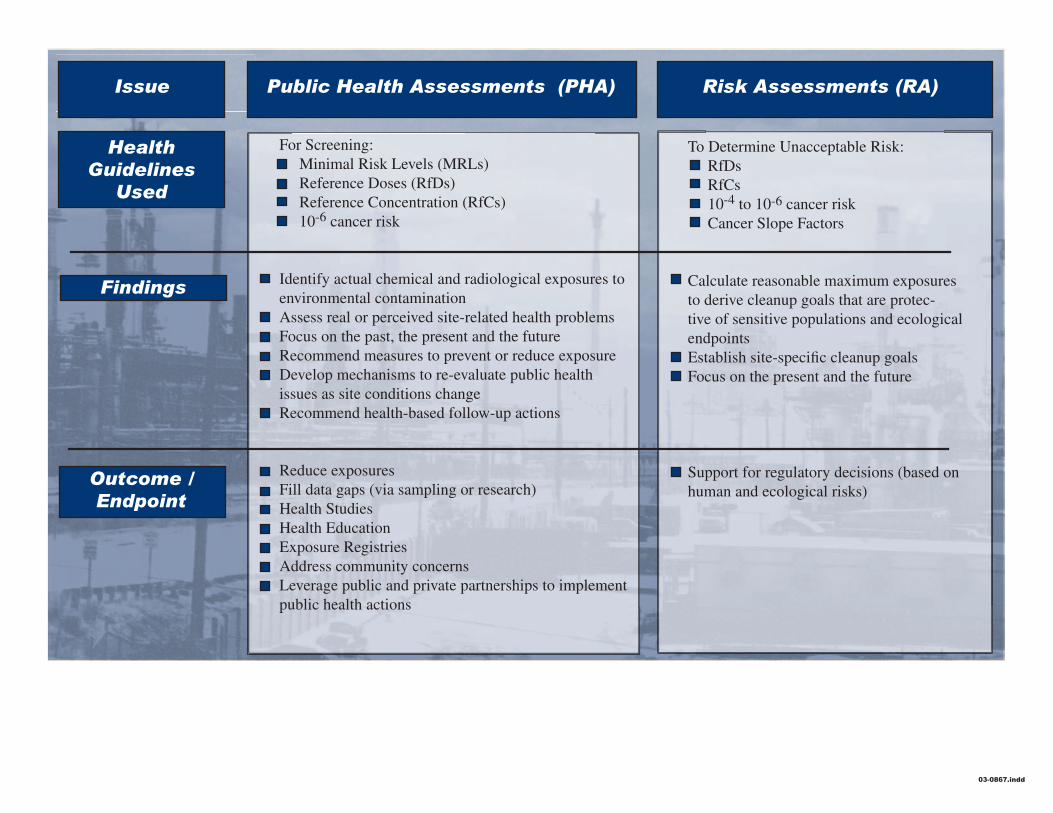
Issue Public Health Assessments (PHA) Risk Assessments (RA)
Health Guidelines
Used
Findings
Outcome / Endpoint
Reference Doses (RfDs) Reference Concentration (RfCs) 10-6 cancer risk
issues as site conditions change
Health Studies Health Education
Address community concerns
public health actions
RfDs RfCs 10-4 to 10-6 cancer risk
endpoints
human and ecological risks)
For Screening: Minimal Risk Levels (MRLs)
Identify actual chemical and radiological exposures to environmental contamination Assess real or perceived site-related health problems Focus on the past, the present and the future Recommend measures to prevent or reduce exposure Develop mechanisms to re-evaluate public health
Recommend health-based follow-up actions
Reduce exposures Fill data gaps (via sampling or research)
Exposure Registries
Leverage public and private partnerships to implement
To Determine Unacceptable Risk:
Cancer Slope Factors
Calculate reasonable maximum exposures to derive cleanup goals that are protec-tive of sensitive populations and ecological
Establish site-specific cleanup goals Focus on the present and the future
Support for regulatory decisions (based on
03-0867.indd