Rufian, J. S., Sanchez-Romero, M.-A., Lopez …eprints.uwe.ac.uk/29510/1/Full final version.pdf ·...
46
Rufian, J. S., Sanchez-Romero, M.-A., Lopez-Marquez, D., Macho, A. P., Mansfield, J. W., Arnold, D. L., Ruiz-Albert, J., Casadesus, J. and Beuzon, C. R. (2016) Pseudomonas syringae differentiates into phenotypically distinct subpopulations during colonization of a plant host. Environmental Microbiology, 18 (10). pp. 3593-3605. ISSN 1462-2912 Available from: http://eprints.uwe.ac.uk/29510 We recommend you cite the published version. The publisher’s URL is: http://dx.doi.org/10.1111/1462-2920.13497 Refereed: Yes This is the peer reviewed version of the following article: Rufian, J. S., Sanchez?Romero, M.?A., Lopez?Marquez, D., Macho, A. P., Mansfield, J. W., Arnold, D. L., Ruiz?Albert, J., Casadesus, J. and Beuzon, C. R. (2016) Pseudomonas syringae differentiates into phenotypically distinct subpopulations during colonization of a plant host. Environmental Microbiology, which has been published in final form at http://dx.doi.org/10.1111/1462?2920.13497. This article may be used for non?commercial purposes in accordance with Wiley Terms and Conditions for Self?Archiving. Disclaimer UWE has obtained warranties from all depositors as to their title in the material deposited and as to their right to deposit such material. UWE makes no representation or warranties of commercial utility, title, or fit- ness for a particular purpose or any other warranty, express or implied in respect of any material deposited. UWE makes no representation that the use of the materials will not infringe any patent, copyright, trademark or other property or proprietary rights. UWE accepts no liability for any infringement of intellectual property rights in any material deposited but will remove such material from public view pend- ing investigation in the event of an allegation of any such infringement. PLEASE SCROLL DOWN FOR TEXT.
Transcript of Rufian, J. S., Sanchez-Romero, M.-A., Lopez …eprints.uwe.ac.uk/29510/1/Full final version.pdf ·...

Rufian, J. S., Sanchez-Romero, M.-A., Lopez-Marquez, D., Macho,A. P., Mansfield, J. W., Arnold, D. L., Ruiz-Albert, J., Casadesus, J.and Beuzon, C. R. (2016) Pseudomonas syringae differentiates intophenotypically distinct subpopulations during colonization of a planthost. Environmental Microbiology, 18 (10). pp. 3593-3605. ISSN1462-2912 Available from: http://eprints.uwe.ac.uk/29510
We recommend you cite the published version.The publisher’s URL is:http://dx.doi.org/10.1111/1462-2920.13497
Refereed: Yes
This is the peer reviewed version of the following article: Rufian, J. S., Sanchez?Romero,M.?A., Lopez?Marquez, D., Macho, A. P., Mansfield, J. W., Arnold, D. L.,Ruiz?Albert, J., Casadesus, J. and Beuzon, C. R. (2016) Pseudomonas syringaedifferentiates into phenotypically distinct subpopulations during colonization ofa plant host. Environmental Microbiology, which has been published in finalform at http://dx.doi.org/10.1111/1462?2920.13497. This article may be usedfor non?commercial purposes in accordance with Wiley Terms and Conditionsfor Self?Archiving.
Disclaimer
UWE has obtained warranties from all depositors as to their title in the materialdeposited and as to their right to deposit such material.
UWE makes no representation or warranties of commercial utility, title, or fit-ness for a particular purpose or any other warranty, express or implied in respectof any material deposited.
UWE makes no representation that the use of the materials will not infringeany patent, copyright, trademark or other property or proprietary rights.
UWE accepts no liability for any infringement of intellectual property rightsin any material deposited but will remove such material from public view pend-ing investigation in the event of an allegation of any such infringement.
PLEASE SCROLL DOWN FOR TEXT.

2

Pseudomonas syringae differentiates into phenotypically distinct 1
subpopulations during colonization of a plant host 2
3
José S. Rufián1, María-Antonia Sánchez-Romero2, Diego López-Márquez1, 4
Alberto P. Macho3, John W. Mansfield4, Dawn L. Arnold5, Javier Ruiz-Albert1, 5
Josep Casadesús2, Carmen R. Beuzón1* 6
1Instituto de Hortofruticultura Subtropical y Mediterránea, Universidad de 7
Málaga-Consejo Superior de Investigaciones Científicas (IHSM-UMA-CSIC), 8
Depto. Biología Celular, Genética y Fisiología, Campus de Teatinos, Málaga 9
E-29071, Spain 10
2Departamento de Genética, Facultad de Ciencias, Universidad de Sevilla, 11
Apartado 1095, 4108 Seville, Spain 12
3Current address: Shanghai Center for Plant Stress Biology, Shanghai Institutes 13
of Biological Sciences, Chinese Academy of Sciences, Shanghai 201602, China 14
4Faculty of Natural Sciences, Imperial College, London, SW7 2AZ, United 15
Kingdom 16
5Centre for Research in Bioscience, Faculty of Health and Applied Sciences, 17
University of the West of England, Frenchay Campus, Bristol, BS16 1QY, 18
United Kingdom 19
20
Running head: Formation of bacterial subpopulations in a plant host 21
22
*For correspondence: [email protected] 23
Phone: ++ 34-952-131959 24
Fax: ++ 34-952-132001 25

Keywords: phenotypic heterogeneity, bacterial pathogen, bistability, plant host, 26
type III secretion system, bacterial effectors, virulence, host adaptation 27
28

ABSTRACT 29
Bacterial microcolonies with heterogeneous sizes are formed during 30
colonization of Phaseolus vulgaris by Pseudomonas syringae. Heterogeneous 31
expression of structural and regulatory components of the P. syringae type 3 32
secretion system (T3SS), essential for colonization of the host apoplast and 33
disease development, is likewise detected within the plant apoplast. T3SS 34
expression is bistable in the homogeneous environment of nutrient-limited 35
T3SS-inducing medium, suggesting that subpopulation formation is not a 36
response to different environmental cues. T3SS bistability is reversible, 37
indicating a non-genetic origin, and the T3SSHIGH and T3SSLOW subpopulations 38
show differences in virulence. T3SS bistability requires the transcriptional 39
activator HrpL, the double negative regulatory loop established by HrpV and 40
HrpG, and may be enhanced through a positive feedback loop involving HrpA, 41
the main component of the T3SS pilus. To our knowledge, this is the first 42
example of phenotypic heterogeneity in the expression of virulence 43
determinants during colonization of a non-mammalian host. 44
45

SIGNIFICANCE 46
The plant pathogen Pseudomonas syringae requires a type III secretion system 47
(T3SS) to inject effector proteins into host cells and to cause disease. This 48
study shows that expression of T3SS genes is activated in a heterogeneous 49
fashion during colonization of plant tissues. Cell-to-cell differences in T3SS 50
gene expression are likewise observed in the homogeneous environment of 51
nutrient-limited culture medium, where an isogenic bacterial population 52
bifurcates into lineages that express or not the T3SS. Differences in T3SS 53
expression are non-heritable, are established through the action of a double-54
negative regulatory feedback loop, and determine differences in plant disease 55
severity. Phenotypic heterogeneity is therefore a factor that must be considered 56
when portraying bacterial adaptation to plant niches. 57
58
INTRODUCTION 59
Bacterial infections involve spatial and temporal changes in gene expression 60
that accompany the migration of pathogens from the site of invasion to target 61
tissues. Pathogen progression inside the host is therefore accompanied by 62
physiological adjustments to respond to different stimuli and 63
microenvironments. However, phenotypic changes are not always deterministic, 64
directly correlated with stimuli. Stochastic events such as an uneven distribution 65
of regulators during cell division can produce cell-to-cell differences within a 66
homogeneous microenvironment. This can lead to probabilistic determination of 67
certain phenotypic traits, generally known as phenotypic heterogeneity or 68
phenotypic variation (Davidson and Surette, 2008). 69
Phenotypic heterogeneity has been known to take place in microbial clonal 70
populations for decades (Bigger, 1944; Novick and Weiner, 1957). In certain 71
cases, phenotypic heterogeneity merely reflects the occurrence of cell-to-cell 72
differences generated by molecular noise. In other cases, however, phenotypic 73
heterogeneity reflects the occurrence of bistability, the bifurcation of a unimodal 74
physiological state into two distinct states, generating two bacterial 75
subpopulations or lineages. 76
Bistability is usually the consequence of bimodal gene expression, which can be 77
generated by a positive feedback loop as described in the E. coli lac operon 78
(Novick and Weiner, 1957) or by a double negative feedback loop as in the 79
lysis/lysogeny decision of bacteriophage lambda (Novick and Weiner, 1957; 80
Herskowitz and Hagen, 1980). The literature on bacterial bistable switches has 81
been enriched with interesting examples in the last decade (Dubnau and Losick, 82
2006; Davidson and Surette, 2008; van der Woude, 2011; Sánchez-Romero 83

and Casadesús, 2014; van Vliet and Ackermann, 2015; Uphoff et al., 2016). In 84
certain cases, the biological significance of bistability remains a mystery. In 85
other examples, however, subpopulation formation may be viewed either as a 86
division of labour within the population or as a bet-hedging strategy that may 87
facilitate adaptation to environmental challenges (Veening et al., 2008). 88
The importance of analysing phenotypic heterogeneity has been highlighted in 89
the context of antibiotic exposure for animal and human and in the colonization 90
of animals (Helaine and Holden, 2013; Arnoldini et al., 2014; Campbell-Valois et 91
al., 2014; Claudi et al., 2014; Sánchez-Romero and Casadesús, 2014; Manina 92
et al., 2015; Bram Van den Bergh, 2016; Brian P. Conlon, 2016; Victor I. Band, 93
2016). In Salmonella enterica pathogens, for instance, phenotypic heterogeneity 94
has been observed at several stages of host colonization including invasion of 95
the intestinal epithelium, survival in macrophages, and colonization of the gall 96
bladder (Stecher et al., 2004; Saini et al., 2010; Bäumler et al., 2011; Stewart 97
and Cookson, 2012). Other examples that highlight the relevance of phenotypic 98
heterogeneity in bacterial infections are bistable expression of the cholera toxin 99
in Vibrio cholerae (Nielsen et al., 2010), and of the NO-detoxification system in 100
Yersinia pseudotuberculosis (Davis et al., 2015). 101
Despite increasing evidence supporting the notion that bacterial pathogens 102
exploit non-genetic variation to adapt to mammalian hosts, little is known about 103
the occurrence or potential impact of these processes in the adaptation of 104
bacteria to non-animal hosts. In this work, we have addressed this issue in the 105
archetypal plant pathogen Pseudomonas syringae (Mansfield et al., 2012). P. 106
syringae is an academically relevant model pathogen of increasing economical, 107

impact in agriculture, with recent resurgence of old diseases and emergence of 108
new ones (Shenge, 2007; Green et al., 2010). 109
P. syringae enters the plant from the leaf surface through natural openings or 110
wounds reaching the intercellular spaces of the leaf parenchyma, the apoplast, 111
where it replicates. In the apoplast, P. syringae uses a type III secretion system 112
(T3SS) to deliver effector proteins into the plant cell cytosol (Alfano and 113
Collmer, 1997; Rohmer et al., 2004). Many of these effectors act to suppress 114
plant defences to allow bacterial colonization (Macho and Zipfel, 2015). 115
In this study, we show that phenotypic heterogeneity occurs during plant 116
colonization by P. syringae. Structural and regulatory components of the P. 117
syringae T3SS display heterogeneous expression within the plant apoplast, and 118
bistable T3SS expression is detected in the homogeneous environment of 119
nutrient-limited T3SS-inducing medium. T3SS bistability is reversible, 120
supporting a non-genetic origin, and generates bacterial subpopulations with 121
differences in virulence. To our knowledge, this is the first example of bacterial 122
phenotypic heterogeneity in a non-mammalian host. 123
124

RESULTS 125
Expression of the T3SS is heterogeneous within the plant apoplast 126
Following the dynamics of fluorescently labelled P. syringae pv. phaseolicola 127
populations during colonization of Phaseolus vulgaris, we observed that the size 128
of bacterial microcolonies within the apoplast was heterogeneous (Fig. 1A and 129
B). Since the apoplast is a complex and multifarious environment, heterogeneity 130
might reflect adaptation of P. syringae to distinct microenvironments. An 131
alternative possibility, however, is that heterogeneous colony size might result 132
from random differences in the expression of virulence factors, as described in 133
certain animal pathogens (Nielsen et al., 2010; Davis et al., 2015). 134
To evaluate if apoplast-growing bacteria could display heterogeneous gene 135
expression, we applied single-cell methods to analyse transcriptional fusions to 136
gfp of several P. syringae genes. Given the relevance of the T3SS in plant 137
colonisation by P. syringae, we focused our study on T3SS genes. The choice 138
was further supported by a report on the necrotrophic plant pathogen Dickeya 139
dadantii showing that a plasmid-cloned type III promoter displayed phenotypic 140
heterogeneity under laboratory conditions (Zeng et al., 2012). We generated 141
transcriptional fusions to gfp downstream of chromosome-located native copies 142
of three genes encoding T3SS elements: hrpL, encoding an alternative sigma 143
factor of the extracytoplasmic factor (ECF) family (Fouts et al., 2002), hrcU, the 144
promoter-distal gene of the HrpL-controlled hrcQRSTU operon, encoding a 145
structural component of the T3SS (Charkowski et al., 1997), and hopAB1, 146
encoding a type III secreted effector involved in suppressing plant defences 147
(Jackson et al., 1999). All three strains displayed wild type virulence (Fig. S1). 148
Bacterial distribution within a microcolony developing in the confines of the 149

intercellular spaces of the leaf apoplast is heterogeneous (Fig. S2 and Video S1 150
and S2) and can thus lead to apparent differences in fluorescence intensity as 151
judged by microscopic examination. Therefore, to unequivocally associate 152
potential differences in fluorescence to individual bacteria, we applied single-cell 153
analyses to apoplast-extracted bacteria. Microscopic analysis on apoplast-154
extracted bacteria carrying the T3SS gene fusions to gfp revealed strong cell-to-155
cell differences in fluorescence, supporting that expression of the T3SS genes 156
is phenotypically heterogeneous within the plant (Fig. 1C and 1D). Bacteria not 157
expressing the genes were found for all three fusions both by microscopic 158
examination (Fig. 1C), and by flow cytometry analyses (Fig. 1D), indicating that 159
a subpopulation of bacteria that do not express the T3SS genes does appear 160
during colonization of the host plant tissue. 161
162
P. syringae bifurcates into two subpopulations due to bistable expression 163
of T3SS genes 164
To ascertain whether the phenotypic heterogeneity observed for expression of 165
the T3SS genes was a response to environmental cues or could have 166
stochastic origin, we examined gene expression in the homogeneous 167
environment of nutrient-limited Hrp-inducing medium (HIM) (Huynh et al., 1989) 168
(Fig. 2). Growth in HIM triggers a signalling cascade that activates expression of 169
HrpL, which in turn activates expression of all T3SS genes (Fig. 2A and B). A 170
remarkable observation, however, was that all three expression patterns were 171
heterogeneous in HIM, in contrast with those obtained in non-inducing medium 172
(i.e. LB medium, Fig. S3). Heterogeneity was higher during exponential growth 173
(24h) than in stationary phase (48h) (Fig. 2B). In all cultures, a fraction of 174

bacterial cells carrying gfp fusions displayed fluorescence levels overlapping 175
with those of non-GFP control bacteria (Fig. 2B, centre and right panels). This 176
was particularly clear in exponentially growing bacteria (24h), where expression 177
of all three gfp fusions reached a bistable state (Fig. 2B, centre panels). 178
Because the differences in T3SS expression between the two subpopulations 179
were not all-or-none, we use the terms TSS3HIGH and T3SSLOW instead of 180
T3SSON and T3SSOFF. Bistability was no longer detected in stationary phase 181
cultures (48h), supporting a reversible and non-genetic origin for the differences 182
observed between subpopulations (Fig. 2B, right panels). 183
184
Bistability of the T3SS genes requires HrpL and is established through the 185
HrpV/HrpG double-negative regulatory loop 186
Because HrpL activates expression of hrcU and hopAB1 (Xiao and Hutcheson, 187
1994) (Fig. 2A), we considered the possibility that the bistable state might be 188
passed down from HrpL to genes under its control. To test this hypothesis, we 189
introduced into the strains carrying hrpL::gfp or hopAB1::gfp fusions, a plasmid 190
carrying a copy of hrpL under the control of the lacZ promoter, which enables 191
moderate, constitutive expression in P. syringae (Ortiz-Martín et al., 2010b), to 192
evaluate its impact on gfp expression by flow cytometry (Fig. 3A). The bimodal 193
distribution of hrpL::gfp expression (Fig. 3A in black) becomes unimodal in the 194
presence of constitutively expressed HrpL (coloured). In the case of 195
hopAB1::gfp, bistability is reduced, although not entirely abolished in the 196
presence of plasmid-encoded HrpL, but the population displays a shift towards 197
the T3SSHIGH state. These observations suggest that HrpL may play a central 198
role in the establishment of bistability in the system. 199
Bistability is often triggered by transforming a quantitative cell-to-cell difference 200
into a qualitative difference through the action of one or more feedback loops 201
(Veening et al., 2008). Two such feedback loops regulate the expression of the 202
T3SS genes in P. syringae: (i) a positive feedback loop controlled by HrpA, the 203
main subunit of the T3SS pilus (Roine et al., 1997; Wei et al., 2000); (ii) a 204
double negative feedback loop regulated by HrpV and HrpG (Wei et al., 2005) 205
(Fig. 2A). We analysed the roles of these regulators in the establishment of 206
T3SS bistability using mutants defective in these genes and/or plasmids 207
carrying the individual genes under study. Although bistability in hopAB1::gfp 208
expression was reduced in a ΔhrpA mutant, bimodal expression of the hrpL::gfp 209
fusion was still observed in the absence of HrpA, thus making HrpA an unlikely 210
candidate to be the molecular switch required to trigger the bistable state (Fig. 211
3B). 212
Bistability of hopAB1::gfp was abolished in a ΔhrpG mutant (Fig. 3C). In turn, 213
absence of HrpV increased the proportion of cells expressing higher levels of 214
hopAB1::gfp (Fig. 3C). This happened regardless of the presence of HrpG, as 215
indicated by the fact that a ΔhrpV mutation was epistatic over a ΔhrpG 216
mutation. Constitutive expression of either regulator from a plasmid led to 217
reciprocal results on hopAB1::gfp expression: a stronger bistable phenotype 218
was detected upon overexpression of HrpG, and bistability was abolished in 219
cultures that constitutively expressed HrpV (Fig. 3C). The effect that constitutive 220
expression of these regulators have on hrpL::gfp closely matched the effect 221
seen on hopAB1::gfp (Fig. 4B). A tentative interpretation of the above 222
observations is that HrpG and HrpV may be key elements in T3SS bistability, 223

perhaps due to the existence of cell-to-cell differences in the amount or activity 224
of these regulators. 225
226
Differences in gene expression correlate with differences in virulence 227
Validation of our reductionist observations in HIM was pursued by analysis in 228
planta. In P. syringae, the T3SS is necessary to suppress basal defences and 229
T3SS absence limits bacterial proliferation within the plant and prevents the 230
development of disease (Alfano and Collmer, 1997). Thus, if heterogeneous 231
expression of the T3SS genes were associated to the heterogeneity observed 232
in the size of apoplast-located microcolonies, T3SSHIGH and T3SSLOW 233
subpopulations would be expected to differ in their ability to interact with the 234
plant host. To test this possibility, we analysed the development of disease in 235
leaves inoculated with T3SSHIGH and T3SSLOW bacterial subpopulations, sorted 236
according to their level of expression of hopAB1 (Fig. 4A, upper panel). The 237
sorted populations were both virulent, an observation consistent with the fact 238
that bacteria expressing hopAB1 were detected in both subpopulations although 239
in different numbers (Fig. 4A, centre panel and 4B). However, the development 240
of disease symptoms was faster in leaf areas inoculated with the population 241
expressing higher levels of hopAB1, and the symptoms were also stronger (Fig. 242
4B). The spread of the disease symptoms was also faster beyond the areas 243
inoculated with the T3SSHIGH subpopulation, suggesting a more efficient 244
colonization of distal tissues by this population. Thus, differences in T3SS gene 245
expression appear to correlate with differences in virulence: namely, the 246
T3SSHIGH subpopulation is more virulent than the T3SSLOW subpopulation. 247
248

DISCUSSION 249
This study shows that colonisation of the plant apoplast by Pseudomonas 250
syringae involves cell-to-cell differences in expression of its T3SS. Although 251
microenvironments within the apoplast might provide different signals to control 252
bacterial gene expression, heterogeneous T3SS expression is also detected in 253
the homogeneous environment of nutrient-limited T3SS-inducing medium 254
(HIM), thus making unlikely it results as a direct response to environmental 255
cues. Flow cytometry analysis of cultures grown in HIM showed the occurrence 256
of two bacterial lineages, one of which expressed the T3SS at high levels while 257
the other did not show significant T3SS expression. This bistable pattern of 258
gene expression appeared during exponential growth, and reverted to unimodal 259
heterogeneity in stationary cultures, thus suggesting a non-genetic origin and 260
making phase variation an unlikely one (van der Woude, 2011). 261
A key factor in bistable expression of the P. syringae T3SS appears to be the 262
HrpL sigma factor (Fouts et al., 2002), as indicated by the disappearance of the 263
T3SSLOW subpopulation when expression of HrpL was uncoupled from its 264
regulation (i.e. upon constitutive expression of HrpL from a plasmid). HrpL 265
activates expression of more than 50 genes within the nutrient-limited plant leaf 266
apoplast (Ferreira et al., 2006; Lam et al., 2014; Mucyn et al., 2014), including 267
the hrp/hrc genes that encode the T3SS, and effector genes (Xiao et al., 1994; 268
Fouts et al., 2002). Bistable expression was detected in hrcU, which encodes a 269
structural component of the T3SS required for secretion and translocation 270
(Charkowski et al., 1997), and in hopAB1, encoding a type III secreted effector 271
involved in suppression of plant defences (Jackson et al., 1999). Hence, 272

transmission of HrpL bistability appears to occur downstream the regulatory 273
cascade, generating T3SSHIGH and T3SSLOW cells. 274
Bistability is hindered either by deletion of hrpG or by constitutive expression of 275
HrpV (Fig. 3C), suggesting that the HrpV/HrpG pair may constitute the bistable 276
switch involved in turning quantitative differences in gene expression into 277
qualitative differences. Although HrpA does not seem to be essential, it may 278
contribute to bistability by increasing the number of bacteria with gene 279
expression levels high enough to cross the threshold for activation. 280
Heterogeneous expression of the P. syringae T3SS is also observed during 281
growth within the apoplast, and T3SSHIGH and T3SSLOW cells are recovered 282
from P. syringae apoplast colonies. This observation, together with the fact that 283
T3SSHIGH and T3SSLOW subpopulations differ in virulence, suggests that 284
heterogeneous T3SS expression may play a role in the adaptation of P. 285
syringae to plant hosts. Unfortunately, a direct test is not feasible because 286
genetic changes that abrogate bistability in laboratory medium (mutation of 287
hrpG or plasmid-borne expression of HrpL or HrpV) alter T3SS expression 288
mean levels in a way that impairs virulence (Ortiz-Martín et al., 2010b; Ortiz-289
Martín et al., 2010a). 290
While the ultimate significance of T3SS heterogeneity in P. syringae remains to 291
be established, a tentative interpretation is that heterogeneous expression of 292
virulence determinants may serve as a stealth strategy for defence evasion in 293
the apoplast, an environment where unsuppressed plant defences are operative 294
(Mitchell et al., 2015). This possibility is supported by theoretical studies 295
indicating that phenotypic heterogeneity can have adaptive value in changing 296
and/or hostile environments (Kussell et al., 2005; Kussell and Leibler, 2005), 297

and by experimental evidence of host defence evasion by lineage formation in 298
animal pathogens (Srikhanta et al., 2010; Lovell et al., 2011; Hernández et al., 299
2012; Claudi et al., 2014; Sánchez-Romero and Casadesús, 2014; Manina et 300
al., 2015). Moreover, the phenotypic heterogeneity observed in P. syringae 301
T3SS genes could also play a role in adaptation to other stages of its life cycle. 302
Among plant pathogens, high frequencies of T3SS polymorphism are detected 303
in natural Arabidopsis-associated populations of P. syringae, and less 304
aggressive variants, increase their growth potential in mixed infections and have 305
a fitness advantage in non-host environments (Barrett et al., 2011). Furthermore 306
natural isolates of P. syringae from agricultural and non-agricultural niches 307
display differences in the phenotypic (but not the genotypic) structure of the 308
populations (Morris et al., 2008). On these grounds, we tentatively propose that 309
phenotypic heterogeneity in T3SS gene expression may protect P. syringae 310
populations from plant defences. Furthermore, it seems conceivable that 311
T3SSLOW subpopulations may persist undetected in plant leaves, in a fashion 312
reminiscent of the animal pathogens that cause persistent and chronic 313
infections. Whatever the case, our description of bistable expression of the P. 314
syringae T3SS brings about the notion that subpopulation formation during 315
infection is not restricted to animal pathogens. 316
317

EXPERIMENTAL PROCEDURES 318
Bacterial strains and growth conditions 319
Bacterial strains used in this work are listed in Table S1, and plasmids are listed 320
in Table S2. Escherichia coli and Pseudomonas syringae pv. phaseolicola (Pph) 321
were grown at 37°C and 28°C, respectively, with aeration in Lysogeny Broth 322
(LB) medium (Bertani, 1951) or Hrp-inducing medium (HIM) at pH 5.7 (Huynh et 323
al., 1989). Solid media contained agar at a final concentration of 15%. 324
Antibiotics were used at the following concentrations: ampicillin (Amp), 100 325
µg/ml for E. coli DH5α, kanamycin (Km), 50 µg/ml for E. coli DH5α and 15 326
µg/ml for Pph 1448A derivative strains. 327
328
Fluorescent labelling of bacterial strains 329
Constitutively expressed fluorescent reporter gene eYFP was introduced into 330
the chromosome of Pph strains 1448A using a Tn7 delivery system 331
(Lambertsen et al., 2004). Bacterial strains carrying chromosome-located 332
transcriptional fusions to a promoterless gfp gene of the hrp genes hrpL, hrcU 333
and hopAB1 were generated using an adaptation of a previously described 334
method (Zumaquero et al., 2010). The hrpL and hopAB1 genes are encoded as 335
monocistronic units, while hrcU is the last gene of an operon (Rahme et al., 336
1991; Xiao and Hutcheson, 1994; Jackson et al., 2000). For each gene, two 337
fragments of approximately 500 bp were amplified from Pph 1448A genomic 338
DNA using iProof High-Fidelity DNA Polymerase (Bio-Rad, USA); one fragment 339
corresponding to the 3’ end of the ORF, including the STOP codon, and the 340
other corresponding to the sequence immediately downstream the STOP 341
codon. Primers used are listed in Table S3. The fragments obtained were used 342

in a PCR reaction without additional primers or template, generating single 343
fragments including the end of each ORF and its downstream sequences 344
separated by an EcoRI site, which were A/T cloned into pGEM-T (Promega, 345
USA) and fully sequenced to discard mutations, giving raise to pDLM3 346
(phopAB1-EcoRI), pDLM4 (phrcU-EcoRI), and pDLM5 (phrpL-EcoRI). 347
Plasmid pZEP07 (Hautefort et al., 2008) was used to amplify a fragment 348
containing a promoterless gfp gene carrying its own ribosomal-binding site 349
(Willmann et al., 2011), followed by an EcoRV site and chloramphenicol 350
resistance cassette. This fragment was A/T cloned into pGEM-T (Promega, 351
USA) generating pDLM1. The nptII kanamycin resistance gene, flanked by FRT 352
sites (Flippase Recognition Target), was PCR-amplified using pDOC-K (Lee et 353
al., 2009) as a template, and cloned into the EcoRV site from pDLM1, to 354
generate pDLM2. pDLM2 was used to amplify a fragment containing the 355
promoterless gfp gene with its RBS, the kanamycin resistance gene, and the 356
chloramphenicol resistance gene, and the fragment obtained cloned into 357
pDLM3, pDLM4 and pDLM5, digested with EcoRI and treated with the Klenow 358
polymerase fragment (Takara, Japan) generating plasmids pDLM6, pDLM7 and 359
pDLM8, respectively. These resulting plasmids were introduced into Pph 1448A 360
and derivatives, as previously described (Zumaquero et al., 2010). Southern 361
blot analysis, using the nptII gene as a probe, was used to confirm that allelic 362
exchange occurred at a single and correct position within the genome. 363
364
Plant growth and inoculation 365
Phaseolus vulgaris bean cultivar Canadian Wonder plants were grown at 23°C, 366
95% humidity, with artificial light maintained for 16-h periods within the 24-h 367
cycle. For inoculum preparation, bacterial lawns were grown on LB plates for 48 368
h at 28°C and resuspended in 2 mL of 10 mM MgCl2. The OD600 was adjusted 369
to 0.1 (5 x 10⁷ colony forming units or cfu/mL) and serial dilutions made to reach 370
the final inoculum concentration. 371
Infiltration of bean leaves for confocal microscopy or symptom development 372
was carried out using a needless syringe and a 5 x 10⁶ cfu/ml bacterial 373
suspension in 10 mM MgCl2. Infiltration of bean leaves to be analysed for flow 374
cytometry was carried out after dipping a whole leaf into a 5 x 10⁸ cfu/ml 375
bacterial solution in 0.01% Silwett L-77 (Crompton Europe Ltd, Evesham, UK), 376
using a pressure chamber. Five days post inoculation (dpi) bacteria were 377
recovered from the plant by an apoplastic fluid extraction. The apoplastic fluid 378
extraction was carried out by pressure infiltrating a whole leaf with 10 ml of a 10 379
mM MgCl2 solution inside a 20 ml syringe. Following 5 cycles of pressure 380
application, the flow-through was removed and placed in a fresh 50 ml tube, 381
and the leaf retained within the syringe was introduced into another 50 ml tube. 382
Both tubes were centrifuged for 30 min at low speed (900 g) at 4ºC. Pellets 383
were resuspended into 1 ml of MgCl2 and analysed by flow cytometry. 384
385
Flow Cytometry and Cell Sorting 386
Five hundred µl of an overnight P. syringae LB culture was washed twice in 10 387
mM MgCl2 and added to 4.5 ml of HIM. Cultures and apoplast-extracted 388
bacterial suspensions were analysed using a BD FACSVerse cytometer and the 389
BD FACSuite software (BD Biosciences) after incubation at 28ºC. Stationary 390
cultures were sorted using a MoFloTM XDP cytometer (Beckman Coulter). 391
Immediately before sorting, 5 x 10⁶ cells were analysed for GFP fluorescence. 392

Based on this analysis, gates were drawn to separate the cells displaying 393
fluorescence levels overlapping the 1448A non-GFP bacterial population used 394
as a negative control, from cells expressing higher GFP levels, as indicated in 395
the corresponding histogram. From each gate, cells were collected into a sterile 396
tube. After sorting, cells were spun at 12,000 g for 10 min, and the resulting 397
pellets resuspended into 10mM MgCl2, and bacterial concentration adjusted to 398
1 x 10⁶ cfu/ml. An aliquot of sorted cells was run again at the cytometer to 399
confirm the differences in expression of the separated populations. Data were 400
analysed with FlowJo Software. All experiments included two replicate samples 401
and a number of independent experiments carried out as indicated for each 402
figure, which shows typical results. 403
404
Microscopy 405
Sections of inoculated P. vulgaris leaves (approximately 5 mm2) were excised 406
with a razor blade, and mounted on slides in double-distilled H2O (lower 407
epidermis toward objective) under a 0.17 mm coverslip. Images of the leaf 408
mesophyll and apoplast-extracted bacteria were taken using the Leica SP5 II 409
confocal microscope (Leica Microsystems GmbH, Wetzlar, Germany). Apoplast-410
extracted bacteria were stained with FM4-64 at 20 µM (Life Technologies). 411
Variable AOTF filters were used for the visualization of the following 412
fluorophores (excitation/ emission): eYFP (514 nm/ 525 to 600 nm), GFP (488 413
nm/ 500 to 533 nm), FM4-64 (488 nm/ 604-674 nm) plant autofluorescence 414
(514/ 605 to 670 nm). Z series imaging were taken at 1 µm or 10 µm intervals 415
when using 40x or 10x objectives respectively. Image processing was 416
performed using Leica LAS AF (Leica Microsystems). Colony area was 417

calculated using Fiji distribution of ImageJ software. All experiments included 418
two replicate samples and a number of independent experiments carried out as 419
indicated for each figure, which shows typical results. 420
421

ACKNOWLEDGMENTS 422
We are grateful to David Navas (Servicios Centrales de Apoyo a la 423
Investigación, Universidad de Málaga), Alberto Álvarez and Pilar Torralbo 424
(Servicio de Técnicas Aplicadas a la Biociencia, Universidad de Extremadura, 425
Badajoz), Modesto Carballo, Laura Navarro, and Cristina Reyes (Servicio de 426
Biología, Centro de Investigación Tecnológica e Innovación, Universidad de 427
Sevilla, Sevilla), and to Pablo Vallejo for technical assistance. We wish to thank 428
E.R. Bejarano and A. Castillo for their helpful comments and suggestions. We 429
also wish to thank David W. Holden for his critical reading of the manuscript. 430
This work was supported by grants from the Ministerio de Ciencia e Innovación 431
(MICINN, Spain; BIO2009-11516) and Ministerio de Economía y Competitividad 432
(MINECO, Spain) BIO2012-35641 to C.R. Beuzón, and BIO2015-64391-R to 433
C.R. Beuzón and J. Ruiz-Albert. J.S. Rufián has been supported by a FPI 434
fellowship associated with a grant of E.R. Bejarano (MICINN, Spain; AGL2010-435
22287-C02-2), funds from BIO2012-35641, and Plan Propio de la Universidad 436
de Málaga – Andalucía Tech. The work was co-funded by European Regional 437
Development Funds (FEDER). 438
439

FIGURE LEGENDS 440
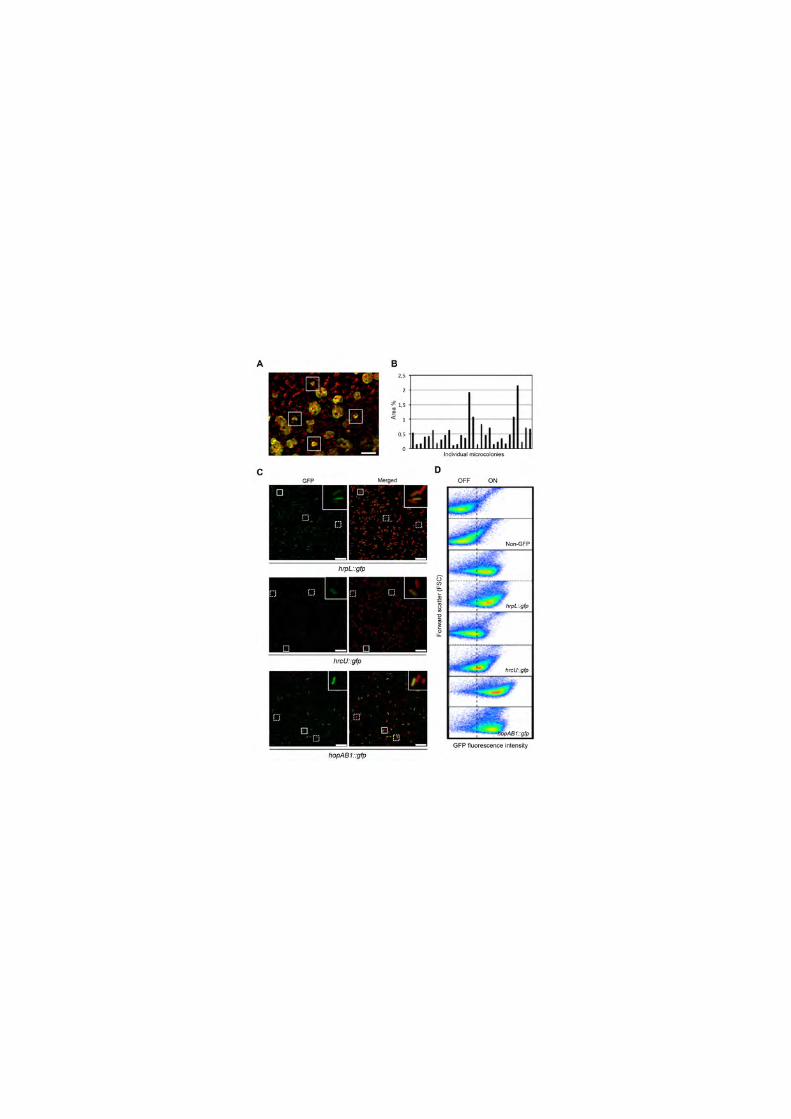
Figure 1. Colony development and T3SS gene expression in P. syringae 441
display phenotypic heterogeneity within the plant. (A and B) Colony 442
development is phenotypically heterogeneous within the plant apoplast. (A) 443
Representative confocal microscopy image of bean leaves inoculated with 444
5x10⁶ cfu/ml of wild type eYFP (yellow) 3 days post-inoculation (dpi). Boxes 445
highlight small microcolonies among the typical and more abundant larger ones. 446
Largest not-rounded microcolonies typically result from closely located colonies 447
merging. Red corresponds to auto-fluorescence generated by chloroplasts. 448
Scale bar corresponds to 100 µm. At least three independent experiments were 449
carried out (B). Graph showing relative area of individual microcolonies. Colony 450
area is expressed in percentage of total image area. (C and D) Expression of 451
the T3SS is phenotypically heterogeneous within the plant. (C) Fluorescence 452
microscopy images of apoplast-extracted bacteria from bean leaves 5 days 453
post-inoculation with a 5x10⁵ cfu/ml inoculum of each of the strains carrying 454
chromosome-located transcriptional gfp fusions to the T3SS genes hrpL, hrcU 455
or hopAB1. Left panels show GFP fluorescence, and right panels this image 456
merged with that obtained from bacterial staining with the membrane dye FM4-457
64 (red). Inset shows a close up of the area of the corresponding image 458
enclosed by a solid line square. Dotted line squares highlight other examples of 459
bacteria displaying GFP fluorescence below the level of detection. Scale bar 460
corresponds to 10 µm. (D) Flow cytometry analysis of apoplast-extracted 461
bacteria carrying hrpL::gfp, hrcU::gfp or hopAB1::gfp fusions, obtained from 462
bean leaves 5 days after inoculation with a 5x10⁵ cfu/ml inoculum. Non-GFP 463
1448A was also included as a reference to differenciate OFF and ON 464

subpopulations. Data are represented as a dot plot (forward scatter [cellular 465
size] versus GFP fluorescence intensity). All data were collected for 100,000 466
events per sample. At least three independent experiments with two replicates 467
each were carried out. Figure shows typical results. 468
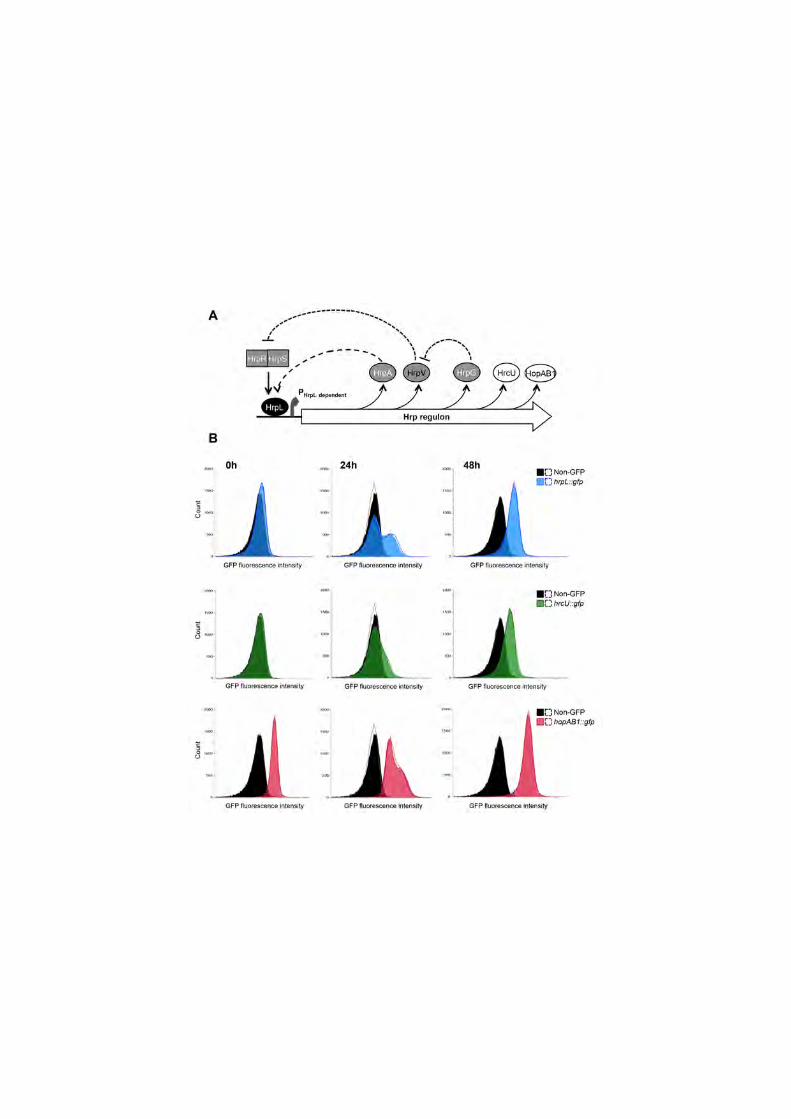
Figure 2. Expression of hrpL::gfp, hrcU::gfp and hopAB1::gfp is bistable 469
during exponential growth in Hrp-inducing medium. (A) Schematic 470
representation of the two feedback regulatory loops operating on the expression 471
of the T3SS genes: a positive feedback loop controlled by HrpA, and a double 472
negative feedback loop regulated by HrpV, an anti-activator of the T3SS genes 473
that binds to HrpS the enhancer-binding protein required for HrpL expression, 474
and HrpG, which binds to HrpV acting as an anti-anti-activator. Expression of 475
hrpA, hrpV, hrpG, hrcU, and hopAB1, is HrpL-activated, although in the case of 476
highly expressed hopAB1 some expression can still be detected in the absence 477
of HrpL. (B) Histograms show flow cytometry analysis of strains carrying 478
chromosome-located transcriptional fusions to the T3SS genes hrpL (top row), 479
hrcU (middle row) or hopAB1 (bottom row). Histograms show cell counts versus 480
GFP fluorescence at 0h (immediately after a 1:10 dilution into HIM of an 481
overnight LB culture), 24h after the dilution into HIM (exponential phase) or 48h 482
(stationary phase). Black histograms show non-GFP 1448A included as a 483
reference. Coloured histograms show GFP fluorescence for the strains carrying 484
the fusions as indicated in each case. Dotted lines show the results of a 485
replicate experiment. All data were collected for 100,000 events per sample. At 486
least three independent experiments with two replicates each were carried out. 487
Figure shows typical results. 488

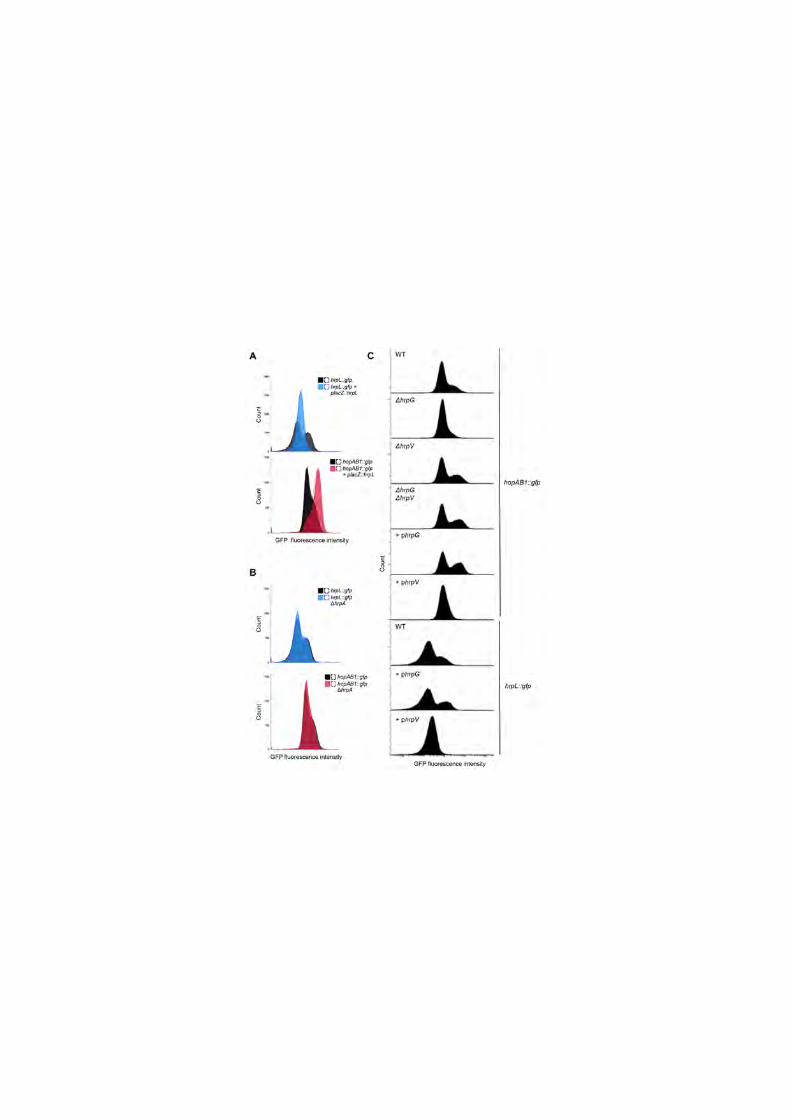
Figure 3. Bistability of hrpL::gfp and hopAB1::gfp is abolished by 489
constitutive expression of HrpL, deletion of hrpG or constitutive 490
expression of HrpV. (A) Flow cytometry analysis of HIM-growing bacterial 491
strains carrying chromosome-located transcriptional fusions to the T3SS genes 492
hrpL or hopAB1, carrying or not a plasmid expressing hrpL under the control of 493
Plac, a constitutive promoter of moderate expression in P. syringae. Histograms 494
show cell counts versus GFP fluorescence after 24h of growth in HIM. Black 495
histograms show fluorescence of the fusions in the absence of the plasmid. 496
Coloured histograms show fluorescence of the fusions in the strain carrying the 497
plasmid as indicated. Dotted lines show the results of a replicate experiment. 498
(B) Flow cytometry analysis of HIM-growing bacterial strains carrying 499
chromosome-located transcriptional fusions to the T3SS genes hrpL or hopAB1, 500
in different genetic backgrounds. Histograms show cell counts versus GFP 501
fluorescence after 24h of growth in HIM. Black histograms show fluorescence of 502
the fusions in an otherwise wild type background. Coloured histograms show 503
fluorescence of the fusions in a strain carrying the ΔhrpA mutation. Dotted lines 504
show the results of a replicate experiment. All data were collected for 100,000 505
events per sample. (C) Flow cytometry analysis of HIM-growing bacterial strains 506
carrying chromosome-located transcriptional fusions to the T3SS genes 507
hopAB1 or hrpL, in different genetic backgrounds. Histograms show cell counts 508
versus GFP fluorescence after 24h of growth in HIM. Histograms show 509
fluorescence of the fusions in each of the indicated genetic backgrounds. WT 510
indicate the strain that only carries the indicated gene fusion. All data were 511
collected for 100,000 events per sample. At least two independent experiments 512
with two replicates each were carried out with similar results. 513

Figure 4. Bacterial populations sorted according to hopAB1 expression 514
display differences in virulence. (A) Flow cytometry analysis of a HIM-515
growing culture of the strain carrying hopAB1::gfp. GFP fluorescence intensity is 516
shown as a green histogram. Gates were drawn to separate hopAB1::gfp 517
bacteria displaying fluorescence levels overlapping the 1448A non-GFP 518
bacterial population (indicated with a line marked as low), used as a negative 519
control (Grey histogram), from cells expressing high GFP levels (indicated with 520
a line marked as high, and including the mode for the expressing population). 521
After sorting, aliquots of sorted cells were run again through the cytometer to 522
confirm the efficacy of the sorting process (below), and bacterial concentration 523
adjusted to 1 x 10⁶ cfu/ml. Some overlap caused by the dynamic and reversible 524
nature of the process can be detected (B) Disease symptom progression in 525
bean leaves inoculated with 1 x 10⁶ cfu/ml of each of the sorted populations at 6 526
and 11 days post inoculation (dpi). Results from three replicate experiments are 527
shown. 528
Supplemental figures 529
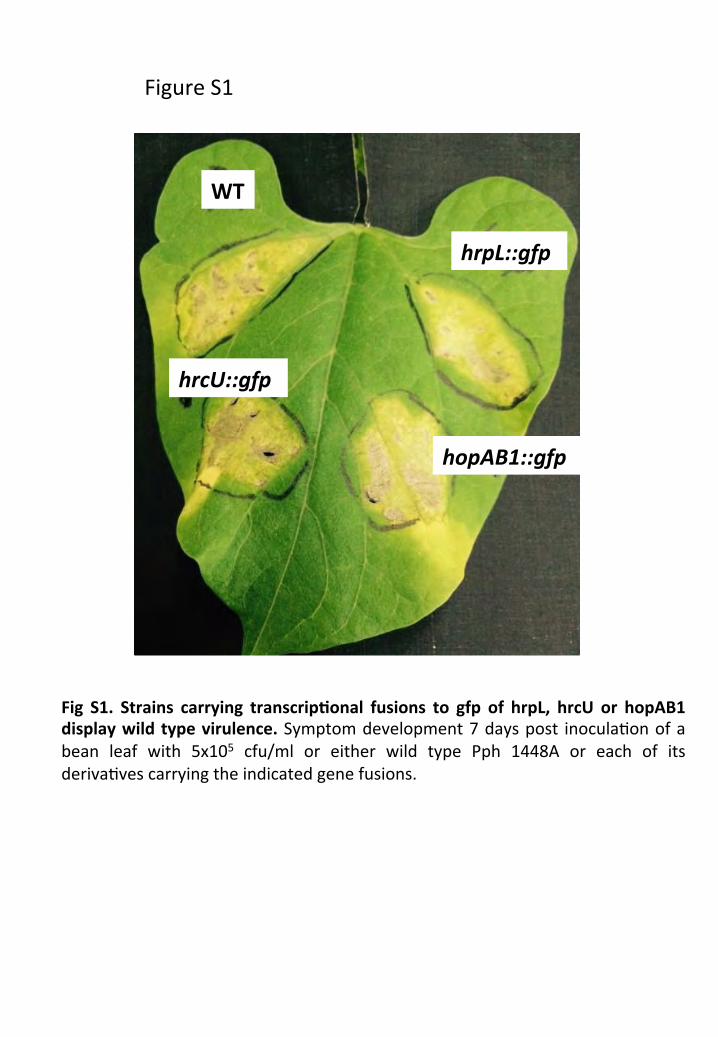
Figure S1. Strains carrying transcriptional fusions to gfp of hrpL, hrcU or 530
hopAB1 display wild type virulence. Symptom development 7 days post 531
inoculation of a bean leaf with 5x10⁵ cfu/ml or either wild type Pph 1448A or 532
each of its derivatives carrying the indicated gene fusions. 533
Figure S2. Bacterial colonies display heterogeneous distribution of gfp 534
fluorescence that cannot be unequivocally associated to individual cells. 535
Confocal microscopy images showing bacterial microcolonies within the 536
apoplast of bean leaves, 5 days post-inoculation with 5x10⁶ cfu/ml of each of 537
the strains carrying the chromosome-located transcriptional hrpL::gfp, hrcU::gfp 538

or hopAB1::gfp fusions. Red corresponds to auto-fluorescence generated by 539
chloroplasts. Scale bar corresponds to 50 µm. 540
Figure S3. Flow cytometry analysis of in LB-grown bacterial cultures. 541
Histograms of GFP fluorescence distribution in the strains carrying the 542
chromosome-located transcriptional hrpL::gfp, hrcU::gfp or hopAB1::gfp fusions 543
growing at 24h (A) or 48h (B). Grey histograms show a strain not expressing 544
GFP. All data was collected for 100,000 events per sample. 545
Video S1 and S2 3D reconstructions of 1 µm z-stack confocal images showing 546
the uneven distribution of bacteria within two different apoplast-located 547
microcolonies of Pph 1448A constitutively expressing GFP. Bean leaves were 548
inoculated with 5x10⁵ cfu/ml, and visualized 3 days post inoculation. 549
550

References 551
Alfano, J.R., and Collmer, A. (1997) The type III (Hrp) secretion pathway of 552 plant pathogenic bacteria: trafficking harpins, Avr proteins, and death. J 553 Bacteriol 179: 5655-5662. 554 Arnoldini, M., Vizcarra, I.A., Pena-Miller, R., Stocker, N., Diard, M., Vogel, V. et 555 al. (2014) Bistable expression of virulence genes in salmonella leads to the 556 formation of an antibiotic-tolerant subpopulation. PLoS Biol 12: e1001928. 557 Barrett, L.G., Bell, T., Dwyer, G., and Bergelson, J. (2011) Cheating, trade-offs 558 and the evolution of aggressiveness in a natural pathogen population. Ecol Lett 559 14: 1149-1157. 560 Bäumler, A.J., Winter, S.E., Thiennimitr, P., and Casadesús, J. (2011) Intestinal 561 and chronic infections: Salmonella lifestyles in hostile environments. Environ 562 Microbiol Rep 3: 508-517. 563 Bertani, G. (1951) Studies on lysogenesis. I. The mode of phage liberation by 564 lysogenic Escherichia coli. J Bacteriol 62: 293-300. 565 Bigger, J. (1944) Treatment of Staphylococcal infections with penicillin by 566 intermittent sterilisation. Lancet 244: 497-500. 567 Bram Van den Bergh, J.E.M., Tom Wenseleers, Etthel M. Windels, Pieterjan 568 Vanden Boer, Donaat Kestemont, Luc De Meester, Kevin J. Verstrepen, Natalie 569 Verstraeten, Maarten Fauvart & Jan Michiels (2016) Frequency of antibiotic 570 application drives rapid evolutionary adaptation of Escherichia coli persistence. 571 Nature Microbiology 1. 572 Brian P. Conlon, S.E.R., Autumn Brown Gandt, Austin S. Nuxoll, Niles P. 573 Donegan, Eliza A. Zalis, Geremy Clair, Joshua N. Adkins, Ambrose L. Cheung 574 & Kim Lewis (2016) Persister formation in Staphylococcus aureus is associated 575 with ATP depletion. Nature Microbiology 1. 576 Campbell-Valois, F.X., Schnupf, P., Nigro, G., Sachse, M., Sansonetti, P.J., and 577 Parsot, C. (2014) A fluorescent reporter reveals on/off regulation of the Shigella 578 type III secretion apparatus during entry and cell-to-cell spread. Cell Host 579 Microbe 15: 177-189. 580 Charkowski, A.O., Huang, H.C., and Collmer, A. (1997) Altered localization of 581 HrpZ in Pseudomonas syringae pv. syringae hrp mutants suggests that different 582 components of the type III secretion pathway control protein translocation 583 across the inner and outer membranes of gram-negative bacteria. J Bacteriol 584 179: 3866-3874. 585 Claudi, B., Sprote, P., Chirkova, A., Personnic, N., Zankl, J., Schurmann, N. et 586 al. (2014) Phenotypic variation of Salmonella in host tissues delays eradication 587 by antimicrobial chemotherapy. Cell 158: 722-733. 588 Davidson, C.J., and Surette, M.G. (2008) Individuality in bacteria. Annu Rev 589 Genet 42: 253-268. 590 Davis, K.M., Mohammadi, S., and Isberg, R.R. (2015) Community behavior and 591 spatial regulation within a bacterial microcolony in deep tissue sites serves to 592 protect against host attack. Cell Host Microbe 17: 21-31. 593 Dubnau, D., and Losick, R. (2006) Bistability in bacteria. Mol Microbiol 61: 564-594 572. 595 Ferreira, A.O., Myers, C.R., Gordon, J.S., Martin, G.B., Vencato, M., Collmer, A. 596 et al. (2006) Whole-genome expression profiling defines the HrpL regulon of 597 Pseudomonas syringae pv. tomato DC3000, allows de novo reconstruction of 598
the Hrp cis element, and identifies novel coregulated genes. Mol Plant Microbe 599 Interact 19: 1167-1179. 600 Fouts, D.E., Abramovitch, R.B., Alfano, J.R., Baldo, A.M., Buell, C.R., 601 Cartinhour, S. et al. (2002) Genomewide identification of Pseudomonas 602 syringae pv. tomato DC3000 promoters controlled by the HrpL alternative sigma 603 factor. Proc Natl Acad Sci 99: 2275-2280. 604 Green, S., Studholme, D.J., Laue, B.E., Dorati, F., Lovell, H., Arnold, D. et al. 605 (2010) Comparative genome analysis provides insights into the evolution and 606 adaptation of Pseudomonas syringae pv. aesculi on Aesculus hippocastanum. 607 PLoS One 5: e10224. 608 Hautefort, I., Thompson, A., Eriksson-Ygberg, S., Parker, M.L., Lucchini, S., 609 Danino, V. et al. (2008) During infection of epithelial cells Salmonella enterica 610 serovar Typhimurium undergoes a time-dependent transcriptional adaptation 611 that results in simultaneous expression of three type 3 secretion systems. Cell 612 Microbiol 10: 958-984. 613 Helaine, S., and Holden, D.W. (2013) Heterogeneity of intracellular replication 614 of bacterial pathogens. Curr Opin Microbiol 16: 184-191. 615 Hernández, S.B., Cota, I., Ducret, A., Aussel, L., and Casadesús, J. (2012) 616 Adaptation and preadaptation of Salmonella enterica to Bile. PLoS Genet 8: 617 e1002459. 618 Herskowitz, I., and Hagen, D. (1980) The lysis-lysogeny decision of phage 619 lambda: explicit programming and responsiveness. Annu Rev Genet 14: 399-620 445. 621 Huynh, T.V., Dahlbeck, D., and Staskawicz, B.J. (1989) Bacterial blight of 622 soybean: regulation of a pathogen gene determining host cultivar specificity. 623 Science 245: 1374-1377. 624 Jackson, R.W., Mansfield, J.W., Arnold, D.L., Sesma, A., Paynter, C.D., Murillo, 625 J. et al. (2000) Excision from tRNA genes of a large chromosomal region, 626 carrying avrPphB, associated with race change in the bean pathogen, 627 Pseudomonas syringae pv. phaseolicola. Mol Microbiol 38: 186-197. 628 Jackson, R.W., Athanassopoulos, E., Tsiamis, G., Mansfield, J.W., Sesma, A., 629 Arnold, D.L. et al. (1999) Identification of a pathogenicity island, which contains 630 genes for virulence and avirulence, on a large native plasmid in the bean 631 pathogen Pseudomonas syringae pathovar phaseolicola. Proc Natl Acad Sci 632 96: 10875-10880. 633 Kussell, E., and Leibler, S. (2005) Phenotypic diversity, population growth, and 634 information in fluctuating environments. Science 309: 2075-2078. 635 Kussell, E., Kishony, R., Balaban, N.Q., and Leibler, S. (2005) Bacterial 636 persistence: a model of survival in changing environments. Genetics 169: 1807-637 1814. 638 Lam, H.N., Chakravarthy, S., Wei, H.L., BuiNguyen, H., Stodghill, P.V., Collmer, 639 A. et al. (2014) Global analysis of the HrpL regulon in the plant pathogen 640 Pseudomonas syringae pv. tomato DC3000 reveals new regulon members with 641 diverse functions. PLoS One 9: e106115. 642 Lambertsen, L., Sternberg, C., and Molin, S. (2004) Mini-Tn7 transposons for 643 site-specific tagging of bacteria with fluorescent proteins. Environ Microbiol 6: 644 726-732. 645 Lee, D.J., Bingle, L.E., Heurlier, K., Pallen, M.J., Penn, C.W., Busby, S.J., and 646 Hobman, J.L. (2009) Gene doctoring: a method for recombineering in laboratory 647 and pathogenic Escherichia coli strains. BMC Microbiol 9: 252. 648

Lovell, H.C., Jackson, R.W., Mansfield, J.W., Godfrey, S.A., Hancock, J.T., 649 Desikan, R., and Arnold, D.L. (2011) In planta conditions induce genomic 650 changes in Pseudomonas syringae pv. phaseolicola. Mol Plant Pathol 12: 167-651 176. 652 Macho, A.P., and Zipfel, C. (2015) Targeting of plant pattern recognition 653 receptor-triggered immunity by bacterial type-III secretion system effectors. Curr 654 Opin Microbiol 23: 14-22. 655 Manina, G., Dhar, N., and McKinney, J.D. (2015) Stress and host immunity 656 amplify Mycobacterium tuberculosis phenotypic heterogeneity and induce 657 nongrowing metabolically active forms. Cell Host Microbe 17: 32-46. 658 Mansfield, J., Genin, S., Magori, S., Citovsky, V., Sriariyanum, M., Ronald, P. et 659 al. (2012) Top 10 plant pathogenic bacteria in molecular plant pathology. Mol 660 Plant Pathol 13: 614-629. 661 Mitchell, K., Brown, I., Knox, P., and Mansfield, J. (2015) The role of cell wall-662 based defences in the early restriction of non-pathogenic hrp mutant bacteria in 663 Arabidopsis. Phytochemistry 112: 139-150. 664 Morris, C.E., Sands, D.C., Vinatzer, B.A., Glaux, C., Guilbaud, C., Buffiere, A. et 665 al. (2008) The life history of the plant pathogen Pseudomonas syringae is linked 666 to the water cycle. ISME J 2: 321-334. 667 Mucyn, T.S., Yourstone, S., Lind, A.L., Biswas, S., Nishimura, M.T., Baltrus, 668 D.A. et al. (2014) Variable suites of non-effector genes are co-regulated in the 669 type III secretion virulence regulon across the Pseudomonas syringae 670 phylogeny. PLoS Pathog 10: e1003807. 671 Nielsen, A.T., Dolganov, N.A., Rasmussen, T., Otto, G., Miller, M.C., Felt, S.A. 672 et al. (2010) A bistable switch and anatomical site control Vibrio cholerae 673 virulence gene expression in the intestine. PLoS Pathog 6: e1001102. 674 Novick, A., and Weiner, M. (1957) Enzyme Induction as an All-or-None 675 Phenomenon. Proc Natl Acad Sci U S A 43: 553-566. 676 Ortiz-Martín, I., Thwaites, R., Mansfield, J.W., and Beuzón, C.R. (2010a) 677 Negative regulation of the Hrp type III secretion system in Pseudomonas 678 syringae pv. phaseolicola. Mol Plant Microbe Interact 23: 682-701. 679 Ortiz-Martín, I., Thwaites, R., Macho, A.P., Mansfield, J.W., and Beuzón, C.R. 680 (2010b) Positive regulation of the Hrp type III secretion system in Pseudomonas 681 syringae pv. phaseolicola. Mol Plant Microbe Interact 23: 665-681. 682 Rahme, L.G., Mindrinos, M.N., and Panopoulos, N.J. (1991) Genetic and 683 transcriptional organization of the hrp cluster of Pseudomonas syringae pv. 684 phaseolicola. J Bacteriol 173: 575-586. 685 Rohmer, L., Guttman, D.S., and Dangl, J.L. (2004) Diverse evolutionary 686 mechanisms shape the type III effector virulence factor repertoire in the plant 687 pathogen Pseudomonas syringae. Genetics 167: 1341-1360. 688 Roine, E., Wei, W., Yuan, J., Nurmiaho-Lassila, E.L., Kalkkinen, N., 689 Romantschuk, M., and He, S.Y. (1997) Hrp pilus: an hrp-dependent bacterial 690 surface appendage produced by Pseudomonas syringae pv. tomato DC3000. 691 Proc Natl Acad Sci 94: 3459-3464. 692 Saini, S., Koirala, S., Floess, E., Mears, P.J., Chemla, Y.R., Golding, I. et al. 693 (2010) FliZ induces a kinetic switch in flagellar gene expression. J Bacteriol 694 192: 6477-6481. 695 Sánchez-Romero, M.A., and Casadesús, J. (2014) Contribution of phenotypic 696 heterogeneity to adaptive antibiotic resistance. Proc Natl Acad Sci U S A 111: 697 355-360. 698

Shenge, K.C., Mabagala, R.B., Mortensen, C.N., Stephan, D. and Wydra, K 699 (2007) First report of bacterial speck of tomato caused by Pseudomonas 700 syringae pv. tomato in Tanzania. Plant Disease 91: 462. 701 Srikhanta, Y.N., Fox, K.L., and Jennings, M.P. (2010) The phasevarion: phase 702 variation of type III DNA methyltransferases controls coordinated switching in 703 multiple genes. Nat Rev Microbiol 8: 196-206. 704 Stecher, B., Hapfelmeier, S., Muller, C., Kremer, M., Stallmach, T., and Hardt, 705 W.D. (2004) Flagella and chemotaxis are required for efficient induction of 706 Salmonella enterica serovar Typhimurium colitis in streptomycin-pretreated 707 mice. Infect Immun 72: 4138-4150. 708 Stewart, M.K., and Cookson, B.T. (2012) Non-genetic diversity shapes 709 infectious capacity and host resistance. Trends Microbiol 20: 461-466. 710 Uphoff, S., Lord, N.D., Okumus, B., Potvin-Trottier, L., Sherratt, D.J., and 711 Paulsson, J. (2016) Stochastic activation of a DNA damage response causes 712 cell-to-cell mutation rate variation. Science 351: 1094-1097. 713 van der Woude, M.W. (2011) Phase variation: how to create and coordinate 714 population diversity. Curr Opin Microbiol 14: 205-211. 715 van Vliet, S., and Ackermann, M. (2015) Bacterial Ventures into Multicellularity: 716 Collectivism through Individuality. PLoS Biol 13: e1002162. 717 Veening, J.W., Smits, W.K., and Kuipers, O.P. (2008) Bistability, epigenetics, 718 and bet-hedging in bacteria. Annu Rev Microbiol 62: 193-210. 719 Victor I. Band, E.K.C., Brooke A. Napier, Carmen M. Herrera, Greg K. Tharp, 720 Kranthi Vavikolanu, Jan Pohl, Timothy D. Read, Steven E. Bosinger, M. 721 Stephen Trent, Eileen M. Burd & David S. Weiss (2016) Antibiotic failure 722 mediated by a resistant subpopulation in Enterobacter cloacae. Nature 723 Microbiology 1. 724 Wei, C.F., Deng, W.L., and Huang, H.C. (2005) A chaperone-like HrpG protein 725 acts as a suppressor of HrpV in regulation of the Pseudomonas syringae pv. 726 syringae type III secretion system. Mol Microbiol 57: 520-536. 727 Wei, W., Plovanich-Jones, A., Deng, W.L., Jin, Q.L., Collmer, A., Huang, H.C., 728 and He, S.Y. (2000) The gene coding for the Hrp pilus structural protein is 729 required for type III secretion of Hrp and Avr proteins in Pseudomonas syringae 730 pv. tomato. Proc Natl Acad Sci 97: 2247-2252. 731 Willmann, R., Lajunen, H.M., Erbs, G., Newman, M.-A., Kolb, D., Tsuda, K. et 732 al. (2011) Arabidopsis lysin-motif proteins LYM1 LYM3 CERK1 mediate 733 bacterial peptidoglycan sensing and immunity to bacterial infection. 734 Proceedings of the National Academy of Sciences 108: 19824-19829. 735 Xiao, Y., and Hutcheson, S.W. (1994) A single promoter sequence recognized 736 by a newly identified alternate sigma factor directs expression of pathogenicity 737 and host range determinants in Pseudomonas syringae. J Bacteriol 176: 3089-738 3091. 739 Xiao, Y., Heu, S., Yi, J., Lu, Y., and Hutcheson, S.W. (1994) Identification of a 740 putative alternate sigma factor and characterization of a multicomponent 741 regulatory cascade controlling the expression of Pseudomonas syringae pv. 742 syringae Pss61 hrp and hrmA genes. J Bacteriol 176: 1025-1036. 743 Zeng, Q., Laiosa, M.D., Steeber, D.A., Biddle, E.M., Peng, Q., and Yang, C.H. 744 (2012) Cell individuality: the bistable gene expression of the type III secretion 745 system in Dickeya dadantii 3937. Mol Plant Microbe Interact 25: 37-47. 746

Zumaquero, A., Macho, A.P., Rufián, J.S., and Beuzón, C.R. (2010) Analysis of 747 the role of the type III effector inventory of Pseudomonas syringae pv. 748 phaseolicola 1448a in interaction with the plant. J Bacteriol 192: 4474-4488. 749 750


WT
hrpL::gfp
hrcU::gfp
hopAB1::gfp
FigureS1
Fig S1. Strains carrying transcrip2onal fusions to gfp of hrpL, hrcU or hopAB1displaywildtypevirulence.Symptomdevelopment7dayspost inocula7onofabean leaf with 5x10⁵ cfu/ml or either wild type Pph 1448A or each of itsderiva7vescarryingtheindicatedgenefusions.

hrpL::gfp hrcU::gfp hopAB1::gfp
FigureS3
FigS3.Bacterialcoloniesdisplayheterogeneousdistribu7onofgfpfluorescencethatcannotbeunequivocallyassociatedtoindividualcells.Confocalmicroscopyimagesshowingbacterialmicrocolonieswithintheapoplastofbeanleaves,5dayspost-inocula?onwith5x106cfu/mlofeachofthestrainscarryingthechromosome-locatedtranscrip?onalhrpL::gfp,hrcU::gfporhopAB1::gfpfusions.Redcorrespondstoauto-fluorescencegeneratedbychloroplasts.Scalebarcorrespondsto50μm.

AB1::GFP
hrcU::GFP
hrpL::GFP
LB Exponencial
100 101 102 1030
1000
2000
3000
4000
100 101 102 1030
1000
2000
3000
4000
100 101 102 1030
1000
2000
3000
4000
100 101 102 1030
1000
2000
3000
4000
100 101 102 1030
1000
2000
3000
4000
100 101 102 1030
1000
2000
3000
4000
LB Estacionario
GFP fluorescence intensity
Cel
l cou
nt
GFP fluorescence intensity
GFP fluorescence intensity
GFP fluorescence intensity
GFP fluorescence intensity GFP fluorescence intensity
Cel
l cou
ntC
ell c
ount
Cel
l cou
ntC
ell c
ount
Cel
l cou
nt
A B
AB1::GFP
hrcU::GFP
hrpL::GFP
LB Exponencial
100 101 102 1030
1000
2000
3000
4000
100 101 102 1030
1000
2000
3000
4000
100 101 102 1030
1000
2000
3000
4000
100 101 102 1030
1000
2000
3000
4000
100 101 102 1030
1000
2000
3000
4000
100 101 102 1030
1000
2000
3000
4000
LB Estacionario
GFP fluorescence intensity
Cel
l cou
nt
GFP fluorescence intensity
GFP fluorescence intensity
GFP fluorescence intensity
GFP fluorescence intensity GFP fluorescence intensity
Cel
l cou
ntC
ell c
ount
Cel
l cou
ntC
ell c
ount
Cel
l cou
nt
AB1::GFP
hrcU::GFP
hrpL::GFP
LB Exponencial
100 101 102 1030
1000
2000
3000
4000
100 101 102 1030
1000
2000
3000
4000
100 101 102 1030
1000
2000
3000
4000
100 101 102 1030
1000
2000
3000
4000
100 101 102 1030
1000
2000
3000
4000
100 101 102 1030
1000
2000
3000
4000
LB Estacionario
GFP fluorescence intensity
Cel
l cou
nt
GFP fluorescence intensity
GFP fluorescence intensity
GFP fluorescence intensity
GFP fluorescence intensity GFP fluorescence intensity
Cel
l cou
ntC
ell c
ount
Cel
l cou
ntC
ell c
ount
Cel
l cou
nthrcU::gfp
hrpL::gfp hrpL::gfp
hrcU::gfp
hopAB1::gfp hopAB1::gfp
48h24h
FigureS4
FigureS4.FlowcytometryanalysisofinLB-grownbacterialcultures.HistogramsofGFPfluorescencedistribu:oninthestrainscarryingthechromosome-locatedtranscrip:onalhrpL::gfp,hrcU::gfporhopAB1::gfpfusionsgrowingat24h(A)or48h(B).GreyhistogramsshowastrainnotexpressingGFP.Alldatawascollectedfor100,000eventspersample.

Table 1. Strains used and generated in this work.
Strain Genotype Reference
1448A P. syringae pv. phaseolicola wild-type
strain race 6
Teverson, 1991
JRP9 1448A Tn7-eYFP, GmR This work
JRP8 1448A Tn7-eGFP, GmR This work
DLM1 1448A hrpL::gpf, KmR This work
DLM2 1448A hrcU::gpf, KmR This work
DLM3 1448A hopAB1::gpf, KmR This work
IOM49 1448A ΔhrpA Ortiz-Martín et al., 2010a
JRP-F1 1448A ΔhrpA; hrpL::gpf, KmR This work
JRP-F2 1448A ΔhrpA; hopAB1::gpf, KmR This work
IOM57 1448A ΔhrpG Ortiz-Martín et al., 2010b
IOM48-F 1448A ΔhrpV Ortiz-Martín et al., 2010b
IOM58 1448A ΔhrpG ΔhrpV Ortiz-Martín et al., 2010b
JRP-F3 1448A ΔhrpG; hopAB1::gpf, KmR This work
JRP-F4 1448A ΔhrpV; hopAB1::gpf, KmR This work
JRP-F5 1448A ΔhrpG ΔhrpV; hopAB1::gpf, KmR This work
Table 2. Plasmids used in this work.
Name Description Reference
pIOM22 pBBR1-MCS-4 derivative, contains a promotorless hrpL gene expressed from the lacZ promoter
Ortiz-Martín et al.,
2010a
pIOM92 pBBR1-MCS-4 derivative, contains a promotorless hrpG gene expressed from the lacZ promoter
Ortiz-Martín et al.,
2010b
pIOM53 pBBR1-MCS-4 derivative, contains a promotorless hrpV gene expressed from the lacZ promoter
Ortiz-Martín et al.,
2010b
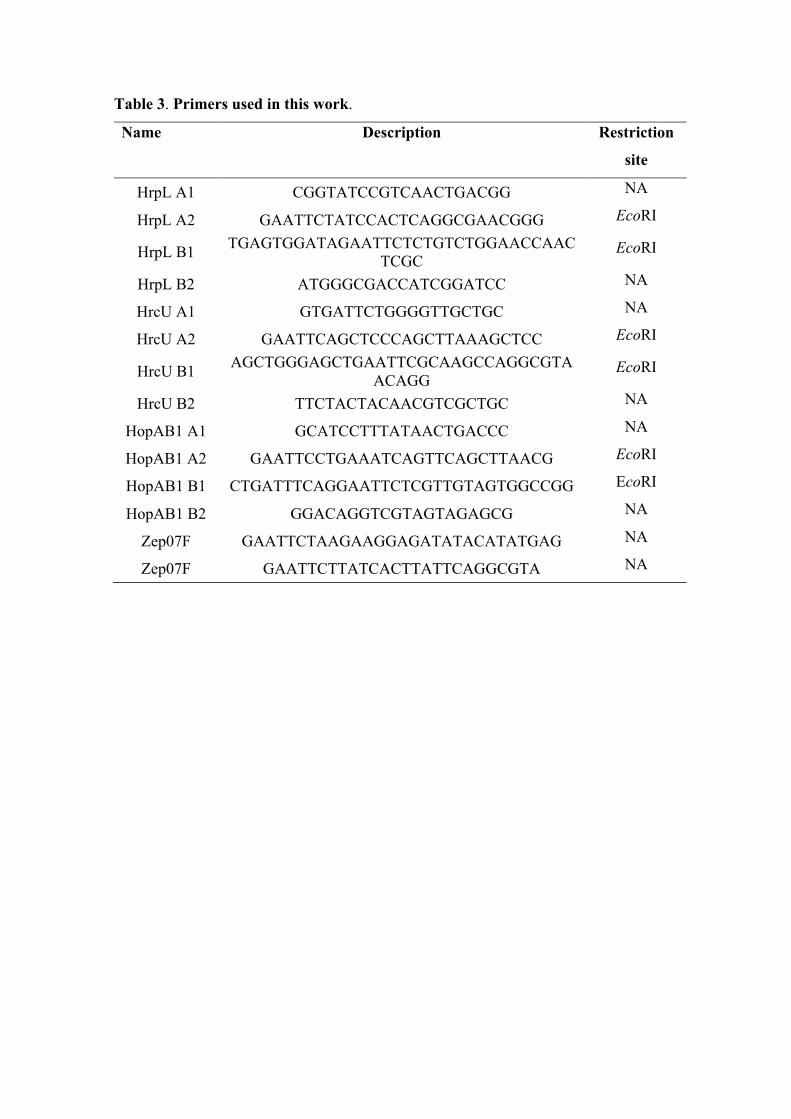
Table 3. Primers used in this work.
Name Description Restriction
site
HrpL A1 CGGTATCCGTCAACTGACGG NA
HrpL A2 GAATTCTATCCACTCAGGCGAACGGG EcoRI
HrpL B1 TGAGTGGATAGAATTCTCTGTCTGGAACCAACTCGC
EcoRI
HrpL B2 ATGGGCGACCATCGGATCC NA
HrcU A1 GTGATTCTGGGGTTGCTGC NA
HrcU A2 GAATTCAGCTCCCAGCTTAAAGCTCC EcoRI
HrcU B1 AGCTGGGAGCTGAATTCGCAAGCCAGGCGTAACAGG
EcoRI
HrcU B2 TTCTACTACAACGTCGCTGC NA
HopAB1 A1 GCATCCTTTATAACTGACCC NA
HopAB1 A2 GAATTCCTGAAATCAGTTCAGCTTAACG EcoRI
HopAB1 B1 CTGATTTCAGGAATTCTCGTTGTAGTGGCCGG EcoRI
HopAB1 B2 GGACAGGTCGTAGTAGAGCG NA
Zep07F GAATTCTAAGAAGGAGATATACATATGAG NA
Zep07F GAATTCTTATCACTTATTCAGGCGTA NA