RTRTR ND PH TRNFRTN N DNTL LD LL DTRNTN F HRNT PH DR fileRTRTR ND PH TRNFRTN N DNTL LD LL DTRNTN F...
17
MICROSTRUCTURE AND PHASE TRANSFORMATIONS IN DENTAL GOLD ALLOYS DETERMINATION OF A COHERENT PHASE DIAGRAM Katsuhiro Yasuda d- Kunihiro Hisatsune Department of Dental Materials Science Nagasaki University School of Dentistry Nagasaki, Japan Electron microscopy has a lot to offer materials scientists in helping them to understand the dependence of mechanical and electrochemical properties on the microstructures resulting from phase transformations in dental alloys. A coherent phase diagram gives us effective information as an aid to developing improved dental alloys. This brief article describes the process of construction of a coherent phase diagram for the AuX - (Ag0.24Cu0.76)1_x section of the gold-copper-silver ternary system, which is the essential system of dental gold alloys, using conventional transmission electron microscopy coupled with selected area electron diffraction. 50 (' Gold Bull., 1993, 26 (2)
Transcript of RTRTR ND PH TRNFRTN N DNTL LD LL DTRNTN F HRNT PH DR fileRTRTR ND PH TRNFRTN N DNTL LD LL DTRNTN F...

MICROSTRUCTURE ANDPHASE TRANSFORMATIONSIN DENTAL GOLD ALLOYS
DETERMINATION OF ACOHERENT PHASE DIAGRAM
Katsuhiro Yasuda d- Kunihiro Hisatsune
Department of Dental Materials ScienceNagasaki University School of Dentistry
Nagasaki, Japan
Electron microscopy has a lot to offer materials scientists in
helping them to understand the dependence of mechanical and
electrochemical properties on the microstructures resulting from
phase transformations in dental alloys. A coherent phase diagram
gives us effective information as an aid to developing improved
dental alloys. This brief article describes the process of
construction of a coherent phase diagram for theAuX - (Ag0.24Cu0.76)1_x section of the gold-copper-silver ternary
system, which is the essential system of dental gold alloys, using
conventional transmission electron microscopy coupled with
selected area electron diffraction.
50 (' Gold Bull., 1993, 26 (2)

Figure 1
Time-Temperature-Transformation diag am of Au-49.7at. %Cu-15.8at. %Ag alloy and the cooling curve prescribed in ADA
specification No. 5 for dental gold casting alloys
INTRODUCTION - WHY DO WENEED A PHASE DIAGRAM?
According to American Dental Association (ADA)Specification No. 5 and International Standard ISO1562, dental gold alloys for casting are classifiedinto four types, I, II, III and IV, by their gold andplatinum metals content and their mechanical proper-ties. Among other things, the Type IV alloys are de-signed to be age-hardenable by an appropriate heattreatment.
As is prescribed in ADA specification No. 5, theType IV alloys can be softened by quenching afterbeing heated for 0.6 ks (10 min.) at 973 K (700 °C) atwhich temperature a single-phase solid solution isformed in the alloys. The quenching tends to suppressphase transformation by preventing diffusion of sol-ute atoms in the crystal lattice. Subsequent hardeningis achieved by slow cooling from 723 K (450 °C) to523 I{ (250 °C) in 1.8 ks (30 min.) at a constant cool-ing rate, without referring to a critical temperature forphase transformation in each particular alloy. The hard-ening heat-treatment seems to be based on the factthat the critical temperature of the Type IV dental goldalloys usually exists between 723 and 523 K. However,the actual critical temperature for phase transformationvaries among the alloys, dependingupon their composition.
Moreover, the type of phase trans-formation is different at each tem-perature in an alloy. Microstructuresand mechanical properties are af-fected by the types and sequence ofthe phase transformations in the alloy.
For instance, Figure 1 representsa Time-Temperature-Transformation(T-T T) diagram in the Au-49.7at.-%Cu-15.8at.%Ag alloy, as determinedby X-ray and electron diffraction aswell as transmission electron micros-copy [1]. It is clear that the type of thephase transformation varies at tem-peratures above and below the criticaltemperature, T, a modulated struc-ture induced by spinodal decomposi-tion being formed in the initial stageof ageing throughout the temperature
range. The modulated structure grows into a 'tweed-like' structure which is composed of a l and a2 disor-dered phases, both fcc in structure, due to phase sepa-ration by further ageing above T.
While AuCull ordering is formed from a copper-rich portion in the modulated structure by ageingbelow T, the a2 disordered and AuCui long-pe-riod ordered phases are formed by prolonged ageingin the higher temperature range below T. The Cu3Auordering is also induced by ageing in the lower tem-perature range below T, and the a2 disordered, Cu3-Au and AuCui ordered phases are also formed bylengthy ageing in this temperature range.
In Figure 1, thick solid lines with shading indi-cate the locus of the maximum hardness values deter-mined by isothermal ageing. The dot-and-dash-lineshows the critical temperature for AuCui orderingin the alloy. The broken line represents the phaseboundary between the region where the three phasesAuCui, al and a2 coexist and the Cu3Au-AuCul -a2
three-phase region; it also shows the critical tempera-ture for Cu3Au ordering.
Another broken line with arrows represents thecooling curve of the hardening treatment prescribedin ADA specification No. 5 (slow cooling from 723 to523 I{ in 1.8 ks at a constant cooling rate).
ome. Gold Bull., 1993, 26 (2) 51

From Figure 1, it is clear that the sequence ofphase transformations is a complex process depend-ing upon ageing temperatures and times, even if theageing is performed at a constant temperature, be-cause the sequence of phase transformations in thisalloy involves dual mechanisms of ordering andphase separation. Spinodal decomposition is also at-tributed to the age-hardening in the initial stage of
— predict what phases are in equilibrium for selectedalloy compositions at required temperatures;
— determine the chemical composition of each phase;— calculate a volumetric ratio of each phase that is
formed in the alloy and— predict phase transformations which give rise to
changes in mechanica) and electrochemical prop-erties as welt as biological characteristics.
Figure 2
Isothermal section ofa plausible phase diagramof the Au-Cu-Ag ternasy system at 573 K
Ag
al+a220 80
AuCu II + a 2
1 40 t..' cfk 60 -.
> a2
60;' 40AuCu 1 + a 2
} s AuCu II + a 2
80 - 20
y ` ,
Cu 20 t 40 60 80 Au
ai / AuCu I Au in at.%
Cu 3Au [ AuCu II
ageing in the alloy [1, 2]. During slow cooling from723 to 523 K, the harderving occurs mainly byspinodal decomposition and to a lesser extent by Au-Cu H ordering. The spinodal decomposition, however,is thought to be an undesirable mechanism of age-hardening for dental gold alloys, because brittlenesswill be caused by the formation of a modulatedstructure.
Thus, several questions arise from the heat-treat-ment method prescribed in ADA specification No. 5as well as in the ISO specification for dental goldalloys. It is important, therefore, to precisely deter-mine the critical temperature of phase transforma-tions and to construct a phase diagram for each dentalgold alloy. Generally, a phase diagram gives us effec-tive information to enable us to:
Accordingly, the following research projects are beingconducted by our laboratory in the Nagasaki Uni-versity School of Dentistry:
— Construction of a coherent phase diagram for theAu-Cu-Ag ternary system.
— Phase transformations and the associated micros-tructural changes in Au-Cu-Ag ternary alloys.
— Age-hardening and the related phase transforma-tions in Au-Cu-Ag ternary alloys and commercialdental gold alloys.
— Interfacial configurations induced by phase trans-formation in Au-Cu-Ag ternary alloys.
This review article attempts to explain how to deter-mine the coherent phase diagram of a section in theAu-Cu-Ag ternary system on the basis of studies usingelectron microscopy.
52 (` Gold Bull., 1993, 26 (2)
,_' 573
473
ald
E
d 673
873
773
1Ag.:iCuae Au (at %)
Figure 4Theoretical coherent phase diagram of 'the
Aux-(Ago.24Cuo.76)1-x pseudobinary section in the Au-Cu-Agternary system
CONSTRUCTION OF A COHERENTPHASE DIAGRAM OF THE
AuX-(Ago.24Cuo.i6) ► -X SECTION IN THEAu-Cu-Ag TERNARY SYSTEM
According to the hypothesis of Allen and Cahn [3], acoherent phase must be metastable and, in the presenteof the incoherent phase, must be unstable; coherencystrain must also be present in the coherent multi-phasestructure, and dislocation must be visible at the inter-faces with the incoherent phase to reduce coherencystrain. Thus, it is thought that grain boundary productsare equilibrium incoherent phases, while phasesformed in the grain interior are metastable coherentphases. A coherent phase diagram, therefore, gives usmore effective information to predict phase transfor-mations related to age-hardening characteristics in analloy system than an incoherent phase diagram.
As the first step of our systematic study, a coher-ent phase diagram of the Au-(Ago.24Cuo.76) 1 -X sec-tion in the Au-Cu-Ag ternary system was examined
873
773
á}J 673roáE
573
473
0 20 40 60 80Ag.24CU 76
Au (at%)
Figure 3Experimental coherent phase diagram of the
Aux-(Ago.24Cuo.76)1-xpseudobinary section in theAu-Cu Ag ternary system
by means of transmission electron micros-copy (TEM) and selected area electron dif-fraction (SAED), since the compositionsof most commercial dental gold alloys arein a region close to the section as seen inFigure 2.
The experimental result obtained isshown in Figure 3 [4]. A theoretical coher-ent phase diagram of the same vertical sec-tion in the Au-Cu-Ag ternary system is alsorepresented in Figure 4, which is calculatedusing the cluster variation approximation byYamauchi [5]. Although there are slightdifferences between the locations of the ex-perimental and theoretical phase boundarylines, both coherent phase diagrams repre-sent a two-phase region which was formedby phase separation, ordering regions oftwo types, i.e. Cu3Au and AuCu orderedphases, and coexisting regions associatedwith these two or three phases. In the theo-retical coherent phase diagram, the long-period superstructure of the AuCuII phasecannot be distinguished from the AuCultetragonal superstructure, because all the
Gold Bull, 1993, 26 (2) 53
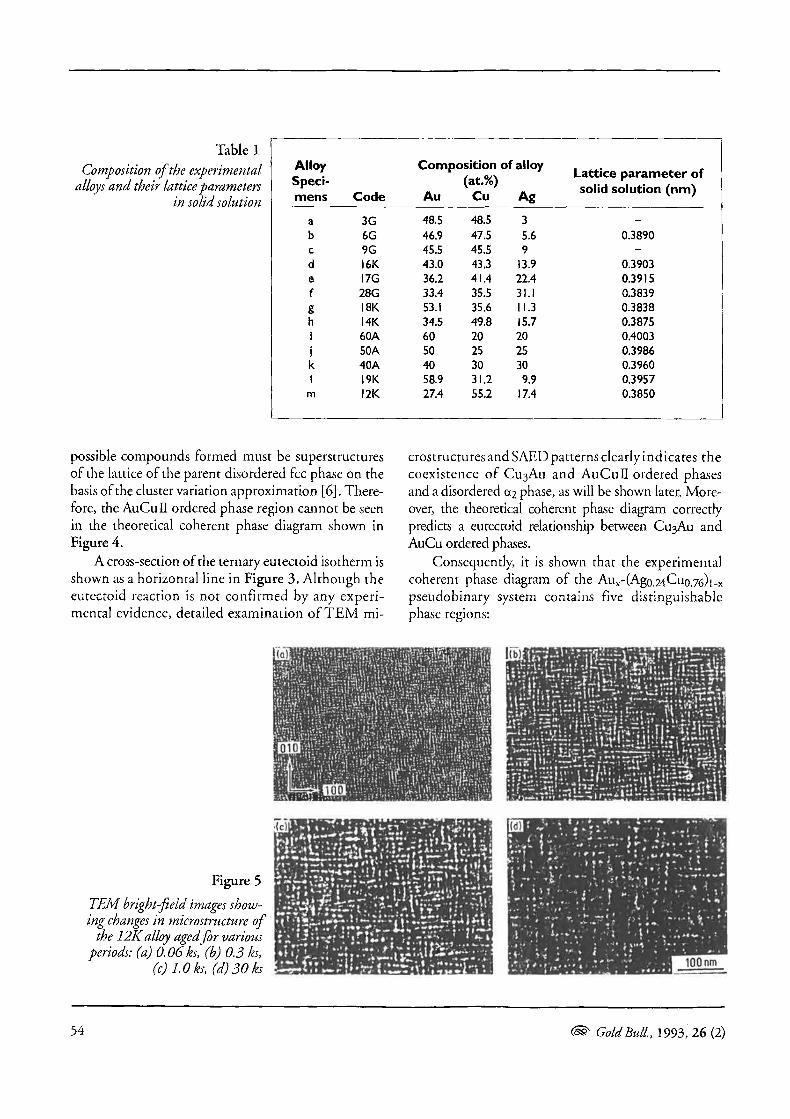
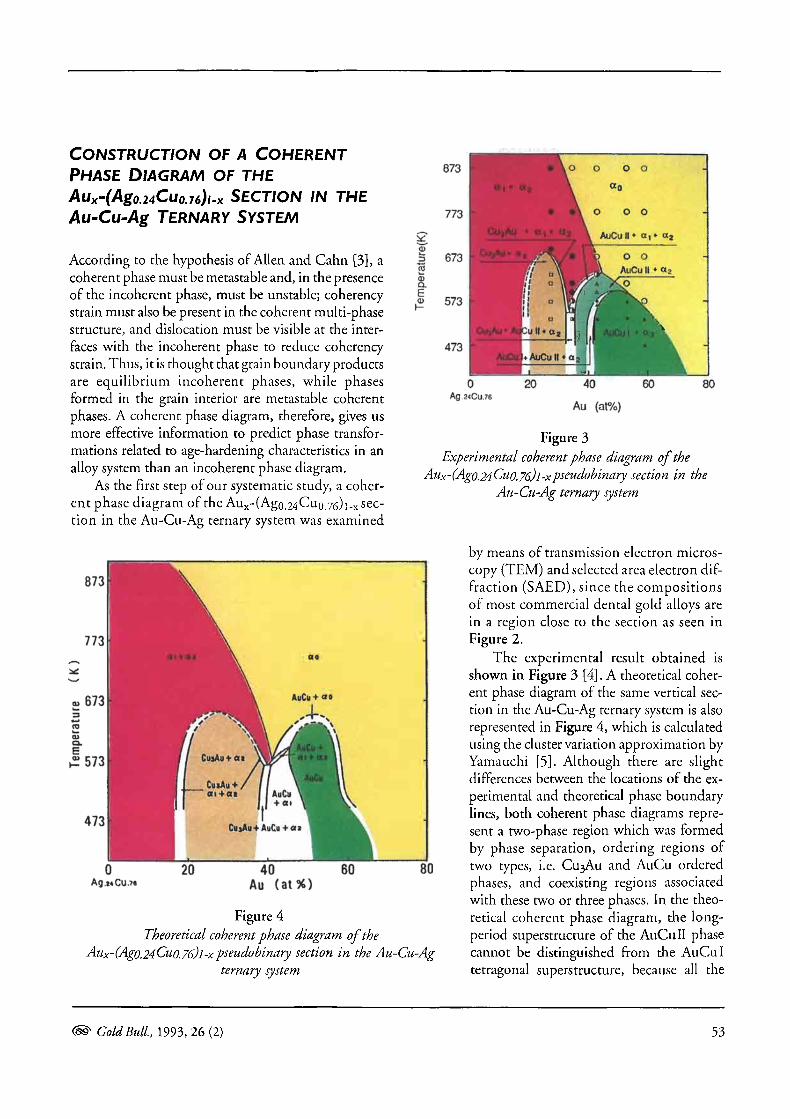
Table 1
Composition of the experimentalalloys and their lattice parameters
in solid solution
AlloySpeci-mens Code
Composition of alloy(at.%)
Au Cu Ag
Lattice parameter ofsolid solution (nm)
a 3G 48.5 48.5 3 -b 6G 46.9 47,5 5.6 0.3890c 9G 45.5 45,5 9 -d 16K 43.0 43.3 13.9 0.3903e 17G 36.2 41.4 22.4 0.3915f 28G 33.4 35.5 31.1 0.3839g 18K 53.1 35.6 11.3 0.3838h 14K 34.5 49.8 15.7 0.3875i 60A 60 20 20 0.4003i 50A 50 25 25 0.3986k 40A 40 30 30 0.3960
1 19K 58.9 31.2 9,9 0.3957m 12K 27.4 55.2 17.4 0.3850
possible compounds formed must be superstructuresof the lattice of the parent disordered fcc phase on thebasis of the cluster variation approximation [6]. There-fore, the AuCull ordered phase region cannot be seenin the theoretical coherent phase diagram shown inFigure 4.
A cross-section of the ternary eutectoid isotherm isshown as a horizontal line in Figure 3. Although theeutectoid reaction is not confirmed by any experi-mental evidence, detailed examination of TEM mi-
crostructuresandSAEDpatternsclearlyindicates thecoexistence of Cu3Au and AuCuil ordered phasesand a disordered a2 phase, as will be shown later. More-over, the theoretical coherent phase diagram correctlypredicts a eutectoid relationship between Cu3Au andAuCu ordered phases.
Consequently, it is shown that the experimentalcoherent phase diagram of the AuX - (Ag0.24Cu0.76)1 -X
pseudobinary system contains five distinguishablephase regions:
Figure 5
TEM bright-field images show-ing changes in microstructure of
the 12Kalloy aged for variousperiods: (a) 0.06 ks, (b) 0.3 ks,
(c)1.0 ks, (d) 30 ks
54 (' Gold Bull., 1993, 26 (2)

20
000 10000
200
Figure 6
Electron diffraction pattern and TEM micrographs of the 12Kalloy aged at 613 Kfor 30 ks; (a) [0 011 SAED pattern,
(b) the schematic representation of (a), (c) bright-field image,(d) 110 dark-field image
(1) a disordered solid solution region, a o (fcc);(2) a two-phase coexisting region, i.e. a1 (copper-rich
fcc phase) + a2 (silver-rich fcc phase);
(3) regions of coexistence of a disordered phase andan ordered phase, i.e. a2 + Cu3Au (L12), a2 + Au-CuI (L10);
(4) regions of coexistence of two disordered phases andan ordered phase, i.e. a l + aZ + Cu3Au and al + a2+ AuCuII and
(5) regions of coexistence of a disordered phase andtwo ordered phases, i.e. aZ + Cu3Au + AuCuiand a2 + AuCuI + AuCuII.
The microstructure of these regions exhibits differ-ent features due to types of phase transformationswhich depend on the composition of the alloys,ageing temperaturen and times. However, a similarityof microstructures was found, attributed to control-ling mechanisms of phase transformations in theinitial stage of ageing, i.e. the spinodal decomposi-tion or nucleation and growth mechanism. For ref-erence in the following sections, the codes and com-positions of the specimen alloys are listed with theirlattice parameters in solid solution in Table 1.
fundamental diffraction reflection and equivalent po-sitions during the initial stage of isothermal ageingat 613 K. With the progress of ageing, the side-bands moved closer to the 200 fundamental reflec-tions. These changes suggest the formation of a modu-lated structure resulting from spinodal decomposi-tion. The effect of ageing times at 613 Kon the modu-lated structure can be clearly seen in Figure 5, inwhich the average wavelength of the modulationincreases with progress of ageing; it is approximately6.7 nm and 13.7 nm in the specimens aged for 0.06and 30 ks, respectively [7}.
On ageing of the 12K alloy for 10 ks at 613 K,superlattice reflections appeared in the SAED pat-tern at the positions of the 100, 110 and equiva-lent positions though their intensity was extremelyweak. With increasing ageing time, the superlat-tice reflections became clearly visible with increasingintensity.
An SAED pattern for the 12K alloy aged at 613 Kfor 30 ks and its schematic representation are shown inFigures 6a and 6b, respectively. Appearance of thesuperlattice reflections at these positions suggests the
PHASE TRANSFORMATIONSAND RELATEDMICROSTRUCTUREIN Au-(Aga.24Cuo.r6),-,PSEUDOBINARY ALLOYS
Two-phase Regionof Coexisting Cu3Auand a2 Phases
Figure 5 shows bright-field TEM micro-graphs of the 12K alloy aged at 613 K forvarious times. The microstructures showthat modulation occurs along < 10 0 > f, di-rections, since side-bands appeared in theX-ray diffraction profile around the 200
Cis` Gold Bull., 1993, 26 (2) 55
d 002Y 022v 220z.220am
200k^2601.202k
020:
001y' A 021v
1102
° --èÖ 0C2x000 0Olx 020v
200z.200au
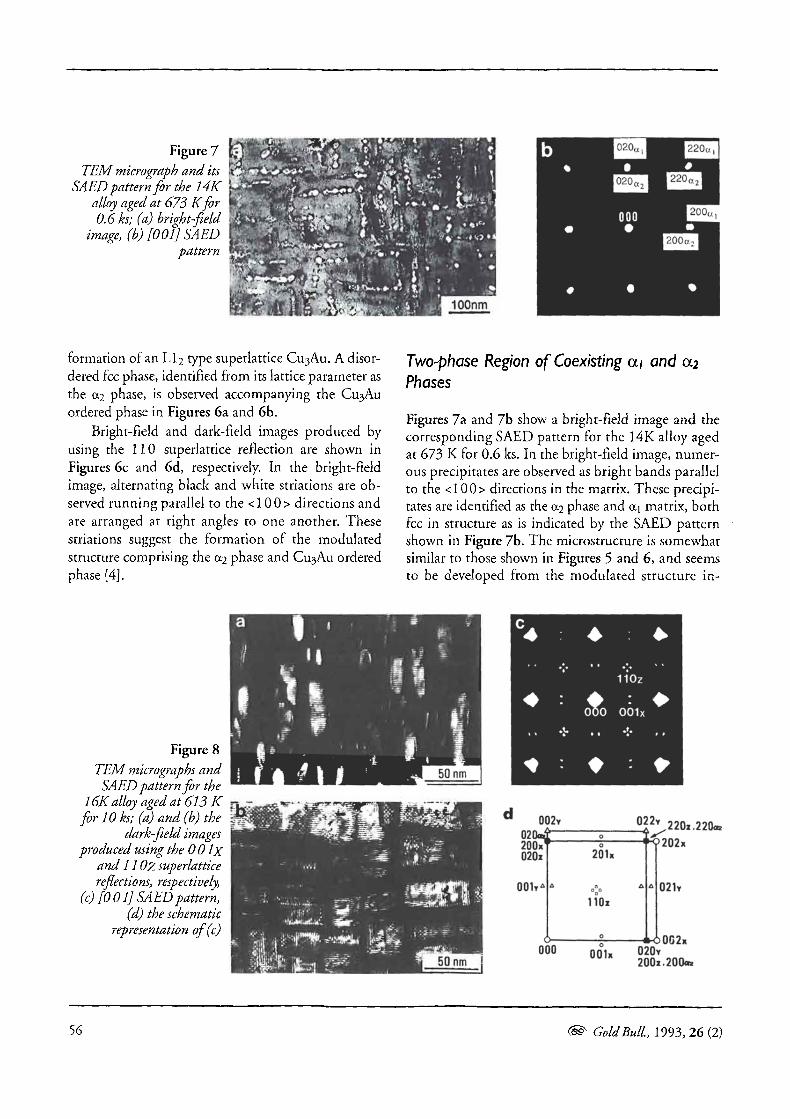
Figure 7TEM micrograph and its
SAED pattern for the 14Kalloy aged at 673 Kfor0.6ks,• (a) bright-field
image, (b) [001] SAEDpattern
formation of an L12 type superlattice Cu3Au. A disor-dered fcc phase, identified from its lattice parameter asthe a2 phase, is observed accompanying the Cu3Auordered phase in Figures 6a and 6b.
Bright-field and dark-field images produced byusing the 110 superlattice reflection are shown inFigures 6c and 6d, respectively. In the bright-fieldimage, alternating black and white striations are ob-served running parallel to the <100> directions andare arranged at right angles to one another. Thesestriations suggest the formation of the modulatedstructure comprising the a2 phase and Cu3Au orderedphase [4].
Twophase Region of Coexisting al and a2Phases
Figures 7a and 7b show a bright-field image and thecorresponding SAED pattern for the 14K alloy agedat 673 K for 0.6 ks. In the bright-field image, numer-ous precipitates are observed as bright bands parallelto the <100> directions in the matrix. These precipi-tates are identified as the a2 phase and a i matrix, bothfcc in structure as is indicated by the SAED patternshown in Figure 7b. The microstructure is somewhatsimilar to those shown in Figures 5 and 6, and seemsto be developed from the modulated structure in-
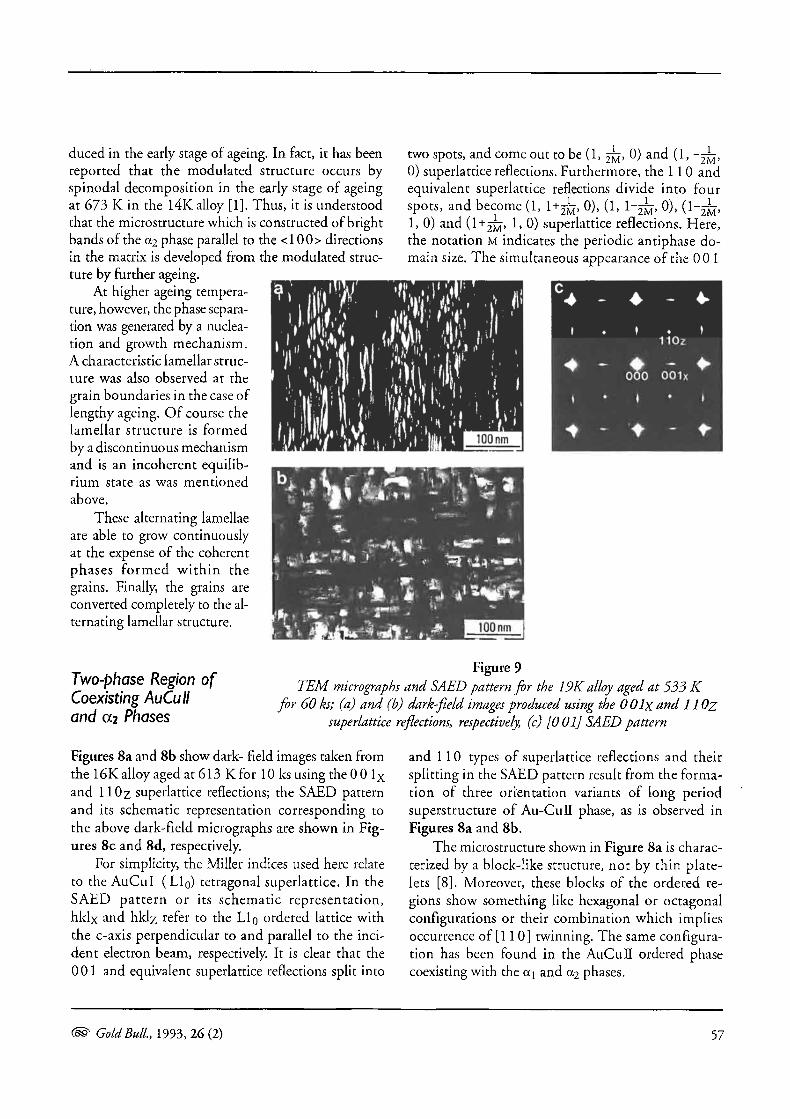
Figure 8TEM micrographs andSAED pattern for the
16K alloy aged at 613 Kfor 10 les; (a) and (b) the
dark f eld imagesproduced using the 001X
and 1102 superlatticereflections, respectively,
(c) [0 01] SAED pattern,(d) the schematic
representation of (c)
56 (' Gold Bull., 1993, 26 (2)
duced in the early stage of ageing. In fact, it has beenreported that the modulated structure occurs byspinodal decomposition in the early stage of ageingat 673 K in the 14K alloy [1]. Thus, it is understoodthat the microstructure which is constructed of brightbands of the a2 phase parallel to the <100> directionsin the matrix is developed from the modulated struc-ture by further ageing.
At higher ageing tempera-ture, however, the phase separa-tion was generated by a nuclea-tion and growth mechanism.A characteristic lamellar struc-ture was also observed at thegrain boundaries in the case oflengthy ageing. Of course thelamellar structure is formedby a discontinuous mechanismand is an incoherent equilib-rium state as was mentionedabove.
These alternating lamellaeare able to grow continuouslyat the expense of the coherentphases formed within thegrains. Finally, the grains areconverted completely to the al-ternating lamellar structure.
two spots, and come out to be (1, ZM, 0) and (1, --1-0) superlattice reflections. Furthermore, the 1 10 and
equivalent superlattice reflections divide into fourspots, and become (1, 1+y, 0), (1, 1-- , 0), (1 -zes,1, 0) and (1 +2M, 1, 0) superlattice reflections. Here,the notation u indicates the periodic antiphase do-main size. The simultaneous appearance of the 001
Two-phase Region ofCoexisting AuCu liand ai Phases
Figure 9TEM micrographs and SAED pattern for the 19K alloy aged at 533 K
for 60 ks; (a) and (b) dark-field images produced using the 0 01x and 1102superlattice reflections, respectively, (c) [0 01] SAED pattern
Figures 8a and 8b show dark- field images taken fromthe 16K alloy aged at 613 K for 10 ks using the 00 1 xand 1102 superlattice reflections; the SAED patternand its schematic representation corresponding tothe above dark-field micrographs are shown in Fig-ures 8c and 8d, respectively.
For simplicity, the Miller indices used here relateto the AuCul (L10) tetragonal superlattice. In theSAED pattern or its schematic representation,hklx and hklz refer to the L10 ordered lattice withthe c-axis perpendicular to and parallel to the inci-dent electron beam, respectively. It is clear that the001 and equivalent superlattice reflections split into
and 1 10 types of superlattice reflections and theirsplitting in the SAED pattern result from the forma-tion of three orientation variants of long periodsuperstructure of Au-Cull phase, as is observed inFigures 8a and 8b.
The microstructure shown in Figure 8a is charac-terized by a block-like structure, not by thin plate-Iets [8]. Moreover, these blocks of the ordered re-gions show something like hexagonal or octagonalconfigurations or their combination which impliesoccurrence of [110] twinning. The same configura-tion has been found in the AuCui ordered phasecoexisting with the a1 and a2 phases.
(w- " Gold Bull., 1993, 26 (2) 57

ne022v
220a,Figure 10
SAED pattern and TEMmicrographs for the 18Kalloy aged at 573 Kfor30 ks; (a) [001] SAED
pattern, (b) schematicrepresentation of (a),
(c) and (d) the dark-fieldimages produced using the
00]xand OOlysuperlattice reflections,
respectively, (e) theBark-field image produced
using the 2200,2
fundamental refleetion
002v
020x2 200x 201x020as
001r 021v
200ae020v
000 001X200
" 202x
002x
A configuration characteristic of the long periodantiphase domain boundary (LPAPB) structure ofthe AuCui phase is clearly visible in the dark-fieldmicrographs shown in Figures 8a and 8b. However,the 0,2 phase is indistinguishable fiom the AuCuiordered phase in the SAED pattern and the dark-field images because diffraction spots corresponding tothe oe2 phase appear at positions very close to thefundamental spots of the Z-variant of the AuCuIIordered phase in this temperature range as will bediscussed below.
Two-phase Region of Coexisting AuCu 1and 0,2 Phases
Figures 9a and 9b show dark-field images of the 19Kalloy aged at 533 IK for 60 ks using the 001x and11 Oz superlattice reflections, respectively. The SA-ED pattern shown in Figure 9c exhibits the simultane-ous presence of the 001X, 1 10Z and equivalent super-lattice reflections.
This indicates the formation of three orientationvariants of AuCuI ordered platelets on the matrix
58 ^^ Gold Bull., 1993, 26 (2)

d 020z 22Ox.200x.020ae 2202T 8- !9202x
110z
002x000 001x 200z
200a
Figure 11
TEM micrographs and SAED pattern for the 16K alloy aged at 563 Kfor30 ks; (a) and (b) dark field images produced using the 001x and 11 0z
superlattice reflections, respectively, (c) [001] SAED pattern, (d) schematicrepresentation of (c)
( 100} planes as was observed previously in the 18Kgold alloy [9], commercial dental gold alloy containingplatinum [10] or palladium [11, 12]. The a2 phase isindistinguishable from the Au-CuI ordered phase inthe SAED pattern for the reason mentioned above.If we can obtain an SAED pattern which does notinciude the 1 107 and equivalent superlattice reflec-tions, i.e. contains merely the X- and Y-variants ofAuCul ordered platelets, the diffraction spots corre-sponding to the a2 phase can be distinguished fromthe 200, 220 and equivalent fundamental reflec-tions in the Z-variant of AuCuI ordered platelets,because they never superimpose on each other dueto a slight difference in the lattice spacings.
Figures 10a and 10b show an SAED pattern andits schematic representation for the 18K alloy agedat 573 I< for 30 ks. The absence of the 110 and equi-valent superlattice reflections in the SAED patternindicates that only two out of three orientation vari-ants of AuCuI platelets are formed in this alloy; theformation of the Z-variant ofAuCu1 ordered plateletsis suppressed in the present case.Diffraction reflections corre-sponding to the a2 phase whichare designated 2 00 2 ,x 020 2xand 220a2 are distinguishablewith certainty from the funda-mental reflections for the Au-CuI ordered phase due to theabsence of the diffraction re-flections arising from the Z-vari-ant of the AuCuI ordered phaseas seen in Figures 10a and 10 b.
Dark-field images producedusing the OO lx and 00 l su-perlattice reflections are givenin Figures 10c and 10d, re-spectively. Figure 10e showsthe dark-field image formedby using the 220x, funda-mental reflection.
These microstructures sug-gest that alternating thin la-mellae are arranged in a step-wise fashion composed of Au-Cul ordered platelets and thea2 phase which are formed al-ternately on the {100} planes.
The configuration of the splitting in the diffractionspots in Figure 10a indicates that twinned lamellaeare formed to relieve strains induced by tetragonaldistortion.
Three-phase Region of Coexisting AuCu 1,AuCu 11 and a2 Phases
Figures lla and 11b are dark-field images of the 16Kalloy aged at 563 K for 30 ks produced by using the001x and 1102 superlattice reflections, respectively.An SAED pattern and its schematic representation areshown in Figures llc and lid. In the SAED pattern,there are found only two orientation variants of thesuperlattice reflections, i.e. 00 1X and 1 10z; the Y-variant of the superlattice reflection, 00ly, is notfound. Moreover, it is clear that these superlatticereflections consist of those from AuCul and AuCuilordered phases in the SAED pattern.
( ' Gold BulL, 1993, 26 (2) 59

The dark-field images are produced by inciudingthe splitting of the superlattice reflections in the aper-ture; therefore, we can observe two regions which aredistinguished by their contrast, i.e. a well developedLPAPB structure artributed to the AuCull ordered
superlattice reflections is not clearly visible in theSAED pattern, the dark-field image which is pro-duced using the 1 10 superlattice reflection representsthe characteristics of the LPAPB structure in the nar-row regions as is indicated by the arrow in Figure 12b.
Figure 12Electron and X-say difrraction
patterns and TEM micrographfor the 18K alloy aged at
593 K for 10 ks; (a) [001]SAED pattern, (b) dark-field
image produced using the 1102superlattice reflection, (c) X ray
diffraction pattern of the 110superlattice reflection and its
splitting
C n AuCu 1I' 110
AuCu 1I ` AuCu II1 1 M 0/l \\1 \1M°
30 32 3420
phase and an area of plain bright contrast arisingfrom the AuCul ordered phase. The a2 phase cannotbe distinguished from theAuCul andAuCull orderedphases because the diffraction reflections arising fromthe a2 phase are superimposed on the positions of thefundamental reflections corresponding to the Z-vari-ant of the AuCu1 and AuCull ordered phases. Fromcareful inspection of the dark-field images, it is clearthat the dark regions observed in Figure lla are nei-ther the Y variant ofAuCuI and AuCulI ordered phasesnor the Z-variant of these ordered phases. Moreover,the ordered phases are not formed in the present case.Thus, it is thought that the dark regions must corre-spond to the a2 phase.
A three-phase coexisting region is also observed inthe 18K alloy aged at 593 K for 10 ks, as seen in Fig-ure 12a. Although the cross-like splitting of the 1 10
This feature is also supported by the 110 superlat-tice reflection in the X-ray diffraction profile for the18K alloy aged at 593 K for 10 ks, as seen inFigure 12c. The diffraction reflections arising fromthe a2 phase are not visible in Figure 12a because thefundamental reflections of the Z-variant AuCuI andAuCuli ordered phases overlap the positions for the a2
phase.
Three-phase Region of Coexisting AuCu II,a i and a2 Phases
An SAED pattern taken from the 16K alloy aged at 633K for 300 ks is shown in Figure 13a. A schematicrepresentation of the SAED pattern is given in Fig-
60 C Gold Bull, 1993, 26 (2)

000 oQix °
ooi.
n O44v004v
ure 13 b, which includes fcc fundamental reflectionsup to 440 to indicate the separation of diffractionspots attributed to each phase generated by ageing.It is to be noted that there are reflections of 4 4 0 a 1 and440x2 in addition to those of 440X, 044y and 4402.Furthermore, superlattice reflections of the 00 l, 0 0 lyand 11 0z types are observed in the SAED pattern. Itis, therefore, concluded that the SAED pattern reveals thecoexistence of the three orientation variants of theAuCui ordered phase and the al and a2 fcc phases atthis temperature. LPAPB structure is observed clearlyin the dank-field images shown in Figures 13c and 13dwhich are produced using the 00 lx and 1 10Z super-lattice reflections, respectively.
Thus, a region with three coexisting phases, i.e. theal and a2 disordered fcc phases and the AuCull or-dered phase, is identifed within a narrow temperaturerange as seen in the coherent phase diagram (Fig. 3).There is found the hexagonal configuration of theordered regions in the dark-field image shown in Fig-ure 13c which is a configuration similar to that shownin Figure 8a. This hexagon of the ordered regions issurrounded by the t100} and ti 10} planes.
TheAuCu11 ordered phase which has a block-likeshape is formed on the { 10 0 } matrix planes. In Fig-ure 13c, only the {1 10} twin planes are found, sinceonly the ordered regions which have AuCui c-axisalternation in the sequence XYXY... out of the se-quences YZYZ... and ZXZX... are visible. Thus, itcan be deduced that the hexagonal configurations oftheAuCuII ordered region are formed due to the occur-rence of twinning to accommodate the tetragonalstrain induced during ordering.
Three-phase Region of Coexisting Cu3Au,AuCull and a2 Phases
This three-phase region is found in a narrow composi-tion range between the region of coexistence of Cu3Auand a2 and the region of coexistence of AuCui anda2 phases at a temperature below the ternary eu- tectoidisotherm, as seen in Figure 3.
Dark-field images of the 14K alloy aged at 533 Kfor 60 ks are shown in Figures 14a and 14b, obtained
Figure 13
SAED pattern and TEMmicrographs for the 16Kalloyagedat 633 Kfor300 ks;(a) [0 01] SAED pattere,(b)schermtic representation of(a), (c) and (d) dank-field imagesproduced using the 00lxand11 Oz superlattice reflections,respectively
C Gold Bull., 1993, 26 (2) 61
d 002, 020 022;,220020z 202)200x ?20:
001010
200002x
000 % 001x 020v100 200z.200a:
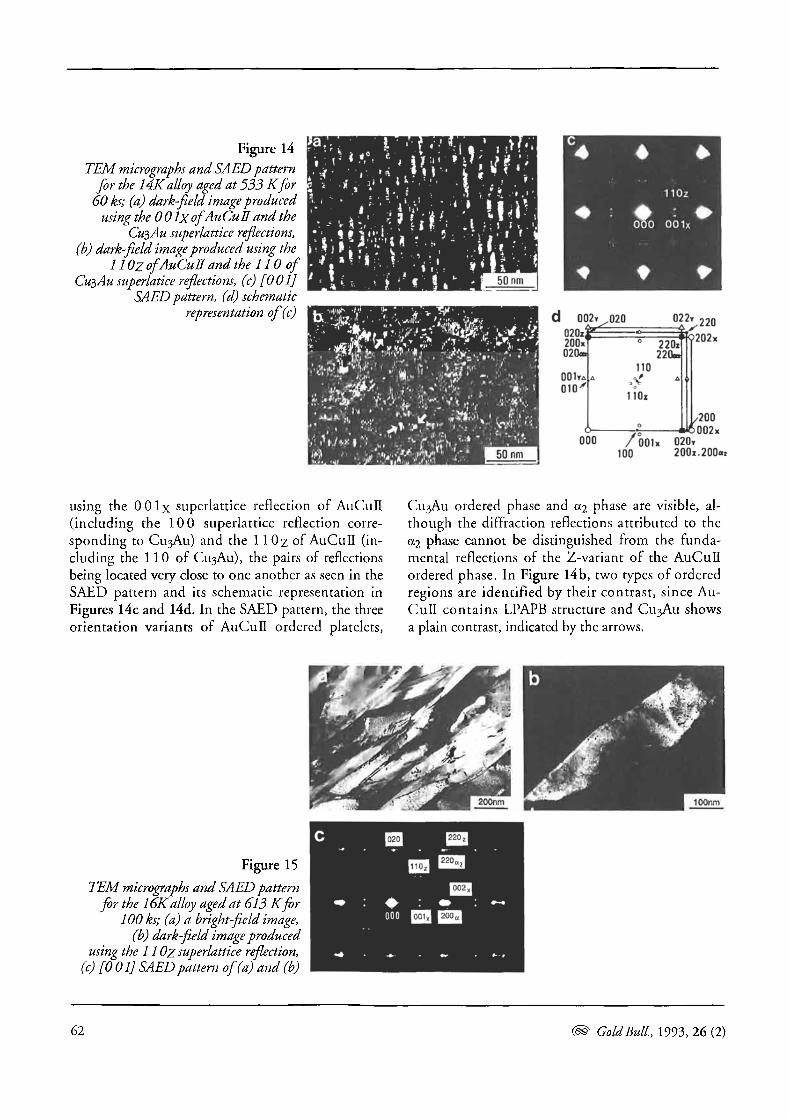
Figure 14TEM micrographs and SAED pattern
for the 14Kalloy aged at 533 Kfor60 ks; (a) dark-field image produced
using the 0 01X ofAuCu 11 and theCu3Au superlattice reflections,
(b) dark-field image produced using the11 OZ ofAuCul7 and the 110 of
Cu3Au superlatice reflections, (c) [001]SAED pattern, (d) schematic
representation of(e)
using the 00 1 x superlattice reflection of AuCui[(including the 10 0 superlattice reflection corre-sponding to Cu3Au) and the 110z of AuCuII (in-cluding the 1 10 of Cu3Au), the pairs of reflectionsbeing located very close to one another as seen in theSAED pattern and its schematic representation inFigures 14c and 14d. In the SAED pattern, the threeorientation variants of AuCui ordered platelets,
Cu3Au ordered phase and a. 2 phase are visible, al-though the diffraction reflections attributed to thea2 phase cannot be distinguished from the funda-mental reflections of the Z-variant of the AuCuiordered phase. In Figure 14b, two types of orderedregions are identified by their contrast, since Au-Cull contains LPAPB structure and Cu 3Au showsa plain contrast, indicated by the arrows.
Figure 15
TEM micrographs and SAED patternfor the 16Kalloy aged at 613 Kfor
100 ks; (a) a bright-field image,(b) dark-field image produced
using the 11 Oz superlattice reflection,(c) [0 01] SAED pattern of (a) and (b)
62 ro Gold Bull., 1993, 26 (2)

Three-phase Region of CoexistingCu3Au, ai and a2
Because this three-phase region was assumed to lie in anarrow composition range between the region of coex-isting Cu3Au ordered phases, a2 disordered phases andthe al, a2 disordered phases, no evidente could beobtained experimentally. Therefore, the phase bounda-ries are merely deduced from the theoretical coherentphase diagram shown in Figure 4.
electrochemical stability, i.e. corrosion or tarnishing,of the alloys. Therefore, microstructuren of several in-coherent phases will be described in this section.
Figures 15a and 15b show bright-field and dark-field images of the 16K alloy aged at 613 K for 100 ks.Coarse alternating lamellae which have smooth inter-faces and no strain contrast are observed to proceed intothe grains from the gram boundaries. The SAED pat-tern which is given in Figure 15 c shows that these lamel-lae are composed of the a2 disordered and AuCuII
Figure 16
TEM micrographs andSAED pattere for the12Kalloy aged at 633 K
for 30 ks; (a) a bright-field image, (b) dark fieldimage produced using the110 superlatticereflection, (c) [001]SAED pattere
Microstructures Formedby Incoherent Phases
During the course of a systematic TEM examinationto determine the coherent phase diagram of the Au X
(Ago.24Cuo.76)1_X section in the Au-Cu-Ag ternary sys-tem, grain boundary products were observed in severalcases. According to the hypothesis of Allen and Cahn[3], the gram boundary products are thought to be in-coherent phases. When we inquire into age-hardeningmechanisms in dental gold alloys as well as jewellerygold alloys, the incoherent phases have also to be takeninto consideration, because they have an undesirableeffect not only on mechanical properties but also on
ordered phases. It is thought that the AuCuU orderedphase is converted from the al copper-rich phase. Atypical LPAPB structure of AuCuH ordered phase isvisible in the dirk-field image produced using the1 10 z superlattice reflection. These lamellae are able togrow continuously at the expense of the coherentAuCull ordered phase formed within grains withlengthy ageing, as was observed in several commercialdental gold alloys [12]. The LPAPB structure formedwithin gram boundary products was also found in the12K alloy on ageing in the temperature range between623 and 633 K [13].
The gram boundary product which is constructedof alternating lamellae is observed in a bright-field
Gold Bull., 1993, 26 (2) 63

d ozo 220
020a1220x2 T01
•s. ..110
000 100 2O0«2
Figure 17TEM micrographs and
SAED pattern for the 12Kalloy aged at 633 Kfor
600 ks; (a) a bright-fieldimage, (b) dark-field
image produced using the110 superlattice reflection,(c) [0 01] SAED pattern,
(d) schematicrepresentation of (e)
micrograph of the 12K alloy aged at 633 K for 30 ksas seen in Figure 16a. The dark-field image producedusing the 110 superlattice reflection and the corre-sponding SAED pattern are shown in Figures 16b and16c, respectively. An arrangement of black stripeslined up in two mutually perpendicular directions,i.e. <100> directions, is found in Figure 16b.
Such configurations are thought to be antiphasedomain boundaries. In the Bark field image, the con-figurations of the central part and the peripheralregion of the lamellae are somewhat different. Theformer exhibits a labyrinth-like configuration, whilethe latter is a parallel arrangement of the antiphasedomain boundary although the labyrinth-like patternstill remains in this region.
As is deduced from the SAED pattern, the grainboundary product consists of the a l and a2 phases,both fee in structure and with lattice parameters0.378 nm and 0.408 nm, respectively. Superlattice re-flections are seen at the 100, 1 10 and equivalent posi-tions of the al phase, which is a copper-rich phase.Furthermore, it can be seen that the 100 and 110 typesuperlattice reflections are elongated in orthogonal di-rections, even if they are accompanied by diffusescattering. From the above observation, it is thoughtthat the labyrinth-like configuration corresponds to
the Cu3AuI or Z-variant of Cu3Aull; however, theycannot be distinguished from one another at this stageof ageing, and the parallel arrangement of the an-tiphase domain boundary represents the X- and Y-vari-ants of the Cu3AuII ordered phase. This situation isexplained by considering a model of the reciprocallattice which is constructed from three orientationvariants of the Cu3-AuII long period superlattice, i.e.directions perpendicular to periodicity, according toMarcinkowsl, y and Zwel! [14].
Much reliable evidence for the above can be seenin Figure 17 which is obtained from the 12K alloyaged at 633 K for 600 ks. The bright-field imageshown in Figure 17a represents a well-oriented lamel-lar structure of the grain boundary product. Figure17b shows the dark-field image produced by using the110 superlattice reflection including the associated sat-ellite reflections
An SAED pattern and its schematic representationare given in Figures 17c and 17d, respectively. In thedark-field image, we can observe that sets of parallelfringes abut on one another at right angles and thatin another region there are no periodic fringes. Theplain contrast regions are thought to be Cu3AuI or-dered regions. It should be noted that the spacingsof the periodic fringes are almost equal, different
64 (' Gold Bull., 1993, 26 (2)

from the labyrinth-lilce confguration. It seems thatthe Cu3AuI ordered regions are eaten away by theLPAPB structure.
The formation of LPAPB structure of orderedphase will be explained rationally by taking into con-sideration a coherent and an incoherent phase diagram.In the 12K alloy, X-ray and TEM studies have revealedthe following process of phase transformation duringisothermal ageing at 633 I< [7, 13]:
(1) appearance of the modulated structure resultingfrom spinodal decomposition in the early stage,occurrence of Cu3Au ordering from the copper-rich ai metastable phase after generation of phaseseparation within a graín by a continuous mecha-nism, and then
(2) formation of a lamellar structure consisting of thea i and az stable phase at the grain boundary bya discontinuous mechanism.
The process (1) takes place prior to the process (2) dur-ing isothermal ageing.
According to Allen and Cahn [3], coherent phasesmust be metastable and, in the presence of an inco-herent phase, unstable. Therefore, it can be supposedthat the process (1) corresponds to the coherent phasechange and the process (2) to the incoherent phasechange, because the coherent phases, i.e. ai, á2 disor-dered phases and the Cu3Au ordered phase formedwithin the grain, are indeed metastable, but are un-stable in the presence of the grain boundary productwhich consists of the al, az disordered and Cu3AuIIordered incoherent phases.
Figure 18a represents a plausible phase diagram ofthe Au-Cu-Ag isothermal section at 633 K obtained bysuperimposing the experimental data [4] on the theo-retical phase diagram [15], although some modifica-tion bas been made on the phase diagram. Figure 18bexhibits an enlargement of a portion of Figure 18a forgreater detail.
In the diagram, the solid and dashed Tines corre-spond to the coherent and incoherent isothermalsections, respectively, as well as the three-phase trian-gles. Although the spinodal locus is not shown in Fig-ure 18a, the first phase change, i.e. the process (1), isthe formation of the modulated structure resultingfrom the spinodal decomposition; the a2 and Cu3Auphases are formed subsequently by phase separation,as is observed in Figure 4. From Figure 18b, it can
Figure 18A plausible phase diagram of'the Au-Cu Ag ternary
system; (a) 633 K isothermal section of'thecoherent phase diagram (solid line) and the incoherent
phase diagram (dashed line), (b) enlargement of'apartof(a)
be seen that these changes are generated on the tie-line depicted within the coherent phase diagramwhich contains the metastable a2 and Cu3Au phases,and cannot run on due to the occurrence of the sub-sequent phase change, i.e. the process (2). When theprocess (2) is induced prior to the accomplishment ofthe process (1), the tie-line is located well inside a
Gold Bull., 1993, 26 (2) 65

narrow margin with the incoherent three-phase trian-gle which contains the stable a2, Cu3AuI and LPAPBstructure of Cu3Aul phases, as seen in Figure 18b.The observations indicate that the lamellar structureformed at grain boundaries consists of the a2, Cu3-Aul and Cu3Aull phases. Thus, it is rational to sup-pose that the LPAPB structure of Cu3-Aul is only gen-erated in the lamellar structure at the grain boundary.
CONCLUSIONS
To achieve control of the mechanical properties suchas strength, ductility, fracture toughness, and chemicalstability in dental gold alloys, it is most important tounderstand the correlation between microstructuralmorphology and phase transformation. A coherentphase diagram gives us effective information concern-ing phase transformations and related microstructuralfeatures for a given alloy.
This review article shows that a coherent phasediagram of the Aux-(Ago.24Cu0.76)l-,< section in the
Au-Cu-Ag ternary system may be constructed on thebasis of TEM observations of microstructural con-figurations and SAED analysis of crystal structuresinduced by phase transformations. The work describedwas based on results obtained mainly from the Depart-ment of Dental Materials Science, Nagasaki Univer-sity School of Dentistry. The coherent phase diagramsof other vertical sections in the Au-Cu-Ag ternarysystem are to be published elsewhere by the presentauthors in the near future.
ACKNOWLEDGEMENTS
The authors would like to thank the Japanese Ministryof Education, Science and Culture for its financialsupport by Grant-in-Aid for Scientific Research(62570880, 01460241) and Grant under the Mon-busho International Scientific Research Program,Joint-Research (63044111, 01044112).
REFERENCES
1. K. Yasuda and M. Ohta, 'Age-hardening in a 14 caratdental gold alloy', Proc. 3rd. Int. Precious Met. Conƒ,Chicago, IL., IPMI., 1979, 137-64.
2. K. Yasuda and M. Ohta, J Dent. Res., 1982, 61,473-79.
3. S. M. Allen and J.W. Cahn, Acta Metall., 1975, 23,1017-26.
4. M. Nakagawa and K. Yasuda, J. Less-Comm. Met.,1988, 138, 95-106.
5. H. Yamauchi, H.A. Yoshimatsu, A.R. Forouhi andD. de Fontaine, 'Phase relation in Cu-Ag-Au ternaryalloys', R.Q. McGachie and A.G. Brandley Eds.Precious Metals, Pergamon, Toronto, 1980, 241-49.
6. R. Kikuchi, J.M. Sanchez, D. de Fontaine andH. Yainauchi, Acta Metall., 28 1980, 651-662,
7. M. Nakagawa and K. Yasuda, J. Mater. Sci.,1988, 23,2975-82.
8. K. Hisatsune, K-I. Udoh, B.I. Sosrosoedirjo,T. Tani and K. Yasuda, J Alloys Comp.,1991, 176,269-83.
9. Y. Kanzawa, K. Yasuda and H. Metahi, J. Less-Comm.Met., 1975, 43, 121-28.
10. K. Yasuda and M. Ohta, J. Less-Conirn. Met., 1980,70, 75-87.
11. K. Yasuda, K. Udoh, K. Hisatsune and M. Ohta,Dent. Mater. J., 1983, 2, 48-58.
12. K-1. Udoh, K. Hisatsune, K. Yasuda and M. Ohta,Dent. Mater. J., 1984, 3,253-61.
13. M. Nakagawa and K. Yasuda, Phys. stat. sol. (a),1988, 107, 709-17.
14. M.J. Marcinkowsky and L. Zwelt, Acta Metall., 1963,11,373-90.
15. A. Prince, G.V. Raynor and D.S. Evans, 1'haseDiagrams of Ternary GoldAlloys, Inst. Metals,London, 1990, 7-42.
66 ( ' Gold Bull., 1993, 26 (2)