Using an RTI Framework to Ensure Success MESPA Presentation February 7, 2013.

RTI Rating Data Analysis Series: Overview of Results and Trends
28 September 2013

-‐ 1 -‐
Introduction1 The RTI Rating, developed by Access Info Europe (AIE)2 and the Centre for Law and Democracy (CLD),3 is a methodology which provides a numerical assessment or rating for the overall legal framework for the right to information (RTI) in a country, based on how well that framework gives effect to the right to access information held by public authorities. The methodology was first launched on International Right to Know Day, 28 September, in 2010, and comprehensive ratings of national RTI laws were provided in 2011 and then updated in 2012 and 2013. The RTI Rating Data Analysis Series currently being launched is a series of reports which will provided detailed assessments of the RTI Rating results, with each report probing into different patterns and trends embedded in the data, for example in terms of constitutional protection of RTI, scope of RTI laws, procedural rules and so on. This Report, the first in the Series, provides an overview of the key general results and trends regarding RTI legislation. The RTI Rating is a set of best practice standards, resulting in a stringent assessment of legal frameworks based on the highest international and comparative standards. A perfect legal framework would score 150 points. However, no legal framework in the world is perfect, and even the model laws AIE and CLD have rated have fallen just short of a perfect score.4 At the same time, it is possible to achieve a very strong score. Serbia currently has 135 points, or a score of 90 percent, while India and Slovenia have 130 points (87 percent), demonstrating that very high values are possible. The RTI Rating is limited to measuring the legal framework and does not measure the quality of implementation. Even relatively strong laws cannot ensure openness 1 This Report was drafted by Toby Mendel, Executive Director, Centre for Law and Democracy. This work is licensed under the Creative Commons Attribution-‐NonCommercial-‐ShareAlike 3.0 Unported Licence. You are free to copy, distribute and display this work and to make derivative works, provided you: 1) Give credit to Access Info Europe and the Centre for Law and Democracy; 2) Do not use this work for commercial purposes; and 3) Distribute any works derived from this publication under a licence identical to this one. 2 Access Info Europe is a human rights organisation dedicated to promoting and protecting the right of access to information in Europe as a tool for defending civil liberties and human rights, for facilitating public participation in decision-‐making and for holding governments accountable. Access Info's mission is that the right of access to information be enshrined in law and work in practice. 3 The Centre for Law and Democracy is an international human rights organisation based in Canada which focuses on promoting foundational rights for democracy, including the right to information, freedom of expression, the right to participate and the rights to freedom of association and assembly. For more information see: www.law-‐democracy.org. 4 These include the Model Inter-American Law on Access to Information and the (then draft) Model Law on Access to Information for Africa. See: http://www.law-‐democracy.org/live/rti-‐rating-‐examines-‐international-‐rti-‐frameworks/.

-‐ 2 -‐
if they are not implemented properly while, in a small number of cases, countries with relatively weak laws may nonetheless be very open, due to superlative implementation efforts. At the same time, and regardless of these outlying success stories, experience around the world provides ample evidence that a strong legal framework is the backbone of a good RTI system. Much attention is naturally directed to the overall scores which are attained by different countries, and their position vis-‐à-‐vis other countries, given how high profile this is. The real value of the RTI Rating, however, is that it pinpoints precise strengths and weaknesses in the legal framework, directing attention to those areas where it is needed. Indeed, the central idea behind the RTI Rating is to provide RTI advocates, reformers, legislators and others with a reliable tool for assessing the very specific ways in which the legal framework, or often the draft legal framework, for RTI in their country could be improved. In practice, the RTI Rating has proven to be extremely useful in helping to create stronger RTI laws. To give just a couple of examples of this, the Rating has consistently been referred to by campaigners, the media and legislative drafters in Pakistan – at both the national and provincial levels – as they seek to improve the legal frameworks for RTI in that country. It was relied on extensively by the government of Khyber Pakhtunkhwa province to improve that province’s draft RTI law and, as a result, the law which was finally adopted now ranks among the best anywhere in the world. In the Philippines, campaigners used the RTI Rating to identify a number of less controversial areas for improvement in their draft law. These were accepted by lawmakers and incorporated into the version of the draft which was agreed between the Senate and Congress. Unfortunately, the draft narrowly failed to go through all of the steps required to become a law, but the impact of the RTI Rating on the process was evident. The RTI Rating is one of a number of attempts to assess the quality of access to information systems. Many of these have consisted of comparative testing exercises, which seek to assess the quality of access in practice by posing a standard set of requests for information in different countries and then comparing the results.5 In other cases, RTI has been incorporated as one element in wider methodologies for assessing governance. The RTI Rating is unique, however, inasmuch as it is a scientific tool for assessing the legal framework for RTI, and inasmuch as it has been applied universally (i.e. to every country that has an RTI law).
5 For example, CLD and AIE, in collaboration with the International Budget Partnership, conducted a comparative requesting exercise by posing six requests for budget information in 80 different countries. See: http://www.law-‐democracy.org/live/global-‐monitoring-‐finds-‐widespread-‐violations-‐of-‐right-‐to-‐information/.
-‐ 3 -‐
This Report starts with a description of the RTI methodology, so that readers can understand exactly how the RTI Rating works. It then goes on to provide a general overview of the results of the latest RTI Rating (i.e. from September 2013), looking at the range of scores across the Rating, and where the legal frameworks around the world generally perform better and worse. An analysis of trends over time is then provided, looking at the dramatic spread of RTI laws over the last 20 years, where this has taken place and how average scores have improved over time. Finally, the Report provides a regional overview of how countries perform on the RTI Rating, looking at which regions have the strongest laws, and where different regions generally do better and worse in terms of meeting international standards in this area.
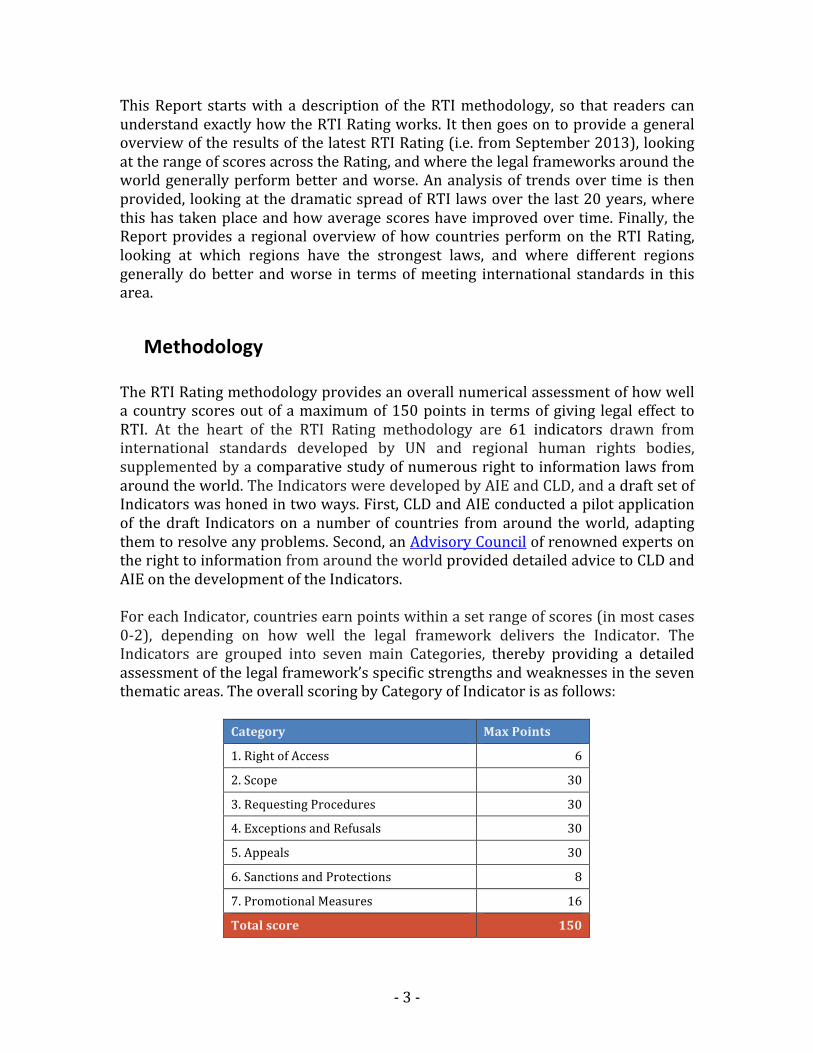
Methodology The RTI Rating methodology provides an overall numerical assessment of how well a country scores out of a maximum of 150 points in terms of giving legal effect to RTI. At the heart of the RTI Rating methodology are 61 indicators drawn from international standards developed by UN and regional human rights bodies, supplemented by a comparative study of numerous right to information laws from around the world. The Indicators were developed by AIE and CLD, and a draft set of Indicators was honed in two ways. First, CLD and AIE conducted a pilot application of the draft Indicators on a number of countries from around the world, adapting them to resolve any problems. Second, an Advisory Council of renowned experts on the right to information from around the world provided detailed advice to CLD and AIE on the development of the Indicators. For each Indicator, countries earn points within a set range of scores (in most cases 0-‐2), depending on how well the legal framework delivers the Indicator. The Indicators are grouped into seven main Categories, thereby providing a detailed assessment of the legal framework’s specific strengths and weaknesses in the seven thematic areas. The overall scoring by Category of Indicator is as follows:
Category Max Points
1. Right of Access 6
2. Scope 30
3. Requesting Procedures 30
4. Exceptions and Refusals 30
5. Appeals 30
6. Sanctions and Protections 8
7. Promotional Measures 16
Total score 150

-‐ 4 -‐
The four central features of an RTI system – Scope, Requesting Procedures, Exceptions and Refusals, and Appeals – are given an equal weighting of 30 points, while the other three features are given less weight so that overall the Indicators establish a balance of weighting among the different legal features required to ensure respect for RTI. The methodology also includes a detailed set of scoring rules, which indicate how points are allocated under each Indicator. This ensures that the allocation of points is consistent across different countries. The original assessments were done by researchers at CLD and AIE, with each researcher conducting blind comparative assessments on countries done by other researchers, to ensure standardisation. To check these assessments, and to ensure that the wider legal context was taken into account, local RTI experts were asked to review and comment on the original assessments, and these comments were then integrated into the scoring.
General Overview of results As of September 2013, 95 countries, from all regions of the world, had adopted national RTI laws.6 Perhaps surprisingly, Serbia tops the list with 135 points, followed by India and Slovenia, each with 130. Looking up from the bottom, we find Austria, with just 37 points, followed by Liechtenstein with 42 points and Tajikistan with 51 points. Overall, the results demonstrate that there is vast room for improvement. The results fall into a rough bell curve, as indicated in Table 1 and Figure 1 below. Table 1 shows the number of countries falling into three equal (tercile) score ranges (cropped to remove the as yet unattained bottom and top score ranges), while Figure 1 shows the number of countries by 10-‐point score ranges.
Table 1: Results Divided into Tercile Score Ranges
Score Range Number of Countries 37-‐69 24 70-‐102 49 102-‐135 22
As demonstrated in Table 1, almost exactly one-‐half of the countries scored in the middle tercile, between 70 and 102 points out of 150, with about one-‐quarter in each of the top and bottom terciles. Looked at differently, this means that three-‐quarters of all countries received less than two-‐thirds (66 percent) of the total
6 The RTI Rating has not yet done a comprehensive assessment of sub-‐national (i.e. state or provincial level) laws, of which there are 100s around the world in federal States like India, Mexico and the United States.
-‐ 5 -‐
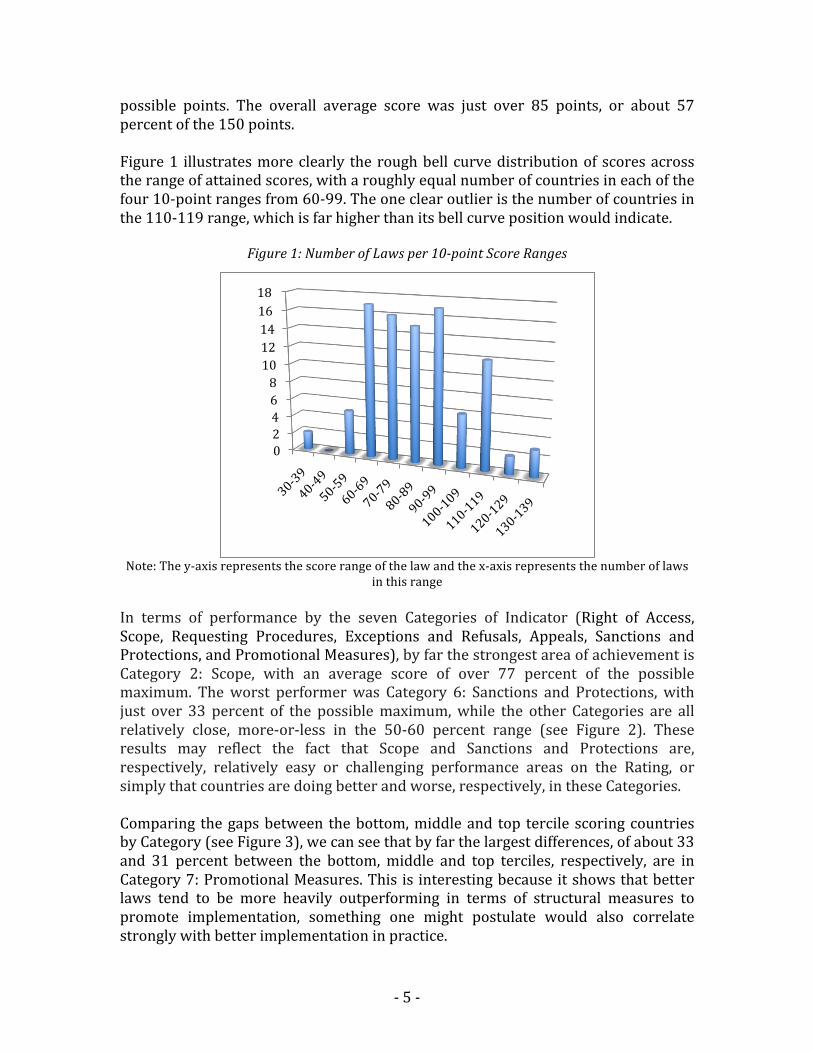
possible points. The overall average score was just over 85 points, or about 57 percent of the 150 points. Figure 1 illustrates more clearly the rough bell curve distribution of scores across the range of attained scores, with a roughly equal number of countries in each of the four 10-‐point ranges from 60-‐99. The one clear outlier is the number of countries in the 110-‐119 range, which is far higher than its bell curve position would indicate.
Figure 1: Number of Laws per 10-point Score Ranges
Note: The y-‐axis represents the score range of the law and the x-‐axis represents the number of laws
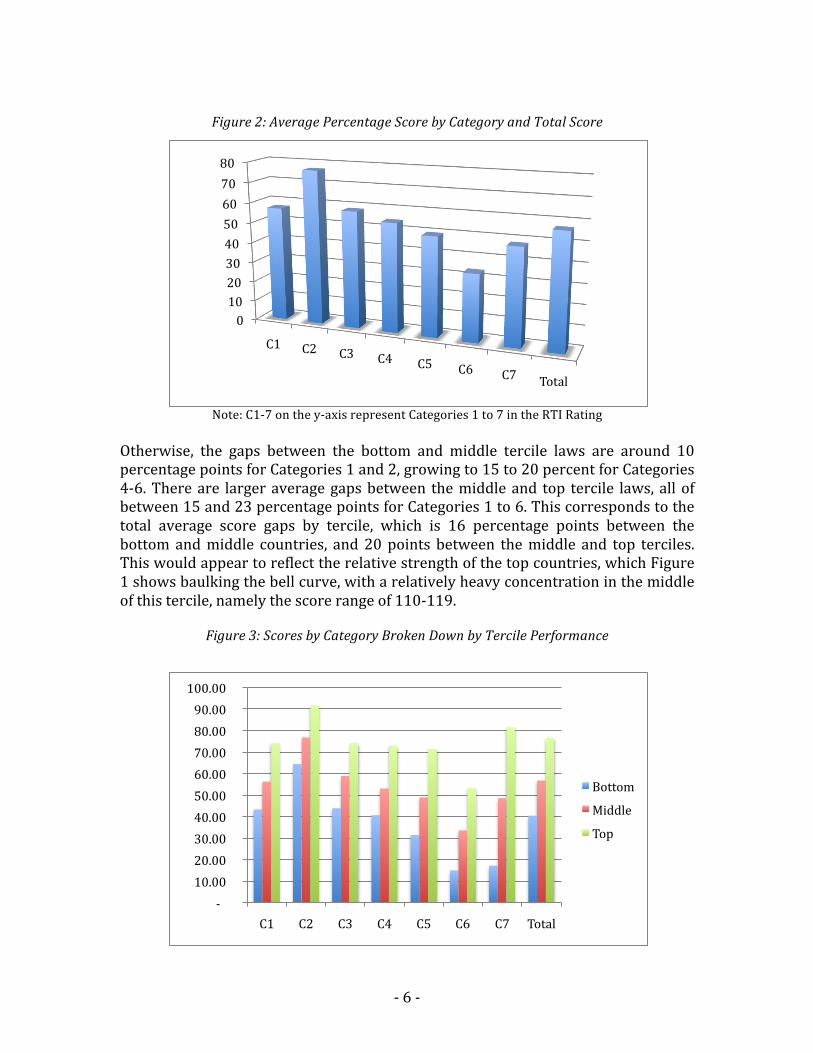
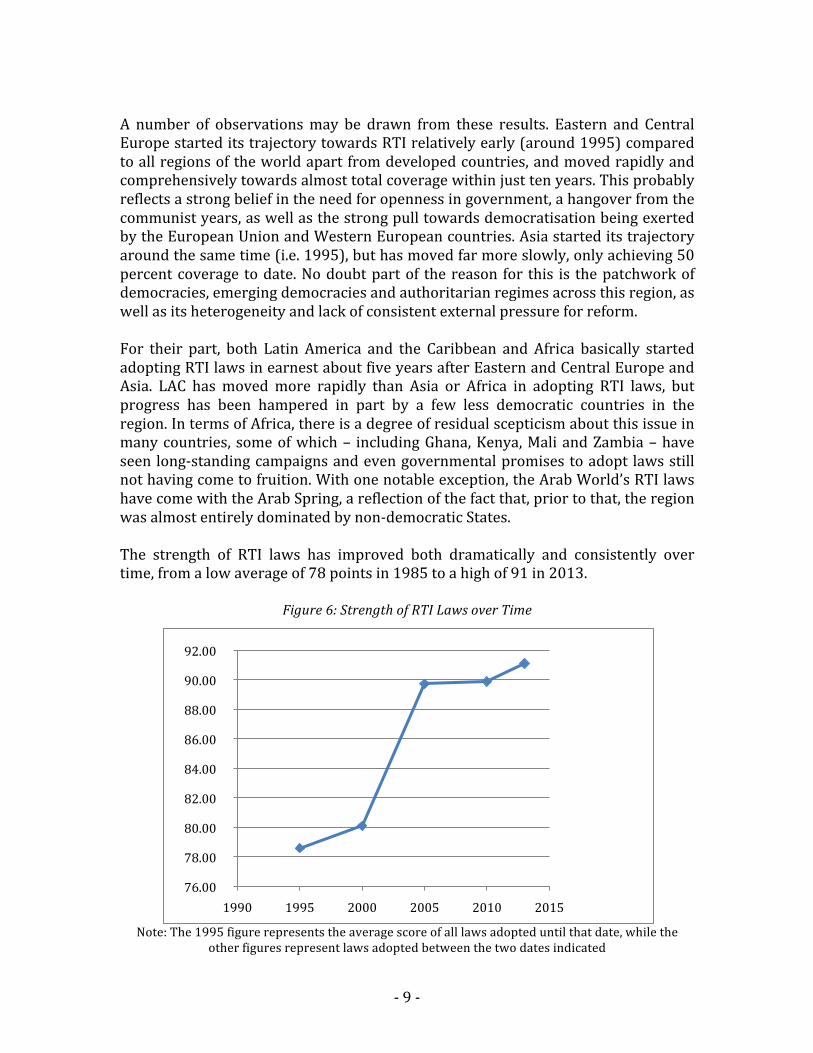
in this range In terms of performance by the seven Categories of Indicator (Right of Access, Scope, Requesting Procedures, Exceptions and Refusals, Appeals, Sanctions and Protections, and Promotional Measures), by far the strongest area of achievement is Category 2: Scope, with an average score of over 77 percent of the possible maximum. The worst performer was Category 6: Sanctions and Protections, with just over 33 percent of the possible maximum, while the other Categories are all relatively close, more-‐or-‐less in the 50-‐60 percent range (see Figure 2). These results may reflect the fact that Scope and Sanctions and Protections are, respectively, relatively easy or challenging performance areas on the Rating, or simply that countries are doing better and worse, respectively, in these Categories. Comparing the gaps between the bottom, middle and top tercile scoring countries by Category (see Figure 3), we can see that by far the largest differences, of about 33 and 31 percent between the bottom, middle and top terciles, respectively, are in Category 7: Promotional Measures. This is interesting because it shows that better laws tend to be more heavily outperforming in terms of structural measures to promote implementation, something one might postulate would also correlate strongly with better implementation in practice.
0 2 4 6 8 10 12 14 16 18
-‐ 6 -‐
Figure 2: Average Percentage Score by Category and Total Score
Note: C1-‐7 on the y-‐axis represent Categories 1 to 7 in the RTI Rating
Otherwise, the gaps between the bottom and middle tercile laws are around 10 percentage points for Categories 1 and 2, growing to 15 to 20 percent for Categories 4-‐6. There are larger average gaps between the middle and top tercile laws, all of between 15 and 23 percentage points for Categories 1 to 6. This corresponds to the total average score gaps by tercile, which is 16 percentage points between the bottom and middle countries, and 20 points between the middle and top terciles. This would appear to reflect the relative strength of the top countries, which Figure 1 shows baulking the bell curve, with a relatively heavy concentration in the middle of this tercile, namely the score range of 110-‐119.
Figure 3: Scores by Category Broken Down by Tercile Performance
0 10 20 30 40 50 60 70 80
C1 C2 C3 C4 C5 C6 C7 Total
-‐ 10.00 20.00 30.00 40.00 50.00 60.00 70.00 80.00 90.00 100.00
C1 C2 C3 C4 C5 C6 C7 Total
Bottom
Middle
Top

-‐ 7 -‐
RTI and Date of Adoption7 As Figure 4 shows, the rate of adoption of new RTI laws was slow and relatively steady between around 1980 and 1998, after which the curve increases dramatically and holds more-‐or-‐less steady until the present day.8
Figure 4: Growth in Number of RTI Laws over Time
Figure 5 shows the distribution of this growth by region. Until 1995, almost all of the (relatively slow) growth could be attributed to developed countries, with only five laws cumulatively having been adopted in all five other regions of the world by that date. For the next ten years, nearly one-‐half of all new laws came from East and Central Europe, with 19 new laws, with the other half largely being shared between Latin American and the Caribbean (LAC) and Asia (ten and nine new laws, respectively), and four laws being adopted in Sub-‐Saharan Africa. By 2005, almost all European countries had laws, and growth in the eight years since then has been concentrated in Latin America and the Caribbean (eight), Asia (seven) and Africa (six), with all three of the laws in the Arab World also being adopted during this period.
7 Some of the material in this section is drawn from an upcoming World Bank publication authored by Toby Mendel of the Centre for Law and Democracy, Historical Spread of Right to Information (RTI) Legislation. 8 Note that the apparently sloping off of the curve at the end is not representative since the gap there is of just one year, as opposed to two years for each of the other graph points.
0 10 20 30 40 50 60 70 80 90 100

-‐ 8 -‐
Figure 5: Growth in Number of RTI Laws over Time and by Region
In terms of scope of regional coverage, Table 2 shows the number of countries which have adopted RTI laws by region.
Table 2: RTI Laws by Region9
Regions Number of Laws
Eastern and Central Europe 24 Developed Countries 22 Latin America and Caribbean 20 Asia and Pacific 16 Sub-‐Saharan Africa 10 Arab World 3 Total 95
Both developed countries and Eastern and Central Europe are largely covered by RTI laws, with a few notable exceptions, such as Spain in the former and Belarus in the latter. Only one of the island States in the Pacific – Cook Islands – has an RTI law, and less than one-‐half of the Caribbean Islands have laws, which is probably mainly a reflection of the special challenges facing these mostly very small population countries. Otherwise, roughly two-‐thirds of the countries of Latin America have adopted RTI laws, along with about one-‐half of the countries in Asia. The rate drops off sharply for Sub-‐Saharan Africa and the Arab World, each of which has only about 20 percent coverage. 9 For purposes of these numbers, Israel and Central Asia are counted as part of Asia, while Turkey is counted as part of Eastern Europe. The term ‘Developed Countries’ is perhaps a misnomer in the modern world, but this group is comprised of Western European countries along with Australia, Canada, New Zealand and the United States.
0
5
10
15
20
25
30
1980 1985 1990 1995 2000 2005 2010 2013
Developed
E Europe
LAC
Asia
Africa
Arab
-‐ 9 -‐
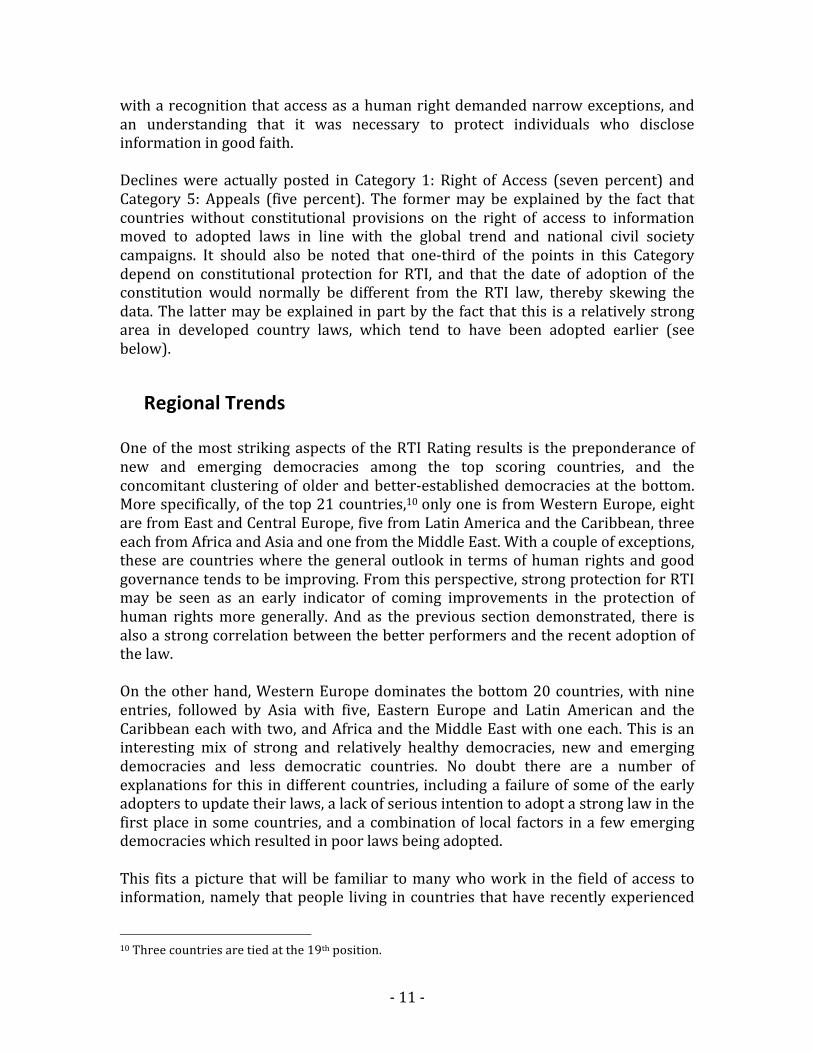
A number of observations may be drawn from these results. Eastern and Central Europe started its trajectory towards RTI relatively early (around 1995) compared to all regions of the world apart from developed countries, and moved rapidly and comprehensively towards almost total coverage within just ten years. This probably reflects a strong belief in the need for openness in government, a hangover from the communist years, as well as the strong pull towards democratisation being exerted by the European Union and Western European countries. Asia started its trajectory around the same time (i.e. 1995), but has moved far more slowly, only achieving 50 percent coverage to date. No doubt part of the reason for this is the patchwork of democracies, emerging democracies and authoritarian regimes across this region, as well as its heterogeneity and lack of consistent external pressure for reform. For their part, both Latin America and the Caribbean and Africa basically started adopting RTI laws in earnest about five years after Eastern and Central Europe and Asia. LAC has moved more rapidly than Asia or Africa in adopting RTI laws, but progress has been hampered in part by a few less democratic countries in the region. In terms of Africa, there is a degree of residual scepticism about this issue in many countries, some of which – including Ghana, Kenya, Mali and Zambia – have seen long-‐standing campaigns and even governmental promises to adopt laws still not having come to fruition. With one notable exception, the Arab World’s RTI laws have come with the Arab Spring, a reflection of the fact that, prior to that, the region was almost entirely dominated by non-‐democratic States. The strength of RTI laws has improved both dramatically and consistently over time, from a low average of 78 points in 1985 to a high of 91 in 2013.
Figure 6: Strength of RTI Laws over Time
Note: The 1995 figure represents the average score of all laws adopted until that date, while the
other figures represent laws adopted between the two dates indicated
76.00
78.00
80.00
82.00
84.00
86.00
88.00
90.00
92.00
1990 1995 2000 2005 2010 2015

-‐ 10 -‐
This is certainly a very significant progression but, at the same time, it should not necessarily be very surprising, since standards on the right to information – both international and in terms of better comparative practice – are continuously evolving. Laws that were drafted more recently have had the advantages of learning from the mistakes or failures of laws that were written earlier and of being able to reference clear international standards in this area. Furthermore, the years since 1995 have seen the emergence of increasingly powerful both civil society networks and international community advocacy in favour of strong RTI laws, which have facilitated the sharing of information about better practice and international standards, and also created pressure for positive law reform. Figure 7 shows the change in strength of RTI laws over time, broken down by RTI Rating Category. By far the most dramatic increase has come in Category 7: Promotional Measures, which had by 2013 increased by 73 percent over its 1995 starting point, despite a small drop between 2010 and 2013. This might be explained by the growing recognition of the importance of making the implementation of promotional measures legally binding, since otherwise early enthusiasm might give way to declining effort. Other strong increases were posted in Category 2: Scope (25 percent), despite an already strong starting position in 1995, Category 4: Exceptions (21 percent) and Category 6: Sanctions and Protections (25 percent). Some possible explanations for this might be the growing recognition of the need for all branches of government to be covered by RTI laws, an issue on which earlier laws tended to be weak, better understanding of what information really does need to be kept confidential, along
Figure 7: Strength of RTI Laws over Time, by Category
-‐
10.00
20.00
30.00
40.00
50.00
60.00
70.00
80.00
90.00
C1 C2 C3 C4 C5 C6 C7
1995
2000
2005
2010
2013
-‐ 11 -‐
with a recognition that access as a human right demanded narrow exceptions, and an understanding that it was necessary to protect individuals who disclose information in good faith. Declines were actually posted in Category 1: Right of Access (seven percent) and Category 5: Appeals (five percent). The former may be explained by the fact that countries without constitutional provisions on the right of access to information moved to adopted laws in line with the global trend and national civil society campaigns. It should also be noted that one-‐third of the points in this Category depend on constitutional protection for RTI, and that the date of adoption of the constitution would normally be different from the RTI law, thereby skewing the data. The latter may be explained in part by the fact that this is a relatively strong area in developed country laws, which tend to have been adopted earlier (see below).
Regional Trends One of the most striking aspects of the RTI Rating results is the preponderance of new and emerging democracies among the top scoring countries, and the concomitant clustering of older and better-‐established democracies at the bottom. More specifically, of the top 21 countries,10 only one is from Western Europe, eight are from East and Central Europe, five from Latin America and the Caribbean, three each from Africa and Asia and one from the Middle East. With a couple of exceptions, these are countries where the general outlook in terms of human rights and good governance tends to be improving. From this perspective, strong protection for RTI may be seen as an early indicator of coming improvements in the protection of human rights more generally. And as the previous section demonstrated, there is also a strong correlation between the better performers and the recent adoption of the law. On the other hand, Western Europe dominates the bottom 20 countries, with nine entries, followed by Asia with five, Eastern Europe and Latin American and the Caribbean each with two, and Africa and the Middle East with one each. This is an interesting mix of strong and relatively healthy democracies, new and emerging democracies and less democratic countries. No doubt there are a number of explanations for this in different countries, including a failure of some of the early adopters to update their laws, a lack of serious intention to adopt a strong law in the first place in some countries, and a combination of local factors in a few emerging democracies which resulted in poor laws being adopted. This fits a picture that will be familiar to many who work in the field of access to information, namely that people living in countries that have recently experienced
10 Three countries are tied at the 19th position.

-‐ 12 -‐
oppression and dictatorship often tend to safeguard their liberties more carefully than those who take their democracies for granted. Another way of looking at this is to note that citizens in established democracies often feel they have a less pressing need for transparency in government since, on the whole, they tend to face lower levels of corruption and abuse of power. However, this obviously does not hold true for all of the democratic countries at the bottom of the list, such as Greece and Italy, which are among the more corrupt States in Europe. Figure 8 shows the average total score on the RTI Rating by region. Consistently with the observations above on the top and bottom performers, developed countries perform the worst, and they constitute the only region with an average percentage score of below 50 percent. They are followed by Asia/Pacific and the Arab World, at 54 and 55 percent, respectively, and then Latin America/Caribbean, Africa and East/Central Europe, all between 60 and 62 percent.
Figure 8: Average Total Percentage Scores by Region
Perhaps the most pertinent observation here is the relative lack of disparity between the three top-‐performing regions, despite the fact that they differ significantly in terms of wealth and other social, political and economic indicators, particularly in the case of Africa. The relatively strong performance of Africa may be explained in part by the limited penetration of laws in this region, which means that those countries that have adopted laws tend to be among the more democratic. There are, however, exceptions to this, such as Ethiopia and Zimbabwe, with the former even having achieved a top-‐ten score. The weaker performance of Asia/Pacific may in part be due to the chequered history of democratisation and in part by the hugely heterogeneous nature of the region. The Arab World sample of just three countries may be too small to draw any
-‐
10.00
20.00
30.00
40.00
50.00
60.00
70.00
-‐ 13 -‐
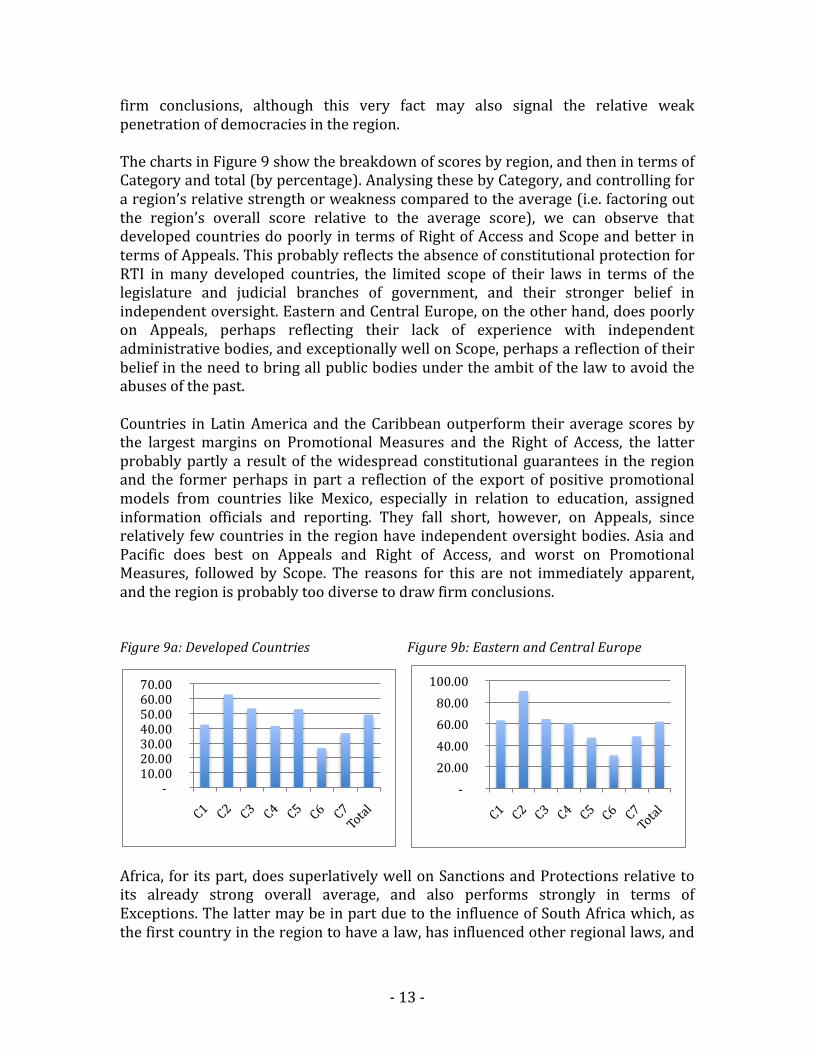
firm conclusions, although this very fact may also signal the relative weak penetration of democracies in the region. The charts in Figure 9 show the breakdown of scores by region, and then in terms of Category and total (by percentage). Analysing these by Category, and controlling for a region’s relative strength or weakness compared to the average (i.e. factoring out the region’s overall score relative to the average score), we can observe that developed countries do poorly in terms of Right of Access and Scope and better in terms of Appeals. This probably reflects the absence of constitutional protection for RTI in many developed countries, the limited scope of their laws in terms of the legislature and judicial branches of government, and their stronger belief in independent oversight. Eastern and Central Europe, on the other hand, does poorly on Appeals, perhaps reflecting their lack of experience with independent administrative bodies, and exceptionally well on Scope, perhaps a reflection of their belief in the need to bring all public bodies under the ambit of the law to avoid the abuses of the past. Countries in Latin America and the Caribbean outperform their average scores by the largest margins on Promotional Measures and the Right of Access, the latter probably partly a result of the widespread constitutional guarantees in the region and the former perhaps in part a reflection of the export of positive promotional models from countries like Mexico, especially in relation to education, assigned information officials and reporting. They fall short, however, on Appeals, since relatively few countries in the region have independent oversight bodies. Asia and Pacific does best on Appeals and Right of Access, and worst on Promotional Measures, followed by Scope. The reasons for this are not immediately apparent, and the region is probably too diverse to draw firm conclusions. Figure 9a: Developed Countries Figure 9b: Eastern and Central Europe
Africa, for its part, does superlatively well on Sanctions and Protections relative to its already strong overall average, and also performs strongly in terms of Exceptions. The latter may be in part due to the influence of South Africa which, as the first country in the region to have a law, has influenced other regional laws, and
-‐ 10.00 20.00 30.00 40.00 50.00 60.00 70.00
-‐ 20.00 40.00 60.00 80.00 100.00

-‐ 14 -‐
which has a very tight regime of exceptions. The former may be due to a strong desire for both protection for good faith behaviour and accountability in the face of wrongdoing. Finally, the Arab World is very strong in terms of Promotional Measures and exceptionally weak in terms of the Right of Access but, once again, the sample size for this is really too small to draw any strong conclusions. Figure 9c: Latin America and Caribbean Figure 9d: Asia and Pacific
Figure 9e: Sub-Saharan Africa Figure 9f: Arab World
Conclusion The past twenty years have seen the number of RTI laws globally multiply by more than five times, from just 18 in 1993 to 95 today. As measured by the RTI Rating, the quality of these laws is distributed roughly over a bell curve, with an average score, in both median and mean terms, of about 85 points, or 57 percent of the possible total of 150, and the average score in most of the RTI Rating Categories falling into the 50-‐60 percent range. The RTI Rating also shows that the quality of RTI laws has improved fairly dramatically and consistently over those same twenty years. Only time will tell whether the growth in terms of both number and quality of laws will continue. In terms of the former, the more democratic regions of the world are all approaching full penetration of laws, with potential for further growth in Africa,
-‐ 20.00 40.00 60.00 80.00 100.00
C1
C2
C3
C4
C5
C6
C7
Total
-‐
20.00
40.00
60.00
80.00
-‐ 20.00 40.00 60.00 80.00 100.00
C1
C2
C3
C4
C5
C6
C7
Total
-‐ 20.00 40.00 60.00 80.00 100.00
C1
C2
C3
C4
C5
C6
C7
Total
-‐ 15 -‐
the Arab World, Asia and among the small island States of both the Caribbean and Pacific. Improvement in average quality can come both through the adoption of strong new laws – the primary engine of growth in this area so far – and through the improvement of existing laws. The weak performance of developed countries indicates strong potential for improvement in the latter area, although there are unfortunately few concrete indications that this is likely to happen in practice.