
RT-Eye Serial Compliance and Analysis Quick Start User Manual
90
071-1769-00 www.tektronix.com RT-Eye R Serial Compliance and Analysis Quick Start User Manual
Transcript of RT-Eye Serial Compliance and Analysis Quick Start User Manual

071-1769-00www.tektronix.com
RT-Eye� Serial Compliance and AnalysisQuick Start User Manual

Copyright � Tektronix, Inc. All rights reserved. Licensed software products are owned by Tektronix or its suppliers and are protected by
United States copyright laws and international treaty provisions.
Use, duplication, or disclosure by the Government is subject to restrictions as set forth in subparagraph (c)(1)(ii) of the Rights in Technical
Data and Computer Software clause at DFARS 252.227-7013, or subparagraphs (c)(1) and (2) of the Commercial Computer Software −
Restricted Rights clause at FAR 52.227-19, as applicable.
Tektronix products are covered by U.S. and foreign patents, issued and pending. Information in this publication supercedes that in all
previously published material. Specifications and price change privileges reserved.
TEKTRONIX and TEK are registered trademarks of Tektronix, Inc.
RT-Eye is a registered trademark of Tektronix, Inc.
Contacting Tektronix
Tektronix, Inc.
14200 SW Karl Braun Drive or P.O. Box 500
Beaverton, OR 97077 USA
For product information, sales, service, and technical support:
� In North America, call 1-800-833-9200.
� Worldwide, visit www.tektronix.com to find contacts in your area.

Warranty 9(b)
Tektronix warrants that the media on which this software product is furnished and the encoding of the programs on the media will be freefrom defects in materials and workmanship for a period of three (3) months from the date of shipment. If any such medium or encodingproves defective during the warranty period, Tektronix will provide a replacement in exchange for the defective medium. Except as to themedia on which this software product is furnished, this software product is provided �as is" without warranty of any kind, either express orimplied. Tektronix does not warrant that the functions contained in this software product will meet Customer’s requirements or that theoperation of the programs will be uninterrupted or error-free.
In order to obtain service under this warranty, Customer must notify Tektronix of the defect before the expiration of the warranty period. IfTektronix is unable to provide a replacement that is free from defects in materials and workmanship within a reasonable time thereafter,Customer may terminate the license for this software product and return this software product and any associated materials for credit orrefund.
THIS WARRANTY IS GIVEN BY TEKTRONIX WITH RESPECT TO THE PRODUCT IN LIEU OF ANY OTHER WARRANTIES,EXPRESS OR IMPLIED. TEKTRONIX AND ITS VENDORS DISCLAIM ANY IMPLIED WARRANTIES OF MERCHANTABILITY ORFITNESS FOR A PARTICULAR PURPOSE. TEKTRONIX’ RESPONSIBILITY TO REPLACE DEFECTIVE MEDIA OR REFUNDCUSTOMER’S PAYMENT IS THE SOLE AND EXCLUSIVE REMEDY PROVIDED TO THE CUSTOMER FOR BREACH OF THISWARRANTY. TEKTRONIX AND ITS VENDORS WILL NOT BE LIABLE FOR ANY INDIRECT, SPECIAL, INCIDENTAL, ORCONSEQUENTIAL DAMAGES IRRESPECTIVE OF WHETHER TEKTRONIX OR THE VENDOR HAS ADVANCE NOTICE OF THEPOSSIBILITY OF SUCH DAMAGES.


Table of Contents
RT-Eye Quick Start User Manual i
Table of ContentsGeneral Safety Summary iii. . . . . . . . . . . . . . . . . . . . . . . . . . . . . . . . . . . . . . . . . . . . . . . . . . . . . . . . . . . . . . . . . . . . .
Preface v. . . . . . . . . . . . . . . . . . . . . . . . . . . . . . . . . . . . . . . . . . . . . . . . . . . . . . . . . . . . . . . . . . . . . . . . . . . . . . . . . .
Getting StartedKey Features 1. . . . . . . . . . . . . . . . . . . . . . . . . . . . . . . . . . . . . . . . . . . . . . . . . . . . . . . . . . . . . . . . . . . . . . . . . . Using Compliance Modules 2. . . . . . . . . . . . . . . . . . . . . . . . . . . . . . . . . . . . . . . . . . . . . . . . . . . . . . . . . . . . . . . . Ensuring Compatibility 2. . . . . . . . . . . . . . . . . . . . . . . . . . . . . . . . . . . . . . . . . . . . . . . . . . . . . . . . . . . . . . . . . . .
Minimum Required System Configuration 3. . . . . . . . . . . . . . . . . . . . . . . . . . . . . . . . . . . . . . . . . . . . . . . . . . Other Requirements and Restrictions 5. . . . . . . . . . . . . . . . . . . . . . . . . . . . . . . . . . . . . . . . . . . . . . . . . . . . .
Using Accessories 5. . . . . . . . . . . . . . . . . . . . . . . . . . . . . . . . . . . . . . . . . . . . . . . . . . . . . . . . . . . . . . . . . . . . . . Installing the Application 5. . . . . . . . . . . . . . . . . . . . . . . . . . . . . . . . . . . . . . . . . . . . . . . . . . . . . . . . . . . . . . . . . . Connecting to the Device Under Test 6. . . . . . . . . . . . . . . . . . . . . . . . . . . . . . . . . . . . . . . . . . . . . . . . . . . . . . . . .
Typical Probing Configurations 6. . . . . . . . . . . . . . . . . . . . . . . . . . . . . . . . . . . . . . . . . . . . . . . . . . . . . . . . . . Calibrating the Oscilloscope and Probes 8. . . . . . . . . . . . . . . . . . . . . . . . . . . . . . . . . . . . . . . . . . . . . . . . . . . . . . .
Operating BasicsStarting the RT-Eye Application 11. . . . . . . . . . . . . . . . . . . . . . . . . . . . . . . . . . . . . . . . . . . . . . . . . . . . . . . . . . . . . Defining Preferences 12. . . . . . . . . . . . . . . . . . . . . . . . . . . . . . . . . . . . . . . . . . . . . . . . . . . . . . . . . . . . . . . . . . . . . Hiding and Returning the RT-Eye Application 13. . . . . . . . . . . . . . . . . . . . . . . . . . . . . . . . . . . . . . . . . . . . . . . . . . . Minimizing and Maximizing the RT-Eye Application 14. . . . . . . . . . . . . . . . . . . . . . . . . . . . . . . . . . . . . . . . . . . . . . . Docking and Undocking the RT-Eye Application 15. . . . . . . . . . . . . . . . . . . . . . . . . . . . . . . . . . . . . . . . . . . . . . . . . Using the Sequencing Controls 16. . . . . . . . . . . . . . . . . . . . . . . . . . . . . . . . . . . . . . . . . . . . . . . . . . . . . . . . . . . . . Exiting the RT-Eye Application 17. . . . . . . . . . . . . . . . . . . . . . . . . . . . . . . . . . . . . . . . . . . . . . . . . . . . . . . . . . . . . . RT-Eye Application User Interface and Menu Structure 18. . . . . . . . . . . . . . . . . . . . . . . . . . . . . . . . . . . . . . . . . . . . Locating the Application Directories 19. . . . . . . . . . . . . . . . . . . . . . . . . . . . . . . . . . . . . . . . . . . . . . . . . . . . . . . . . .
Using the RT-Eye SoftwareSetting Up the Application 21. . . . . . . . . . . . . . . . . . . . . . . . . . . . . . . . . . . . . . . . . . . . . . . . . . . . . . . . . . . . . . . . .
Using the Wizard 22. . . . . . . . . . . . . . . . . . . . . . . . . . . . . . . . . . . . . . . . . . . . . . . . . . . . . . . . . . . . . . . . . . . . Viewing Plot Summaries 24. . . . . . . . . . . . . . . . . . . . . . . . . . . . . . . . . . . . . . . . . . . . . . . . . . . . . . . . . . . . . . . . . . Viewing Plot Details 26. . . . . . . . . . . . . . . . . . . . . . . . . . . . . . . . . . . . . . . . . . . . . . . . . . . . . . . . . . . . . . . . . . . . .
Using Zoom 26. . . . . . . . . . . . . . . . . . . . . . . . . . . . . . . . . . . . . . . . . . . . . . . . . . . . . . . . . . . . . . . . . . . . . . . Using Cursors 28. . . . . . . . . . . . . . . . . . . . . . . . . . . . . . . . . . . . . . . . . . . . . . . . . . . . . . . . . . . . . . . . . . . . . . Using a Grid 29. . . . . . . . . . . . . . . . . . . . . . . . . . . . . . . . . . . . . . . . . . . . . . . . . . . . . . . . . . . . . . . . . . . . . . .
Exporting Plots to Files 30. . . . . . . . . . . . . . . . . . . . . . . . . . . . . . . . . . . . . . . . . . . . . . . . . . . . . . . . . . . . . . . . . . . Printing Plots 31. . . . . . . . . . . . . . . . . . . . . . . . . . . . . . . . . . . . . . . . . . . . . . . . . . . . . . . . . . . . . . . . . . . . . . . . . . Viewing Results 32. . . . . . . . . . . . . . . . . . . . . . . . . . . . . . . . . . . . . . . . . . . . . . . . . . . . . . . . . . . . . . . . . . . . . . . . Creating a New Report 34. . . . . . . . . . . . . . . . . . . . . . . . . . . . . . . . . . . . . . . . . . . . . . . . . . . . . . . . . . . . . . . . . . .
Generating a Report 34. . . . . . . . . . . . . . . . . . . . . . . . . . . . . . . . . . . . . . . . . . . . . . . . . . . . . . . . . . . . . . . . . Printing a Report 35. . . . . . . . . . . . . . . . . . . . . . . . . . . . . . . . . . . . . . . . . . . . . . . . . . . . . . . . . . . . . . . . . . . . Saving a Report 36. . . . . . . . . . . . . . . . . . . . . . . . . . . . . . . . . . . . . . . . . . . . . . . . . . . . . . . . . . . . . . . . . . . . .
Viewing or Printing a Saved Report 36. . . . . . . . . . . . . . . . . . . . . . . . . . . . . . . . . . . . . . . . . . . . . . . . . . . . . . . . . . Viewing a Saved Report 36. . . . . . . . . . . . . . . . . . . . . . . . . . . . . . . . . . . . . . . . . . . . . . . . . . . . . . . . . . . . . . . Printing a Saved Report without Viewing 38. . . . . . . . . . . . . . . . . . . . . . . . . . . . . . . . . . . . . . . . . . . . . . . . . . .
Logging Worst Case Waveforms 39. . . . . . . . . . . . . . . . . . . . . . . . . . . . . . . . . . . . . . . . . . . . . . . . . . . . . . . . . . . . Using MyTest 41. . . . . . . . . . . . . . . . . . . . . . . . . . . . . . . . . . . . . . . . . . . . . . . . . . . . . . . . . . . . . . . . . . . . . . . . . .
Saving MyTest 41. . . . . . . . . . . . . . . . . . . . . . . . . . . . . . . . . . . . . . . . . . . . . . . . . . . . . . . . . . . . . . . . . . . . . . Running MyTest 42. . . . . . . . . . . . . . . . . . . . . . . . . . . . . . . . . . . . . . . . . . . . . . . . . . . . . . . . . . . . . . . . . . . . .
Selecting Measurements and Using Autoset 42. . . . . . . . . . . . . . . . . . . . . . . . . . . . . . . . . . . . . . . . . . . . . . . . . . . . Selecting Plots 43. . . . . . . . . . . . . . . . . . . . . . . . . . . . . . . . . . . . . . . . . . . . . . . . . . . . . . . . . . . . . . . . . . . . . . . . . Configuring Plots 44. . . . . . . . . . . . . . . . . . . . . . . . . . . . . . . . . . . . . . . . . . . . . . . . . . . . . . . . . . . . . . . . . . . . . . .
Reconfiguring Plots and Using the Bit Error Locator 46. . . . . . . . . . . . . . . . . . . . . . . . . . . . . . . . . . . . . . . . . . . Configuring Measurements 49. . . . . . . . . . . . . . . . . . . . . . . . . . . . . . . . . . . . . . . . . . . . . . . . . . . . . . . . . . . . . . . .

Table of Contents
ii RT-Eye Quick Start User Manual
Choosing Probe Types and Measurement Sources 49. . . . . . . . . . . . . . . . . . . . . . . . . . . . . . . . . . . . . . . . . . . . Source 49. . . . . . . . . . . . . . . . . . . . . . . . . . . . . . . . . . . . . . . . . . . . . . . . . . . . . . . . . . . . . . . . . . . . . . . . . . . Ref Levels 52. . . . . . . . . . . . . . . . . . . . . . . . . . . . . . . . . . . . . . . . . . . . . . . . . . . . . . . . . . . . . . . . . . . . . . . . . Smart Gating 53. . . . . . . . . . . . . . . . . . . . . . . . . . . . . . . . . . . . . . . . . . . . . . . . . . . . . . . . . . . . . . . . . . . . . . . Clock Recovery 56. . . . . . . . . . . . . . . . . . . . . . . . . . . . . . . . . . . . . . . . . . . . . . . . . . . . . . . . . . . . . . . . . . . . . Jitter 58. . . . . . . . . . . . . . . . . . . . . . . . . . . . . . . . . . . . . . . . . . . . . . . . . . . . . . . . . . . . . . . . . . . . . . . . . . . . . Population 59. . . . . . . . . . . . . . . . . . . . . . . . . . . . . . . . . . . . . . . . . . . . . . . . . . . . . . . . . . . . . . . . . . . . . . . . . General Config 59. . . . . . . . . . . . . . . . . . . . . . . . . . . . . . . . . . . . . . . . . . . . . . . . . . . . . . . . . . . . . . . . . . . . .
Setting Limits 60. . . . . . . . . . . . . . . . . . . . . . . . . . . . . . . . . . . . . . . . . . . . . . . . . . . . . . . . . . . . . . . . . . . . . . . . . . Viewing the Current Limits 60. . . . . . . . . . . . . . . . . . . . . . . . . . . . . . . . . . . . . . . . . . . . . . . . . . . . . . . . . . . . . Editing the Currently Displayed Limit File 61. . . . . . . . . . . . . . . . . . . . . . . . . . . . . . . . . . . . . . . . . . . . . . . . . . . Viewing a Summary of the Limits 62. . . . . . . . . . . . . . . . . . . . . . . . . . . . . . . . . . . . . . . . . . . . . . . . . . . . . . . . Saving the Limits File 63. . . . . . . . . . . . . . . . . . . . . . . . . . . . . . . . . . . . . . . . . . . . . . . . . . . . . . . . . . . . . . . . . Using Limits 63. . . . . . . . . . . . . . . . . . . . . . . . . . . . . . . . . . . . . . . . . . . . . . . . . . . . . . . . . . . . . . . . . . . . . . .
Application ExamplesCreating a Custom Compliance Module with Pass/Fail Limits 64. . . . . . . . . . . . . . . . . . . . . . . . . . . . . . . . . . . . . . . .
Starting the RT-EyeApplication 64. . . . . . . . . . . . . . . . . . . . . . . . . . . . . . . . . . . . . . . . . . . . . . . . . . . . . . . . . . Running the Setup Wizard 65. . . . . . . . . . . . . . . . . . . . . . . . . . . . . . . . . . . . . . . . . . . . . . . . . . . . . . . . . . . . . Viewing the Results 66. . . . . . . . . . . . . . . . . . . . . . . . . . . . . . . . . . . . . . . . . . . . . . . . . . . . . . . . . . . . . . . . . . Summary of Displayed Results 67. . . . . . . . . . . . . . . . . . . . . . . . . . . . . . . . . . . . . . . . . . . . . . . . . . . . . . . . . . Using a Mask 68. . . . . . . . . . . . . . . . . . . . . . . . . . . . . . . . . . . . . . . . . . . . . . . . . . . . . . . . . . . . . . . . . . . . . . Defining a Limits Module 70. . . . . . . . . . . . . . . . . . . . . . . . . . . . . . . . . . . . . . . . . . . . . . . . . . . . . . . . . . . . . . Creating a Compliance Report 74. . . . . . . . . . . . . . . . . . . . . . . . . . . . . . . . . . . . . . . . . . . . . . . . . . . . . . . . . . Using MyTest 75. . . . . . . . . . . . . . . . . . . . . . . . . . . . . . . . . . . . . . . . . . . . . . . . . . . . . . . . . . . . . . . . . . . . . .
Index

General Safety Summary
RT-Eye Quick Start User Manual iii
General Safety SummaryReview the following safety precautions to avoid injury and prevent damage to this product or any products connected to it.
To avoid potential hazards, use this product only as specified.
Only qualified personnel should perform service procedures.
While using this product, you may need to access other parts of the system. Read the General Safety Summary in othersystem manuals for warnings and cautions related to operating the system.
To Avoid Fire or Personal Injury
Connect and Disconnect Properly. Do not connect or disconnect probes or test leads while they are connected to avoltage source.
Do Not Operate With Suspected Failures. If you suspect there is damage to this product, have it inspected byqualified service personnel.
Symbols and Terms
Terms in this Manual. These terms may appear in this manual:
WARNING. Warning statements identify conditions or practices that could result in injury or loss of life.
CAUTION. Caution statements identify conditions or practices that could result in damage to this product or other property.
Terms on the Product. These terms may appear on the product:
DANGER indicates an injury hazard immediately accessible as you read the marking.
WARNING indicates an injury hazard not immediately accessible as you read the marking.
CAUTION indicates a hazard to property including the product.
Symbols on the Product. The following symbol may appear on the product:
CAUTIONRefer to Help

General Safety Summary
iv RT-Eye Quick Start User Manual
Preface
RT-Eye Quick Start User Manual v
PrefaceThis manual describes how to set up and use the RT-Eye Serial Data Compliance and Analysis Application. Only basicoperations, presented as task-oriented procedures, are covered. For more detailed information, such as theory, concepts,or algorithms, refer to the RT-Eye online help. For information about using specific, industry-standard modules, refer to thedocumentation provided with the module. See Documentation below for additional, related information.
Documentation
To read about Use these documents
Installation, enabling an application,software warranty and license agreement,5 times free trial, downloading files fromthe Tektronix site, available applicationsand compatibility
Read the Optional Applications Software on a Windows-
Based Oscilloscope Installation Manual.
Basic operations of the RT-Eye applica-tion
Read the RT-Eye Serial Data Compliance and Analysis
Quick Start User Manual (this manual) provided in PDFformat on the Optional Applications Software on a
Windows-Based Oscilloscope CD.*
In-depth operation, user interface help,GPIB commands, and measurementalgorithms
Access the online help from the Help menu in the RT-Eyeapplication.
Other related documentation, such asMethod of Implementation (MOI) docu-ments and help files for specific com-pliance modules, Report Generator help,and so on
Read the relevant documents, provided in PDF files, on theOptional Applications Software on a Windows-Based
Oscilloscope CD.*
* To access the documentation that is installed on your instrument, click Start in the taskbar and select Programs > TekApplications.
Relevant Web Sites
You may also find useful information about serial data standards on the following Web sites:
� www.Infinibandta.org
� www.pcisig.com
� www.T11.org
� www.tektronix.com/serial_data
Preface
vi RT-Eye Quick Start User Manual
Conventions Used in this Manual
The following icon is used throughout this manual:
SequenceStep
1
The following conventions are used throughout the text of this manual:
� The terms �RT-Eye application" or �application" refer to the RT-Eye Serial Compliance and Analysis Application.
� The term �oscilloscope" refers to any product on which this application runs.
� The term �select" is a generic term that applies to the two mechanical methods of choosing an option: with a mouse orwith the Touch Screen.
� The term �Compliance Module" refers to optional �plug-in applications" from Tektronix used for compliance testing tospecific serial data standards.
� The term �Limits Module" refers to a formatted text file used to specify user limits on mask geometry and measurementboundary conditions for Pass/Fail testing.
� The term �channel" is context dependent. It can refer to the transmit channel of the device under test or to anoscilloscope channel.
� The term �DUT" is an acronym for Device Under Test.
� User interface screen graphics are from a TDS6000 series oscilloscope; there may be minor differences in the displayson other types of oscilloscopes.
� When steps require a sequence of selections using the application interface, the � >" delimiter marks each transitionbetween a menu and an option.

Getting Started
RT-Eye Quick Start User Manual 1
Getting StartedThis section contains information on key features, compliance modules, compatibility issues, installation, probingconfigurations, and calibration.
Key Features
The RT-Eye Serial Compliance and Analysis Application is a software product that enhances the basic capabilities of someTektronix oscilloscopes that use Microsoft Windows operating systems. The RT-Eye application is a general analysis toolthat you can use to test, debug, and verify serial-data based designs.
You can use this application to do the following tasks:
� Select and configure many amplitude and timing measurements on serial data signals
� Quickly set up and take measurements using the Setup Wizard
� Select MyTest to execute a previously saved customized set of test conditions
� Conduct RT-Eye rendering and mask testing, Time Interval Error analysis, Rj/Dj (random jitter and deterministic jitter)analysis, and display results as a Bathtub plot
� Display the results as eye diagram, histogram, spectrum, or bathtub curve plots
� Use the bit error locator feature to find mask failures on the waveform
� Perform Pass or Fail limits testing based on waveform masks and based on measurements that use Limits Modules
� Perform "plug-fest" level compliance tests for available compliance modules that test against a specific standard
� Save the statistical results to a file
� Save the worst case waveforms to files
� Generate reports

Getting Started
2 RT-Eye Quick Start User Manual
Using Compliance Modules
You can purchase separate compliancemodules for the RT-Eye application, suchas Infiniband, PCI Express, FB-DIMM,and SAS. These are specific tools thatyou can use to ensure that device designscomply with specific serial data standards.The compliance modules available to youare listed in the Modules menu.
This manual only discusses the operationof the Serial Analysis module. However,the compliance modules may includespecific help files and PDF files ofMethods of Implementation (MOI) thatexplain how to use the compliancemodule.
Ensuring Compatibility
For information on oscilloscope and RT-Eye application compatibility, refer to the Optional Applications Software on
Windows Based Oscilloscopes Installation Manual, Tektronix part number 071-1078-xx, that shipped with your application.

Getting Started
RT-Eye Quick Start User Manual 3
Minimum Required System Configuration
To check whether you system meets theminimum required system configuration,do the following procedure:
1. Select File > Minimize to minimize theTekScope application.
1
2. Select Start > Programs > TekAp-
plications > tdsRT-Eye > Readme,note the minimum firmware versionthat is required, and close the Readmefile.
3. Click TekScope.
3
2

Getting Started
4 RT-Eye Quick Start User Manual
4. Select Help > About TekScope� inthe oscilloscope menu bar.
4
5. Verify that the firmware version is thesame or greater than that noted instep 2.
Other minimum requirements are:
� Windows 2000 or Windows XPoperating system
� 850 MHz Processor
� 512 MB SDRAM

Getting Started
RT-Eye Quick Start User Manual 5
Other Requirements and Restrictions
MATLAB
The RT-Eye installer also installs the Sun Java Run-Time Environment (JRE) and the Mathworks MATLAB Run-TimeServer. The MATLAB server is dedicated to the RT-Eye application and cannot be used for other purposes.
Do not close the MATLAB Server icon inthe oscilloscope task bar. The applicationwill close the MATLAB sever when youexit the application.
Oscilloscope
A maximum sampling rate with interpolation is often necessary to ensure accurate results. Be sure to consider thefollowing differences in sampling rates before taking measurements:
� The TDS6604 oscilloscopes sample at 20 GS/s on two channels and at 10 GS/s on four channels.
� The TDS6000B oscilloscopes sample at 20 GS/s on two and four channels.
� The TDS6000C oscilloscopes sample at 40 GS/s on two channels and 20 GS/s on four channels.
� The TDS7404 oscilloscopes sample at 20 GS/s on one channel and at 10 GS/s on two channels.
� The TDS7000B oscilloscopes sample at 20 GS/s on one channel, 10 GS/s on two channels, and 5 GS/s on fourchannels.
When the Record Length of the oscilloscope is set to 4 M or less, the application can take all measurements. The RT-Eyeapplication can take a TIE measurement on a record length up to 20 M.
Keyboard
You will need to use a keyboard to enter new names for some file save operations.
Using Accessories
There are no standard accessories for this product.
Installing the Application
For information on how to install the RT-Eye application, refer to the Optional Applications Software on Windows Based
Oscilloscopes Installation Manual that shipped with your application. This manual contains the following information:
� Checking for available applications, compatible oscilloscopes, and relevant software and firmware version numbers
� Using the five-time free trials for applications
� Applying labels for a newly authorized option installation keys
� Installing application software
� Enabling applications
� Downloading updates from the Tektronix Web site

Getting Started
6 RT-Eye Quick Start User Manual
Connecting to the Device Under Test
You can use any compatible probes to connect between the device under test (DUT) and oscilloscope.
WARNING. To avoid electrical shock and equipment damage, refer to the General Safety Summary at the beginning of
this manual and the safety summaries in your oscilloscope and probe user manuals.
Power off the device under test before you attach probes. Do not touch exposed conductors except with the properly rated
probe tips. Refer to your probe manual for proper use.
To ensure that the bandwidth is adequatefor rise time measurements, your probeand oscilloscope combination must havea system bandwidth greater than 1.5times the bit rate that you are measuring.This ensures that the bandwidth isadequate for most measurements, sincemost of the energy in high-speed serialdata signals is contained in the first andthird harmonics. To ensure accuraterisetime measurements, 2.5 times the bitrate (5th harmonic) is required.
Typical Probing Configurations
There are four typical probing configurations for serial data links: two for pseudo differential waveforms and two for truedifferential waveforms. The method that you use to set up your measurement channel(s) depends on your application andwhat you want to measure.
� Two TCA-to-SMA adapters (single
ended)

Getting Started
RT-Eye Quick Start User Manual 7
� One P73XX SMA differential probe
� Two P72XX single-ended or P73XX
differential probes
� One P73XX differential probe
NOTE. You must deskew the probes when using two channels to perform pseudo-differential measurements. Use theproper deskew fixture and procedure as described in the user manual or online help of your oscilloscope.
The RT-Eye application relies on upsampled, deskewed data from the oscilloscope to conduct math operations fordifferential and common mode waveform measurements. Upsampling prior to deskew is required to ensure accuratemeasurements.
For more information about probes, refer to Choosing the Probe Configuration in the RT-Eye Serial Compliance andAnalysis Online Help.

Getting Started
8 RT-Eye Quick Start User Manual
Calibrating the Oscilloscope and Probes
NOTE. To ensure accurate results, calibrate the oscilloscope and probes before you run tests. Refer to your oscilloscope
and probe documentation for additional information.
1. Click Utilities > Instrument Calibra-
tion to begin calibrating the oscillo-scope for signal path compensation.
2. Click Calibrate.1
2
3. After the SPC compensation finishes(verify that the Status is Pass), selectVertical > Probe Cal�.
3
4. Connect the probe calibration signal tothe probe.

Getting Started
RT-Eye Quick Start User Manual 9
5. Click Calibrate Probe.
5

Getting Started
10 RT-Eye Quick Start User Manual

Operating Basics
RT-Eye Quick Start User Manual 11
Operating Basics
Starting the RT-Eye Application
1. Start the application:
� For non-B or non-C modeloscilloscopes, select File > Run
Application > RT-Eye Serial
Compliance and Analysis.
1
� For B and C model oscilloscopes,select App > RT-Eye Serial
Compliance and Analysis.
1
The RT-Eye application displays in thelower half of the screen.
2. If the RT-Eye Welcome dialog box dis-plays, click Cancel.
2

Operating Basics
12 RT-Eye Quick Start User Manual
Defining Preferences
You can set some preferences that willhelp you use the application moreefficiently. To set the preferences:
1. Select File > Preferences�.
The Preferences dialog windowdisplays.
1
2. Check the preferences to:
� Display a Welcome dialog windoweach time that you start theapplication that allows you to runeither MyTest or the Wizard
� Display the Autoset Summarydialog window each time youselect Autoset.
� Enable high-performance eyerendering. When selected, onlysegments of the waveformsurrounding the worst-case eyeviolations are rendered. Theresulting eye typically contains10,000 to 12,000 unit intervals(UIs) for statistical validity butresults in faster display of the eyediagrams. If this selection is notchecked, then all the UIs in therecord are rendered, resulting inincreased fidelity of the eyediagram, but reducedmeasurement throughput.
3. Click:
� Apply to apply your selectionsand leave the dialog window open
� Cancel to discard your changesand close the dialog window
� OK to accept your changes andclose the dialog window
3
2

Operating Basics
RT-Eye Quick Start User Manual 13
Hiding and Returning the RT-Eye Application
1. Click the Hide icon to minimize theRT-Eye application and maximize theoscilloscope display.
1
2. To display the RT-Eye applicationagain:
� For non-B or non-C modeloscilloscopes, click the App
button.
2
� For B and C model oscilloscopes,select App > Restore
Application.2

Operating Basics
14 RT-Eye Quick Start User Manual
Minimizing and Maximizing the RT-Eye Application
1. To minimize the application, select File
> Minimize.
1
2. To maximize the application, click theRT-Eye icon in the task bar.
2
If you expanded the TekScope applicationfull screen after minimizing the RT-Eyeapplication, you can maximize the RT-Eyeapplication by performing the followingstep:
3. To maximize the RT-Eye applicationagain:
� For non-B or non-C modeloscilloscopes, click the App
button.
3
� For B and C model oscilloscopes,select App > Restore
Application.3

Operating Basics
RT-Eye Quick Start User Manual 15
Docking and Undocking the RT-Eye Application
1. To undock the RT-Eye application, se-lect File > Undock.
1
2. Click and drag the RT-Eye title bar toposition the application anywhere onscreen or on a second monitor, if used.
2
3. To dock the RT-Eye application, selectFile > Dock.
3

Operating Basics
16 RT-Eye Quick Start User Manual
Using the Sequencing Controls
Sequencing is the steps to acquire waveform information, determine if the information is usable for the measurement, takethe measurement, and display the results. (Before starting sequencing, you must set up the application properly.)
There are three sequencing modes:
� Single Run�Processes a single waveform, and then halts. If the waveform source is a live channel, a new waveformis acquired using the current trigger settings of the oscilloscope
� Single No Acq�Processes a single waveform, and then halts. If the waveform source is a live channel, themeasurements are performed on the currently displayed waveform without retriggering
� Free Run�Continuously acquires waveforms and sequences until you select the Stop command button; results andany plots are updated one or more times per measurement cycle
The sequencing controls consist of thefollowing:
1. Clear Results�Clears previously takenmeasurements.
2. Mode�Selects one of three modes:Single Run, Single No Acq, or FreeRun.
3. Start�Begins the sequencing steps.
4. Stop�Stops the sequencing.
For example, if you selected Free Runas the mode, you can click Stop to endthe sequencing. If you selected SingleRun or Single No Acq, it is not neces-sary to click Stop.
1
4
2
3

Operating Basics
RT-Eye Quick Start User Manual 17
Exiting the RT-Eye Application
1. Select File > Exit or click the Close
icon.
The Exit RT-Eye dialog box opens.
1
2. Check Save MyTest if you want tosave your last test configuration so thatit can be recalled the next time youopen the RT-Eye application.
3. Click:
� Yes to exit the RT-Eye applicationand restore your oscilloscopesettings to their state prior tostarting RT-Eye.
� No to exit without restoring theoscilloscope settings.
� Cancel to return to the RT-Eyeapplication.
2
3

Operating Basics
18 RT-Eye Quick Start User Manual
RT-Eye Application User Interface and Menu Structure

Operating Basics
RT-Eye Quick Start User Manual 19
Locating the Application Directories
During installation, the RT-Eye applicationsets up directories for various functions,such as to save setup files, masks, andwaveforms.
The default directory structure is shown.

Operating Basics
20 RT-Eye Quick Start User Manual

Using the RT−Eye Software
RT-Eye Quick Start User Manual 21
Using the RT-Eye Software
Setting Up the Application
You must set up the RT-Eye applicationfor serial data analysis. The general stepsthat you do are shown in the diagram.
After taking measurements, you can dothe following tasks:
� View the results as statistics
� Save statistics to a .csv file
� View results as a plot
� Use the zoom function to examinedetails of a plot
� Use the Cursor functions in a plot
� Save a plot file
� Print a plot
� Save the worst-case waveforms as.wfm files
� Generate a report file

Using the RT−Eye Software
22 RT-Eye Quick Start User Manual
Using the Wizard
This version of the RT-Eye Application has a Setup Wizard to enable you to quickly set up and take some key measure-ments. Before starting the Wizard, you must have your probe(s) connected to an applicable signal. In these procedures, a2.5 Gb/s, 127 bit, PRBS repeating pattern signal is used. The positive and negative outputs of the signal are connected viaphase-matched SMA cables to a Tektronix P7380SMA differential probe, which is connected to CH 1 of the oscilloscope.(See page 6, Connecting to the Device Under Test.)
To use the wizard, perform the followingsteps:
1. Start the application:
� For older oscilloscopes (typically non-Bmodels), select File > Run
Application > RT-Eye Serial
Compliance and Analysis.
1
� For newer oscilloscopes (typically Bmodels), select App > RT-Eye Serial
Compliance and Analysis.
1
2. If the RT-Eye Welcome dialog box dis-plays, click Run Wizard. Go to step 4.
2
3. If the RT-Eye Welcome dialog boxdoes not display, select Measure-
ments > Wizard�.
(You can use the File > Preferencesmenu selection to set the RT-EyeWelcome dialog box to open when youstart the application.)
3

Using the RT−Eye Software
RT-Eye Quick Start User Manual 23
The Setup Wizard dialog windowopens with step 1, Probe Type,highlighted. The selections for step 1appear in the right hand area of thewindow.
4. Select Probe Type from the drop-downlist (in this procedure, Differential), andclick Next.
The choice that you made for step 1 isdisplayed in yellow text.
5. Repeat the above procedure for eachstep, making the selections that youwant.
4
5
After making your selections for step 7,Plots, the display should look similar tothis.
6. Click Run.
6

Using the RT−Eye Software
24 RT-Eye Quick Start User Manual
A display similar to this with the plotsummary window in the upper half ofthe screen appears.
Viewing Plot Summaries
The RT-Eye Plot Summary window hasthe following toolbar controls for control-ling the plot views.
1. Click this icon to display the plot sum-mary in the lower half of the screen.
1

Using the RT−Eye Software
RT-Eye Quick Start User Manual 25
2. Click this icon to return the plot sum-mary to the upper half of the screen.
2
3. Click this icon to display the plot sum-mary full screen.
3
4. Click one of these icons to display theplot summary at half screen again.
4

Using the RT−Eye Software
26 RT-Eye Quick Start User Manual
Viewing Plot Details
To view details of a plot, click the detailsicon associated with one of the fourpossible plots. For example, to displaydetails of the upper left plot:
1. Click this icon.
1
� The RT-Eye Plot Details windowdisplays for the selected plot.
� The toolbar controls change.
Using Zoom
The toolbar for the Plot Details windowhas four icons that control the zoomfunction.
1. Click this icon to select the zoom-intool.
1
2. Click an area of the waveform to zoomin by a factor of two, centered aroundthe point that you clicked.
Note: An alternative zoom function isto click and drag a box around the areathat you want to zoom; the selectedarea is expanded to fill the displayarea.
2

Using the RT−Eye Software
RT-Eye Quick Start User Manual 27
3. Click a portion of the zoomed wave-form to further zoom in (or click anddrag a box around the area).
3
4. Click this icon to select the zoom outtool.
4
5. Click the waveform to zoom out.
If you zoomed in more than once onthe waveform, clicking the waveformwill zoom out in equal steps.
5
6. Click this icon to select the zoom hori-zontal axis tool.
6
7. Click an area of the waveform to zoomthe horizontal axis by a factor of two(centered around the area clicked), butretain the scale of the vertical axis.
Note: An alternative zoom function isto click and drag a box around the areathat you want to zoom; the selectedarea is expanded to fill the displayarea, but still maintain the verticalscale.
7

Using the RT−Eye Software
28 RT-Eye Quick Start User Manual
8. Click a portion of the zoomed wave-form to further zoom in (or click anddrag a box around the area).
8
9. Click the horizontal zoom icon to turnoff the zoom function.
10. Click the 100% icon to return the wa-veform to its original size.
Clicking this icon always returns thewaveform directly to its original sizewithout any intermediate zoom steps.
109
Using Cursors
Use plot cursors to quickly take accuratemeasurements of two cursor positions ona waveform and the difference (∆) valuebetween the cursors. Note that cursorsare on by default when viewing plotdetails.
Cursor icons
Make sure that all zoom functions are offbefore using cursors.
1. Click and drag each cursor to positionit where you want.
2. Read the V1, V2, and ∆V values for thehorizontal cursors and the t1, t2, and ∆tvalues for the vertical cursors.
1
2
3. To reset the cursors,click this icon.
Resetting the cursors is a quickmethod of locating cursors that may bepositioned outside of the display. 3
4. To turn cursors off, click the associatedicon (horizontal and/or vertical).
4

Using the RT−Eye Software
RT-Eye Quick Start User Manual 29
5. To return to the plot summary window,click this icon.
5
The plot summary window displays.
Using a Grid
1. Click this icon to display the details ofthe upper right plot (in this example,the TIE Jitter Spectrum plot).
1
2. To display a grid on the plot, click thisicon.
2
3. To turn the grid off, click the grid icon.
You cannot display a grid on an eyediagram plot.

Using the RT−Eye Software
30 RT-Eye Quick Start User Manual
Exporting Plots to Files
You can export your plot data to two typesof files:
� Graphic files in any format available onthe Save as type drop-down list
� Data files in binary .fig file formatGraphic Data
1. Set up the plot window as you want toexport it.
2. Click the Graphics or Data icon to se-lect the type file that you want to ex-port.
2
3. Browse to the directory in which youwant to save the file.
4. Enter a file name.
5. Select the type of file format that youwant to export.
6. Click Save.
3
4
5
6

Using the RT−Eye Software
RT-Eye Quick Start User Manual 31
Printing Plots
You can print your plots to a printer if youhave configured Microsoft Windows onyour oscilloscope for a printer. To print aplot, perform the following steps:
1. Set up the plot window as you want itto print (zoom, cursors, and so on).
2. Click the print figure icon.
2
3. To print the plot as it appears, clickPrint�.
The Print dialog box for your printeropens.
3

Using the RT−Eye Software
32 RT-Eye Quick Start User Manual
4. To print the plot, choose the printer set-tings that you want, and click OK.
4
Viewing Results
You can view the statistics for yourmeasurements in two ways:
� Summary view shows the current datafor all the measurements that youselected.
� Detail view shows the followingstatistics for each measurement:population, mean, standard deviation,maximum, minimum, andpeak-to-peak.
1. To view the summary statistics for yourcurrent measurements, selectResults > Summary.
The Result Summary window displayslisting all the selected measurementsand their general statistics.
1
Using the RT−Eye Software
RT-Eye Quick Start User Manual 33
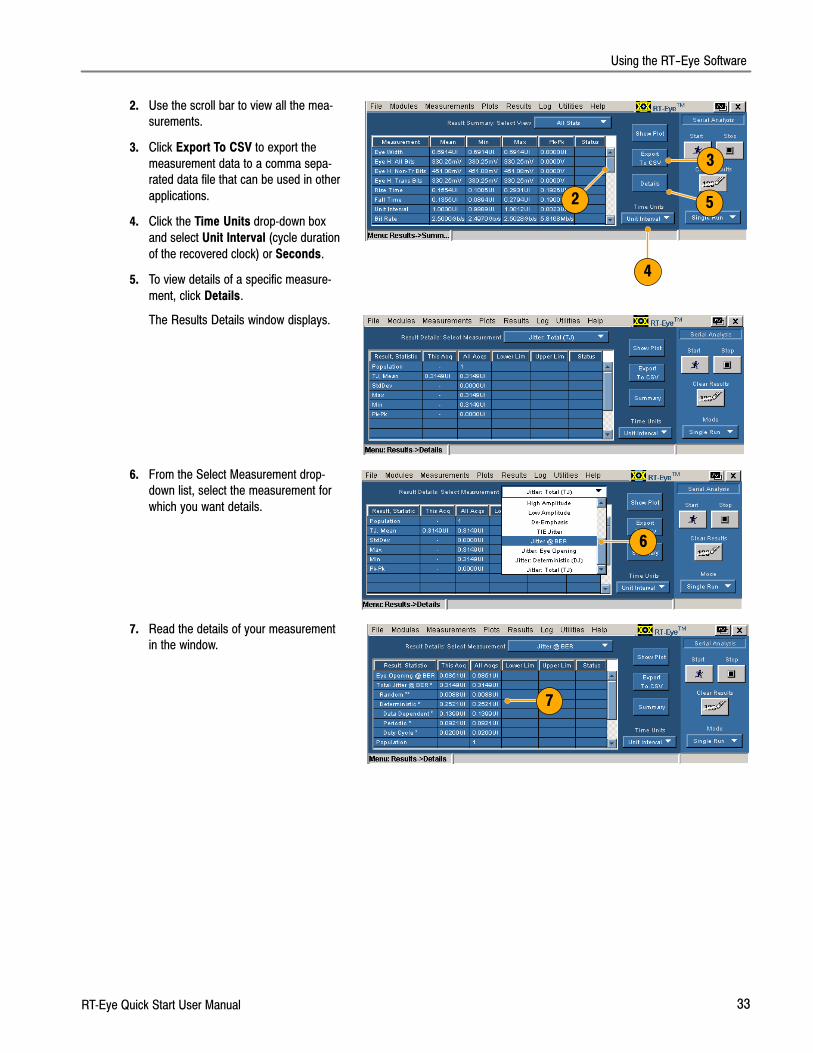
2. Use the scroll bar to view all the mea-surements.
3. Click Export To CSV to export themeasurement data to a comma sepa-rated data file that can be used in otherapplications.
4. Click the Time Units drop-down boxand select Unit Interval (cycle durationof the recovered clock) or Seconds.
5. To view details of a specific measure-ment, click Details.
2
3
5
4
The Results Details window displays.
6. From the Select Measurement drop-down list, select the measurement forwhich you want details.
6
7. Read the details of your measurementin the window.
7

Using the RT−Eye Software
34 RT-Eye Quick Start User Manual
Creating a New Report
Use the Report Generator utility togenerate a compliance report. The reportis a .rpt file that can only be viewed orprinted from the Report Generator.
You can customize the contents andlayout of the report using the advancedfeatures of the Report Generator. Refer tothe RT-Eye online help and the ReportGenerator online help for details.
By default, the report files are saved tothe Reports directory as shown.
Generating a Report
To generate a report, perform the follow-ing steps:
1. Select Utilities > Reports.1
2. Click Generate.
Wait until the report generator isfinished.
2

Using the RT−Eye Software
RT-Eye Quick Start User Manual 35
When completed, the report displays.(Use the Alt+Tab key combination tobring the report to the front, if neces-sary.)
Printing a Report
3. To print the report, click the printer iconin the Report Viewer toolbar.
3
4. Select a printer from the drop-downlist.
5. Make any adjustments that you want,and click OK. (The Print dialog boxmay differ slightly, depending on theprinter your are using.)
4
5

Using the RT−Eye Software
36 RT-Eye Quick Start User Manual
Saving a Report
1. To save a report, click the save icon inthe Report Viewer toolbar.
The Save As window opens.
1
2. Select the directory in which you wantto save the report (the default directoryis Reports).
3. Enter the filename.
4. Click Save.
5. Close the Report Viewer window.
2
3 4
Viewing or Printing a Saved Report
Viewing a Saved Report
To view a saved report, perform thefollowing steps:
1. Select Utilities > Reports.1
2. Click Browse.
The Open window displays the defaultdirectory, Layouts.
2

Using the RT−Eye Software
RT-Eye Quick Start User Manual 37
3. Click the Up One Level icon, and thendouble-click the Reports folder to openthe Reports directory.
3
4. Browse to locate the file that you wantto view, and click the file name to se-lect it.
5. Click Open.
4
5
6. Click View.
6

Using the RT−Eye Software
38 RT-Eye Quick Start User Manual
The report that you selected is dis-played.
You can print the viewed report. (Seepage 35, Printing a Report.)
7. Click the Close icon to close the Re-port Viewer.
7
Printing a Saved Report without Viewing
1. To print a saved report without viewingit in the Report Viewer, perform steps 1through 5 of the preceding procedure,and then click Print.
1
The Report Viewer window opens anda Report Viewer print dialog boxdisplays. After the print job is sent,both windows close.
Note that the instrument does notdisplay a Print setup dialog box whenthe report is printed using this method.
7
8

Using the RT−Eye Software
RT-Eye Quick Start User Manual 39
Logging Worst Case Waveforms
You can save the acquired waveforms toa set of .wfm files whenever a selectedmeasurement exceeds the highest orlowest prior value.
To log worst case waveforms, perform thefollowing procedure:
1. Select Log > Worst Case > Config-
ure.
The Worst Case Waveforms windowdisplays.
1
2. Click ON in the Log section.
3. Click Browse to open a browse win-dow.
2
3
4. Browse to the directory in which youwant to save the set of worst casefiles.
5. Click Open.
4
5

Using the RT−Eye Software
40 RT-Eye Quick Start User Manual
6. If you want to clear existing waveformand .csv files from the selected directo-ry, click Purge.
7. Click Start to take your selected mea-surements.
The measurement results display inthe Results Summary window. 6
7
8. Select Log > Worst Case > File
Names.
The File Names window displays thenames of the measurements, sources,and worst case file names.
8
9. To turn off logging, click Config.
9
10. Click Off.
10

Using the RT−Eye Software
RT-Eye Quick Start User Manual 41
Using MyTest
You can use the MyTest feature to save and recall your current settings. This allows you to recall your customized setup atany time and display a Result Summary window with a single click of a button.
Saving MyTest
To save your settings at any time, performthe following procedure:
1. Select Measurements > Save
MyTest.
Your current set up is saved as MyTest. 1
To save your settings when exiting theRT-Eye application, perform the followingprocedure:
1. Select File > Exit.
The Exit RT-Eye dialogue windowdisplays.
1
2. Check Save MyTest.
3. Click:
� Yes to restore the oscilloscopesettings when you exit theapplication
� No to exit without restoringoscilloscope settings
� Cancel to cancel the exit (yourcurrent setup will not be saved)
2
3

Using the RT−Eye Software
42 RT-Eye Quick Start User Manual
Running MyTest
To run MyTest at anytime, perform thefollowing procedure:
1. Select Measurements > Run MyTest.
The application restores the savedconfiguration, takes the measure-ments, and displays the results in theResult Summary window.
1
To run MyTest from the RT-Eye Welcomedialogue box, which displays when youstart the RT-Eye application, perform thefollowing procedure:
1. Start the RT-Eye application.
The RT-Eye Welcome dialogue boxdisplays.
2. Click Run MyTest.
The application takes the measure-ments and displays the results in theResult Summary window.
2
Selecting Measurements and Using Autoset
You may want to take measurementsother than those set up by the wizard. Toselect specific measurements, performthe following procedures:
1. Select Measurements > Select.
The Measurements window displays.1

Using the RT−Eye Software
RT-Eye Quick Start User Manual 43
2. Select your probe type from the ProbeType drop-down list box. The probetype affects the available measure-ments. (When you select Single En-ded, measurements for DifferentialSkew, CM Voltage, and AC CM Volt-age are added.)
2
3. Click the measurement buttons to turnthe measurements on or off, or clickSelect All to turn on all measure-ments.
4. Click Autoset, which performs a Verti-cal, Horizontal, and Reference Levelautoset to ensure accurate measure-ment results.
Note: You can set these levels manu-ally. (See page 52, Ref Levels.)
3
4
Selecting Plots
You can display up to four plots (depend-ing on your measurement selections). Toselect the plots for display, perform thefollowing procedure:
1. Click Select Plots (or select Plots >
Select).
1
2. Click Select, if the tab is not active.
2

Using the RT−Eye Software
44 RT-Eye Quick Start User Manual
3. In the Measurement drop-down boxes,select up to four measurements thatyou want plotted.
3
4. In the Plot Type drop-down boxes, se-lect the plot type for each measure-ment that you selected. (Note that it ispossible to select a measurement forwhich there is no plot.)
4
Configuring Plots
After you have selected the Measurementand associated plot type, you can furtherconfigure each of these. To configure aplot, perform the following procedure:
1. Click Configure.
The controls in the Configure sectionvary, depending on the type of mea-surements and plots that you previous-ly selected in the Select window.
1
2. In this example, click 1 to display theConfigure controls for an Eye Diagramplot.
3. Click the Bit Type drop-down box, andselect the bit type that you want.
4. Click On or Off to toggle the display ofmasks.
5. Click Browse.
The Masks window opens.
2 3
4
5

Using the RT−Eye Software
RT-Eye Quick Start User Manual 45
6. Select the mask file that you want touse, and then click Open.
Selecting and opening a mask togglesMask on. Once selected, you cantoggle the mask off or on.
For additional information on usingmasks, refer to the RT-Eye online help.
6
7. In this example, click 2 to display theConfigure controls for a Spectrum plot.
8. Click Linear or Log for the vertical axisscale.
9. Click Linear or Log for the horizontalaxis scale.
7
8 9
10. In this example, click 3 to display theConfigure controls for a Histogramplot.
11. Click Linear or Log for the vertical axisscale.
12. Click the Bin Resolution control to se-lect the number of bins.
12
10
11
13. In this example, click 4 to display theConfigure controls for a Bathtub Curve.
14. Click Linear or Log to set the scale forboth axes.
13
14

Using the RT−Eye Software
46 RT-Eye Quick Start User Manual
15. After you select and configure the plotsthat you want, click Start to take yourmeasurements.
15
When sequencing is complete, the PlotSummary window displays up to fourplots.
16
Reconfiguring Plots and Using the Bit Error Locator
In the following steps, you will:
� Make changes to display two plots: an eye diagram plot with a PCIExpress NTbit mask and the associated waveformplot.
� Use the Plots Refresh button to reconfigure the plots without sequencing again.
� View the mask hits in the eye diagram plot.
� Use the Bit Error Locator function to see the mask hits (sample points) in red on the waveform.
16. Select Plots > Select.
16

Using the RT−Eye Software
RT-Eye Quick Start User Manual 47
17. Make the following changes:
� Change the second measurementto Eye Width.
� Change the Plot Type toWaveform.
� Change third and fourthmeasurements to None.
17
18. Click Configure.
19. Click 1.
20. Click Browse.
18
19 20
21. Locate and select the PCI Express Di-rectory in the Masks directory.
22. Click Open.
21
22
23. Select PCETxNTbit.msk.
24. Click Open.
The mask file is opened and Mask istoggled to On (if it was Off).
23
24

Using the RT−Eye Software
48 RT-Eye Quick Start User Manual
25. Click Select.
26. Click Refresh.
The reconfigured plots are displayed.
27. Click the Eye Diagram Details icon.
25
26
27
The details of the eye diagram aredisplayed.
28. Note the mask hits.
29. Click the Plot Summary Icon to displayboth plots again.
28
29
30. Click the Waveform Details icon.
30
Note that the Bit Error Locator displaysthe waveform with the mask hitshighlighted in red.
31. Click the Zoom in X icon.
32. Click the mask hits that you want tosee in detail (you may want to clickmultiple times to zoom in on the wave-form).
32
31

Using the RT−Eye Software
RT-Eye Quick Start User Manual 49
33. Note the mask hits (sample hits), indi-cated in red, on zoomed waveform.
33
Configuring Measurements
This topic contains information about advanced features of the RT-Eye application. Refer to the RT-Eye Serial Compliance
and Analysis Online Help for additional information, if needed.
Choosing Probe Types and Measurement Sources
When started, the RT-Eye application is configured with a default probe type and source for the measurements. You canchoose a different probe type and source, either manually or by using the Wizard. This section discusses how to manuallychoose a probe type and source.
You can set the probe type to Single Ended or Differential. To use a single-ended probe type, you must choose two sourcewaveforms, nominally representing the Vpositive and Vnegative inputs to a differential amplifier. The application subtractsVnegative from Vpositive to create a composite waveform on which the measurements are performed. The two sourcewaveforms may be two live waveforms, two reference waveforms, or two .csv files.
When you choose a Differential probe type, you must choose a single-source waveform. This waveform represents theoutput of a differential amplifier external to the oscilloscope, such as that contained in a differential probe. Again, thesource may be a live channel, a reference waveform, or a .csv file.
Source
Use the Source window to configure the source of your measurements. The controls displayed in the window differ,depending on the probe type and source type that you select.
The following procedure configures thesources for a single ended probe type.
1. Select Measurements > Select.
The Select window displays. 1

Using the RT−Eye Software
50 RT-Eye Quick Start User Manual
2. Select Single Ended from the ProbeType drop-down box.
2
3. Select Measurements > Configure >
Source.
3
4. Select the source type. For this exam-ple, select Live.
5. Select your sources from the D+. D−
drop-down box.
The Autoset controls in the followingsteps are available only when thesource type is Live.
6. Click Vertical Scale to autoset the wa-veforms to display full screen verticallybased on the amplitude of the sources.
7. Click Horizontal Resolution to auto-set the time base to the necessary hor-izontal resolution and record length toensure accurate measurements.
8. Click Vertical & Horizontal to autosetboth the vertical scale and the horizon-tal resolution.
4
56 7 8
The following procedure configures thesource for a differential probe type.
1. Select Measurements > Select.
The Select window displays. 1

Using the RT−Eye Software
RT-Eye Quick Start User Manual 51
2. Select Differential from the ProbeType drop-down box.
2
3. Select Measurements > Configure >
Source.
3
The Source window displays. Thisdisplay is for a differential probe typewith Live/Ref selected.
4. In the Differential drop-down box, se-lect the source of the waveform onwhich you want to take measurements.
5. Click Vertical Scale to autoset the wa-veform to display full screen verticallybased on the amplitude of the source.
6. Click Horizontal Resolution to auto-set the time base to the horizontal res-olution and record length necessary foraccurate measurements.
7. Click Vertical & Horizontal to autosetboth the vertical scale and the horizon-tal resolution.
8. Click Select to display the Select Mea-surements window.
4
5 6 7
8

Using the RT−Eye Software
52 RT-Eye Quick Start User Manual
Ref Levels
Use the Ref Levels window to set the high, middle and low reference voltages. The timing instants used by themeasurements are precisely determined by when these voltage thresholds are crossed by the source waveform(s).
You can set any of the reference levels manually, or you can choose Ref Level Autoset so that the application automatical-ly determines appropriate levels. If you do not set the reference levels either manually or using Autoset, the application willuse default values which may cause unexpected measurement results.
Note that the Autoset button in the Measurements > Select window performs an autoset on the horizontal scale, verticalscale, and reference level. (See page 42, Selecting Measurements and Using Autoset.)
To set the reference level values automat-ically, which is the preferred method,perform the following procedure:
1. Click Ref Levels.
The Ref Level Autoset Setup windowdisplays.
2. Click Run.
1
2

Using the RT−Eye Software
RT-Eye Quick Start User Manual 53
Smart Gating
Use gating to narrow the analysis to an area of the waveform specified by a gated region, filtering out unnecessaryinformation. The Smart Gating window has controls for two types of gating. You can gate the region using vertical cursors,or you can use smart gating. If you use smart gating, you must set up a clock recovery window and an analysis windowwithin the specified clock recovery window.
Using Cursors to Set a Gated Region. To set a gated region using cursors, perform the following procedure:
1. In the instrument menu bar, selectCursors > Cursors On. Then selectCursors > Cursor Type > V-bars.
1
2. In the application menu bar, selectMeasurements > Configure > Smart
Gating.
The Smart Gating window displays.2

Using the RT−Eye Software
54 RT-Eye Quick Start User Manual
3. Click Cursors.
4. Use the multipurpose knobs on the in-strument to position the cursors, defin-ing the area of the waveform in whichmeasurements will be taken.
5. Click Start to take measurements onthe waveform between the cursors.
3
5
4
Using Smart Gating to Set Up a Gated Region. To set a gated region using smart gating, you must set up a ClockRecovery Window, and then define your gated region by setting up an Analysis Window within the Clock RecoveryWindow.
Setting Up the Clock Recovery Win-
dow. Perform the following procedure:
1. Click Measurements > Configure >
Smart Gating. 1
2. Click Smart Gating.
3. Click the Gating Units drop-down box,and select the type of units that youwant to use.
4. Click Start in the Clock Recovery Win-dow, and enter the unit interval or edgewithin the record where the clock re-covery starts.
5. Click Length in the Clock RecoveryWindow, and enter the length in unitintervals or edges of the window overwhich the application recovers theclock.
6. Note the unit interval or edge on whichthe clock recovery will stop.
2 43
5
6

Using the RT−Eye Software
RT-Eye Quick Start User Manual 55
You can take measurements on multipleclock recovery windows within thewaveform. To use multiple windows,perform these additional steps:
7. Check Enable Scan.
8. Click Scan Incr, and enter the numberof unit intervals or edges by which youwant to each scan to be offset from theprior one.
9. Click #Scans, and enter the number ofscans that you want to make, or, if youwant to scan the entire record, checkScan to End of Record.
7
89
Setting Up the Analysis Window. After setting up the Clock Recovery Window, you must set up the Analysis Window.There are three ways to set up the Analysis Window:
� The same as the Clock Recovery Window
� A smaller region centered within the Clock Recovery Window
� A user-defined region positioned anywhere within the Clock Recovery Window
To set up the Analysis Window, perform the one of the following procedures.
Setting the Analysis Window the same
as the Clock Recovery Window.
1. Check Same as Clock Recovery Win-
dow. Your Analysis Window is now setup.
1

Using the RT−Eye Software
56 RT-Eye Quick Start User Manual
Setting the Analysis Window Centered
within the Clock Recovery Window.
1. Clear the Same as Clock Recovery
Window check box.
2. Select Centered from the Alignmentdrop-down box.
3. Click Length, and set the size of thewindow in unit intervals or edges. YourAnalysis Window is now set up.
12
3
Setting a User-Defined Analysis
Window within the Clock Recovery
Window.
1. To specify the absolute position of theAnalysis Window within the Clock Re-covery Window, select User Defined
from the Alignment drop-down box.
2. Click Start, and enter the unit intervalor edge that you want the AnalysisWindow to start.
3. Click Length, and set the size of thewindow in unit intervals or edges. YourAnalysis Window is now set up.
1
3
2
Clock Recovery
Use the following procedures to set upclock recovery using different clockrecovery methods.
To set up clock recovery as a phase-locked loop with the bandwidth based onan industry standard method, perform thefollowing procedure:
1. Click Clock Recovery.
The Clock Recovery window displays.
2. Click the Method drop-down box andselect PLL:Standard BW.
1
2

Using the RT−Eye Software
RT-Eye Quick Start User Manual 57
3. Select the standard to which you wantto test from the Standard : b/s drop-down box.
3
4. Click the PLL Order drop-down box,and select between a first-order or sec-ond-order loop.
5. If you select Second for the PLL Order,click the Damping control, and enter avalue for the damping ratio of the PLL.
6. Normally, the clock recovery softwareautomatically determines the bit rate ofthe waveform. To explicitly guide theclock recovery software, click On forthe Nominal Data rate.
7. Click the Bit Rate control, and enterthe nominal bit rate in bits per second.
4 5
6
7
To set up the Clock Recovery at a PLLwith a user-defined bandwidth, performthe following procedure:
1. Click the the Method drop-down box,and select PLL: User BW.
2. Click the User BW control, and inputthe bandwidth.
3. To use the other controls in this win-dow, follow the instructions in the in-dustry standard procedure (startingwith step 4).
2
1
To set up the Clock Recovery to use theconstant clock mean or the constant clockmedian method, perform the followingprocedure:
1. Click the Method drop-down box andselect Const Clk Mean or Const Clk
Median.
2. To explicitly guide the bit rate used bythe clock recovery software, do steps 6and 7 in the industry standard proce-dure.
1

Using the RT−Eye Software
58 RT-Eye Quick Start User Manual
Jitter
Use the controls in the Jitter window toset up for Jitter@BER measurements.These controls are not required for a TIEjitter measurement.
If your waveform has a cyclically-repeat-ing pattern and you know the patternlength in unit intervals, perform thefollowing procedure:
1. Click Jitter.
2. Select Repeating in the Type drop-down box.
2
1
3. Select from one of the industry-standard bit patterns in the Patterndrop-down box. If your pattern is notlisted, choose Custom.
4. If you selected Custom as the pattern,then enter the pattern length.
5. Click the BER control, and enter the biterror ratio. The eye opening and totaljitter at this BER is extrapolated.
3
4 5
If your waveform does not have arepeating pattern, or has a repeatingpattern for which you do not know thelength, perform the following procedure:
1. Click Jitter.
2. Select Arbitrary in the Type drop-downbox.
3. Click the Window Length control toset the number of history bits used tocalculate data-dependent jitter for eachedge in the waveform (typically 5 to 10bits).
4. Click the Population control to set theminimum population that each bit pat-tern must be observed before it is usedas a basis for data-dependent jitter cal-culations (typically 100 to greater than1000).
5. Click the BER control, and enter the biterror rate. The measurement will ex-trapolate the eye opening and total jit-ter at this BER.
2
3 4 5
1

Using the RT−Eye Software
RT-Eye Quick Start User Manual 59
Population
Use the controls in the Population windowto set the maximum population on whichthe selected measurements are taken. InFree Run mode, sequencing will automat-ically halt when the specified population isreached on all measurements.
1. Click Population.
2. Click On.
3. Select Measurement or Acquisitions
in the Limit By drop-down box.
4. Click the Limit control, and specify thenumber of measurements or acquisi-tions that you want to set as the limit.
1
23
4
General Config
Use the controls in the General Configwindow to set whether rise, fall, andamplitude measurements are limited totransition bits or all bits. You can alsoenable worst-case logging in the scanmode.
1. Click General Config.
2. Click to toggle the features.
1
2

Using the RT−Eye Software
60 RT-Eye Quick Start User Manual
Setting Limits
The Serial Analysis module provides a Limits file that includes combinations of all measurements and statisticalcharacteristics and an appropriate range of values for each combination. The application can use the Limits file and amask file to determine the Pass or Fail status for compliance tests. You can view and edit existing files or create new limitfiles that meet your test needs.
Viewing the Current Limits
To view the current limits, perform thefollowing procedure:
1. Select Measurements > Limits.
The Limits window displays.
1
2. Click Off.
3. Click Browse to find the Limits file thatyou want to display.
4. Click Current.
The RT-Eye Limits Editor Editor opensand displays the values in the currentlyselected Limits file.
2 4
3

Using the RT−Eye Software
RT-Eye Quick Start User Manual 61
Editing the Currently Displayed Limit File
To edit the currently displayed Limit file,perform the following procedure:
5. Using the drop-down boxes and con-trols, edit any measurement, statistic,lower limit, or upper limit that youwant.
6. To add a new measurement, click + inthe toolbar. A new line is added withNone selected as the measurement tothe end of the list. Set up this mea-surement as you want.
7. To remove a measurement, selectNone as the measurement, and clickCompact. Compact removes all mea-surements that are set to None.
8. Click Validate to verify that the limitsfor each measurement are valid andthat there are no duplicate measure-ments.
5
6
78

Using the RT−Eye Software
62 RT-Eye Quick Start User Manual
Viewing a Summary of the Limits
9. To view a summary of the currently dis-played file, select File > Show Sum-
mary.
The Summary window displays.9
The summary table displays all themeasurements, statistics, lower limits,and upper limits that you have set up.
10. Click OK.
10

Using the RT−Eye Software
RT-Eye Quick Start User Manual 63
Saving the Limits File
11. Click Cancel to close the editor with-out saving any of your changes.
12. Click Save As to save your file. Besure to save the file with a differentname, unless you want to overwrite thecurrent file.
12 11
13. Close the RT-Eye Limits Editor.
Using Limits
14. After you select the Limits file that youwant to use, click On.
15. Click Start.
The Result Summary window displays. 14 15
16. Check the Status column for PASS/FAIL results for the measurements onwhich you set limits.
16

Application Examples
64 RT-Eye Quick Start User Manual
Application Examples
Creating a Custom Compliance Module with Pass/Fail Limits
This application example shows you how to perform jitter analysis compliant with T11.2 MJSQ methodology using thespectrum approach. You will use the Setup Wizard to quickly set up and take your measurements and display plots, selectan appropriate mask for the eye diagram, define a limits module, create a compliance report, and save your test so thatyou can run it when you start up the application again (or at any other time).
The signal used for this example is a 127 bit, PRBS repeating pattern. A Tektronix P7380SMA differential probe withphase-matched SMA cables is connected to the positive and negative outputs of a 2.5 Gb/s signal source. The differentialprobe is then connected to Channel 1 of the instrument.
The RT-Eye Serial Data Compliance and Analysis Application must be installed and enabled on your instrument.
Starting the RT-EyeApplication
1. Press AUTOSET on the front panel ofthe instrument to view the differentialsignal.
2. Start the application:
� For non-B and non-C modeloscilloscopes, select File > Run
Application > RT-Eye Serial
Compliance and Analysis.
2

Application Examples
RT-Eye Quick Start User Manual 65
� For B and C model oscilloscopes,select App > RT-Eye Serial
Compliance and Analysis.
2
The RT-Eye application displays in thelower half of the screen.
Running the Setup Wizard
3. If the RT-Eye Welcome dialog box dis-plays, click Run Wizard.
3
4. If the RT-Eye Welcome dialog boxdoes not display, select Measure-
ments > Wizard�. 4

Application Examples
66 RT-Eye Quick Start User Manual
5. Make the following selections in theSetup Wizard:
Step 1�Differential
Step 2�Ch1
Step 3�PCIE : 2.5G
Step 4�Timing, Amplitude, TIE
Jitter, Jitter@BER, Repeating, 127 UI
Step 5�Yes
Step 6�Yes
Step 7�Eye Diagram, Spectrum,
Bathtub Curve, Jitter Histogram
6. Click Run.6
5
Viewing the Results
7. View the results.
The Plot Summary window displaysthe plots that you selected and theResults Summary window displays themeasurements.
8. Click Details.
7
8

Application Examples
RT-Eye Quick Start User Manual 67
9. Select Jitter @ BER from the SelectMeasurement drop-down box.
10. View the details of the Jitter @ BERmeasurement.
9
10
Summary of Displayed Results
The three plots of jitter and the corresponding measurements represent a typical method of taking jitter measurementsusing the Spectrum Method of Rj/Dj separation.
The TIE histogram (lower left-hand plot) is the traditional method of measuring jitter on an oscilloscope. This method islimited by the amount of statistical certainty that can be achieved in a reasonable amount of time. More advanced DSPmethods are used to determine the jitter eye opening, total jitter, random jitter, and deterministic Jitter.
The TIE measurements are transformed into the frequency domain by performing an FFT on the raw TIE data, creating thejitter spectrum shown in the upper right-hand plot. The spikes in the frequency domain represent deterministic jitter. Furtheranalysis can be done to determine which spikes are Duty Cycle Distortion (DCD), which are Data Dependent Jitter (DDJ),and which are Periodic Jitter (PJ). Once these values are removed (DJ), then what is left is a noise floor which representsthe Random Jitter (RJ).
These transformed values are used to create the Cumulative Distribution Function (CDF), commonly known as theBathtub Curve, shown in the lower right−hand plot. The magenta line at 10 −12 BER represents the jitter eye openingmeasurement. As can be seen by the measurement results, the following equation applies:
Eye Opening @ BER = [1 UI − Total Jitter @ BER]
For more information about the spectrum approach to jitter measurements, refer to the MJSQ (Methodologies in Jitter andSignal Quality) PDF file at:
http://www.t11.org/ftp/t11/pub/fc/mjsq/04−101v4.pdf

Application Examples
68 RT-Eye Quick Start User Manual
Using a Mask
You have taken your measurements andviewed the associated plots. Now, you willdisplay a custom or industry-standardmask on the Eye Diagram plot.
11. Select Plots > Config.
11
12. Click 1.
13. Click Browse.
The browse window opens.13
12
14. Locate and select the PCI Expressfolder in the Masks directory.
15. Click Open.
14
15
Application Examples
RT-Eye Quick Start User Manual 69
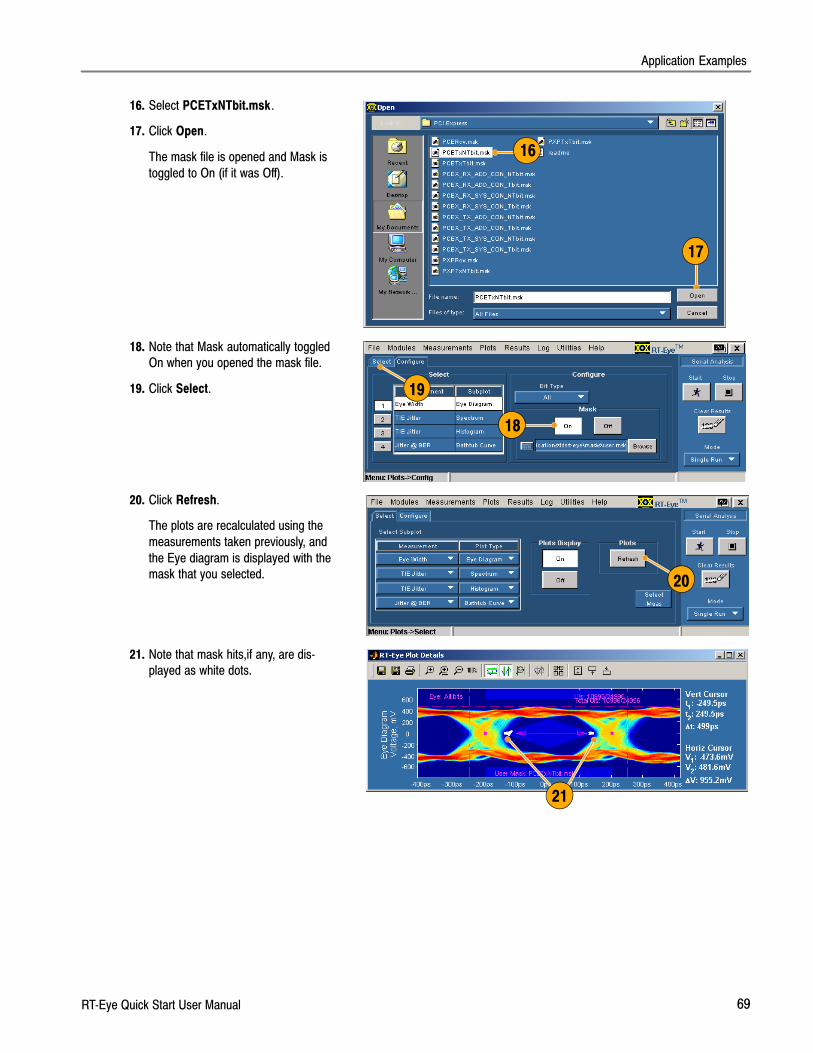
16. Select PCETxNTbit.msk.
17. Click Open.
The mask file is opened and Mask istoggled to On (if it was Off).
16
17
18. Note that Mask automatically toggledOn when you opened the mask file.
19. Click Select. 19
18
20. Click Refresh.
The plots are recalculated using themeasurements taken previously, andthe Eye diagram is displayed with themask that you selected.
20
21. Note that mask hits,if any, are dis-played as white dots.
21

Application Examples
70 RT-Eye Quick Start User Manual
Defining a Limits Module
You have taken measurements, viewedplots, and added an industry-standardmask to your eye diagram, Now, you willcreate a limits module to apply a limit tothe TIE Jitter measurement takenpreviously.
22. Select Measurements > Limits.
22
23. Click New.
The RT-Eye Limits Editor windowopens.
23
24. Select TIE Jitter from the Measure-ment drop-down box.
24

Application Examples
RT-Eye Quick Start User Manual 71
25. Select Min from the Statistic drop-down box.
26. Enter −60ps in the Lower Lim box.
25 26
27. Click + to add another measurement.
28. Select TIE Jitter from the Measure-ment drop-down box.
29. Select Max from the Statistic drop-down box.
30. Enter 60ps in the Upper Lim box.
31. Click Save As.
The Save window displays.
27
28 29 30
31

Application Examples
72 RT-Eye Quick Start User Manual
32. Enter Jitter.lim as the file name.
33. Click Save.
The Save window closes.
32 33
34. Close the RT-Eye Limits Editior win-dow.
34
35. Click Browse.
35

Application Examples
RT-Eye Quick Start User Manual 73
36. Select Jitter.lim as the limits file.
37. Click Open.
The Limits browse window closes. 36
37
38. Click On.
38
39. Select Results > Details.
40. Click Clear Results.
41. Click Start. 3339
41
40
42. Select TIE Jitter.
43. Note the PASS/FAIL status of the mea-surement limits that you set up in theLimits file.
42
43

Application Examples
74 RT-Eye Quick Start User Manual
Creating a Compliance Report
You have taken measurements, viewedplots, added an industry-standard mask toyour eye diagram, and created a Tie Jitterlimits file. Now you will generate acompliance report. Perform the followingsteps:
44. Select Utilities > Reports.
44
45. Click Generate.
Wait until the report generator isfinished.
45
When completed, the report displays.(Use the Alt+Tab key combination tobring the report to the front, if neces-sary.)

Application Examples
RT-Eye Quick Start User Manual 75
Using MyTest
You have created a custom compliancetest module. Now you will use MyTest tosave your test and run it automaticallywhen you start the application (orwhenever you want).
To save your settings as a MyTest file,perform the following procedure:
46. Select Measurements > Save
MyTest.
Your current setup is saved as MyTest. 46
47. Select File > Exit.
The Exit RT-Eye dialogue windowdisplays.
47
48. Click No to exit without restoring oscil-loscope settings.
48

Application Examples
76 RT-Eye Quick Start User Manual
To run MyTest from the RT-Eye Welcomedialogue box, which displays when youstart the RT-Eye application, perform thefollowing procedure:
49. Start the application:
� For non-B and non-C modeloscilloscopes, select File > Run
Application > RT-Eye Serial
Compliance and Analysis.
The RT-Eye Welcome dialogue boxdisplays.
49
� For B and C model oscilloscopes,select App > RT-Eye Serial
Compliance and Analysis.
The RT-Eye Welcome dialogue boxdisplays.
49
50. Click Run MyTest.
The application takes the measure-ments and displays the results in theResult Summary window.
50
51. If the RT-Eye Welcome window did notappear, then select Measurements >
Run MyTest.
The application takes the measure-ments and displays the results in theResult Summary window.
51
Index
RT-Eye Quick Start User Manual 77
Index
AAccessories, standard, 5Application directories, location, 19Application Examples, 64Application installation, 5Application set up, 21Autoset Summary dialog window, 12
BBandwidth, system, 6Bit Error Locator, 46
CCalibration of oscilloscope and probes, 8Clock Recovery, 56
See also Configuring Measure-ments
Closing the application, 17Compatibility, 2Compliance modules, 2Configurations, probing. See Probing
configurations, typicalConfiguring Measurements, 49
Clock RecoveryBit Rate, 57Const Clk Mean, 57Const Clk Median, 57Damping, 57Industry standard method, 56Nominal Data Rate, 57PLL Order, 57PLL: Standard BW, 56PLL: User BW, 57Standard: b/s, 57User BW, 57User−defined method, 57
General Config, 59Enable worst−case logging, 59General Config Window, dis-
playing the , 59Limit Amplitude measure-
ments, 59Limit Rise/Fall measurements,
59Jitter, 58
Arbitrary pattern, 58BER, 58Jitter window, displaying, 58Length, 58Pattern, 58
Population, 58Repeating pattern, 58Type, 58Window Length, 58
PopulationLimit by Acquisitions, 59Limit by Measurements, 59Limit value, 59Population Limit, toggling, 59Population Window, displaying,
59Ref Levels, Autoset
Accessing Ref Levels window,52
Setup, 52Smart Gating, 53
#Scans (Clock Recovery), 55Accessing Smart Gating win-
dow, 53, 54Analysis Window, setting up,
55Button, Smart Gating, 54Centered (Analysis), 56Clock Recovery, setting up, 54Cursors, 54Enable Scan (Clock Recovery),
55Gating Units, 54Length (Analysis), 56Length (Clock Recovery), 54Same as Clock Recovery Win-
dow (Analysis), 55, 56Scan Incr (Clock Recovery), 55Scan to End of Record (Clock
Recovery), 55Start (Analysis), 56Start (Clock Recovery), 54Stop (Clock Recovery), 54User−defined (Analysis), 56
Source, 49Accessing Source window, 50Autoset, 50Differential Probe, 50Horizontal Resolution, 50, 51Single Ended Probe, 49Source Type, 50Source, inputs, 50, 51Vertical & Horizontal, 50, 51Vertical Scale, 50, 51
Configuring Plots, 44Bathtub Curve, 45
Scale, 45
Eye Diagram, 44Bit Type, 44Toggling masks, 44
Histogram, 45Bin resolution, 45Vertical axis, selecting, 45
SpectrumHorizontal scale, selecting, 45Toggling masks, 45Vertical scale, selecting, 45
Connection to device under test, 6Conventions used in this manual, viCSV file, exporting to, 33Cursors
Positioning, 28Readouts, 28Resetting, 28Turning off, 28Using, 28
DDefining preferences
Autoset Summary dialog window,12
High−performance eye rendering,12
Welcome window, 12Deskew, probe, 7Details, viewing plot summary, 26Device under test, connections to, 6Docking the application, 15Documentation, v
EExamples, application, 64Exiting the application, 17Exporting plots
Data file, 30Graphics file, 30
FFeatures, key, 1
GGeneral Config. See Confiiguring Mea-
surementsGeneral Safety Summary, iii

Index
78 RT-Eye Quick Start User Manual
HHiding the application, 13High−performance eye rendering, 12
IInstallation, 5Interface, user, 18
JJitter. See Configuring MeasurementsJitter, configuring for, 58
KKey features, 1Keyboard, 5
LLimits, 60
Compacting a Limits File, 61Limits File Editor, 60Limits File, browsing for a, 60Limits File, editing, 61Limits File, saving a, 63Limits Window, displaying, 60Setting, 60Summary of limits, 62Summary table, example of, 62Toggling on or off, 60PASS?FAIL, 63Using, 63Validating a Limits File, 61Viewing , 60
Location of application directories, 19Logging worst case waveforms, 39
MManual conventions, viMATLAB, 5Measurements
Additional for Single Ended, 43Autoset, using, 42, 43Configuring. See Configuring Mea-
surementsDetail View, 33Displaying the measurement win-
dow, 42Exporting to CSV file, 33
Selecting, 42Selecting all, 43Selecting Probe Type, 43Turning off or on, 43
Menu structure, 18Minimizing and maximizing the applica-
tion, 14Minimum requirements, 3Modules, compliance, 2MyTest, 41
Running, 42Running from the menu, 42Running from the Welcome window,
42, 76Saving from the menu, 41, 75Saving when exiting, 41
OOscilloscope, 5Oscilloscope calibration, 8
PPreferences, defining, High−performance
eye rendering, 12Plot Summaries
Cursor functions. See CursorsDisplay full screen, 25Display in lower half of screen, 24Display in upper half of screen, 25Grid display, 29Viewing, 24Viewing details, 26Zoom function. See Zoom
PlotsConfiguring. See Configuring PlotsExporting, 30Printing, 31Reconfiguring. See Configuring
PlotsSelecting, 43
From menu, 43Measurement to be plotted, 44Plot type, 44Using button, 43
Population, configuring, 59See also Configuring Measure-
mentsPreferences, defining, 12
Autoset Summary dialog window,12
Welcome window, 12
Probe calibration, 8Probe deskew, 7Probe type, Selecting in Wizard, 23Probing configurations, typical, 6
One P73XX differential probe, 7One P73XX SMA differential probe,
7Two P72XX single−ended or P73XX
differential probes, 7Two TCA−to−SMA adapters, 6
RRef Levels, 52
Configuring. See Configuring Mea-surements
Related documentation, vRelevant Web Sites, vReports
Accessing the Report Generator,34, 74
Compliance, 34Creating new, 34Directory, 34Example of , 35, 74File formats, 34Generate button, 34, 74Generating, 34Moving the Report window to the
front, 35, 74Printer icon, 35Printing, 35Printing a saved report, 36, 38Report generator utility, 34Saving, 36Selecting a printer, 35Viewing a saved report, 36
Requirementskeyboard, 5MATLAB, 5minimum, 3oscilloscope, 5
ResultsAccessing the Detail View, 33Accessing the Summary View, 32Detail view, 32Detail window example, 33Exporting to CSV file, 33Measurement selection for details,
33Summary view, 32Time Units, selecting, 33

Index
RT-Eye Quick Start User Manual 79
SSafety Summary, General, iiiSave MyTest check box, 17Sequencing Controls, 16
ModesFree Run, 16Single No Acq, 16Single Run, 16
Stop, 16Setup Wizard
Access from menu, 22, 65Access from Welcome window, 22Example display, 23Probe type,selecting, 23Running the, 23Selections, making, 23Summary windows example, 24Using the, 22
Setup, saving a, 41Smart Gating
See also Configuring Measure-ments
Types, 53Source, Configuring. See Configuring
Measurements
Standard accessories, 5Starting the application
Newer instruments, 11, 22Older instruments, 11, 22
Structure, menu, 18System bandwidth, 6
TTime units, selecting, 33
UUndocking the application, 15User interface, 18
VViewing Results, 32
WWaveforms
Accessing the Config controls, 39
Browsing to a log file, 39File names, 40Logging worst case, 39Opening a worst case file, 39Purging worst case files, 40Turning off logging, 40Turning on logging, 39
Web sites, relevant, vWelcome window, 12Wizard, Setup. See Setup Wizard
ZZoom, 26
100% icon, 28Horizontal, 27Horizontal, multiple times, 28In, 26In, multiple times, 27Out, 27Out, multiple times, 27

Index
80 RT-Eye Quick Start User Manual


![[XLS]s446aec1b0de51350.jimcontent.coms446aec1b0de51350.jimcontent.com/download/version/... · Web viewCQ 0765 RT CQ 0965 RT CQ 1265 RT CQ 1465 RT CQ 1565 RT CVA 2411 ORI CX 065 CX](https://static.fdocuments.us/doc/165x107/5af8be3d7f8b9ae92b8b7689/xls-viewcq-0765-rt-cq-0965-rt-cq-1265-rt-cq-1465-rt-cq-1565-rt-cva-2411-ori-cx.jpg)