RS U2C1A6 Turn to page137& copy the key question. “ Describing the Motion of an Object with...
43
RS U2C1A6 Turn to page137& copy the key question. “Describing the Motion of an Object with Constant Speed”
-
Upload
cory-copeland -
Category
Documents
-
view
214 -
download
1
Transcript of RS U2C1A6 Turn to page137& copy the key question. “ Describing the Motion of an Object with...

RS U2C1A6Turn to page137& copy
the key question.
“Describing the Motion of an Object with Constant
Speed”

slopethe tilt or slant of a straight line on a graph: the rise divided by the run

slope
Rise
Run

9 miles
+12 - (3) = 9 miles

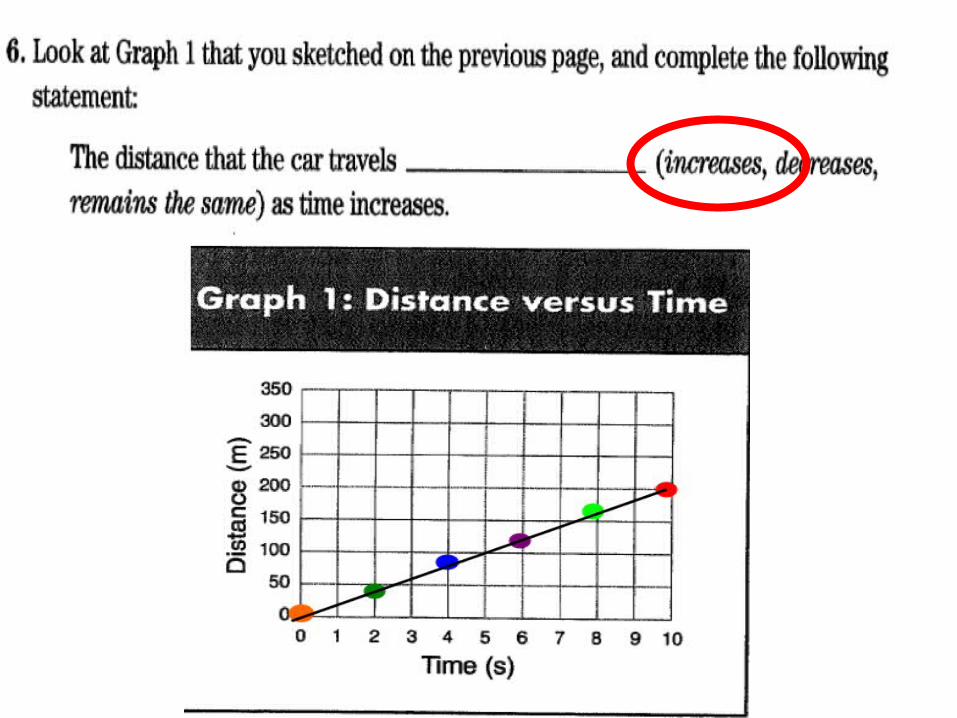
1. If Amy starts from her house and rides her bike to Alex’s house, what would be the distance she traveled?
7 miles
+3 -(-4) = 7 miles

Read page 139Calculating the Speed of
an Object
constant speed simulator

speed = distance traveled
time elapsed
Write the formula below on your Record Sheet (back of last page)
speed = distance
time


Now it’s your turn!

2. What is the speed of the car between 4.0 s and 10.0 s? SHOW YOUR WORK!!

Now complete #’s 3 & 4 (p.140) on your own!

3. Ephraim walks to his job every day. His workplace is located 2 km (2000 m) from his home. He takes 20 min (or 1/3 hour) to get to work. How fast is he walking?: Give an answer in both meters per minute (m/min) and kilometers per hour (km/h).
SHOW YOUR WORK!


4. In the distant future, Rachel flies a single-person, high-speed spacecraft between Earth and the Moon.
Once she gets out of Earth’s atmosphere, Rachel makes the 384,000 km trip in exactly 1000 s. How fast
is Rachel moving? SHOW YOUR WORK!


p 139, yellow data table


Students: Copy Graph 2 from the
video
• Finish viewing race car video #1showing both graphs.

remains the same

• Link to simulator movie: two different speeds
• (Hint: Race car vs. Plower)

slopethe tilt or slant of a straight line on a graph: the rise divided by the run

8. Compare the slopes of the two plotted lines on the distance versus time graphs below (graph 3 and graph 4)

The line for graph 3 is steeper than the line for graph 4. The slope is _________ for graph 3, and the slope is ______ for graph 4.

9. Compare the slopes of the two plotted lines on the speed versus time graphs below.

#9. The slope of graph 5 and graph 6 is zero. No change is occurring in the speed over time. Their speed is constant!

slope
Rise
Run


Rise = 75 m
Run = 3s


Rise = 50m
Run = 10s


The line for graph 3 is steeper than the line for graph 4. The slope is 25/1 for graph 3, and the slope is 5/1 for graph 4. Graph 3 has a greater slope- 25/1 is greater than 5/1.


p 143


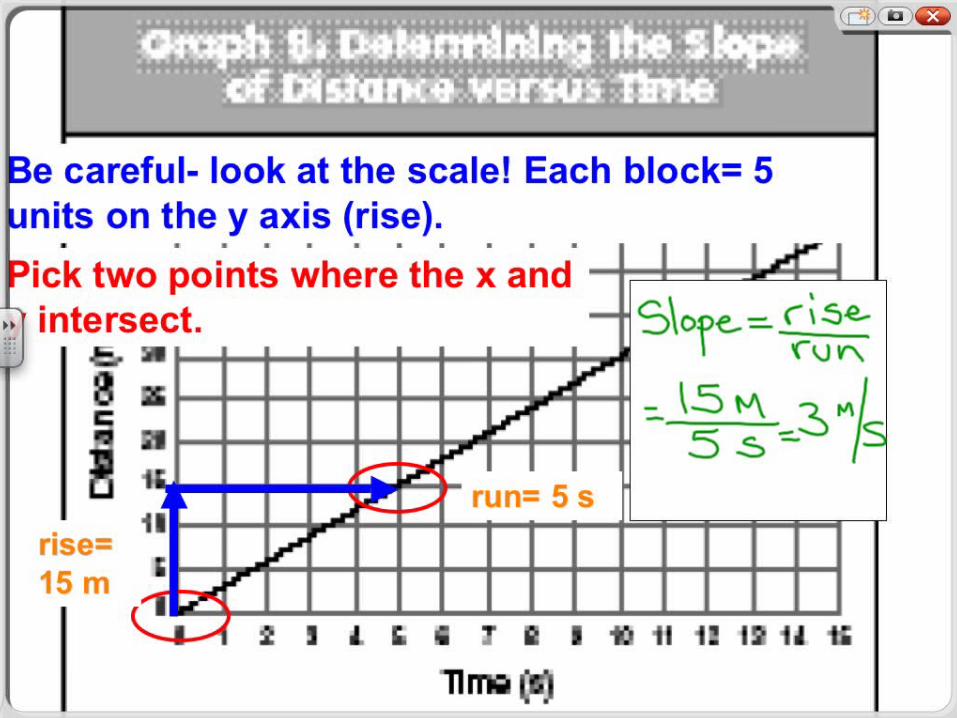
Be careful- look at the scale! Each block= 5 units on the y axis (rise).
Pick two points where the x and y intersect.
rise= 15 m
run= 5 s


How can you determine the speed of an object that has constant motion?
2 ways:
1)speed distance time2)graph a distance vs. time
graph and measure the slope of the line (slope = rise run)