RR528 An investigation of reporting of workplace … and Safety Executive An investigation of...
34
Health and Safety Executive An investigation of reporting of workplace accidents under RIDDOR using the Merseyside Accident Information Model Prepared by the University of Liverpool for the Health and Safety Executive 2007 RR528 Research Report
-
Upload
phungtuyen -
Category
Documents
-
view
216 -
download
0
Transcript of RR528 An investigation of reporting of workplace … and Safety Executive An investigation of...
Health and Safety Executive
An investigation of reporting of workplace accidents under RIDDOR using the Merseyside Accident Information Model
Prepared by the University of Liverpool for the Health and Safety Executive 2007
RR528 Research Report
Health and Safety Executive
An investigation of reporting of workplace accidents under RIDDOR using the Merseyside Accident Information Model
Dr John C Davies Computing Services Department The University of Liverpool Chadwick Building Peach Street Liverpool L69 7ZF
Dr Graham J Kemp & Professor Simon P Frostick Faculty of Medicine The University of Liverpool The Duncan Building Daulby Street Liverpool L69 3GA
This study investigated the under-reporting of accidents to HSE by matching patients attending the Royal Liverpool University Hospital with cases reported to HSE. Patients were followed up to establish time lost from work and this data together with severity of injuries established which accidents should be reported. The largest number of reportable accidents was from occupations connected with the construction industry, both labouring and trades. Sales assistants and unqualified nursing assistants were also prominent. Reporting rates varied between sectors: local and central government had the highest reporting rate; the three lowest were catering/repairs, distribution/hotels and other manufacturing. The comparison with accidents actually reported to HSE suggested that the main reason accidents were reported was time lost from work and that other factors were ancillary. Major injury and reduced duties on their own were largely ignored when accidents were reported, however major injury in conjunction with time lost increased the likelihood that accidents would be reported. Overall 30% of reportable accidents from the study were reported to HSE. Self employed workers were poor at reporting accidents, with a reporting rate of 12%, compared with 32% for employed workers.
This report and the work it describes were funded by the Health and Safety Executive (HSE). Its contents, including any opinions and/or conclusions expressed, are those of the authors alone and do not necessarily reflect HSE policy.
HSE Books
© Crown copyright 2007
First published 2007
All rights reserved. No part of this publication may bereproduced, stored in a retrieval system, or transmitted inany form or by any means (electronic, mechanical,photocopying, recording or otherwise) without the priorwritten permission of the copyright owner.
Applications for reproduction should be made in writing to:Licensing Division, Her Majesty’s Stationery Office,St Clements House, 2-16 Colegate, Norwich NR3 1BQor by e-mail to [email protected]
ii
CONTENTS
ABSTRACT ......................................................................................................................................... iCONTENTS .......................................................................................................................................iiiEXECUTIVE SUMMARY ................................................................................................................ v1 INTRODUCTION .......................................................................................................................... 12 METHODS ..................................................................................................................................... 2
2.1 Recruiting patients ............................................................................................ 22.2 MAIM interview ............................................................................................... 22.3 Telephone MAIM interview ............................................................................ 32.4 Patient follow-up survey .................................................................................. 32.5 Matching accidents reported to HSE ............................................................... 3
3 RESULTS........................................................................................................................................ 53.1 Patient survey .................................................................................................... 53.2 Reportable accidents ......................................................................................... 53.3 Cases matched in MAIM and RIDDOR.......................................................... 73.4 Estimate of under-reporting ............................................................................. 73.5 Industries ........................................................................................................... 73.6 RIDDOR classification................................................................................... 103.7 Reporting accidents and employment status ................................................. 113.8 Occupations ..................................................................................................... 123.9 MAIM events .................................................................................................. 133.10 Injuries ............................................................................................................. 163.11 Telephone MAIM interview .......................................................................... 17
4 DISCUSSION ............................................................................................................................... 194.1 Reasons for reporting accidents ..................................................................... 194.2 Similarities and differences with the 1999 study.......................................... 194.3 Marginal increase in major injuries ............................................................... 204.4 Comparing underreporting with other sources.............................................. 214.5 Over reporting ................................................................................................. 214.6 Reporting rates and employment status......................................................... 224.7 Collection of MAIM accident data by telephone interviews ....................... 22
REFERENCES.................................................................................................................................. 23APPENDIX Example of accident data recorded by MAIM ............................................... 24
iii

iv
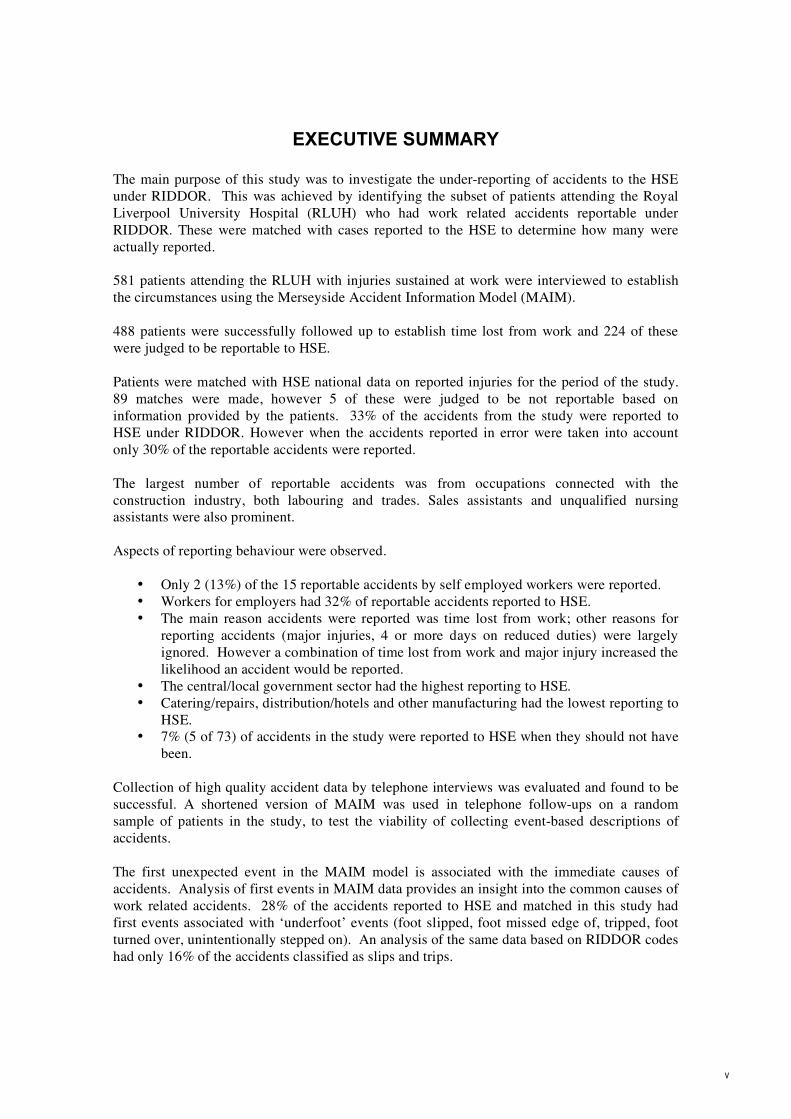
EXECUTIVE SUMMARY
The main purpose of this study was to investigate the under-reporting of accidents to the HSE under RIDDOR. This was achieved by identifying the subset of patients attending the Royal Liverpool University Hospital (RLUH) who had work related accidents reportable under RIDDOR. These were matched with cases reported to the HSE to determine how many were actually reported.
581 patients attending the RLUH with injuries sustained at work were interviewed to establish the circumstances using the Merseyside Accident Information Model (MAIM).
488 patients were successfully followed up to establish time lost from work and 224 of these were judged to be reportable to HSE.
Patients were matched with HSE national data on reported injuries for the period of the study. 89 matches were made, however 5 of these were judged to be not reportable based on information provided by the patients. 33% of the accidents from the study were reported to HSE under RIDDOR. However when the accidents reported in error were taken into account only 30% of the reportable accidents were reported.
The largest number of reportable accidents was from occupations connected with the construction industry, both labouring and trades. Sales assistants and unqualified nursing assistants were also prominent.
Aspects of reporting behaviour were observed.
• Only 2 (13%) of the 15 reportable accidents by self employed workers were reported. • Workers for employers had 32% of reportable accidents reported to HSE. • The main reason accidents were reported was time lost from work; other reasons for
reporting accidents (major injuries, 4 or more days on reduced duties) were largely ignored. However a combination of time lost from work and major injury increased the likelihood an accident would be reported.
• The central/local government sector had the highest reporting to HSE. • Catering/repairs, distribution/hotels and other manufacturing had the lowest reporting to
HSE. • 7% (5 of 73) of accidents in the study were reported to HSE when they should not have
been.
Collection of high quality accident data by telephone interviews was evaluated and found to be successful. A shortened version of MAIM was used in telephone follow-ups on a random sample of patients in the study, to test the viability of collecting event-based descriptions of accidents.
The first unexpected event in the MAIM model is associated with the immediate causes of accidents. Analysis of first events in MAIM data provides an insight into the common causes of work related accidents. 28% of the accidents reported to HSE and matched in this study had first events associated with ‘underfoot’ events (foot slipped, foot missed edge of, tripped, foot turned over, unintentionally stepped on). An analysis of the same data based on RIDDOR codes had only 16% of the accidents classified as slips and trips.
v

vi

5
1 INTRODUCTION
Under the Reporting of Injuries, Diseases and Dangerous Occurrences Regulations (RIDDOR), employers and the self-employed are required to report some work-related accidents. Reportable accidents to workers comprise three categories: those where a worker is killed, those where a worker sustains a defined major injury and those where a worker sustains an injury that results in their being away from work or their normal duties for more than three days. Recently there has been a change in the pattern of reported major and over-3-day injuries. The rate of reported major injuries has marginally increased while the rate of reported over-3-day injuries has decreased. Previously, there was a general decrease in the incidence rates for both categories.
The main purpose of this study was:
1. To investigate prospectively the under-reporting of accidents to the HSE under RIDDOR among patients attending the Royal Liverpool University Hospital (RLUH) for treatment of work-related injuries.
This was achieved by identifying the subset of patients who had accidents reportable under RIDDOR, and then matching these to those in HSE systems in order to determine how many were actually reported. We also compared reported and reportable cases by nature of injury, kind of accident and industry to determine how representative reported injuries are of those reportable under RIDDOR. The methods are similar to work reported for contract R64.040 (1999), but with a focus on the reporting of major versus over-3-day injuries, where the pattern of reporting appears to have changed in recent years.
Subsidiary aims were to use the patient base and the interview opportunity to investigate some relationships between reaction time and falls which are of potentially great significance in prevention of accidents. We have interests in three such relationships:
2 That between reaction time and falls in the general population. 3 That between reaction time and falls in postmenopausal women. 4 That between reaction time and falls during the menstrual cycle.
Finally, we aimed to establish a practical matter:
The feasibility of collecting high quality accident histories by a telephone interview.
The objectives 2, 3 and 4 are beyond the scope of this report and the data will be analysed as a separate exercise to investigate these objectives. However, the number of cases recorded has proved to be significantly smaller than our initial projections, reducing the power of the study to achieve these ancillary objectives.
1
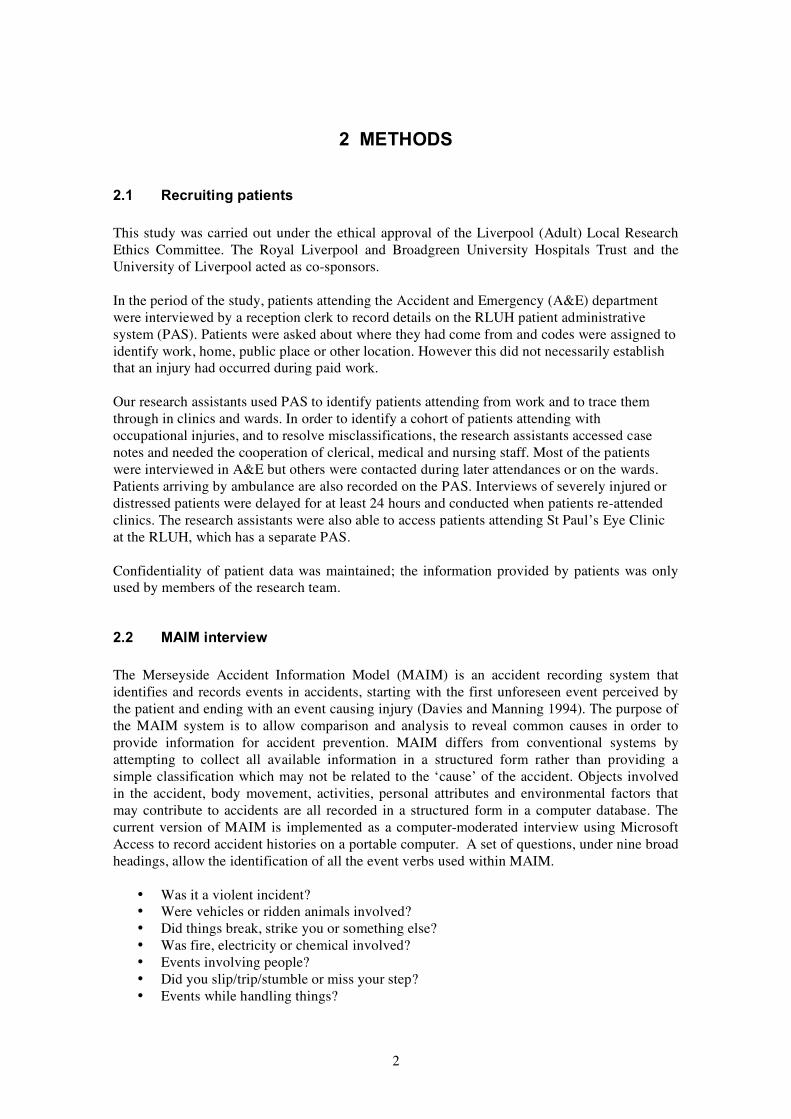
2 METHODS
2.1 Recruiting patients
This study was carried out under the ethical approval of the Liverpool (Adult) Local Research Ethics Committee. The Royal Liverpool and Broadgreen University Hospitals Trust and the University of Liverpool acted as co-sponsors.
In the period of the study, patients attending the Accident and Emergency (A&E) department were interviewed by a reception clerk to record details on the RLUH patient administrative system (PAS). Patients were asked about where they had come from and codes were assigned to identify work, home, public place or other location. However this did not necessarily establish that an injury had occurred during paid work.
Our research assistants used PAS to identify patients attending from work and to trace them through in clinics and wards. In order to identify a cohort of patients attending with occupational injuries, and to resolve misclassifications, the research assistants accessed case notes and needed the cooperation of clerical, medical and nursing staff. Most of the patients were interviewed in A&E but others were contacted during later attendances or on the wards. Patients arriving by ambulance are also recorded on the PAS. Interviews of severely injured or distressed patients were delayed for at least 24 hours and conducted when patients re-attended clinics. The research assistants were also able to access patients attending St Paul’s Eye Clinic at the RLUH, which has a separate PAS.
Confidentiality of patient data was maintained; the information provided by patients was only used by members of the research team.
2.2 MAIM interview
The Merseyside Accident Information Model (MAIM) is an accident recording system that identifies and records events in accidents, starting with the first unforeseen event perceived by the patient and ending with an event causing injury (Davies and Manning 1994). The purpose of the MAIM system is to allow comparison and analysis to reveal common causes in order to provide information for accident prevention. MAIM differs from conventional systems by attempting to collect all available information in a structured form rather than providing a simple classification which may not be related to the ‘cause’ of the accident. Objects involved in the accident, body movement, activities, personal attributes and environmental factors that may contribute to accidents are all recorded in a structured form in a computer database. The current version of MAIM is implemented as a computer-moderated interview using Microsoft Access to record accident histories on a portable computer. A set of questions, under nine broad headings, allow the identification of all the event verbs used within MAIM.
• Was it a violent incident? • Were vehicles or ridden animals involved? • Did things break, strike you or something else? • Was fire, electricity or chemical involved? • Events involving people? • Did you slip/trip/stumble or miss your step? • Events while handling things?
2
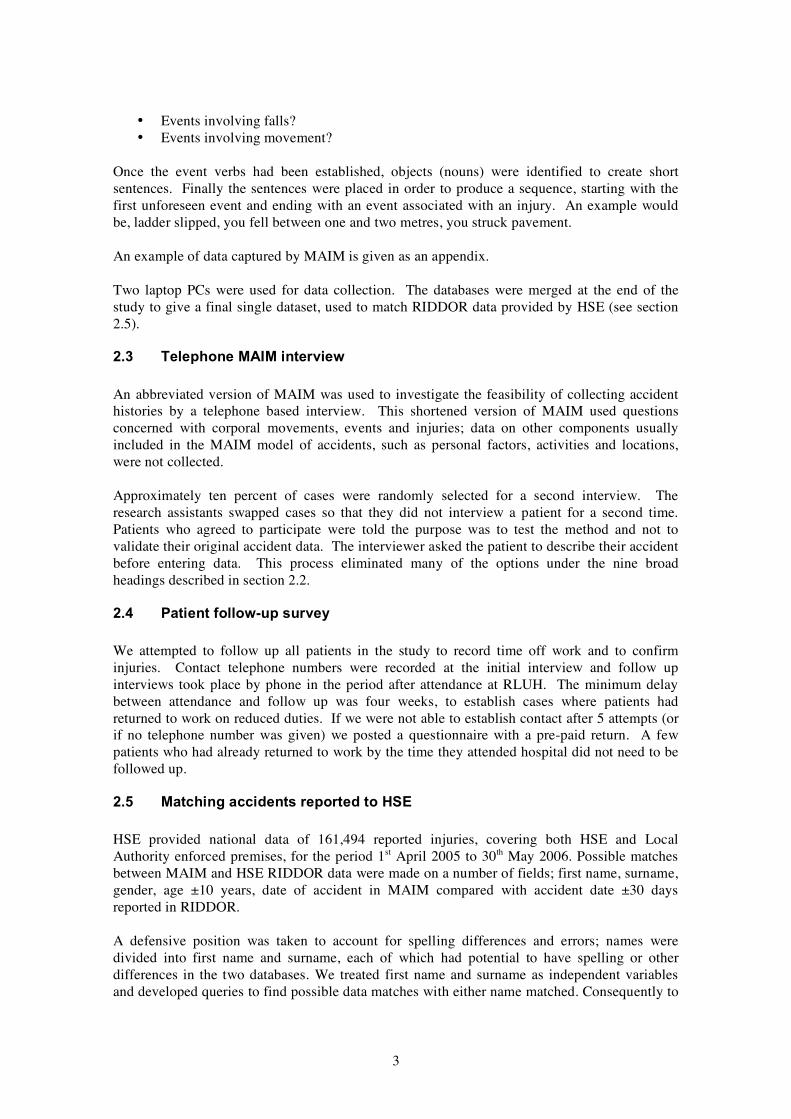
• Events involving falls? • Events involving movement?
Once the event verbs had been established, objects (nouns) were identified to create short sentences. Finally the sentences were placed in order to produce a sequence, starting with the first unforeseen event and ending with an event associated with an injury. An example would be, ladder slipped, you fell between one and two metres, you struck pavement.
An example of data captured by MAIM is given as an appendix.
Two laptop PCs were used for data collection. The databases were merged at the end of the study to give a final single dataset, used to match RIDDOR data provided by HSE (see section 2.5).
2.3 Telephone MAIM interview
An abbreviated version of MAIM was used to investigate the feasibility of collecting accident histories by a telephone based interview. This shortened version of MAIM used questions concerned with corporal movements, events and injuries; data on other components usually included in the MAIM model of accidents, such as personal factors, activities and locations, were not collected.
Approximately ten percent of cases were randomly selected for a second interview. The research assistants swapped cases so that they did not interview a patient for a second time. Patients who agreed to participate were told the purpose was to test the method and not to validate their original accident data. The interviewer asked the patient to describe their accident before entering data. This process eliminated many of the options under the nine broad headings described in section 2.2.
2.4 Patient follow-up survey
We attempted to follow up all patients in the study to record time off work and to confirm injuries. Contact telephone numbers were recorded at the initial interview and follow up interviews took place by phone in the period after attendance at RLUH. The minimum delay between attendance and follow up was four weeks, to establish cases where patients had returned to work on reduced duties. If we were not able to establish contact after 5 attempts (or if no telephone number was given) we posted a questionnaire with a pre-paid return. A few patients who had already returned to work by the time they attended hospital did not need to be followed up.
2.5 Matching accidents reported to HSE
HSE provided national data of 161,494 reported injuries, covering both HSE and Local Authority enforced premises, for the period 1st April 2005 to 30th May 2006. Possible matches between MAIM and HSE RIDDOR data were made on a number of fields; first name, surname, gender, age ±10 years, date of accident in MAIM compared with accident date ±30 days reported in RIDDOR.
A defensive position was taken to account for spelling differences and errors; names were divided into first name and surname, each of which had potential to have spelling or other differences in the two databases. We treated first name and surname as independent variables and developed queries to find possible data matches with either name matched. Consequently to
3

be missed, a case would need differences or spelling errors in both name fields. We also allowed for first name and surname entered in the wrong order. Records where date fields were missing were included for consideration if there was an adequate match on first name or surname.
Matches were confirmed or rejected by visual inspection of data on screen, comparing all available details in the MAIM and RIDDOR databases; first name, surname, age, gender, date of accident, time of accident, description of accident details.
4
3 RESULTS
3.1 Patient survey
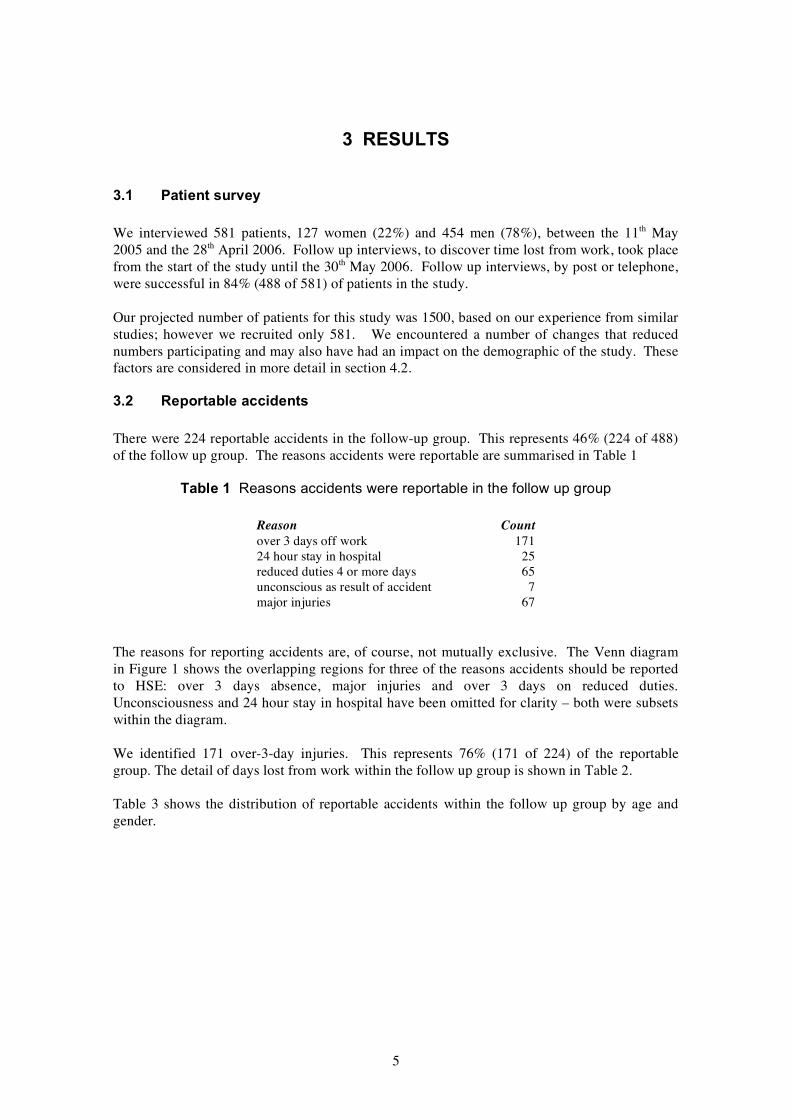
We interviewed 581 patients, 127 women (22%) and 454 men (78%), between the 11th May 2005 and the 28th April 2006. Follow up interviews, to discover time lost from work, took place from the start of the study until the 30th May 2006. Follow up interviews, by post or telephone, were successful in 84% (488 of 581) of patients in the study.
Our projected number of patients for this study was 1500, based on our experience from similar studies; however we recruited only 581. We encountered a number of changes that reduced numbers participating and may also have had an impact on the demographic of the study. These factors are considered in more detail in section 4.2.
3.2 Reportable accidents
There were 224 reportable accidents in the follow-up group. This represents 46% (224 of 488) of the follow up group. The reasons accidents were reportable are summarised in Table 1
Table 1 Reasons accidents were reportable in the follow up group
Reason Count over 3 days off work 171 24 hour stay in hospital 25 reduced duties 4 or more days 65 unconscious as result of accident 7 major injuries 67
The reasons for reporting accidents are, of course, not mutually exclusive. The Venn diagram in Figure 1 shows the overlapping regions for three of the reasons accidents should be reported to HSE: over 3 days absence, major injuries and over 3 days on reduced duties. Unconsciousness and 24 hour stay in hospital have been omitted for clarity – both were subsets within the diagram.
We identified 171 over-3-day injuries. This represents 76% (171 of 224) of the reportable group. The detail of days lost from work within the follow up group is shown in Table 2.
Table 3 shows the distribution of reportable accidents within the follow up group by age and gender.
5
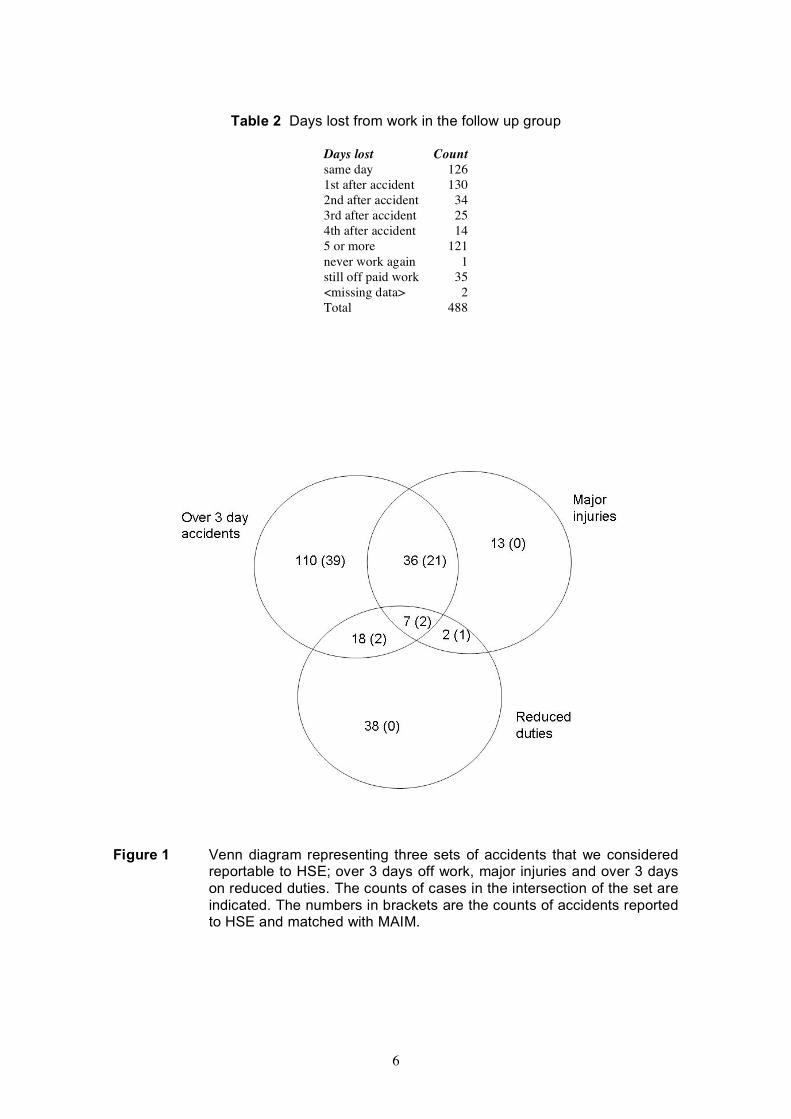
Table 2 Days lost from work in the follow up group
Days lost Count same day 126 1st after accident 130 2nd after accident 34 3rd after accident 25 4th after accident 14 5 or more 121 never work again 1 still off paid work 35 <missing data> 2 Total 488
Figure 1 Venn diagram representing three sets of accidents that we considered reportable to HSE; over 3 days off work, major injuries and over 3 days on reduced duties. The counts of cases in the intersection of the set are indicated. The numbers in brackets are the counts of accidents reported to HSE and matched with MAIM.
6
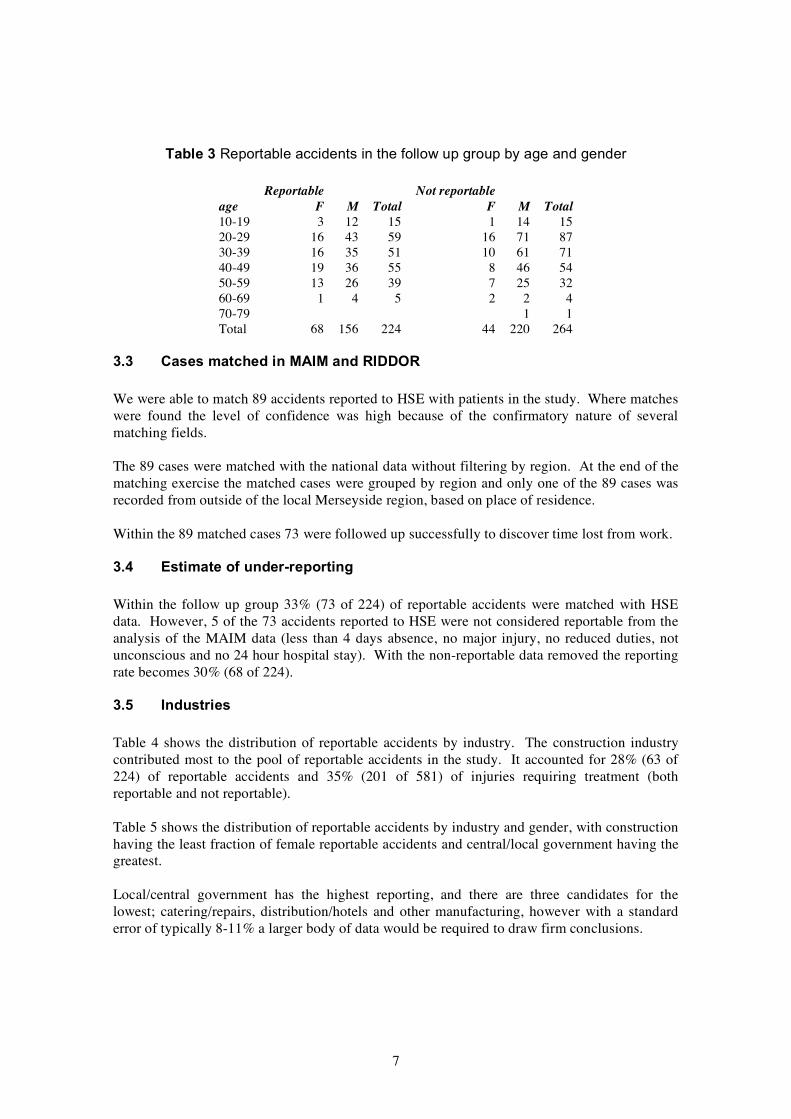
Table 3 Reportable accidents in the follow up group by age and gender
Reportable Not reportable age F M Total F M Total 10-19 3 12 15 1 14 15 20-29 16 43 59 16 71 87 30-39 16 35 51 10 61 71 40-49 19 36 55 8 46 54 50-59 13 26 39 7 25 32 60-69 1 4 5 2 2 4 70-79 1 1 Total 68 156 224 44 220 264
3.3 Cases matched in MAIM and RIDDOR
We were able to match 89 accidents reported to HSE with patients in the study. Where matches were found the level of confidence was high because of the confirmatory nature of several matching fields.
The 89 cases were matched with the national data without filtering by region. At the end of the matching exercise the matched cases were grouped by region and only one of the 89 cases was recorded from outside of the local Merseyside region, based on place of residence.
Within the 89 matched cases 73 were followed up successfully to discover time lost from work.
3.4 Estimate of under-reporting
Within the follow up group 33% (73 of 224) of reportable accidents were matched with HSE data. However, 5 of the 73 accidents reported to HSE were not considered reportable from the analysis of the MAIM data (less than 4 days absence, no major injury, no reduced duties, not unconscious and no 24 hour hospital stay). With the non-reportable data removed the reporting rate becomes 30% (68 of 224).
3.5 Industries
Table 4 shows the distribution of reportable accidents by industry. The construction industry contributed most to the pool of reportable accidents in the study. It accounted for 28% (63 of 224) of reportable accidents and 35% (201 of 581) of injuries requiring treatment (both reportable and not reportable).
Table 5 shows the distribution of reportable accidents by industry and gender, with construction having the least fraction of female reportable accidents and central/local government having the greatest.
Local/central government has the highest reporting, and there are three candidates for the lowest; catering/repairs, distribution/hotels and other manufacturing, however with a standard error of typically 8-11% a larger body of data would be required to draw firm conclusions.
7
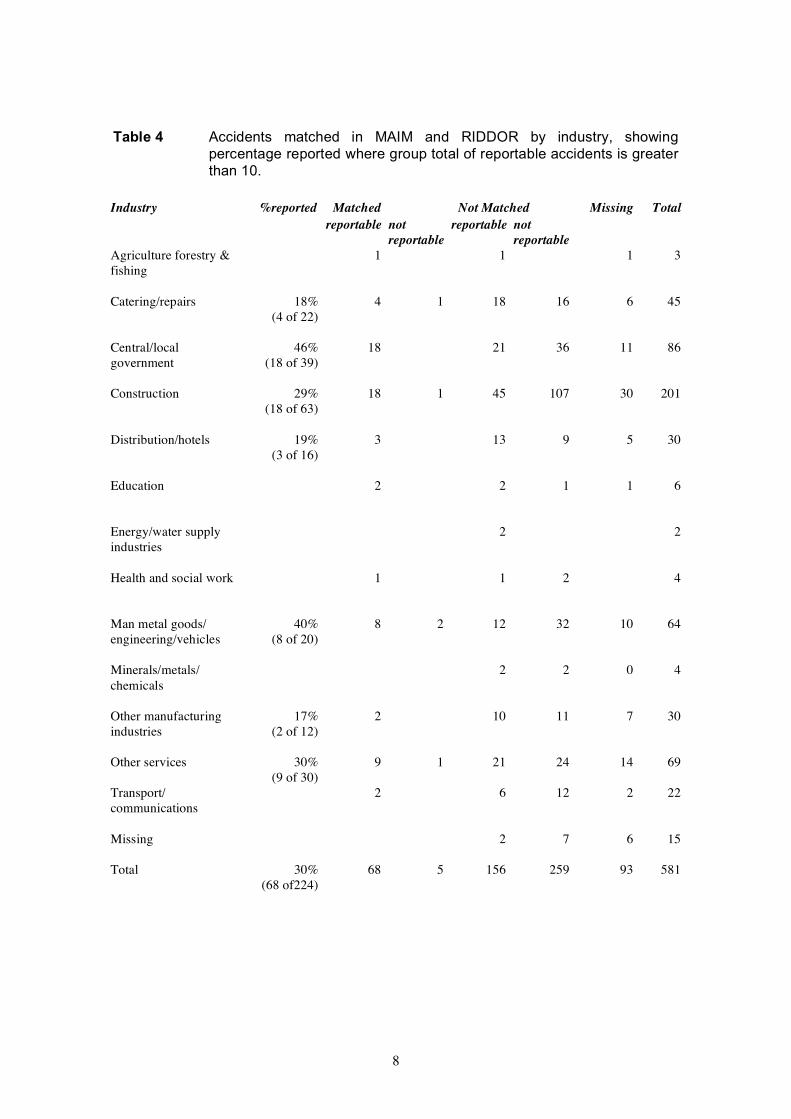
Table 4 Accidents matched in MAIM and RIDDOR by industry, showing percentage reported where group total of reportable accidents is greater than 10.
Industry %reported Matched Not Matched Missing Total reportable not reportable not
reportable reportable Agriculture forestry & 1 1 1 3 fishing
Catering/repairs 18% 4 1 18 16 6 45 (4 of 22)
Central/local 46% 18 21 36 11 86 government (18 of 39)
Construction 29% 18 1 45 107 30 201 (18 of 63)
Distribution/hotels 19% 3 13 9 5 30 (3 of 16)
Education 2 2 1 1 6
Energy/water supply 2 2 industries
Health and social work 1 1 2 4
Man metal goods/ 40% 8 2 12 32 10 64 engineering/vehicles (8 of 20)
Minerals/metals/ 2 2 0 4 chemicals
Other manufacturing 17% 2 10 11 7 30 industries (2 of 12)
Other services 30% 9 1 21 24 14 69 (9 of 30)
Transport/ 2 6 12 2 22 communications
Missing 2 7 6 15
Total 30% 68 5 156 259 93 581 (68 of224)
8

Table 5 Reportable accidents matched in MAIM and RIDDOR by industry and gender, showing percentage female where group total of reportable accidents is greater than 10.
Industry Percentage Male Female Male Female female reportable reportable not not
reportable reportable reportable missing 2 7
agriculture forestry and fishing 2
catering/repairs 50% 11 11 10 7
central/local government 79% 8 31 16 20
construction 0% 63 108
distribution/hotels 13% 14 2 5 4
education 1 3 1
energy/water supply industries 2
health and social work 1 1 2
manufacturing 10% 18 2 34 metalgoods/engineering/vehicles
minerals/metals/chemicals 2 1 1
other manufacturing industries 8% 11 1 10 1
other services 53% 14 16 17 8
transport/communications 7 1 11 1
9
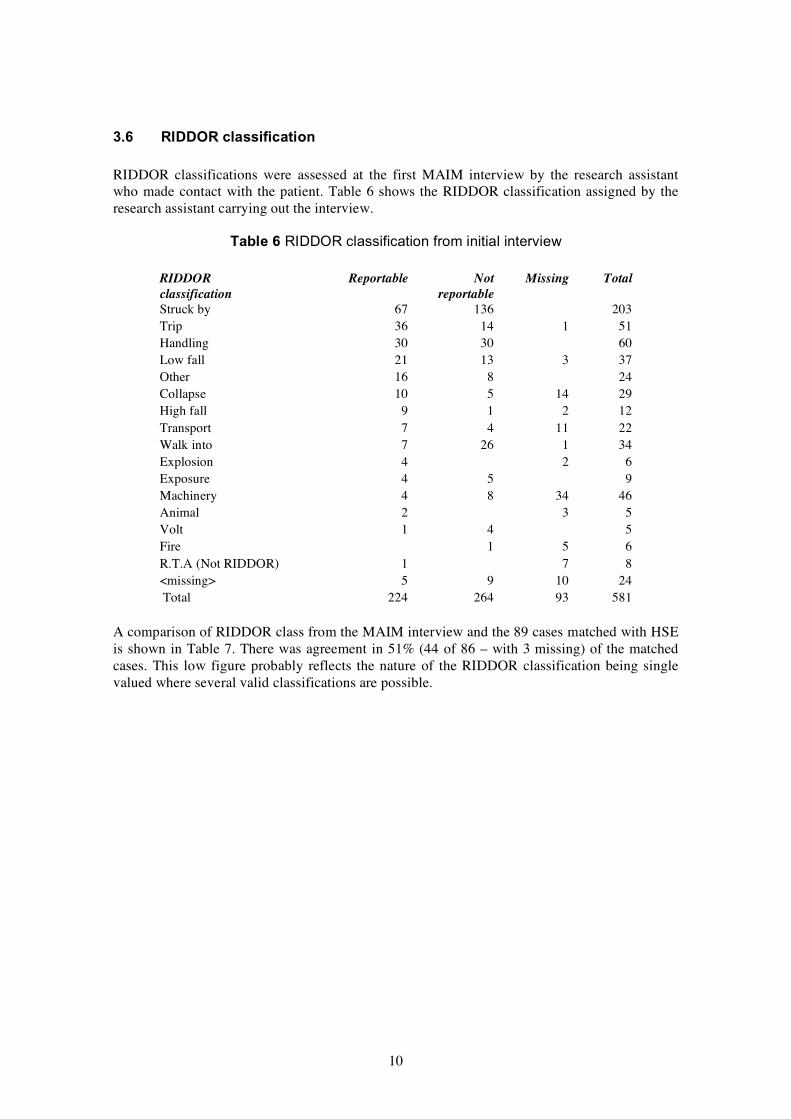
3.6 RIDDOR classification
RIDDOR classifications were assessed at the first MAIM interview by the research assistant who made contact with the patient. Table 6 shows the RIDDOR classification assigned by the research assistant carrying out the interview.
Table 6 RIDDOR classification from initial interview
RIDDOR Reportable Not Missing Total classification reportable Struck by 67 136 203 Trip 36 14 1 51 Handling 30 30 60 Low fall 21 13 3 37 Other 16 8 24 Collapse 10 5 14 29 High fall 9 1 2 12 Transport 7 4 11 22 Walk into 7 26 1 34 Explosion 4 2 6 Exposure 4 5 9 Machinery 4 8 34 46 Animal 2 3 5 Volt 1 4 5 Fire 1 5 6 R.T.A (Not RIDDOR) 1 7 8 <missing> 5 9 10 24 Total 224 264 93 581
A comparison of RIDDOR class from the MAIM interview and the 89 cases matched with HSE is shown in Table 7. There was agreement in 51% (44 of 86 – with 3 missing) of the matched cases. This low figure probably reflects the nature of the RIDDOR classification being single valued where several valid classifications are possible.
10
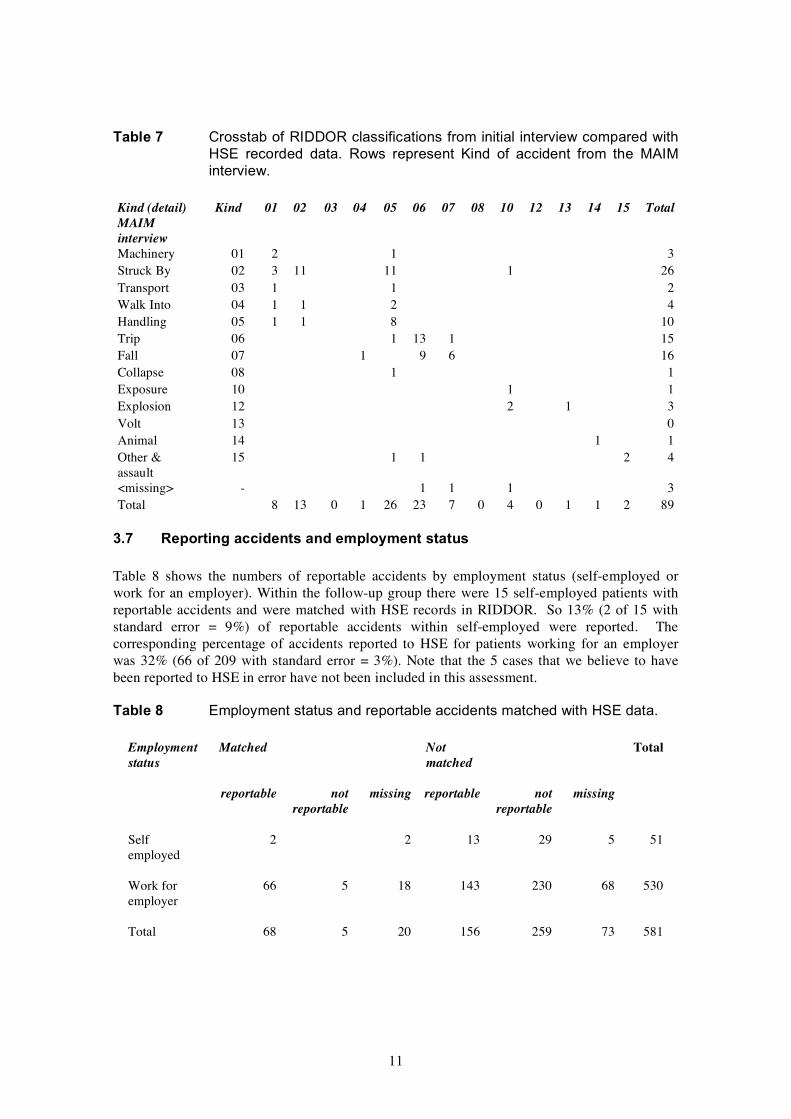
Table 7 Crosstab of RIDDOR classifications from initial interview compared with HSE recorded data. Rows represent Kind of accident from the MAIM interview.
Kind (detail) Kind 01 02 03 04 05 06 07 08 10 12 13 14 15 Total MAIM interview Machinery 01 2 1 3 Struck By 02 3 11 11 1 26 Transport 03 1 1 2 Walk Into 04 1 1 2 4 Handling 05 1 1 8 10 Trip 06 1 13 1 15 Fall 07 1 9 6 16 Collapse 08 1 1 Exposure 10 1 1 Explosion 12 2 1 3 Volt 13 0 Animal 14 1 1 Other & 15 1 1 2 4 assault <missing> - 1 1 1 3 Total 8 13 0 1 26 23 7 0 4 0 1 1 2 89
3.7 Reporting accidents and employment status
Table 8 shows the numbers of reportable accidents by employment status (self-employed or work for an employer). Within the follow-up group there were 15 self-employed patients with reportable accidents and were matched with HSE records in RIDDOR. So 13% (2 of 15 with standard error = 9%) of reportable accidents within self-employed were reported. The corresponding percentage of accidents reported to HSE for patients working for an employer was 32% (66 of 209 with standard error = 3%). Note that the 5 cases that we believe to have been reported to HSE in error have not been included in this assessment.
Table 8 Employment status and reportable accidents matched with HSE data.
Employment Matched Not Total status matched
reportable not missing reportable not missing reportable reportable
Self 2 2 13 29 5 51 employed
Work for 66 5 18 143 230 68 530 employer
Total 68 5 20 156 259 73 581
11

3.8 Occupations
Occupations recorded in the study are listed in Table 9. Labourers and other workers in the construction industry were seen most frequently in this study. Sales assistants and unqualified nursing assistants were also prominent, and it is worth noting that none of the 7 qualified nurses in the follow up group had reportable accidents.
Table 9 Occupation and reportable accidents (The table has been truncated at total occupations < 4).
Occupation Reportable Not missing Total reportable
labourer/construction/building 18 26 6 50 joiner 8 20 7 35 sales assistant 16 6 9 31 electrician 4 16 4 24 nurse assistant/unqualified 9 9 2 20 welder 6 10 2 18 driver 10 6 1 17 chef 8 5 3 16 bricklayer 9 5 14 cleaner 5 7 2 14 fitter 3 6 5 14 mechanic (motor mechanic) 4 7 2 13 warehouse person 5 4 4 13 builder 2 6 1 9 glazier 7 2 9 maintenance engineer 3 5 1 9 painter/decorator 3 4 2 9 waiter/waitress 4 3 2 9 clerk 5 3 8 nurse/registered 7 1 8 process worker 1 5 2 8 labourer/unlisted industry 2 3 2 7 plasterer 3 4 7 plumber 5 2 7 steel erector 1 5 1 7 machine operator 1 3 2 6 publican 5 1 6 security guard 2 4 6 technician 1 5 6 wood machinist 6 6 domestic servant 2 2 1 5 teacher 3 2 5 care assistant 3 1 4 flagger 3 1 4 police 4 4 scaffolder/stager/steeplejack 3 1 4 table truncated …
12
3.9 MAIM events
First events in the MAIM model are associated with the causes of accidents (Davies et al 1998). This view of the data indicates the most common first unexpected events; where to put effort for most effect in reducing accidents at work. However when analysing accidents in this way it is important to differentiate between common and serious accidents. Uncommon events may have very serious consequences.
Table 10 shows the first event verbs within the follow up group. Table 11 shows all events within the follow up group. Tables 10 and 11 reveal a profile of typical events in the 224 reportable accidents in the study. For example;
• 90 ‘were struck by’ events (20 as first events) • 50 ‘fell over on the ground’ (3 as first event) • 46 ‘struck’ events (5 were reported as first events), • 17 ‘tripped over’ (14 as first events)
The distinction between ‘struck by’ and ‘struck’ is important, indicating the movements of objects in the environment and the movements of injured people.
If we define underfoot accidents as those with a first event in the set [foot slipped, foot missed edge of, tripped, foot turned over, unintentionally stepped on], then underfoot accidents accounted for 28% (19 of 68) of accidents reported to HSE and matched with MAIM (5 reported in error excluded) and 25% (55 of 224) of reportable accidents in the study. The RIDDOR classification, assigned by the research interviewer (section 3.6), has 16% (36 of 224) of the reportable accidents in the study associated with tripping. Simple analysis with RIDDOR will underestimate the incidence of accidents with causes associated with underfoot hazards.
13
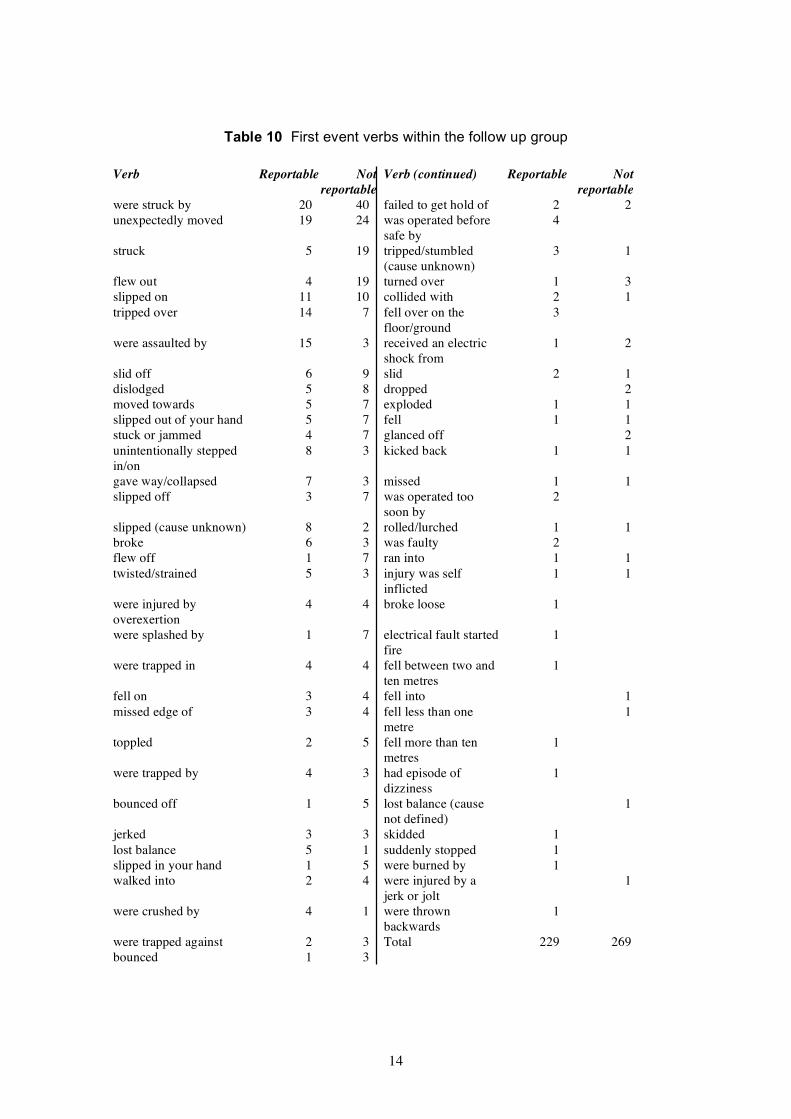
Table 10 First event verbs within the follow up group
Verb Reportable Not Verb (continued) Reportable Not reportable reportable
were struck by 20 40 failed to get hold of 2 2 unexpectedly moved 19 24 was operated before 4
safe by struck 5 19 tripped/stumbled 3 1
(cause unknown) flew out 4 19 turned over 1 3 slipped on 11 10 collided with 2 1 tripped over 14 7 fell over on the 3
floor/ground were assaulted by 15 3 received an electric 1 2
shock from slid off 6 9 slid 2 1 dislodged 5 8 dropped 2 moved towards 5 7 exploded 1 1 slipped out of your hand 5 7 fell 1 1 stuck or jammed 4 7 glanced off 2 unintentionally stepped 8 3 kicked back 1 1 in/on gave way/collapsed 7 3 missed 1 1 slipped off 3 7 was operated too 2
soon by slipped (cause unknown) 8 2 rolled/lurched 1 1 broke 6 3 was faulty 2 flew off 1 7 ran into 1 1 twisted/strained 5 3 injury was self 1 1
inflicted were injured by 4 4 broke loose 1 overexertion were splashed by 1 7 electrical fault started 1
fire were trapped in 4 4 fell between two and 1
ten metres fell on 3 4 fell into 1 missed edge of 3 4 fell less than one 1
metre toppled 2 5 fell more than ten 1
metres were trapped by 4 3 had episode of 1
dizziness bounced off 1 5 lost balance (cause 1
not defined) jerked 3 3 skidded 1 lost balance 5 1 suddenly stopped 1 slipped in your hand 1 5 were burned by 1 walked into 2 4 were injured by a 1
jerk or jolt were crushed by 4 1 were thrown 1
backwards were trapped against 2 3 Total 229 269 bounced 1 3
14
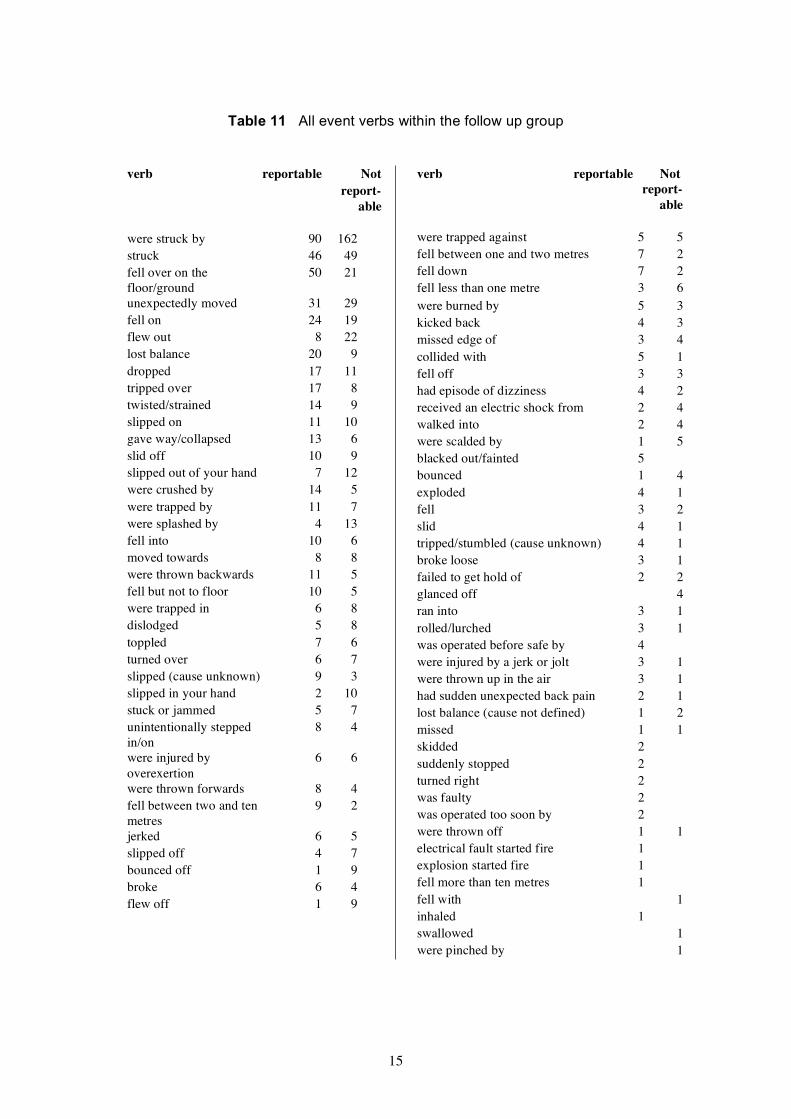
Table 11 All event verbs within the follow up group
verb reportable Not report-able
were struck by 90 162 struck 46 49 fell over on the 50 21 floor/ground unexpectedly moved 31 29 fell on 24 19 flew out 8 22 lost balance 20 9 dropped 17 11 tripped over 17 8 twisted/strained 14 9 slipped on 11 10 gave way/collapsed 13 6 slid off 10 9 slipped out of your hand 7 12 were crushed by 14 5 were trapped by 11 7 were splashed by 4 13 fell into 10 6 moved towards 8 8 were thrown backwards 11 5 fell but not to floor 10 5 were trapped in 6 8 dislodged 5 8 toppled 7 6 turned over 6 7 slipped (cause unknown) 9 3 slipped in your hand 2 10 stuck or jammed 5 7 unintentionally stepped 8 4 in/on were injured by 6 6 overexertion were thrown forwards 8 4 fell between two and ten 9 2 metres jerked 6 5 slipped off 4 7 bounced off 1 9 broke 6 4 flew off 1 9
verb reportable Not report-able
were trapped against 5 5 fell between one and two metres 7 2 fell down 7 2 fell less than one metre 3 6 were burned by 5 3 kicked back 4 3 missed edge of 3 4 collided with 5 1 fell off 3 3 had episode of dizziness 4 2 received an electric shock from 2 4 walked into 2 4 were scalded by 1 5 blacked out/fainted 5 bounced 1 4 exploded 4 1 fell 3 2 slid 4 1 tripped/stumbled (cause unknown) 4 1 broke loose 3 1 failed to get hold of 2 2 glanced off 4 ran into 3 1 rolled/lurched 3 1 was operated before safe by 4 were injured by a jerk or jolt 3 1 were thrown up in the air 3 1 had sudden unexpected back pain 2 1 lost balance (cause not defined) 1 2 missed 1 1 skidded 2 suddenly stopped 2 turned right 2 was faulty 2 was operated too soon by 2 were thrown off 1 1 electrical fault started fire 1 explosion started fire 1 fell more than ten metres 1 fell with 1 inhaled 1 swallowed 1 were pinched by 1
15

3.10 Injuries
Injuries and locations of injuries are summarised in Tables 12 and 13 respectively for the follow-up group.
Table 12 Injuries within the follow-up group
Injury description Reportable Not reportable amputation/partial amputation 4 bite wound 3 broken tooth/teeth 1 bruise or contusion with intact skin 57 51 burn/scald 15 12 concussed 9 crush injury with intact skin 10 10 diagnosis not made 14 25 dislocation 4 2 electric shock 1 4 foreign body/rust in eye 1 33 fracture (compound) 9 fracture with dislocation 6 fracture/cracked bone (simple) 48 2 graze/scrape 8 11 multiple severe injuries 1 nail torn 6 5 rupture or hernia 1 skin wound (uncomplicated) 30 108 skin wound with nerve injury 2 1 slipped disc or spinal injury 1 splinter/foreign body 8 sprain or strain 30 16 tendon and nerve injury 5 tendon injury 16 5 whiplash 1
16
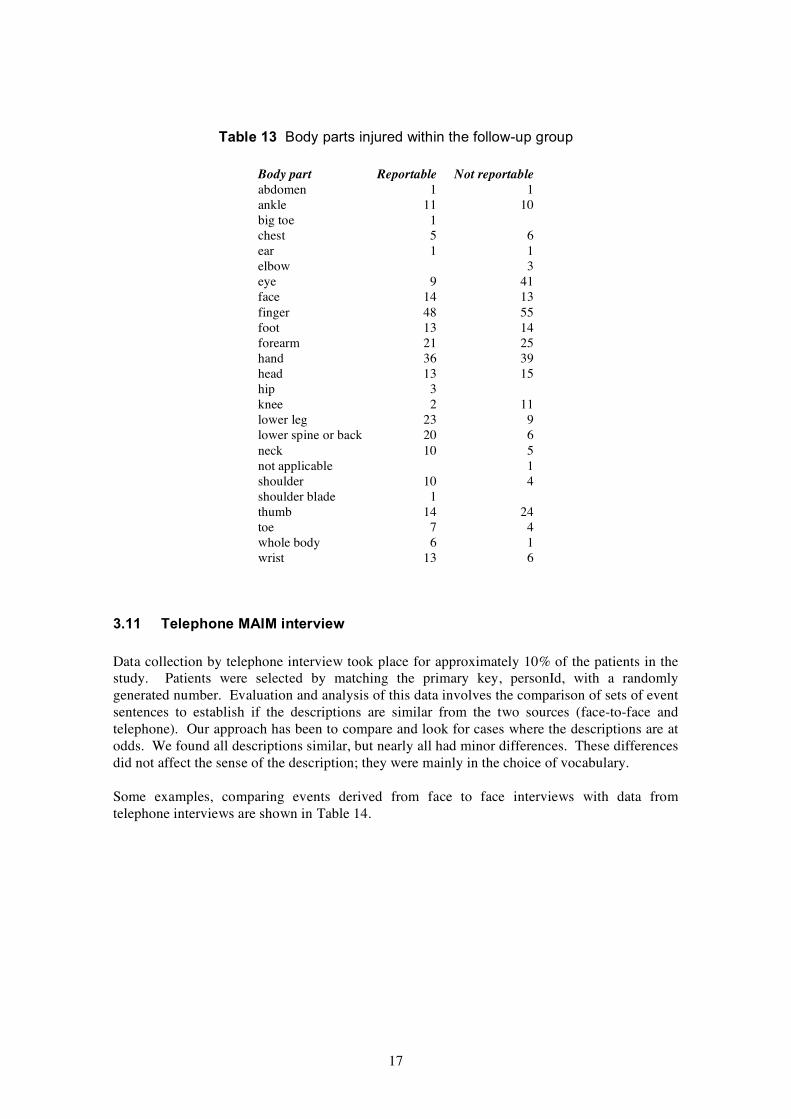
Table 13 Body parts injured within the follow-up group
Body part Reportable Not reportable abdomen 1 1 ankle 11 10 big toe 1 chest 5 6 ear 1 1 elbow 3 eye 9 41 face 14 13 finger 48 55 foot 13 14 forearm 21 25 hand 36 39 head 13 15 hip 3 knee 2 11 lower leg 23 9 lower spine or back 20 6 neck 10 5 not applicable 1 shoulder 10 4 shoulder blade 1 thumb 14 24 toe 7 4 whole body 6 1 wrist 13 6
3.11 Telephone MAIM interview
Data collection by telephone interview took place for approximately 10% of the patients in the study. Patients were selected by matching the primary key, personId, with a randomly generated number. Evaluation and analysis of this data involves the comparison of sets of event sentences to establish if the descriptions are similar from the two sources (face-to-face and telephone). Our approach has been to compare and look for cases where the descriptions are at odds. We found all descriptions similar, but nearly all had minor differences. These differences did not affect the sense of the description; they were mainly in the choice of vocabulary.
Some examples, comparing events derived from face to face interviews with data from telephone interviews are shown in Table 14.
17
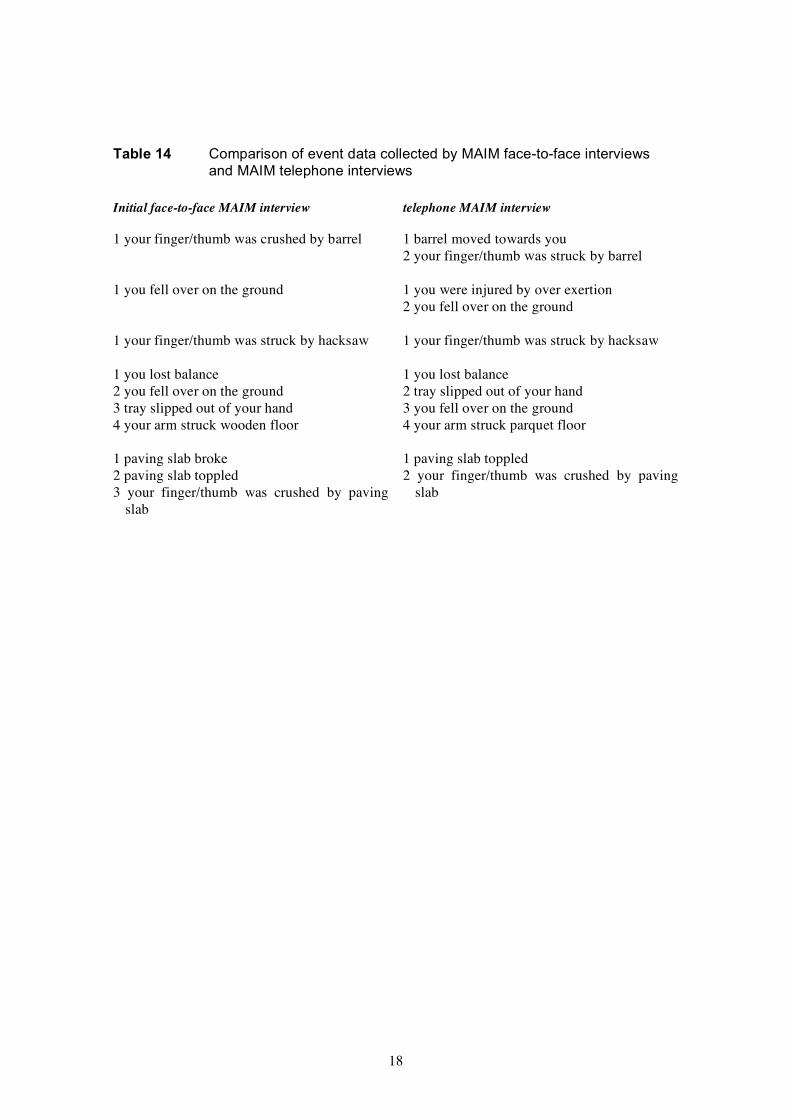
Table 14 Comparison of event data collected by MAIM face-to-face interviews and MAIM telephone interviews
Initial face-to-face MAIM interview
1 your finger/thumb was crushed by barrel
1 you fell over on the ground
1 your finger/thumb was struck by hacksaw
1 you lost balance 2 you fell over on the ground 3 tray slipped out of your hand 4 your arm struck wooden floor
1 paving slab broke 2 paving slab toppled 3 your finger/thumb was crushed by paving slab
telephone MAIM interview
1 barrel moved towards you 2 your finger/thumb was struck by barrel
1 you were injured by over exertion 2 you fell over on the ground
1 your finger/thumb was struck by hacksaw
1 you lost balance 2 tray slipped out of your hand 3 you fell over on the ground 4 your arm struck parquet floor
1 paving slab toppled 2 your finger/thumb was crushed by paving slab
18
4 DISCUSSION
4.1 Reasons for reporting accidents
In the Venn diagram of reportable accidents (Figure 1) it is apparent that time off work is the major factor that determines that an accident will be reported under RIDDOR. In the follow up group 32% (41 of 128) of cases were reported with time off as the sole reason. The proportion reported rises to 53% (23 of 43) where major injury is combined with over 3 days absence. The likelihood of an accident being reported increases if there is a major injury combined with an absence of over 3 days.
The same reporting pattern of matched cases was observed in our 1999 study (Davies et al 1999) with 18% in over 3 day only and 30% combined major injury and over 3 days absence. The change of scale of reporting between the two studies can be attributed to a more efficient matching method between MAIM and RIDDOR in the current study.
In a different view of the same data (Figure 1), the combined injury and over 3 days set is 25% (43 of 171) of the time off reportable set. In the 1999 study the corresponding figure was 23% (84 of 363). This observation suggests a consistent reporting behaviour between the two studies.
4.2 Similarities and differences with the 1999 study
A similar study was carried out in 1999 (Davies et al 1999) and it was the intention to use data from this earlier investigation as a baseline to see changes in reporting behaviour. There were a number of unavoidable differences between the two studies that have made comparison problematic.
Changes in the operation of the NHS have almost certainly had an impact on the demographics of the two studies. There has been a successful drive to cut waiting times in A&E which has been achieved by a number of measures. The introduction of NHS ‘Walk-in Centres’ probably had most impact on the demographic of the current study compared with the 1999 study. While walk-in centres treat minor injuries, in NHS terms, time lost from work may well be significant. Walk-in centres probably had an impact on the demographic and patterns of reporting observed in this study if groups of workers were under-represented. Clearly injured people will opt to go to the nearest and most convenient centre for treatment. Where this is in a city centre, with office and commercial workers, we would expect proportionately more women to visit NHS walk in centres than would attend A&E. In the current study 23% of the followed up cases were women, compared with 27% in. the 1999 study.
In our 1999 study we identified 363 ‘over 3 day accidents’ from 1504 patient interviews. In the current study we recorded 171 ‘over 3 day accidents’ from 581 patient interviews. That is, in the 1999 study 24% (363 of 1504) were reportable because of time off work compared with 29% (171 of 581) in the current study. This is consistent with NHS walk-in centres filtering out some of the relatively minor cases from the workload of A&E, and would account for an estimated 131 ‘lost’ patients (if 171 were to represent 24% then the total number of cases would be 171/0.24 = 712).
In Table 3 women represented 30% (68 of 224) of the accidents we considered reportable. In the 1999 study the equivalent figure was 27% (170 of 634). So, comparing the current study and the 1999 study, we have 1) a decreased percentage of women attending, 23% vs 27% and 2)
19
an increased proportion of women with reportable accidents, 30% vs 27%. This data is consistent with proportionately fewer women attending A&E in the current study, but with more serious injuries.
It is very likely that the recent cut in waiting times in A&E has reduced the number of participants willing to take part in the study, for two reasons. First, the research assistants had less time to locate patients. Second, interviews invariably took place while patients were waiting for treatment, and it is possible that a shortened wait increased the number of refusals to participate. In the 1990 study few patients refused to take part, but in the current study refusals amounted to approximately 40% of eligible patients.
Patients attending with eye injuries were included in the current study. They were treated at a different location in 1999 and were not available for that study.
Changes at HSE in the way RIDDOR data has been collected have probably had a significant effect on the efficiency and accuracy of matching cases between MAIM and RIDDOR. There are two reporting authorities, Local Authorities (LA) and HSE. In the 1999 study we only had access to HSE-reported cases, available on a database. The LA cases were paper-based records and were not suitable for searching for matches. This split between LA and HSE introduced significant errors in estimating underreporting, as we had to judge, based on the location of the accident and the industrial sector if the accident should have been reported to HSE or the LA. Also the searching mechanism within the HSE database was inefficient, relying on single searches based on the name of the patient (with sensible variations). The changes, since 1999, in the way RIDDOR data is collected have been beneficial for the current study. The HSE and LA reported accidents have been merged into one database, removing one source of error, the need to identify the reporting authority. In addition full access to a copy of the RIDDOR database has allowed us to develop a more efficient search method to match cases between MAIM and RIDDOR, described in section 2.5.
4.3 Marginal increase in major injuries
One purpose of this study was to investigate a reported marginal increase in major injuries seen in RIDDOR. The marginal increase of reported major injuries observed in RIDDOR data could be explained by an increased likelihood of reporting when a major injury is sustained (section 4.1). The observed marginal increase would occur if there were an actual increase in accidents with major injuries within the over-3-day accident set.
In the current study, section 4.1 has 25% (43 of 171) of major injuries in the over three day accident set compared with 23% (84 of 363) in the 1999 study. The uncertainties discussed in section 4.2 makes direct comparison unwise and we conclude there is no evidence from this and the 1999 study that would suggest a general increase in the proportion of major injuries within over-3-day accidents.
Two alternative scenarios would also cause a marginal increase of reported major injury. Different sectors have different reporting rates (section 3.5). The increase of reported major injury would occur with 1) an increase in reporting rates from a sector with a constant high rate of major injury 2) a decrease in reporting rates from a sector with a constant low rate of major injury.
We have seen an increased proportion of construction workers attending A&E (18% in 1999 and 36% in the current study). This could be attributed to an increase in construction activity on Merseyside, but could also be affected by a decrease in attendance from workers in city centre
20
commercial establishments and offices because of the location of NHS walk-in centres (a fact of the geography of locations of building sites with respect to the city centre). The observed increase in construction workers in the current study compared with the 1999 study (Davies et al 1999), combined with an increase in ‘were struck by’ first events, could be consistent with a model of reporting that would see the marginal increase of reported major injuries. The possible change in demographics between the 1999 study and the current study is a confounding factor and we can draw no firm conclusions. However there are three tests within RIDDOR that could give an insight: 1) Is there a change over time in relative reporting between industrial sectors? 2) Are there different rates of major injuries within sectors? 3) If the answers to questions 1 and 2 are both yes, do they combine to form, within a sector, an increased reporting rate and a higher rate of injury (or a decreased reporting rate and lower rate of injury)?
In summary
• the main reason accidents are reported is over three days absence • accidents are more likely to be reported if there are major injuries • different industrial sectors report under RIDDOR with different rates • different sectors can have different major injury rates • changes, over time, in sector reporting rates can have an impact on the prevalence of
major injuries seen in RIDDOR
4.4 Comparing underreporting with other sources
Two sources are available for estimates of under reporting under RIDDOR, data published from the Labour Force Survey (HSC 2002) and our 1999 study (Davies et al 1999).
The estimate of underreporting from employers by the Labour Force Survey is 44% (HSC 2002). Our estimate in this study of 33%, in section 3.4, falls short of this. We used a rigorous evaluation of the reportability of accidents, based on definitions in RIDDOR. However if we relax the criteria and remove time on reduced duties then the reporting rate for the current study becomes 39% (73 of 186). The Labour Force Survey did not establish time on reduced duties (personal communication David Leigh HSE 2006) and the revised figure of 39% from the current study would be comparable with the Labour Force Survey estimate. However industry sector profile in the immediate area of the Royal Liverpool University Hospital will be a significant factor in our estimate.
The Labour Force Survey has 5% of reportable accidents by self employed reported under RIDDOR. We estimate underreporting by the self-employed to be 13% with a standard error of 9% (section 3.7).
4.5 Over reporting
In the 1999 study (Davies et al 1999) we found that 8% (7 of 89) of the cases matched within MAIM and RIDDOR were not reportable. We associated this over-reporting with misinterpretation of the definitions of time lost from work within RIDDOR - the day of the accident does not count as a ‘lost day’. In the current study, in section 3.4, we have also found cases that have been reported to HSE but were not in fact reportable. In the current study, there were 7% (5 of 73) of the follow up cases reported in error.
If the source of this error is confusion about the day of the accident not counting towards time lost from work then the remedy is to record if the injured person has yet returned to work, or the date that the injured person returned to work.
21
4.6 Reporting rates and employment status
In section 3.7, reporting rates for employed workers and for self employed groups were 32% and 13% respectively. We did not ask, as part of the interview, about awareness of responsibility to report accidents to HSE. However many self-employed workers volunteered that they were unaware of their obligation to report such incidents to HSE.
4.7 Collection of MAIM accident data by telephone interviews
We have demonstrated the possibility of collecting of high quality accident data by telephone interviews, based on the MAIM event model of accidents.
MAIM allows the analysis of the immediate causes of accidents by identifying the first unexpected event perceived by the injured person. Simple classification systems, such as RIDDOR, fail to identify causes. Accidents in the workplace are complex and the structure available in MAIM preserves this complexity for subsequent analysis. The large scale collection and analysis of accident data in this form would be a significant resource in understanding accident mechanisms.
As an example of the possible use of MAIM data consider two of the RIDDOR classes, manual handling and slips/trips. Clearly these classifications are not mutually exclusive, but a single classification system has to treat them as such. The analysis of the interaction of underfoot accidents and manual handling available from MAIM would be an important resource in advice for accident prevention.
22
REFERENCES
1. Davies JC and Manning DP: MAIM: The Concept and Construction of Intelligent Software. Safety Science 17 1994 207-218.
2. Davies JC, Stevens G, Manning DP Understanding Accident Mechanisms: An Analysis of the Components of 2516 Accidents Collected in a MAIM Database. 1998 Safety Science 29:25-58.
3. Davies JC, Kemp GJ, Tsao Y, Omar KM and Fostick SP Matching MAIM interviews at the Royal Liverpool University Hospital with accidents reported under RIDDOR. Final report HSE contract 3822/R64.040 1999.
4. HSC: Levels and trends in workplace injury: reported injuries and the Labour Force Survey. 2002 lfsfct01.pdf at Web location http://www.hse.gov.uk/statistics/index.htm
23

APPENDIX EXAMPLE OF ACCIDENT DATA RECORDED BY MAIM
Dates have not been inserted to preserve confidentiality
Gender F personId 134 Date of Birth dd/mm/yyyy Date of Accident dd/mm/yyyy Time of Accident 10:30 Personal Factors slept well
usually sleep well do not snore no alcohol in previous 24 hours no prescribed medication no herbal medication no non prescription medication good eyesight never use glasses or contacts not wearing spectacles at time of accident it was good daylight no disability no illness not tired no haste
Equipment factors not well maintained unsafe equipment not faulty design protective equipment would not have helped avoid accident
Work status work for employer Employment full time Industry Type central/local government Occupation nurse assistant/unqualified Location you were in/on government/local authority property Activity you were cleaning stand/rack
you were looking up Body Movements you were holding (with one hand) stand/rack you were standing
Events 1. stand/rack unexpectedly moved 2. stand/rack gave way/collapsed 3. your finger/thumb were/was struck by stand/rack 4. your finger/thumb were/was trapped in stand/rack
Injuries Thumb: bruise or contusion with intact skin (event 3)
24

25

Published by the Health and Safety Executive 02/07
Health and Safety Executive
An investigation of reporting of workplace accidents under RIDDOR using the Merseyside Accident Information Model
This study investigated the under-reporting of accidents to HSE by matching patients attending the Royal Liverpool University Hospital with cases reported to HSE. Patients were followed up to establish time lost from work and this data together with severity of injuries established which accidents should be reported. The largest number of reportable accidents was from occupations connected with the construction industry, both labouring and trades. Sales assistants and unqualified nursing assistants were also prominent. Reporting rates varied between sectors: local and central government had the highest reporting rate; the three lowest were catering/repairs, distribution/hotels and other manufacturing. The comparison with accidents actually reported to HSE suggested that the main reason accidents were reported was time lost from work and that other factors were ancillary. Major injury and reduced duties on their own were largely ignored when accidents were reported, however major injury in conjunction with time lost increased the likelihood that accidents would be reported. Overall 30% of reportable accidents from the study were reported to HSE. Self employed workers were poor at reporting accidents, with a reporting rate of 12%, compared with 32% for employed workers.
This report and the work it describes were funded by the Health and Safety Executive (HSE). Its contents, including any opinions and/or conclusions expressed, are those of the authors alone and do not necessarily reflect HSE policy.
RR528
www.hse.gov.uk