RR183 - Lifting Incident Review 1998-2003
93
HSE Health & Safety Executive Lifting incident review 1998 - 2003 Prepared by Sparrows Offshore Services Ltd for the Health and Safety Executive 2004 RESEARCH REPORT 183
Transcript of RR183 - Lifting Incident Review 1998-2003

8/6/2019 RR183 - Lifting Incident Review 1998-2003
http://slidepdf.com/reader/full/rr183-lifting-incident-review-1998-2003 1/93
HSEHealth & Safety
Executive
Lifting incident review 1998 - 2003
Prepared by Sparrows Offshore Services Ltd for the Health and Safety Executive 2004
RESEARCH REPORT 183

8/6/2019 RR183 - Lifting Incident Review 1998-2003
http://slidepdf.com/reader/full/rr183-lifting-incident-review-1998-2003 2/93
HSEHealth & Safety
Executive
Lifting incident review 1998 - 2003
Andrew Garvie B.Eng.(Hons), A.M .I.MechE
Sparrows Offshore Services Limited
Carlton House
33 Robert Adam Street
London
W1U 2HR
Sparrows Offshore Services Ltd, on behalf of the Health and Safety Executive Offshore Safety
Division, have undertaken a review of lifting incidents occurring in the United Kingdom Continental
Shelf (UKCS) with the objective of identifying any incident trends and also identifying whether the
introduction of certain industry safety initiatives, such as the Lifting Operations and Lifting Equipment
Regulations (LOLER) and Step Change in Safety have had a positive effect in decreasing the number
of lifting incidents.
This report and the work it describes were funded by the Health and Safety Executive (HSE). Itscontents, including any opinions and/or conclusions expressed, are those of the authors alone and do
not necessarily reflect HSE policy.
HSE BOOKS

8/6/2019 RR183 - Lifting Incident Review 1998-2003
http://slidepdf.com/reader/full/rr183-lifting-incident-review-1998-2003 3/93
© Crown copyright 2004
First published 2004
ISBN 0 7176 2804 3
All rights reserved. No part of this publication may be
reproduced, stored in a retrieval system, or transmitted inany form or by any means (electronic, mechanical, photocopying, recording or otherwise) without the priorwritten permission of the copyright owner.Applications for reproduction should be made in writing to: Licensing Division, Her Majesty's Stationery Office, St Clements House, 2-16 Colegate, Norwich NR3 1BQ or by e-mail to [email protected]
ii

8/6/2019 RR183 - Lifting Incident Review 1998-2003
http://slidepdf.com/reader/full/rr183-lifting-incident-review-1998-2003 4/93
CONTENTS
CONTENTS...................................................................................................................... iii
EXECUTIVE SUMMARY................................................................................................ v
1. INTRODUCTION ........................................................................................................ 11.1 BACKGROUND............................................................................................................11.2 SCOPE OF WORK.........................................................................................................1
2. REVIEW OF INCIDENT DATA........ ........ ........ ........ ........ ........ ......... ........ ........ ........ . 22.1 DEFINITIONS...............................................................................................................22.2 SELECTION OF LIFTING EQUIPMENT INCIDENTS...................................................32.3 DRILLING AND MECHANICAL HANDLING INCIDENTS..........................................52.4 EQUIPMENT FAILURE AND HUMAN FACTOR....... ........ ......... ........ ........ ........ ........ .6
2.5 CATEGORISATION OF INCIDENTS....... ........ ......... ........ ........ ........ ........ ......... ........ ...72.6. ASSIGNMENT OF INCIDENTS TO CATEGORIES........... ........ ........ ........ ........ ........ .13
3. DATA ANALYSIS...................................................................................................... 153.1 HIGH LEVEL ANALYSIS...........................................................................................153.2 DETAILED ANALYSIS OF DATA – DRILLING HANDLING INCIDENTS ....... .... .... .213.3 DETAILED ANALYSIS OF DATA – MECHANICAL HANDLING INCIDENTS .... .... .27
4. DISCUSSION ............................................................................................................. 354.1 DRILLING HANDLING EQUIPMENT – EQUIPMENT FAILURE...............................354.2 DRILLING HANDLING EQUIP MENT – HUMAN FACTOR.......................................364.3 MECHANICAL HANDLING EQUIPMENT – EQUIPMENT FAILURE........... .... .... .... .37
4.4 MECHANICAL HANDLING EQUIPMENT – HUMAN FACTORS..............................38
5. JOINT INDUSTRY AND HSE SAFETY INITIATIVES......... ......... ........ ........ ........ .. 415.1 SAFETY INITIATIVE BACKGROUND........ ......... ........ ........ ........ ........ ........ ......... ..... 415.2 SAFETY INITIATIVE INTRODUCTION........ ........ ........ ........ ........ ......... ........ ........ ....42
6. CONCLUSIONS......................................................................................................... 456.1 DATA ANALYSIS.......................................................................................................456.2 DRILLING HANDLING EQUIPMENT......... ......... ........ ........ ........ ........ ........ ......... .....466.3 MECHANICAL HANDLING EQUIPMENT........ ........ ........ ........ ........ ......... ........ ........ 466.5 SAFETY INITIATIVES ........ ........ ........ ........ ........ ........ ........ ......... ........ ........ ........ ...... 47
7. RECOMMENDATIONS............................................................................................ 487.1 TRAINING AND AWARENESS..................................................................................487.2 LIFTING OPERATIONS..............................................................................................487.3 REPORTING OF INCIDENTS.....................................................................................487.4 FURTHER INVESTIGATION......................................................................................49
8. RECOMMENDED FUTURE WORK ........ ........ ........ ........ ........ ......... ........ ........ ....... 50
REFERENCES................................................................................................................ 51
APPENDICES................................................................................................................. 52APPENDIX 1 HSE OSD DATA FORMAT........ ......... ........ ........ ........ ........ ........ ......... .53
APPENDIX 2 HIGH LEVEL DATA ANALYSIS – DETAIL CHARTS .... .... .... .... .... .... .55
iii

8/6/2019 RR183 - Lifting Incident Review 1998-2003
http://slidepdf.com/reader/full/rr183-lifting-incident-review-1998-2003 5/93
APPENDIX 3 DETAILED ANALYSIS – DRILLING EQUIPMENT FAILURES..... ... ... 61APPENDIX 4 DETAILED ANALYSIS – DRILLING HUMAN FACTORS..... .... .... .... .. 66APPENDIX 5 DETAILED ANALYSIS – MECHANICAL EQUIPMENT FAILURES.... 71APPENDIX 6 DETAILED ANALYSIS – MECHANICAL HUMAN FACTORS..... ..... .. 77APPENDIX 7 DRILLING HANDLING EQUIPMENT - HUMAN FACTORS ..... ... ..... .. 82APPENDIX 8 MECHANICAL HANDLING EQUIPMENT - HUMAN FACTORS..... ... 83
iv
8/6/2019 RR183 - Lifting Incident Review 1998-2003
http://slidepdf.com/reader/full/rr183-lifting-incident-review-1998-2003 6/93
EXECUTIVE SUMMARY
Sparrows Offshore Services Ltd, on behalf of the Health and Safety Executive Offshore Safety
Division, have undertaken a review of lifting incidents occurring in the United KingdomContinental Shelf (UKCS) with the objective of identifying any incident trends and alsoidentifying whether the introduction of certain industry safety initiatives, such as the LiftingOperations and Lifting Equipment Regulations (LOLER) and Step Change in Safety have had a positive effect in decreasing the number of lifting incidents.
The key findings of this study were:
• Of the 4,624 incident reported to the HSE during the study period, 1st
April 1998 to 31st
March 2003, 861 incidents were identified as occurring during lifting operations.
• An average of 172 incidents associated with both mechanical and drilling handlingequipment was reported each year, representing 18.6% of all incidents reported.
• 58.5% of lifting incidents were attributed to mechanical handling operations.
• 41.5% of lifting incidents were attributed to drilling handling operations.
• The root cause of 59% of lifting incidents was attributed to a human factor with 33.3% being caused by equipment failure. The remaining 7.7% could not be classified.
• Drilling handling incidents have shown an increasing trend, rising from 40.2% of liftingincidents to 43.1%.
• Mechanical handling incidents have shown a decreasing trend, falling from 59.8% of lifting
incidents to 56.9%.
• Since the introduction of LOLER at the end of 1998, lifting incidents have decreased from205 to 140 incidents per year (31.7%).
v

8/6/2019 RR183 - Lifting Incident Review 1998-2003
http://slidepdf.com/reader/full/rr183-lifting-incident-review-1998-2003 7/93
vi

8/6/2019 RR183 - Lifting Incident Review 1998-2003
http://slidepdf.com/reader/full/rr183-lifting-incident-review-1998-2003 8/93
1. INTRODUCTION
At the request of the Health & Safety Executive (HSE), Sparrows Offshore Services Ltd were
contracted to review and analyse incident data provided by the HSE Offshore Safety Division(OSD) for lifting incidents occurring in the United Kingdom Continental Shelf (UKCS) and identify any trends. The final report will also identify whether the introduction of certainindustry safety initiatives, such as LOLER and Step Change in Safety have had a positive effectin decreasing the number of lifting incidents.
1.1 BACKGROUND
Sparrows Offshore Services Ltd were previously contracted by the HSE to undertake a reviewof lifting equipment and lifting operations in the UKCS Oil and Gas industry with the aim of making recommendations which would have a positive effect in decreasing the number of incidents occurring in this area, phase 1. The findings of this study are contained within HSE
report OTO2000 024. The incidents that were reviewed were those that occurred during the period 1
stApril 1991 to 31
stMarch 1998. Since that review the regulation SI 2307 “Lifting
Operations and Lifting Equipment Regulation (LOLER) 1998” , and its associated Approved Codes Of Practice (ACOP) have been introduced. These documents are targeted at all personnel who have an involvement with lifting equipment and lifting operations in the UK.This phase 2 study aims to identify whether the introduction of LOLER and other safetyinitiatives have had an effect on the number of lifting incidents in the offshore industry sector.
1.2 SCOPE OF WORK
The scope of the project was to follow on from Offshore Technology Report – OTO2000 024,‘Lifting Equipment Project’ (phase 1), and review the HSE OSD incident data for the period 1
st
April 1998 to 31st March 2003, identifying all those incidents attributed to lifting equipment and lifting operations.
Following this selection process, the incidents were to be split between drilling and mechanicalhandling groups and then categorised as either those attributed as equipment failure or humanfactor. This categorisation would then allow any incident trends to be identified and highlightany areas where improved control measures are required.
The final section of the work scope is to review the various industry safety initiatives that have been introduced since phase 1 of this study was conducted and identify whether their introduction has had any effect on the number of incidents occurring in the UK ContinentalShelf (UKCS) Oil and Gas industry.
1

8/6/2019 RR183 - Lifting Incident Review 1998-2003
http://slidepdf.com/reader/full/rr183-lifting-incident-review-1998-2003 9/93
2. REVIEW OF INCIDENT DATA
As with phase 1 of the Lifting Equipment Project, a copy of the Health and Safety Executives
Offshore Safety Division incident database was transferred from the HSE offices at Bootle,Liverpool to the project team undertaking the second part of this study (based in Aberdeen). Toensure that there was no overlap of the data with phase 1, each year was taken as running fromthe 1
stApril to 31
stMarch.
The range of incidents to be included within this project was clearly defined during phase 1, aswell as the process used to categorise the incidents. To ensure the continuity between both phases of the study the incident categories and the categorisation process have carried over and used in this part of the study. The process used was as follows:
a) select incidents associated with lifting equipment or operations b) split the incidents between those associated with drilling and mechanical handling
c) split the selected incidents into those caused by equipment failure or human factorsd) group incidents under categories to allow analysis and identify trends, where possible
2.1 DEFINITIONS
The definitions used to filter and categorise the data in phase 1 were also used in phase 2.
• Lifting Equipment
The definition within Statutory Instrument 1998 Number 2307, The Lifting Operations and Lifting Equipment Regulation 1998 (LOLER) was used to define “Lifting Equipment”:
‘work equipment for lifting or lowering loads and includes its attachments for anchoring, fixing or supporting it’.
• Lifting Operation
Again from SI 2307:
‘an operation concerned with the lifting and lowering of a load’.
• Drilling Handling Equipment
The team undertaking the study recognised the need to mark the boundary between drilling and mechanical handling operations and, as drilling tends to be confined to a limited area on aninstallation the following definition was used:
‘all equipment and operations within the drilling package, including the use of dedicated drill pipe handling equipment’
• Mechanical Handling Equipment
Defined as:
‘all equipment not included within the drilling package’
2

8/6/2019 RR183 - Lifting Incident Review 1998-2003
http://slidepdf.com/reader/full/rr183-lifting-incident-review-1998-2003 10/93
2.2 SELECTION OF LIFTING EQUIPMENT INCIDENTS
The total number of incidents provided by the HSE OSD, covering all oil and gas productionand exploration locations on the UK Continental Shelf (UKCS), for phase 2 of the study, for the period 1998 to 2003 was as follows:
Table 2.1Number of incidents supplied by HSE OSD
Year Original Number
of Incidents
1998/99 1,046
1999/00 890
2000/01 959
2001/02 890
2002/03 839
4,624
The layout of the incident data on the spreadsheet provided for phase 2 was of a similar formatto that provided for phase 1. All the relevant columns that were used during the filtering process were still present on the new format, with the only real difference being that the codingused in each column was now replaced with the corresponding description. However, it wasnoted that the short description column had been replaced with a very brief incident title.
The first filtering process was to read the incident title for all 4,624 incidents to eliminate theobvious non-lifting incidents, for example the release of hydrocarbons. Following this, asecond filtering process was carried out on the remaining incidents, the categories ‘IncidentOperation’ (column n), ‘Broad Incident Type’ (column m) and the ‘Incident Title’ (column d)
were selected to capture the lifting incidents to be analysed as part of the study. By utilising‘Drilling/Workover’ and ‘Deck Operations’ from the ‘Incident Operation’ column, drillingrelated incidents could be selected. Likewise ‘Lifting/Crane Operations’ could be used to selectmechanical handling incidents.
However, on studying the summary note text for the first year of phase 2 incidents, it wasevident that if only these categories were used some lifting incidents, whether drilling or mechanical handling, would be overlooked, as well as the possibility of some non-liftingincidents being included in the final totals. It was also apparent that the ‘Incident Title’ did not provide adequate information to establish the root cause of the incidents, therefore the fullincident summary text would have to be read for all lifting incidents following the filtering process. At this stage it was decided by the project team to read the full incident summary for
all the incidents identified as possible lifting incidents following the first filtering process. Thisallowed the assigning of the incidents to categories to be undertaken at the same time as thefinal filtering process.
By utilising the lifting definitions and the full incident summary text it was possible to completethe filtering out of all non-lifting incidents. Examples of incidents discarded at this stageinclude (as per phase 1):
• manual handling
• falling objects – although incidents have been included where the dropped objectswere as a direct result of lifting operations.
• operations involving the use of tongs, which although suspended and dynamic donot raise or lower a load
• marine operations and anchor handling
3

8/6/2019 RR183 - Lifting Incident Review 1998-2003
http://slidepdf.com/reader/full/rr183-lifting-incident-review-1998-2003 11/93
The number of lifting incidents retained for further study in phase 2 was as listed in Table 2.2:
Table 2.2
Lifting incidents included in study
Year Original Number Lifting Incidents
of Incidents
1998/99 1,046 205
1999/00 890 170
2000/01 959 165
2001/02 890 181
2002/03 839 140
4,624 861
The average number of incidents associated with lifting equipment or lifting operations was 172 per year.
4

8/6/2019 RR183 - Lifting Incident Review 1998-2003
http://slidepdf.com/reader/full/rr183-lifting-incident-review-1998-2003 12/93
2.3 DRILLING AND MECHANICAL HANDLING INCIDENTS
A simple split between drilling handling equipment and mechanical handling equipment, in linewith the definitions in 2.1 above was undertaken.
drilling handling
equipment
incidents
i
or lifting
equipment
mechanicalhandling
lifting operaton
Figure 2.1 - First level of categorisation
The final distribution of incidents was as Table 2.3:
Table 2.3
Drilling handling / mechanical handling equipment
Year Drilling Handling Mechanical Handling Total Number of Lifting
Equipment Equipment Incidents
1998/99 83 122 205
1999/00 64 105 169
2000/01 75 90 165
2001/02 76 105 181
2002/03 59 81 140
357 503 860
Note that all but one lifting incident could be classified between drilling or mechanical handlingequipment.
5

8/6/2019 RR183 - Lifting Incident Review 1998-2003
http://slidepdf.com/reader/full/rr183-lifting-incident-review-1998-2003 13/93
2.4 EQUIPMENT FAILURE AND HUMAN FACTOR
As with the incident data for phase 1 each incident was reviewed and categorised as either:
• drilling handling incidents – equipment failure (DHE-EF)
•
drilling handling incidents - human factor (DHE-HF)• mechanical handling incidents - equipment failure (MHE-EF)
• mechanical handling incidents – human factor (MHE-HF)
equipment
DHE-
drilling handling
equipment
human
DHE-
incidents
lifting operation
or lifting
equipment
equipment
mechanicalhandling
human
EF HF MHE-EF MHE-HF
Figure 2.2 - Second level of categorisation
This categorisation was then applied to all incidents in phase 2 of the study.
The split was as follows:
Table 2.4
Equipment failure / human factors
Year DHE-EF DHE-HF MHE-EF MHE-HF Total Number
of Lifting
Incidents
1998/99 30 47 30 85 192
1999/00 18 36 34 64 152
2000/01 30 39 25 56 150
2001/02 35 32 36 66 169
2002/03 24 35 27 46 132
137 189 152 317 795
Again, due to the information provided in the incident text it was not possible to classify everylifting incident into one of the categories above.
Overall, the split between equipment failure and human factors was 287/508 (36%/64%).
6

8/6/2019 RR183 - Lifting Incident Review 1998-2003
http://slidepdf.com/reader/full/rr183-lifting-incident-review-1998-2003 14/93
2.5 CATEGORISATION OF INCIDENTS
To examine trends and analyse incident data, the four major categories (drilling – equipmentfailure, drilling – human factor, mechanical handling – equipment failure and mechanicalhandling – human factor) were further sub-divided into more detailed categories, as developed from phase 1 of the study. For completeness, these categories have been listed in Tables 2.5,2.6, 2.7 and 2.8 with a short explanation of the scope of each category and examples, whereappropriate.
Table 2.5
Drilling - equipment failure categories
Category DHE-EF Category Title
Number
DHE-EF1 Elevators
DHE-EF2 Compensators
DHE-EF3 WinchesDHE-EF4 Hoisting system
DHE-EF5 Wireline
DHE-EF6 Blow-out preventer (BOP)
DHE-EF7 Pipe handling
DHE-EF Category 1 – Elevators A lifting accessory suspended from the travelling block (the lifting equipment) including the suspension and anchoring system.
DHE-EF Category 2 – Compensators Although compensators are not lifting equipment in their own right failure of such equipment
has a knock-on effect on lifting equipment within the drilling package, principally the drawworks and wire line equipment and the systems have many features in common with other lifting equipment studied.
DHE-EF Category 3 – Winches All winch systems (including wire ropes and hooks) associated with the drilling package, including those for lifting of persons (man-riding).
DHE-EF Category 4 – Hoisting SystemAn extensive category including all equipment associated with the hoisting system, with the exception of the elevators. Included are the drawworks themselves and associated drilling line, crown block, travelling block, drilling hook and reserve line drum, see Figure 2.3 below:
7

8/6/2019 RR183 - Lifting Incident Review 1998-2003
http://slidepdf.com/reader/full/rr183-lifting-incident-review-1998-2003 15/93
Drawworks
Drawworks
Drum
Travelling Block
Crown Block
Drilling Hook
Elevators
Reserve
Drum
Dead LineAnchor
Figure 2.3Hoisting system
DHE-EF Category 5 – WirelinePrimarily concerned with the lifting equipment associated with wire lining, i.e. the winch, line and load attachment system.
DHE-EF Category 6 – Blow-out Preventer (BOP)This category covers the lifting equipment used to move the BOP’s, rather than failure of unit itself.
DHE-EF Category 7 – Pipe HandlingThe pipe handling category captures failure of the attachments on the drill string assembly used when lifting, for example collars and tool joints on the end of the string (i.e. failure of the load
itself) and string handling equipment outwith the main hoisting system, for example pipe racking equipment.
Table 2.6
Drilling – human factor categories
Category DHE-HF Category Title
Number
DHE-HF1 Elevators
DHE-HF2 Compensators
DHE-HF3 Winches
DHE-HF4 Hoisting system
DHE-HF5 Wireline
DHE-HF6 Blow-out preventer (BOP)
DHE-HF7 Pipe handling
In Table 2.6 all incidents assigned to these categories were as a result of human factors, rather than equipment failure. The same categories were used for human factors as for equipmentfailure as the equipment within the drilling package readily splits itself into well-delineated groups.
8

8/6/2019 RR183 - Lifting Incident Review 1998-2003
http://slidepdf.com/reader/full/rr183-lifting-incident-review-1998-2003 16/93
equipment
drilling handling
equipment
incidents
lifting operation
or lifting
equipment
elevator
elevator
compensator winches
compensator
mechanical
handling
winches
hoisting system
hoisting system
wireline
wireline
BOP
BOP
pipe handling
pipe handling
DHE-EF
DHE-EF1
DHE-HF1
DHE-EF2 DHE-EF3
DHE-HF2
human
DHE-HF
DHE-HF3
DHE-EF4
DHE-HF4
DHE-EF5
DHE-HF5
DHE-EF6
DHE-HF6
DHE-EF7
DHE-HF7
Figure 2.4
Drilling handling equipment categorisation
Similarly, for mechanical handling equipment:
Table 2.7Mechanical handling – equipment failure categories
Category
Number MHE-EF Category Title
MHE-EF1 Pedestal crane – hoist function
MHE-EF2 Pedestal crane – boom function
MHE-EF3 Pedestal crane – slew function
MHE-EF4 Pedestal crane – power pack
MHE-EF5 Pedestal crane – ancillary equipment
MHE-EF6 Pedestal crane – accessoriesMHE-EF7 Other cranes / Powered lifting appliances
MHE-EF8 Manual lifting equipment
MHE-EF9 Lifting accessories
MHE-EF Category 1 – Pedestal Crane – Hoist FunctionAll incidents associates with equipment failure on the hoist system including power take-off, winch drum, sheaves and control system.
MHE-EF Category 2 – Pedestal Crane – Boom FunctionAll equipment associated with the boom hoist system.
9

8/6/2019 RR183 - Lifting Incident Review 1998-2003
http://slidepdf.com/reader/full/rr183-lifting-incident-review-1998-2003 17/93
boom
function
hoist
slew
function
function
Figure 2.5 – Typical pedestal crane functions
MHE-EF Category 3 – Pedestal Crane – Slew FunctionAll equipment associated with the slew system.
MHE-EF Category 4 – Pedestal Crane – Power PackThe prime mover used to power crane primary systems.
MHE-EF Category 5 – Pedestal Crane – Ancillary EquipmentEquipment not directly in the load path of the crane, for example safety cut-outs.
MHE-EF Category 6 – Pedestal Crane – Accessories Running gear associated with the pedestal crane, for example wire ropes, hook blocks.
MHE-EF Category 7 – Other Cranes / Powered Lifting Appliance Includes all other cranes found offshore which are not classed as pedestal cranes, for example ROV handling crane, overhead gantry as well as other powered lifting appliances, such as air hoists.
MHE-EF Category 8 – Manual Lifting Equipment Portable lifting equipment such as chain and lever hoists which require physical effort to operate.
MHE-EF Category 9 – Lifting Accessories As per the LOLER description, items used to connect the lifting equipment (crane, chain hoist)
to the load, for example slings, shackles, spreader beams, etc.
10

8/6/2019 RR183 - Lifting Incident Review 1998-2003
http://slidepdf.com/reader/full/rr183-lifting-incident-review-1998-2003 18/93
Table 2.8
Mechanical handling – human factor categories
Category MHE-HF Category Table
Number MHE-HF1 Pedestal crane – platform lifts
MHE-HF2 Pedestal crane – sea lifts
MHE-HF3 Installation - pedestal crane operations
MHE-HF4 Marine - pedestal crane operations
MHE-HF5 Other lifting appliances – powered
MHE-HF6 Other lifting appliances – manual
MHE-HF7 Pedestal crane - maintenance
MHE-HF Category 1 – Pedestal Crane – Platform LiftsIncidents occurring on board the installation in whic h the human factor attributed to the incidentlay with the crane operator.
MHE-HF Category 2 – Pedestal Crane – Sea LiftsIncidents occurring during lifting operations to or from a sea going vessel in which the humanfactor attributed to the incident lay with the crane operator.
MHE-HF Category 3 – Installation – Pedestal Crane OperationsIncidents occurring on board the installation in which the human factor was not attributed to thecrane operator, rather to a third party associated with the lifting operation.
MHE-HF Category 4 – Marine – Pedestal Crane OperationsIncidents occurring during lifting operations to or from a sea going vessel in which the humanfactor was not attributed to the crane operator, rather to a third party associated with the sea
going vessel.
MHE-HF Category 5 – Other Lifting Appliances – Powered Incidents caused by human factors associated with cranes other than the pedestal crane and powered lifting appliances.
MHE-HF Category 6 – Other Lifting Appliances – ManualIncidents caused by human factors associated with portable lifting equipment and accessories.
MHE-HF Category 7 – Pedestal Crane - MaintenanceIncidents involving pedestal cranes where maintenance activities were the root cause.
11

8/6/2019 RR183 - Lifting Incident Review 1998-2003
http://slidepdf.com/reader/full/rr183-lifting-incident-review-1998-2003 19/93
drilling handling
equipment
equipment
mechanical
handling
manual
incidents
lifting operation
or lifting
equipment
powered
other lifting
appliances manualpowered
hoist
function
(primary
control)
pedestal
crane
boom
other liftingappliance
slew
lifting
equipment
lifting
accessories
power packancillary
equipmentaccessories
pedestal
crane
other lifting
appliance
platform lift sea lift installation liftmaintenance
deck
oprerations
marine
MHE-EF
human
MHE-HF
MHE-HF6
MHE-EF1 MHE-EF2
MHE-EF7
MHE-EF3
MHE-EF8 MHE-EF9
MHE-EF4MHE-EF5
MHE-EF6
MHE-HF5
MHE-HF1 MHE-HF2 MHE-HF3MHE-HF7 MHE-HF4
Figure 2.6
Mechanical handling equipment categorisation
12

8/6/2019 RR183 - Lifting Incident Review 1998-2003
http://slidepdf.com/reader/full/rr183-lifting-incident-review-1998-2003 20/93
2.6. ASSIGNMENT OF INCIDENTS TO CATEGORIES
The project team undertook allocation of the 861 lifting incidents to the categories described earlier. However, as with phase 1 it became evident that not every incident could be positive lyassigned to a category as the text for these incidents did not provide enough information toeither identify the specific type of lifting equipment being used or the results of anyinvestigations / examinations of failed equipment carried out at the time of the incident. It wasdecided by the project team that, since the incident text did not provide enough information tofully classify these incidents, they should be set aside as unclassified lifting incidents and nofurther investigation undertaken. However, so as not to distort the final analysis, these incidentswould still be included in the total number of lifting incidents reported.
Setting aside these incidents produced the following results:
• The final number of fully classified lifting incidents was reduced by 66, from 861 to 795.• Drilling handling equipment incidents reduced by 31, from 357 to 326
• Mechanical handling equipment incidents reduced by 34, from 503 to 469• The ratio of equipment failure and human factor as the root cause was 36/64
The categorisation of incidents was finalised as shown in Tables 2.9 and 2.10 below:
Table 2.9
Drilling lifting incidents by year
Category 98/99 99/00 00/01 01/02 02/03 Total
SUB-TOTAL 30 18 30 35 24 137
Human Factor
Winches DHE-HF3 21 6 11 5 9 52
Pipe Handling DHE-HF7 8 8 10 8 9 43
Hoisting system DHE-HF4 4 13 8 8 6 39
Elevators DHE-HF1 12 4 4 8 5 33
Wireline DHE-HF5 1 3 5 2 5 16
BOP DHE-HF6 1 2 1 1 1 6
Compensators DHE-HF2 0 0 0 0 0 0
SUB-TOTAL 47 36 39 32 35 189
TOTAL 77 54 69 67 59 326
Equipment Failure
Wireline
Pipe HandlingHoisting system
Winches
Elevators
BOP
Compensators
DHE-EF5
DHE-EF7DHE-EF4
DHE-EF3
DHE-EF1
DHE-EF6
DHE-EF2
1 7 9
6 6 58 0 7
8 3 5
4 1 3
2 1 1
1 0 0
11 5 33
5 7 298 4 27
6 3 25
3 5 16
2 0 6
0 0 1
13

8/6/2019 RR183 - Lifting Incident Review 1998-2003
http://slidepdf.com/reader/full/rr183-lifting-incident-review-1998-2003 21/93
Table 2.10
Mechanical handling lifting incidents by year
Category 98/99 99/00 00/01 01/02 02/03 Total
Equipment Failure
Manual lifting equipment
Lifting accessories
Hoist
Other cranes
Boom
Ancillary equipment
Accessories
Power pack
Slew
MHE-EF8 6
MHE-EF9 9
MHE-EF1 2
MHE-EF7 3
MHE-EF2 5
MHE-EF5 1
MHE-EF6 3
MHE-EF4 1
MHE-EF3 0
13 3
6 3
4 2
3 7
0 6
2 3
5 1
1 0
0 0
6 3 31
3 5 26
8 7 23
5 3 21
5 2 18
8 2 16
1 3 13
0 1 3
0 1 1
SUB-TOTAL
Human Factor
Installation lifts
Other – manual
Sea lifts
Platform lifts
Marine
Other – powered
Maintenance
MHE-HF3
MHE-HF6
MHE-HF2
MHE-HF1
MHE-HF4
MHE-HF5
MHE-HF7
30
36
15
9
9
6
7
3
34
20
13
9
6
7
6
3
25
25
6
10
8
4
2
1
36 27 152
29 18 128
10 8 52
7 5 40
9 4 36
7 5 29
2 0 17
2 6 15
SUB-TOTAL 85 64 56 66 46 317
TOTAL 115 98 81 102 73 469
14
8/6/2019 RR183 - Lifting Incident Review 1998-2003
http://slidepdf.com/reader/full/rr183-lifting-incident-review-1998-2003 22/93
3. DATA ANALYSIS
Following the final assignment of each of the 795 incidents associated with phase 2 of this study
into the broad categories mentioned earlier, each category was then analysed to identify anytrends.
3.1 HIGH LEVEL ANALYSIS
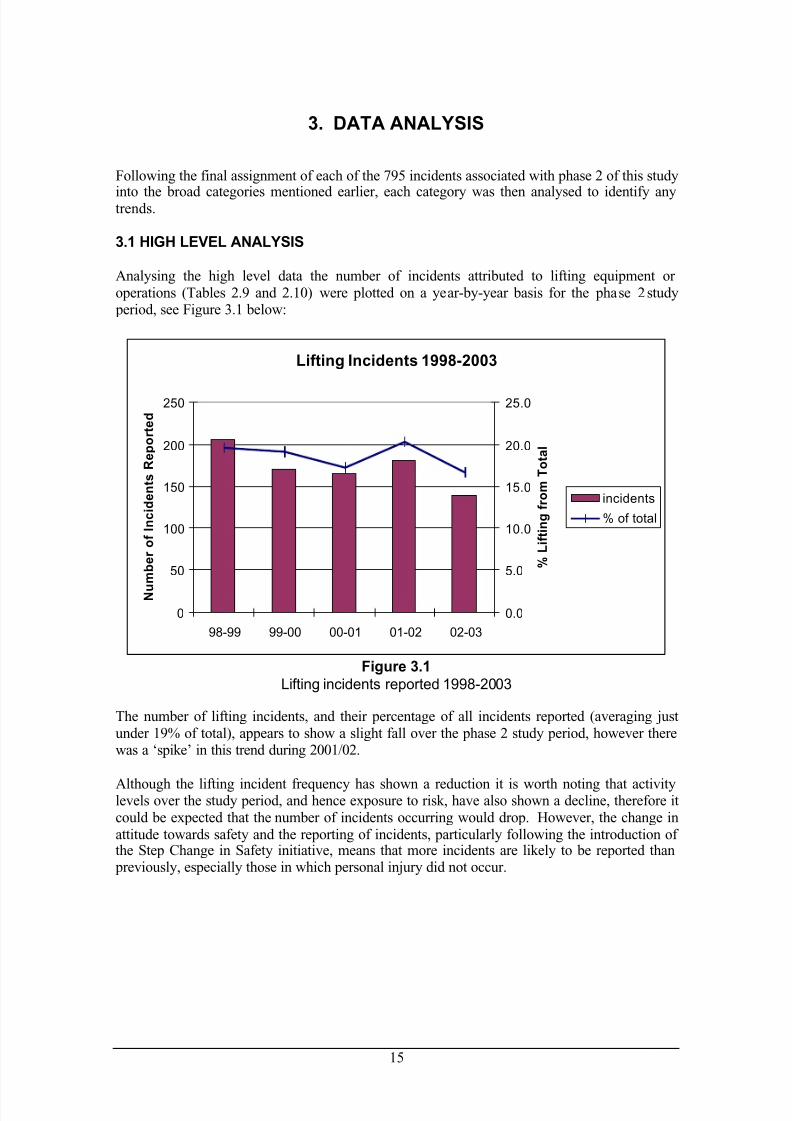
Analysing the high level data the number of incidents attributed to lifting equipment or operations (Tables 2.9 and 2.10) were plotted on a year-by-year basis for the phase 2 study period, see Figure 3.1 below:
Lifting Incidents 1998-2003
0
50
100
150
200
250
98-99 99-00 00-01 01-02 02-03
N u
m b e r o f I n c i d e n t s R e p o r t e d
0.0
5.0
10.0
15.0
20.0
25.0
% L
i f t i n g f r o m T
o t a l
incidents
% of total
Figure 3.1
Lifting incidents reported 1998-2003
The number of lifting incidents, and their percentage of all incidents reported (averaging justunder 19% of total), appears to show a slight fall over the phase 2 study period, however therewas a ‘spike’ in this trend during 2001/02.
Although the lifting incident frequency has shown a reduction it is worth noting that activitylevels over the study period, and hence exposure to risk, have also shown a decline, therefore itcould be expected that the number of incidents occurring would drop. However, the change inattitude towards safety and the reporting of incidents, particularly following the introduction of the Step Change in Safety initiative, means that more incidents are likely to be reported than previously, especially those in which personal injury did not occur.
15

8/6/2019 RR183 - Lifting Incident Review 1998-2003
http://slidepdf.com/reader/full/rr183-lifting-incident-review-1998-2003 23/93
The initial split in lifting data was between drilling and mechanical handling incidents. Thetrends in these incidents are shown in figure 3.2:
all lifting incidents 1998-2003drilling/mechanical handling split
0
10
20
30
40
50
60
70
98-99 99-00 00-01 01-02 02-03
% o
f i n c i d e n t s
d u r i n g y e a r
lifting incidents (% of all incidents)drilling incidents (% of lifting)
mechanical handling incidents (% of lifting)
Figure 3.2
Lifting incidents reported – drilling / mechanical (best fit lines) – 1998 to 2003
Averaged over phase 2 of the study period, 59% of all lifting incidents were attributed tomechanical handling and 41% to drilling.
As mentioned earlier the percentage of all lifting incidents against all incidents reported hasshown a slight fall, around 3%. Although the proportion of lifting incidents attributed to
mechanical handling is the greatest, this category has shown an improvement over the study period, falling by 3% overall. Conversely, the proportion of incidents attributed to drillingoperations and equipment has risen by a similar percentage.
16

8/6/2019 RR183 - Lifting Incident Review 1998-2003
http://slidepdf.com/reader/full/rr183-lifting-incident-review-1998-2003 24/93
The best fit profiles for equipment failure and human factor incidents, for all lifting incidentsover the study period have revealed the following trends:
all lifting incidents 1998-2003equipment failure/human factor split
0
10
20
30
40
50
60
70
98-99 99-00 00-01 01-02 02-03
% o
f i n c i d e n t s d u r i n g y e a r
lifting incidents (% of all incidents)
equipment failure (% of lifting)
human factor (% of lifting)
Figure 3.3
Equipment failure / human factor incidents (best fit lines) – 1998 to 2003
As can be seen in Figure 3.3 above, incidents attributed to human factors account for the largest proportion of all lifting incidents. However, this category has shown a marked improvementover the study period, reducing by approximately 7%. On the other hand, the number of incidents attributed to equipment failure has seen a significant increase in percentage, 9.1%, of all lifting incidents over the study period. In categorising the incidents between those caused by
human factor or due to equipment failure it was not always possible to decide for certain whichcategory best fitted an incident as the description provided did not include any further investigation into a specific incident that may have taken place. Where a human factor wasclearly the root cause, then these incidents were easily categorised. However for many of thoseincidents ultimately assigned to equipment failure all that could be determined with anycertainty was that the equipment had indeed failed. It is possible that, with a more detailed investigation of these incidents, some of them could be re-categorised as having human factor asthe root cause, for example an item of lifting equipment failing due to improper use or specification. Unfortunately the nature of the data held by HSE OSD did not readily allowfurther investigation of those incidents where some doubt existed.
17

8/6/2019 RR183 - Lifting Incident Review 1998-2003
http://slidepdf.com/reader/full/rr183-lifting-incident-review-1998-2003 25/93
Further splitting the data for both equipment failure and human factor incident in to thoseattributed to mechanical handling and drilling handling incidents the following trends have beenrevealed:
lifting incidents 1998-2003 general trends
0
5
10
15
20
25
30
35
40
45
98-99 99-00 00-01 01-02 02-03
% o
f a l l l i f t i n g i n c i d e n t s d u r i n g y e a r
mechanical handling equipment - equipment failuremechanical handling equipment - human factor
drilling handling equipment - equipment failure
drilling handling equipment - human factor
Figure 3.4
Drilling / mechanical incidents (best fit lines) – 1998 to 2003
Figure 3.4 above clearly shows that incidents attributed to mechanical handling – human factor account for the largest proportion of lifting incidents. However this was also the only categorythat has shown an improvement in the number of incidents occurring, as a percentage of alllifting incidents over the study period, falling by nearly 9%. The number of equipment failureincidents under mechanical handling has shown a slight increase, however this has not besignificant enough to reverse the overall downward trend of mechanical handling incidents,shown earlier in figure 3.2.
Looking at the trends for the drilling handling incidents, both those caused by human factorsand equipment failure have increase over the study period, this further backs up the increasingtrend for the drilling handling incidents, again shown earlier in figure 3.2.
Detailed charts showing the year-on-year number of incidents and their percentage of all liftingincidents for drilling and mechanical handling, equipment failure and human factors can befound in Appendix 2.
18

8/6/2019 RR183 - Lifting Incident Review 1998-2003
http://slidepdf.com/reader/full/rr183-lifting-incident-review-1998-2003 26/93
Splitting the incidents in to the final categories described in Section 2 and as shown in Tables2.9 and 2.10 produces the following charts:
drilling handling equipment
equipment failures 1998-2003
total incidents reported
12%
1%
18%
20%24%
4%
21%
elevators compensators wincheshoisting system wireline BOPpipe handling
Figure 3.5
Drilling handling incidents – equipment failure – 1998 to 2003
drilling handling equipment
human factors 1998-2003
total incidents reported
17%
28%
21%
8%
3%
23%
0%
elevators compensators wincheshoisting system wireline BOPpipe handling
Figure 3.6
Drilling handling incidents – human factors – 1998 to 2003
19

8/6/2019 RR183 - Lifting Incident Review 1998-2003
http://slidepdf.com/reader/full/rr183-lifting-incident-review-1998-2003 27/93
mechanical handling equipment
equipment failures 1998-2003
total incidents reported
15%
12%
2%
11%
9%14%
1%
16%
20%
hoist boomslew power packancillary accessoryother lifting equipment manual lifting equipmentlifting accessory
Figure 3.7
Mechanical handling incidents – equipment failure – 1998 to 2003
mechanical handlingequipment
human factors 1998-2003
total incidents reported11%
41%
9%
5%
16%
5%
13%
platform lift supply vessel liftinstallation lift marinepowered lifting equipment manual lifting equipmentmaintenance
Figure 3.8
Mechanical handling incidents – human factors – 1998 to 2003
The following two sections of this report give a more detailed analysis of the incidents withinthe final categories identified previously.
20

8/6/2019 RR183 - Lifting Incident Review 1998-2003
http://slidepdf.com/reader/full/rr183-lifting-incident-review-1998-2003 28/93
3.2 DETAILED ANALYSIS OF DATA – DRILLING HANDLING INCIDENTS
drilling handling equipment
5 most common incident categories
0
1
2
3
4
5
6
7
8
98-99 99-00 00-01 01-02 02-03
% o
f a l l l i f t i n g i n
c i d e n t s d u r i n g y e a r
human factor - winches human factor - pipe handling
human factor - hoisting system human factor -elevators
equipment failure - wireline
Figure 3.9
Drilling handling incidents – top 5 incident categories (best fit lines) – 1998 – 2003
Figure 3.9 above shows the 5 most common incident categories associated with drillinghandling equipment. As can be seen 3 out of the 5 categories have shown an increase infrequency over the study period, with the most significant being those caused by failure of wireline equipment. However, as mentioned previously further investigation of these incidentscould result in some of these incidents being attributed to human factor.
Although the category for human factor – winches was the largest contributor to drillinghandling incidents over the whole study period, this category has shown a marked fall in thenumber of incidents, as a percentage of all lifting incidents.
To follow is a more detailed look at each incident category associated with drilling handlingequipment. Detailed charts showing year-on-year incident numbers can be found in Appendices3 and 4.
21

8/6/2019 RR183 - Lifting Incident Review 1998-2003
http://slidepdf.com/reader/full/rr183-lifting-incident-review-1998-2003 29/93
Drilling incidents – equipment failure
DHE–EF1 – Elevators
Over the study period the number of incidents where failure of the elevator was deemed as theroot cause has increased.
The most common result (9 of 16, 56%) of elevator failure is a dropped load (drilling string or pipe). The remaining 44% of incidents resulted in parts of the elevator, (bolts, nuts and pins)falling down inside the derrick. This was possibly due to excess vibration during drillingoperations.
DHE–EF2 – Compensators
This section covers incidents associated with failure of both the compensator and tensioner system as, although neither is strictly speaking, lifting equipment the systems employed both
have characteristics in common with other equipment in the study; primarily the use of wireropes.
There was only 1 incident within this study that has been assigned to this category, whichconcerned part of the compensator assembly breaking loose and falling to the drill floor.
DHE–EF3 – Winches
Incidents involving equipment failure of winches and their associated ancillaries within thedrilling package have seen a slight falling trend over the full study period.
The most common result, 13 of 25 incidents, of equipment failure was a dropped object, as part
of the lifting equipment fell down inside the derrick. These being wire rope (5), sheave (4),chain (1) and part of the winch itself on three occasions.
In 8 out of 25 incidents, the result was a dropped load due to failure of the lifting accessories(4), wire rope (3) and wire termination (1). Of the remaining 4 incidents, 2 resulted in atemporary loss of control of the load and in the other 2 the failure occurred before the load had been lifted off the deck.
Of the four incidents resulting in the parting of the wire rope or the termination there wasinsufficient evidence to say definitely whether an overload had been induced in the line.
DHE–EF4 – Hoisting System
This category covers an extensive amount of lifting equipment from the Drawworks through tothe travelling block and the attached Top drive, see figure 2.3 presented earlier.
Splitting the incidents between the various items of equipment within the hoisting systemidentifies the following equipment as the root cause:
• Drawworks 9 of 27 incidents (33%)
• Top drive 6 of 27 incidents (22%)
• Unknown 5 of 27 incidents (19%)
• Travelling block 3 of 27 incidents (11%)
• Crown block 3 of 27 incidents (11%)
• Dead line anchor 1 of 27 incidents (4%)
22
8/6/2019 RR183 - Lifting Incident Review 1998-2003
http://slidepdf.com/reader/full/rr183-lifting-incident-review-1998-2003 30/93
Of the 9 incidents attributed to failure of the Drawworks, 5 of these were deemed to be caused due to failure or slipping of the brake, resulting in an uncontrolled descent of the load / block until the load either contacted the drill floor or the back-up brakes were applied.
Over half of the incidents (15 of 27) resulted in a dropped object, usually part of the liftingequipment falling down inside the derrick.
The overall trend for incidents in this category has been upwards, however the final year of thestudy, 2002/03 has seen a marked improvement, halving the number of incidents from the previous years.
DHE–EF5 - Wireline
The largest category within the drilling equipment failure section with 33 incidents reported.This represents 4% of all lifting incidents and just less than one quarter (24%) of drillingequipment failure.
Of the 33 incidents within this category 26 were as a result of the wireline parting, whichresulted in either the tool being dropped to the drill floor or lost down hole. However thedetailed descriptions provided for many of these incidents was not sufficient to determine anyroot cause for the failure of the wire, all that is known is that the wire parted.
Over the study period, the trend of incidents within this category has been upwards and it is theonly equipment failure category that appears within the 5 most common drilling handlingincidents. However, as with failures of the hoisting system, the final year of the study has seena considerable reversal of this trend.
DHE-EF6 – Blow-Out-Preventer (BOP) Lifting Equipment
The second smallest category, after compensators, within the drilling equipment failure sectionwith 6 incidents reported was BOP lifting equipment failure, this represents less than 1% of alllifting incidents. The trend over the study period for this category has been downwards with noincidents reported in 2002/03.
The results of failure of this type of equipment were dropped load (3), dropped object (2) and equipment damage (1).
DHE-EF7 – Pipe Handling
This category includes failures of the pipe handling equipment such as mechanical racking
systems and failure of the drill string tool joints, for example collars and threads.
The most common cause (12 of 29, 41%) of equipment failures were attributed to parts of themechanical pipe handling / racking systems. There were 10 incidents where the drill stringfailed (tool joint), rather than the lifting equipment.
As might be expected, the results of equipment failure within this category were dropped load (14), dropped object (12) and injured personnel (2). Under dropped objects, there were 9instances of parts falling from the pipe handling / racking equipment, most commonly bolts and pins that had either sheared or vibrated loose.
The trend for incidents within this category is upwards and it accounts for the second highestcategory within the drilling equipment failure section with 29 incidents reported, representing
23

8/6/2019 RR183 - Lifting Incident Review 1998-2003
http://slidepdf.com/reader/full/rr183-lifting-incident-review-1998-2003 31/93
3% of all lifting incidents and 21% of drilling equipment failures. This increasing trend could be due to the increasing mechanisation of the pipe racking process.
Drilling incidents – human factors
DHE-HF1 – Elevators
This is the fourth highest category (17%) within the drilling handling equipment, human factor group, and shows there has been a steady downward trend since 1998/99, with the exception of 2001/02 that saw a slight increase in the number of incidents.
Two major root causes were identified as:
• Operator error 15 of 33 incidents (45%)
• Positioning / action of injured party 14 of 33 incidents (42%)
The most common outcome of an incident within this category was an injury to one of the drill
crew (14 of 33 incidents). In 10 of these 14 cases, the injured party had their fingers, thumb or hand caught and crushed, either in the elevators as they opened or closed, or between theelevator and the load.
On three occasions, the operator accidentally operated the automatic elevator release function,resulting in the suspended load being dropped to the drill floor.
DHE-HF2 – Compensators
There were no reported incidents during the study period that fell in to this category.
DHE-HF3 – Winches
The largest category within the human factor group with 53 incidents (6.2% of all liftingincidents and 28% of those attributed to drilling equipment – human factors). However, thiscategory has seen one of the most dramatic downward trends since 1998/99, apart from a coupleof poor years, 2000/01 and 2002/03.
It was possible to attribute the root causes of the incidents in this category as follows:
• Operator Error 22 of 52 incidents (42%)
• Procedures 13 of 52 incidents (25%)
• Positioning of injured party 10 of 52 incidents (19%)
• Banking 4 of 52 incidents (8%)
•
Rigging 3 of 52 incidents (6%)
The results of these incidents were as follows:
• Dropped object 21 of 52 incidents (40%)
• Injured party 16 of 52 incidents – either trapped or struck by load (31%)
• Dropped Load 10 of 52 incidents (19%)
• Equipment damage 5 of 52 incidents (10%)
24

8/6/2019 RR183 - Lifting Incident Review 1998-2003
http://slidepdf.com/reader/full/rr183-lifting-incident-review-1998-2003 32/93
DHE-HF4 – Hoisting System
Overall the incidents within this category have shown a slightly increasing trend over the study period, this is partly due to a significant increase in incidents during 1999/00. Since then therehas been a slight decrease over the remaining years, however this has not returned to the level atthe start of the study.
The root causes were determined as:
• Operator error 30 of 39 incidents (77%)
• Rigging 5 of 39 incidents (13%)
• Positioning 3 of 39 incidents (8%)
• Maintenance 1 of 39 incidents (2%)
Looking at all the root causes, the most significant factor is operator error when using any of theelements within the hoisting system. Of these incidents, 24 involved the operation of thetravelling block; most frequently the block catching on other equipment in the derrick resulting
in either equipment damage or a dropped object.
There were 5 incidents that resulted in injury to personnel, these being either trapped limb dueto poor positioning of the individual or as a result of being struck by a dropped object.
DHE-HF5 – Wireline
This category has seen a steadily increasing trend in the number of incidents occurring as withthose attributed to failure of the wireline equipment. With 16 incidents due to human factorscompared to 33 equipment failure it may appear that the main area of concern should be withthe equipment currently in use. However, when considering that 79% of equipment failureswere the direct result of the wireline parting, and the fact that due to the level of information
provided in the incident text it was impossible to determine the root cause of the failure, it is possible that with further investigation some of these incidents could in fact be attributed tohuman factors. This is further substantiated by the fact that 11 of the 16 human factor incidents(69%), occurred due to operator error and that in all but one of these incidents the wireline had been subjected to over tensioning and resulted in the wire parting.
The root causes were attributed to:
• Operator error 11 of 16 incidents (69%)
• Positioning 4 of 16 incidents (25%)
• Maintenance 1 of 16 incidents (6%)
The most common result (11 occasions), of an incident was the wireline tool being dropped either to the drill floor or down hole. On 10 of these occasions the root cause was the operator over hoisting the wireline causing the wire to part, and on the other occasion was due toincorrect maintenance of the equipment.
DHE-HF6 – Blow-Out-Preventer (BOP) Lifting Equipment
As with the equipment failure section, this is the second smallest category within the drillingequipment human factor group with only 6 incidents reported over the five years of this studyand the maximum incidents reported in any single year being 2.
25

8/6/2019 RR183 - Lifting Incident Review 1998-2003
http://slidepdf.com/reader/full/rr183-lifting-incident-review-1998-2003 33/93
The main cause of incidents, (4 out of 6) was deemed to be due to the use of poor procedures or poor pre-task planning. These incidents could have been avoided had better control measures been in place. The other 2 incidents were attributed to banking during the lifting operation.
DHE-HF7 – Pipe Handling
The second largest category within the drilling handling equipment – human factor group, with43 incidents (5% of all lifting incidents). This category was the most common of the drillinghandling group over the last two years of the study.
The two most common causes of the incidents were poor positioning of the injured party (17 of 43, 40%) and operator error (16 of 43, 37%). All of the poor positioning incidents resulted in personnel injury due to the injured party having their fingers, hands or arms trapped as a resultof handling the drill pipe / collars. The information contained in the incidents text show there to be a lack of awareness by the derrickhand of both inertia and momentum of the various drill pipes when they are being handled in and out of the monkey board fingers. The incidents
attributed to operator error were due to incorrect or careless operation of the mechanical pipehandling equipment and usually resulted in either a dropped load (9 of 16) or a dropped object(5 of 16).
With the increasing mechanisation of the pipe handling process (for example mechanicalracking systems) it would have been expected that the incidents in this category should havedecreased over the study perio d, however this has not been the case. Instead this category has become the most likely incident to occur within the drilling operations. As mentioned earlier the biggest cause is due to carelessness of the derrickhand or the operator of the mechanical pipehandling equipment.
26

8/6/2019 RR183 - Lifting Incident Review 1998-2003
http://slidepdf.com/reader/full/rr183-lifting-incident-review-1998-2003 34/93
3.3 DETAILED ANALYSIS OF DATA – MECHANICAL HANDLING INCIDENTS
mechanical handling equipment
5 most common incident categories
0
2
4
6
8
10
12
14
16
18
98-99 99-00 00-01 01-02 02-03
% o
f a l l l i f t i n g i n c i d e n t s d u r i n g y e a r
human factor - installation lift (deck crew)
human factor - manual lifting equipment
human factor - sea lifts (crane operator)
human factor - installation lifts (crane operator)
equipment failure - manual lifting equipment
Figure 3.10
Mechanical handling incidents – top 5 incident categories (best fit lines) - 1998 - 2003
Figure 3.10 above shows the 5 most common incident categories associated with mechanicalhandling equipment and operations. As can be seen, 4 of the 5 incident categories are attributed to human factors with 3 of these categories involving the operation of pedestal cranes.
All of the 5 most common incidents have seen slight improvements over the study period,which further backs up the fact that the mechanical handling group has seen a downward trend
in the number of incidents occurring each year.
To follow is a more detailed look at each incident category associated with mechanical handlingequipment. Detailed charts showing year-on-year incident numbers can be found in Appendices5 and 6.
Mechanical handling incidents – e quipment failure
MHE-EF1 – Pedestal Crane – Hoist Function
A total of 23 incidents have been attributed to failure of equipment associated with either themain or auxiliary hoist of pedestal cranes. Although only the fourth largest category within the
mechanical handling equipment failure group it has seen a sharp rising trend in the number of
27
8/6/2019 RR183 - Lifting Incident Review 1998-2003
http://slidepdf.com/reader/full/rr183-lifting-incident-review-1998-2003 35/93
incidents occurring each year and is now the most likely category of incident to occur withinthis group.
The results of equipment failure within the hoist system are:
•
Dropped Load 10 of 23 incidentsemergency system operator unable to prevent uncontrolled descent of load
• Loss of control 9 of 23 incidentsunplanned descent of load until arrested by operator or emergency system
• Loss of motion 2 of 23 incidentsoperator unable to hoist or lower load
• Equipment damage 2 of 23 incidentscontrol over load maintained by operator but part of hoist system damaged
Due to the lack of detailed description provided for these incidents it was impossible todetermine the root cause for all 23 incidents, all that is known is that part of the hoist systemfailed. Of the root causes that could be determined these include failure or slipping of the hoist
brake (4), hydraulic leak due to a burst hose or fitting (4) and failure of the hoist motor (1).
MHE-EF2 – Pedestal Crane – Boom Function
The overall trend of incidents within this category has been a slight increase, however the lasttwo years of the study have seen an improvement in the number of incidents occurring.
The results of equipment failure of the boom system are:• Uncontrolled rising of boom 6 of 18 incidents
• Dropped boom 5 of 18 incidents
• Boom motion opposite to control 2 of 18 incidents
• Dropped object 2 of 18 incidents
• Loss of control 2 of 18 incidentsunplanned descent of the boom until arrested by safety system or operator
• Equipment damage 1 of 18 incidents
In 5 of the 6 incidents where the boom continued to rise after the controls had been returned tothe neutral position, the boom was pulled into the backstops before the operator could apply theemergency stop and arrest the luffing motion. These incidents resulted in damage to the footsection of the boom. The description provided for these incidents was insufficient to identifythe reasons for their occurrence.
Of the incidents resulting in a dropped boom, 3 of the 5 incident were as a result of brake failure
and 1 incident occurred due to the winch drum shaft shearing. There was insufficientinformation to determine the cause of the final incident. On 2 occasions the boom was dropped over the side of the platform resulting in major damage to both the boom and the installation.
MHE-EF3 – Pedestal Crane – Slew Function
There was only 1 incident (0.1% of all lifting incidents) within this study that has beenattributed to a failure in the pedestal crane slew system. The cause of the incident was identified as a failure of a hydraulic fitting within the slew system and as a result of this the operator lostcontrol of the slew motion and had to use the emergency stop facility to avert the boomcontacting the drilling derrick.
28

8/6/2019 RR183 - Lifting Incident Review 1998-2003
http://slidepdf.com/reader/full/rr183-lifting-incident-review-1998-2003 36/93
MHE-EF4 – Pedestal Crane – Power Pack
As with Pedestal Crane – Slew Function, the number of incidents associated with failure of the power pack is very low, with only 3 incidents reported (0.3% of all lifting incidents).
In all 3 incidents equipment damaged occurred, either to the load or to the crane. The result of 1incident was an uncontrolled decent of the load until it landed on the deck of the vessel.
Due to the small number of incidents within this category and the fact that no two incidents had the same cause it was not possible to identify any significant trends.
MHE-EF5 – Pedestal Crane – Ancillary Equipment
This category has seen an increasing trend over the study period and by the final year is the third most likely incident to occur within the mechanical handling equipment failure group. Of the16 incidents, 14 resulted in a dropped object (87%), these objects were found to be various
fitting mounted to the crane, such as floodlights, cable trays and mounting bolts / pins. It wasnot possible to identify whether these incidents occurred as a direct result of performing a liftwith the crane or due to general wear and tear of the different components.
MHE-EF6 – Pedestal Crane – Accessories
Over the study period the general trend of incidents has been downward, alt hough the final year has seen as slight increase in incident frequency. The most common failure (5 of the 13incidents) was found to be the crane hook, on every occasion the sling or pennant slipped out of the hook when the line was slackened after landing the load even though a safety catch wasfitted. On investigation of the hooks, no obvious defects could be determined.
In 4 incidents, part of the main block (3) or overhaul ball (1) sheared off and resulted in adropped object. On three occasions the object fell on to the deck, luckily there were no personnel in the vicinity at the time.
MHE-EF7 – Other Lifting Appliance
This category covers all other power lifting appliances which are not classified as pedestalcranes. Given the wide range of equipment included in this category it is perhaps surprising thatthis is only the fourth largest category within the mechanical handling equipment failure group.However, due to the increasing trend (as a percentage of lifting incidents) this category was thesecond most likely to occur within the equipment failure group by the end of the study.
The types of lifting appliances were as follows:• Overhead gantry crane 10 of 21 incidents (48%)
• Pneumatic winch 6 of 21 incidents (28%)
• ROV handling crane 4 of 21 incidents (19%)
• Pipe handling crane 1 of 21 incidents (5%)
In 10 of the 21 incidents the result was a dropped load. On 7 of these occasions the operator was unable to arrest the descent of the load before it either contacted the deck or landed in thesea.
29

8/6/2019 RR183 - Lifting Incident Review 1998-2003
http://slidepdf.com/reader/full/rr183-lifting-incident-review-1998-2003 37/93
MHE-EF8 – Manual Lifting Equipment
The largest category within the mechanical handling equipment – equipment failure groupaccounting for 31 of the 152 incidents (20%). However since a high in 1999/00 a downward trend in incidents has occurred. This category is the only equipment failure category within the5 most common mechanical handling incidents.
The types of manual lifting equipment that failed were:
• Chain hoist / block 23 of 31 incidents (74%)
• Lever hoist 6 of 31 incidents (20%)
• Manual winch 1 of 31 incidents (3%)
• Other 1 of 31 incidents (3%)
The fact that this is the largest equipment failure group is quite alarming given the fairlyrigorous periodic examinations carried out on portable lifting equipment. Therefore it seemslikely that a degree of equipment abuse or negligence would be at the centre of the failures. If
this is the case a large portion of these incidents could be reassigned to be attributed to humanfactors.
It was not possible to further investigate the root cause of these incidents as the details provided did not include the findings of any post failure investigation / examination of the equipment. Itwould now be very difficult and time consuming, if not impossible to trace these incidents back to the duty holders and review any of these investigations.
MHE-EF9 – Lifting Accessories
This is the second largest category within the mechanical handling equipment failure group,however this category includes a wide range of lifting equipment. Lifting accessories were
taken as all items connecting the load to the lifting equipment, as defined in the LiftingOperations and Lifting Equipment Regulations (LOLER) 1998, SI 2307.
The failure of an accessory generally led to a dropped or unbalanced load (19 of 26 incidents).On a further 5 incidents the accessory failed before the load had been lifted off the deck.
The most common accessories that were found to have failed during the study were slings /sling sets, both wire rope (11) and webbing straps (2).
Due to the detail of the information provided it was not possible to determine whether theseitems failed due to defective manufacture or due to being subjected to an overload.
30

8/6/2019 RR183 - Lifting Incident Review 1998-2003
http://slidepdf.com/reader/full/rr183-lifting-incident-review-1998-2003 38/93
Mechanical handling incidents – human factors
MHE-HF1 – Pedestal Crane – Platform Lifts (Operator Error)
The use of pedestal cranes on offshore installations is the primary method of performing liftingoperations outside the drill floor and account for 37% of all lifting incidents.
All 36 incidents within this category occurred during lifting operations onboard an offshoreinstallation in which the incidents are attributed as having operator error as the root cause.
The results of these incidents were as follows:
• Dropped Object 15 of 36 incidents
• Dropped load 10 of 36 incidents
• Equipment damage 7 of 36 incidents
• Injured personnel 4 of 36 incidents
Of the incidents resulting in a dropped object, this occurred on 9 occasions due to the load contacting an item of plant or a section of the installation and subsequently the damaged piecefalling to the deck.
Injury to personnel has occurred where the operator has been unaware of the injured party’slocation until it was too late to avoid striking them with either the load or the hook. On 3occasions the injured party was not part of the crew undertaking the lifting operation.
MHE-HF2 – Pedestal Crane – Sea Lifts (Operator Error)
This category has seen a steady decline in the incident frequency over the study period, althoughthere is a slight blip during 2000/01.
Again in all 40 incidents the root cause has been attributed to the operator.
The results of the incidents are:
• Equipment damage 13 of 40 incidents
• Dropped load 11 of 40 incidents
• Dropped object 10 of 40 incidents
• Sling shedding 3 of 40 incidents
• Injured personnel 2 of 40 incidents
• Loss of control 1 of 40 incidents
There is always an increased risk when performing lifting operations to or from a sea goingvessel due to the vessels motion as it rolls with the waves. 24 of the 40 incidents wereattributed to the operator misjudging the roll of the vessel. On 18 occasions this resulted in theload being snagged on part of the vessel as it heaved on a wave inducing an overload situation.The resulting overload lead to, dropped load (6), broken leg of sling set (8) and damage to thevessel (4). The remaining 7 incidents were the operator misjudge the vessel motion resulted in2 dropped loads (where the container was tipped and the contents spilled across the deck), 2 personal injuries, 1 occasion of equipment damage (container landed too hard on deck) and 1incident where the operator lost control of the load and it was dragged down the length of thevessels deck.
There were 8 incidents where the operator allowed the load to contact either the vessel or
another item of cargo which resulted in a dropped object due to the damage sustained.
31

8/6/2019 RR183 - Lifting Incident Review 1998-2003
http://slidepdf.com/reader/full/rr183-lifting-incident-review-1998-2003 39/93
In 2 of the 3 incidents resulting in sling shedding, a pennant was left attached to the main linewhist the operator proceeded to use the whipline to perform a lift. During this operation the pennant detached itself from the main block and fell to the deck of the vessel below. Theremaining incident occurred when the operator accidentally lowered the hook block into the sea,resulting in the pennant slipping out of the hook.
MHE-HF3 – Installation – Pedestal Crane Operation
Undoubtedly the largest category from both mechanical and drilling handling groups with 128incidents (14.8% of all lifting incidents, 27.3% of mechanical handling incidents and 40.4% of mechanical handling human factor incidents).
The root causes of the incidents were found to be:
• Positioning 64 of 128 incidents (50%)
• Banking 20 of 128 incidents (16%)
• Slinging 17 of 128 incidents (13%)
• Procedures 15 of 128 incidents (12%)• Packing 12 of 128 incidents (9%)
In all 64 incidents where the positioning of the deck crew was deemed to be the root cause of the incident, personal injury occurred. As with the drilling pipe handling incidents attributed tohuman factor, the deck crew seem to have a lack of awareness of both inertia and momentum of a load being lifted by a pedestal crane. On many occasions the injury occurred when a member of the deck crew attempted to arrest or guide a swinging or spinning load manually, even if theload weighed several tonnes.
There were another 13 incidents that resulted in personal injury, giving a total of 77 (60%)incidents within this category. Of these 4 occurred as a result inadequate slinging of the load
causing it to either drop to the deck or to swing violently and strike the injured party. Another 3were attributed to banking, where during a blind lift the load contacted part of the platform and rebounded into the injured party. The remaining 6 incidents were attributed to poor proceduresduring the lifting operation, usually involving a lack of communication between all the involved personnel or a lack of pre task planning. Of the incidents attributed to inadequate slinging of the load, all but one resulted in a dropped load.
MHE-HF4 – Marine – Pedestal Crane Operations
This category is similar to the above but relates to lifting operations to and from a sea goingvessel, where the human factor was attributed to the vessel crew. The root causes identified aresimilar to those for MHE-HF3
The root causes of the incidents were attributed to:
• Inadequate packing 11 of 29 incidents
• Positioning 7 of 29 incidents
• Slinging 6 of 29 incidents
• Banking 3 of 29 incidents
• Procedures 2 of 29 incidents
As shown above the largest cause of incidents was due to inadequate packing of the cargo,causing various dropped objects as the load was lifted up to the installation. Although thevessel crew would not have originally packed the cargo, it is the responsibility if the vessel
captain to reject all cargo that is not packed both safely and securely.
32

8/6/2019 RR183 - Lifting Incident Review 1998-2003
http://slidepdf.com/reader/full/rr183-lifting-incident-review-1998-2003 40/93
All the inc idents caused by poor positioning resulted in personal injury, usually caused by theinjured party becoming trapped between the load on part of the vessel or another item of stowed cargo. This is not unexpected given the motion of the vessel and the congested nature of thedeck.
The incident frequency trend has remained steady throughout the study period with a maximumnumber of 7 incidents being reported in one year.
MHE-HF5 – Other Lifting Equipment – Powered
The second smallest category within the mechanical handling – human factor group with 17incidents (5% of mechanical handling-human factor) over the study period. The incident trend has been steadily downwards, and in the final year of the study no incidents had been attributed to this category.
The types of lifting equipment within this category are:
• Overhead gantry crane 6 of 17 incidents• Pneumatic winch 6 of 17 incidents
• ROV handling crane 2 of 17 incidents
• Lifting davit 1 of 17 incidents
• Telescopic mast 1 of 17 incidents
• Helicopter lift 1 of 17 incidents
The most common cause identified was operator error (8 incidents). Half of these incidentswere as a result of the lifting equipment being either operated prematurely or by accident. Thiswas particularly concerning as it put the rest of the deck crew at risk as they were either attaching the load or had not retreated to a safe position. The remaining half of these incidentswere due to the careless actions of the operator, where the lifting equipment was operated erratically, causing the load to swing uncontrollably.
The incidents identified as being caused by poor positioning of the deck crew were as a result of a lack of awareness of how the load was expected to move or how the equipment was to beoperated.
MHE-HF6 – Other Lifting Equipment – Manual
Although the incident frequency trend has been downwards this is still second largest categorywithin the mechanical handling-human factor group with 52 incidents reported.
The types of lifting equipment noted were:• Chain hoist / block 24 of 52 incidents
• Lever hoist 7 of 52 incidents
• Wire rope hoist (‘Tirfor’) 3 of 52 incidents
• Beam trolley 2 of 52 incidents
• Other 16 of 52 incidents
26 of the 52 incidents (50%) resulted in personal injury, this was usually caused when theinjured party attempted to manoeuvre the load whilst it was suspended on the lifting equipmenttrapping part of their body as the load shifted.
33

8/6/2019 RR183 - Lifting Incident Review 1998-2003
http://slidepdf.com/reader/full/rr183-lifting-incident-review-1998-2003 41/93
There were 23 incidents attributed to operator error, which included improper use of equipment,including the use of damaged or uncertified equipment (13), allowing the load to snag duringhoisting (5) and the use of inadequate rigging (5).
MHE-HF7 – Pedestal Crane Maintenance
The smallest category within the mechanical handling, human factor group with 15 reported incidents during the study period, this is the only category that has shown a noteworthy increasein incident frequency, mainly due to a peak in the final year of the study.
The results of incidents attributed to maintenance of pedestal cranes were:
• Dropped object 10 of 15 incidents (67%)
• Injured personnel 2 of 15 incidents (12%)
• Dropped load 1 of 15 incidents (7%)
• Dropped boom 1 of 15 incidents (7%)
• Equipment damage 1 of 15 incidents (7%)
On 8 occasions the incident occurred during the maintenance activity as a result of carelessaction of the members of the maintenance team. The majority of these (5 incidents) resulted ina dropped object, usually due to the item of equipment being inspected / replace not beingsecured properly during its removal.
There were 3 incidents that occurred as a result of incorrect or inadequate maintenance activitieswhere any item of equipment was either modified incorrectly or replaced with an incompatibleitem.
34

8/6/2019 RR183 - Lifting Incident Review 1998-2003
http://slidepdf.com/reader/full/rr183-lifting-incident-review-1998-2003 42/93
4. DISCUSSION
In this section of the report, each of the four main groups of incidents, drilling and mechanical
handling, equipment failure and human factors, will be considered in more detail.
handling equipment 1998-2003
total incidents reported
MHE-human
factors
40%
DHE-equipment
failure
17%
DHE-human
factors
24%
MHE-equipment
failure
19%
DHE-equipment failure DHE-human factors
MHE-equipment failure MHE-human factors
Figure 4.1
The 4 main incident groups – 1998 to 2003
Figure 4.1 clearly shows that mechanical handling operation account for the largest proportion(3 in every 5 incidents, 59%) of lifting incidents reported, with those attributed to human factorscontributing the largest proportion. In addition the percentage split for equipment failureincidents is practically the same for both groups.
4.1 DRILLING HANDLING EQUIPMENT – EQUIPMENT FAILURE
Equipment failure for drilling handling equipment is the smallest of the four groups with only17% of all lifting incidents reported. However this group has shown an increasing trend over the study period and by the end of the study it has almost passed mechanical handling
equipment failures in terms of incident frequency. Although the final year of the study hasshown a reduction in the number of incidents reported.
The category reporting the most incidents within this group was that attributed to wirelineoperations, this accounted for approximately one quarter of all incidents within the drillinghandling equipment failure group, which is 1 in every 4 equipment failure incidents reported within the drilling floor. It has also shown the most dramatic rise in incident frequency trend over this study. However as mentioned earlier, the details provided for many of these incidentswere not sufficient to determine any root cause for the failure of the wire. If these incidentswere further investigated (depending on information available) it is possible that some incidentscould have a degree of human factor contributing to the failure.
35

8/6/2019 RR183 - Lifting Incident Review 1998-2003
http://slidepdf.com/reader/full/rr183-lifting-incident-review-1998-2003 43/93
The second largest category within this group was the pipe handling system. This category hasseen a steady increase in incident frequency, which could be attributed to the increasingmechanisation of this process, although this does suggest that greater control measures areneeded to try and reverse this trend. A large proportion of incidents involved parts of themechanical pipe racking system breaking and falling from the derrick. It is uncertain whether these can be attributed to the design of the equipment or to the levels of maintenance currently practiced by the drill crew.
The hoisting system was only the third largest category, and it is worth noting the extensiveamount of equipment covered by this category and the fact that during drilling operations theseare probably the most used pieces of equipment, however the trend is for a rise in incidents over the study period.
4.2 DRILLING HANDLING EQUIPMENT – HUMAN FACTOR
The largest category within this group is that attributed to the use of winches, accounts for 28%
of incidents. However the incident trend is downwards during the study. The most commoncause of the winch related incidents was deemed to be due to operator error, most notableallowing the load, empty hook or winch wire to foul on various pieces of equipment on either the drill floor or up in the derrick. This usually resulted in a dropped object, which given theconfined space of the drill floor heightens the risk of members of the drill crew being injured byfalling objects. More alarming though are the incidents occurring during manriding operation,where on several occasion there appears to be a lack of communication between the winchoperator and the derrickhand undertaking the manriding task. The operator, for whatever reasondoes not verify that the derrickhand is ready to be hoisted and that it is safe to proceed beforeoperating the winch. Most commonly the derrickhand is pulled into various parts of the derrick,i.e. monkey board, sustaining an injury in the process. Due to the height above the drill floor of some of these operations and the noisy atmosphere verbal communication between the two
parties is difficult, however since the person in the riding belt has very little control over thewinch, if any, their safety is entirely in the hands of the winch operator.
The second largest category within this group was pipe handling, and as mentioned earlier inSection 3.2 the increasing trend in incidents in this category has made it the most likely drillingrelated incident to occur by the end of the study. This increasing trend is alarming given theincreasing mechanisation of this process due to the introduction of mechanical pipe rackingsystems, which should reduce some of the physical operations previously required by membersof the drill crew. Removing some of the human factors involved in handling the drill pipe /collar within the drill floor , and hence exposure to risk, has not led to a decrease in the number of incidents attributed to this category, as now the second largest cause of incidents is due tooperator error when working the various pipe handling equipment. Even with the introduction
of these mechanical aids, there are still a high proportion of incidents attributed to the carelessaction of members of the drill crew, where they have positioned themselves or part of their bodyin a dangerous situation and become trapped as the pipe /collar is manoeuvred into position.The incident text shows there to be a lack of awareness by the derrickhands of the momentum of the pipe / collar when being handle d.
36

8/6/2019 RR183 - Lifting Incident Review 1998-2003
http://slidepdf.com/reader/full/rr183-lifting-incident-review-1998-2003 44/93
Table 4.1
Root cause of drilling handling - human factor incidents
Root cause 98/99 99/00 00/01 01/02 02/03 Total
Operator error 16 22 24 17 15 94
Positioning 21 5 5 8 9 48
Procedures 5 5 7 3 5 25
Rigging 1 2 3 3 3 12
Banking 3 0 0 1 2 6
Maintenance 1 3 0 0 0 4
TOTAL 47 37 39 32 34 189
The root causes of the incidents within this group are shown in Table 4.1, and as can clearly been seen operator error is by far the most common cause with twice as many incidents as anyother.
A year-on-year graph for the root causes for all drilling handling equipment – human factors can be found in Appendix 7.
4.3 MECHANICAL HANDLING EQUIPMENT – EQUIPMENT FAILURE
The mechanical handling equipment – equipment failure is the second smallest group with 19%of all lifting incidents reported. The largest category was the failure of manual liftingequipment (31 incidents), such as chain and lever hoists, although this was one of only 4categories (this having the maximum) that showed a decreasing incident trend over the study period. As mentioned earlier the fact that this is the largest equipment failure category withinthis group is rather alarming given the rigorous periodic examinations carried out on portable
lifting gear. Also, it is common practice to colour code the portable lifting gear making it easyto identify whether the equipment is still in current certification. Therefore, given all thesecontrol measures there could be a certain degree of negligence or equipment abuse, duringoperation or maintenance, contributing to some these failures. This could also be true for thelifting accessories (i.e. shackles, slings, etc) as this was the second largest category but it is alsosubject to the same control measures the portable lifting equipment (colour coding and periodicexamination).
The primary item of lifting equipment used offshore is the pedestal crane, and 6 of the 9categories within this group are dedicated to failure of various items of equipment / systems onthe pedestal crane. Combining all the pedestal crane equipment failure incidents it was found that they account for 49% of all incidents within this group.
37

8/6/2019 RR183 - Lifting Incident Review 1998-2003
http://slidepdf.com/reader/full/rr183-lifting-incident-review-1998-2003 45/93
mhe-equipment failure
pedestal crane
0
5
10
15
20
25
98-99 99-00 00-01 01-02 02-03
n u m b e r o f i n c i d e n t s
0.0
20.0
40.0
60.0
80.0
100.0
% o
f m h e - e f i n c i d e n t s d u r i n g
y e a r
ef-ped crane % of mhe-ef
Figure 4.2Mechanical handling incidents – equipment failure
Pedestal crane incidents – 1998 to 2003
Overall the trend has been increasing for pedestal crane equipment failure incidents, with only
the power pack and accessory categories showing a decreasing trend.
4.4 MECHANICAL HANDLING EQUIPMENT – HUMAN FACTORS
The mechanical handling equipment – human factors is the largest group within the studyaccounting for 317 incidents (40% of all lifting incidents), which is more than all the equipmentfailure incidents and nearly twice as many incidents as the drilling handling human factor group.However this is the only group that has shown a decreasing trend over the study period.
By far and away the largest category within this group is that attributed to installation lifts pedestal crane operations where the root cause was attributed to the deck crew, accounting for 41% of incidents. Over half of the incidents (77 of 128) resulted in some form of personal
injury, most commonly due to the poor positioning of the injured party during the liftingoperation. Combining this category with that where the deck crew of the associated sea goingvessel where deemed to be the root cause, we find that these two categories alone account for 50% of incident within this group.
Overall, 248 of the 317 incidents (78%) within this group involved the operation of pedestalcranes, and as mentioned earlier they are the primary item of lifting equipment used offshore.Of these incidents only 76 where attributed to the crane operator, the majority, 157 incidentswere attributed to third-parties (i.e. the deck crew) and the remaining 15 incidents attributed tomaintenance activities. Figure 4.3 shows the incident frequency trends for these three rootcauses, as a percentage of all pedestal crane incidents attributed to human factors:
38

8/6/2019 RR183 - Lifting Incident Review 1998-2003
http://slidepdf.com/reader/full/rr183-lifting-incident-review-1998-2003 46/93
pedestal crane incidents - human factor 1998-2003
0.0
10.0
20.0
30.0
40.0
50.0
60.0
70.0
80.0
98-99 99-00 00-01 01-02 02-03 %
o f a l l p e d e s t a l c r a n e - h u m a n f a
c t o r
i n c i d e n t s
pedestal crane-operator error pedestal crane-maintenance
pedestal crane-3rd party
Figure 4.3
Mechanical handling equipmentPedestal crane incidents – human factors (best fit lines) – 1998 – 2003
As figure 4.3 shows, incidents attributed to poor or lack of maintenance is the only root causedemonstrating a rising trend over the study. This rising trend is primarily due to the increase inincidents occurring in the final year of the study.
3
3
The incidents attributed to operator error and 3rd
party personnel account for 94% of the pedestal crane human factor incidents, since generally the cranes are undertaking substantiallymore lifting operations compared to the number of maintenance activities carried out (half of allmaintenance incidents occur during maintenance activities). The trends for operator error and
rd party incidents have shown a reduction over the study period, however despite the level of
training that these groups of personnel are exposed to, i.e. crane operator training (basic principals through to full offshore lifting operations), slinging and banking, rigging and liftingand handling courses, there is still a considerable amount of incident occurring due to carelessaction or lack of forward thinking. This is particularly evident within the incidents caused by
rd
party personnel where the largest single cause of incidents was deemed to be due to the poor positioning of a member of the deck crew or the position of part of their body (i.e. hand, arm,foot, etc), and always resulting in personal injury. Most commonly this involved the injured party trying to guide the load into position as it was landed on the deck or guiding it out of atight space. During this operation, the injured party would inadvertently place a part of their body in a poor position, resulting in them becoming trapped as the load shifted. It isunderstandable for the deck crew to try and manually guide a small load into position with their hands but this is also occurring when lifting loads of several tonnes, where no amount of physical effort could control the swinging motion.
These actions by the deck crew are not just limited to pedestal crane operations, as it was alsofound to be a common occurrence in both the powered and manually lifting appliance
39

8/6/2019 RR183 - Lifting Incident Review 1998-2003
http://slidepdf.com/reader/full/rr183-lifting-incident-review-1998-2003 47/93
categories. The identifiable root causes of the mechanical handling human factor incidents (311of 317) are shown in Table 4.2.
Table 4.2
Root cause of mechanical handling - human factor incidents
Root cause 98/99 99/00 00/01 01/02 02/03 Total
Operator error 31 21 25 19 13 109
Positioning 31 22 13 21 7 94
Banking 7 4 5 5 4 25
Slinging 4 6 6 5 3 24
Packing 4 3 3 6 7 23
Procedures 4 3 3 7 4 21
Maintenance 3 3 1 2 6 15
TOTAL 84 62 56 65 44 311
As can be seen from Table 4.2, the poor positioning of members of the deck crew is a major factor in the number of incidents occurring each year. It is not until the final year of the studythat the incidents attributed to poor positioning has reduced down to a level similar to the rest of the root causes. Whilst operator error was identified as the largest root cause of incidents withinthis group it is worth noting that all the incidents in categories MHE-HF1 and MHE-HF2 wereclassified as caused by operator error, with the 6 remaining causes split between the other 5incident categories.
Year-on-year graphs for the root causes for pedestal crane incidents attributed to 3rd
party error and all mechanical handling equipment – human factor incidents can be found in Appendix 8.
40

8/6/2019 RR183 - Lifting Incident Review 1998-2003
http://slidepdf.com/reader/full/rr183-lifting-incident-review-1998-2003 48/93
5. JOINT INDUSTRY AND HSE SAFETY INITIATIVES
Having undertaken a review of all HSE OSD lifting incidents the second element of the Scope
of Work was to identify the key industry safety initiatives that have been introduced since theend of phase 1 of this study and to determine if these initiative have had an effect on the number of lifting incidents occurring in the North Sea Oil and Gas industry.
The main safety initiatives that have been introduced across the entire UKCS Oil and Gasindustry are Step Change in Safety, Lifting Operations and Lifting Equipment Regulations
LOLER (L113), Provision and Use of Work Equipment Regulations PUWER (L22),Technical Guidance on the Safe Use of Lifting Equipment Offshore (HSG221), and Codeof Practice for the Safe Use of Lifting Equipment (LEEA). In conjunction with these, theHSE OSD also release various safety notices relating to specific equipment or operations and the numerous operators and drilling contractors run their own safety initiatives, such as STOPand TOFS (Time Out For Safety) on their different installations.
5.1 SAFETY INITIATIVE BACKGROUND
Step Change in Safety
Step Change was launched in September 1997 to improve the safety performance, awarenessand behaviours throughout the UKCS Oil and Gas industry. Step Change in Safety was set-upas a non-profit organisation with the support of several Trade Associations across the industrywith the aim to unite all the various sectors (i.e. employees, service companies, operators, tradeunions, regulators and representative bodies) and work together to improve safety through thesharing of information, good practices and common safety goals. This was undertaken by thecreation of cross-industry task groups set-up to address priority issues.
Lifting Operations and Lifting Equipment Regulations, LOLER (L113)
The Lifting Operations and Lifting Equipment Regulations , LOLER (L113) was issued by theHSE and came into force in December 1998. The regulations are a single statutory instrumentto cover all lifting or lowering operations undertaken in the workplace and are set out inconjunction with approved code of practice and guidance material. LOLER applies to all areacovered by the Health and Safety at Work Act and covers all lifting operations and liftingequipment (existing and new).
Provision and Use of Work Equipment Regulations, PUWER (L22)
The Provision and Use of Work Equipment Regulations, PUWER (L22) was issued by the HSEand came in to force in December 1998, superseding the first edition ‘Work Equipment.
Provision and Use of Work Equipment Regulation 1992’. Similar to LOLER, the regulationsare a single statutory instrument to cover the work equipment and machinery used everyday inworkplaces and are set out in conjunction with approved code of practice and guidance material.PUWER applies to all areas covered by the Health and Safety at Work Act.
Technical Guidance on the Safe Use of Lifting Equipment Offshore (HSG221)
The Technical Guidance on the Safe Use of Lifting Equipment Offshore (HSG221) documentwas issued by the HSE in January 2002. The guidance document sets out to provide technical
information for those involved in the supply, operation and control of lifting equipment offshore
41
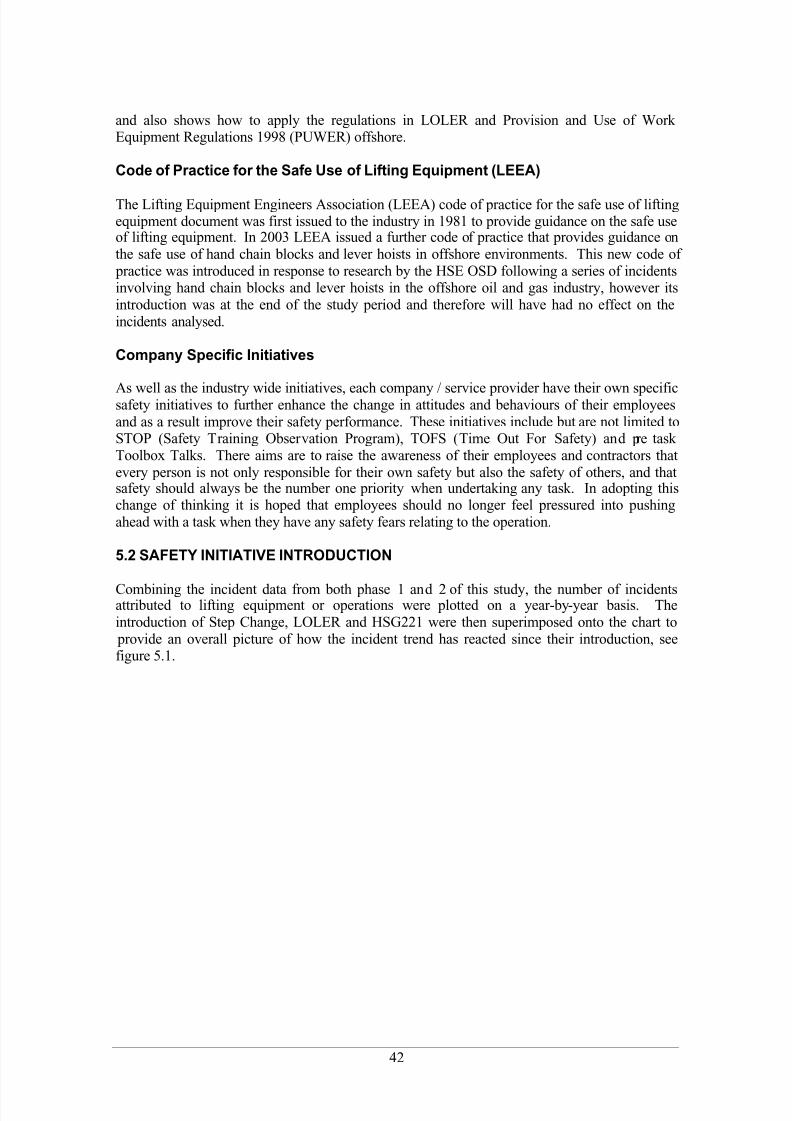
8/6/2019 RR183 - Lifting Incident Review 1998-2003
http://slidepdf.com/reader/full/rr183-lifting-incident-review-1998-2003 49/93
and also shows how to apply the regulations in LOLER and Provision and Use of Work Equipment Regulations 1998 (PUWER) offshore.
Code of Practice for the Safe Use of Lifting Equipment (LEEA)
The Lifting Equipment Engineers Association (LEEA) code of practice for the safe use of liftingequipment document was first issued to the industry in 1981 to provide guidance on the safe useof lifting equipment. In 2003 LEEA issued a further code of practice that provides guidance onthe safe use of hand chain blocks and lever hoists in offshore environments. This new code of practice was introduced in response to research by the HSE OSD following a series of incidentsinvolving hand chain blocks and lever hoists in the offshore oil and gas industry, however itsintroduction was at the end of the study period and therefore will have had no effect on theincidents analysed.
Company Specific Initiatives
As well as the industry wide initiatives, each company / service provider have their own specificsafety initiatives to further enhance the change in attitudes and behaviours of their employeesand as a result improve their safety performance. These initiatives include but are not limited toSTOP (Safety Training Observation Program), TOFS (Time Out For Safety) and pre task Toolbox Talks. There aims are to raise the awareness of their employees and contractors thatevery person is not only responsible for their own safety but also the safety of others, and thatsafety should always be the number one priority when undertaking any task. In adopting thischange of thinking it is hoped that employees should no longer feel pressured into pushingahead with a task when they have any safety fears relating to the operation.
5.2 SAFETY INITIATIVE INTRODUCTION
Combining the incident data from both phase 1 and 2 of this study, the number of incidentsattributed to lifting equipment or operations were plotted on a year-by-year basis. Theintroduction of Step Change, LOLER and HSG221 were then superimposed onto the chart to provide an overall picture of how the incident trend has reacted since their introduction, seefigure 5.1.
42

8/6/2019 RR183 - Lifting Incident Review 1998-2003
http://slidepdf.com/reader/full/rr183-lifting-incident-review-1998-2003 50/93
Lifting Incidents 1991-2003
0
50
100
150
200
250
N u m b e r o f I n c i d e n t s R e p o r t e d
0.0
5.0
10.0
15.0
20.0
25.0
% L
i f t i n g f r o m T
o t a l
incidents
% of total
LOLER S tep C hange HSG2 2 1
9 1 - 9 2
9 2 - 9 3
9 3 - 9 4
9 4 - 9 5
9 5 - 9 6
9 6 - 9 7
9 7 - 9 8
9 8 - 9 9
9 9 - 0 0
0 0 - 0 1
0 1 - 0 2
0 2 - 0 3
Figure 5.1
Lifting incidents reported – 1991-2003
As can be seen from Figure 5.1 above, the lifting incident trend during phase 1 was showing asteady reduction up to the final year of the of that phase, at which point the incidents have takena sharp rise until 1999 where upon the trend has once again decreased. This rise, in the middleof the two phases of the study coincides with the introduction of Step Change in Safety, whilstthis might at first seem quite alarming, it is worth taking time to remember what this safety
initiative sets out to do. As well as the overall aim of improving the safety levels and as a resultreducing the number of incident occurring, this initiative also encourages a change in attitudeand behaviour towards safety and positively encourages the highlighting of potentiallydangerous activities and the reporting of all incident and near misses even when there was norisk of personnel injury, damage to plant or equipment or harmful to the environment.Therefore even though the number of reported incidents started to rise it does not necessarilymean that the industry suddenly became more unsafe. Splitting the lifting incidents betweenthose resulting in personal injury and those that did not produces the trends as shown in Figure5.2.
43

8/6/2019 RR183 - Lifting Incident Review 1998-2003
http://slidepdf.com/reader/full/rr183-lifting-incident-review-1998-2003 51/93
Lifting incidents 1995-2003
non injury/injury split
0
50
100
150
200
250
95-96 96-97 97-98 98-99 99-00 00-01 01-02 02-03
n u m b
e r o f i n c i d e n t r e p o r t e d
total lifting incidents non injury incidents injury incidents
Figure 5.2
Lifting incidents reported – non injury / injury split – 1995-2003
Figure 5.2 also contains incidents from 1995 to 1997 so as to show the trends before and after the introduction of LOLER at the end of 1998. This information has been taken from theincidents reviewed by OTO 2000 024. As Figure 5.2 shows, incidents resulting in both injuryand non-injury had started to rise around 1996/1997, however since LOLER has come intoeffect the number of incidents resulting in personal injury has started to drop and has continued to do so, apart from a slight blip in 2001 / 2002, down to a low of 23 incidents per year by theend of the study. This reduction has not been followed by non-injury incidents, as these havecontinued to increase up until the final year of the study where they have actually started todecrease. The start of this decline coincides with the introduction of HSG221, Technicalguidance on the safe use of lifting equipment offshore.
Since the introduction of LOLER in December 1998 the number of lifting incidents occurringhas started to drop again and by the end of the study they had almost returned to the low seen in1996 / 1997.
Also with the introduction of these safety initiatives, as with any new initiative / working practice, the industry would require a bit of time to adjust to the new working practices. Thiscan be seen in Figure 5.1 where the rising lifting incidents trend was reversed by 1999 / 2000and has continued to do so up to the end of the study.
44

8/6/2019 RR183 - Lifting Incident Review 1998-2003
http://slidepdf.com/reader/full/rr183-lifting-incident-review-1998-2003 52/93
6. CONCLUSIONS
Having completed the analysis of the HSE OSD incident data and having reviewed the key
industry safety initiatives and their effect on reducing the level of incidents occurring thefollowing conclusions have been reached:
6.1 DATA ANALYSIS
• Of the 4,624 reported incidents provided by the HSE OSD covering the period 1st
April1998 to 31
stMarch 2003 (phase two) for all oil and gas production and drilling operation
locations on the UKCS, 861 incidents were identified as occurring during operations wherelifting equipment was being used.
• The annual distribution of incidents is as shown in Figure 6.1 below:
HSE OSD Incidents 1998-2003
0
200
400
600
800
1000
1200
98-99 99-00 00-01 01-02 02-03
N u m b e r o f I n c
i d e n t s R e p o r t e d
0.0
5.0
10.0
15.0
20.0
25.0
% L
i f t i n g
f r o m T
o t a l
all incidents
lifting incidents
% of total
Figure 6.1
HSE OSD incidents reported – 1998 - 2003
• The proportion of incidents associated with lifting equipment rages from 16.7% to 20.3% of all lifting incidents reported and averages 18.6% over the study period.
• The average number of lifting incidents reported was 172 per year, with a maximum of 205in 1998/99 and steadily reducing to a minimum in 2002/03 of 140, apart from a slight rise in2001/02.
• 58.5% of lifting incidents took place during mechanical handling lifting operations.
• 41.5% of lifting incidents took place during drilling handling lifting operations.
45

8/6/2019 RR183 - Lifting Incident Review 1998-2003
http://slidepdf.com/reader/full/rr183-lifting-incident-review-1998-2003 53/93
• 59% of all lifting incidents had human factors as their root cause.
• 33.3% of all lifting incidents had equipment failure as their root cause.
•
7.7% of all lifting incidents could not be classified as having been caused by equipmentfailure or human factors.
• Incidents that took place during drilling handling operations show a sustained increasingtrend over the study period, rising from 40.2% of all lifting incidents during 1998/99 to43.1% in 2002/03.
• Incidents that took place during mechanical handling operations show a sustained decreasing trend over the study period, falling from 59.8% of all lifting incidents in1998/99 to 56.9% in 2002/03.
6.2 DRILLING HANDLING EQUIPMENT
• The main drilling handling equipment areas in which incidents occurred (60% of all drillingincidents) were the use of winches (77 of 357 incidents, 21.6%), pipe handling (72 of 357,20.2%) and the hoisting system (66 of 357, 18.5%).
• Rising trends in incident frequency were most apparent in wireline and pipe handlingcategories, both equipment failure and human factors. A rising trend was also apparent for incidents attributed to equipment failure of the hoisting system and the elevators.
• The largest cause of drilling handling incidents attributed to human factors was due tooperator error, accounting for 49.7% of all drilling handling human factor incidents and 26.3% of all drilling handling incidents.
6.3 MECHANICAL HANDLING EQUIPMENT
• The main mechanical handling equipment category in which incidents occurred (128 of 503incidents, 25.4%) was that attributed to being caused by the deck crew during liftingoperations with pedestal cranes.
• The largest cause of mechanical handling incidents attributed to human factors was due tooperator error, accounting for 34.3% of all mechanical handling human factor incidents and 21.6% of all mechanical handling incidents. However the majority of these incidents wereattributed to the crane operator (69.7%).
• Excluding incidents attributed to the crane operator the largest cause of human factor incidents within the mechanical handling equipment group was due to the poor positioningof members of the deck crew (both installation and sea going vessels), accounting for 29.6%of all mechanical handling human factor incidents.
• Failure of the pedestal crane hoist function showed the most dramatic in incident frequencywithin the mechanical handling equipment group, however this category still only accountsfor 2.6% of all lifting incidents.
46

8/6/2019 RR183 - Lifting Incident Review 1998-2003
http://slidepdf.com/reader/full/rr183-lifting-incident-review-1998-2003 54/93
6.4 PEDESTAL CRANES
• Incidents involving the use of pedestal cranes accounted for 37.4% of all lifting incidents.
•
The trend for pedestal crane incidents has reduced over the study period, however as a percentage of lifting incidents the trend has actually increased, meaning that the use of pedestal cranes account for a greater proportion of lifting incidents. This shows that thedecreasing trend has not been as great as the other incident categories.
• Incidents involving the use of pedestal cranes, where the crane operator was deemed to be atfault, have shown a steady decline over the study period and these account for 8.8% of alllifting incidents.
• Pedestal crane incidents where a person other than the crane operator was responsible haveshown a steady decline over the study period and these account for 18.2% of all liftingincidents.
6.5 SAFETY INITIATIVES
• Since the introduction of LOLER in December 1998, lifting incidents have shown areduction from 205 to 140 incidents per year (31.7%) by the end of the study.
47

8/6/2019 RR183 - Lifting Incident Review 1998-2003
http://slidepdf.com/reader/full/rr183-lifting-incident-review-1998-2003 55/93
7. RECOMMENDATIONS
The following recommendations can be drawn from the review of the lifting incidents occurring
in the UKCS Oil and Gas industry for the period 1
st
April 1998 to 31
st
March 2003:
7.1 TRAINING AND AWARENESS
• Improve the awareness of members of both the deck and drill crew into the inertia and momentum of suspended loads, no matter how light and small they may appear. These personnel should be made aware of the likely consequences of being struck or trapped byswinging loads and urged to show forward thinking toward the position that they should occupy during a lifting operation.
• Both deck and drill crew should be advised and trained into the proper and safest way of stopping a swinging load and made aware of the consequences of trying to restrain a load.
7.2 LIFTING OPERATIONS
• A culture of risk assessment and pre task toolbox talks when undertaking lifting operationsis well established in the UKCS Oil and Gas industry, however it is recommended that these pre task safety measures also make the personnel involved in the lifting operation aware of the procedures to be used and the lifting plan, as during the review it was noted that onseveral occasions personnel were caught unaware when the load was lifted or as it was being landed, in particular the anticipated location of where that the load was to be placed.
• It is recommended that communication between all parties involved in undertaking a liftingoperation be improved as there was evidence of members of the lifting team being unawareof another’s actions or position and as a result one or more of the personnel sustained aninjury. This should also include the level of communication possible between the pedestalcrane operator and both the deck crew of the installation and any supply vessels. This could be improved by the introduction of a direct radio link between the crane operator and theindividual controlling the lift on the deck or the vessel. Also fitting the crane with awarning horn and / or a PA system would allow the crane operator to attract the attention of personnel on the deck.
• The introduction of tighter control measures and improved training of personnel involved inman riding operations within the drilling package. This should particularly cover the
responsibility of the winch operator as they are directly responsible for the safety of the personnel in the riding belt. Communication between the two parties needs to be improved so that the winch operator is working at the command of the person in the riding belt and not at their own discretion.
7.3 REPORTING OF INCIDENTS
• There should be better reporting of lifting incidents at time of occurrence. It isrecommended that this includes greater details of the incident, including a brief summary of operation, personnel involved and the result of the incident. These details would greatlyhelp any further investigation into a specific incident and as a result identify the required actions to prevent a reoccurrence.
48

8/6/2019 RR183 - Lifting Incident Review 1998-2003
http://slidepdf.com/reader/full/rr183-lifting-incident-review-1998-2003 56/93
7.4 FURTHER INVESTIGATION
• During the study there has been a significant rise in the number of wireline equipmentfailure incidents particularly attributed to the parting of the wire. The information available
was not sufficient to determine the root cause of these failures and due to the fact that thishas now become the most common drilling handling equipment failure incident category itis recommended that further investigation in to future incidents is undertaken.
• Investigation in the increasing trend of pipe handlin g incidents attributed to human factorsgiven the increase mechanisation of this operation due to the introduction of mechanical pipe racking systems.
49

8/6/2019 RR183 - Lifting Incident Review 1998-2003
http://slidepdf.com/reader/full/rr183-lifting-incident-review-1998-2003 57/93
8. RECOMMENDED FUTURE WORK
The following recommended future work topics have been identified from the review of the
lifting incidents occurring in the UKCS Oil and Gas industry for the period 1st April 1998 to 31st
March 2003:
• Conduct a review of the current training programmes associated with lifting operations,including those conducted on the drill floor, in the UKCS, including both specialist trainingorganisations and company specific training schemes. The review should highlight anyimprovements that could be made to either existing training programmes or areas wherenew material could be introduced. The review should also examine the level of continuoustraining offered throughout an individual’s development.
• Investigate the existing control measures and procedures being used during lifting
operations on offshore installations. This investigation should particularly examine thelifting operations involving either a blind lift or man riding operations as these are two areasthat have been identified as containing a high proportion of incidents.
• Amend the HSE OIR 9 incident reporting form so that a greater level of detail can becontained on each form. In particular the OIR 9 form should include a section to note thedetails of the lifting equipment being used, for example:
- type of equipment
- manufacturer
- serial number of equipment - date of last inspection / test
These details would allow further investigation into specific categories of incidents, particularly those resulting from equipment failure. It would also provide scope to identifyany trends that may develop regarding a specific type or a manufactured batch of equipment.
• Carry out an assessment on the introduction of crane simulator training, assessing theimpact, if any on the incident trends. The assessment should also review the content and frequency of the training provided, and highlight any improvements that could be made toenhance the skills of the crane operators.
50

8/6/2019 RR183 - Lifting Incident Review 1998-2003
http://slidepdf.com/reader/full/rr183-lifting-incident-review-1998-2003 58/93
REFERENCES
1. Safe use lifting equipment ‘Lifting Operations and Lifting Equipment Regulations 1998’
(LOLER) Approved Code of Practice and Guidance L113 HSE Books 1998
2. Safe use of work equipment ‘Provision and Use of Work Equipment Regulation 1998(PUWER) Approved Code of Practice and Guidance L22 HSE Books 1998
3. Technical guidance on the safe use of lifting equipment offshore HSG221 HSE Books 2002
4. Code of practice for the safe use of lifting equipment , 1981 Lifting Equipment EngineersAssociation (LEEA)
5. Code of practice for the safe use of hand chain blocks and lever hoists in offshoreenvironments, 2003 Lifting Equipment Engineers Association (LEEA)
6. Lifting equipment project – phase 1 2000 HSE OTO 2000 024
7. ‘Heath & Safety Executive, web site – ‘http://www.hse.gov.uk’
8. ‘A Step Change in Safety’ web site – ‘http://step.steel-sci.org’
9. ‘International Association of Drilling Contractors (IADC)’ web site – ‘http://www.iadc.org
51

8/6/2019 RR183 - Lifting Incident Review 1998-2003
http://slidepdf.com/reader/full/rr183-lifting-incident-review-1998-2003 59/93
APPENDICES
52

8/6/2019 RR183 - Lifting Incident Review 1998-2003
http://slidepdf.com/reader/full/rr183-lifting-incident-review-1998-2003 60/93
APPENDIX 1 HSE OSD DATA FORMAT
53

8/6/2019 RR183 - Lifting Incident Review 1998-2003
http://slidepdf.com/reader/full/rr183-lifting-incident-review-1998-2003 61/93
54

8/6/2019 RR183 - Lifting Incident Review 1998-2003
http://slidepdf.com/reader/full/rr183-lifting-incident-review-1998-2003 62/93
APPENDIX 2 HIGH LEVEL DATA ANAL YSIS – DETAIL CHARTS
The following charts are in support of Section 3.1 High Level Analysis.
drilling handling equipment
incidents 1998-2003
0
20
40
60
80
100
120
98-99 99-00 00-01 01-02 02-03
n u m b e r o f i n c i d e n t s
0.0
10.0
20.0
30.0
40.0
50.0
60.0
70.0
% o
f t o t a l i n c i d e n t s d u r i n g y e a r
drilling % of total
Figure A2.1
Lifting incidents reported – drilling handling equipment – 1998 to 2003
55
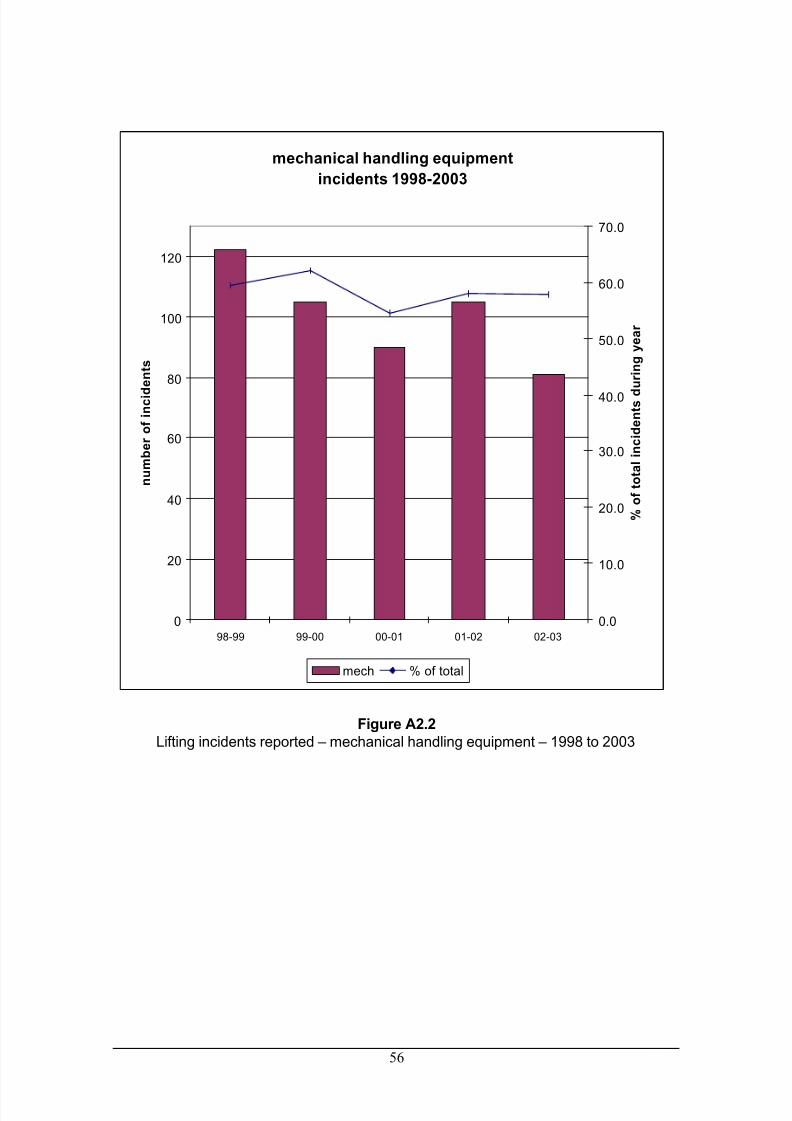
8/6/2019 RR183 - Lifting Incident Review 1998-2003
http://slidepdf.com/reader/full/rr183-lifting-incident-review-1998-2003 63/93
mechanical handling equipment
incidents 1998-2003
0
20
40
60
80
100
120
98-99 99-00 00-01 01-02 02-03
n u m b e r o f i n c i d
e n t s
0.0
10.0
20.0
30.0
40.0
50.0
60.0
70.0
% o
f t o t a l i n c i d e n t s d
u r i n g y e a r
mech % of total
Figure A2.2
Lifting incidents reported – mechanical handling equipment – 1998 to 2003
56

8/6/2019 RR183 - Lifting Incident Review 1998-2003
http://slidepdf.com/reader/full/rr183-lifting-incident-review-1998-2003 64/93
drilling handling equipment
equipment failure incidents 1998-2003
0
20
40
60
80
98-99 99-00 00-01 01-02 02-03
n u m b e r o f i n c i d e n t s
0.0
5.0
10.0
15.0
20.0
25.0
30.0
35.0
40.0
45.0
% o
f t o t a l i n c i d e n t s
d u r i n g y e a r
drilling % of total
Figure A2.3
Drilling handling incidents –equipment failure – 1998 to 2003
57

8/6/2019 RR183 - Lifting Incident Review 1998-2003
http://slidepdf.com/reader/full/rr183-lifting-incident-review-1998-2003 65/93
drilling handling equipment
human factor incidents 1998-2003
0
20
40
60
80
98-99 99-00 00-01 01-02 02-03
n u m b e r o f i n c i d
e n t s
0.0
5.0
10.0
15.0
20.0
25.0
30.0
35.0
40.0
45.0
% o
f t o t a l i n c i d e n t s d
u r i n g y e a r
drilling % of total
Figure A2.4
Drilling handling incidents –human factors – 1998 to 2003
58

8/6/2019 RR183 - Lifting Incident Review 1998-2003
http://slidepdf.com/reader/full/rr183-lifting-incident-review-1998-2003 66/93
mechanical handling equipment
equipment failure incidents 1998-2003
0
20
40
60
80
100
98-99 99-00 00-01 01-02 02-03
n u m b e r o f i n c i d
e n t s
0.0
5.0
10.0
15.0
20.0
25.0
30.0
35.0
40.0
45.0
% o
f t o t a l i n c i d e n t s d
u r i n g y e a r
mech % of total
Figure A2.5
Mechanical handling incidents –equipment failure – 1998 to 2003
59

8/6/2019 RR183 - Lifting Incident Review 1998-2003
http://slidepdf.com/reader/full/rr183-lifting-incident-review-1998-2003 67/93
mechanical handling equipment
human factor incidents 1998-2003
0
20
40
60
80
100
98-99 99-00 00-01 01-02 02-03
n u m b e r o f i n c i d
e n t s
0.0
5.0
10.0
15.0
20.0
25.0
30.0
35.0
40.0
45.0
% o
f t o t a l i n c i d e n t s d
u r i n g y e a r
mech % of total
Figure A2.6
Mechanical handling incidents –human factors – 1998 to 2003
60

8/6/2019 RR183 - Lifting Incident Review 1998-2003
http://slidepdf.com/reader/full/rr183-lifting-incident-review-1998-2003 68/93
APPENDIX 3 DETAILED ANALYSIS – DRILLING EQUIPMENT FAILURES
The following charts are in support of Section 3.2 Detailed Analysis of Data – DrillingEquipment.
drilling handling equipment
equipment failure trends 1998-2003
-1
0
1
2
3
4
5
6
98-99 99-00 00-01 01-02 02-03
% o
f a l l l i f t i n g i n c i d e n t s d u r i n g y e
a r
elevators Compensators winches
hoisting system wireline BOP
Pipe handling
Figure A3.1Drilling handling equipment – equipment failure trends – 1998 to 2003
61
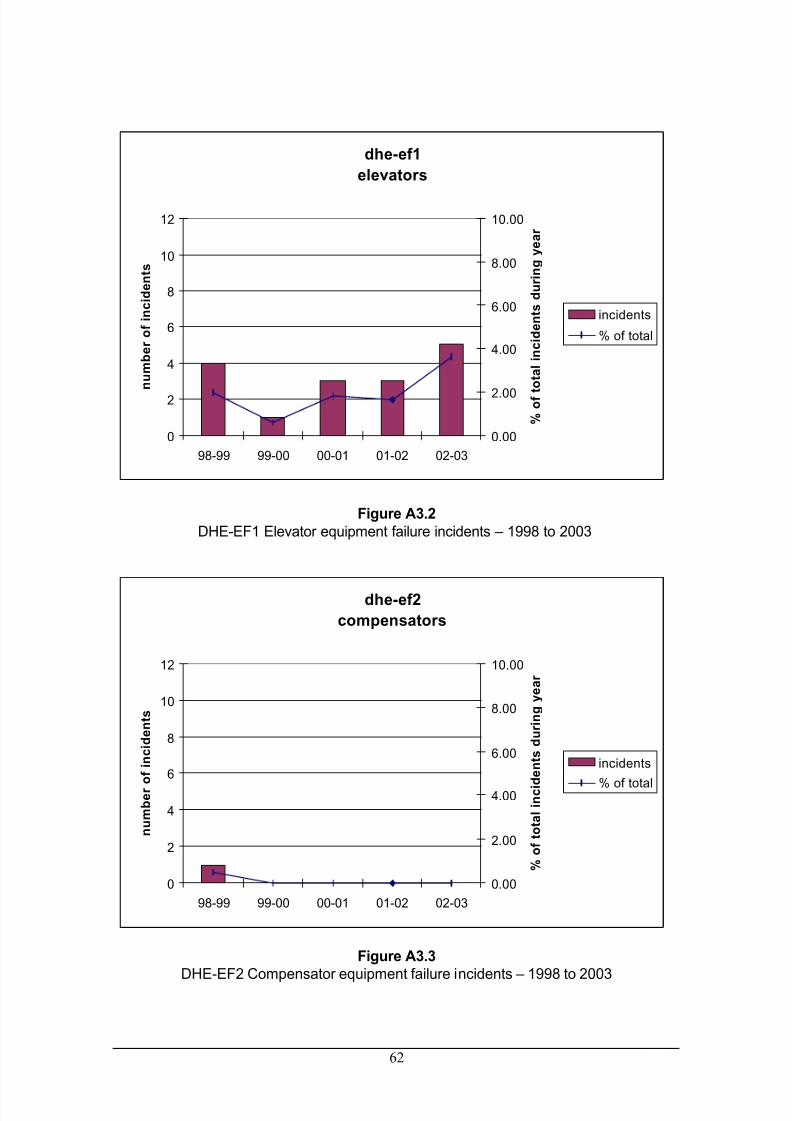
8/6/2019 RR183 - Lifting Incident Review 1998-2003
http://slidepdf.com/reader/full/rr183-lifting-incident-review-1998-2003 69/93
dhe-ef1
elevators
0
2
4
6
8
10
12
98-99 99-00 00-01 01-02 02-03
n u m b e r o f i n c i d e n t s
0.00
2.00
4.00
6.00
8.00
10.00
% o
f t o t a l i n c i d e n t s d u r i n g y e a r
incidents
% of total
Figure A3.2
DHE-EF1 Elevator equipment failure incidents – 1998 to 2003
dhe-ef2
compensators
0
2
4
6
8
10
12
98-99 99-00 00-01 01-02 02-03
n u m b e r o f i n c i d e n t s
0.00
2.00
4.00
6.00
8.00
10.00
% o
f t o t a l i n c i d e n t s d u r i n g y e a r
incidents
% of total
Figure A3.3
DHE-EF2 Compensator equipment failure incidents – 1998 to 2003
62

8/6/2019 RR183 - Lifting Incident Review 1998-2003
http://slidepdf.com/reader/full/rr183-lifting-incident-review-1998-2003 70/93
dhe-ef3
winch
0
2
4
6
8
10
12
98-99 99-00 00-01 01-02 02-03
n u m b e r o f i n c i d e n t s
0.00
2.00
4.00
6.00
8.00
10.00
% o
f t
o t a l i n c i d e n t s d u r i n g y e a r
incidents
% of total
Figure A3.4
DHE-EF3 Winch equipment failure incidents – 1998 to 2003
dhe-ef4
hoisting system
0
2
4
6
8
10
12
98-99 99-00 00-01 01-02 02-03
n u m b e r o
f i n c i d e n t s
0.00
2.00
4.00
6.00
8.00
10.00
% o
f t o t a l i n c i d
e n t s d u r i n g y e a r
incidents
% of total
Figure A3.5
DHE-EF4 Hoisting system equipment failure incidents – 1998 to 2003
63

8/6/2019 RR183 - Lifting Incident Review 1998-2003
http://slidepdf.com/reader/full/rr183-lifting-incident-review-1998-2003 71/93
dhe-ef5
wire lining
0
2
4
6
8
10
12
98-99 99-00 00-01 01-02 02-03
n u m b e r o f i n c i d e n t s
0.00
2.00
4.00
6.00
8.00
10.00
% o
f t
o t a l i n c i d e n t s d u r i n g y e a r
incidents
% of total
Figure A3.6
DHE-EF5 Wire lining equipment failure incidents – 1998 to 2003
dhe-ef6
blow-out preventer
0
2
4
6
8
10
12
98-99 99-00 00-01 01-02 02-03
n u m b e r o f i n c i d e n t s
0.00
2.00
4.00
6.00
8.00
10.00
% o
f t o t a l i n c i d
e n t s d u r i n g y e a r
incidents
% of total
Figure A3.7
DHE-EF6 Blow-out preventer handling equipment failure incidents – 1998 to 2003
64

8/6/2019 RR183 - Lifting Incident Review 1998-2003
http://slidepdf.com/reader/full/rr183-lifting-incident-review-1998-2003 72/93
dhe-ef7
pipe handling
0
2
4
6
8
10
12
98-99 99-00 00-01 01-02 02-03
n u m b e r o f i n c i d e n t s
0.00
2.00
4.00
6.00
8.00
10.00
% o
f t
o t a l i n c i d e n t s d u r i n g y e a r
incidents
% of total
Figure A3.8
DHE-EF7 Pipe handling equipment failure incidents – 1998 to 2003
65

8/6/2019 RR183 - Lifting Incident Review 1998-2003
http://slidepdf.com/reader/full/rr183-lifting-incident-review-1998-2003 73/93
APPENDIX 4 DETAILED ANALYSIS – DRILLING HUMAN FACTORS
The following charts are in support of Section 3.2 Detailed Analysis of Data – DrillingEquipment.
drilling handling equipment
human factor trends 1998-2003
0
1
2
3
4
5
6
7
8
98-99 99-00 00-01 01-02 02-03
% o
f a l l l i f t i n g i n c i d e n t s d u r i n g y
e a r
elevators Compensators winches
hoisting system wireline BOP
Pipe handling
Figure A4.1Drilling handling equipment – human factor trends – 1998 to 2003
66

8/6/2019 RR183 - Lifting Incident Review 1998-2003
http://slidepdf.com/reader/full/rr183-lifting-incident-review-1998-2003 74/93
dhe-hf1
elevators
0
5
10
15
20
25
98-99 99-00 00-01 01-02 02-03
n u m b e r o f i n c i d e n t s
0.00
2.00
4.00
6.00
8.00
10.00
12.00
14.00
16.00
% o
f t o t a l i n c i d e n t s d u r i n g y e a r
incidents
% of total
Figure A4.2
DHE-HF1 Elevator incidents – 1998 to 2003
dhe-hf2
compensators
0
5
10
15
20
25
98-99 99-00 00-01 01-02 02-03
n u m b e r o f i n c i d e n t s
0.00
2.00
4.00
6.00
8.00
10.00
12.00
14.00
16.00
% o
f t o t a l i n c i d e n t s d u r i n g y e a r
incidents
% of total
Figure A4.3
DHE-HF2 Compensator incidents – 1998 to 2003
67

8/6/2019 RR183 - Lifting Incident Review 1998-2003
http://slidepdf.com/reader/full/rr183-lifting-incident-review-1998-2003 75/93
dhe-hf3
winch
0
5
10
15
20
25
98-99 99-00 00-01 01-02 02-03
n u m b e r o f i n c i d e n t s
0.00
2.00
4.00
6.00
8.00
10.00
12.00
14.00
16.00
% o
f t
o t a l i n c i d e n t s d u r i n g y e a r
incidents
% of total
Figure A4.4
DHE-HF3 Winch incidents – 1998 to 2003
dhe-hf4
hoisting system
0
5
10
15
20
25
98-99 99-00 00-01 01-02 02-03
n u m b e r o
f i n c i d e n t s
0.00
2.00
4.00
6.00
8.00
10.00
12.00
14.00
16.00
% o
f t o t a l i n c i d
e n t s d u r i n g y e a r
incidents
% of total
Figure A4.5
DHE-HF4 Hoisting system incidents – 1998 to 2003
68

8/6/2019 RR183 - Lifting Incident Review 1998-2003
http://slidepdf.com/reader/full/rr183-lifting-incident-review-1998-2003 76/93
dhe-hf5
wire lining
0
5
10
15
20
25
98-99 99-00 00-01 01-02 02-03
n u m b e r o f i n c i d e n t s
0.00
2.00
4.00
6.00
8.00
10.00
12.00
14.00
16.00
% o
f t
o t a l i n c i d e n t s d u r i n g y e a r
incidents
% of total
Figure A4.6
DHE-HF5 Wire lining incidents – 1998 to 2003
dhe-hf6
blow-out preventer
0
5
10
15
20
25
98-99 99-00 00-01 01-02 02-03
n u m b e r o f i n c i d e n t s
0.00
2.00
4.00
6.00
8.00
10.00
12.00
14.00
16.00
% o
f t o t a l i n c i d
e n t s d u r i n g y e a r
incidents
% of total
Figure A4.7
DHE-HF6 Blow-out preventer handling equipment incidents – 1998 to 2003
69

8/6/2019 RR183 - Lifting Incident Review 1998-2003
http://slidepdf.com/reader/full/rr183-lifting-incident-review-1998-2003 77/93
dhe-hf7
pipe handling
0
5
10
15
20
25
98-99 99-00 00-01 01-02 02-03
n u m b e r o f i n c i d e n t s
0.00
2.00
4.00
6.00
8.00
10.00
12.00
14.00
16.00
% o
f t
o t a l i n c i d e n t s d u r i n g y e a r
incidents
% of total
Figure A4.8
DHE-HF7 Pipe handling incidents – 1998 to 2003
70

8/6/2019 RR183 - Lifting Incident Review 1998-2003
http://slidepdf.com/reader/full/rr183-lifting-incident-review-1998-2003 78/93
APPENDIX 5 DETAILED ANALYSIS – MECHANICAL EQUIPMENT FAILURES
The following charts are in support of Section 3.3 Detailed Analysis of Data – MechanicalHandling Equipment.
mechanical handling equipment
equipment failure trends 1998-2003
-1
0
1
2
3
4
5
6
98-99 99-00 00-01 01-02 02-03
% o
f a l l l i f t i n g i n c i d e n t s d u r i n g y e a r
ped crane-hoist function ped crane-boom function
ped crane-slew function ped crane-power pack
ped crane-ancillary equip ped crane-accessories
other lifting appl manual lifting equip
lifting accessories
Figure A5.1Mechanical handling equipment – equipment failure trends – 1998 to 2003
71
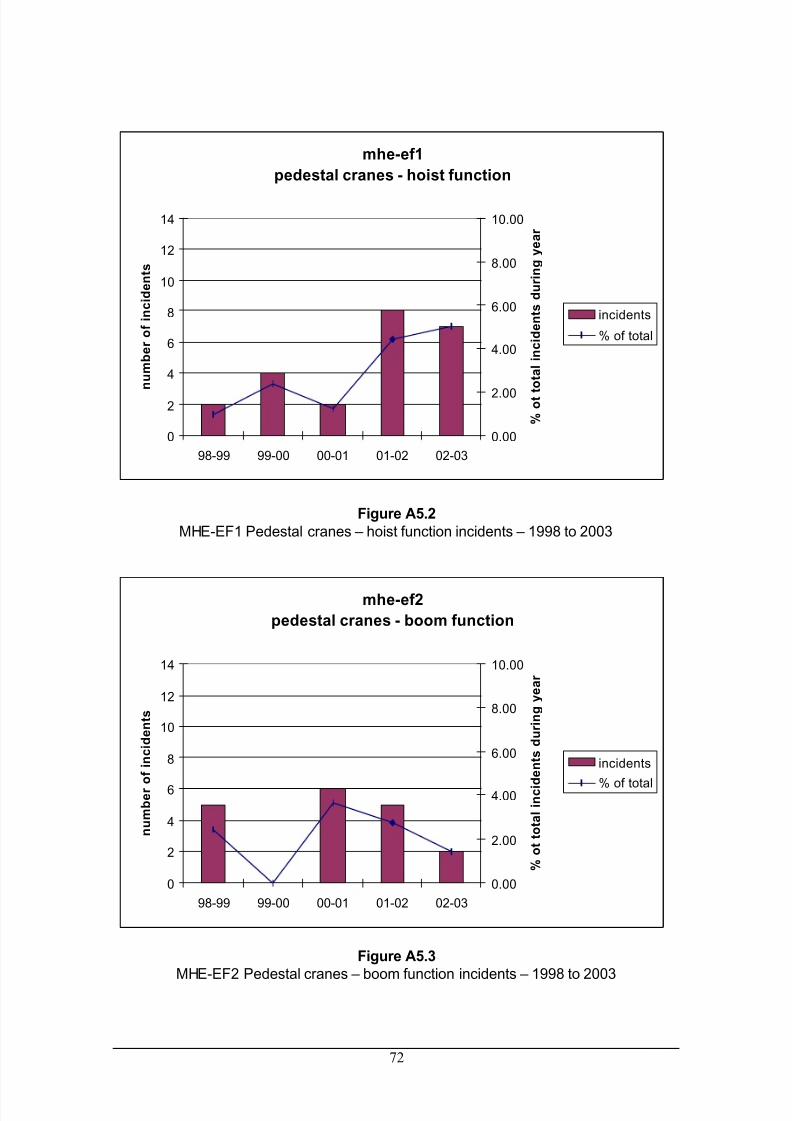
8/6/2019 RR183 - Lifting Incident Review 1998-2003
http://slidepdf.com/reader/full/rr183-lifting-incident-review-1998-2003 79/93
mhe-ef1
pedestal cranes - hoist function
0
2
4
6
8
10
12
14
98-99 99-00 00-01 01-02 02-03
n u m b e r o f i n c i d e n t s
0.00
2.00
4.00
6.00
8.00
10.00
% o
t t o t a l i n c i d e n t s d u r i n g y e a r
incidents
% of total
Figure A5.2
MHE-EF1 Pedestal cranes – hoist function incidents – 1998 to 2003
mhe-ef2
pedestal cranes - boom function
0
2
4
6
8
10
12
14
98-99 99-00 00-01 01-02 02-03
n u m b e r o f i n c i d e n t s
0.00
2.00
4.00
6.00
8.00
10.00
% o
t t o t a l i n c i d e n t s d u r i n g y e a r
incidents
% of total
Figure A5.3
MHE-EF2 Pedestal cranes – boom function incidents – 1998 to 2003
72

8/6/2019 RR183 - Lifting Incident Review 1998-2003
http://slidepdf.com/reader/full/rr183-lifting-incident-review-1998-2003 80/93
mhe-ef3
pedestal cranes - slew function
0
2
4
6
8
10
12
14
98-99 99-00 00-01 01-02 02-03
n u m b e r o f i n c i d e n t s
0.00
2.00
4.00
6.00
8.00
10.00
% o
t t o t a l i n c i d e n t s d u r i n g y e a r
incidents
% of total
Figure A5.4
MHE-EF3 Pedestal cranes – slew function incidents – 1998 to 2003
mhe-ef4
pedestal cranes - power pack
0
2
4
6
8
10
12
14
98-99 99-00 00-01 01-02 02-03
n u m b e r o f i n c i d e n t s
0.00
2.00
4.00
6.00
8.00
10.00
% o
t t o t a l i n c i d e n t s d u r i n g y e a r
incidents
% of total
Figure A5.5
MHE-EF4 Pedestal cranes – power pack incidents – 1998 to 2003
73
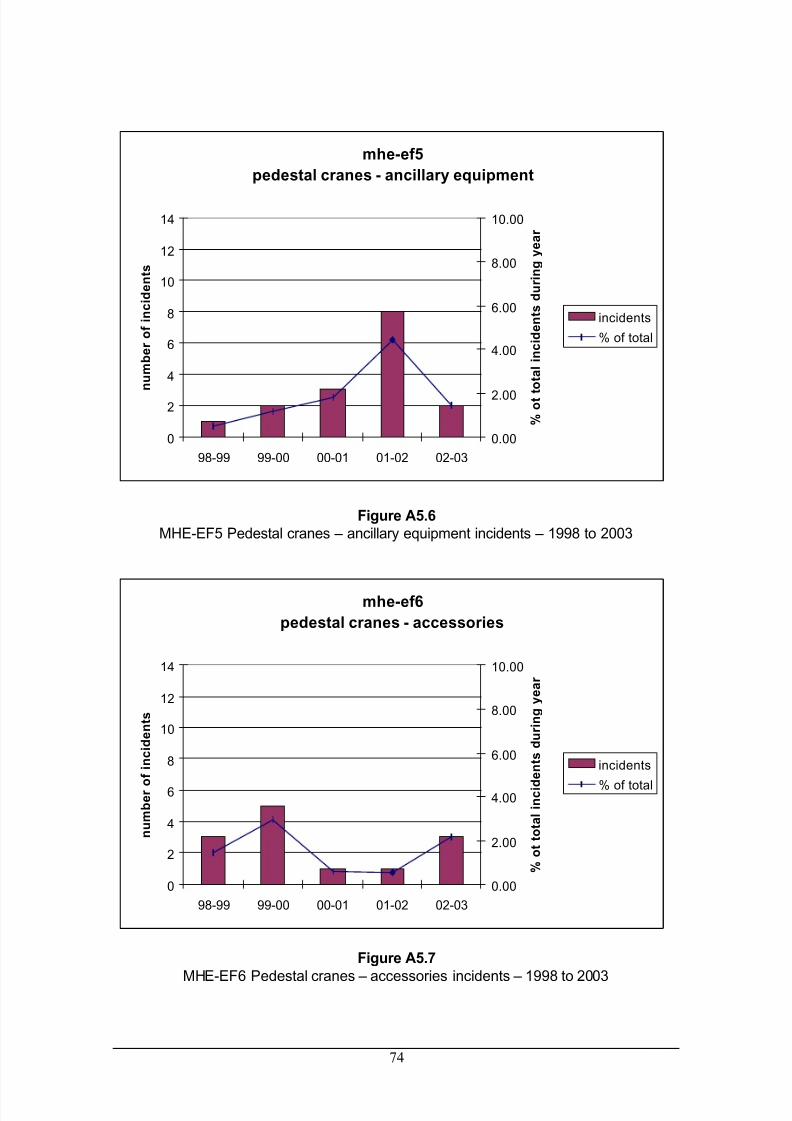
8/6/2019 RR183 - Lifting Incident Review 1998-2003
http://slidepdf.com/reader/full/rr183-lifting-incident-review-1998-2003 81/93
mhe-ef5
pedestal cranes - ancillary equipment
0
2
4
6
8
10
12
14
98-99 99-00 00-01 01-02 02-03
n u m b e r o f i n c i d e n t s
0.00
2.00
4.00
6.00
8.00
10.00
% o
t t
o t a l i n c i d e n t s d u r i n g y e a r
incidents
% of total
Figure A5.6
MHE-EF5 Pedestal cranes – ancillary equipment incidents – 1998 to 2003
mhe-ef6
pedestal cranes - accessories
0
2
4
6
8
10
12
14
98-99 99-00 00-01 01-02 02-03
n u m b e r o
f i n c i d e n t s
0.00
2.00
4.00
6.00
8.00
10.00
% o
t t o t a l i n c i d
e n t s d u r i n g y e a r
incidents
% of total
Figure A5.7
MHE-EF6 Pedestal cranes – accessories incidents – 1998 to 2003
74

8/6/2019 RR183 - Lifting Incident Review 1998-2003
http://slidepdf.com/reader/full/rr183-lifting-incident-review-1998-2003 82/93
mhe-ef7
other lifting appliance
0
2
4
6
8
10
12
14
98-99 99-00 00-01 01-02 02-03
n u m b e r o f i n c i d e n t s
0.00
2.00
4.00
6.00
8.00
10.00
% o
t t
o t a l i n c i d e n t s d u r i n g y e a r
incidents
% of total
Figure A5.8
MHE-EF7 Other cranes incidents – 1998 to 2003
mhe-ef8
manual lifting equipment
0
2
4
6
8
10
12
14
98-99 99-00 00-01 01-02 02-03
n u m b e r o
f i n c i d e n t s
0.00
2.00
4.00
6.00
8.00
10.00
% o
t t o t a l i n c i d
e n t s d u r i n g y e a r
incidents
% of total
Figure A5.9
MHE-EF8 Manual lifting equipment incidents – 1998 to 2003
75

8/6/2019 RR183 - Lifting Incident Review 1998-2003
http://slidepdf.com/reader/full/rr183-lifting-incident-review-1998-2003 83/93
mhe-ef9
lifting accessories
0
2
4
6
8
10
12
14
98-99 99-00 00-01 01-02 02-03
n u m b e r o f i n c i d e n t s
0.00
2.00
4.00
6.00
8.00
10.00
% o
t t o t a l i n c i d e n t s d u r i n g y e a r
incidents
% of total
Figure A5.10
MHE-EF9 Lifting accessories incidents – 1998 to 2003
76

8/6/2019 RR183 - Lifting Incident Review 1998-2003
http://slidepdf.com/reader/full/rr183-lifting-incident-review-1998-2003 84/93
APPENDIX 6 DETAILED ANALYSIS – MECHANICAL HUMAN FACTORS
The following charts are in support of Section 3.3 Detailed Analysis of Data – MechanicalHandlin g Equipment.
mechanical handling equipment
human factor trends 1998-2003
0
2
4
6
8
10
12
14
16
18
98-99 99-00 00-01 01-02 02-03
% o
f a l l l i f t i n g i n c i d e n t s d u r i n g
y e a r
platform lifts sea lifts
installation-ped crane op marine-ped crane op
other lifting equip-powered other lifting equip-manual
ped crane maintenance
Figure A6.1
Mechanical handling equipment – human factor trends – 1998 to 2003
77

8/6/2019 RR183 - Lifting Incident Review 1998-2003
http://slidepdf.com/reader/full/rr183-lifting-incident-review-1998-2003 85/93
mhe-hf1
pedestal cranes - platform lifts
0
5
10
15
20
25
30
35
40
98-99 99-00 00-01 01-02 02-03
n u m b e r o f i n c i d e n t s
0.00
2.00
4.00
6.00
8.00
10.00
12.00
14.00
16.00
18.00
20.00
% o
f t o t a l i n c i d e n t s d u r i n g y e a r
incidents
% of total
Figure A6.2
MHE-HF1 Pedestal cranes – platform lift incidents – 1998 to 2003
mhe-hf2
pedestal cranes - sea lifts
0
5
10
15
20
25
30
35
40
98-99 99-00 00-01 01-02 02-03
n u m b e r o f i n c i d e n t s
0.00
2.00
4.00
6.00
8.00
10.00
12.00
14.00
16.00
18.00
20.00
% o
f t o t a l i n c i d e n t s d u r i n g y e a r
incidents
% of total
Figure A6.3
MHE-HF2 Pedestal cranes – sea lift incidents – 1998 to 2003
78

8/6/2019 RR183 - Lifting Incident Review 1998-2003
http://slidepdf.com/reader/full/rr183-lifting-incident-review-1998-2003 86/93
mhe-hf3
installation - pedestal crane operations
0
5
10
15
20
25
30
35
40
98-99 99-00 00-01 01-02 02-03
n u m b e r o f i n c i d e n t s
0.00
2.00
4.00
6.00
8.00
10.00
12.00
14.00
16.00
18.00
20.00
% o
f t
o t a l i n c i d e n t s d u r i n g y e a r
incidents
% of total
Figure A6.4
MHE-HF3 Installation - pedestal crane operation incidents – 1998 to 2003
mhe-hf4
marine - pedestal crane operations
0
5
10
15
20
25
30
35
40
98-99 99-00 00-01 01-02 02-03
n u m b e r o
f i n c i d e n t s
0.00
2.00
4.00
6.00
8.00
10.00
12.00
14.00
16.00
18.00
20.00
% o
f t o t a l i n c i d
e n t s d u r i n g y e a r
incidents
% of total
Figure A6.5
MHE-HF4 Marine - pedestal crane operation incidents – 1998 to 2003
79

8/6/2019 RR183 - Lifting Incident Review 1998-2003
http://slidepdf.com/reader/full/rr183-lifting-incident-review-1998-2003 87/93
mhe-hf5
other lifting equipment - powered
0
5
10
15
20
25
30
35
40
98-99 99-00 00-01 01-02 02-03
n u m b e r o f i n c i d e n t s
0.00
2.00
4.00
6.00
8.00
10.00
12.00
14.00
16.00
18.00
20.00
% o
f t
o t a l i n c i d e n t s d u r i n g y e a r
incidents
% of total
Figure A6.6
MHE-HF5 Other lifting appliances - powered incidents – 1998 to 2003
mhe-hf6
other lifting equipment - manual
0
5
10
15
20
25
30
35
40
98-99 99-00 00-01 01-02 02-03
n u m b e r o f i n c i d e n t s
0.00
2.00
4.00
6.00
8.00
10.00
12.00
14.00
16.00
18.00
20.00
% o
f t o t a l i n c i d
e n t s d u r i n g y e a r
incidents
% of total
Figure A6.7
MHE-HF6 Other lifting appliances - manual incidents – 1998 to 2003
80

8/6/2019 RR183 - Lifting Incident Review 1998-2003
http://slidepdf.com/reader/full/rr183-lifting-incident-review-1998-2003 88/93
mhe-hf7
pedestal crane maintenance
0
5
10
15
20
25
30
35
40
98-99 99-00 00-01 01-02 02-03
n u m b e r o f i n c i d e n t s
0.00
2.00
4.00
6.00
8.00
10.00
12.00
14.00
16.00
18.00
20.00
% o
f t
o t a l i n c i d e n t s d u r i n g y e a r
incidents
% of total
Figure A6.8
MHE-HF7 Pedestal crane maintenance incidents – 1998 to 2003
81

8/6/2019 RR183 - Lifting Incident Review 1998-2003
http://slidepdf.com/reader/full/rr183-lifting-incident-review-1998-2003 89/93
APPENDIX 7 DRILLING HANDLING EQUIPMENT - HUMAN FACTORS
The following chart is in support of Section 4.2 Drilling Handling Equipment – Human factors.
drilling handling equipment-human factors
root causes
02
468
101214161820222426
98-99 99-00 00-01 01-02 02-03
n
u m b e r o f i n c i d e n t s
banking positioning procedures operator error maintenance rigging
Figure A7.1
Drilling handling equipment – human factor root cause – 1998 to 2003
82

8/6/2019 RR183 - Lifting Incident Review 1998-2003
http://slidepdf.com/reader/full/rr183-lifting-incident-review-1998-2003 90/93
APPENDIX 8 MECHANICAL HANDLING EQUIPMENT - HUMAN FACTORS
The following chart is in support of Section 4.4 Mechanical Handling Equipment – Humanfactors.
pedestal crane incidents - 3rd party error
root causes
0
2
4
6
8
10
1214
16
18
20
22
24
26
98-99 99-00 00-01 01-02 02-03
n u m b e r o f i
n c i d e n t s
banking positioning slinging packing procedures
Figure A8.1
Mechanical handling equipment – human factorsPedestal crane incidents – 3rd party error root cause
83

8/6/2019 RR183 - Lifting Incident Review 1998-2003
http://slidepdf.com/reader/full/rr183-lifting-incident-review-1998-2003 91/93
mechanical handling equipment-human factors
root causes
0246
8101214161820222426283032
98-99 99-00 00-01 01-02 02-03
n u m b e r o f i n c i d e n t s
banking positioning slinging packing procedures operator error maintenance
Figure A8.2
Mechanical handling equipment – human factor root causes
84

8/6/2019 RR183 - Lifting Incident Review 1998-2003
http://slidepdf.com/reader/full/rr183-lifting-incident-review-1998-2003 92/93
Printed and published by the Health and Safety ExecutiveC30 1/98
Printed and published by the Health and Safety Executive
C0.06 02/04

8/6/2019 RR183 - Lifting Incident Review 1998-2003
http://slidepdf.com/reader/full/rr183-lifting-incident-review-1998-2003 93/93


![Understanding school financial decisionsuctpimr/research/DFE-RR183[1].pdfResearch Report DFE-RR183 Understanding school financial decisions Rebecca Allen, Institute of Education, University](https://static.fdocuments.us/doc/165x107/5e67be2afeca013f806ccb00/understanding-school-financial-decisions-uctpimrresearchdfe-rr1831pdf-research.jpg)