
RQD: Time to Rest in Peace - University of Toronto T-Space · RQD: Time to Rest in Peace Author 1...
35
Draft RQD: Time to Rest in Peace Journal: Canadian Geotechnical Journal Manuscript ID cgj-2016-0012.R1 Manuscript Type: Article Date Submitted by the Author: 12-Dec-2016 Complete List of Authors: Pells, Philip; Pells Consulting, Bieniawski, Z. T. Richard; Consultant Hencher, Stephen; University of Leeds Pells, Steven; University of New South Wales Keyword: Geology, Rock Mechanics, Classification, Site Investigation, Erodibility https://mc06.manuscriptcentral.com/cgj-pubs Canadian Geotechnical Journal
Transcript of RQD: Time to Rest in Peace - University of Toronto T-Space · RQD: Time to Rest in Peace Author 1...

Draft
RQD: Time to Rest in Peace
Journal: Canadian Geotechnical Journal
Manuscript ID cgj-2016-0012.R1
Manuscript Type: Article
Date Submitted by the Author: 12-Dec-2016
Complete List of Authors: Pells, Philip; Pells Consulting, Bieniawski, Z. T. Richard; Consultant Hencher, Stephen; University of Leeds Pells, Steven; University of New South Wales
Keyword: Geology, Rock Mechanics, Classification, Site Investigation, Erodibility
https://mc06.manuscriptcentral.com/cgj-pubs
Canadian Geotechnical Journal
Draft
1
RQD: Time to Rest in Peace
Author 1
• P J Pells
• DSc DIC FIEAust MASCE
• Consultant, Sydney, Australia
• [email protected] Author 2
• Z T Bieniawski
• DSc(Eng) DrHonC (Madrid) DrHonC (Krakow) DTM,
• Consultant, Arizona, USA
• [email protected] Author 3
• S R Hencher
• PhD DIC FHKIE FICE CGeol Cng MAE,
• Consultant, Ilkley, UK
• [email protected] Author 4
• S E Pells
• MEngSci, Phd
• Consultant, Australia
Contact details of corresponding author: P J Pells Pells Consulting 49 Lakeside Drive MacMasters Beach NSW 2251 AUSTRALIA Email: [email protected] Ph: + 61 2 4381 2125
Page 1 of 34
https://mc06.manuscriptcentral.com/cgj-pubs
Canadian Geotechnical Journal

Draft
2
ABSTRACT
Rock Quality Designation (RQD), was introduced by Don Deere in the mid-1960s as a means of
using diamond core to classify rock for engineering purposes. Subsequently it was incorporated
into the Rock Mass Rating and Q-system classification methods which, world-wide, now play
substantial roles in rock mechanics design, whether for tunnels, foundations, rock slopes or rock
excavation.
It is shown that a key facet of the definition of RQD is ignored in many parts of the world, and it is
noted that there are several inherent limitations to the use of RQD.
Based on mapping of rock formations by seventeen independent professionals at different
locations in Australia and South Africa it is shown that differences in assessed RQD values result
in significant errors in computed RMR and Q ratings, and also in Geological Strength Index (GSI)
and Mining Rock Mass Rating (MRMR).
The introduction of a look-up chart for assessing GSI has effectively removed the need to
measure, or estimate, RQD. It has been found that GSI values derived from the look-up chart are
as valid as those derived by calculation from the original component parameters, and are
satisfactorily consistent between professionals from diverse backgrounds. The look-up charts
provide a quick and appropriate means of assessing GSI from exposures. GSI is, in turn a useful
rock mass strength index; one new application is presented for assessing potential erosion of
unlined spillways in rock.
Incorporation of RQD within the RMR and Q classification systems was a matter of historical
development, and its incorporation into rock mass classifications is no longer necessary.
KEYWORDS
Geology, rock mechanics, classification, site investigation, erodibility
Page 2 of 34
https://mc06.manuscriptcentral.com/cgj-pubs
Canadian Geotechnical Journal

Draft
3
LIST OF NOTATION
GSI Geological Strength Index
Ja Joint alteration number, Barton et al. (1974)
Jn Joint set number, Barton et al. (1974)
Jr Joint roughness number, Barton et al. (1974)
Jv Volumetric joint spacing, Barton et al. (1974)
RMR Rock Mass Rating
RQD Rock Quality Designation
UCS Unconfined Compressive Strength
Q Norwegian rock mass classification index, Barton et al. (1974)
Q’ Norwegian rock mass classification index for dry, unstressed rock
Page 3 of 34
https://mc06.manuscriptcentral.com/cgj-pubs
Canadian Geotechnical Journal

Draft
4
Introduction
In mid-2014, two of the authors undertook mapping and classification of rock exposures of unlined
spillways in South Africa, in support of an Australian-funded research project (Pells 2015). This
work yielded surprising findings in respect to Rock Quality Designation (RQD), which has
implications to quantitative rock mass classifications systems. Discussions between all the authors
provided confirmation of these findings, creating the impetus for this paper.
Rock Quality Designation (RQD) was devised in 1964 as an index for classifying the relative quality
of rock core obtained from small diameter core drilling (about 50 mm) (Deere and Deere 1989).
Since such a humble beginning, RQD has been adopted as a fundamental tool in characterising
rock masses. It has been used to estimate rock mass shear strength and deformation parameters,
bearing capacity of foundations; and most importantly is, “an essential element within the
framework of other classification systems” (US Corps of Engineers 1997).
This paper summarises the origins of RQD, and discusses how it has changed to the point that it
has substantially different meanings in different parts of the world. The inherent limitations of RQD
are summarised, and critical examination is made of its incorporation in Rock Mass Rating (RMR),
‘Q-values’ and Geological Strength Index (GSI). Results of field work are presented to show the
limitations arising from using RQD in the determination of these rock mass classification indices. It
is shown that RQD is not required for determining RMR and GSI values.
In core and exposure logging it is better replaced by fracture frequency.
The Genesis and Definition of RQD
In 1964 and 1965, whilst working on sites in granite at the Nevada Test Site for nuclear bombs,
Deere and co-workers devised an index, Rock Quality Designation (RQD), to differentiate between
relatively good quality rock and poor rock when logging rock core, as an alternative to just judging
quality on the basis of core recovery. RQD came to international recognition, and widespread
Page 4 of 34
https://mc06.manuscriptcentral.com/cgj-pubs
Canadian Geotechnical Journal

Draft
5
acceptance, through a chapter by Deere in a book edited by Stagg and Zienkiewicz (1968). The
1968 definition of RQD was:
“RQD is a modified core recovery percentage in which all pieces of sound core over 4 inches long
(100mm) are summed and divided by the length of the core run.”
A review of 20 years’ experience with RQD was given by Deere and Deere (1989) in a report to the
US Corps of Engineers. They emphasised three essential features of RQD.
1. It was a means of assessing rock mass quality from nominally 55mm diameter, double-tube
core, over a core run.
2. Only sticks of core with lengths greater than 4 inches (100mm) separated by natural
mechanical fractures were to be included. Fractures opened up by drilling were to be
ignored.
3. “Pieces of core which are not ‘hard and sound’ (ISRM, 1978) should not be counted for the
RQD even though they possess the requisite 4 in, (100mm) length.”
RQD was intended as more than an index of fracture spacing. In Deere’s words from 1989, “RQD
is an index of rock quality in that problematic rock that is highly weathered, soft, fractured, sheared,
and jointed is counted against the rock mass. Thus, it is simply a measurement of the percentage
of "good" rock recovered from an interval of a borehole.”
Meaning of “hard and sound”
In the original publications, Deere did not define “sound”, but in 1989 Deere and Deere clarified this
criterion, and chose to do so with reference to degree of weathering. They concluded:
(i) Highly and Completely Weathered rock and Residual Soil should never be included in
RQD, ‘highly’ being defined following Little (1969) in that ‘fairly large pieces can be
crumbled in the hands’ which agrees with Moye’s definition (1955) who originally
defined ‘highly weathered granite’ as where core 54 mm diameter could be ‘broken and
crumbled by hand’.
Page 5 of 34
https://mc06.manuscriptcentral.com/cgj-pubs
Canadian Geotechnical Journal

Draft
6
(ii) They suggested that Moderately Weathered rock could be included but then the Rock
Quality Designation should be marked with an asterix, i.e. RQD*. In the authors’
experience this distinction has not been widely adopted in practice.
Deere and Deere (1989) emphasised that the “purpose of the soundness requirement is to
downgrade the rock quality where the rock has been altered and weakened either by agents of
surface weathering or by hydrothermal activity. Obviously, in many instances, a judgment decision
must be made as to whether or not the degree of chemical alteration is sufficient to reject the core
piece”. ASTM D 6032-02 defined ‘sound’ core (only sound rock to be included in RQD) as: ‘sound
core’ is any core which is fresh to moderately weathered and which has sufficient strength to resist
hand breakage.
Uncertainties, confusion and errors
As discussed as early as 1978 by Deere’s co-workers (Cording and Mahar 1978) there can be
several causes for low quality of core “and they need to be determined when using RQD”. These
included; improper handling, drilling parallel to and intersecting a joint, separation on bedding and
foliation surfaces that are not open in the field, and core discing. There are other long-recognised
problems with measurement and use of RQD (see Foster 2015), including:
• measurements are usually taken post-boxing, rather than upon exposure in the core
barrel splits, leading to incipient fractures opening up and lower RQD being logged than
characteristic of the ground in situ
• typical standard practice is to retain the original prescription and measure RQD by core
run, although Deere and Deere (1989) do suggest logging by lithology as being
appropriate,
• directional bias means that where the geology is dominated by joints near-parallel to the
borehole, those defects are under-sampled,
• confusion exists in respect to the definition of ‘natural mechanical fractures’ within
certain rock types like schists, phyllite and shales, and
Page 6 of 34
https://mc06.manuscriptcentral.com/cgj-pubs
Canadian Geotechnical Journal
Draft
7
• confusion in dealing with well-defined incipient discontinuities that have tensile strength;
in fact these should be ignored when calculating RQD.
However, the greatest source of differences in core-logged RQD values arises from professionals
in certain parts of the world ignoring the “hard and sound” criterion in the definition.
The current situation in the United Kingdom (Hencher 2008), and much of the rest of Europe, is to
ignore the requirement for “hard and sound” rock (British Standard BS5930, since 1999). All cored
“rock” counts in the RQD assessment, with ‘rock’ being defined as having substance strength of
greater than 0.6MPa (BS EN ISO 14688-2:2004). The criterion of ‘sound’ is similarly ignored by
many other authors including Palmstrȍm (2005).
Material of substance strength >0.6MPa does not comply with Deere’s definition of “hard and
sound” and its inclusion results in logged RQD values much higher than computed on the basis of
the original definition (see Figure 1). The consequences are potentially dangerous, such as when
designing support measures in weak rock masses on the basis of RMR and Q charts which
assume RQD data determined using the proper Deere definition (Hencher 2015).
A further substantial issue is the practical necessity where, in many situations, cored borehole data
are not available and RQD is estimated from exposures, or RADAR, or photographs; despite this
contradicting the original definition and intent. Such estimation invokes consideration of ‘sound
rock’, the difficulty of establishing that a discontinuity has zero tensile strength and would cause a
break in core, and directional bias (Hencher 2014).
In addition the process may lead the geologist or engineer to adopt a relationship between RQD
and volumetric joint spacing (Jv), such as that of Palmstrȍm (2005):
RQD = 110 – 2.5Jv (for Jv = 4 to 44) (1)
or between defect frequency and RQD, such as per Priest and Hudson (1976), namely:
RQD = 110.4 – 3.8/ẋ (2)
where ẋ = mean spacing of defects assuming an exponential distribution.
Page 7 of 34
https://mc06.manuscriptcentral.com/cgj-pubs
Canadian Geotechnical Journal

Draft
8
The authors consider that such correlations may be inappropriate and misleading, not only for the
reason that Deere addressed when creating RQD, namely that rock included in RQD must
comprise only “sound” core, but also because of having to assess discontinuities as having zero
tensile strength.
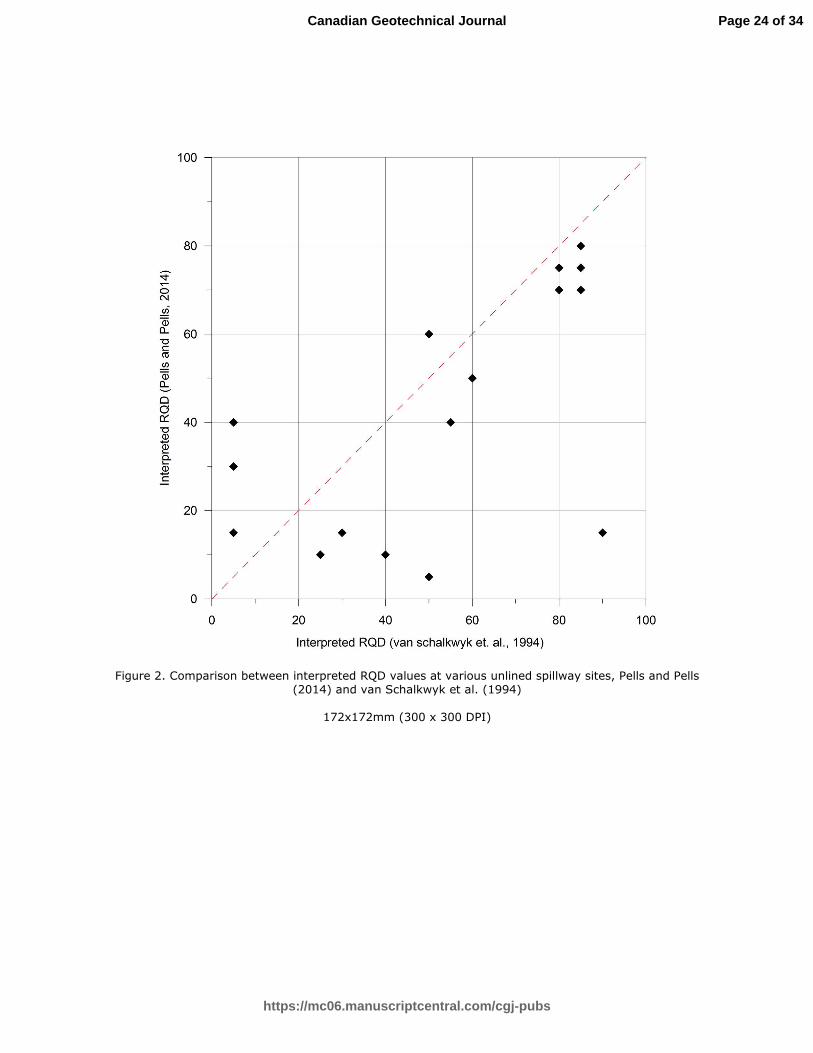
Field work by two of the authors in mid-2014 revealed the substantial problems associated with
assessing RQD from exposures. The work involved mapping and rock-mass classification of
seventeen structural regions in a wide variety of rocks in unlined spillways of major dams in South
Africa (Pells and Pells, 2014). These same rock exposures had been previously subject to
independent interpretation (van Schalkwyk et al. 1994). The RQD values from the two
independent assessments are compared in Figure 2, and reveal large differences of interpretation.
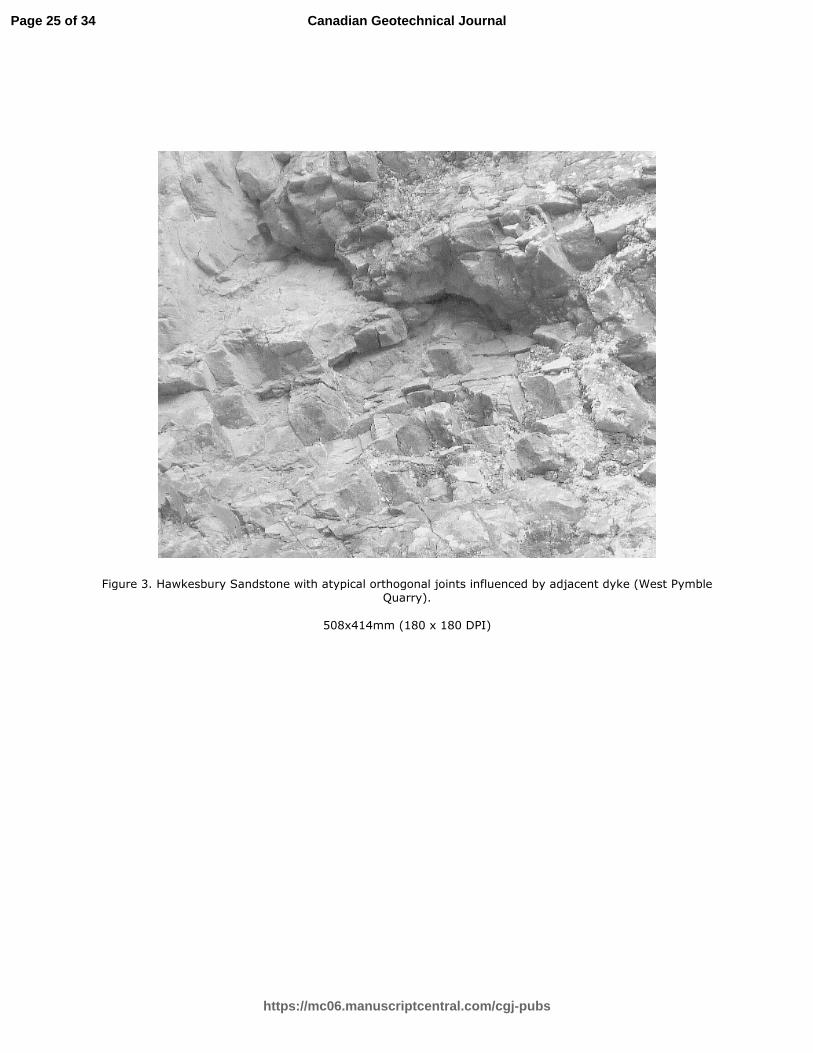
Prompted by the large discrepancy in interpretation shown in Figure 2, a further study was
instituted in which 13 practicing professionals were asked to independently classify three different
exposures in the Sydney area (a diatreme; an exposure typical of Hawkesbury Sandstone, and
Hawkesbury Sandstone altered to columnar jointing adjacent to a dolerite dyke – See Figure 3).
The range of interpreted RQD values at these sites is shown in Figure 4.
The work on the South African spillways was part of a major study financed by various Australian
authorities responsible for dam construction and maintenance, so the discovery of substantial
differences in quantitative classification of the same rock masses by different operators had
important consequences. Later in this paper we return to this matter, but first we must deal with
the use of RQD in widely used quantitative rock mass classification systems.
RQD in Rock Mass Classification Systems
Rock Mass Rating (RMR) and Q systems
In the early 1970s, Bieniawski (1973) and Barton et al. (1974) published their Rock Mass Rating
(RMR) and Q classification systems. Both are now widely adopted in practice for design of mines,
Page 8 of 34
https://mc06.manuscriptcentral.com/cgj-pubs
Canadian Geotechnical Journal
Draft
9
tunnels, rock slopes, and foundations, and for assessment of rock excavation and erosion (US
Corps of Engineers 1997).
As originally defined, both systems were fundamentally dependent on RQD; essentially modifying
RQD by incorporating other factors deemed to impact on rock mass strength and stiffness.
Barton et al. (1974) followed Cecil (1975) in modifying RQD by reducing it for the number of joint
sets (RQD/Jn); and then incorporated joint roughness, joint alteration (Jr/Ja) and rock load and
water pressures (Jw/SRF), in defining the Q-value.
For the RMR system, Bieniawski (1973) modified RQD by assigning a rating to this index, and then
combined this with ratings for strength, defect orientations and conditions, and groundwater
pressures.
After 40 years of application, Lowson and Bieniawski (2013) recommended against further use of
RQD in the RMR system. Their explanation was:
“This parameter was included originally among the six RMR parameters because the case
histories collected in 1972 all involved RQD. Over the years it became apparent that RQD
was difficult to determine at tunnel face, being directed to borehole characterization.
For the best practical use, this led to the preferred use of "fracture frequency" as an inverse
of "fracture density", as depicted in Chart D (see Figure 5 herein). Neither of these
approaches changed the basic allocation of rating values to these parameters.”
In a similar vein, Jakubec and Esterhuizen (2007) formalised a modification of Laubscher’s Mining
Rock Mass Rating (MRMR) wherein RQD is replaced by fracture frequency, a change first flagged
by Laubscher (1993).
Page 9 of 34
https://mc06.manuscriptcentral.com/cgj-pubs
Canadian Geotechnical Journal
Draft
10
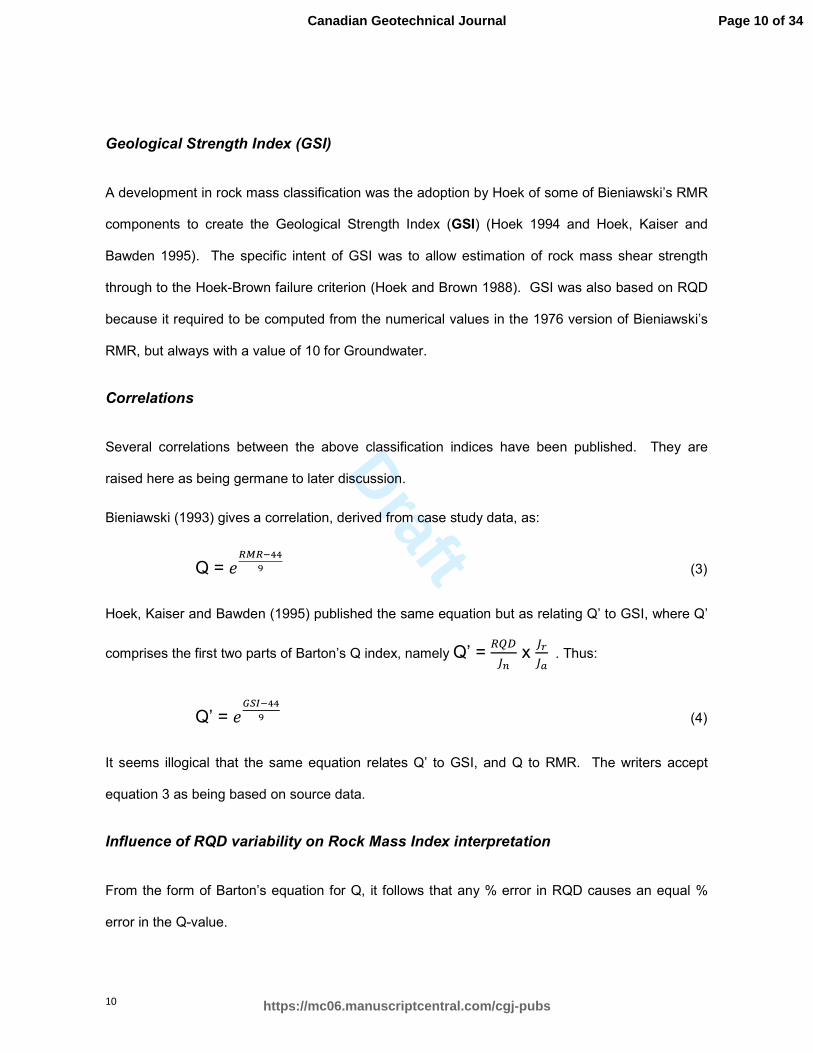
Geological Strength Index (GSI)
A development in rock mass classification was the adoption by Hoek of some of Bieniawski’s RMR
components to create the Geological Strength Index (GSI) (Hoek 1994 and Hoek, Kaiser and
Bawden 1995). The specific intent of GSI was to allow estimation of rock mass shear strength
through to the Hoek-Brown failure criterion (Hoek and Brown 1988). GSI was also based on RQD
because it required to be computed from the numerical values in the 1976 version of Bieniawski’s
RMR, but always with a value of 10 for Groundwater.
Correlations
Several correlations between the above classification indices have been published. They are
raised here as being germane to later discussion.
Bieniawski (1993) gives a correlation, derived from case study data, as:
Q = �������
� (3)
Hoek, Kaiser and Bawden (1995) published the same equation but as relating Q’ to GSI, where Q’
comprises the first two parts of Barton’s Q index, namely Q’ = ��
� x
�
. Thus:
Q’ = �������
� (4)
It seems illogical that the same equation relates Q’ to GSI, and Q to RMR. The writers accept
equation 3 as being based on source data.
Influence of RQD variability on Rock Mass Index interpretation
From the form of Barton’s equation for Q, it follows that any % error in RQD causes an equal %
error in the Q-value.
Page 10 of 34
https://mc06.manuscriptcentral.com/cgj-pubs
Canadian Geotechnical Journal
Draft
11
RQD is not used directly in RMR, but rather as a rating. Therefore it is not obvious what error will
result from a certain % error in RQD. By running several hundred practical scenarios, it is found
that +/-30% error in RQD results typically in < 6% error in RMR. Only in extreme cases with high
water pressures, unfavourable joint orientations, and a 30% underestimate of an already low RQD
does the error reach about 25%.
As originally published (Hoek, Kaiser and Bawden 1995) GSI was RMR without the groundwater
and joint orientation factors. This means that within a GSI range of 10 to 100, a 30% error in RQD
causes <5% error in GSI.
The significance of mathematical sensitivity to errors in RQD depends on the practical reality in
respect to accuracy of RQD assessment. And here is where the data collected in the field studies
in South Africa and Australia are disturbing. They showed that the variation in assessed RQD
between multiple professionals (which can be taken as errors) was so great that the resulting
quantitative rock mass classifications were inconsistent to the point of destroying confidence in
their application.
However, a revelation arising from the full field project covering unlined rock spillways at 10 major
dams in South Africa (mentioned above), and a further 20 dams in Australia (Pells 2015) was to
discover remarkably good, operator-independent, agreement between GSI values computed from
the RMR components as per Hoek, Kaiser and Bawden (1995), a process that required careful
work in the field and time in the office, and GSI values assessed very quickly in the field using the
look-up chart of Figure 6, discussed below. Like many fellow practitioners, the authors had
assumed that use of the look-up chart was second-best to proper calculation of GSI using the RMR
parameters.
The details and consequences of this finding are discussed in the remaining part of this paper.
Page 11 of 34
https://mc06.manuscriptcentral.com/cgj-pubs
Canadian Geotechnical Journal
Draft
12
Hoek’s Look-up Chart
It appears that the first version of the chart shown in Figure 6 was published by Hoek, Kaiser and
Bawden (1995). It appeared in a simplified version in the software Roclab (2002). Modified,
material-specific charts were published by Hoek and Marinos (2000).
The purpose of the original chart was to allow short-hand estimation of GSI for assessing the
parameters of the Hoek-Brown failure criterion.
Figure 6 makes no reference to RQD. Also there are no requirements to determine numerical
ratings covering substance strength, joint shear strength, alteration, continuity and spacing.
Figure 7 shows the comparisons, for the 30 rock spillways, between GSI values computed from
RMR components determined from field mapping and GSI values assessed quickly by use of the
look-up chart. Figure 8 shows the same kind of data from the 13 professionals mapping the three
quarry exposures in Sydney.
A test of consistency between operators using only the look-up charts was conducted by another
five senior professionals, assessing exposures of ignimbrite north of Newcastle, New South Wales.
One exposure was jointed, fresh rock, and the second was disturbed and faulted; near the contact
with underlying Carboniferous shales. The look-up chart GSI values for the exposure of fresh
ignimbrite ranged from 65 to 70. For the complex faulted rock, the values were between 35 and 45.
The field data from all the multi-operator experiments therefore confirmed that GSI could be
estimated with reasonable accuracy by experienced professionals using only Hoek’s look-up chart,
with no recourse to RQD. This finding has been partly supported by Hoek (2007 on-line Course
Notes and Book), who recommended that “that GSI should be estimated directly by means of the
chart ... and not from the RMR classification”. However, this is tempered by Hoek, Carter and
Diedrichs (2013) to the effect that GSI be computed by yet another method, namely a combination
of RQD and the Joint Condition Rating, the latter derived from RMR as per Bieniawski (1989). The
equation is:
GSI = 1.5*JCond89 +RQD/2 (5)
Page 12 of 34
https://mc06.manuscriptcentral.com/cgj-pubs
Canadian Geotechnical Journal
Draft
13
Equation 5 has been tested using the data from the South African and Australian sites, as shown in
Figure 9. This shows that computing GSI from Equation 5 (labelled “GSI2013”) gives poorer
agreement with the original GSI definition than achieved simply from the look-up chart (compare
with Figure 7).
Estimation of RMR and Q’ from GSI
GSI is not a synonym for RMR, and it is incorrect to transpose correlations made using RMR to
being correlations with GSI. Thus the correlation of rock mass modulus with RMR (Bieniawski
1989) should not be taken as the correlation between mass modulus and GSI.
Significant errors can result in determining RMR values from estimated GSI values, via correlation
equations such as Equations 3 and 4, above. Directly computed RMR values should be used when
invoking the empirical correlations relating to rock mass modulus or tunnel support categories. In
so doing, RQD should not be used, but rather fracture frequency as per Lowson and Bieniawski
(2013).
Applications of GSI
Rock-mass erodibility
As already noted, GSI was introduced as a means of estimating rock mass parameters in the
Hoek-Brown failure criterion. However, it is Geological Strength Index and there are situations
where it can be used directly as such an index. The following is one such application.
Unlined dam spillways can be subject to significant erosion, incurring unacceptable safety and
economic risks. Examples of such erosion are shown in Figure 10 in high strength quartzite at the
Mokolo Dam, South Africa, and in Figure 11 in high strength granite at Copeton Dam, Australia.
The prediction and analysis of such erosion is complex, and no satisfactory, generalised analytical
solutions exist (Pells 2015).
Page 13 of 34
https://mc06.manuscriptcentral.com/cgj-pubs
Canadian Geotechnical Journal
Draft
14
The “Kirsten Index” (K) which was based on the Q-system and developed for rippability
assessments (Kirsten 1982), has been used as an index for rock mass erodibility (Moore and
Kirsten 1988). Based on field investigations of unlined dam spillways in South Africa, van
Schalkwyk et al. (1994) presented a correlation between magnitude of erosion, the Kirsten Index
and; hydraulic loading as represented by the unit stream power dissipation incurred during peak
historical spillway discharge (ΠΠΠΠUD). Different correlations based on essentially the same field data
for fractured rock and the same indices (K and ΠUD) were subsequently presented by Annandale
(1995) and Kirsten et al. (2000).
The fact, discovered as part of this study, that different operators mapping the same areas in the
same spillways obtained significantly different Kirsten Index values, and the fact that determining
K, RMR and Q, takes extensive work, suggested consideration be given to using GSI from the
look-up chart as the measure of rock mass strength. Pells (2015) showed that a reasonable
correlation existed between erosion magnitude, unit stream power (ΠUD) and rock mass strength as
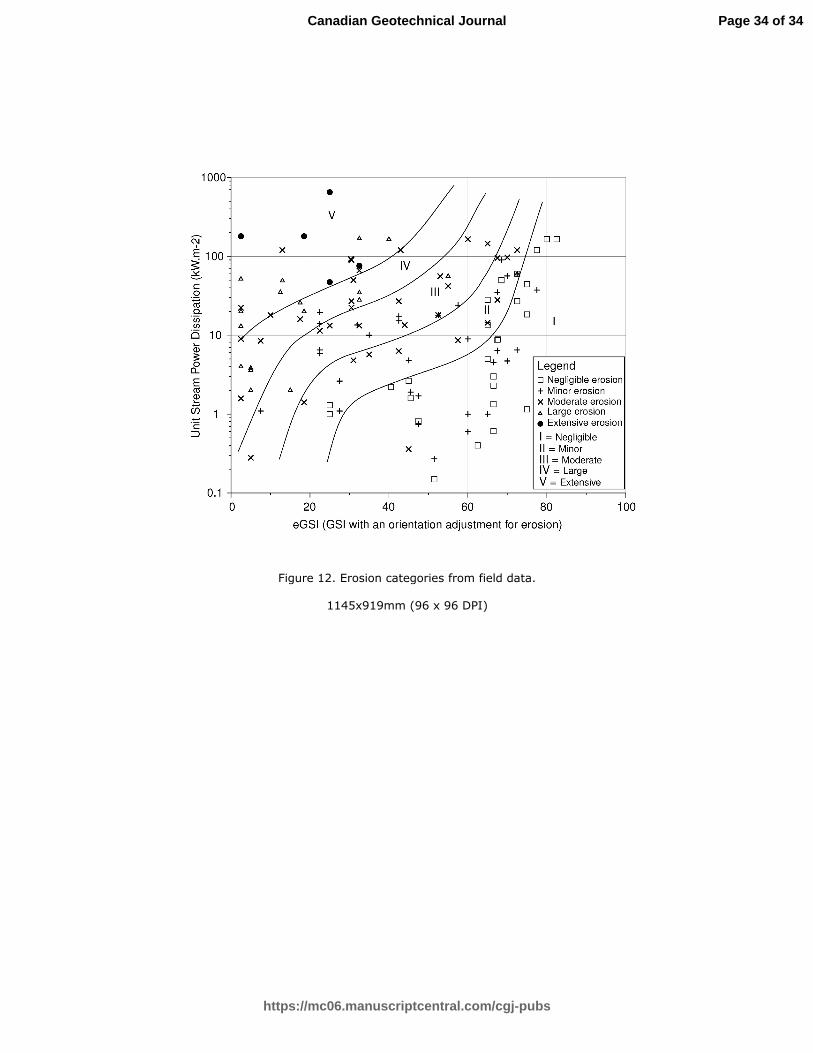
represented by GSI. However, joint orientation is a significant factor in vulnerability to erosion.
Therefore a better evaluation of the spillway erosion data was obtained by modifying GSI with an
appropriate orientation adjustment factor, of the kind used in the RMR system (Bieniawski 1973)
The resulting index, labelled Erosion GSI (eGSI) was found to provide an improved representation
of erosion vulnerability in five classes (see Figure 12).
Calculating rock mass shear strength
It is not within the framework of this paper to comment on the validity of Hoek-Brown mass shear
strength parameters derived from GSI. However, based on the field data documented herein, and
on the authors’ individual experiences, it is concluded that GSI is usually not known to better than
about 10 points for a single exposure, and ±15 points for a Structural Region. Of importance is the
fact that GSI occurs as an exponential in the Hoek-Brown equation for rock mass shear strength
parameters (where σci= material UCS), viz:
(σ1-σ3)/σci = [mb(σ3/σci) + s]a (6)
Page 14 of 34
https://mc06.manuscriptcentral.com/cgj-pubs
Canadian Geotechnical Journal

Draft
15
a=0.5 +1/6[e-GSI/15 – e-20/3] (7)
mb = mi e(GSI-100)/28 (8)
s= e(GSI-100)/9 (9)
For zero confining stress (σ3=0) errors in shear strength arising from errors in GSI are independent
of rock type (mi) and substance UCS, and from the derivative of Equation 6 it is shown that for a 10
point uncertainty in GSI, the uncertainty in the computed rock mass unconfined strength, ranges
from 100% at true GSI of 15, to 75% at true GSI of 25, and ~56% for true GSI greater than 70.
For confined conditions the uncertainty in shear strength arising from uncertainty in GSI is
complex. A parametric study has shown that for confining stress >1MPa a 10 point uncertainty in
GSI causes a 20% to 40% uncertainty in computed shear strength.
The significant sensitivity of the Hoek-Brown failure criterion to GSI is a matter that practitioners
must consider when using rock mass shear strengths derived using Equations 6 for design
purposes.
Conclusions
Based on a review of inherent limitations of RQD, the inconsistent changes in definition, the
maturing understanding of RMR and GSI, and extensive multi-operator field experimentation, it is
concluded that RQD should be phased out in rock mass classification.
In particular:
1. The definitions of RQD have become different in different parts of the world, and in
many countries the definition is no longer consistent with the original methodology
and logic of its creator, Don Deere.
2. Most applications of the dominant classification systems, RMR, Q, GSI and MRMR,
require RQD to be estimated from exposures. This is a process fraught with error
and personal bias, as demonstrated by the factual data presented in this paper.
Page 15 of 34
https://mc06.manuscriptcentral.com/cgj-pubs
Canadian Geotechnical Journal
Draft
16
3. The inherent limitations of RQD have already been recognised by the original
creators of the RMR and MRMR systems, who have recommended it be replaced
by fracture frequency.
4. It has been demonstrated that GSI can be estimated from Hoek’s look-up chart as
accurately as calculated from its components which include RQD.
Use of GSI for calculating rock mass strength via the Hoek-Brown failure criterion must be done
with prudence because the computed strength parameters are sensitive to uncertainty in GSI
determinations.
Where RMR values are required for use in the empirical correlations for rock mass modulus or
tunnel support categories, and where rock strength and groundwater are key issues, calculations
of RMR should be made using the fundamental components as per Lowson and Bieniawski (2013).
Acknowledgements
The studies relating to rock-mass erodibility and rock mass assessments of unlined spillways in
Australia and the USA are drawn from a research project under the guidance of Dr. Bill Peirson,
Dr. Kurt Douglas, and Professor Robin Fell of the University of NSW.
We acknowledge the work done voluntarily by the following in mapping at the Hornsby, West
Pymble and Seaham quarries in NSW, Australia:
Dr K. Douglas of UNSW Australia
T. Nash, R. Bertuzzi, W. Piper, A. Irvine, M. Kobler, A. Merit and M. Salcher, of PSM
P. Roberts and W. Theunissen of JK Geotechnics
Dr J. Simmons of Sherwood Geotechnics
E. Cammack of AECOM
T. Rannard of URS
Dr S. Fityus of University Newcastle, NSW
Page 16 of 34
https://mc06.manuscriptcentral.com/cgj-pubs
Canadian Geotechnical Journal

Draft
17
D. Fleming and P. Hartcliff of Douglas Partners
L. McQueen of Golder Associates
We also acknowledge the assistance of Prof. A. van Schalkwyk and Dr H. Kirsten for the work
done in South Africa.
Page 17 of 34
https://mc06.manuscriptcentral.com/cgj-pubs
Canadian Geotechnical Journal
Draft
18
REFERENCES
Annandale, G. W. 1995. Erodibility. Journal of Hydraulic Research 33, 471-494.
Barton, N. R., Lien, R. and Lunde, J. 1974. Engineering classification of rock masses for the design
of tunnel support, Rock Mech. 6 (4), 189–236.
Bieniawski, Z. T. 1973. Engineering classification of jointed rock masses, Trans. S. Afr. Inst. Civil
Eng. 15, 335-344
Bieniawski, Z. T. 1989. Engineering Rock Mass Classifications. Wiley, New York
Bieniawski, Z. T. 1993. Classification of Rock Masses for Engineering: The RMR System and
Future Trends. Comprehensive Rock Engineering, 3, Pergamon.
BS 5930:1999 Code of Practice for Site Investigations, British Standards Institution, London,
October 1999.
BS EN ISO 14688-2:2004 Geotechnical investigation and testing -Identification and classification of
soil - Part 2: Principles for classification.
Canadian Geotechnical Society. 1992. Canadian Foundation Engineering Manual, 3rd Edition,
BiTech Publishers, Richmond, BC.
Cecil, O. S. 1975. Correlations of Rock Bolt-Shotcrete Support and Rock Quality Parameters in
Scandinavian Tunnels. Swedish Geotechnical Institute, Proceedings No 27, Stockholm.
Cording, E. J. and Mahar, J. W. 1978. Index properties and observations for design of chambers in
rock. Engineering Geology 12 113-142, Elsevier, Amsterdam
Deere, D. U. 1968. Geological Considerations. Chapter 1, Rock Mechanics in Engineering
Practice, K.G. Stagg & O.C. Zienkiewicz (eds.), New York: Wiley, 1–20.
Deere, D. U. and Deere, D. W. 1989. Rock Quality Designation (RQD) after Twenty Years.
Contract Report GL-89-1, US Army Corps of Engineers, 67p plus Appendix.
Page 18 of 34
https://mc06.manuscriptcentral.com/cgj-pubs
Canadian Geotechnical Journal

Draft
19
Forster, D. 2015. Classification of rock masses for dam engineering: A new system-rock condition
number. Australian Commission on Large Dames, Symposium, Brisbane, November 2015.
Hencher, S. R. 2008. The new British and European standard guidance on rock description.
Ground Engineering, July 2008.
Hencher, S. R. 2014. Characterising discontinuities in naturally fractured outcrop analogues and
rock core: the need to consider fracture development over geological time. Geological
Society of London Special Publication 374, Advances in the Study of Fractured Reservoirs,
113-123.
Hoek, E. and Brown, E. T. 1988. The Hoek-Brown failure criterion-a 1988 update. Proc. 15th Can.
Rock Mech. Symp. University of Toronto.
Hoek, E. 1994. Strength of rock and rock masses. ISRM News Journal 2(2) 4-16
Hoek, E., Kaiser, P. K. and Bawden, W. F. 1995. Support of Underground Excavations in Hard
Rock, A. A. Balkema Rotterdam/Brookfield.
Hoek, E. and Marinos P., 2000. Predicting Tunnel Squeezing. Tunnels and Tunnelling
International, Part 1, November 2000, Part 2 – December 2000.
Hoek, 2007 Practical Rock Engineering. https://www.rocscience.com/learning/hoek-s-
corner/books. Accessed 11/01/2016.
Hoek, E., Carter, T. G. and Diederichs, M. S. 2013. Quantification of the Geological Strength Index
Chart. 47th US Rock Mechanics Symposium, American Rock Mechanics Association, San
Francisco.
Jakubec, J. and Esterhuizen, G. S. 2007. Use of the Mining Rock Mass Rating (MRMR)
Classification: Industry Experience. Proc. Int. Workshop on Rock Mass Clarification in
Underground Mining, US Dept Health & Human Services, N105H.
Page 19 of 34
https://mc06.manuscriptcentral.com/cgj-pubs
Canadian Geotechnical Journal

Draft
20
Kirsten, H. A. D. 1982. Classification system for excavation in natural materials. Civil Engineer in
South Africa, pp 293-308.
Kirsten, H. A. D., Moore, J. S., Kirsten, L. H. and Temple, D. M. 2000. Erodibility criterion for
auxiliary spillways of dams. International Journal of Sediment Research 15, 93-107.
Laubscher, D. H. 1993. Planning mass mining operations. Comprehensive Rock Engineering, 2,
Pergamon Press, Oxford.
Lowson, A. R. and Bieniawski, Z. T. 2013. Critical Assessment of RMR based Tunnel Design
Practices: a Practical Engineer’s Approach. SME, Rapid Excavation and Tunnelling
Conference, Washington DC, pp 180-198.
Moore, J.S., Kirsten, H., 1988. Discussion - Critique of the rock material classification procedure,
in: Kirkaldie, L. (editor), Proceedings. Presented at the Rock Classification Systems for
Engineering Purposes, American Society for Testing and Materials, Philadelphia, pp 55–88.
Palmstrȍm, A. 2005. Measurements of and correlations between block size and rock quality
designation (RQD), Tunnelling and Underground Space Technology 20(4), 362-377.
Palmstrȍm, A., and Broch, E. 2006. Use and misuse of rock mass classification systems with
particular reference to the Q-system, Tunnelling and Underground Space Technology 21,
575-593.
Pells, S. E. 2015. Erosion of unlined spillways in rock. Doctoral Thesis, University of New South
Wales, Australia
Pells, P.J.N., and Pells, S.E. 2014. Erosion of Rock in Unlined Spillways - Report on Study Tour to
South Africa, May 2014 (Technical report No. S004.R1). Pells Consulting, MacMasters
Beach, Australia.
Priest, S. D., and Hudson, J. A. 1976. Discontinuity spacings in rock. Int. J. Rock Mech. Min. Sci.
&Geomechanics Abstracts., 13 135-148.
Page 20 of 34
https://mc06.manuscriptcentral.com/cgj-pubs
Canadian Geotechnical Journal

Draft
21
RocLab 2002. Software published by Rocscience, Toronto, Canada; superseded by RockData5.0
in 2014
Stagg, K. G., and Zienkiewicz, O. C. 1968. Rock Mechanics in Engineering Practice. Wiley, NY,
442pp.
United States Army Corps of Engineers, Engineering manual 1110-2-2901. Engineering and
design , Tunnels and Shafts in Rock, May,1997
van Schalkwyk, A., Jordaan, J.M., Dooge, N. 1994. Erosion of Rock in Unlined Spillways.
International Commission on Large Dams, Paris. Q.71 E.37, 555–571
Page 21 of 34
https://mc06.manuscriptcentral.com/cgj-pubs
Canadian Geotechnical Journal

Draft
22
LIST OF FIGURES
Figure 1: RQD determination as per Deere and Deere (1989) and per current UK and European
practice.
Figure 2: Comparison between interpreted RQD values and various unlined spillway sites, Pells
and Pells 2014 and van Schalkwyk et al. 1994.
Figure 3: Dyke-affected, columnar, Hawkesbury Sandstone in the West Pymble quarry.
Figure 4: The range of RQD values interpreted by independent professionals at three rock
exposures in Sydney.
Figure 5: Chart D for combined rating of the discontinuity density parameters RQD, plus
discontinuity spacing (from Lowson and Bieniawski 2013).
Figure 6: GSI look-up chart from Hoek (2007) – published with permission of E Hoek.
Figure 7: Comparison of GSIRMR vs GSICHART, from spillway investigations (Pells 2015).
Figure 8: Comparison between two methods of assessing GSI – rock exposures in Sydney.
Figure 9: Comparison of GSIRMR versus GSI2013 (Equation 5); from Pells (2015).
Figure 10: Erosion at Mokolo Dam spillway, Waterberg Mountains, South Africa.
Figure 11: Slot erosion in very high strength granite, Copeton Dam spillway, NSW, Australia.
Figure 12: Erosion categories from field data.
Page 22 of 34
https://mc06.manuscriptcentral.com/cgj-pubs
Canadian Geotechnical Journal

Draft
Figure 1. RQD determination as per Deere and Deere (1989), and compared to current UK and European
practice.
193x233mm (600 x 600 DPI)
Page 23 of 34
https://mc06.manuscriptcentral.com/cgj-pubs
Canadian Geotechnical Journal
Draft
Figure 2. Comparison between interpreted RQD values at various unlined spillway sites, Pells and Pells
(2014) and van Schalkwyk et al. (1994)
172x172mm (300 x 300 DPI)
Page 24 of 34
https://mc06.manuscriptcentral.com/cgj-pubs
Canadian Geotechnical Journal
Draft
Figure 3. Hawkesbury Sandstone with atypical orthogonal joints influenced by adjacent dyke (West Pymble Quarry).
508x414mm (180 x 180 DPI)
Page 25 of 34
https://mc06.manuscriptcentral.com/cgj-pubs
Canadian Geotechnical Journal

Draft
Figure 4. The range of RQD values interpreted by independent professionals at three rock exposures in Sydney.
718x651mm (96 x 96 DPI)
Page 26 of 34
https://mc06.manuscriptcentral.com/cgj-pubs
Canadian Geotechnical Journal

Draft
Figure 5. Chart D for combined rating of the discontinuity density parameters RQD, plus discontinuity spacing (from Lowson and Bieniawski 2013).
234x217mm (300 x 300 DPI)
Page 27 of 34
https://mc06.manuscriptcentral.com/cgj-pubs
Canadian Geotechnical Journal

Draft
Figure 6. GSI look-up chart from Hoek (2007) - published with permission of E Hoek.
158x224mm (300 x 300 DPI)
Page 28 of 34
https://mc06.manuscriptcentral.com/cgj-pubs
Canadian Geotechnical Journal

Draft
Figure 7. Comparison of GSIRMR vs GSICHART, from spillway investigations (Pells 2015).
157x154mm (300 x 300 DPI)
Page 29 of 34
https://mc06.manuscriptcentral.com/cgj-pubs
Canadian Geotechnical Journal

Draft
Figure 8. Comparison between two methods of assessing GSI - rock exposures in Sydney.
130x66mm (300 x 300 DPI)
Page 30 of 34
https://mc06.manuscriptcentral.com/cgj-pubs
Canadian Geotechnical Journal

Draft
Figure 9. Comparison of GSIRMR versus GSI2013 (Equation 5); from Pells (2015).
1005x933mm (96 x 96 DPI)
Page 31 of 34
https://mc06.manuscriptcentral.com/cgj-pubs
Canadian Geotechnical Journal

Draft
Figure 10. Erosion at Mokolo Dam spillway, Waterberg Mountains, South Africa.
1087x677mm (72 x 72 DPI)
Page 32 of 34
https://mc06.manuscriptcentral.com/cgj-pubs
Canadian Geotechnical Journal

Draft
Figure 11. Slot erosion in very high strength granite, Copeton Dam spillway, NSW, Australia.
443x269mm (200 x 200 DPI)
Page 33 of 34
https://mc06.manuscriptcentral.com/cgj-pubs
Canadian Geotechnical Journal
Draft
Figure 12. Erosion categories from field data.
1145x919mm (96 x 96 DPI)
Page 34 of 34
https://mc06.manuscriptcentral.com/cgj-pubs
Canadian Geotechnical Journal


![ZZZ EHO]RQD FRP](https://static.fdocuments.us/doc/165x107/62040d0dedb3a75b68040498/zzz-ehorqd-frp.jpg)
