DEPARTMENT OF DEFENCE Briefing on Audit Outcomes Year ended 31 March 2010 AGSA AUDIT TEAM.
HEAD OFFICE
SABS Campus 1 Dr Lategan Road Groenkloof, PretoriaPO Box: NRCS Private Bag X25, Brooklyn 0075Telephone: +27 12 482 8700
PORT ELIZABETH
Willow Park Units 25 & 26Willow Road Business ParkWillow Road, FairviewTel. 041 398 6900Fax 041 398 6944
CAPE TOWN
14 Railway RoadMontagu GardensTel. 021 526 3400Fax. 021 526 3452
DURBAN
Unit 13 Cedar Park Industrial Estate 3 Quarry Park PlaceBriardeneTel. 031 533 6700Fax. 031 533 6729
BLOEMFONTEIN
34 Victoria RoadWillowsBloemfonteinTel. 051 447 4408Fax. 051 430 3485
Natio
nal R
egu
lator fo
r Co
mp
ulso
ry Specifi
cation
s An
nu
al Rep
ort 2013/2014
2013/2014
ANNUAL REPORT
RP105/2014ISBN: 978-0-621-42627-4
1NRCS Annual Report 2013/2014 PB NRCS Annual Report 2013/2014
Contents
PART A - GENERAL INFORMATION
General Information 2List of Abbreviations/Acronyms 3Strategic Overview 5Foreword by the Minister 6Report of the Chairperson 9Report of the Chief Executive Officer 11NRCS Board Members 16Organisational Structure 17
PART B - PERFORMANCE INFORMATION
Statement of Responsibility for Performance Information 18Reports of the Business Units 1. Automotive 192. Chemical, Mechanical and Materials 223. Electrotechnical 254. Foods and Associated Industries 275. Legal Metrology 306. National Building Regulations 347. Regulatory Research and Development 368. Communications and Marketing 40
Programme Performance 42
PART C - GOVERNANCE
Governance Report 48Audit and Risk Committee Report 54
PART D - HUMAN RESOURCES
HR Management Oversight Report 56
PART E - FINANCIALSReport of the Auditor-General 62Statement of Responsibility 66Annual Financial Statements - for the year ended 31 March 2014 67
3NRCS Annual Report 2013/2014 2 NRCS Annual Report 2013/2014
PART A -
General Information
Registered name of the public entity National Regulator of Compulsory Specifications (NRCS)
RP number RP:105/2014
ISBN number ISBN:978-0-621-42627-4
Controlling entity: The executive authority for the NRCS is the Minister of Trade and Industry
Business address of head office SABS CampusNo.1 Dr Lategan RoadGroenkloofPretoria
Postal address of head office Private Bag X25BrooklynPretoria0075
Email address [email protected]
Website www.nrcs.org.za
Auditors Auditor-General South Africa (AGSA)
Physical address 300 Middel StreetNew MuckleneukPretoria
Postal address PO Box 446Pretoria0001
Acting Company Secretary Teboho Aphane
1
3NRCS Annual Report 2013/2014 2 NRCS Annual Report 2013/2014
AFRIMETS Intra-Africa Metrology SystemAGSA Auditor-General South AfricaBESA Bond Exchange of South AfricaBCO Building Control OfficersBCOCC Border Control Operations Coordinating CommitteeCAE Chief Audit ExecutiveCCMA Commission for Conciliation, Mediation and ArbitrationCEO Chief Executive OfficerCFL Compact Fluorescent LampsCFO Chief Financial OfficerCIML International Committee of Legal MetrologyCMM Chemical, Mechanical and Materials CPI Consumer Price IndexCOGTA Department of Cooperative Governance and Traditional AffairsCRM Customers Relations ManagementDAFF Department of Agriculture, Forestry and FisheriesDEA Department of Environmental AffairsDOE Department of EnergyDOH Department of HealthDOT Department of TransportDPSA Department of Public Service and AdministrationDR Disaster Recoverydti Department of Trade and IndustryEE Employment EquityERP Enterprise Resource PlanningEU European UnionExco Executive CommitteeFAI Food and Associated IndustriesFAO Food and Agriculture Organization of the United NationsFLAG Food and Legislation Advisory GroupFOREX Foreign ExchangeGRAP Generally Recognised Accounting PracticeHR Human ResourcesICASA Independent Communications Authority of South AfricaICT Information and Communication TechnologyIEC International Electrotechnical CommissionIECEE International Commission on the Rules for the Approval of Electrical EquipmentIPAP Industrial Policy Action PlanIR Industrial Relations
List of Abbreviations/Acronyms
2
5NRCS Annual Report 2013/2014 4 NRCS Annual Report 2013/2014
IT Information TechnologyISO International Standards OrganisationJASIC Japan Automobile Standards Internationalization CentreKPA Key Performance AreaKPI Key Performance IndicatorLOA Letter of AuthorityLOC Letter of Certification LSM Lower Living Standards Measure MIB Manufacturers, Importers and BuildersMISA Municipal Infrastructure Support AgencyMoU Memorandum of Understanding MTBPS Medium Term Budget Policy StatementNAAMSA National Association of Automobile Manufacturers of South AfricaNCOP National Council of ProvincesNDT National Department of TransportNDP National Development PlanNBR National Building RegulationsNRCS National Regulator for Compulsory SpecificationsOIML International Organisation for Legal MetrologyPAA Public Audit ActPAC Project Approvals CommitteePFMA Public Finance Management ActQMS Quality Management SystemRASFF Rapid Alert System for Food and FeedRMI Retail Motor IndustrySABOA South African Bus Operators AssociationSABS South African Bureau of StandardsSADC South African Development CommunitySADCMEL SADC Cooperation in Legal MetrologySAMSA South African Maritime Safety AuthoritySANAS South African National Accreditation SystemSANS South African National StandardsSAPA South African Press AssociationSAPS South African Police ServiceSARS South African Revenue ServicesSETA Sector Education and Training Authority SI International System of UnitsSLA Service Level AgreementSPS Sanitary and PhytosanitarySQAMEG The SADC Standardisation, Quality Assurance, Accreditation and Metrology Expert GroupTBT Technical Barriers to TradeTC Technical CommitteeTR Technical RegulationsUNECE United Nations Economic Commission for EuropeVC Verpligte/CompulsoryVCs/CS Compulsory SpecificationsVIN Vehicle Identification NumberVoIP Voice over Internet ProtocolWP Working PartyWHO World Health OrganisationWTO World Trade Organisation
5NRCS Annual Report 2013/2014 4 NRCS Annual Report 2013/2014
Background
The National Regulator for Compulsory Specifications (NRCS) was established on 1 September 2008 in accordance with the National Regulator for Compulsory Specifications Act (NRCS Act), No.5 of 2008. It emerged as an independent organisation from the original Regulatory Division of the South African Bureau of Standards (SABS) and is defined as a schedule 3(a) entity under the Public Finance Management Act (PFMA), 1999 (Act No. 1 of 1999). The NRCS is an agency of the dti, established to administer compulsory specifications and other technical regulations with the view to protect human health and safety, the environment and to ensure fair trade, in accordance with Government policies and guidelines.
NRCS vision
The vision of the NRCS is a safe, competitive and prosperous South Africa in which we collaborate with our partners to promote environmental sustainability and contribute to a world-class technical infrastructure.
NRCS mission
The mission of the NRCS is to protect the interests of South Africans by developing and ensuring compliance with a system of compulsory specifications and technical regulations. The specifications and technical regulations cover a range of products that may impact on the safety of consumers.
Strategic Overview3Strategic outcome-orientated goals
The mandate of the NRCS will be executed by pursuing the following four key strategic goals
• Strategic Goal One: To develop, maintain and administer compulsory specifications and technical regulations
• Strategic Goal Two: To maximise compliance with all specifications and technical regulations
• Strategic Goal Three: To inform and educate our stakeholders about the NRCS
• Strategic Goal Four: To ensure an optimally capacitated institution
Each of these goals is described by a key metric in the Annual Performance Plan that will track progress made towards achieving these goals over time. Each goal will also have strategic projects or initiatives that will create focused actions with clear accountabilities.
LEGISLATIVE AND OTHER MANDATES Legal form of entity
Schedule 3A Public Entity, in terms of the PFMA
Legislative frameworks
The legislative frameworks under which the NRCS performs its tasks (on behalf of the dti) are:
• The National Regulator for Compulsory Specifications Act, No.5 of 2008
• Trade Metrology Act, No.77 of 1973• National Building Regulations and Building
Standards Act, No.103 of 1977• Public Finance Management Act (PFMA), 1999
(Act No. 1 of 1999)• Other applicable legislation

7NRCS Annual Report 2013/2014 6 NRCS Annual Report 2013/2014
The year 2014 marks the 20th anniversary of our democracy. Given this historic occasion, the Presidency has commissioned a range of papers to review 21 thematic areas related to South Africa’s development. These include topics such as democracy and citizenship, non-racialism and social cohesion, spatial development, the judiciary, the economy, the environment and employment.
Government encourages departments, agencies and society to reflect on the progress made and the challenges that the nation has faced over the past 20 years.
Government has tabled the National Development Plan and New Growth Path as the job driver within which the Industrial Policy Action Plan (IPAP) was
Foreword by the Minister 4
identified. IPAP has become the centrepiece of the Department of Trade and Industry’s (the dti’s) work and that of its agencies, with all our actions being co-ordinated around and aligned to it.
Each year, the dti launches a revised three-year rolling IPAP with a ten-year outlook in a context of rapid economic change and significant global uncertainty. The latest version of IPAP demonstrates the dti’s commitment to constantly refine and improve on the design and implementation of its industrial policy.
“Compulsory Specifications/Technical Regulations specify technical requirements that are made mandatory by legislation in terms of any Act of Parliament or the Regulations to any Act. Such Technical Regulations may refer to requirements in an international or national standard, thereby making those mandatory.”
The technical infrastructure institutional framework supports industrial development through maintenance and improvement of compulsory specifications as well as regulations that require accredited testing, calibrations, inspections, certification and verification services in order to provide evidence of compliance. Accurate and internationally recognised standards of measurement performed in industry are an important
Dr Rob Davies Trade and Industry Minister
7NRCS Annual Report 2013/2014 6 NRCS Annual Report 2013/2014
factor for competitiveness in international trade. Compliance with regulations, standards, labelling requirements and other specifications has to be demonstrated for every batch of goods that the NRCS monitors. The development of world-class testing, calibration and certification capabilities is of great value in scaling up and resuscitating manufacturing industries, while simultaneously contributing to broader social benefits. Great strides have already been made with focused enforcement programmes, targeting the main South African border posts, coupled with a visible media campaign to broadcast the seizure and destruction of non-compliant products by the NRCS. The cooperation and partnerships between the South African Revenue Services (SARS), the South African Police Service (SAPS), other parties and the NRCS have contributed to this success. The NRCS plays a critical role in curbing various forms of fraudulent and illegal imports as well as harmful sub-standard products imported into the country – all of which undermine productive capacity and employment growth across a wide range of sectors in South Africa. A range of compliance assessment tools including sampling, inspections and sanctioning of products, as well as examination of documentary evidence are undertaken to realise this mandate with the objective of locking out sub-standard, unsafe, non-compliant and harmful products from our market and to lock-in foreign markets for South African manufactured goods.
“Sampling is a sub process carried out during market surveillance inspection. Sampling is done at two levels; sampling of products from a batch for inspection and sampling of products from a batch for testing and/or for keeping a “reference sample” for future use.”
To date, approximately R438 million worth of non-compliant and unsafe products have been seized and removed from the market. In addition to the negative impact on the health and safety of South African consumers and the environment, non-compliant products have a significant impact on the South African economy. It is important for industry and
in particular, importers, to adhere to the prescribed rules and regulations and not supply the market with unsafe, non-complaint goods.
the dti has supported the NRCS and will continue to do so in its endeavour to realise its full mandate. In order to position the national technical infrastructure appropriately by ensuring that it continues to meet the changing needs of industry, the dti adopted a policy to modernise the Trade Metrology legislation by expanding its scope to Legal Metrology. The Legal Metrology Bill has now been passed by Parliament. It is aimed at promoting fair trade, industrialisation and enhanced protection for both the environment and public health and safety. Its main measures are to expand and strengthen the scope of Trade Metrology and enforce Legal Metrology, protect consumers against inaccurate measures and support local industrial competitiveness.
The strengthening of the enforcement of Legal Metrology within an appropriate legislative framework supports industrial development by “locking out” inferior goods. It will furthermore protect consumers against short measure and inaccurate measurement and also level the playing field for industry, as measures should be equivalent across the country. By harmonising South African Legal Metrology regulations with international requirements, the competitiveness of South African exporters will be enhanced.
The Bill also addresses corporate governance as contained in Clause 42, as well as Schedule 2 to the Bill. The signing of the Bill will introduce a new governance structure where the Agency’s Chief Executive Officer will report directly to the Minister of Trade and Industry.
Legal Metrology impacts on our everyday lives in that it refers to measurements in trade such as the weight of consumer goods, be it meat purchased from a butchery or a pre-packed staple such as mealie meal or the volume of fuel that we purchase daily. If these products are not accurately measured, consumers may not get what they are paying for.
It will in future also include measurements related to health, safety and the environment such as measurements related to blood pressure instruments and baby scales, where incorrect diagnosis could be

9NRCS Annual Report 2013/2014 8 NRCS Annual Report 2013/2014
fatal, as well as breath analysers and exhaust gas analysers. This legislation relates to the technical infrastructure – the Standards, Quality Assurance, Accreditation and Metrology-system that provides an objective basis for competitiveness in the economy. The legislation improves the responsiveness of this system to the needs of the South African economy.
the dti is also in the process of reviewing the National Building Regulations and Building Standards Act (NBR & BS Act), No. 103 of 1977 to make it more effective. The legislation was promulgated several years ago and has not kept pace with the developments in the building industry.
On behalf of the dti, I wish to thank the NRCS for the sterling work done but more importantly its commitment to assist the dti in realising its objectives and supporting government priorities. Through our collective efforts, much has been achieved; however, we are mindful of the challenges that lie ahead of us.
Dr Rob Davies Trade and Industry Minister

9NRCS Annual Report 2013/2014 8 NRCS Annual Report 2013/2014
Report of the Chairperson5
The National Industrial Policy Framework and successive iterations of IPAP provide a policy and programme fulcrum for the work of the dti and its affiliated agencies, enabling alignment and integration of its work within the strategic vision of a more equitable society, provided by the National Development Plan and the programmatic perspectives set out in the New Growth Plan.
The work of the NRCS, as an entity of the dti, is informed by action plans and programmes set out in the IPAP goals in keeping with the Department’s constitutional mandate and mission statement. Equally, the successful implementation of the IPAP programmes and actions plans requires coordination and partnerships with other government institutions.
There are no quick fix solutions for industrial development, especially in the face of extremely strong headwinds such as the economic meltdown and its aftermath on the global economy; the deep structural problems which characterise the domestic economy; and the constraints and tactical challenges that have to be overcome. Though much has been achieved and learned, more still needs to be done.
The Board and management of the NRCS are committed to doing everything to contribute towards securing a collective social agenda that will allow the NRCS to address South Africa’s most pressing developmental challenges with renewed urgency and decisiveness. Our approach to industrial development means never losing sight of our constitutional mandate as the organisation to contribute towards building an inclusive values- and rights-based economy and society. As such, the Board and management continuously consider and review the need for new or amended technical regulations and compulsory specifications to improve delivery on our mandate.
In addition to the IPAP deliverables, the Board and management have developed a three-year (2013–2016) annual performance plan, as well as a five-year (2013–2017) strategic plan. Both these documents are aligned to a number of strategic documents of government which include the National Development Plan (NDP), as well as various policies and action planning frameworks of the dti, such as the South African Trade Policy and Strategy Framework, and the Industrial Policy Action Plan (IPAP).
The NRCS’s Strategic Plan gives direction to the activities of the organisation to ensure that its
Mr Jeff Molobela Chairperson of the NRCS Board
11NRCS Annual Report 2013/2014 10 NRCS Annual Report 2013/2014
specific deliverables are achieved in a manner that is consistent with its mandate, which involves undertaking surveillance inspections and approvals, and – where necessary – implementing sanctions.
The NRCS’s Strategic Plan intends to achieve the following:
• Enhance the quality of life of all South African citizens by ensuring their health and safety, as well as protecting the environment and maintaining fair trade
• Support the economy by strengthening existing markets and opening up new markets through exports
• “Lock-out” the import of products that do not comply with compulsory specifications
The NRCS will continue to build the capacity required to analyse, co-ordinate and implement effective programmes underpinned by sound research; forging strong partnerships and stakeholder engagement; rigorous programme oversight; and open-minded ‘discovery’ with respect to what works and what does not.
The Board has also resuscitated the NBR Review Board and through its recommendation, the Chairperson of the Review Board was officially appointed by the Trade and Industry Minister, Dr Rob Davies on 1 June 2013. Fourteen cases were subsequently registered for consideration by the Review Board out of which three were concluded, eight are ready for tribunal, three were withdrawn and one is proceeding through the appeal process.
Through its committees, the NRCS Board has also made some significant strides in addressing governance-related issues. Furthermore, uncertain as the global economic recovery may be, technological change continues at breakneck speed. It is already common cause that we have entered a new wave or ‘second machine age’ driven by additive manufacturing; exponential progress in computing, telecommunications and digital access to knowledge; composite and new materials; and the drive for energy efficiency and climate change mitigation. In keeping afloat in a high-tech digitised world, the Board has established the ICT Steering Committee to deal with all IT governance and related procedures and practices.
The Board also remains committed to maintaining good industrial and labour relations in the workplace and thus engages proactively with all stakeholders in a manner that is beneficial to the long-term sustainability of the entity. Finally, it is our resolve to do more in the years to come, but our success will be underpinned by the support of all our stakeholders, including the dti and other government departments and agencies. Our efforts are strengthened immeasurably if we work together to move the country forward.
My heartfelt thank you goes to the Minister of Trade and Industry for his continued guidance and insight. Also, the support that the NRCS continues to receive from the dti is much valued. To my fellow Board members, thank you for your dedication and unwavering support during the period under review. To the Executive Officer and all staff members - thank you for your professionalism and commitment.
This report provides a detailed overview of the activities and overall performance of the NRCS for the year ended 31 March 2014.
Mr Jeff MolobelaChairperson of the NRCS Board

11NRCS Annual Report 2013/2014 10 NRCS Annual Report 2013/2014
Report of the
Chief Executive Officer6
Government’s industrial policy interventions without the actions of all the stakeholders, can never be enough to confront the many challenges that undermine our economy. These require disciplined and principled joint efforts on the part of all the state agencies, industry players and social partners. Global experience has shown that yesterday’s commanding economic orthodoxies can become today’s failed projects, especially where country-specific context and dynamics are not properly factored in.
The NRCS’s role as a regulator is to ensure that businesses produce, import or sell products or services that are not harmful to consumers and the environment, or that do not fall short of the declared quantity of measurement. The NRCS is also tasked to provide a regulatory function for the building industry
to ensure building safety, health, structural stability, and the uniform interpretation and implementation of the Act and Building Regulations.
Economic overview
Economic growth is the key component in the alleviation of poverty and unemployment. Economic studies have proven that productivity is the determinant of long-term health and prosperity of an economy. Institutions like the NRCS provide a level playing field for industry participants to adhere to set rules for entrance into the South African and world market. As an open economy South Africa plays a significant role in the world market, which provides a platform for a significant role within the SADC Technical Infrastructure through spill overs and knowledge transfer.
South Africa’s economic growth rate for the year under review was 2%. Notably the agriculture, forestry and fishing industry experienced a decrease of 1,9% year on year, and this statistic is reflected by low local fishery productions and consignments for the year under review as compared to imported products. The NRCS inspected 13 124 imported frozen fishery products and canned fish and meat consignments as compared to 6 159 local consignments and productions. In the year under review, the growth in the number of imported automotive and electrotechnical products, paraffin stoves and plastics tapered off, as reflected by the number of applications for Letters of Authority received during the year.
It is extremely difficult to separate the role that the NRCS plays in the South African economy from the role government plays in economic development and
Mr Asogan Moodley NRCS Chief Executive Officer
13NRCS Annual Report 2013/2014 12 NRCS Annual Report 2013/2014
economic benefits of standards, because the regulator plays an integral part in many micro-economic and social activities. The NRCS technical regulations’ impact cannot reasonably be aggregated into a single measure, because of the diversity and impact of the NRCS on the entire manufacturing and retail sectors. Albeit at a micro level the NRCS ensures that non-complaint, unsafe products and products that did not adhere to the declared quantities, were removed from the South African market through the leveling of the playing field, thereby “locking in” compliant products and ‘locking out” non-compliant products.
Planned policy initiatives driven by the dti in support of the NRCS’s work
The Legal Metrology BillThe NRCS welcomes the policy initiatives by the dti such as the movement from Trade Metrology to Legal Metrology. The Legal Metrology Bill replaced the Trade Metrology Act, No.77 of 1973, which was outdated and did not provide for the regulation of Legal Metrology measurements but was limited to weights and measures. Legal metrology will afford the same kind of assurance to additional measurements such as those with respect to water consumption, speeding on the roads or blood pressure determinations.
In addition, the Bill mandates the NRCS to participate in the International Organisation of Legal Metrology (OIML). The OIML is a treaty organisation that was established in 1955. Currently it has 59 member states and 67 corresponding members. South Africa acceded to the OIML in 1998. The OIML was established to disseminate information on legal metrology laws and regulations, the development and promotion of international best practice, elimination of barriers to trade caused by legal metrology and to develop and promote mutual acceptance agreements in legal metrology. Where OIML regulations are available, the NRCS will use those as a basis for its regulations. It is important to note that this Bill forms part of our ongoing effort to provide a strong basis for industrial development.
It was agreed that the NRCS could not implement the new Legal Metrology Act without the industry’s support. This is also reflected in the continued provision for the use of accredited verification bodies and the provision for cooperation with other organs of state to avoid duplication in terms of market surveillance
inspections. The NRCS is currently training candidate legal metrology officers in order to provide a more effective service to the economy.
“Market surveillance inspection means any activity of the National Regulator, other than testing, concerned with determining, either directly or indirectly, whether any or all of the requirements of a compulsory specification are met.”
This Bill provides for a new financing model for legal metrology, similar to the structure that the NRCS uses for funding of compulsory specifications. Fees will be determined per legal metrology technical regulation, based on the cost that the regulator incurs to effectively and efficiently regulate. Regulatory costs that need to be covered include: type approvals, verifications, inspections, consultations, awareness campaigns, impact assessments and risk assessments. The funds of the NRCS will consist of money that is appropriated by Parliament and fees collected for services provided. These fees are consulted with industry annually and have to be approved by both the Ministers of Trade and Industry and Finance. Fees are published in the Government Gazette.
NRCS Flagship Projects
Market surveillance and regulatory supervisionIn response to the regulatory landscape of today, the NRCS adopted the border or port of entry (source) inspections as well as a risk-based approach to its enforcement surveillance activities. These two initiatives have yielded positive results for the organisation which saw approximately R153 million worth of products being destroyed during the period under review.
The success of the border enforcement project was augmented by the support and enhanced collaboration from stakeholders such as the South African Revenue Services (SARS), South African Police Service (SAPS), Department of Health and Department of Agriculture, Forestry and Fisheries to maximise compliance with technical regulations.
13NRCS Annual Report 2013/2014 12 NRCS Annual Report 2013/2014
Border enforcementThe NRCS, in giving effect to IPAP Phase 3, conducted studies at the ten targeted ports of entry, namely the airports of OR Tambo and Cape Town; and the inland ports of Beitbridge, Oshoek, Ficksburg, Maseru Bridge, Ramatlabama, Kopfontein, Skilpadshek and Golela.
The border enforcement project has yielded positive results for the organisation in curbing non-compliant products in the market. A six week peak season blitz at three major ports of entry; the harbours of Cape Town and Durban, and the dry port of City Deep in Gauteng, resulted in R11.4 million worth of non-compliant products being detected and confiscated, with a non-compliance rate of 7.9% for NRCS-regulated products. The presence of the NRCS at the ports of entry has also resulted in an increase in LOA applications for pre-market approval of products. The NRCS actively participated in various Border Control Operations Coordinating Committee (BCOCC) meetings across the country. The organisation built strong relations with SARS and SAPS, other port of entry regulators, as well as stakeholder groupings representing freight forwarders and shipping lines.
Energy efficiency The NRCS has been part of a national steering committee on the DOE-led initiative on the Energy Efficiency Standards and Labelling Project. The regulator has been mandated to play a major role in energy efficiency to contribute in meeting the national target of reducing the energy intensity by 12% by 2015. The NRCS is required to adequately prepare to enforce energy efficiency requirements in compulsory specifications which are currently under development, including incandescent lamps and household appliances.
Operational Performance Information
ApprovalsThe NRCS processed 8 620 applications for letters of authority, of which 73.5% were for electrotechnical products destined for the local market, 22% for automotive products and 4.5% for applications received from the chemical, mechanical and materials industries.
Market surveillanceThe organisation inspected all declared locally produced and imported fishery and associated products for compliance. The total number of inspections for local consignments and productions amounted to 6 159 and 13 124 consignments for imported fishery and associated products. In promoting South African products and facilitating trade, the NRCS issued health guarantees for 18 780 fisheries and associated product consignments destined for the European Union and the Far East.
The NRCS undertook 5 192 inspections against a target of 4 960 for chemical, mechanical and materials products and industries, which represents an achievement of 4,68% over the planned target. In respect of electrotechnical products and industry, the NRCS conducted 4 338 inspections, representing an achievement of 8.45% over the planned target, while the Automotive Business Unit undertook 4 054 inspections, which represented an achievement of 1.35% over the planned target. Furthermore the Legal Metrology Business Unit conducted 4 287 market surveillance inspections, 8.5% more than the inspection target for the year.
The Legal Metrology Business Unit received 153 applications for type approval from instrument manufacturers and suppliers and issued 94 certificates of approval for instruments that passed all requirements and tests. The approval of certificates allows submitters to manufacture or import any number of replicas of the approved instrument for use in terms of the Act. The Business Unit received applications from the gaming and gambling industry for the evaluation of gaming hardware and software and 890 letters of certification (LOC) were issued.
Information TechnologyThe NRCS ICT has been tasked with implementing an IT infrastructure capable of meeting the NRCS IT needs and assisting in enabling the achievement of strategic goals. Since inception, the NRCS utilised the SABS IT infrastructure. In February 2013, the NRCS started implementing services on a new platform. This move was finalised on 2 September 2013. The IT infrastructure experienced problems with servers on the virtualised platform, dropping connection to the shared storage which led to downtime being
15NRCS Annual Report 2013/2014 14 NRCS Annual Report 2013/2014
experienced. The NRCS and the service provider have resolved the problem by utilising hard drives for the operating system.
The NRCS is in the process of finalising the development and implementation of a Customer Relationship Management (CRM) system which is key in aiding the NRCS’s operational needs. The system will aid in the inspection process, management of clients, and allow for the inspectors’ results to be recorded electronically. The system is in its final stages of development and the service provider and business are currently busy reviewing and streamlining processes to ensure that the system meets organisational needs. The CRM project was initiated in 2010 and the project was estimated to be completed in 12 months, ending 28 February 2011. The delays are due to challenges associated with the project, including the suspension of the project to allow for investigations, no documented business process being available and non-availability of key stakeholders.
IT and business are in the process of procuring an Enterprise Resource Planning (ERP) system which will include human resources needs, payroll needs and financial management requirements. This process is in the planning phase with the “requirements gathering” process finalised.
NRCS facilities
To cover the regulated market efficiently, the NRCS’s head office is located in Pretoria and has four regional offices with satellite offices in Hermanus, Mossel Bay and the West Coast. The NRCS’s regional offices are in Cape Town, Durban, Port Elizabeth and Bloemfontein. All facilities are leased and the NRCS will in the 2014/15 financial year conduct a feasibility study on future office options such as ownership. The NRCS owns property in Port Elizabeth which is currently not occupied. The NRCS Board resolved to refurbish the building with the view to relocate the staff in the Port Elizabeth office to the NRCS building. The National Treasury gave approval to retain surpluses for the purposes of refurbishing this property. In March 2014 the NRCS contracted a service provider to provide architectural services.
The Board and management of the NRCS attach great value to the organisation’s principal asset – its staff, through which the organisation renders its service to the nation. Management is thus working with organised labour and is continuously seeking staff views to create the best working environment. During the 2012/2013 financial year, the NRCS experienced considerable instability in the work environment. Concerted effort was accorded to negotiate with organised labour and two wage settlement agreements, signed in July 2013 and May 2014, have resulted in relative stability. The training and development function is also receiving attention to reduce capacity constraints.
The operating Business Units are undertaking business improvement and capacitation processes to identify medium- to long-term needs. This initiative will strengthen the regulator’s footprint and coverage in areas of strategic importance. The organisation is determined to continue to further enhance its services in ensuring compliance at all levels. It will continue to identify gaps in regulation to ensure consumer protection in an ever-changing global market.
Human Resources
During the last two financial years, the NRCS experienced labour instability as a result of wage demands from organised labour, as well as remunerative entitlements that arose from the separation of the NRCS from the SABS. Whilst the CCMA ruled on the matter relating to the “tool of trade” allowance, a mediator was appointed by the dti to resolve the impasse between the NRCS and organised labour. The mediation effort resulted in the NRCS accepting an assessment from Deloitte and Touche with regard to the grading of NRCS posts as well as other outstanding matters.
The settlement agreements resulted in a significant increase in employment costs as reported in the Annual Financial Statements. The settlement agreement impact in the 2014 financial year includes a basic increase in salaries of R4.5 million, the introduction of employers’ contribution to the pension fund of R1.1 million and other adjustments as a result of late settlement of the agreement of R0.56 million.
15NRCS Annual Report 2013/2014 14 NRCS Annual Report 2013/2014
A wage settlement agreement that resulted in a general increase in salaries for bargaining level staff members was signed for both the 2011/12 and 2012/13 financial years. Furthermore, a similar settlement was also reached with management staff that also resulted in increased salaries.
Governance
During the year under review, the Finance Unit reviewed its operating processes, implemented stronger internal controls and enhanced operating procedures. The Unit was assisted in this task by the numerous internal audit reports issued. Our Audit and Risk Committee continues to play a significant role in the governance architecture of the NRCS while the Board and its committees continue to provide the leadership and direction necessary to move the organisation forward. Management is deeply indebted to the Board and its committees for the dedicated leadership.
The NRCS received unconditional support from the Minister and management of the dti which enables it to overcome some significant challenges. The NRCS is looking forward to such continued support.
Mr Asogan Moodley Chief Executive Officer

17NRCS Annual Report 2013/2014 16 NRCS Annual Report 2013/2014
NRCS Board Members7
Mr Asogan MoodleyCEO of NRCS
Prof Sadhasivan PerumalBoard Member
Mr Sipho ZikodeBoard Member (the dti)
Mr Paul Serote Board Member
Mr Nico MW Vermeulen Board Member
Ms Elizabeth (Lilibeth) Moolman Board Member
Ms Funzani Asnath Melato Board Member
Ms Dora Ndaba Board Member
Mr Jeff Molobela Chairperson of the NRCS Board
17NRCS Annual Report 2013/2014 16 NRCS Annual Report 2013/2014
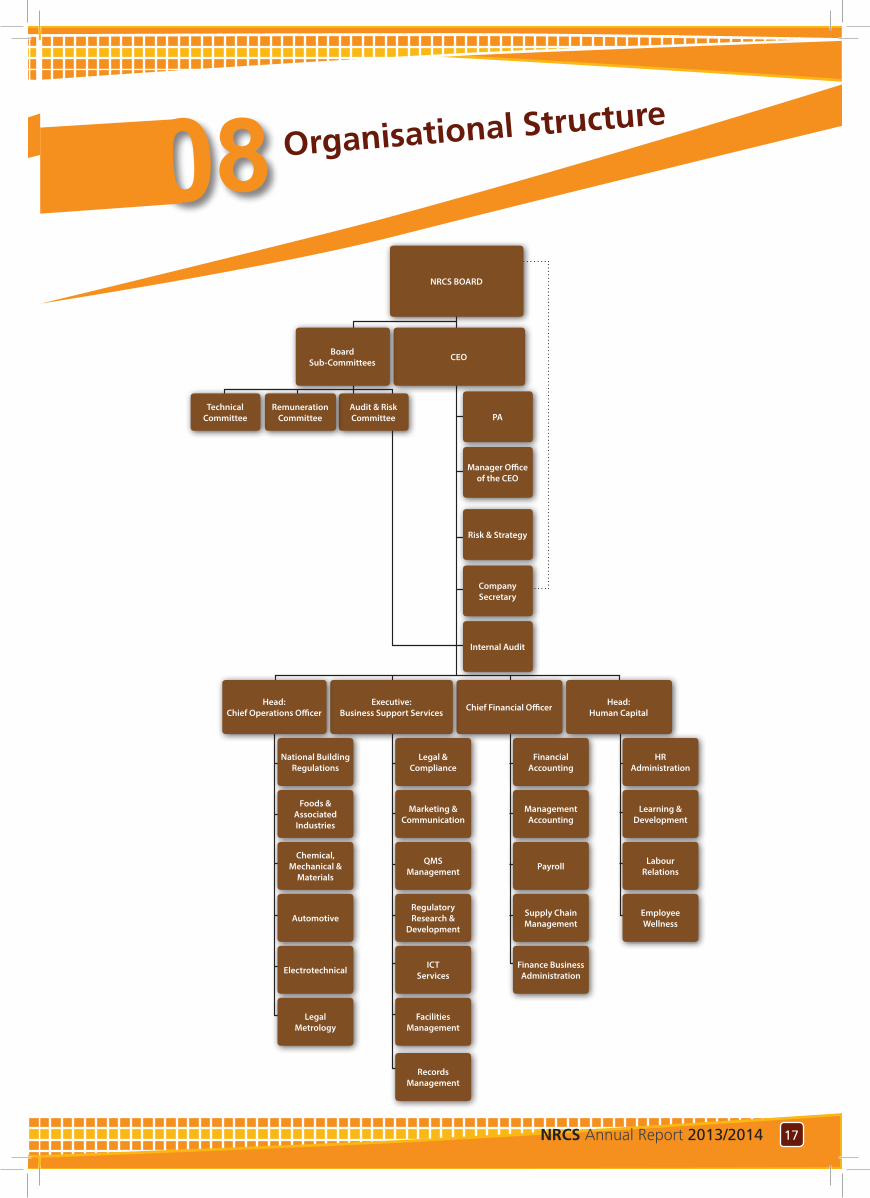
Organisational Structure 8NRCS BOARD
CEOBoardSub-Committees
Audit & RiskCommittee PA
Manager Office of the CEO
Risk & Strategy
Company Secretary
Internal Audit
Chief Financial Officer Head: Human Capital
Executive: Business Support Services
Head: Chief Operations Officer
RemunerationCommittee
TechnicalCommittee
FinancialAccounting
Legal &Compliance
Marketing & Communication
QMS Management
Regulatory Research &
Development
ICT Services
FacilitiesManagement
Records Management
National Building Regulations
Foods & Associated Industries
Chemical, Mechanical &
Materials
Automotive
Electrotechnical
Legal Metrology
Management Accounting
Payroll
Supply ChainManagement
Finance Business Administration
HRAdministration
Learning & Development
Labour Relations
EmployeeWellness
19NRCS Annual Report 2013/2014 18 NRCS Annual Report 2013/2014
The Chief Executive Officer is responsible for the preparation of the public entity’s performance information and for the judgements made in this information.
He is responsible for establishing and implementing a system of internal controls, designed to provide reasonable assurance as to the integrity and reliability of performance information.
In my opinion, the performance information fairly reflects the actual achievements against planned objectives, indictors and targets as per the strategic and annual performance plan of the NRCS for the financial year ended 31 March 2014.
The NRCS’s performance information for the year ended 31 March 2014 has been examined by the external auditors. This report is presented on page 62 to 65.
The performance information of the entity set out on page 43 to page 47 was approved by the Board.
Mr Asogan Moodley Chief Executive Officer31 July 2014
PART B -
Performance Information9
STATEMENT OF RESPONSIBILITY FOR PERFORMANCE INFORMATION
19NRCS Annual Report 2013/2014 18 NRCS Annual Report 2013/2014
01 Automotive Business Unit
Overview
The Automotive Business Unit administers compulsory specifications for motor vehicles and certain identified motor vehicle replacement components in accordance with the NRCS Act. Additional powers to the Automotive Business Unit are granted by the Department of Transport in accordance with the National Road Traffic Act, No. 93 of 1996, wherein the NRCS is appointed as the Inspectorate of Manufacturers, Importers and Builders of Motor Vehicles. The Business Unit’s strategic partners include government organisations such as the dti, National and Provincial Departments of Transport, consumers, automotive industry as well as other parties affected by regulatory activities. Our strategic partners also include foreign governments and regional groupings such as the Southern African Development Community (SADC) and national and international organisations of which we are members, such as the World Forum for the harmonization of Motor Vehicle Regulations.
Our strategic stakeholders, with whom we share a common purpose, assist us in executing our mandates effectively. These stakeholders include but not limited to:
• SARS/Customs Unit in providing effective import control at all ports of entry
• SAPS, where there is evidence/suspicion of illegal vehicles in the market, or where illegal conversion
of motor vehicles or use of Manufacturers, Importers and Builders (MIB) status takes place
• UNECE (United Nations Economic Commission for Europe), in the harmonization of technical regulations with international regulations as required in terms of the WTO (World Trade Organisation) Technical Barriers to Trade Agreement
• SADC (Southern African Development Community), to further the harmonization of technical regulations in the region in support of the SADC Trade Protocol and wherever possible, provide assistance to SADC member countries with the establishment of an infrastructure to implement and administer technical regulations
• SABS
Overall performance
Market surveillanceThe Automotive Business Unit conducts market surveillance inspections and is also mandated by the National Road Traffic Act (NRTA Act), No. 93 of 1996, to conduct inspections of all Manufacturers, Importers and Builders MIBs of motor vehicles within South Africa. As the inspectorate of MIBs, automotive inspectors conduct inspections at the physical location of the MIBs to evaluate the suitability for registration as an MIB and recommend to the Department of Transport. Inspections are also conducted at manufactures
21NRCS Annual Report 2013/2014 20 NRCS Annual Report 2013/2014
and importers premises as well as market place after homologations/approvals are granted. For the period under review, the Business Unit conducted 4 054 inspections, including 163 border inspections in line with the risk-based approach to NRCS work.
“Homologation is a confirmation by the NRCS that the model of the motor vehicle or replacement component which has been submitted by the applicant, an importer or manufacturer of a regulated product, meets the requirements of the relevant compulsory specification or technical regulation.”ApprovalsThe Business Unit conducts homologations (pre-market approvals). During the period under review, the Automotive Business Unit issued 5 800 approvals. These approvals were related to vehicles, as well as certain vehicle components, spanning the entire scope of the Business Unit including the following: light passenger vehicles (M1), buses (M2 and M3), light commercial vehicles (N1), heavy commercial vehicles (N2, N3), trailers (O1, O2, O3, O4), agricultural tractors (U), motorcycles (L), child restraints, lights, tyres, safety helmets for motor cyclists, replacement brake linings assemblies, replacement safety glass, towing devices (tow bars), elastomeric cups and seals and replacement incadescent lamps, as well as hydraulic brake and clutch fluid.
“A Pre-market approval is a confirmation by the NRCS that the model which has been submitted by the applicant, an importer or manufacturer of a regulated product, meets the requirements of the relevant compulsory specification or technical regulation before being introduced to the market.”SanctionsThe Automotive Business Unit contributes to the eradication of non-compliant products from the
South African market by imposing sanctions on companies that do not comply with the requirements of the compulsory specifications. Seventeen directives were issued for non-compliant products such as tyres, brake material, motorcycle helmets and towbars during the period under review. Other non-compliant products including child restraints, tyres, seals and motorcycle helmets to the value of R231 490 were destroyed during the last quarter of the financial year.
Stakeholder engagement
During the period under review, representatives of the Automotive Business Unit actively participated in the following stakeholder interactions:
• Working Party 29 (WP29 and working groups) Harmonisation of Motor Vehicle Regulations
• Department of Transport (DoT) Automotive Forum• DoT Vehicle Technical Committee• DoT Interprovincial Policies and Procedures Meeting• DoT Abnormal Loads Committee • South African Police Service (SAPS) Vehicle Crime
Forum• National Association of Automobile Manufacturers
of South Africa (NAAMSA)/NRCS Automotive Forum
• Retail Motor Industry (RMI)• South African Bus Operators Association (SABOA)
Technical Committee • SABS T.C’s
Challenges
Despite the overall good performance by the Business Unit, there remain challenges that need to be resolved for the Business Unit to completely realise its objectives. Some of the challenges include evasive behaviour by MIBs in terms of continuous compliance after initial approvals. This is more prominent where certain grey areas exist within the Road Traffic Act and NRCS Act, hindering effective regulation. Other challenges include, the control mechanisms within the vehicle licensing authorities nationally in terms vehicle registrations and limited availability of accredited local testing facilities for certain products such as tyres, safety helmets for motorcyclists, brake fluid and category L vehicles. The turnaround times for the test results and the rising costs of testing have also been a concern over the years.
21NRCS Annual Report 2013/2014 20 NRCS Annual Report 2013/2014
The challenge remains where incomplete applications are received, resulting in unnecessary delays.
The implementation of the border inspections for the Business Unit was challenging, even though the overall target of 4 000 inspections was exceeded by 1.35%. These challenges will be resolved through efforts to focus on the accurate profiling of containers at the various ports in the next year.
Conclusion
The Automotive Business Unit continues to work closely with industry to ensure that all approvals are processed within the turnaround times.
In order to address the above challenges, it will be essential to work closely with our external stakeholders, including the DoT, SABS and industry representative organisations.
The Automotive as well as the Regulatory, Research and Development Business Units will consider all current compulsory specifications that need revision, paying special attention to testing requirements in the new year.

23NRCS Annual Report 2013/2014 22 NRCS Annual Report 2013/2014
Chemical, Mechanical and
Materials Business Unit
Overview
The Chemical, Mechanical and Materials (CMM) Business Unit is responsible for the administering of compulsory specifications that cover the following industry sectors:
• Personal protective equipment (safety footwear and respiratory protective devices)
• Flotation devices and swimming aids, firearms and associated products (firearms and shooting ranges)
• Flame-producing devices (paraffin stoves, heaters and cigarette lighters)
• Health-related products (microbiological safety cabinets and disinfectants)
• Construction materials (cement and treated timber)
• Products that affect the environment (plastic carrier bags and coal-burning stoves)
In addition the CMM Business Unit performs a regulatory function on behalf of the following government departments:
• The Department of Health on the regulation of microbiological safety cabinets, disinfectants and detergent disinfectants
• The Department of Labour and the Department of Mineral Resources on the regulation of various
types of personal protective equipment, such as respirators and breathing apparatus
• The Department of Energy on the regulation of paraffin stoves and heaters
• The South African Police Service on the regulation of shooting ranges and firearms
• The Department of Environmental Affairs on the regulation of plastic bags and plastic carrier bags
The activities of the Business Unit, in the administration and maintenance of compulsory specifications, involve the processes of pre-approval, market surveillance inspection, sampling and sanctioning.
Overall performance
Market surveillanceThe CMM Business Unit conducted 5 192 market surveillance inspections, exceeding its target of 4 960 for the period under review.
ApprovalsThe CMM Business Unit issues pre-market approvals for regulated products. These pre-approvals are issued after evaluating submitted evidence of compliance against the relevant compulsory specifications. During the period under review, the Business Unit achieved its set target of carrying out pre-market approvals within the turnaround time. A total of 389 approval certificates were issued to various commodities
11
23NRCS Annual Report 2013/2014 22 NRCS Annual Report 2013/2014
regulated by the Business Unit. Thirty-nine out of 460 applications were rejected during the period under review.
SanctionsDuring the 2013/2014 financial year, a total of 120 CEO directives and 50 Board directives were served on manufacturers and importers of non-compliant goods for failure to comply with the health and safety requirements as detailed in the various compulsory specifications.
Stakeholder engagement
As part of its stakeholder engagement strategy, CMM Business Unit held a meeting with representatives from the Personal Protective Equipment industry to discuss the implementation of the Safety Shoes Compulsory Specification. The Business Unit also met with the South African Maritime Safety Authority (SAMSA) to discuss common challenges faced by both organisations on the regulation of personal flotation devices. An agreement was reached on the process to be followed to ensure both NRCS and SAMSA requirements are met by industry in the future. During 7 to18 October 2013, the CMM Business Unit conducted focused plastic bags and disinfectants inspections as part of its compliance intervention in KwaZulu-Natal, covering areas such as Springfield, Inanda Road, the Workshop, Phoenix Industrial Plaza, Briardene and Overport. Nine CEO directives were served and 329 bales of plastic bags were confiscated.
The CMM Business Unit also participated in a joint operation with the South African Police Services’ Border Police and Counterfeit Business Unit, Department of Agriculture, Forestry and Fisheries, South African Revenue Services’ Customs Unit and brand holders.
During this operation commodities such as plastic carrier bags, flame producing devices and swimming aids were seized, valued at R5 million.
The Business Unit also held industry-specific meetings in Pretoria, Durban and Port Elizabeth to discuss the implementation of the new Compulsory Specification for Plastic Bags (VC8087:2013) that came into effect on 6 March 2014.
As part of the NRCS outreach programme, the Business Unit distributed 120 compliant paraffin stoves in exchange for non-compliant stoves to the community of Emfuleni in the Western Cape on 20 June 2013.
Highlights
The Business Unit acted on a tip-off from industry regarding non-compliant disinfectants products and confiscated 9 491 bottles (500ml) of non-compliant imported Dettol and 735 bottles (750ml) of Domestos Extended Germ Kill which did not comply with disinfecting efficacy tests as specified in VC8054. A nation-wide recall of the products was initiated.
Challenges
A major challenge is to find suppliers that can destroy non-compliant goods such as disinfectants and cigarette lighters in an environmentally-friendly manner. The Business Unit is also affected by delays in testing due to the long turn-around times at testing facilities. The CMM Business Unit is affected by wilful evasion by industry, shunting their non-compliant products from province to province, in order to avoid detection. There has also been a trend in certain sectors to try and delay the implementation of new compulsory specifications, claiming that industry is not yet fully prepared for such compliance.
CMM Business Unit products that were confiscated were destroyed in Port Elizabeth, Durban, Cape Town and Pretoria. These included:
• Non-pressurised paraffin stoves and heaters • Cigarette lighters • Plastic carrier bags• Disinfectant and detergent-disinfectants • Swimming aids that assist users with movement
through water while learning to swim • Respirators (dust masks)
Products such as disinfectants were imported. As these products had not been registered with the NRCS as required by law, their compliance with safety requirements could not be ascertained.
25NRCS Annual Report 2013/2014 24 NRCS Annual Report 2013/2014
Conclusion
The CMM Business Unit exceeded the inspection targets by conducting 5 192 inspections against a target of 4 960. An estimated total of R2 018 977 worth of non-compliant products were destroyed during the period under review. The Business Unit has, through applying the risk-based approach strategy, identified paraffin stoves as high risk items which require close monitoring and high visibility of inspectors to protect consumers. Non-compliant paraffin stoves have dire consequences leading to death, resulting from fires. The shift to locking out non-compliant products before they enter the market will play a major role in addressing this problem, as paraffin stoves and heaters are mainly imported.

25NRCS Annual Report 2013/2014 24 NRCS Annual Report 2013/2014
Electrotechnical Business Unit
Overview
The Electrotechnical Business Unit regulates various categories of electrical and electronic products, covered by 17 compulsory specifications, ranging from household appliances, power tools, ICT equipment, audio visual equipment and lighting components to other electrical components such as plugs, adaptors and switches. In addition, the Business Unit operates under the mandate of other government departments such as the Department of Labour regarding the approval of components of fixed electrical installations and the Independent Communications Authority of South Africa (ICASA) regarding electromagnetic compatibility and interference of certain electrical and electronic apparatus.
The Electrotechnical Business Unit processes include the approval of products before they enter the market, conducting market surveillance inspections, sampling of products from the market for testing at third party accredited laboratories, and the administering of sanctions on non-compliant products in terms of section 15 of the NRCS Act.
The focus of market surveillance has shifted towards locking out non-compliant products at the ports of entry, due to the large quantities of regulated products being imported into South Africa. During the period under review, 37% of inspections were conducted at the various ports of entry, compared to 27.3% during the previous financial year.
A recent focus has been on the energy efficiency of products as mandated under the National Energy Efficiency Strategy of 2012 and IPAP initiatives. This has included preparations for the enforcement of minimum energy efficiency standards for incandescent lamps and household appliances.
Overall performance
Market surveillance A total of 4 338 market surveillance inspections were conducted against a planned target of 4 000, representing a positive variance of 8.5%. The biggest proportion of inspections were carried out in Gauteng (40.4%), while, KwaZulu-Natal had the highest share of border inspections (47.4%). During market surveillance, a total of 312 samples were taken from the market for testing at accredited laboratories, while approximately 2 400 samples were kept for reference purposes and some 212 000 were submitted for voluntary destruction. The cost for testing for the period was R2.6 million.
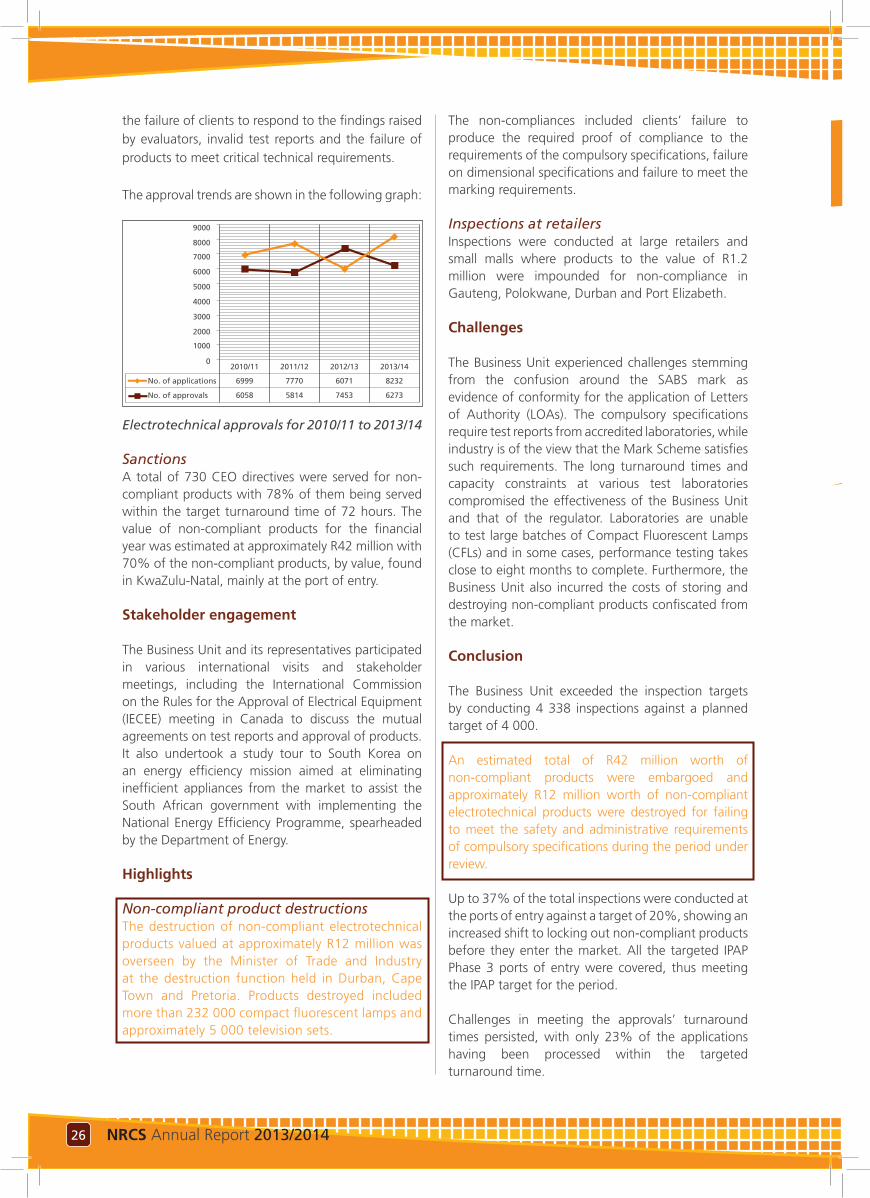
ApprovalsChallenges were experienced in that the targeted turnaround times for pre-market approvals were not met, with only 23% of the approvals granted within the target. The problem of approval capacity persisted as the number of applications for the financial year under review reached 8 234, compared to 6 071 for the previous period. A total of 2 190 applications were rejected for reasons which included
21
27NRCS Annual Report 2013/2014 26 NRCS Annual Report 2013/2014
the failure of clients to respond to the findings raised by evaluators, invalid test reports and the failure of products to meet critical technical requirements.
The approval trends are shown in the following graph:
9000
8000
7000
6000
5000
4000
3000
2000
1000
02010/11
6999No. of applications
6058No. of approvals
2011/12
7770
5814
2012/13
6071
7453
2013/14
8232
6273
Electrotechnical approvals for 2010/11 to 2013/14
SanctionsA total of 730 CEO directives were served for non-compliant products with 78% of them being served within the target turnaround time of 72 hours. The value of non-compliant products for the financial year was estimated at approximately R42 million with 70% of the non-compliant products, by value, found in KwaZulu-Natal, mainly at the port of entry.
Stakeholder engagement
The Business Unit and its representatives participated in various international visits and stakeholder meetings, including the International Commission on the Rules for the Approval of Electrical Equipment (IECEE) meeting in Canada to discuss the mutual agreements on test reports and approval of products. It also undertook a study tour to South Korea on an energy efficiency mission aimed at eliminating inefficient appliances from the market to assist the South African government with implementing the National Energy Efficiency Programme, spearheaded by the Department of Energy.
Highlights
Non-compliant product destructionsThe destruction of non-compliant electrotechnical products valued at approximately R12 million was overseen by the Minister of Trade and Industry at the destruction function held in Durban, Cape Town and Pretoria. Products destroyed included more than 232 000 compact fluorescent lamps and approximately 5 000 television sets.
The non-compliances included clients’ failure to produce the required proof of compliance to the requirements of the compulsory specifications, failure on dimensional specifications and failure to meet the marking requirements.
Inspections at retailersInspections were conducted at large retailers and small malls where products to the value of R1.2 million were impounded for non-compliance in Gauteng, Polokwane, Durban and Port Elizabeth.
Challenges
The Business Unit experienced challenges stemming from the confusion around the SABS mark as evidence of conformity for the application of Letters of Authority (LOAs). The compulsory specifications require test reports from accredited laboratories, while industry is of the view that the Mark Scheme satisfies such requirements. The long turnaround times and capacity constraints at various test laboratories compromised the effectiveness of the Business Unit and that of the regulator. Laboratories are unable to test large batches of Compact Fluorescent Lamps (CFLs) and in some cases, performance testing takes close to eight months to complete. Furthermore, the Business Unit also incurred the costs of storing and destroying non-compliant products confiscated from the market.
Conclusion
The Business Unit exceeded the inspection targets by conducting 4 338 inspections against a planned target of 4 000.
An estimated total of R42 million worth of non-compliant products were embargoed and approximately R12 million worth of non-compliant electrotechnical products were destroyed for failing to meet the safety and administrative requirements of compulsory specifications during the period under review.
Up to 37% of the total inspections were conducted at the ports of entry against a target of 20%, showing an increased shift to locking out non-compliant products before they enter the market. All the targeted IPAP Phase 3 ports of entry were covered, thus meeting the IPAP target for the period.
Challenges in meeting the approvals’ turnaround times persisted, with only 23% of the applications having been processed within the targeted turnaround time.
27NRCS Annual Report 2013/2014 26 NRCS Annual Report 2013/2014
Foods and Associated
Industries Business Unit
Overview
The Foods and Associated Industries (FAI) Business Unit is responsible for the protection of the health and safety of consumers by administering compulsory specifications for canned meat and fishery products, frozen fishery products, smoked snoek and aqua-cultured live abalone, traded nationally and internationally. The FAI Business Unit acts as the competent authority for the issuing of health guarantees to various countries and trade groupings.
At national level, the Business Unit works in close cooperation with several other legislators in the food environment, including the Department of Health and with various sections of the Department of Agriculture, Forestry and Fisheries (DAFF) that control aspects of food safety. FAI Business Unit actively participates in the South African Standards setting processes (SANS and DAFF) as well as internationally with those of the Codex Alimentarius.
During the year under review, the Business Unit participated and cooperated with various competent authorities at an international level to facilitate trade of safe food. The Business Unit also constantly strives to keep abreast of technology and to benchmark itself with other regulators, nationally and internationally.
The Business Unit has entered into various technical cooperation agreements with countries that trade
fishery products with South Africa. These agreements act as preventative measures to ensure that only safe products are obtained from these countries.
Overall performance
Goals, targets and tasks are set by the Business Unit in terms of measureable objectives and have been successfully implemented. Internal audits took place during the year to measure the performance of the Business Unit in terms of its documented quality management plan, based on ISO/IEC 17020. The Business Unit successfully maintained its SANAS accreditation and the quality management system was entrenched and in compliance with international requirements.
InspectionsThe Business Unit’s regulatory and inspection methodologies rest firmly on the assessed risk profiles of the various food commodities it regulates. Inspections are conducted on all high risk products such as canned and imported products from countries where there is no official inspection agreement, while low risk products are monitored with a predetermined surveillance programme at factory level.
South Africa experienced an increase in the import volumes of canned fish products as the inspection trends for the past four years have indicated. During the period under review, there has been an increase
31
29NRCS Annual Report 2013/2014 28 NRCS Annual Report 2013/2014
in the number of inspections for export and local productions of fishery products, while there was a slight decrease in the number of imported product inspections. Adverse weather patterns and the ever volatile and fluctuating exchange rate, play a major role in the production and trade of fishery products.
Canned meat products are mainly produced according to sales orders and volumes fluctuate from month to month, depending on consumer spending.
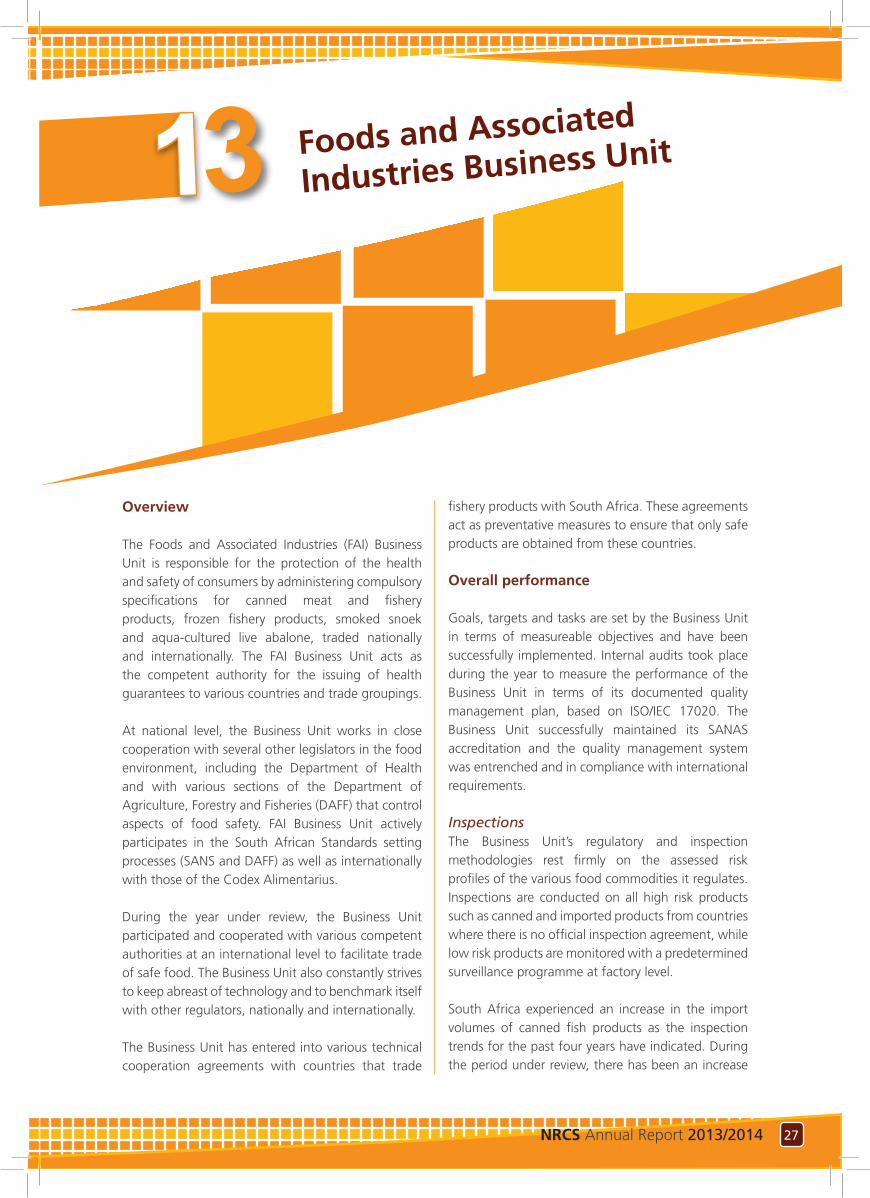
Imported Products
Exported Products
Local Canned Fish
Local Canned Meat
Local Frozen Fish
Facility Inspection
2009/10 2010/11 2011/12 2012/13 2013/14
16000
14000
12000
10000
8000
6000
4000
2000
0
Inspection trend for the past four months
During the period under review 867 facility compliance inspections were conducted at processing establishments. A total of 6 159 product inspections, including frozen fishery products, as well as canned meat and fishery products were conducted from these processing establishments before release to trade or exported to various countries.
All imported products covered by compulsory specifications administered by this Business Unit are sampled at the port of entry and inspected at various national inspection facilities.
During the period under review, 13 124 product inspections were conducted for frozen and canned fishery products imported into the country.
Health guarantees
Health guarantees are certificates that are issued by competent authorities for food products which comply with the international food law (Codex) or law of the country of destination. The FAI Business Unit is recognised and appointed as the competent authority for fish and fishery products for South Africa by various countries, including the European Union and People’s Republic of China.
A total number of 13 793 inspections were conducted for products exported to various countries and 18 780 health guarantees were issued for these products.
Sanctions
Non-complianceNon-compliance certificates are issued for productions or consignments that were found to be sub-standard or non-compliant with certain non-food safety related quality requirements in terms of compulsory specifications. A total number of 173 non-compliance certificates were issued during this period. Sales permits, which stipulate prescribed or compulsory sales conditions, are issued for these products on request.
A total number of 203 non-compliance certificates were issued for products adjudged to be not for sale. Directives were issued as appropriate. These products did not comply with food safety and/or labelling requirements of the relevant Compulsory Specifications. Sales permits could not be issued for these products. Such products were required to be re-labelled, destroyed or returned to the country of origin. The final outcomes are strictly monitored by inspectors through a documented system and industry must adhere to the stipulated requirements and time frames.
Voluntary and national recalls for locally produced and imported canned fishery products which pose a risk to human health, were successfully conducted.
Directives issuedThe products for which directives were issued were destroyed by industry at their own cost, under the supervision of the NRCS, or returned to the country of origin. A total number of 37 directives were issued during this period on imported products, exported products and locally produced products.
Stakeholder engagement
The FAI Business Unit collaborated with various local industry bodies and international trading partner nations to clarify and harmonise standards for fishery products. The Business Unit participates in the international standards setting process, organised by Codex. The Business Unit supported and made interventions at the various meetings held under leadership of the DAFF to assist the process of improved collaboration between the three food
regulators, namely the Department of Health, the
Department of Agriculture, Forestry and Fisheries and
29NRCS Annual Report 2013/2014 28 NRCS Annual Report 2013/2014
the NRCS. Locally, the FAI Business Unit participated
in and contributed to the following legislation and
standards setting forums:
• SANS Technical Committees for Various Food
Standards
• Food Legislation Advisory Group (FLAG) meeting,
hosted by the Department of Health where
proposed food regulations were discussed and
the processes leading to the implementation of
these regulations in the interest of protecting
consumers
• Aqua-culture Advisory Group Committee, hosted
by the DAFF in Cape Town
• SPS/TBT Committee meetings, hosted by the
Department of Agriculture
• Inter-governmental Aqua-culture Forums
• Interdepartmental Food Safety Coordinating
Committee meeting - established to coordinate
all food safety issues between the food regulatory
authorities in South Africa
Joint management meetings were held with Namibia,
Mozambique, Mauritius and Thailand in terms of the
technical cooperation agreements. These agreements
are designed to ensure that food traded between
the countries is safe for human consumption and
complies with specifications and regulations.
The Business Unit held 163 meetings during the
year under review with representatives from various
companies in the fish and meat industry (local
manufacturers and importers) to discuss various
operational and technical issues and matters of
mutual interest.
Highlights
All health guarantees issued for fishery products
exported to the European Union were successfully
accepted without any notification in the rapid alert
system for food and feed (RASFF) for South Africa.
Products estimated at R31 million were made not
for sale and these products were either destroyed or
returned to the country of origin.
Challenges
The extent and timing of local production and importation of goods remain unpredictable and make operational planning difficult. Operational activities and available resources need to be re-organised and adjusted at short notice to accommodate for sudden increases in imports or exports and to service the local production. During the first quarter as well as in November 2013, the importation of canned fishery products peaked, putting strain on NRCS staff, particularly in Durban. The quality of some of the products was and remains a challenge for the Business Unit, especially as a result of excessive fish fat oxidation of frozen sardines (pilchards).
The catches of squid were very poor during the period under review and most freezer vessels were not operational. During the winter period the catches of white fish were also poor and had an adverse effect on the levy income. There was also a downward trend in the volumes of canned meat products produced and these trends affected the performance of the Business Unit negatively.
Conclusion
The Business Unit achieved its targets and objectives of protecting consumers by effectively administrating the relevant compulsory specifications. It has also managed to enhance the trade of good quality food products nationally and internationally. The total number of inspections increased from 32 408 in the previous financial year to 33 905 for the period under review. The trade relations with various countries and the demand for good quality and safe fishery products have resulted in an increase in the number of health guarantees issued by the FAI Business Unit from 11 919 in 2012/13 to 13 793 in 2013/14, which translates to a 15,7% increase. The Business Unit has also participated successfully in the national and international standards setting processes. In its effort to drive basic performance efficiencies, the Business Unit constantly strives to keep abreast with the technology and to benchmark itself with other regulators, nationally and internationally. The Business Unit also places emphasis in ensuring the technical competence of its inspectors and thus facilitates ongoing training.
31NRCS Annual Report 2013/2014 30 NRCS Annual Report 2013/2014
Legal Metrology Business Unit
Overview
The Legal Metrology Business Unit is mandated to ensure that consumers receive the actual measure of goods declared by an importer, manufacturer or retailer on a pre-package, or where a measuring instrument is used to conclude a transaction, that it remains accurate within prescribed limits of error. In short, both industry and consumers are protected, which ensures fair trade.
Fair trade is achieved by:
• Ensuring that prescribed measuring instruments used for trade are “type evaluated” for proper design, construction and accuracy, taking into consideration the South African climate and environment. Type approval is a pre-market approval mechanism designed to ascertain whether measuring instruments are compliant with applicable standards and technical regulations;
• Conducting inspections to ensure that importers, manufacturers and retailers of products use accurate instruments for trade and that, where manufacturers or retailers prepare pre-packages, there is no short measure;
• Taking action against those importers, manufacturers and retailers that supply short measure products or use inaccurate measuring instruments;
• Approving and designating private verification
laboratories to verify measuring instruments,
used in terms of the Trade Metrology Act, on
behalf of the regulator;
• Evaluating the competence of verification officers
working for private verification laboratories,
performing verification on behalf of the regulator;
• Providing traceability to national standards for
verification and inspection standards used to
type approve, verify and inspect measuring
instruments. Traceability is the compliance
of standard masspieces and/or measuring
instruments to the International System of
Measurement (SI) by means of an unbroken
chain of comparisons, linking them to the
relevant primary standards of the SI units of
measurements;
• Providing training to inspectors, and where
requested, to provide training to regional legal
metrology bodies (e.g. SADC member states);
• Evaluating performance test reports of gaming/
gambling hardware and software with the view
of issuing a letter of certification (LOC) to the
gaming and gambling industry, as mandated by
Section 25 of the National Gambling Act, No. 33
of 1996. This is a pre-market approval mechanism
to evaluate whether gaming hardware and/or
software are compliant with applicable standards
and technical regulations; • Providing input into national, regional and
41
31NRCS Annual Report 2013/2014 30 NRCS Annual Report 2013/2014
international standards as required by the SADC Legal Metrology Cooperation (SADCMEL), Pan African Metrology (AFRIMETS) and International Organisation of Legal Metrology (OIML).
Overall performance
Market surveillanceTo ensure that non-compliant goods were not sold to the consumer and that non-compliant instruments were not used in trade transactions, Legal Metrology inspectors conducted 4 287 inspections, 8.5 % more than the inspection target of 3 951 set for the year. In line with the risk-based approach to NRCS work, the focus of surveillance inspections remained on importers and the manufacturers of pre-packed goods and measuring instruments. Furthermore, 75 % of the market surveillance inspections were carried out on importers and manufacturers, while 25 % of inspections were carried out at the retail level.
During these market surveillance inspections, 24 540 samples of products were assessed and the following non-compliances were uncovered:
• Short measure – 3 374 instances (13,7 %)• Incorrect pack size – 628 instances (2,5 %) • Unmarked goods – 516 instances (2,1 %) • Other than mentioned – 154 instances (0,6 %)
With regard to measuring instruments, a total number of 10 744 instruments were inspected and the following non-compliances were identified:
• Verification status lapsed – 2 456 instances (22,9 %)
• Unapproved instruments used in trade – 629 instances (5,8 %)
• Inaccuracy – 79 instances (0,7 %)• Technical/markings – 62 instances (0,6 %) • Other than mentioned – 101 instances (0,9 %).
Type approvalA total of 53 applications were carried over from the 2012/13 financial year and during the year under review, the Legal Metrology Business Unit received an additional 158 new applications from instrument manufacturers and suppliers for type evaluation. The Business Unit issued 94 approval certificates for instruments that passed all requirements and
tests. The approval certificate allows submitters to manufacture or import any number of replicas of the instrument approved. A total number of 74 projects were closed due to failure to submit the required information timely. Forty-three applications were carried over to the 2014/15 financial year.
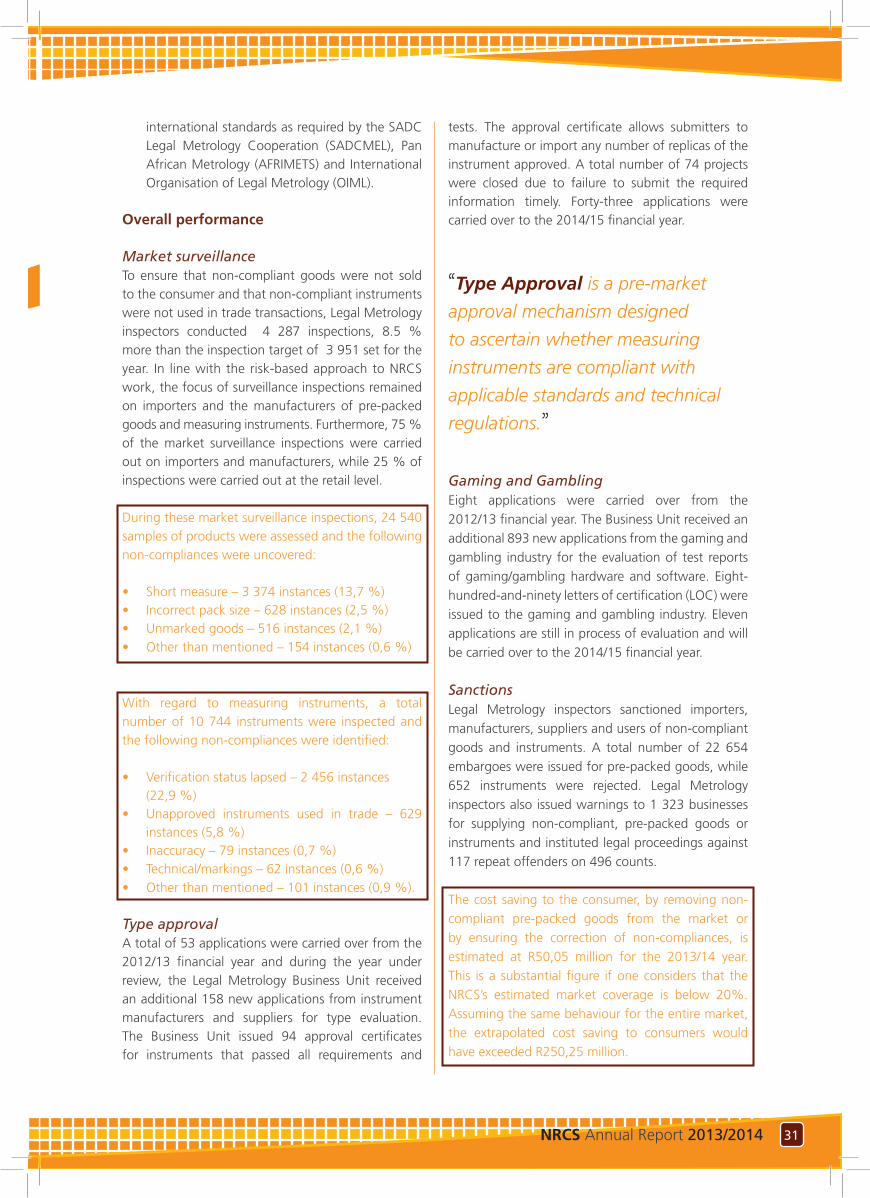
“Type Approval is a pre-market
approval mechanism designed
to ascertain whether measuring
instruments are compliant with
applicable standards and technical
regulations.”
Gaming and GamblingEight applications were carried over from the
2012/13 financial year. The Business Unit received an
additional 893 new applications from the gaming and
gambling industry for the evaluation of test reports
of gaming/gambling hardware and software. Eight-
hundred-and-ninety letters of certification (LOC) were
issued to the gaming and gambling industry. Eleven
applications are still in process of evaluation and will
be carried over to the 2014/15 financial year.
SanctionsLegal Metrology inspectors sanctioned importers,
manufacturers, suppliers and users of non-compliant
goods and instruments. A total number of 22 654
embargoes were issued for pre-packed goods, while
652 instruments were rejected. Legal Metrology
inspectors also issued warnings to 1 323 businesses
for supplying non-compliant, pre-packed goods or
instruments and instituted legal proceedings against
117 repeat offenders on 496 counts.
The cost saving to the consumer, by removing non-
compliant pre-packed goods from the market or
by ensuring the correction of non-compliances, is
estimated at R50,05 million for the 2013/14 year.
This is a substantial figure if one considers that the
NRCS’s estimated market coverage is below 20%.
Assuming the same behaviour for the entire market,
the extrapolated cost saving to consumers would
have exceeded R250,25 million.
33NRCS Annual Report 2013/2014 32 NRCS Annual Report 2013/2014
Calibration Calibration ensures that verification standards used by verification officers as well as equipment used by inspectors of the regulator are accurate and traceable to national standards. The Business Unit inspected and calibrated 9 740 verification standards in four SANAS accredited calibration laboratories in Cape Town, Durban, Port Elizabeth and Pretoria. This number includes the calibration of 7 869 mass verification standards, 1 019 volumetric verification
standards and 852 balances.
The Legal Metrology BillThe Business Unit also assisted the dti to present the draft Legal Metrology Bill to the National Assembly’s Portfolio Committee on Trade and Industry, the National Council of Provinces (NCOP) as well as to all provincial government departments. Members from the Legal Metrology Business Unit reviewed comments on the draft Legal Metrology Bill and gave input into the various stakeholder meetings from the perspective of a regulator. The Legal Metrology Bill was signed by the President on 16 May 2014.
Funding The Legal Metrology Business Unit receives its principal source of funding through a government grant. Additional funding is generated from its calibration, verification, type approval and assessment activities. The new Legal Metrology Act will provide for a new financing model for legal metrology, similar to the structure that the NRCS uses for funding of compulsory specifications. Fees will be determined per legal metrology technical regulation, based on the cost that the regulator incurs to regulate.
Stakeholder engagements
During the past year, the Business Unit continued to work closely with other national, regional and international regulators as well as standard bodies in the field of legal metrology, engaging in the following activities:
• The Business Unit represented South Africa on 28 technical committees of the International Organisation of Legal Metrology (OIML), responsible for drafting model regulations (recommendations) to be used in legal metrology and made input into several of these recommendations.
• The Business Unit hosts the secretariat of the OIML Technical Committee 6 (OIML TC 6) which deals with requirements for pre-packaged goods. The secretariat gave input into the draft international recommendations currently being developed and revised by the OIML TC 6. An international meeting of the OIML TC 6 was arranged and attended by the secretariat in Bern, Switzerland.
• The head of Legal Metrology, as representative of South Africa, attended the CIML meeting (steering committee for the OIML) in Ho Chi Minh City, Vietnam to review the organisation’s technical progress and administrative operations. During this period the head also participated in numerous other technical committee meetings.
• The Business Unit provides the secretariat for the SADC Cooperation in Legal Metrology (SADCMEL) and a staff member of the Legal Metrology Business Unit is also the regional coordinator. The secretariat was responsible for arranging the 28th SADCMEL meeting in March 2013 in Gaborone, Botswana. The regional coordinator attended the SADCMEL TC, SQAMEG and SADCMEL Project Management Committee meetings. The involvement of the Business Unit and the attendance of the above meetings furthered the commitment of the NRCS to play a leading role in regional matters of interest. It also ensured that the NRCS received exposure as a leading regulator in the field of legal metrology and associated fields.
• Legal Metrology management chaired four SABS committees dealing with legal metrology standards. These are SABS TC 70, SABS SC 70 A, SABS 70 B and SABS 70 D. Legal Metrology specialists and inspectors also participated in various work groups dealing with new standards and amendments to existing standards, covering legal metrology technical requirements.
The involvement of the Business Unit in these activities ensured that the regulator’s requirements were adequately addressed in national standards which will become future technical regulations.
The Business Unit held meetings with stakeholders in various market segments to inform and educate them on legal metrology requirements. A formal sector committee meeting, namely the Accredited Verification Laboratory Sector, was held and various stakeholders in the retail, alcoholic beverages, cosmetics and aerosol sectors were consulted to
33NRCS Annual Report 2013/2014 32 NRCS Annual Report 2013/2014
inform them of the draft Legal Metrology Bill as well as the registration of importers of products bearing the e-mark. The e-mark provides an indication to the NRCS that pre-packed goods meet with requirements on an ongoing basis. Currently 123 local manufacturers and four importers are registered as e-mark holders, with 64 additional applications from importers being processed.
Highlights
Designation of verification laboratoriesSix new accredited verification laboratories have been designated to verify measuring instruments on behalf of the Business Unit during the reporting period. To ensure that verification officers working for designated verification laboratories are competent, they have to pass the required theoretical and practical examinations. A total number of 303 theoretical verification officer examination papers were written and 85 practical evaluations were conducted on candidate verification officers. The Business Unit further provided support to SANAS as lead or technical assessors, to conduct assessments on verification laboratories. Legal Metrology assessors took 119 days ,on average, to assess various verification laboratories. The assessment of verification laboratories remains strategic to the regulator because it underpins confidence in the designation of the laboratories to operate under the Act.
Challenges
Inspectorate capacityThe promulgation of the Legal Metrology Act will result in an increase of scope of the Legal Metrology Business Unit. To enable the Business Unit to execute its new mandate effectively, challenges of capacity and training will have to be addressed to cover other areas of the scope which include health, safety and environment measurements.
Conclusion
Through the work of the Legal Metrology Business Unit, the NRCS remains committed to protect the right of consumers to receive the correct quantity of goods and services for which they pay, as well as ensuring confidence in the measurements made by the South African industry that will ultimately lead to increased market access of local manufacturers.
35NRCS Annual Report 2013/2014 34 NRCS Annual Report 2013/2014
National Building Regulations
Business Unit51
Overview
The National Building Regulations Business Unit is responsible for ensuring uniform understanding and implementation of the Building Regulations and Building Standards in accordance with the National Building Regulations and Building Standards Act (NBR and BS Act), No. 103 of 1977.
The National Building Regulations Business Unit also protects the interests of citizens through:
• Pro-actively engaging with built environment practitioners and the relevant building industries for regulatory awareness, and developing and enhancing a culture of voluntary compliance
• Identifying gaps in the enforcement and compliance to the building legislation
• Adopting a risk-based approach that informs all of the NBR’s Business Unit regulatory activities
• Collaborating with our strategic partners and building control officers as implementers of the building legislation
• Building a competent team that oversees the implementation of the NBR and BS Act
The strategic objectives of the NBR Business Unit are:
• Administering the NBR Business Unit Review Board, an appeal mechanism provided to allow aggrieved parties to challenge local authorities’
decisions and interpretations of the National Building Regulations
• Providing technical advice and interpretation of the NBR and BS Act to the built environment practitioners and other interested parties, such as home owners, local authorities, government departments and the public
• Performing building defects investigations that can be described as forensic architectural investigations. These investigations are performed to determine why and how building failures occurred
• Evaluation of the qualifications of building control officers who do not satisfy the required minimum qualifications as prescribed by legislation
• Providing technical support and guidance to the SABS technical committees responsible for providing solutions to satisfy the legislative requirements in terms of developing the SANS 10400 range of documents
• To inform the building industry’s stakeholders of the role and function of the NBR Business Unit
Overall performance
Review Board administrationThe NBR Business Unit receives applications to review decisions made by local authorities when they decline building applications. These decisions are heard by the Review Board to provide clarification and
interpretation of the building legislation, and to give
a decision on the application.
35NRCS Annual Report 2013/2014 34 NRCS Annual Report 2013/2014
During the 2013/2014 financial year, the Minister
of Trade and Industry appointed the Chairperson of
the Review Board with effect from 1 June 2013 for a
period of three years. The NRCS CEO appointed four
additional members to the Review Board. During the
year under review, 14 reviews were received, lodged
and referred to the Review Board.
Forensic investigationsThe Business Unit formed part of the team that
investigated the building under construction that
collapsed in Tongaat, KwaZulu-Natal in November
2013. The investigation revealed that the developer
was prohibited to commence with construction as
the local authority had not approved the building
application as prescribed by clause 4 of the NBR
and BS Act, but continued against the law. The
investigation reports compiled by NBR Business Unit
were submitted to the Department of Labour which
is currently conducting its own investigation on the
matter.
The NBR Business Unit also conducted the
investigation on allegations of non-compliance to
the NBR and BS Act by the Local Authority of Marble
Hall. The allegations were made by the Marble Hall
Business Chamber to the dti Minister. The NBR
Business Unit, in conjunction with the Department
of Co-operative Government and Traditional Affairs
(COGTA), Municipal Infrastructure Support Agency
(MISA) and the dti investigated the allegations. The
investigation revealed that contraventions were due
to failure to adhere to the local authority’s own town
planning scheme, as well as the NBR and BS Act.
The investigation further identified widespread
shortcomings as failures in the implementation of the
two Acts that govern the development of towns and cities across many local authorities. the dti is currently looking at finding solutions to these challenges.
Stakeholder engagement
The Building Control Officers (BCO) Steering Committee held four meetings during the reporting period. In addition, the NRCS through the NBR Business Unit, hosted the Annual Building Regulators Convention together with the City of Johannesburg and the dti on 3 and 4 October 2013 at the Gallagher Convention Centre in Midrand, Johannesburg. This conference reflected on efforts to create a uniform understanding and implementation of the NBR and BS Act.
Challenges
A lack of understanding of the NBR and BS Act and its technical requirements by the building industry remains a challenge to the Business Unit, tasked with ensuring its uniform understanding and implementation. The local authorities are also experiencing challenges regarding skills shortages and financial support to effectively administer the Act.
Conclusion
the dti is in the process of reviewing the NBR and BS Act. The review will assist in ironing-out challenges experienced with the administration and the enforcement of the Act. The review of the Act forms part of the IPAP requirements for the organisation. The NRCS, through the NBR Business Unit, has been asked to expand on its mandate to include informal buildings and innovative building technologies within the NBR regulations. The Business Unit, working in collaboration with other Business Units within the organisation, will also identify building industry materials to be regulated. The above interventions will have a positive effect on the citizens of the country and on building stakeholders.
37NRCS Annual Report 2013/2014 36 NRCS Annual Report 2013/2014
Regulatory Research and
Development Business Unit
Overview
The Regulatory Research and Development (RRD) Business Unit supports the NRCS’s first strategic goal to identify the need for new compulsory specifications (VCs) or technical regulations (TRs) and to develop these, or in the case of existing VC/TRs, maintain their relevance by amending or revising documents according to the latest international and national requirements. In this process, the RRD Business Unit takes into consideration the cost benefit of new or in some cases amended VC/TRs as these may have unintended consequences such as the exclusion of small enterprises from the mainstream economy. Special attention is given to other legislation that may overlap with the intended actions of the RRD Business Unit.
The RRD Business Unit gives effect to this strategic objective through two overarching operational activities:
• The principles alluded to the development of new and maintenance of existing VC/TRs. The VC/TR requirements will be enforced by the NRCS’s Operational Units. The NRCS mandate provides for a wide spectrum of products to be regulated by the NRCS;
• The facilitation and execution of research relating to the development and implementation of
VC/TRs and to support business improvement strategies.
To ensure maximum efficiency, the development and revision of VC/TRs are conducted through a process that allows for public and stakeholder participation according to set principles.
The above principles include inter alia:
• Developing VC/TRs within acceptable time periods, as set in a formal project management plan and according to acceptable standards of quality/international best practice;
• Conducting a periodic review of VCs, ensuring that legislation remains current and relevant, and that the NRCS is able to effectively apply the regulations within the constraints of a changing environment;
• Engaging with stakeholders to ensure transparency and accountability of regulatory processes;
• Participating in inter-governmental, national, regional and international forums supporting the achievement of the mandate and the strategic goals of the NRCS.
The NRCS’s approach to develop VC/TRs adheres to the World Trade Organisation’s (WTO) principles and procedures for the development of technical regulations as far as practically possible. These
61
37NRCS Annual Report 2013/2014 36 NRCS Annual Report 2013/2014
practices include interventions such as conducting feasibility studies, risk and impact assessment studies as well as extensive stakeholder engagements and consultations with affected and interested parties to ensure transparency of the proposed regulatory intervention.
The development process spans a period of approximately 18 months, although the process can be shorter if an existing regulation needs to be reviewed or amended.
Overall performance
During the period under review, the RRD Business Unit managed 33 active projects that were at various stages of completion. Eight projects were completed against an adjusted target of nine projects for new and amended compulsory specifications and technical regulations. The initial target of 11 projects was reduced mainly because of lack of the required human resources capacity to execute the planned projects, as well as delays in the completion of related National Standards required for referencing in the compulsory specifications. The eight projects completed consisted of seven amendments to compulsory specifications and the introduction of one new compulsory specification under the NRCS Act.
The following compulsory specifications were completed:
• VC 8023: The amendment of the Compulsory Specification for M2/3 Vehicles - Inclusion of ABS braking
• VC 8025: The amendment of the Compulsory Specification for N2/3 Vehicles - Inclusion of ABS braking
• VC 8053: The amendment of the Compulsory Specification for Replacement Brake Lining Assemblies
• VC 9008: The proposed Compulsory Specification for Energy Efficiency and Labelling of Electrical and Electronic Apparatus
• VC 9012: The amendment of the Compulsory Specification for Electric Luminaires
• VC 9088: The amendment of Compulsory Specification for Small Arms Shooting Ranges
• VC 8016: The amendment of the Compulsory Specification for Safety Helmets for Motor Cyclists
• VC 8031: The amendment of the Compulsory Specification for Frozen Shrimps (prawns), Langoustines and Crabs
During the 2013/2014 reporting period, the dti published the following notices in the government gazette:
• New VC/TRs– The regulation of Automatic Rail Weighbridges
under the Trade Metrology Act (GG R828, 1 Nov 2013)
• Amended VC/TRs– VC 9089: The Compulsory Specification for Non-
pressure Paraffin Stoves and Heaters (GG R552, 8 Aug 2013)
– VC 8087: The Compulsory Specification for Plastic Carrier Bags and Flat Bags (GG R651, 6 Sep 2013)
– VC 8043: The Compulsory Specification for Incandescent Lamps (GG R74, 7 Feb 2014)
• Final withdrawal notices:– VC 8062: The withdrawal of the Compulsory
Specification for Number Plates (GG R517, 26 Jul 2013)
– VC 8078: The withdrawal of the Compulsory Specification for Contour Marking Material (GG R518, 26 Jul 2013)
• Notices for public comments:– VC 8034: The proposed withdrawal of the
Compulsory Specification for Coal Burning Stoves and Heaters for use in a dwelling
– VC 8028: The proposed withdrawal of the Compulsory Specification for Firearm Proofing for civilian use
– VC 9003: The proposed Compulsory Specification for Safety Glass and other Safety Glazing Materials
– VC 9008: The proposed Compulsory Specification for Energy Efficiency and Labelling of Electrical and Electronic Apparatus
– VC 9091: The Compulsory Specification for Compact Fluorescent Lamps
The reports produced through these processes are approved by the Project Approvals Committee (PAC) of the RRD Business Unit. The PAC is responsible for the appraisal of the feasibility, risk and impact assessments of all technical regulation projects before submission to the NRCS Exco. Once approved by the NRCS Exco, the process feeds into the NRCS Board and thereafter to the dti for promulgation. During the 2013/14 financial year the PAC reviewed and approved 28 documents.
39NRCS Annual Report 2013/2014 38 NRCS Annual Report 2013/2014
Research projects The research capability of the RRD Business Unit has not been embedded as resource requirements compromised this activity. However, the RRD Business Unit progressed by the following actions:
• Developed a strategy for conducting research that will be explored further during 2014;
• The RRD Business Unit administered and appointed the third NRCS project team (SIDA III) that visited Sweden for a training period of a month. The SIDA III team completed their project on the “Feasibility on the Introduction of an NRCS Regulatory Mark” and presented their findings to a full meeting consisting of SIDA senior officials and representatives of the SADC countries. The RRD Business Unit provided supervisory support for the SIDA III Project;
• Tabled a review document for future publication on “The relationship between standards and regulations, a close liaison – M Marneweck & Z Fourie.” This is part of the research drive to inform stakeholders on the intimate relationship between the national standard and the regulations, but also emphasises the roles of the specific agencies in this endeavour to meet with the World Trade Organisation’s requirements to prevent technical barriers to trade;
• A research project proposal for a project entitled “Establishing the Regulatory Compliance gap in South Africa” was developed and approved by the NRCS Bid Committee. The research report will inform the NRCS risk-based strategy, aimed at improving the NRCS coverage of the higher risk industries. This project is targeted for completion in 2015.
Stakeholder engagement
The RRD Business Unit places a strong emphasis on stakeholder relationship management as the regulatory decision making processes are based on the principles of transparency and accountability. The Business Unit convened and facilitated 27 stakeholder consultation meetings on proposed regulatory interventions. These meetings are open to any affected or interested party and are widely attended by industry including their representative bodies, consumer bodies, conformity assessment bodies and others. In addition, the RRD Business Unit hosted and participated in 145 general liaison meetings to support the internal functions of the NRCS, such as discussions on Audit reports, support to the CEO when meeting with industry, discussions
on proposed regulatory amendments with internal parties, and preparations for meetings with various stakeholders such as the National Manufacturers of Automobiles of South Africa and the Parallel Importer of Motorcycles Traders Association.
National, regional and international involvement The RRD Business Unit participated in a more thean 35 of regional and international engagements in an effort to foster strategic partnerships with other regulators, policy makers and industries and also enhanced regional and international harmonisation of regulatory practices.
Participation in national forums The RRD Business Unit participated in 66 inter-governmental meetings with other government departments such as the dti, Department of Transport, Department of Environmental Affairs (DEA), Department of Health (DOH) and Department of Agriculture, Forestry and Fisheries (DAFF). RRD Business Unit staff members serve in 10 national co-ordinating structures such as the Interdepartmental Task Team on Food Control and the Appliance Standards and Labelling Group of the Department of Energy. The RRD Business Unit also participated in 59 meetings of Technical Committees of the South African Bureau of Standards (SABS) dealing with various South African National Standards (SANS) applicable to commodities that are regulated by the NRCS.
Southern African Development Community (SADC)During the period under review, the RRD Business Unit attended the 4th SADC Sanitary and Phytosanitary (SPS) Coordinating Committee meeting of the regional coordinating committee, led by the DAFF.
In the area of trade metrology, a representative of the RRD Business Unit participated in the SADC Workshop on amendments to the TBT Annex to the SADC Trade Protocol as part of the South African delegation to provide input and assist with motivation of amendments proposed by South Africa.
In SADCMEL, a representative of the Business Unit was tasked to prepare and submit a request to the SADC Secretariat to budget for funds to translate SADCMEL harmonised technical documents and rules of procedure into French and Portuguese. The RRD Business Unit is involved with capacity building on behalf of trade metrology in neighbouring countries.
39NRCS Annual Report 2013/2014 38 NRCS Annual Report 2013/2014
As part of these initiatives, the RRD Business Unit assisted with the evaluation of quotations for equipment to be supplied to Lesotho by the PTB under the SADC funding programme. The Business Unit also developed a course on the verification of water meters according to the requirements of OIML R 49. This course was presented to SADCMEL members between 13 and 17 January 2013 in Pretoria under the PTB funding programme.
International liaison The Business Unit participated in and contributed to 31 international initiatives, by either providing technical expertise assistance in discussion/technical documents or attendance of meetings as national representation. These include:
– OIML TC 8 SC 3:o Working on test procedures for liquid fuel
dispensers, milk meters and other matters relating to the development of OIML R 117-2, which deals with conformity assessment test procedures for type approval of meters for liquids other than water;
o Evaluating international type approval and verifying test procedures for liquid fuel dispensers and making extensive comments and inputs for improvement. This procedure will be incorporated in OIML R 117-2 which deals with conformity assessment test procedures for type approval of meters for liquids other than water;
o Meeting in London from 1 to 3 October 2013, representing South Africa as a technical expert member of OIML TC 8/ SC 3, dealing with the measurement of liquids other than water. Amendments to various annexures of OIML R 117-2 were proposed.
– OIML TC 6:o Collation and evaluation of international
comments on OIML R79 and R87. A member of the RRD Business Unit, who is part of the OIML TC 6 Secretariat assisted with preparation of collated international comments on OIML R 79 and OIML R87 and amended these documents accordingly.
– In the area of automotives, the RRD Business Unit provided technical expert representation for South Africa in four meetings of the WP.29 (World Forum for the Harmonization of Vehicle Regulations) working on UN Regulations that affect the compulsory specifications.
International trainingOne of the RRD Business Unit technical specialists went on a study visit to Korea Testing Laboratory on Technical Regulation for Energy Efficiency and Labelling of Electrical Appliances and this study tour served to benchmark regulatory procedures.
Challenges
The performance of RRD Business Unit has been constrained by capacity problems and the performance target for 2013/14 was reduced because of loss of staff members (Specialists in Foods and National Building Regulations). The Business Unit currently has five vacant positions that have been approved and the recruitment process will commence during 2014/15. Another contributing factor affecting the performance of the RRD Business Unit stems from the delay in completion of certain standards developed by the SABS Technical Committees.
Several projects needed extensions of time lines because of unexpected complexity and policy issues raised during stakeholder engagements. These mainly relate to inability of the industry to agree on regulatory aspects, and the overlapping regulatory mandates with other government departments have been identified as matters to be resolved. Specialists in the Business Unit with extensive experience are nearing retirement age, and the loss of their skills is a major concern. Succession planning is under development to reduce this risk to the NRCS.
Conclusion
The strategic target of the RRD Business Unit in the coming financial year (2014/15) is to finalise 11 VC/TRs. In light of human resources capacity shortages, the RRD Business Unit will prioritise, acquiring and developing the necessary skills needed to perform optimally. Special focus will also be given to expanding research capability and capacity to enable the NRCS to intelligently deliver on its mandate and to inform effective decision making at a strategic and operational level.

41NRCS Annual Report 2013/2014 40 NRCS Annual Report 2013/2014
Communications and Marketing
Overview
The role of the Communications and Marketing Department is to facilitate and co-ordinate an array of integrated communication solutions in line with the business strategy and objectives of the organisation through internal and external communications, thereby promoting and enhancing the organisation’s image. The Department’s other responsibilities are to inform and educate stakeholders, industry and consumers regarding obligations of the NRCS with respect to specifications and technical regulations.
Overall performance
Consumer education programmes The Department develops, as part of its Stakeholder Engagement Plan, consumer education programmes aimed at facilitating face to face engagement with consumers, educating them about their rights and outlining the role of the NRCS to the public. The NRCS visited 20 areas across the country to facilitate dialogue and promote face to face interactions with stakeholders. Areas covered include: Ixopo, Upington, Alexandra, Idutywa, Stutterheim, Mandeni, Kwazakhele, Shatale, Lenasia, Botlokwa, Matsana, Newtown, Eldorado Park, Carletonville, Mafikeng, Queenstown, Matatiele and Pretoria.
Media liaison activitiesThe Department also implements media liaison
activities aimed at working with the media for the
purpose of disseminating information about the
NRCS policies and regulatory functions in a positive,
consistent and credible manner. During the period
under review, the Department issued six media
statements which were covered by various main
stream media in South Africa and the UK. These
statements were covered in the following media: The
New Age, The Daily Telegraph, Sowetan, Business Day,
SABC Radio and TV News, Daily Sun, The Herald, The
Star, Beeld, City Press, Sunday Times, News 24 and
the South African Press Agency (Sapa). The coverage
assisted in enhancing the image of the NRCS and
raised its brand awareness, reaching approximately
1 062 222 readers and viewers.
The most prominent focus of media coverage
in relation to the NRCS was the recalling of two
products, namely Dettol Disinfectant Liquid, Lime and
Lemon Grass as well as Domestos Extended Germ
Kill. The recalling of these products generated more
than 50 articles. The publicity garnered also assisted
in building the reputation of the NRCS among its
stakeholders and the media. It also saw the NRCS
receiving lots of media queries which increased
71
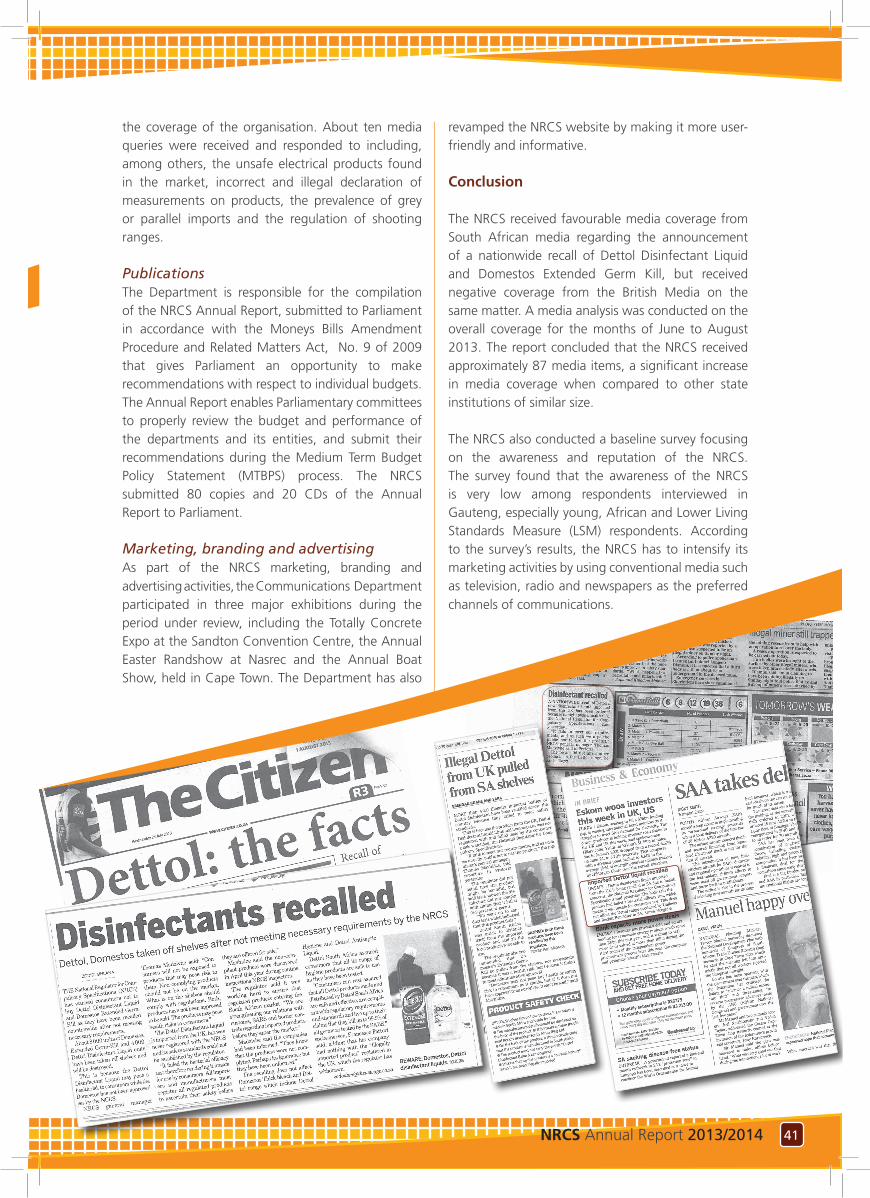
41NRCS Annual Report 2013/2014 40 NRCS Annual Report 2013/2014
the coverage of the organisation. About ten media queries were received and responded to including, among others, the unsafe electrical products found in the market, incorrect and illegal declaration of measurements on products, the prevalence of grey or parallel imports and the regulation of shooting ranges.
Publications The Department is responsible for the compilation of the NRCS Annual Report, submitted to Parliament in accordance with the Moneys Bills Amendment Procedure and Related Matters Act, No. 9 of 2009 that gives Parliament an opportunity to make recommendations with respect to individual budgets. The Annual Report enables Parliamentary committees to properly review the budget and performance of the departments and its entities, and submit their recommendations during the Medium Term Budget Policy Statement (MTBPS) process. The NRCS submitted 80 copies and 20 CDs of the Annual Report to Parliament.
Marketing, branding and advertising As part of the NRCS marketing, branding and advertising activities, the Communications Department participated in three major exhibitions during the period under review, including the Totally Concrete Expo at the Sandton Convention Centre, the Annual Easter Randshow at Nasrec and the Annual Boat Show, held in Cape Town. The Department has also
revamped the NRCS website by making it more user-friendly and informative.
Conclusion
The NRCS received favourable media coverage from South African media regarding the announcement of a nationwide recall of Dettol Disinfectant Liquid and Domestos Extended Germ Kill, but received negative coverage from the British Media on the same matter. A media analysis was conducted on the overall coverage for the months of June to August 2013. The report concluded that the NRCS received approximately 87 media items, a significant increase in media coverage when compared to other state institutions of similar size.
The NRCS also conducted a baseline survey focusing on the awareness and reputation of the NRCS. The survey found that the awareness of the NRCS is very low among respondents interviewed in Gauteng, especially young, African and Lower Living Standards Measure (LSM) respondents. According to the survey’s results, the NRCS has to intensify its marketing activities by using conventional media such as television, radio and newspapers as the preferred channels of communications.
43NRCS Annual Report 2013/2014 42 NRCS Annual Report 2013/2014
Programme Performance81
PERFORMANCE AGAINST THE ANNUAL PERFORMANCE PLAN
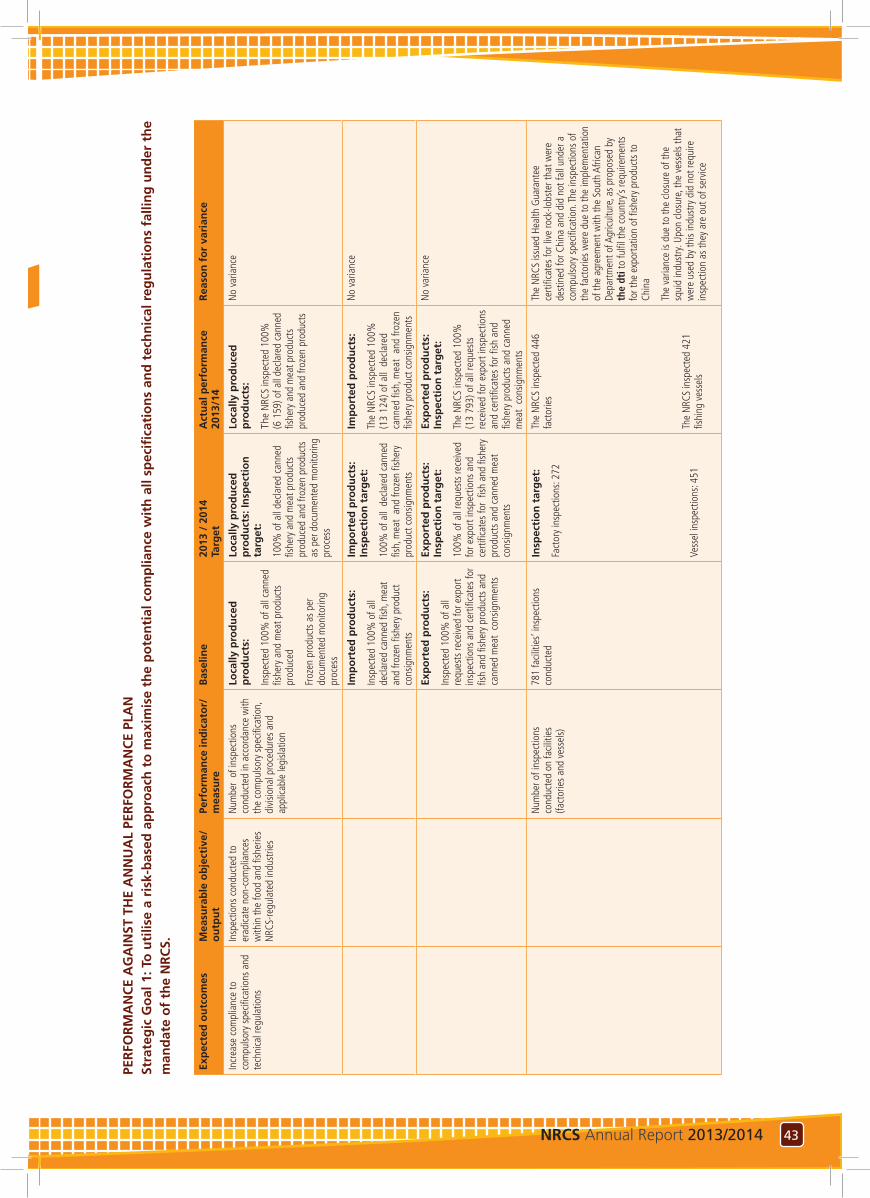
43NRCS Annual Report 2013/2014 42 NRCS Annual Report 2013/2014
PER
FOR
MA
NC
E A
GA
INST
TH
E A
NN
UA
L PE
RFO
RM
AN
CE
PLA
N
Stra
teg
ic G
oal
1: T
o u
tilis
e a
risk
-bas
ed a
pp
roac
h t
o m
axim
ise
the
po
ten
tial
co
mp
lian
ce w
ith
all
spec
ifica
tio
ns
and
tec
hn
ical
reg
ula
tio
ns
falli
ng
un
der
th
e m
and
ate
of
the
NR
CS.
Exp
ecte
d o
utc
om
es
Mea
sura
ble
ob
ject
ive/
o
utp
ut
Perf
orm
ance
ind
icat
or/
mea
sure
Bas
elin
e20
13 /
201
4Ta
rget
Act
ual
per
form
ance
20
13/1
4R
easo
n f
or
vari
ance
Incr
ease
com
plia
nce
to
com
pulso
ry s
pecifi
catio
ns a
nd
tech
nica
l reg
ulat
ions
Insp
ectio
ns c
ondu
cted
to
erad
icate
non
-com
plia
nces
w
ithin
the
food
and
fish
erie
s N
RCS-
regu
late
d in
dust
ries
Num
ber
of in
spec
tions
co
nduc
ted
in a
ccor
danc
e w
ith
the
com
pulso
ry s
pecifi
catio
n,
divi
siona
l pro
cedu
res
and
appl
icabl
e le
gisla
tion
Loca
lly p
rod
uce
d
pro
du
cts:
Insp
ecte
d 10
0% o
f all
cann
ed
fishe
ry a
nd m
eat p
rodu
cts
prod
uced
Froz
en p
rodu
cts
as p
er
docu
men
ted
mon
itorin
g pr
oces
s
Loca
lly p
rod
uce
d
pro
du
cts:
Insp
ecti
on
ta
rget
:
100%
of a
ll de
clare
d ca
nned
fis
hery
and
mea
t pro
duct
s pr
oduc
ed a
nd fr
ozen
pro
duct
s as
per
doc
umen
ted
mon
itorin
g pr
oces
s
Loca
lly p
rod
uce
d
pro
du
cts:
The
NRC
S in
spec
ted
100%
(6
159
) of a
ll de
clare
d ca
nned
fis
hery
and
mea
t pro
duct
s pr
oduc
ed a
nd fr
ozen
pro
duct
s
No
varia
nce
Imp
ort
ed p
rod
uct
s:
Insp
ecte
d 10
0% o
f all
de
clare
d ca
nned
fish
, mea
t an
d fro
zen
fishe
ry p
rodu
ct
cons
ignm
ents
Imp
ort
ed p
rod
uct
s:
Insp
ecti
on
tar
get
:
100%
of a
ll d
ecla
red
cann
ed
fish,
mea
t an
d fro
zen
fishe
ry
prod
uct c
onsig
nmen
ts
Imp
ort
ed p
rod
uct
s:
The
NRC
S in
spec
ted
100%
(1
3 12
4) o
f all
dec
lare
d ca
nned
fish
, mea
t an
d fro
zen
fishe
ry p
rodu
ct c
onsig
nmen
ts
No
varia
nce
Exp
ort
ed p
rod
uct
s:
Insp
ecte
d 10
0% o
f all
requ
ests
rece
ived
for e
xpor
t in
spec
tions
and
cer
tifica
tes
for
fish
and
fishe
ry p
rodu
cts
and
cann
ed m
eat
cons
ignm
ents
Exp
ort
ed p
rod
uct
s:
Insp
ecti
on
tar
get
:
100%
of a
ll re
ques
ts re
ceiv
ed
for e
xpor
t ins
pect
ions
and
ce
rtific
ates
for
fish
and
fishe
ry
prod
ucts
and
can
ned
mea
t co
nsig
nmen
ts
Exp
ort
ed p
rod
uct
s:
Insp
ecti
on
tar
get
:
The
NRC
S in
spec
ted
100%
(1
3 79
3) o
f all
requ
ests
re
ceiv
ed fo
r exp
ort i
nspe
ctio
ns
and
certi
ficat
es fo
r fish
and
fis
hery
pro
duct
s an
d ca
nned
m
eat
cons
ignm
ents
No
varia
nce
Num
ber o
f ins
pect
ions
co
nduc
ted
on fa
ciliti
es
(fact
orie
s an
d ve
ssel
s)
781
facil
ities
’ ins
pect
ions
co
nduc
ted
Insp
ecti
on
tar
get
:
Fact
ory
insp
ectio
ns: 2
72
Vess
el in
spec
tions
: 451
The
NRC
S in
spec
ted
446
fact
orie
s
The
NRC
S in
spec
ted
421
fishi
ng v
esse
ls
The
NRC
S iss
ued
Heal
th G
uara
ntee
ce
rtific
ates
for l
ive
rock
-lobs
ter t
hat w
ere
dest
ined
for C
hina
and
did
not
fall
unde
r a
com
pulso
ry s
pecifi
catio
n. Th
e in
spec
tions
of
the
fact
orie
s w
ere
due
to th
e im
plem
enta
tion
of th
e ag
reem
ent w
ith th
e So
uth
Afric
an
Depa
rtmen
t of A
gricu
lture
, as
prop
osed
by
the
dti t
o fu
lfil t
he c
ount
ry’s
requ
irem
ents
fo
r the
exp
orta
tion
of fi
sher
y pr
oduc
ts to
Ch
ina
The
varia
nce
is du
e to
the
closu
re o
f the
sq
uid
indu
stry
. Upo
n clo
sure
, the
ves
sels
that
w
ere
used
by
this
indu
stry
did
not
requ
ire
insp
ectio
n as
they
are
out
of s
ervi
ce
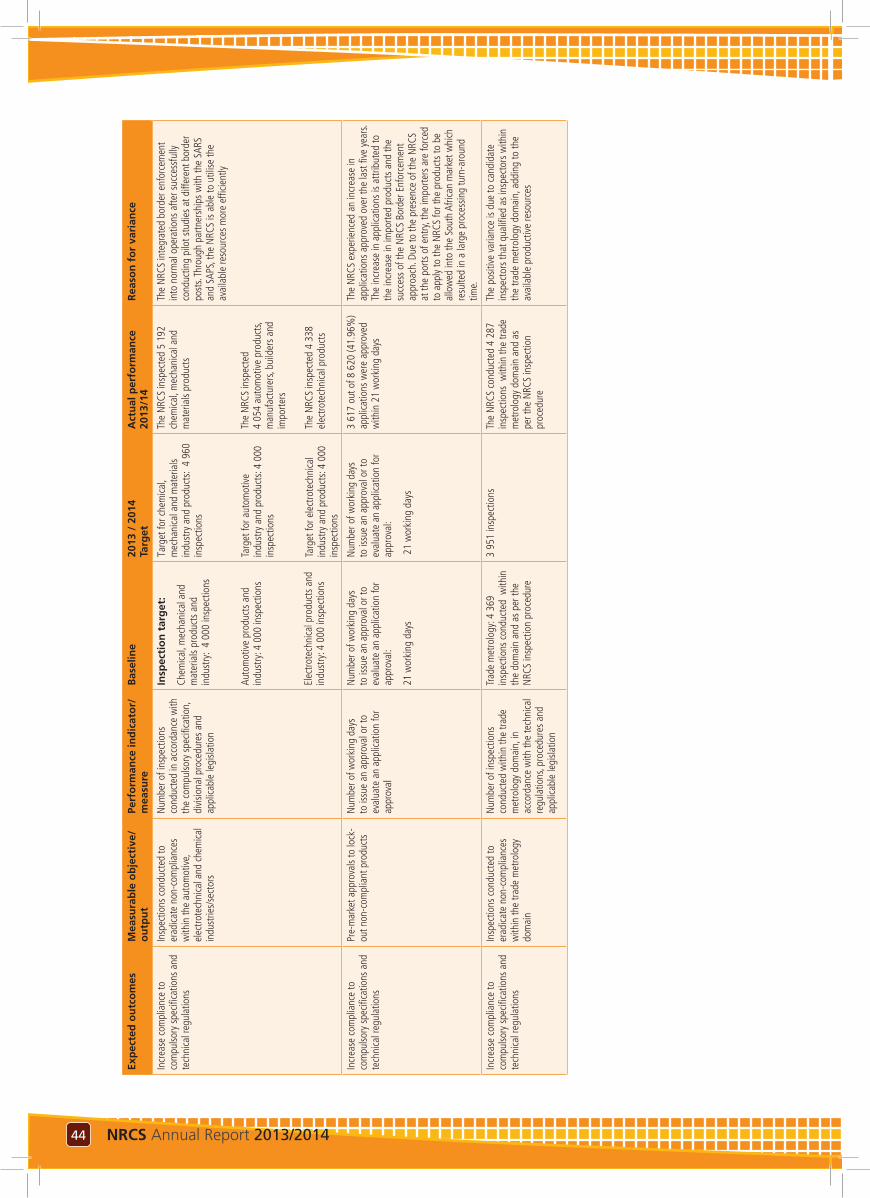
45NRCS Annual Report 2013/2014 44 NRCS Annual Report 2013/2014
Exp
ecte
d o
utc
om
es
Mea
sura
ble
ob
ject
ive/
o
utp
ut
Perf
orm
ance
ind
icat
or/
mea
sure
Bas
elin
e20
13 /
201
4Ta
rget
Act
ual
per
form
ance
20
13/1
4R
easo
n f
or
vari
ance
Incr
ease
com
plia
nce
to
com
pulso
ry s
pecifi
catio
ns a
nd
tech
nica
l reg
ulat
ions
Insp
ectio
ns c
ondu
cted
to
erad
icate
non
-com
plia
nces
w
ithin
the
auto
mot
ive,
el
ectro
tech
nica
l and
che
mica
l in
dust
ries/
sect
ors
Num
ber o
f ins
pect
ions
co
nduc
ted
in a
ccor
danc
e w
ith
the
com
pulso
ry s
pecifi
catio
n,
divi
siona
l pro
cedu
res
and
appl
icabl
e le
gisla
tion
Insp
ecti
on
tar
get
:
Chem
ical,
mec
hani
cal a
nd
mat
eria
ls pr
oduc
ts a
nd
indu
stry
: 4
000
insp
ectio
ns
Auto
mot
ive
prod
ucts
and
in
dust
ry: 4
000
insp
ectio
ns
Elec
trote
chni
cal p
rodu
cts
and
indu
stry
: 4 0
00 in
spec
tions
Targ
et fo
r che
mica
l, m
echa
nica
l and
mat
eria
ls
indu
stry
and
pro
duct
s: 4
960
in
spec
tions
Targ
et fo
r aut
omot
ive
indu
stry
and
pro
duct
s: 4
000
insp
ectio
ns
Targ
et fo
r ele
ctro
tech
nica
l in
dust
ry a
nd p
rodu
cts:
4 00
0 in
spec
tions
The
NRC
S in
spec
ted
5 19
2
chem
ical,
mec
hani
cal a
nd
mat
eria
ls pr
oduc
ts
The
NRC
S in
spec
ted
4
054
auto
mot
ive
prod
ucts
, m
anuf
actu
rers
, bui
lder
s an
d im
porte
rs
The
NRC
S in
spec
ted
4 33
8
elec
trote
chni
cal p
rodu
cts
The
NRC
S in
tegr
ated
bor
der e
nfor
cem
ent
into
nor
mal
ope
ratio
ns a
fter s
ucce
ssfu
lly
cond
uctin
g pi
lot s
tudi
es a
t diff
eren
t bor
der
post
s. Th
roug
h pa
rtner
ship
s w
ith th
e SA
RS
and
SAPS
, the
NRC
S is
able
to u
tilise
the
avai
labl
e re
sour
ces
mor
e ef
ficie
ntly
Incr
ease
com
plia
nce
to
com
pulso
ry s
pecifi
catio
ns a
nd
tech
nica
l reg
ulat
ions
Pre-
mar
ket a
ppro
vals
to lo
ck-
out n
on-c
ompl
iant
pro
duct
sN
umbe
r of w
orki
ng d
ays
to is
sue
an a
ppro
val o
r to
eval
uate
an
appl
icatio
n fo
r ap
prov
al
Num
ber o
f wor
king
day
s to
issu
e an
app
rova
l or t
o ev
alua
te a
n ap
plica
tion
for
appr
oval
:
21 w
orki
ng d
ays
Num
ber o
f wor
king
day
s to
issu
e an
app
rova
l or t
o ev
alua
te a
n ap
plica
tion
for
appr
oval
:
21
wor
king
day
s
3 61
7 ou
t of 8
620
(41.
96%
) ap
plica
tions
wer
e ap
prov
ed
with
in 2
1 w
orki
ng d
ays
The
NRC
S ex
perie
nced
an
incr
ease
in
appl
icatio
ns a
ppro
ved
over
the
last
five
yea
rs.
The
incr
ease
in a
pplic
atio
ns is
attr
ibut
ed to
th
e in
crea
se in
impo
rted
prod
ucts
and
the
succ
ess
of th
e N
RCS
Bord
er E
nfor
cem
ent
appr
oach
. Due
to th
e pr
esen
ce o
f the
NRC
S at
the
ports
of e
ntry
, the
impo
rters
are
forc
ed
to a
pply
to th
e N
RCS
for t
he p
rodu
cts
to b
e al
low
ed in
to th
e So
uth
Afric
an m
arke
t whi
ch
resu
lted
in a
larg
e pr
oces
sing
turn
-aro
und
time.
Incr
ease
com
plia
nce
to
com
pulso
ry s
pecifi
catio
ns a
nd
tech
nica
l reg
ulat
ions
Insp
ectio
ns c
ondu
cted
to
erad
icate
non
-com
plia
nces
w
ithin
the
trade
met
rolo
gy
dom
ain
Num
ber o
f ins
pect
ions
co
nduc
ted
with
in th
e tra
de
met
rolo
gy d
omai
n, in
ac
cord
ance
with
the
tech
nica
l re
gula
tions
, pro
cedu
res
and
appl
icabl
e le
gisla
tion
Trad
e m
etro
logy
: 4 3
69
insp
ectio
ns c
ondu
cted
with
in
the
dom
ain
and
as p
er th
e N
RCS
insp
ectio
n pr
oced
ure
3 95
1 in
spec
tions
Th
e N
RCS
cond
ucte
d 4
287
insp
ectio
ns w
ithin
the
trade
m
etro
logy
dom
ain
and
as
per t
he N
RCS
insp
ectio
n pr
oced
ure
The
posit
ive
varia
nce
is du
e to
can
dida
te
insp
ecto
rs th
at q
ualifi
ed a
s in
spec
tors
with
in
the
trade
met
rolo
gy d
omai
n, a
ddin
g to
the
avai
labl
e pr
oduc
tive
reso
urce
s
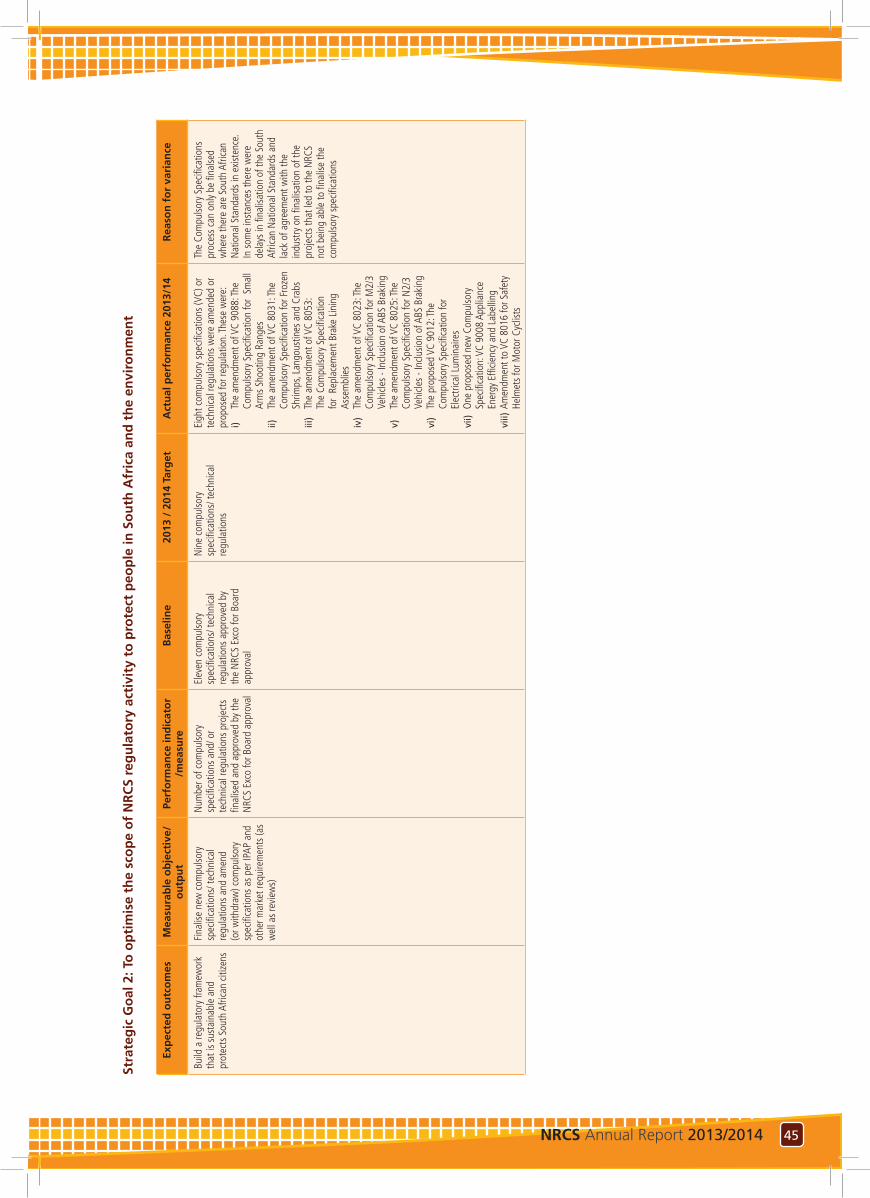
45NRCS Annual Report 2013/2014 44 NRCS Annual Report 2013/2014
Stra
teg
ic G
oal
2: T
o o
pti
mis
e th
e sc
op
e o
f N
RC
S re
gu
lato
ry a
ctiv
ity
to p
rote
ct p
eop
le in
So
uth
Afr
ica
and
th
e en
viro
nm
ent
Exp
ecte
d o
utc
om
es
Mea
sura
ble
ob
ject
ive/
ou
tpu
tPe
rfo
rman
ce in
dic
ato
r /m
easu
reB
asel
ine
2013
/ 2
014
Targ
etA
ctu
al p
erfo
rman
ce 2
013/
14R
easo
n f
or
vari
ance
Build
a re
gula
tory
fram
ewor
k th
at is
sus
tain
able
and
pr
otec
ts S
outh
Afri
can
citize
ns
Fina
lise
new
com
pulso
ry
spec
ifica
tions
/ tec
hnica
l re
gula
tions
and
am
end
(or w
ithdr
aw) c
ompu
lsory
sp
ecifi
catio
ns a
s pe
r IPA
P an
d ot
her m
arke
t req
uire
men
ts (a
s w
ell a
s re
view
s)
Num
ber o
f com
pulso
ry
spec
ifica
tions
and
/ or
tech
nica
l reg
ulat
ions
pro
ject
s fin
alise
d an
d ap
prov
ed b
y th
e N
RCS
Exco
for B
oard
app
rova
l
Elev
en c
ompu
lsory
sp
ecifi
catio
ns/ t
echn
ical
regu
latio
ns a
ppro
ved
by
the
NRC
S Ex
co fo
r Boa
rd
appr
oval
Nin
e co
mpu
lsory
sp
ecifi
catio
ns/ t
echn
ical
regu
latio
ns
Eigh
t com
pulso
ry s
pecifi
catio
ns (V
C) o
r te
chni
cal r
egul
atio
ns w
ere
amen
ded
or
prop
osed
for r
egul
atio
n. Th
ese
wer
e:
i) Th
e am
endm
ent o
f VC
9088
: The
Co
mpu
lsory
Spe
cifica
tion
for
Smal
l Ar
ms
Shoo
ting
Rang
esii)
Th
e am
endm
ent o
f VC
8031
: The
Co
mpu
lsory
Spe
cifica
tion
for F
roze
n Sh
rimps
, Lan
gous
tines
and
Cra
bsiii
) Th
e am
endm
ent o
f VC
8053
: Th
e Co
mpu
lsory
Spe
cifica
tion
for
Repl
acem
ent B
rake
Lin
ing
Asse
mbl
ies
iv)
The
amen
dmen
t of V
C 80
23: T
he
Com
pulso
ry S
pecifi
catio
n fo
r M2/
3 Ve
hicle
s - I
nclu
sion
of A
BS B
raki
ng
v)
The
amen
dmen
t of V
C 80
25: T
he
Com
pulso
ry S
pecifi
catio
n fo
r N2/
3 Ve
hicle
s - I
nclu
sion
of A
BS B
raki
ngvi
) Th
e pr
opos
ed V
C 90
12: T
he
Com
pulso
ry S
pecifi
catio
n fo
r El
ectri
cal L
umin
aire
svi
i) O
ne p
ropo
sed
new
Com
pulso
ry
Spec
ifica
tion:
VC
9008
App
lianc
e En
ergy
Effi
cienc
y an
d La
belli
ngvi
ii) A
men
dmen
t to
VC 8
016
for S
afet
y He
lmet
s fo
r Mot
or C
yclis
ts
The
Com
pulso
ry S
pecifi
catio
ns
proc
ess
can
only
be fi
nalse
d w
here
ther
e ar
e So
uth
Afric
an
Nat
iona
l Sta
ndar
ds in
exi
sten
ce.
In s
ome
inst
ance
s th
ere
wer
e de
lays
in fi
nalis
atio
n of
the
Sout
h Af
rican
Nat
iona
l Sta
ndar
ds a
nd
lack
of a
gree
men
t with
the
indu
stry
on
final
isatio
n of
the
proj
ects
that
led
to th
e N
RCS
not b
eing
abl
e to
fina
lise
the
com
pulso
ry s
pecifi
catio
ns
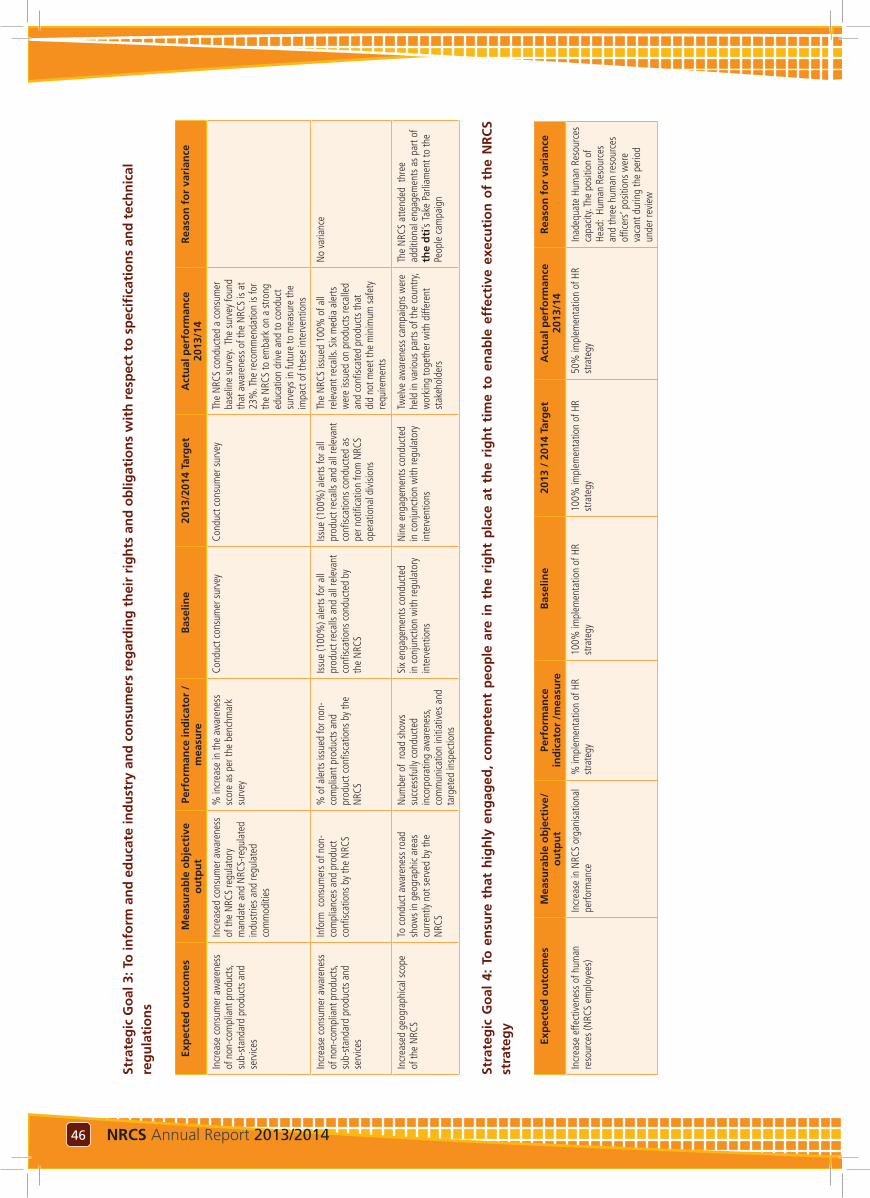
47NRCS Annual Report 2013/2014 46 NRCS Annual Report 2013/2014
Stra
teg
ic G
oal
3: T
o in
form
an
d e
du
cate
ind
ust
ry a
nd
co
nsu
mer
s re
gar
din
g t
hei
r ri
gh
ts a
nd
ob
ligat
ion
s w
ith
res
pec
t to
sp
ecifi
cati
on
s an
d t
ech
nic
al
reg
ula
tio
ns
Exp
ecte
d o
utc
om
es
Mea
sura
ble
ob
ject
ive
ou
tpu
tPe
rfo
rman
ce in
dic
ato
r /
mea
sure
Bas
elin
e20
13/2
014
Targ
etA
ctu
al p
erfo
rman
ce
2013
/14
Rea
son
fo
r va
rian
ce
Incr
ease
con
sum
er a
war
enes
s of
non
-com
plia
nt p
rodu
cts,
sub-
stan
dard
pro
duct
s an
d se
rvice
s
Incr
ease
d co
nsum
er a
war
enes
s of
the
NRC
S re
gula
tory
m
anda
te a
nd N
RCS-
regu
late
d in
dust
ries
and
regu
late
d co
mm
oditi
es
% in
crea
se in
the
awar
enes
s sc
ore
as p
er th
e be
nchm
ark
surv
ey
Cond
uct c
onsu
mer
sur
vey
Cond
uct c
onsu
mer
sur
vey
The
NRC
S co
nduc
ted
a co
nsum
er
base
line
surv
ey.
The
surv
ey fo
und
that
aw
aren
ess
of th
e N
RCS
is at
23
%. T
he re
com
men
datio
n is
for
the
NRC
S to
em
bark
on
a st
rong
ed
ucat
ion
driv
e an
d to
con
duct
su
rvey
s in
futu
re to
mea
sure
the
impa
ct o
f the
se in
terv
entio
ns
Incr
ease
con
sum
er a
war
enes
s of
non
-com
plia
nt p
rodu
cts,
sub-
stan
dard
pro
duct
s an
d se
rvice
s
Info
rm c
onsu
mer
s of
non
-co
mpl
ianc
es a
nd p
rodu
ct
confi
scat
ions
by
the
NRC
S
% o
f ale
rts is
sued
for n
on-
com
plia
nt p
rodu
cts
and
prod
uct c
onfis
catio
ns b
y th
e N
RCS
Issue
(100
%) a
lerts
for a
ll pr
oduc
t rec
alls
and
all r
elev
ant
confi
scat
ions
con
duct
ed b
y th
e N
RCS
Issue
(100
%) a
lerts
for a
ll pr
oduc
t rec
alls
and
all r
elev
ant
confi
scat
ions
con
duct
ed a
s pe
r not
ifica
tion
from
NRC
S op
erat
iona
l div
ision
s
The
NRC
S iss
ued
100%
of a
ll re
leva
nt re
calls
. Six
med
ia a
lerts
w
ere
issue
d on
pro
duct
s re
calle
d an
d co
nfisc
ated
pro
duct
s th
at
did
not m
eet t
he m
inim
um s
afet
y re
quire
men
ts
No
varia
nce
Incr
ease
d ge
ogra
phica
l sco
pe
of th
e N
RCS
To c
ondu
ct a
war
enes
s ro
ad
show
s in
geo
grap
hic
area
s cu
rrent
ly no
t ser
ved
by th
e N
RCS
Num
ber o
f ro
ad s
how
s
succ
essf
ully
cond
ucte
d in
corp
orat
ing
awar
enes
s, co
mm
unica
tion
initi
ativ
es a
nd
targ
eted
insp
ectio
ns
Six
enga
gem
ents
con
duct
ed
in c
onju
nctio
n w
ith re
gula
tory
in
terv
entio
ns
Nin
e en
gage
men
ts c
ondu
cted
in
con
junc
tion
with
regu
lato
ry
inte
rven
tions
Twel
ve a
war
enes
s ca
mpa
igns
wer
e he
ld in
var
ious
par
ts o
f the
cou
ntry
, w
orki
ng to
geth
er w
ith d
iffer
ent
stak
ehol
ders
The
NRC
S at
tend
ed t
hree
ad
ditio
nal e
ngag
emen
ts a
s pa
rt of
th
e d
ti’s
Take
Par
liam
ent t
o th
e Pe
ople
cam
paig
n
Stra
teg
ic G
oal
4:
To e
nsu
re t
hat
hig
hly
en
gag
ed,
com
pet
ent
peo
ple
are
in
th
e ri
gh
t p
lace
at
the
rig
ht
tim
e to
en
able
eff
ecti
ve e
xecu
tio
n o
f th
e N
RC
S st
rate
gy
Exp
ecte
d o
utc
om
es
Mea
sura
ble
ob
ject
ive/
ou
tpu
tPe
rfo
rman
ce
ind
icat
or
/mea
sure
Bas
elin
e20
13 /
201
4 Ta
rget
Act
ual
per
form
ance
20
13/1
4R
easo
n f
or
vari
ance
Incr
ease
effe
ctiv
enes
s of
hum
an
reso
urce
s (N
RCS
empl
oyee
s)
Incr
ease
in N
RCS
orga
nisa
tiona
l pe
rform
ance
%
impl
emen
tatio
n of
HR
stra
tegy
10
0% im
plem
enta
tion
of H
R st
rate
gy
100%
impl
emen
tatio
n of
HR
stra
tegy
50
% im
plem
enta
tion
of H
R st
rate
gyIn
adeq
uate
Hum
an R
esou
rces
ca
pacit
y. Th
e po
sitio
n of
He
ad:
Hum
an R
esou
rces
an
d th
ree
hum
an re
sour
ces
offic
ers’
pos
ition
s w
ere
vaca
nt d
urin
g th
e pe
riod
unde
r rev
iew
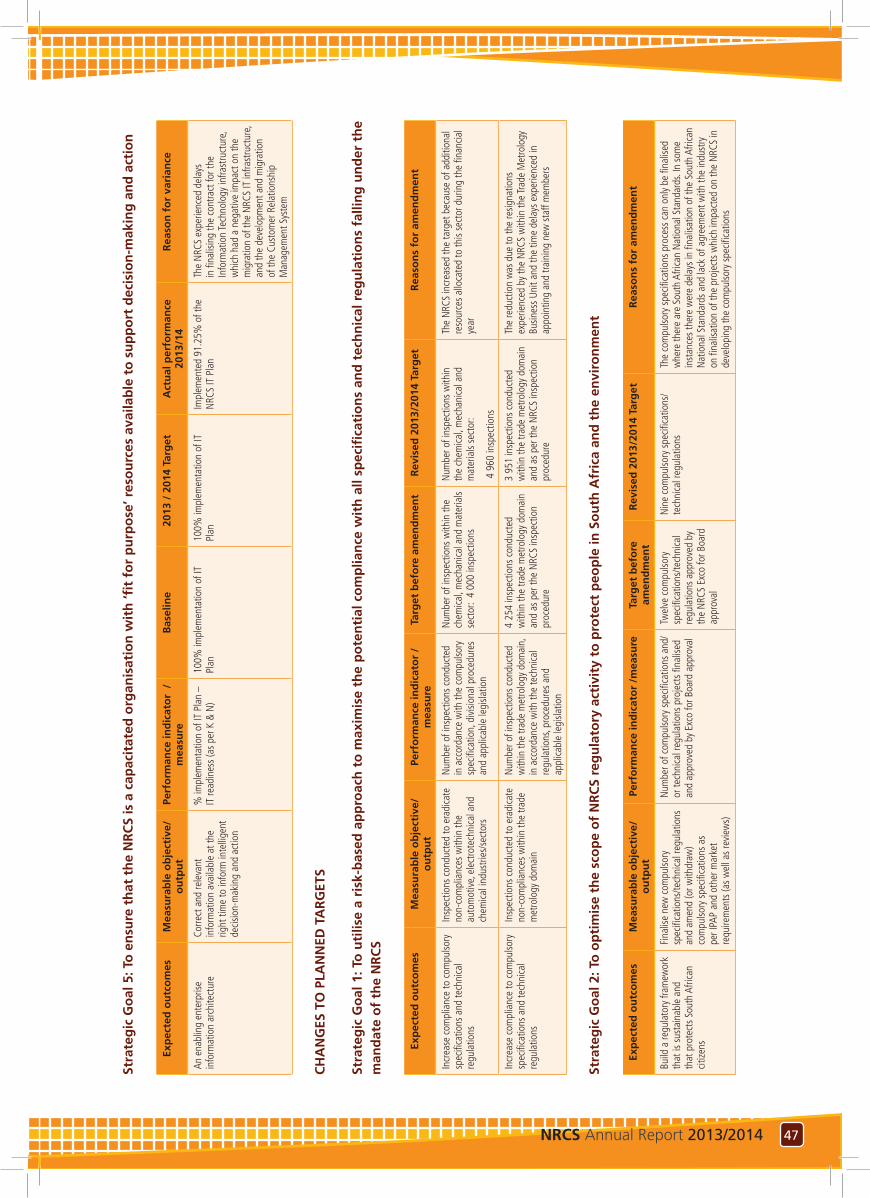
47NRCS Annual Report 2013/2014 46 NRCS Annual Report 2013/2014
Stra
teg
ic G
oal
5: T
o e
nsu
re t
hat
th
e N
RC
S is
a c
apac
itat
ed o
rgan
isat
ion
wit
h ‘fi
t fo
r p
urp
ose
’ res
ou
rces
ava
ilab
le t
o s
up
po
rt d
ecis
ion
-mak
ing
an
d a
ctio
n
Exp
ecte
d o
utc
om
es
Mea
sura
ble
ob
ject
ive/
ou
tpu
tPe
rfo
rman
ce in
dic
ato
r /
mea
sure
Bas
elin
e20
13 /
201
4 Ta
rget
Act
ual
per
form
ance
20
13/1
4R
easo
n f
or
vari
ance
An e
nabl
ing
ente
rpris
e in
form
atio
n ar
chite
ctur
e Co
rrect
and
rele
vant
in
form
atio
n av
aila
ble
at th
e rig
ht ti
me
to in
form
inte
llige
nt
decis
ion-
mak
ing
and
actio
n
% im
plem
enta
tion
of IT
Pla
n –
IT re
adin
ess
(as
per K
& N
)10
0% im
plem
enta
tion
of IT
Pl
an10
0% im
plem
enta
tion
of IT
Pl
anIm
plem
ente
d 91
.25%
of t
he
NRC
S IT
Pla
nTh
e N
RCS
expe
rienc
ed d
elay
s in
fina
lisin
g th
e co
ntra
ct fo
r the
In
form
atio
n Te
chno
logy
infra
stru
ctur
e,
whi
ch h
ad a
neg
ativ
e im
pact
on
the
mig
ratio
n of
the
NRC
S IT
infra
stru
ctur
e,
and
the
deve
lopm
ent a
nd m
igra
tion
of th
e Cu
stom
er R
elat
ions
hip
Man
agem
ent S
yste
m
CH
AN
GES
TO
PLA
NN
ED T
AR
GET
S
Stra
teg
ic G
oal
1: T
o u
tilis
e a
risk
-bas
ed a
pp
roac
h t
o m
axim
ise
the
po
ten
tial
co
mp
lian
ce w
ith
all
spec
ifica
tio
ns
and
tec
hn
ical
reg
ula
tio
ns
falli
ng
un
der
th
e m
and
ate
of
the
NR
CS
Exp
ecte
d o
utc
om
es
Mea
sura
ble
ob
ject
ive/
o
utp
ut
Perf
orm
ance
ind
icat
or
/m
easu
reTa
rget
bef
ore
am
end
men
t R
evis
ed 2
013/
2014
Tar
get
Rea
son
s fo
r am
end
men
t
Incr
ease
com
plia
nce
to c
ompu
lsory
sp
ecifi
catio
ns a
nd te
chni
cal
regu
latio
ns
Insp
ectio
ns c
ondu
cted
to e
radi
cate
no
n-co
mpl
ianc
es w
ithin
the
auto
mot
ive,
ele
ctro
tech
nica
l and
ch
emica
l ind
ustri
es/s
ecto
rs
Num
ber o
f ins
pect
ions
con
duct
ed
in a
ccor
danc
e w
ith th
e co
mpu
lsory
sp
ecifi
catio
n, d
ivisi
onal
pro
cedu
res
and
appl
icabl
e le
gisla
tion
Num
ber o
f ins
pect
ions
with
in th
e ch
emica
l, m
echa
nica
l and
mat
eria
ls se
ctor
: 4
000
insp
ectio
ns
Num
ber o
f ins
pect
ions
with
in
the
chem
ical,
mec
hani
cal a
nd
mat
eria
ls se
ctor
:
4 9
60 in
spec
tions
The
NRC
S in
crea
sed
the
targ
et b
ecau
se o
f add
ition
al
reso
urce
s al
loca
ted
to th
is se
ctor
dur
ing
the
finan
cial
year
Incr
ease
com
plia
nce
to c
ompu
lsory
sp
ecifi
catio
ns a
nd te
chni
cal
regu
latio
ns
Insp
ectio
ns c
ondu
cted
to e
radi
cate
no
n-co
mpl
ianc
es w
ithin
the
trade
m
etro
logy
dom
ain
Num
ber o
f ins
pect
ions
con
duct
ed
with
in th
e tra
de m
etro
logy
dom
ain,
in
acc
orda
nce
with
the
tech
nica
l re
gula
tions
, pro
cedu
res
and
appl
icabl
e le
gisla
tion
4 25
4 in
spec
tions
con
duct
ed
with
in th
e tra
de m
etro
logy
dom
ain
and
as p
er th
e N
RCS
insp
ectio
n pr
oced
ure
3 95
1 in
spec
tions
con
duct
ed
with
in th
e tra
de m
etro
logy
dom
ain
and
as p
er th
e N
RCS
insp
ectio
n pr
oced
ure
The
redu
ctio
n w
as d
ue to
the
resig
natio
ns
expe
rienc
ed b
y th
e N
RCS
with
in th
e Tr
ade
Met
rolo
gy
Busin
ess
Unit
and
the
time
dela
ys e
xper
ienc
ed in
ap
poin
ting
and
train
ing
new
sta
ff m
embe
rs
Stra
teg
ic G
oal
2: T
o o
pti
mis
e th
e sc
op
e o
f N
RC
S re
gu
lato
ry a
ctiv
ity
to p
rote
ct p
eop
le in
So
uth
Afr
ica
and
th
e en
viro
nm
ent
Exp
ecte
d o
utc
om
es
Mea
sura
ble
ob
ject
ive/
ou
tpu
tPe
rfo
rman
ce in
dic
ato
r /m
easu
reTa
rget
bef
ore
am
end
men
t R
evis
ed 2
013/
2014
Tar
get
Rea
son
s fo
r am
end
men
t
Build
a re
gula
tory
fram
ewor
k th
at is
sus
tain
able
and
th
at p
rote
cts
Sout
h Af
rican
cit
izens
Fina
lise
new
com
pulso
ry
spec
ifica
tions
/tech
nica
l reg
ulat
ions
an
d am
end
(or w
ithdr
aw)
com
pulso
ry s
pecifi
catio
ns a
s pe
r IPA
P an
d ot
her m
arke
t re
quire
men
ts (a
s w
ell a
s re
view
s)
Num
ber o
f com
pulso
ry s
pecifi
catio
ns a
nd/
or te
chni
cal r
egul
atio
ns p
roje
cts
final
ised
and
appr
oved
by
Exco
for B
oard
app
rova
l
Twel
ve c
ompu
lsory
sp
ecifi
catio
ns/te
chni
cal
regu
latio
ns a
ppro
ved
by
the
NRC
S Ex
co fo
r Boa
rd
appr
oval
Nin
e co
mpu
lsory
spe
cifica
tions
/ te
chni
cal r
egul
atio
ns
The
com
pulso
ry s
pecifi
catio
ns p
roce
ss c
an o
nly
be fi
nalis
ed
whe
re th
ere
are
Sout
h Af
rican
Nat
iona
l Sta
ndar
ds. I
n so
me
inst
ance
s th
ere
wer
e de
lays
in fi
nalis
atio
n of
the
Sout
h Af
rican
N
atio
nal S
tand
ards
and
lack
of a
gree
men
t with
the
indu
stry
on
fina
lisat
ion
of th
e pr
ojec
ts w
hich
impa
cted
on
the
NRC
S in
de
velo
ping
the
com
pulso
ry s
pecifi
catio
ns
49NRCS Annual Report 2013/2014 48 NRCS Annual Report 2013/2014
GOVERNANCE REPORT
Introduction
The National Regulator for Compulsory Specifications was established on 1 September 2008 with the promulgation of the National Regulator for Compulsory Specifications Act (NRCS Act), No. 5 of 2008 and is mainly responsible for the administration of three Acts that reside under its jurisdiction. These are the NRCS Act, the Trade Metrology Act, No.77 of 1973 and the National Building Regulations and Building Standards Act, No.103 of 1977. Furthermore, the organisation administers regulations that fall under the jurisdiction of other government departments, as per agreement with the respective departments.
As a public entity, the NRCS is guided by the Protocol on Good Corporate Governance, as defined in the Public Finance Management Act (PFMA), No. 1 of 1999. In managing its activities, the organisation strives to achieve transparency, accountability, efficiency and the effective use of resources.
The Board as accounting authority
The NRCS’s Board of Directors is appointed by the Minister of Trade and Industry in terms of the NRCS Act. The Board is required to provide vision and leadership to the NRCS in a way that will enhance shareholder value and ensure long-term sustainable growth of the NRCS. With effect from 1 June 2013, the Minister of Trade and Industry appointed Mr Jeff Molobela as Chairperson of the Board and Mr Paul Serote as an additional member of the Board. The
PART C GOVERNANCE
CEO of the NRCS is also a member of the Board. Before June 2013, the NRCS had an acting CEO. The Minister appointed the CEO with effect from 13 June 2013.
The Board, during its meetings, noted the following, among others:
• Information and Communication Technology (ICT) is a major challenge within the NRCS. As a result the Board is in the process of appointing independent members to the ICT Steering Committee to provide guidance and to ensure that the ICT infrastructure is able to provide the best support to the core mandate of the NRCS;
• Border Enforcement – The Board approved that the Border Enforcement project move to the “roll-out” phase as it has proven to be successful. Its full implementation will result in a considerably more efficient and effective NRCS;
• Inspection strategies – After considering international developments, the NRCS is continuing to consider different strategies to obtain assurance that sub-standard products will be kept out of the South African economy. The Board continues to deliberate on various strategies which can lead to an increase in the compliance of products with compulsory specifications;
• Human Resources – The Board has noted that to enable the NRCS to deliver on its core mandate, an efficient and effective HR component is required. Capacitation of the HR function and the filling of identified vacancies is therefore a priority.
91
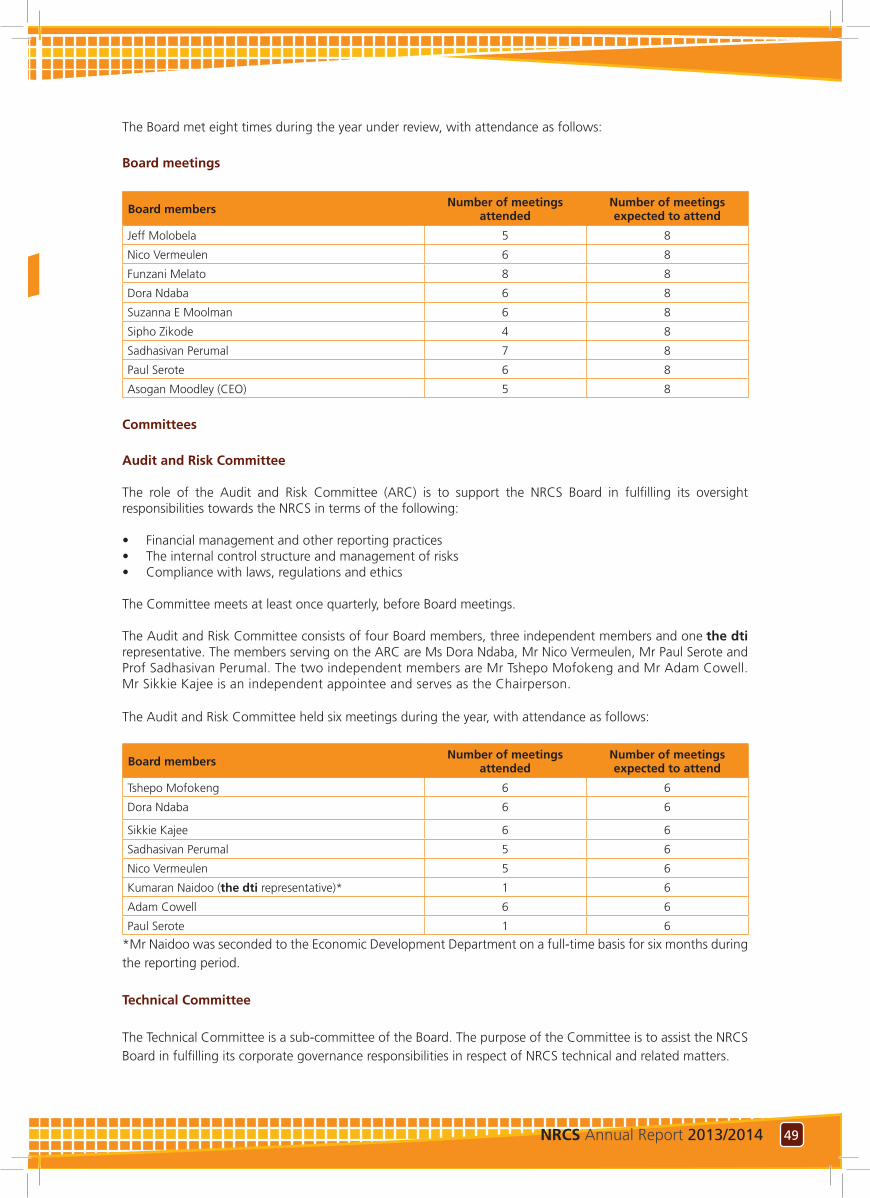
49NRCS Annual Report 2013/2014 48 NRCS Annual Report 2013/2014
The Board met eight times during the year under review, with attendance as follows:
Board meetings
Board members Number of meetings attended
Number of meetings expected to attend
Jeff Molobela 5 8
Nico Vermeulen 6 8
Funzani Melato 8 8
Dora Ndaba 6 8
Suzanna E Moolman 6 8
Sipho Zikode 4 8
Sadhasivan Perumal 7 8
Paul Serote 6 8
Asogan Moodley (CEO) 5 8
Committees
Audit and Risk Committee
The role of the Audit and Risk Committee (ARC) is to support the NRCS Board in fulfilling its oversight responsibilities towards the NRCS in terms of the following:
• Financial management and other reporting practices• The internal control structure and management of risks• Compliance with laws, regulations and ethics
The Committee meets at least once quarterly, before Board meetings.
The Audit and Risk Committee consists of four Board members, three independent members and one the dti representative. The members serving on the ARC are Ms Dora Ndaba, Mr Nico Vermeulen, Mr Paul Serote and Prof Sadhasivan Perumal. The two independent members are Mr Tshepo Mofokeng and Mr Adam Cowell. Mr Sikkie Kajee is an independent appointee and serves as the Chairperson.
The Audit and Risk Committee held six meetings during the year, with attendance as follows:
Board members Number of meetings attended
Number of meetings expected to attend
Tshepo Mofokeng 6 6
Dora Ndaba 6 6
Sikkie Kajee 6 6
Sadhasivan Perumal 5 6
Nico Vermeulen 5 6
Kumaran Naidoo (the dti representative)* 1 6
Adam Cowell 6 6
Paul Serote 1 6
*Mr Naidoo was seconded to the Economic Development Department on a full-time basis for six months during the reporting period.
Technical Committee
The Technical Committee is a sub-committee of the Board. The purpose of the Committee is to assist the NRCS Board in fulfilling its corporate governance responsibilities in respect of NRCS technical and related matters.
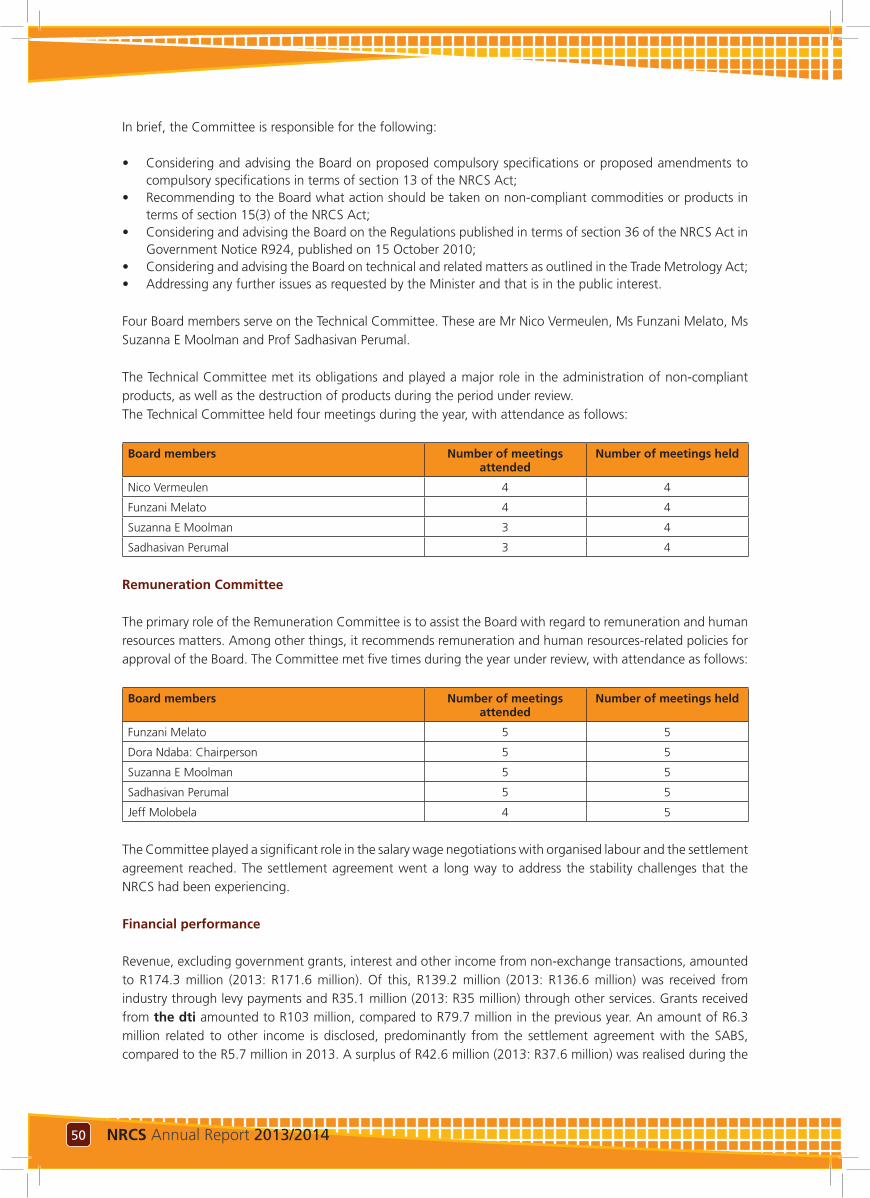
51NRCS Annual Report 2013/2014 50 NRCS Annual Report 2013/2014
In brief, the Committee is responsible for the following:
• Considering and advising the Board on proposed compulsory specifications or proposed amendments to compulsory specifications in terms of section 13 of the NRCS Act;
• Recommending to the Board what action should be taken on non-compliant commodities or products in terms of section 15(3) of the NRCS Act;
• Considering and advising the Board on the Regulations published in terms of section 36 of the NRCS Act in Government Notice R924, published on 15 October 2010;
• Considering and advising the Board on technical and related matters as outlined in the Trade Metrology Act; • Addressing any further issues as requested by the Minister and that is in the public interest.
Four Board members serve on the Technical Committee. These are Mr Nico Vermeulen, Ms Funzani Melato, Ms Suzanna E Moolman and Prof Sadhasivan Perumal.
The Technical Committee met its obligations and played a major role in the administration of non-compliant products, as well as the destruction of products during the period under review. The Technical Committee held four meetings during the year, with attendance as follows:
Board members Number of meetings attended
Number of meetings held
Nico Vermeulen 4 4
Funzani Melato 4 4
Suzanna E Moolman 3 4
Sadhasivan Perumal 3 4
Remuneration Committee
The primary role of the Remuneration Committee is to assist the Board with regard to remuneration and human resources matters. Among other things, it recommends remuneration and human resources-related policies for approval of the Board. The Committee met five times during the year under review, with attendance as follows:
Board members Number of meetings attended
Number of meetings held
Funzani Melato 5 5
Dora Ndaba: Chairperson 5 5
Suzanna E Moolman 5 5
Sadhasivan Perumal 5 5
Jeff Molobela 4 5
The Committee played a significant role in the salary wage negotiations with organised labour and the settlement agreement reached. The settlement agreement went a long way to address the stability challenges that the NRCS had been experiencing.
Financial performance
Revenue, excluding government grants, interest and other income from non-exchange transactions, amounted to R174.3 million (2013: R171.6 million). Of this, R139.2 million (2013: R136.6 million) was received from industry through levy payments and R35.1 million (2013: R35 million) through other services. Grants received from the dti amounted to R103 million, compared to R79.7 million in the previous year. An amount of R6.3 million related to other income is disclosed, predominantly from the settlement agreement with the SABS, compared to the R5.7 million in 2013. A surplus of R42.6 million (2013: R37.6 million) was realised during the
51NRCS Annual Report 2013/2014 50 NRCS Annual Report 2013/2014
12 months ended 31 March 2014. Cash on hand at the end of the year amounted to R150.9 million in comparison to R119.4 million in the previous year.
The NRCS received qualified audit opinion on revenue and personnel costs for the 2013/14 financial year.
REVENUE
Whilst considerable effort was awarded towards correcting the completion and timing of the revenuerecognised through levies, further work still needs to be done in order to provide the assurance that the levy revenue that is reflected on the financial statements is correct. In this regard we have implemented the following:
• A customer relations management (CRM) system
is in the final stages of being deployed and will
enable data to be captured real time electronically.
This will also enable levy payers to register with
the NCRS electronically. This data will enable the
organisation to ensure that all known levy payers
are recognised on the financial systems
• A thorough analysis of existing financial systems
is underway, in order to enhance capabilities and
functionality
• An application has been made to the Minister
of Trade and Industry to gazette that levy payers
declare their volumes to the NRCS on a quarterly
basis, as opposed to the bi-annual declarations
being made currently. Quarterly declarations will
enable the NRCS to record accrued revenue in
the correct accounting period
• Applicable legislation is being reviewed to
encourage levy payers to timeously and
accurately disclose production volumes and
make levy payments to the NRCS. Penalties for
non-compliance are also being investigated
PAYROLL
The qualifications relating to payroll arose as a result of incomplete documentation being available on the employee files. The large majority of files were obtained from the SABS when the Regulatory Division of SABS became a separate entity, called the NRCS. The non-availability of documentation to substantiate payments made to employees’ pursuant to a wage settlement agreement with organised labour, resulted
in remuneration as well as all balance sheet related employee costs being called into question.
The organisation has already implemented a comprehensive project to locate and correctly file all necessary documentation and conduct a complete evaluation of the 2013/14 payroll.
Events subsequent to the statement of financial position
The bargaining unit salary negotiations effective from 1 July 2013 were concluded on 6 May 2014. The Legal Metrology Bill was signed by the President on 16 May 2014, as detailed earlier on in the report.
Materiality framework
The NRCS, in accordance with the PFMA, has adopted and implemented a materiality framework. The materiality framework is updated annually as part of the strategic planning process and is included in the strategic plan. The NRCS determined its materiality quantum as 0.85% of total revenue.
Property, plant and equipment
The assessment of useful life and residual value of property, plant and equipment was evaluated by management and adjustments made, which are reflected in the financial statements. This will be assessed annually.
Risk management
Risk management is a tool that enables management to identify threats and activities that, should they arise, may negatively impact on the ability of the NRCS to accomplish its objectives. It also creates an environment where management is able to prioritise risks and develop a risk response strategy in accordance with the NRCS materiality framework. The Accounting Authority is responsible for ensuring that the NRCS has and maintains effective, efficient and transparent systems of financial and risk management, as well as internal control.
In managing risks, the NRCS instituted a system of internal controls, including policies and procedures, to assist in the orderly conduct of business. The organisation conducted a risk assessment exercise at
53NRCS Annual Report 2013/2014 52 NRCS Annual Report 2013/2014
a corporate level to identify risks that may impact on accomplishing its key objectives, as outlined in the NRCS’s Strategic Plan. Risk assessments were also conducted at departmental level to identify, rate and prioritise operational risks. Operational risks are managed by management at Business Unit level.
Beyond the management of strategic risks, the Audit and Risk Committee played a significant role in identifying strategic areas of concern for the organisation. This culminated in the formulation of the Audit and Risk Workshop Matrix that was used to track achievement against set targets. Management used the matrix and the risk registers to conduct quarterly performance assessments and review internal controls.
The Audit and Risk Committee played a significant role in ensuring compliance with good corporate governance principles, aiding the Board in the management of the NRCS’s risks.
Internal audit
Internal audit is an independent objective assurance and consulting activity designed to add value and improve the organisation’s operations. It helps the organisation accomplish its objectives by bringing a systematic disciplined approach to evaluate and improve the adequacy of risk management, control and governance processes.
The NRCS considers compliance with applicable laws, regulations, codes and its own ethical standards and internal policies to be an integral part of its business culture. Internal audit is designed to add value and improve the NRCS’s operation. Internal audit also provides a systematic disciplined approach to evaluate and improve the effectiveness of risk management, control and governance process. It follows the business approach, which is risk-based and primarily responsible for the execution of operational and compliance audits, performance audits, financial audits, IT audits, forensic audits as well as ad hoc assignments.
The internal audit function has, in consultation with the Audit and Risk Committee, prepared the following:• A three-year rolling strategic Internal Audit Plan
based on its assessment of key areas of risk for the
NRCS, having regard for its current operations, the operations proposed in its Corporate or Strategic Plan and its Risk Management Strategy
• An annual Internal Audit Plan • Plans indicating the scope, cost and time lines of
each audit in the annual internal audit plan• Audit reports were directed to the Audit and Risk
Committee detailing its performance against the plan, to allow for effective monitoring and intervention when necessary
The Internal Audit function is a co-sourced function with the full-time employees being assisted by an outside service provider. The function works in co-ordination with the Auditor-General of South Africa, in order to ensure proper coverage and minimise duplication of effort. Internal audit assisted the Accounting Authority in maintaining controls by evaluating those controls and by developing recommendations for enhancement or improvement. It also assisted the Accounting Authority in achieving the objectives of the NRCS by evaluating and developing recommendations for the enhancement or improvement of the processes through which the following can be done:
• Objectives and values are established and communicated;
• The accomplishment of objectives is monitored; • Accountability is ensured; • Corporate values are preserved; • The adequacy and effectiveness of the system of
internal controls are reviewed and appraised; • The relevance, reliability and integrity of
management, financial and operating data, and reports are appraised;
• Systems established to ensure compliance with policies, plans, procedures, statutory requirements and regulations, which could have a significant impact on operations, are reviewed;
• The means of safeguarding assets are reviewed and, as appropriate, the existence of such assets is verified;
• The economy, efficiency and effectiveness with which resources are employed are appraised;
• The results of operations or programmes are reviewed to ascertain whether results are consistent with the NRCS’s established objectives and goals, and whether the operations or programmes are being carried out as planned;
• The adequacy of established systems and procedures is assessed.
53NRCS Annual Report 2013/2014 52 NRCS Annual Report 2013/2014
Information and Communication Technology
The Information and Communication Technology (ICT) Department is responsible for the provision of information technology systems and support for the NRCS. The NRCS’s primary consideration in managing its ICT is its sustainability, its performance assurance and the ability of the Information and Systems Management Section to execute the identified NRCS priorities. The NRCS has embarked on the implementation of a customer relations management system and IT infrastructure for the organisation.
Development of a customer relations management system
The NRCS awarded a project for the implementation of a customer relations management (CRM) system, which is envisaged to enhance services to customers. The system will also add mobility to inspectors, who will be able to access and conduct their duties remotely, and will improve the dissemination of information. The new system will transform NRCS processes from manual systems to digital processing and storage environments, making services accessible using web-based and mobile technology.
This project will see increased collaboration with other relevant organisations and government departments in realising an integrated system for sharing information, especially the SARS risk engine. This is in line with the strategic plan for locking out non-compliant commodities from the South African economy. The use of information technology to link data sources for business intelligence through collaboration with the SARS will improve the inspections at points of entry. This project is now at a pilot stage and implementation will be finalised during the 2014/15 financial year.
Implementation of an ICT Infrastructure
During the 2013/14 financial year the NRCS implemented an ICT infrastructure to provide an efficient, stable and accessible ICT environment. The ICT infrastructure was designed to achieve interoperability and scalability to ensure easy provisioning of new services and communication with other external systems. The new IT platform is geared to achieve performance, security, availability and safety of NRCS systems. A dual firewall is implemented and managed separately to improve security. The IT platform was designed to cater for disaster recovery (DR) by implementation of two mirror sites to ensure business continuity and data recovery in case of a disaster. Improvement of the IT platform for the 2014/15 financial year will focus on bandwidth increase to improve accessibility and migrate its telephony services at regional sites from analogue to Voice over Internet Protocol (VoIP). The NRCS will also focus on implementing an ERP system that will seek to automate processes in support services, especially in the Finance, Human Resources and Supply Chain Management departments.
Board approval
The NRCS Board approved the Annual Financial Statements and the Annual Performance Plan for the 2014 financial year.
Mr Jeff Molobela Chairperson of the NRCS Board
Mr Asogan MoodleyCEO of the NRCS
55NRCS Annual Report 2013/2014 54 NRCS Annual Report 2013/2014
AUDIT AND RISK COMMITTEE REPORT
We are pleased to present our report for the financial year ended 31 March 2014.
The Audit and Risk Committee for the year ended 31 March 2014 comprised of eight members - four non-executive Board members, two independent external members, the dti representative and the independent Chairperson. The Committee convened six times during the period. The Chief Executive Officer (CEO), Chief Financial Officer (CFO), Chief Audit Executive (CAE), Chief Risk Officer and representatives of the Auditor-General are standing invitees at each meeting of the Audit and Risk Committee, which also enjoys direct access to these attendees in the fulfilment of its duties. Other executives and managers are invited to attend for agenda items covering audit findings or business matters which relate to their areas of responsibility.
Audit and Risk Committee responsibility
During the financial year under review, the Audit and Risk Committee complied with its responsibilities arising from section 38 (1) (a) of the PFMA and Treasury Regulations 3.1.13.
The Audit and Risk Committee operates in terms of approved terms of reference in the form of the Audit and Risk Committee Charter and has conducted its affairs in compliance with this charter. The Audit and Risk Committee has furthermore discharged its responsibilities as contained therein.
Effectiveness of internal control The systems of internal control are designed to provide cost-effective assurance that assets are safeguarded and that liabilities and working capital are efficiently managed.
From the various reports of the internal auditors and the Auditor-General, the Audit and Risk Committee has noted some significant improvement on internal financial control systems, including supply chain management, general internal control environment, as well acceptable compliance with laid down procedures. Together with the CEO, appropriate action is taken to deal with other deficiencies and to prevent the recurrence of certain control failures.
The business environment of the organisation was
severely disrupted by wage settlement agreements
and the grading process for a large part of the
reporting year. Critical positions in Human Resources
Management were vacant during the reporting
year which resulted in certain officials acting in
these positions. This disrupted the operations of the
organisation, resulting in certain control deficiencies
being experienced during the financial year.
An Internal Audit function has been established
internally and is supported by resources from a
specialist firm until such time as the Business Unit is
able to perform all of the work required in terms of
the approved audit plan.
Concerns regarding weaknesses in human resources
management, supply chain and asset management
have been identified. Management has developed
and is implementing a plan to address these control
weaknesses and regular progress reports will be
submitted to the Audit and Risk Committee.
In line with the PFMA, internal audit plans and
reports are provided to the Audit and Risk Committee
and management with the intention of providing
assurance that key internal controls are appropriate
and effective. This is achieved by means of an
appropriate quarterly reporting process, as well as
the identification of corrective actions and suggested
enhancements to the controls and processes. The
internal auditors use the organisation’s risk framework
to prepare their audit coverage plan and to prioritise
audit work in the high risk areas.
Based on the audits conducted and presented to the
Audit and Risk Committee for the 2013/14 financial
year, the Committee concludes overall that the
internal controls evaluated during those audits were
partially adequate and therefore not entirely effective
to provide reasonable assurance that the objectives
will be achieved, with particular attention being
required in the areas referred to above. The internal
auditors however noted significant improvements in
the system of internal controls as compared to the
prior financial years and therefore these improvements
provide reasonable assurance that going forward, the
control objectives will be fully achieved.
55NRCS Annual Report 2013/2014 54 NRCS Annual Report 2013/2014
Quality of management reports
The Audit and Risk Committee is generally satisfied with the content and quality of the quarterly reports as prepared and issued by management during the year under review in terms of the PFMA for both finance and performance information. Evaluation of the financial statements
The Audit and Risk Committee has:
• Reviewed and discussed with management and the Auditor-General the audited Annual Financial Statements and the Auditor-General’s qualified audit report included in the Annual Report
• Reviewed the appropriateness of accounting policies and practices
• Reviewed significant adjustments, resulting from the annual audit
The Audit and Risk Committee has discussed, concurs with and accepts the conclusions of the Auditor-General on the Annual Financial Statements read together with the Report of the Auditor-General, and recommends these to the Accounting Authority for acceptance and inclusion in the annual report.
SAH Kajee Chairperson of the Audit and Risk Committee
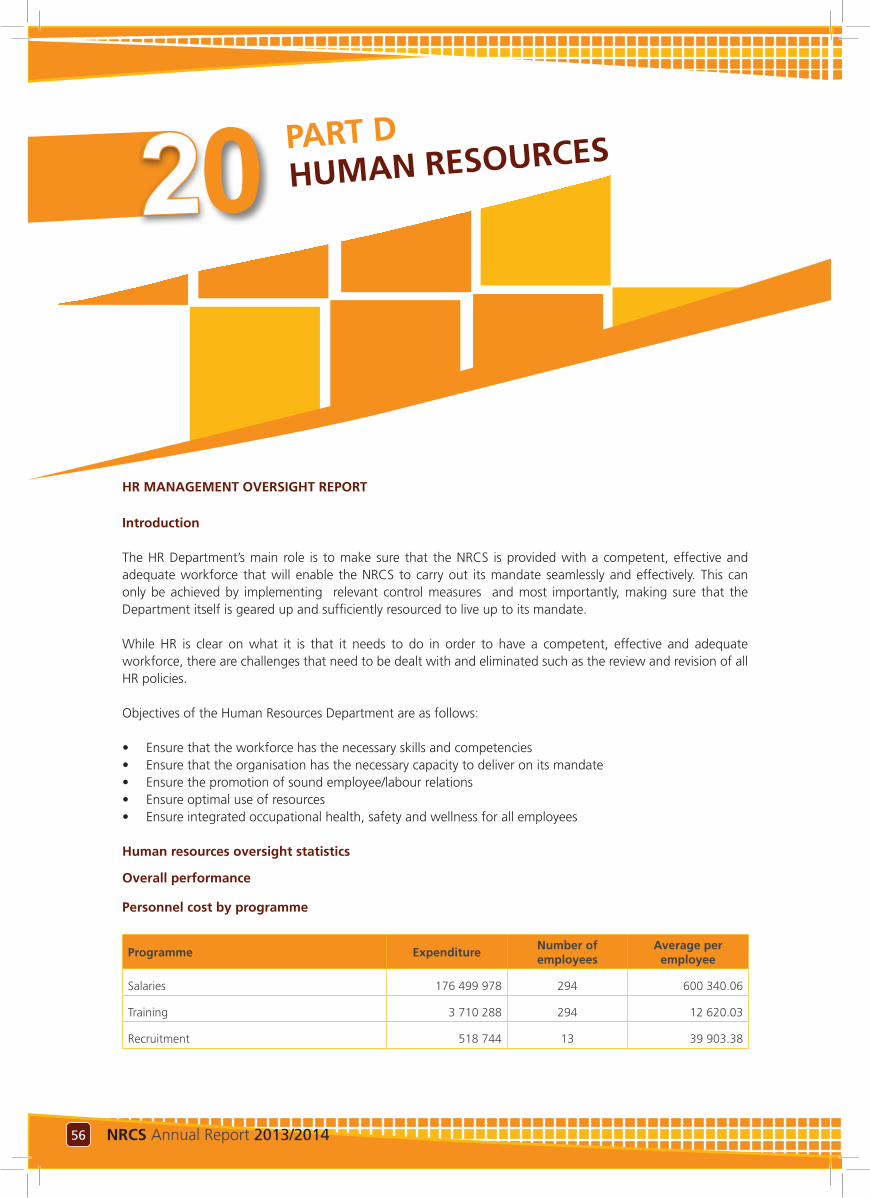
57NRCS Annual Report 2013/2014 56 NRCS Annual Report 2013/2014
PART D HUMAN RESOURCES
HR MANAGEMENT OVERSIGHT REPORT
Introduction
The HR Department’s main role is to make sure that the NRCS is provided with a competent, effective and adequate workforce that will enable the NRCS to carry out its mandate seamlessly and effectively. This can only be achieved by implementing relevant control measures and most importantly, making sure that the Department itself is geared up and sufficiently resourced to live up to its mandate.
While HR is clear on what it is that it needs to do in order to have a competent, effective and adequate workforce, there are challenges that need to be dealt with and eliminated such as the review and revision of all HR policies.
Objectives of the Human Resources Department are as follows:
• Ensure that the workforce has the necessary skills and competencies • Ensure that the organisation has the necessary capacity to deliver on its mandate• Ensure the promotion of sound employee/labour relations• Ensure optimal use of resources • Ensure integrated occupational health, safety and wellness for all employees
Human resources oversight statistics
Overall performance
Personnel cost by programme
Programme ExpenditureNumber of employees
Average per employee
Salaries 176 499 978 294 600 340.06
Training 3 710 288 294 12 620.03
Recruitment 518 744 13 39 903.38
02
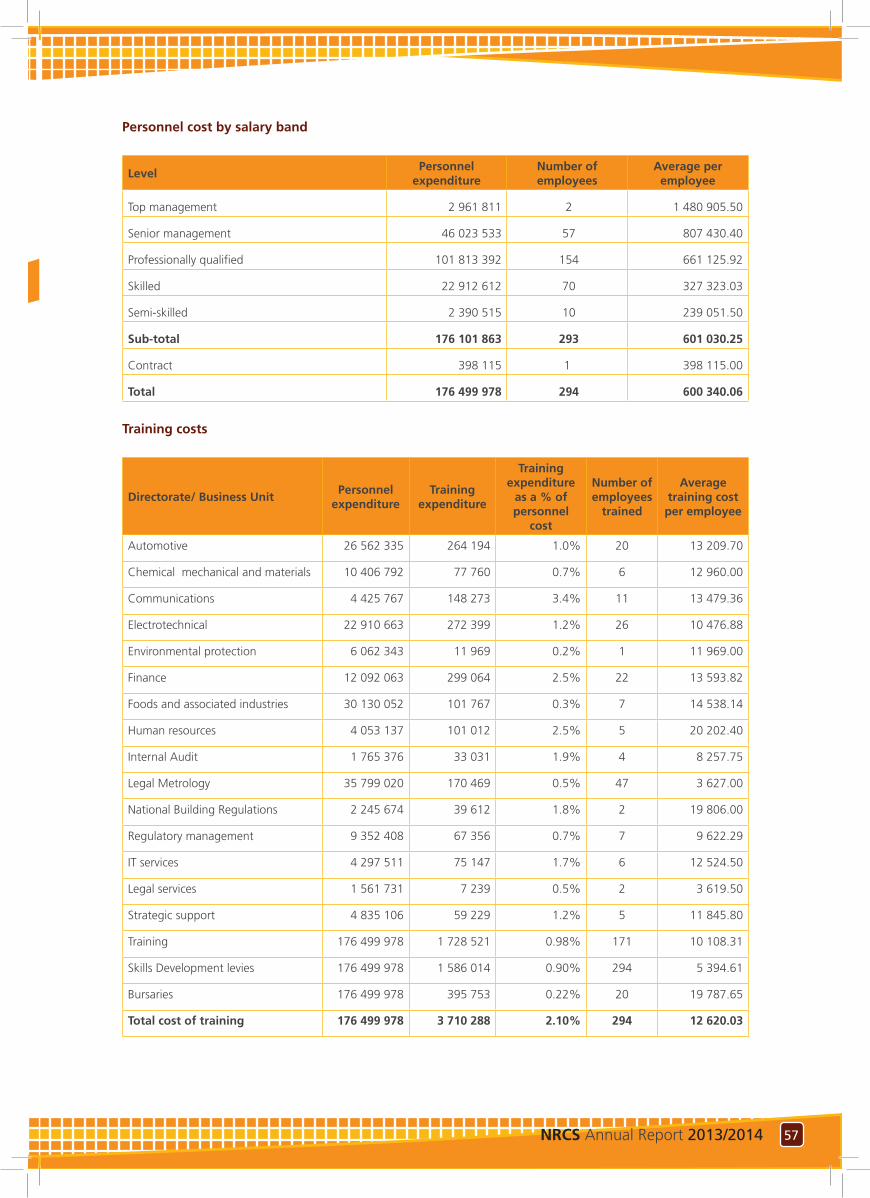
57NRCS Annual Report 2013/2014 56 NRCS Annual Report 2013/2014
Personnel cost by salary band
LevelPersonnel
expenditureNumber of employees
Average per employee
Top management 2 961 811 2 1 480 905.50
Senior management 46 023 533 57 807 430.40
Professionally qualified 101 813 392 154 661 125.92
Skilled 22 912 612 70 327 323.03
Semi-skilled 2 390 515 10 239 051.50
Sub-total 176 101 863 293 601 030.25
Contract 398 115 1 398 115.00
Total 176 499 978 294 600 340.06
Training costs
Directorate/ Business UnitPersonnel
expenditureTraining
expenditure
Training expenditure
as a % of personnel
cost
Number of employees
trained
Average training cost
per employee
Automotive 26 562 335 264 194 1.0% 20 13 209.70
Chemical mechanical and materials 10 406 792 77 760 0.7% 6 12 960.00
Communications 4 425 767 148 273 3.4% 11 13 479.36
Electrotechnical 22 910 663 272 399 1.2% 26 10 476.88
Environmental protection 6 062 343 11 969 0.2% 1 11 969.00
Finance 12 092 063 299 064 2.5% 22 13 593.82
Foods and associated industries 30 130 052 101 767 0.3% 7 14 538.14
Human resources 4 053 137 101 012 2.5% 5 20 202.40
Internal Audit 1 765 376 33 031 1.9% 4 8 257.75
Legal Metrology 35 799 020 170 469 0.5% 47 3 627.00
National Building Regulations 2 245 674 39 612 1.8% 2 19 806.00
Regulatory management 9 352 408 67 356 0.7% 7 9 622.29
IT services 4 297 511 75 147 1.7% 6 12 524.50
Legal services 1 561 731 7 239 0.5% 2 3 619.50
Strategic support 4 835 106 59 229 1.2% 5 11 845.80
Training 176 499 978 1 728 521 0.98% 171 10 108.31
Skills Development levies 176 499 978 1 586 014 0.90% 294 5 394.61
Bursaries 176 499 978 395 753 0.22% 20 19 787.65
Total cost of training 176 499 978 3 710 288 2.10% 294 12 620.03
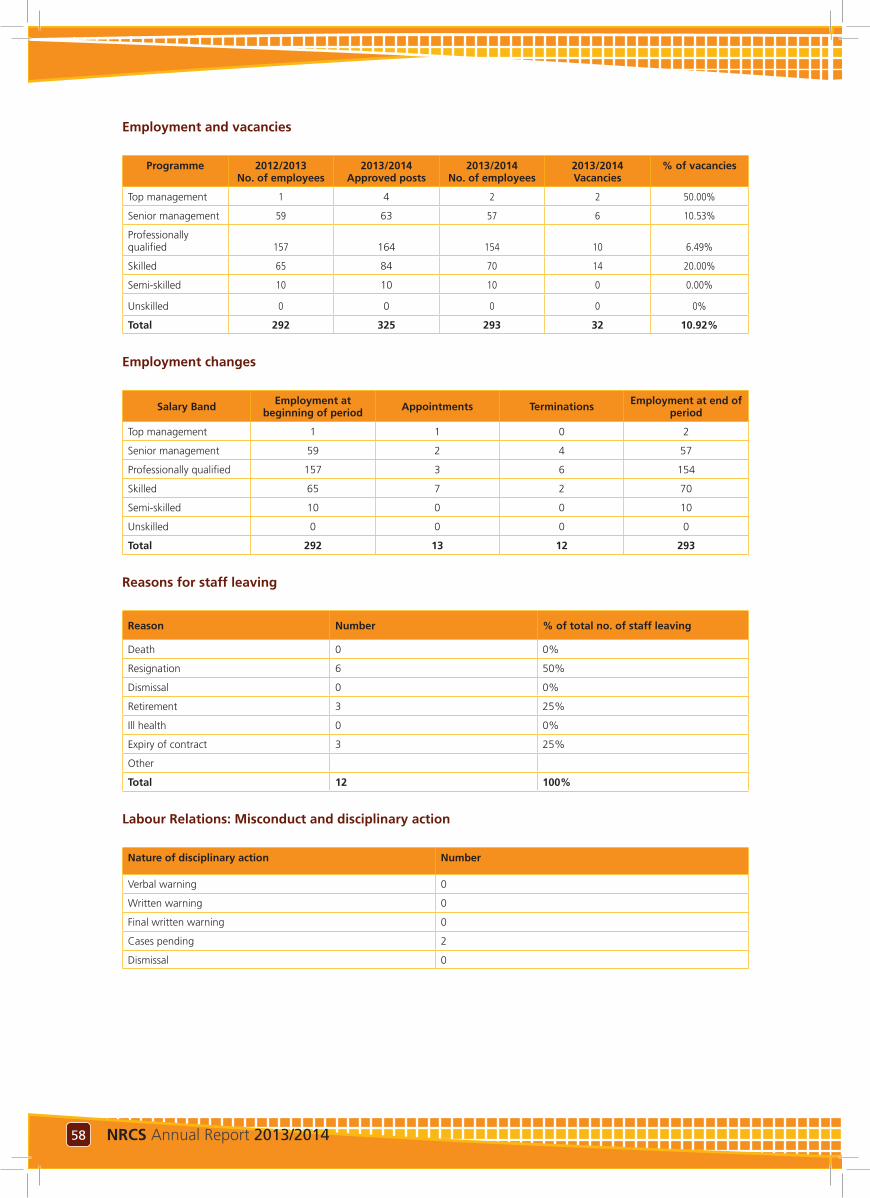
59NRCS Annual Report 2013/2014 58 NRCS Annual Report 2013/2014
Employment and vacancies
Programme 2012/2013 No. of employees
2013/2014 Approved posts
2013/2014No. of employees
2013/2014 Vacancies
% of vacancies
Top management 1 4 2 2 50.00%
Senior management 59 63 57 6 10.53%
Professionally qualified 157 164 154 10 6.49%
Skilled 65 84 70 14 20.00%
Semi-skilled 10 10 10 0 0.00%
Unskilled 0 0 0 0 0%
Total 292 325 293 32 10.92%
Employment changes
Salary Band Employment at beginning of period Appointments Terminations Employment at end of
period
Top management 1 1 0 2
Senior management 59 2 4 57
Professionally qualified 157 3 6 154
Skilled 65 7 2 70
Semi-skilled 10 0 0 10
Unskilled 0 0 0 0
Total 292 13 12 293
Reasons for staff leaving
Reason Number % of total no. of staff leaving
Death 0 0%
Resignation 6 50%
Dismissal 0 0%
Retirement 3 25%
Ill health 0 0%
Expiry of contract 3 25%
Other
Total 12 100%
Labour Relations: Misconduct and disciplinary action
Nature of disciplinary action Number
Verbal warning 0
Written warning 0
Final written warning 0
Cases pending 2
Dismissal 0
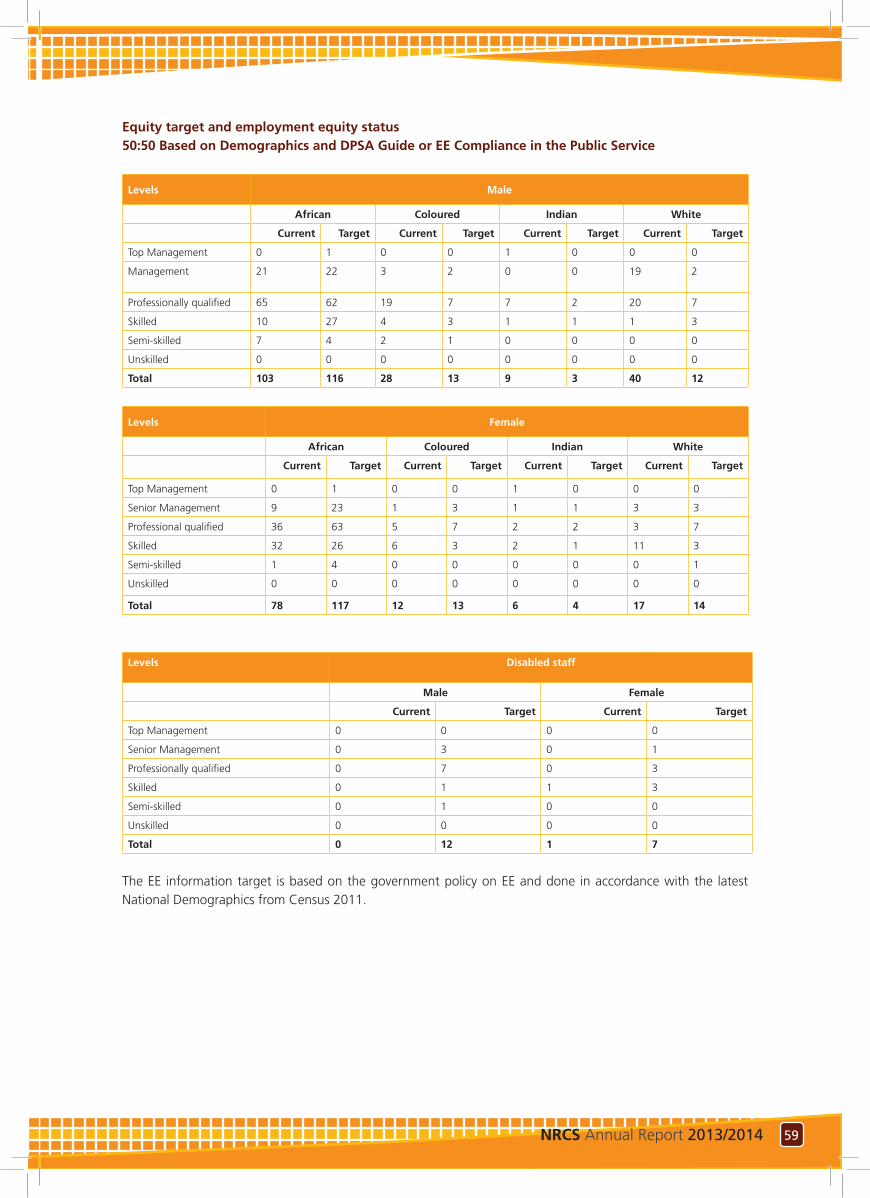
59NRCS Annual Report 2013/2014 58 NRCS Annual Report 2013/2014
Equity target and employment equity status 50:50 Based on Demographics and DPSA Guide or EE Compliance in the Public Service
Levels Male
African Coloured Indian White
Current Target Current Target Current Target Current Target
Top Management 0 1 0 0 1 0 0 0
Management 21 22 3 2 0 0 19 2
Professionally qualified 65 62 19 7 7 2 20 7
Skilled 10 27 4 3 1 1 1 3
Semi-skilled 7 4 2 1 0 0 0 0
Unskilled 0 0 0 0 0 0 0 0
Total 103 116 28 13 9 3 40 12
Levels Female
African Coloured Indian White
Current Target Current Target Current Target Current Target
Top Management 0 1 0 0 1 0 0 0
Senior Management 9 23 1 3 1 1 3 3
Professional qualified 36 63 5 7 2 2 3 7
Skilled 32 26 6 3 2 1 11 3
Semi-skilled 1 4 0 0 0 0 0 1
Unskilled 0 0 0 0 0 0 0 0
Total 78 117 12 13 6 4 17 14
Levels Disabled staff
Male Female
Current Target Current Target
Top Management 0 0 0 0
Senior Management 0 3 0 1
Professionally qualified 0 7 0 3
Skilled 0 1 1 3
Semi-skilled 0 1 0 0
Unskilled 0 0 0 0
Total 0 12 1 7
The EE information target is based on the government policy on EE and done in accordance with the latest National Demographics from Census 2011.
61NRCS Annual Report 2013/2014 60 NRCS Annual Report 2013/2014
Conclusion
The NRCS recognises that for the Human Resources Department to make a significant impact, it will have to transform its traditional, transactional role to a strategic, value-added one. This will require a transition of the HR Department from the conventional delivery of transactional HR services, to the adoption of those practices and roles through which Human Resources adds competitive value to the operations of the NRCS. As a key function concerned with the management of people, Human Resources has the potential to act as the catalyst for maximising the value that employees can contribute. However, at the moment there is a general recognition within the NRCS that one of the key focus areas of the HR Department must be to stabilise the core transactional human resource services. An important factor in improving the Department’s capabilities is ensuring that the core human resource services are administered in a timely and accurate manner. This includes payroll, leave and benefits administration, as well as the technical aspects of recruitment. As part of overall HR transformation efforts, Human Resources has focused on increasing its capacity both in terms of the requisite skills and numbers of employees within the Department, as well as making some changes in the HR organisational structure and internal HR processes and systems.
61NRCS Annual Report 2013/2014 60 NRCS Annual Report 2013/2014
PART E FINANCIALS
Annual Financial Statementsfor the year ended 31 March 2014
12
62 NRCS Annual Report 2013/2014
REPORT ON THE FINANCIAL STATEMENTS
Introduction
1. I have audited the financial statements of the National Regulator for Compulsory Specifications set out on pages 67 to 106, which comprise the statement of financial position as at 31 March 2014, the statement of financial performance, statement of changes in net assets, statement of cash flows and statement of comparison of budget information with the actual information for the year then ended, and the notes, comprising a summary of significant accounting policies and other explanatory information.
Accounting authority’s responsibility for the financial statements
2. The accounting authority is responsible for the preparation and fair presentation of these financial statements in accordance with Standards of Generally Recognised Accounting Practice (Standards of GRAP) and the requirements of the Public Finance Management Act of South Africa, 1999 (Act No.1 of 1999) (PFMA), and for such internal control as the accounting authority determines is necessary to enable the preparation of financial statements that are free from material misstatement, whether due to fraud or error.
Auditor-General’s responsibility
3. My responsibility is to express an opinion on these financial statements based on my audit. I conducted my audit in accordance with the Public Audit Act of South Africa, 2004 (Act No. 25 of 2004) (PAA), the general notice issued in terms thereof and International Standards on Auditing. Those standards require that I comply
with ethical requirements and plan and perform the audit to obtain reasonable assurance about whether the financial statements are free from material misstatement.
4. An audit involves performing procedures to obtain audit evidence about the amounts and disclosures in the financial statements. The procedures selected depend on the auditor’s judgement, including the assessment of the risks of material misstatement of the financial statements, whether due to fraud or error. In making those risk assessments, the auditor considers internal control relevant to the entity’s preparation and fair presentation of the financial statements in order to design audit procedures that are appropriate in the circumstances, but not for the purpose of expressing an opinion on the effectiveness of the entity’s internal control. An audit also includes evaluating the appropriateness of accounting policies used and the reasonableness of accounting estimates made by management, as well as evaluating the overall presentation of the financial statements.
5. I believe that the audit evidence I have obtained
is sufficient and appropriate to provide a basis for my qualified audit opinion.
Qualified opinion
6. In my opinion, except for the possible effects of the matters described in the basis for qualified opinion paragraph, the financial statements present fairly, in all material respects, the financial position of the National Regulator for Compulsory Specifications as at 31 March 2014 and its financial performance and cash flows for the year then ended in accordance with Standards of Generally Recognised Accounting Practice (Standards of GRAP) and the requirements of the PFMA.
REPORT OF THE AUDITOR-GENERAL TO PARLIAMENT ON THE NATIONAL REGULATOR FOR COMPULSORY SPECIFICATIONS
63NRCS Annual Report 2013/2014
Basis for qualified opinion
Non-exchange revenue from levies for compulsory specifications
7. I was unable to obtain sufficient appropriate audit evidence that management had properly accounted for all non-exchange levies for compulsory specifications for the current and prior year, due to the status of the accounting records. I was unable to confirm the non-exchange revenue from levies for compulsory specifications by alternative means. Consequently, I was unable to determine whether any adjustment to non-exchange revenue from levies for compulsory specifications at R139 million (2012-13: R137 million) in the financial statements was necessary.
Trade and other receivables from non-exchange transactions
8. I was unable to obtain sufficient appropriate audit evidence that management had properly accounted for trade and other receivables from non-exchange transactions for the current and prior year relating to non-exchange revenue from levies for compulsory specifications, due to the status of the accounting records for non-exchange revenue from levies for compulsory specifications. I was unable to confirm the trade and other receivables from non-exchange transactions relating to non-exchange levies for compulsory specifications by alternative means. Consequently, I was unable to determine whether any adjustment to trade and other receivables from non-exchange transactions regarding non-exchange revenue from levies for compulsory specifications at R10 million (2012-13: R7,6 million) in the financial statements was necessary.
Employee cost
9. I was unable to obtain sufficient appropriate audit evidence that management had properly accounted for employee cost for the current year, due to the status of the accounting records for employee cost. I was unable to confirm the employee cost by alternative means. Consequently, I was unable to determine
whether any adjustment to employee cost at R158 million in the financial statements was necessary.
Employee benefit obligations for long service leave awards
10. I was unable to obtain sufficient appropriate audit evidence that management had properly accounted for employee benefit obligations for long service leave awards for the current year, due to the status of the accounting records for employee cost. I was unable to confirm the employee benefit obligations for long service leave awards by alternative means. Consequently, I was unable to determine whether any adjustment to employee benefit obligations for long service leave awards at R10 million in the financial statements was necessary.
Trade and other payables from exchange transactions for salary related accruals
11. I was unable to obtain sufficient appropriate audit evidence that management had properly accounted for trade and other payables from exchange transactions for salary-related accruals for the current year, due to the status of the accounting records for employee cost. I was unable to confirm the trade and other payables from exchange transactions for salary-related accruals awards by alternative means. Consequently, I was unable to determine whether any adjustment to trade and other payables from exchange transactions for salary-related accruals at R10 million in the financial statements was necessary.
Provisions for leave pay
12. I was unable to obtain sufficient appropriate audit evidence that management had properly accounted for provisions for leave pay for the current year, due to the status of the accounting records for employee cost. I was unable to confirm the provisions for leave pay by alternative means. Consequently, I was unable to determine whether any adjustment to provisions for leave pay at R11 million in the financial statements was necessary.
64 NRCS Annual Report 2013/2014
Emphasis of matters
13. I draw attention to the matter below. My opinion is not modified in respect of this matter.
Restatement of corresponding figures
14. As disclosed in note 32 to the financial statements, the corresponding figures for 31 March 2013 have been restated as a result of an error discovered during 2014 in the financial statements of the National Regulator for Compulsory Specifications, and for the year ended 31 March 2013.
REPORT ON OTHER LEGAL AND REGULATORY REQUIREMENTS
15. In accordance with the PAA and the General Notice issued in terms thereof, I report the following findings on the reported performance information against predetermined objectives for selected objectives presented in the annual report, non-compliance with legislation as well as internal control. The objective of my tests was to identify reportable findings as described under each subheading but not to gather evidence to express assurance on these matters. Accordingly, I do not express an opinion or conclusion on these matters.
Predetermined objectives
16. I performed procedures to obtain evidence about the usefulness and reliability of the reported performance information for the following selected programmes presented in the annual performance report of the National Regulator for Compulsory Specifications for the year ended 31 March 2014:
• Programme 1: To utilise a risk-based approach to maximise the potential compliance with all specifications and technical regulations falling under the mandate of NRCS on pages 43 to 44 Programme 2: To optimise the scope of NRCS regulatory activity to protect people in South Africa and the environment on page 45.
17. I evaluated the reported performance information against the overall criteria of usefulness and reliability.
18. I evaluated the usefulness of the reported performance information to determine whether it was presented in accordance with the National Treasury’s annual reporting principles and whether the reported performance was consistent with the planned objectives.
19. I further performed tests to determine whether indicators and targets were well defined, verifiable, specific, measurable, time bound and relevant as required by the National Treasury’s Framework for Managing Programme Performance Information (FMPPI).
20. I assessed the reliability of the reported performance information to determine whether it was valid, accurate and complete.
21. I did not identify any material findings on the usefulness and reliability of the reported performance information for the selected programmes.
Additional matters
22. Although I identified no material findings on the usefulness and reliability of the reported performance information for the selected programmes, I draw attention to the following matters:
Achievement of planned targets
23. Refer to the annual performance report on pages 43 to 47 for information on the achievement of planned targets for the year.
Compliance with laws and regulations
24. I performed procedures to obtain evidence that the National Regulator for Compulsory Specifications has complied with applicable laws and regulations regarding financial matters, financial management and other related matters.
65NRCS Annual Report 2013/2014
My findings on material non-compliance with specific matters in key applicable laws and regulations as set out in the general notice issued in terms of the PAA are as follows:
Annual financial statements, performance and annual reports
25. The financial statements submitted for auditing were not prepared in accordance with the prescribed financial reporting framework as required by section section 55(1) (b) of the Public Finance Management Act. Material misstatements of non-exchange revenue and disclosure notes identified by the auditors in the submitted financial statements were subsequently corrected but the uncorrected material misstatements resulted in the financial statements receiving a qualified audit opinion.
Expenditure management
26. The accounting authority did not take effective steps to prevent irregular expenditure as required by section 51(1)(b)(ii) of the Public Finance Management Act.
Revenue management
27. Effective and appropriate steps were not taken to collect all money due, as required by section 51(1)(b)(i) of the Public Finance Management Act and Treasury Regulations 31.1.2(a) and 31.1.2(e).
Internal control
28. I considered internal control relevant to my audit of the financial statements, the report on predetermined objectives and compliance with legislation. The matters reported below under the fundamentals of internal control are limited to the significant deficiencies that resulted in the findings on the financial statements and the findings on non-compliance with legislation included in this report.
Leadership
29. Inadequate oversight in terms of the leadership’s responsibility regarding financial reporting and compliance with laws and regulations.
Financial and performance management
30. Management did not in all instances monitor the controls designed to ensure accurate and complete financial statements and compliance with laws and regulations.
31 July 2014Pretoria
66 NRCS Annual Report 2013/2014
STATEMENT OF RESPONSIBILITY
Statement of Responsibility for the Annual Financial Statements for the year ended 31 March 2014
The Accounting Authority is responsible for the preparation of the public entity’s Annual Financial Statements (AFS) and for the judgements made in this information.
The Accounting Authority is responsible for establishing, and implementing a system of internal control designed to provide reasonable assurance as to the integrity and reliability of the AFS.
In my opinion, the financial statements fairly reflect the operations of the public entity for the financial year ended 31 March 2014.
The external auditors are engaged to express an independent opinion on the AFS of the public entity.
The NRCS’s annual financial statements for the year ended 31 March 2014 have been audited by the Auditor-General and their report is presented on page 62 to 65.
The Annual Financial Statements of the public entity set out on page 67 to page 106 have been approved.
A MoodleyChief Executive OfficerNational Regulator for Compulsory Specifications
31 July 2014
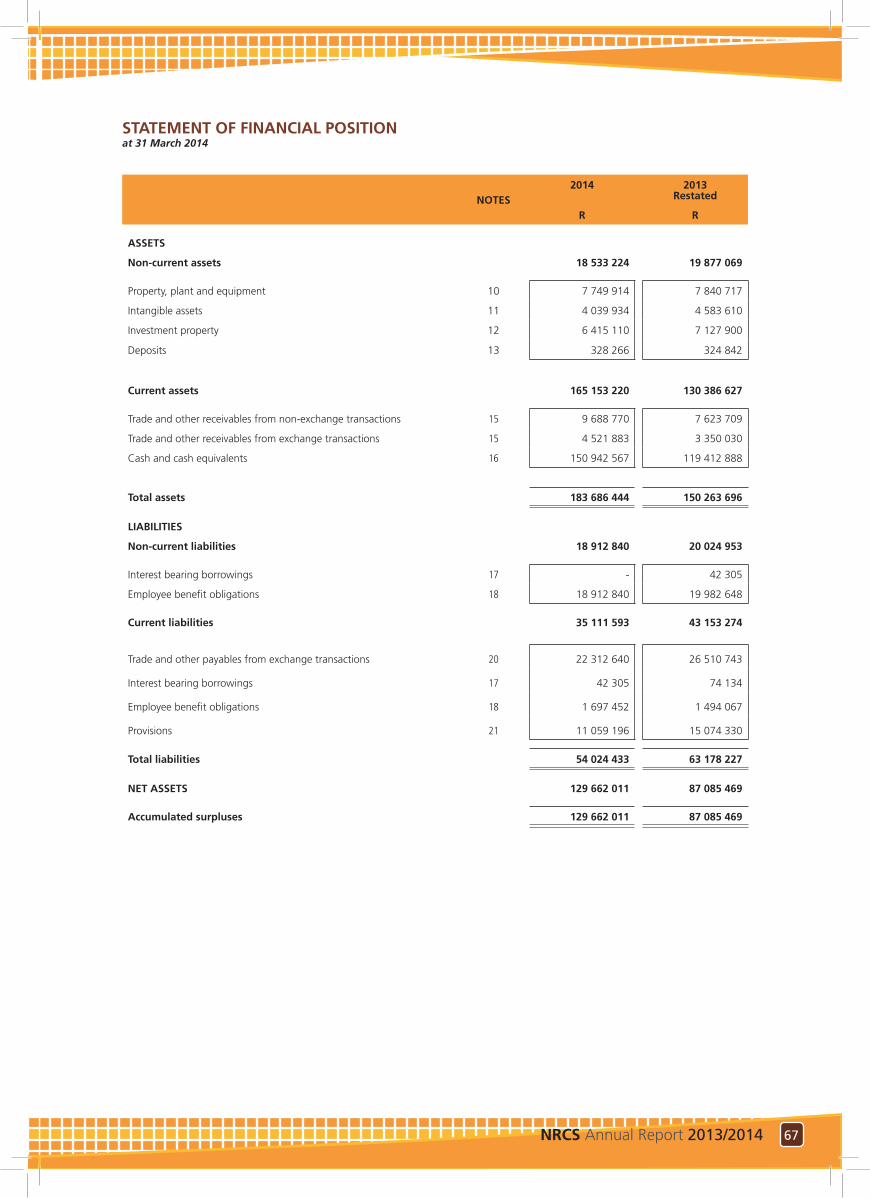
67NRCS Annual Report 2013/2014
STATEMENT OF FINANCIAL POSITION at 31 March 2014
NOTES2014 2013
Restated
R R
ASSETS
Non-current assets 18 533 224 19 877 069
Property, plant and equipment 10 7 749 914 7 840 717
Intangible assets 11 4 039 934 4 583 610
Investment property 12 6 415 110 7 127 900
Deposits 13 328 266 324 842
Current assets 165 153 220 130 386 627
Trade and other receivables from non-exchange transactions 15 9 688 770 7 623 709
Trade and other receivables from exchange transactions 15 4 521 883 3 350 030
Cash and cash equivalents 16 150 942 567 119 412 888
Total assets 183 686 444 150 263 696
LIABILITIES
Non-current liabilities 18 912 840 20 024 953
Interest bearing borrowings 17 - 42 305
Employee benefit obligations 18 18 912 840 19 982 648
Current liabilities 35 111 593 43 153 274
Trade and other payables from exchange transactions 20 22 312 640 26 510 743
Interest bearing borrowings 17 42 305 74 134
Employee benefit obligations 18 1 697 452 1 494 067
Provisions 21 11 059 196 15 074 330
Total liabilities 54 024 433 63 178 227
NET ASSETS 129 662 011 87 085 469
Accumulated surpluses 129 662 011 87 085 469
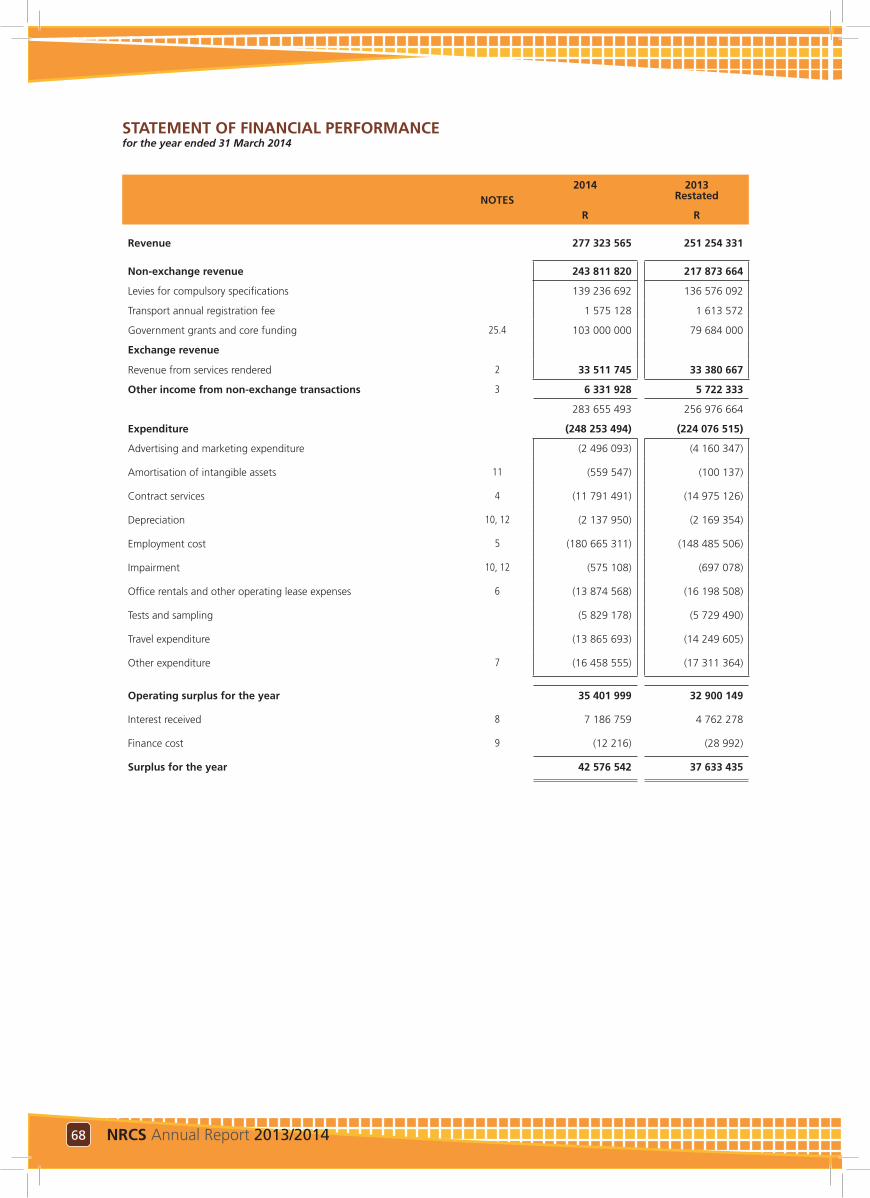
68 NRCS Annual Report 2013/2014
STATEMENT OF FINANCIAL PERFORMANCE for the year ended 31 March 2014
NOTES2014 2013
Restated
R R
Revenue 277 323 565 251 254 331
Non-exchange revenue 243 811 820 217 873 664
Levies for compulsory specifications 139 236 692 136 576 092
Transport annual registration fee 1 575 128 1 613 572
Government grants and core funding 25.4 103 000 000 79 684 000
Exchange revenue
Revenue from services rendered 2 33 511 745 33 380 667
Other income from non-exchange transactions 3 6 331 928 5 722 333
283 655 493 256 976 664
Expenditure (248 253 494) (224 076 515)
Advertising and marketing expenditure (2 496 093) (4 160 347)
Amortisation of intangible assets 11 (559 547) (100 137)
Contract services 4 (11 791 491) (14 975 126)
Depreciation 10, 12 (2 137 950) (2 169 354)
Employment cost 5 (180 665 311) (148 485 506)
Impairment 10, 12 (575 108) (697 078)
Office rentals and other operating lease expenses 6 (13 874 568) (16 198 508)
Tests and sampling (5 829 178) (5 729 490)
Travel expenditure (13 865 693) (14 249 605)
Other expenditure 7 (16 458 555) (17 311 364)
Operating surplus for the year 35 401 999 32 900 149
Interest received 8 7 186 759 4 762 278
Finance cost 9 (12 216) (28 992)
Surplus for the year 42 576 542 37 633 435
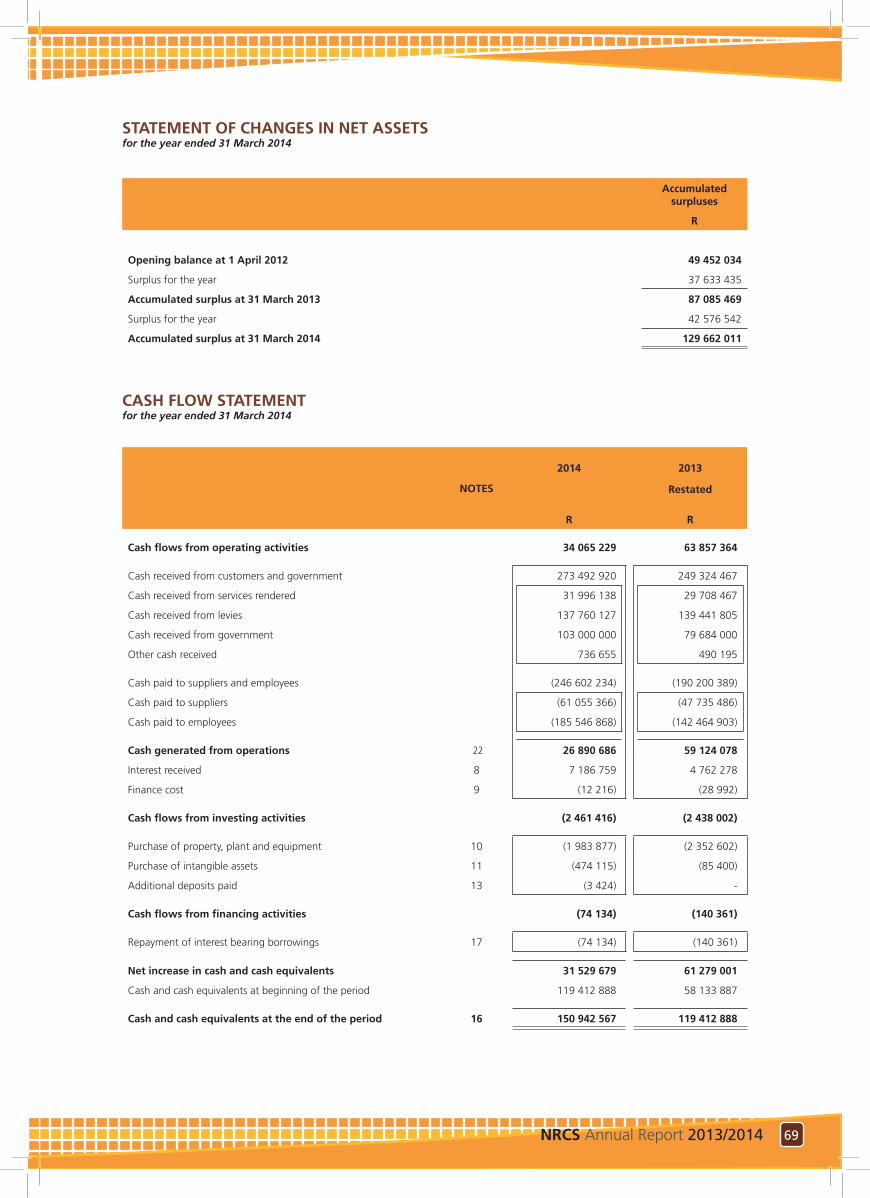
69NRCS Annual Report 2013/2014
STATEMENT OF CHANGES IN NET ASSETS for the year ended 31 March 2014
Accumulated surpluses
R
Opening balance at 1 April 2012 49 452 034
Surplus for the year 37 633 435
Accumulated surplus at 31 March 2013 87 085 469
Surplus for the year 42 576 542
Accumulated surplus at 31 March 2014 129 662 011
CASH FLOW STATEMENT for the year ended 31 March 2014
NOTES
2014Restated
2013
Restated
R R
Cash flows from operating activities 34 065 229 63 857 364
Cash received from customers and government 273 492 920 249 324 467
Cash received from services rendered 31 996 138 29 708 467
Cash received from levies 137 760 127 139 441 805
Cash received from government 103 000 000 79 684 000
Other cash received 736 655 490 195
Cash paid to suppliers and employees (246 602 234) (190 200 389)
Cash paid to suppliers (61 055 366) (47 735 486)
Cash paid to employees (185 546 868) (142 464 903)
Cash generated from operations 22 26 890 686 59 124 078
Interest received 8 7 186 759 4 762 278
Finance cost 9 (12 216) (28 992)
Cash flows from investing activities (2 461 416) (2 438 002)
Purchase of property, plant and equipment 10 (1 983 877) (2 352 602)
Purchase of intangible assets 11 (474 115) (85 400)
Additional deposits paid 13 (3 424) -
Cash flows from financing activities (74 134) (140 361)
Repayment of interest bearing borrowings 17 (74 134) (140 361)
Net increase in cash and cash equivalents 31 529 679 61 279 001
Cash and cash equivalents at beginning of the period 119 412 888 58 133 887
Cash and cash equivalents at the end of the period 16 150 942 567 119 412 888
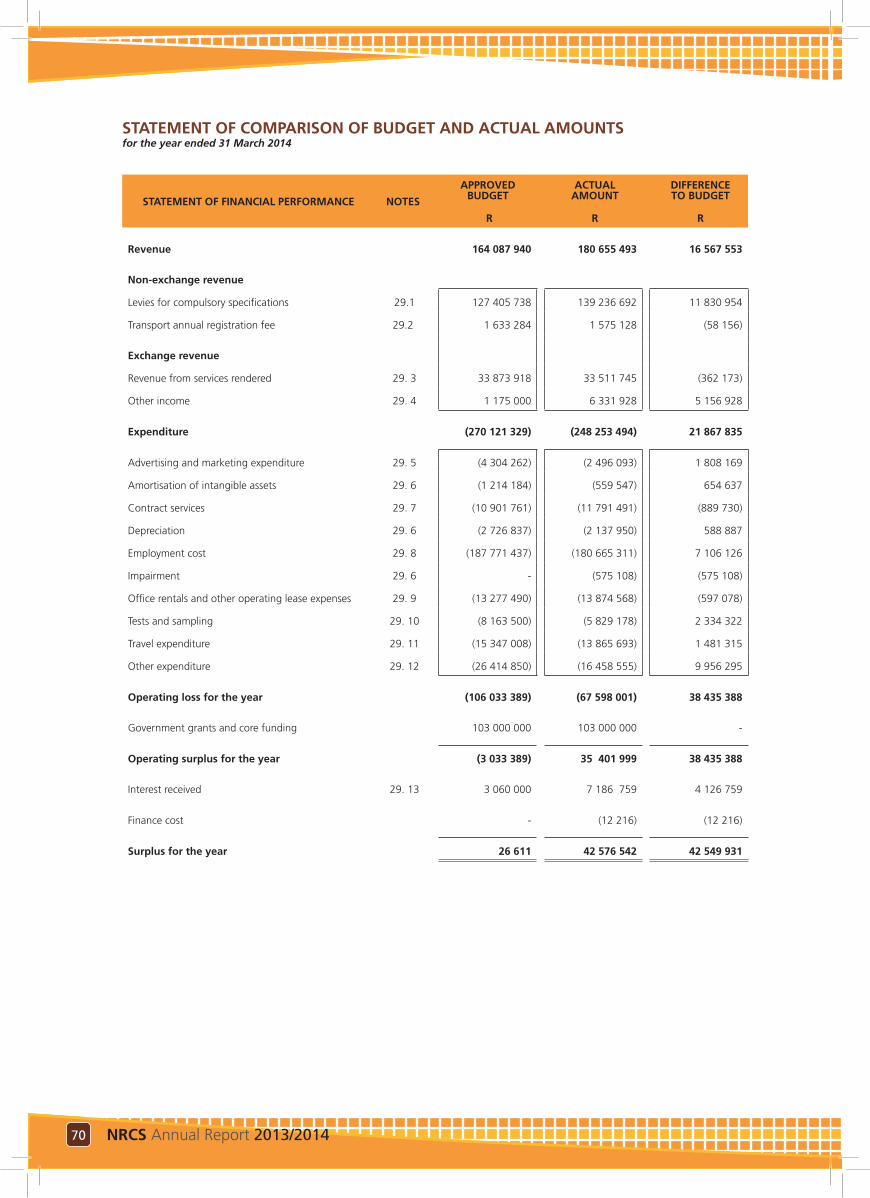
70 NRCS Annual Report 2013/2014 70 NRCS Annual Report 2013/2014
STATEMENT OF COMPARISON OF BUDGET AND ACTUAL AMOUNTS for the year ended 31 March 2014
STATEMENT OF FINANCIAL PERFORMANCE NOTES
APPROVED BUDGET
ACTUAL AMOUNT
DIFFERENCE TO BUDGET
R R R
Revenue 164 087 940 180 655 493 16 567 553
Non-exchange revenue
Levies for compulsory specifications 29.1 127 405 738 139 236 692 11 830 954
Transport annual registration fee 29.2 1 633 284 1 575 128 (58 156)
Exchange revenue
Revenue from services rendered 29. 3 33 873 918 33 511 745 (362 173)
Other income 29. 4 1 175 000 6 331 928 5 156 928
Expenditure (270 121 329) (248 253 494) 21 867 835
Advertising and marketing expenditure 29. 5 (4 304 262) (2 496 093) 1 808 169
Amortisation of intangible assets 29. 6 (1 214 184) (559 547) 654 637
Contract services 29. 7 (10 901 761) (11 791 491) (889 730)
Depreciation 29. 6 (2 726 837) (2 137 950) 588 887
Employment cost 29. 8 (187 771 437) (180 665 311) 7 106 126
Impairment 29. 6 - (575 108) (575 108)
Office rentals and other operating lease expenses 29. 9 (13 277 490) (13 874 568) (597 078)
Tests and sampling 29. 10 (8 163 500) (5 829 178) 2 334 322
Travel expenditure 29. 11 (15 347 008) (13 865 693) 1 481 315
Other expenditure 29. 12 (26 414 850) (16 458 555) 9 956 295
Operating loss for the year (106 033 389) (67 598 001) 38 435 388
Government grants and core funding 103 000 000 103 000 000 -
Operating surplus for the year (3 033 389) 35 401 999 38 435 388
Interest received 29. 13 3 060 000 7 186 759 4 126 759
Finance cost - (12 216) (12 216)
Surplus for the year 26 611 42 576 542 42 549 931
71NRCS Annual Report 2013/2014 71NRCS Annual Report 2013/2014
NOTES TO THE FINANCIAL STATEMENTSfor the year ended 31 March 2014
1. SIGNIFICANT ACCOUNTING POLICIES
1.1 Basis of preparation
The Annual Financial Statements have been prepared in accordance with Standards of Generally Recognised Accounting Practice (GRAP) issued by the Accounting Standards Board in accordance with Section 55 of the Public Finance Management Act, No. 29 of 1999. The Annual Financial Statements have been prepared on the historical cost basis, and incorporate the principal accounting policies set out below. Accounting policies for material transactions, events or conditions not covered by the GRAP reporting framework, have been developed in accordance with paragraphs 7, 11 and 12 of GRAP 3 and the hierarchy approved in Directive 5 issued by the Accounting Standards Board. Assets, liabilities, revenues and expenses have not been offset except where offsetting is required or permitted by a Standard of GRAP. These accounting policies are consistent with the previous year, unless explicitly stated. The details of any changes in accounting policies are explained in the relevant policy. The principal accounting policies adopted in the preparation of these financial statements are set out below.
Changes in accounting policy, changes in accounting estimates and prior period errors
Changes in accounting policy resulting from the initial application of a Standard are accounted for in accordance with the specific transitional provisions, if any, in that Standard; else the change is applied retrospectively unless impracticable.
The effect of a change in an accounting estimate is recognised prospectively by including it in surplus or deficit in:
(a) the period of the change, if the change affects that period only; or
(b) the period of the change and future periods, if the change affects both.
To the extent that a change in an accounting estimate gives rise to changes in assets and liabilities, or relates to an item of net assets, it is recognised by adjusting the carrying amount of the related asset, liability or item of net assets in the period of the change.
Material prior period errors are retrospectively corrected in the first set of financial statements authorised for issue after their discovery by:
(a) restating the comparative amounts for the prior period(s) presented in which the error occurred; or
(b) if the error occurred before the earliest prior period presented, restating the opening balances of assets, liabilities and net assets for the earliest prior period presented unless impracticable.
Accrual basis
In order to meet its objectives, the financial statements are prepared on the accrual basis of accounting. Under this basis, the effects of transactions and other events are recognised when they occur and they are recorded in the accounting records and reported in the financial statements of the periods to which they relate. The budget is also prepared on the accrual basis.
Going concern
The financial statements are prepared on the assumption that the entity is a going concern and will continue in operation for the foreseeable future.
Judgements, estimates and assumptions
The preparation of Annual Financial Statements in conformity with GRAP requires management to make judgements, estimates and assumptions that affect the application of policies and reported amounts of assets and liabilities, income and expenses. The estimates and associated assumptions are based on historical experience and other factors that are considered to be relevant. Actual results may differ from these estimates.
The estimates and underlying assumptions are reviewed on an ongoing basis. Revisions to accounting estimates are recognised in the period in which the estimate is revised if the revision affects only that period, or in the period of the revision and future periods if the revision affects both current and future periods. Critical judgements include:
72 NRCS Annual Report 2013/2014
Asset impairments
The entity evaluates its non-current assets for impairment annually whenever events or changes in circumstances indicate that the carrying amount of the asset may not be recoverable. Judgements regarding the existence of impairment indicators are based on market conditions and operational performance of the business. Future events could cause management to conclude that impairment indicators exist.
If the entity determines that impairment indicators exist, the recoverable amount is determined. The recoverable amount is the higher of value in use or fair value less cost to sell. The determination is either based on an external valuation or internally determined by discounting the expected future economic benefits from the use of the asset at an appropriate discount rate.
Residual values
The entity is required to measure the residual value of an item of property, plant and equipment. An estimation is made of the amount it would receive currently for the asset if the asset was already of the age and condition expected at the end of its useful life.
Residual values (if material) are first estimated at the date of acquisition or transfer and are thereafter reviewed at each reporting date. If these change from the prior period, the depreciation charge is adjusted prospectively.
Useful life
The useful life of an asset is the period over which the entity expects to use the asset, and not necessarily the asset’s economic life. Useful lives of assets are reviewed annually. If these change from the prior period, the depreciation charge is adjusted prospectively.
The entity uses the following indicators to determine useful lives:
• Expected usage of assets;
• Expected physical wear and tear;
• Technical or commercial obsolescence.
Provisions and long-term employee benefits
Provisions are required to be recorded when the entity has a present legal or constructive obligation as a result of past events, for which it is probable that an outflow of economic benefits will occur, and where a reliable estimate can be made of the amount of the obligation.
Best estimates, being the amount that the entity would rationally pay to settle the obligation, are recognised as provisions at reporting date. Risks, uncertainties and future events are taken into account by management in determining the best estimates. Provisions are discounted where the effect of discounting is material. The discount rate used is the rate that reflects current market assessments of the time value of money and, where appropriate, the risks specific to the liability, all of which require management judgement. All provisions are reviewed at each reporting date.
Various uncertainties can result in obligations not being considered probable or estimable for significant periods of time. As a consequence, potentially material obligations may have no provisions and a change in facts or circumstances that result in an obligation becoming probable or estimable can lead to a need for the establishment of material provisions. In addition, where estimated amounts vary from initial estimates, the provisions may be revised materially, up or down.
The entity is required to record provisions for legal contingencies when the occurrence of the contingency is probable and the amount of the loss can be reasonably estimated. Liabilities provided for legal matters require judgements regarding projected outcomes and ranges of losses based on historical experience and recommendations of legal counsel. Litigation is however unpredictable and actual costs incurred could differ materially from those estimated at the reporting date.
Long-term employee benefits are determined by independent actuaries based on assumptions listed in note 18.
Impairment of trade receivables
A debtor is regarded as impaired if there is objective evidence, as a result of one or more events that
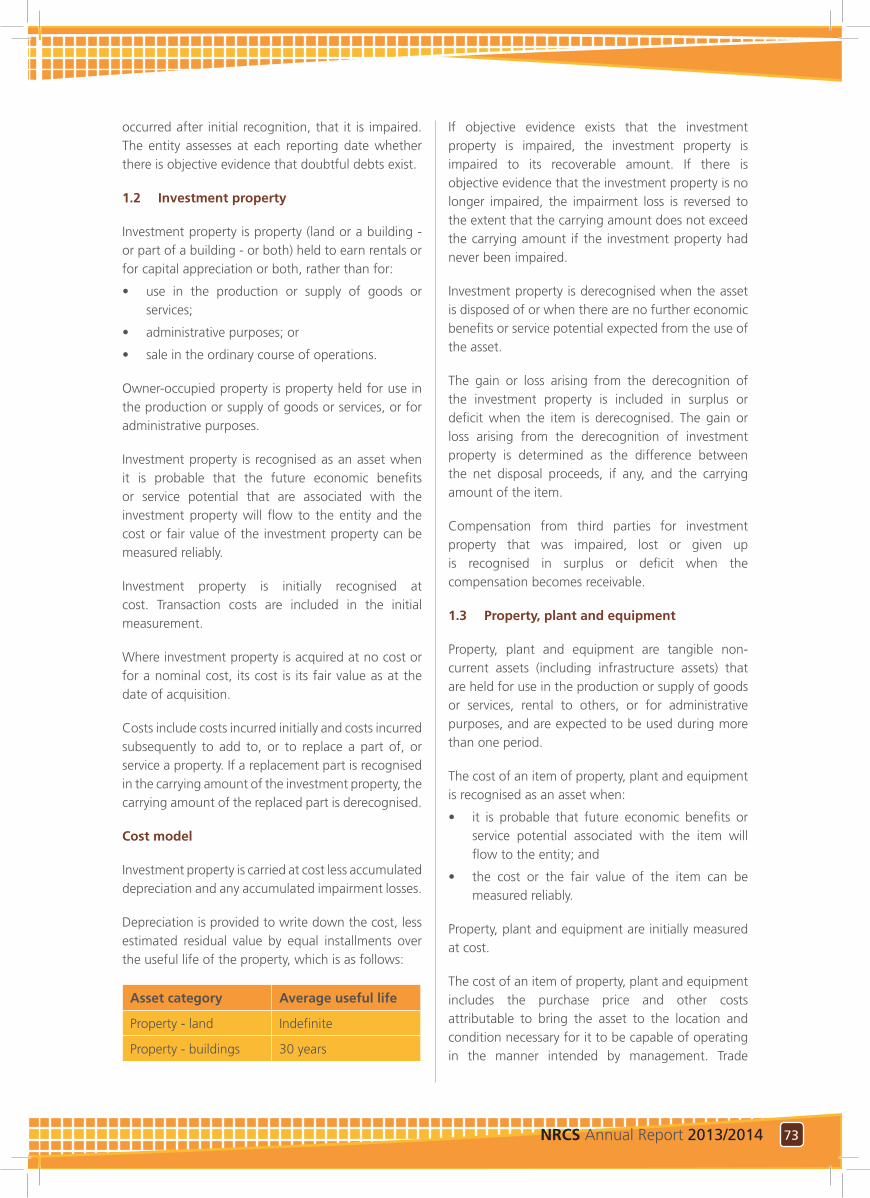
73NRCS Annual Report 2013/2014
occurred after initial recognition, that it is impaired. The entity assesses at each reporting date whether there is objective evidence that doubtful debts exist.
1.2 Investment property
Investment property is property (land or a building - or part of a building - or both) held to earn rentals or for capital appreciation or both, rather than for:
• use in the production or supply of goods or services;
• administrative purposes; or
• sale in the ordinary course of operations.
Owner-occupied property is property held for use in the production or supply of goods or services, or for administrative purposes.
Investment property is recognised as an asset when it is probable that the future economic benefits or service potential that are associated with the investment property will flow to the entity and the cost or fair value of the investment property can be measured reliably.
Investment property is initially recognised at cost. Transaction costs are included in the initial measurement.
Where investment property is acquired at no cost or for a nominal cost, its cost is its fair value as at the date of acquisition.
Costs include costs incurred initially and costs incurred subsequently to add to, or to replace a part of, or service a property. If a replacement part is recognised in the carrying amount of the investment property, the carrying amount of the replaced part is derecognised.
Cost model
Investment property is carried at cost less accumulated depreciation and any accumulated impairment losses.
Depreciation is provided to write down the cost, less estimated residual value by equal installments over the useful life of the property, which is as follows:
Asset category Average useful life
Property - land Indefinite
Property - buildings 30 years
If objective evidence exists that the investment property is impaired, the investment property is impaired to its recoverable amount. If there is objective evidence that the investment property is no longer impaired, the impairment loss is reversed to the extent that the carrying amount does not exceed the carrying amount if the investment property had never been impaired.
Investment property is derecognised when the asset is disposed of or when there are no further economic benefits or service potential expected from the use of the asset.
The gain or loss arising from the derecognition of the investment property is included in surplus or deficit when the item is derecognised. The gain or loss arising from the derecognition of investment property is determined as the difference between the net disposal proceeds, if any, and the carrying amount of the item.
Compensation from third parties for investment property that was impaired, lost or given up is recognised in surplus or deficit when the compensation becomes receivable.
1.3 Property, plant and equipment
Property, plant and equipment are tangible non-current assets (including infrastructure assets) that are held for use in the production or supply of goods or services, rental to others, or for administrative purposes, and are expected to be used during more than one period.
The cost of an item of property, plant and equipment is recognised as an asset when:
• it is probable that future economic benefits or service potential associated with the item will flow to the entity; and
• the cost or the fair value of the item can be measured reliably.
Property, plant and equipment are initially measured at cost.
The cost of an item of property, plant and equipment includes the purchase price and other costs attributable to bring the asset to the location and condition necessary for it to be capable of operating in the manner intended by management. Trade
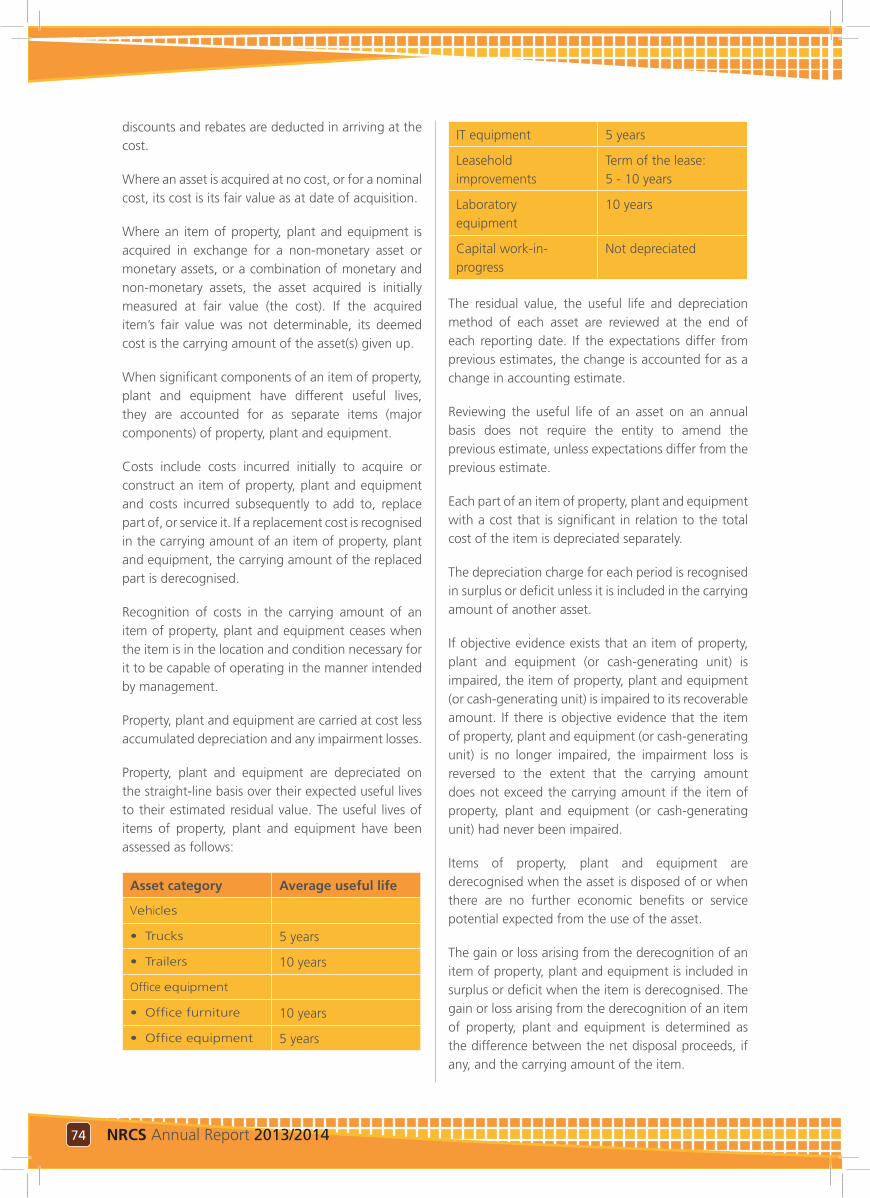
74 NRCS Annual Report 2013/2014
discounts and rebates are deducted in arriving at the cost.
Where an asset is acquired at no cost, or for a nominal cost, its cost is its fair value as at date of acquisition.
Where an item of property, plant and equipment is acquired in exchange for a non-monetary asset or monetary assets, or a combination of monetary and non-monetary assets, the asset acquired is initially measured at fair value (the cost). If the acquired item’s fair value was not determinable, its deemed cost is the carrying amount of the asset(s) given up.
When significant components of an item of property, plant and equipment have different useful lives, they are accounted for as separate items (major components) of property, plant and equipment.
Costs include costs incurred initially to acquire or construct an item of property, plant and equipment and costs incurred subsequently to add to, replace part of, or service it. If a replacement cost is recognised in the carrying amount of an item of property, plant and equipment, the carrying amount of the replaced part is derecognised.
Recognition of costs in the carrying amount of an item of property, plant and equipment ceases when the item is in the location and condition necessary for it to be capable of operating in the manner intended by management.
Property, plant and equipment are carried at cost less accumulated depreciation and any impairment losses.
Property, plant and equipment are depreciated on the straight-line basis over their expected useful lives to their estimated residual value. The useful lives of items of property, plant and equipment have been assessed as follows:
Asset category Average useful life
Vehicles
• Trucks 5 years
• Trailers 10 years
Office equipment
• Office furniture 10 years
• Office equipment 5 years
IT equipment 5 years
Leasehold improvements
Term of the lease: 5 - 10 years
Laboratory equipment
10 years
Capital work-in-progress
Not depreciated
The residual value, the useful life and depreciation method of each asset are reviewed at the end of each reporting date. If the expectations differ from previous estimates, the change is accounted for as a change in accounting estimate.
Reviewing the useful life of an asset on an annual basis does not require the entity to amend the previous estimate, unless expectations differ from the previous estimate.
Each part of an item of property, plant and equipment with a cost that is significant in relation to the total cost of the item is depreciated separately.
The depreciation charge for each period is recognised in surplus or deficit unless it is included in the carrying amount of another asset.
If objective evidence exists that an item of property, plant and equipment (or cash-generating unit) is impaired, the item of property, plant and equipment (or cash-generating unit) is impaired to its recoverable amount. If there is objective evidence that the item of property, plant and equipment (or cash-generating unit) is no longer impaired, the impairment loss is reversed to the extent that the carrying amount does not exceed the carrying amount if the item of property, plant and equipment (or cash-generating unit) had never been impaired.
Items of property, plant and equipment are derecognised when the asset is disposed of or when there are no further economic benefits or service potential expected from the use of the asset.
The gain or loss arising from the derecognition of an item of property, plant and equipment is included in surplus or deficit when the item is derecognised. The gain or loss arising from the derecognition of an item of property, plant and equipment is determined as the difference between the net disposal proceeds, if any, and the carrying amount of the item.
75NRCS Annual Report 2013/2014
1.4 Intangible assets
An asset is identified as an intangible asset when it:
• is capable of being separated or divided from an entity and sold, transferred, licensed, rented or exchanged, either individually or together with a related contract, assets or liability; or
• arises from contractual rights or other legal rights, regardless whether those rights are transferable or separate from the entity or from other rights and obligations.
An intangible asset is recognised when:
• it is probable that the expected future economic benefits or service potential that are attributable to the asset will flow to the entity; and
• the cost or fair value of the asset can be measured reliably.
Intangible assets are initially recognised at cost.
For an intangible asset acquired at no or nominal cost, the cost is deemed to be its fair value as at the date of acquisition. Expenditure on research (or on the research phase of an internal project) is recognised as an expense when it is incurred.
An intangible asset arising from development (or from the development phase of an internal project) is recognised when:
• it is technically feasible to complete the asset so that it will be available for use or sale;
• there is an intention to complete and use or sell it;
• there is an ability to use or sell it;
• it will generate probable future economic benefits or service potential;
• there are available technical, financial and other resources to complete the development and to use or sell the asset;
• the expenditure attributable to the asset during its development can be measured reliably.
Intangible assets are carried at cost less any accumulated amortisation and any impairment losses.
An intangible asset is regarded as having an indefinite useful life when, based on all relevant factors, there is no foreseeable limit to the period over which the asset is expected to generate net cash inflows or service
potential. Amortisation is not provided for these intangible assets, but they are tested for impairment annually and whenever there is an indication that the asset may be impaired. For all other intangible assets, amortisation is provided on a straight-line basis over their useful life.
The amortisation period and the amortisation method for intangible assets are reviewed at each reporting date.
Reassessing the useful life of an intangible asset with a finite useful life after it was classified as indefinite, is an indicator that the asset may be impaired. As a result the asset is tested for impairment and the remaining carrying amount is amortised over its useful life.
Internally generated brands, mastheads, publishing titles, customer lists and items similar in substance are not recognised as intangible assets. Amortisation is provided to write down the intangible assets, on a straight-line basis, to their residual values as follows:
Asset category Average useful life
Computer software, internally generated
3 - 5 years
Computer software, acquired
3 - 5 years
Computer software, work-in-progress
Not depreciated
If objective evidence exists that an intangible asset (or cash-generating unit) is impaired, the intangible asset (or cash-generating unit) is impaired to its recoverable amount. If there is objective evidence that the intangible asset (or cash-generating unit) is no longer impaired, the impairment loss is reversed to the extent that the carrying amount does not exceed the carrying amount if the intangible asset (or cash-generating unit) had never been impaired.
Intangible assets are derecognised when the asset is disposed of or when there are no further economic benefits or service potential expected from the use of the asset.
The gain or loss arising from the derecognition of an intangible asset is included in surplus or deficit when the item is derecognised. The gain or loss arising from the derecognition of an intangible asset is determined
76 NRCS Annual Report 2013/2014
as the difference between the net disposal proceeds, if any, and the carrying amount of the item.
1.5 Financial instruments
Initial recognition and measurement
Financial instruments are recognised initially when the entity becomes a party to the contractual provisions of the instruments.
Upon initial recognition the entity classifies financial instruments or their component parts as financial liabilities, financial assets or residual interests in conformity with the substance of the contractual arrangement and to the extent that the instrument satisfies the definitions of a financial liability, a financial asset or a residual interest.
When a financial instrument is recognised, the entity measures it initially at its fair value plus, in the case of a financial asset or a financial liability not subsequently measured at fair value, transaction costs that are directly attributable to the acquisition or issue of the financial asset or financial liability.
Subsequent measurement
Receivables from exchange transactions and receivables from non-exchange transactions
Trade receivables are measured at initial recognition at fair value, and are subsequently measured at amortised cost using the effective interest rate method. Appropriate allowances for estimated irrecoverable amounts are recognised in surplus or deficit when there is objective evidence that the asset is impaired. Significant financial difficulties of the debtor, probability that the debtor will enter bankruptcy or financial reorganisation, and default or delinquency in payments (more than 30 days overdue) are considered indicators that the trade receivable is impaired. The allowance recognised is measured as the difference between the asset’s carrying amount and the present value of estimated future cash flows discounted at the effective interest rate computed at initial recognition.
The carrying amount of the asset is reduced through the use of an allowance account, and the amount of the deficit is recognised in surplus or deficit within operating expenses. When a trade receivable is uncollectible, it is written off against the allowance
account for trade receivables. Subsequent recoveries of amounts previously written off are credited against operating expenses in surplus or deficit.
Payables from exchange transactions
Trade payables are initially measured at fair value, and are subsequently measured at amortised cost, using the effective interest rate method.
Borrowings
Borrowings are initially measured at fair value, and are subsequently measured at amortised cost, using the effective interest rate method.
Cash and cash equivalents
Cash and cash equivalents comprise cash on hand and demand deposits and other short-term highly liquid investments that are readily convertible to a known amount of cash and are subject to an insignificant risk of changes in value. These are initially measured at fair value, and are subsequently measured at amortised cost, using the effective interest rate method.
Offset
Financial assets and liabilities are offset and the net amount reported in the statement of financial position only when there is a legal enforceable right to offset the recognised amounts and the intention is to settle on a net basis or to realise the asset and settle the liability simultaneously.
Effective interest rate
The effective interest rate method is a method of calculating the amortised cost of a financial asset or a financial liability and of allocating the interest income or interest expense over the relevant period. The effective interest rate is the rate that exactly discounts estimated future cash payments or receipts through the expected life of the financial instrument or, when appropriate, a shorter period to the net carrying amount of the financial asset or financial liability.
Determination of fair value
The best evidence of fair value is quoted prices in an active market. If the market for a financial instrument is not active, the entity establishes fair value by using a valuation technique. The objective of using a valuation technique is to establish what the transaction price would
77NRCS Annual Report 2013/2014
have been on the measurement date in an arm’s length exchange motivated by normal operating considerations. Valuation techniques include using recent arm’s length market transactions between knowledgeable, willing parties, if available, reference to the current fair value of another instrument that is substantially the same and discounted cash flow analysis.
If there is a valuation technique commonly used by market participants to price the instrument and that technique has been demonstrated to provide reliable estimates of prices obtained in actual market transactions, the entity uses that technique.
Short-term receivables and payables are not discounted where the initial credit period granted or received is consistent with terms used in the public sector, either through established practices or legislation.
Derecognition
Financial assets or parts thereof are derecognised when the contractual rights to receive the cash flows have been transferred or have expired or if substantially all the risks and rewards of ownership have passed. Where substantially all the risks and rewards of ownership have not been transferred or retained, the financial assets are derecognised if they are no longer controlled. However, if control in this situation is retained, the financial assets are recognised only to the extent of the continuing involvement in those assets. On derecognition of a financial asset, the difference between:
(a) the carrying amount (or the carrying amount allocated to the part derecognised); and
(b) the sum of (i) the consideration received (including any new asset obtained less any new liability assumed) and (ii) any cumulative gain or loss that had been recognised in net assets is recognised in surplus or deficit.
Financial liabilities or parts thereof are derecognised when they are extinguished, i.e. when the obligation specified in the contract is discharged, cancelled or expires. The difference between the carrying amount of a financial liability (or part of a financial liability) extinguished or transferred to another party and the consideration paid, including any non-cash assets transferred or liabilities assumed, is recognised in surplus or deficit.
Impairment of financial assets
Financial assets, other than those financial assets classified as fair value through surplus and deficit, are assessed for indicators of impairment at each reporting date. Financial assets are impaired where there is objective evidence that, as a result of one or more events that occurred after the initial recognition of the financial asset, the estimated future cash flows have been impacted. An impairment allowance is raised when there is an indication of impairment and a write-off is only affected when the debtor is deemed to be fully impaired and not recoverable.
A previously recognised impairment loss is reversed if the reversal can be related objectively to an event occurring after the impairment loss was recognised. For financial assets measured at a mortised cost, the reversal is recognised in surplus or deficit.
1.6 Leases
A lease is classified as a finance lease if it transfers substantially all the risks and rewards incidental to ownership. A lease is classified as an operating lease if it does not transfer substantially all the risks and rewards incidental to ownership.
When a lease includes both land and building elements, the entity assesses the classification of each element separately.
Finance leases - lessee
Finance leases are recognised as assets and liabilities in the statement of financial position at amounts equal to the fair value of the leased property or, if lower, the present value of the minimum lease payments. The corresponding liability to the lessor is included in the statement of financial position as a finance lease obligation.
The discount rate used in calculating the present value of the minimum lease payments is the interest rate implicit in the lease.
Minimum lease payments are apportioned between the finance charge and reduction of the outstanding liability. The finance charge is allocated to each period during the lease term so as to produce a constant periodic rate on the remaining balance of the liability.
Any contingent rents are expensed in the period in which they are incurred.
78 NRCS Annual Report 2013/2014
Operating leases - lessee
Operating lease payments are recognised as an expense on a straight-line basis over the lease term. The difference between the amounts recognised as an expense and the contractual payments is recognised as an operating lease asset or liability.
1.7 Impairment of cash-generating assets
Cash-generating assets are those assets held by the entity with the primary objective of generating a commercial return. When an asset is deployed in a manner consistent with that adopted by a profit-orientated entity, it generates a commercial return.
Impairment is a loss in the future economic benefits or service potential of an asset, over and above the systematic recognition of the loss of the asset’s future economic benefits or service potential through depreciation (amortisation).
The carrying amount is the amount at which an asset is recognised in the statement of financial position after deducting any accumulated depreciation and accumulated impairment losses thereon.
A cash-generating unit is the smallest identifiable group of assets held with the primary objective of generating a commercial return that generates cash inflows from continuing use that are largely independent of the cash inflows from other assets or groups of assets.
Costs of disposal are incremental costs directly attributable to the disposal of an asset, excluding finance costs.
Depreciation (amortisation) is the systematic allocation of the depreciable amount of an asset over its useful life.
Fair value less costs to sell is the amount obtainable from the sale of an asset in an arm’s length transaction between knowledgeable, willing parties, less the costs of disposal.
Recoverable amount of an asset or a cash-generating unit is the higher of its fair value less costs to sell and its value in use. Useful life is either:
(a) the period of time over which an asset is expected to be used by the entity; or
(b) the number of production or similar units expected to be obtained from the asset by the entity.
Criteria developed by the entity to distinguish cash-generating assets from non-cash-generating assets are as follows:
• Cash generating assets are assets used to generate service revenue.
Identification
When the carrying amount of a cash-generating asset exceeds its recoverable amount, it is impaired.
The entity assesses at each reporting date whether there is any indication that a cash-generating asset may be impaired. If any such indication exists, the entity estimates the recoverable amount of the asset.
Irrespective of whether there is any indication of impairment, the entity also tests a cash-generating intangible asset with an indefinite useful life or a cash-generating intangible asset not yet available for use for impairment annually by comparing its carrying amount with its recoverable amount. This impairment test is performed at the same time every year. If an intangible asset was initially recognised during the current reporting period, that intangible asset was tested for impairment before the end of the current reporting period.
Value in use
Value in use of a cash-generating asset is the present value of the estimated future cash flows expected to be derived from the continuing use of an asset and from its disposal at the end of its useful life.
When estimating the value in use of an asset, the entity estimates the future cash inflows and outflows to be derived from the continuing use of the asset and from its ultimate disposal. The entity applies the appropriate discount rate to those future cash flows.
Recognition and measurement (individual asset)
If the recoverable amount of a cash-generating asset is less than its carrying amount, the carrying amount of the asset is reduced to its recoverable amount. This reduction is an impairment loss.
79NRCS Annual Report 2013/2014
An impairment loss is recognised immediately in surplus or deficit.
When the amount estimated for an impairment loss is greater than the carrying amount of the cash-generating asset to which it relates, the entity recognises a liability only to the extent that is a requirement in the Standard of GRAP.
After the recognition of an impairment loss, the depreciation (amortisation) charge for the cash-generating asset is adjusted in future periods to allocate the cash-generating asset’s revised carrying amount, less its residual value (if any), on a systematic basis over its remaining useful life.
Reversal of impairment loss
The entity assesses at each reporting date whether there is any indication that an impairment loss recognised in prior periods for a cash-generating asset may no longer exist or may have decreased. If any such indication exists, the entity estimates the recoverable amount of that asset.
An impairment loss recognised in prior periods for a cash-generating asset is reversed if there has been a change in the estimates used to determine the asset’s recoverable amount since the last impairment loss was recognised. The carrying amount of the asset is increased to its recoverable amount. The increase is a reversal of an impairment loss. The increased carrying amount of an asset attributable to a reversal of an impairment loss does not exceed the carrying amount that would have been determined (net of depreciation or amortisation) had no impairment loss been recognised for the asset in prior periods.
A reversal of an impairment loss for a cash-generating asset is recognised immediately in surplus or deficit.
After a reversal of an impairment loss is recognised, the depreciation (amortisation) charge for the cash-generating asset is adjusted in future periods to allocate the cash-generating asset’s revised carrying amount, less its residual value (if any), on a systematic basis over its remaining useful life.
A reversal of an impairment loss for a cash-generating unit is allocated to the cash-generating assets of the
unit pro rata with the carrying amounts of those assets. These increases in carrying amounts are treated as reversals of impairment losses for individual assets. No part of the amount of such a reversal is allocated to a non-cash-generating asset contributing service potential to a cash-generating unit.
In allocating a reversal of an impairment loss for a cash-generating unit, the carrying amount of an asset is not increased above the lower of:
• its recoverable amount (if determinable); and
• the carrying amount that would have been determined (net of amortisation or depreciation) had no impairment loss been recognised for the asset in prior periods.
The amount of the reversal of the impairment loss that would otherwise have been allocated to the asset is allocated pro rata to the other assets of the unit.
1.8 Employee benefits
Employee benefits are all forms of consideration given by an entity in exchange for service rendered by employees.
Termination benefits are employee benefits payable as a result of either:
• an entity’s decision to terminate an employee’s employment before the normal retirement date; or
• an employee’s decision to accept voluntary redundancy in exchange for those benefits.
Other long-term employee benefits are employee benefits (other than post-employment benefits and termination benefits) that are not due to be settled within 12 months after the end of the period in which the employees render the related service.
Vested employee benefits are employee benefits that are not conditional on future employment.
Short-term employee benefits
Employee benefits (other than termination benefits) that are due to be settled within 12 months after the end of the period in which the employees render the related service.
80 NRCS Annual Report 2013/2014
Short-term employee benefits include items such as:
• wages, salaries and social security contributions;• short-term compensated absences (such as
paid annual leave and paid sick leave) where the compensation for the absences is due to be settled within twelve months after the end of the reporting period in which the employees render the related employee service;
• bonus-, incentive- and performance-related payments payable within 12 months after the end of the reporting period in which the employees render the related service; and
• non-monetary benefits (for example medical care and free or subsidised goods or services such as housing, cars and cellphones) for current employees.
When an employee has rendered a service to the entity during a reporting period, the entity recognises the undiscounted amount of short-term employee benefits expected to be paid in exchange for that service:
• as a liability (accrued expense), after deducting any amount already paid. If the amount already paid exceeds the undiscounted amount of the benefits, the entity recognises that excess as an asset (prepaid expense) to the extent that the prepayment will lead to, for example, a reduction in future payments or a cash refund; and
• as an expense, unless another Standard requires or permits the inclusion of the benefits in the cost of an asset.
The expected cost of compensated absences is recognised as an expense as the employees render services that increase their entitlement or, in the case of non-accumulating absences, when the absence occurs. The entity measures the expected cost of accumulating compensated absences as the additional amount that the entity expects to pay as a result of the unused entitlement that has accumulated at the reporting date.
The entity recognises the expected cost of bonus-, incentive- and performance-related payments when the entity has a present legal or constructive obligation to make such payments as a result of past events and a reliable estimate of the obligation can be made. A present obligation exists when the entity has no realistic alternative but to make the payments.
Post-employment benefits
Post-employment benefits are employee benefits (other than termination benefits) which are payable after the completion of employment.
Post-employment benefit plans are formal or informal arrangements under which an entity provides post-employment benefits for one or more employees.
Post-employment benefits: Defined contribution plans
Defined contribution plans are post-employment benefit plans under which an entity pays fixed contributions into a separate entity (a fund) and will have no legal or constructive obligation to pay further contributions if the fund does not hold sufficient assets to pay all employee benefits relating to employee service in the current and prior periods.
When an employee has rendered service to the entity during a reporting period, the entity recognises the contribution payable to a defined contribution plan in exchange for that service:
• as a liability (accrued expense), after deducting any contribution already paid. If the contribution already paid exceeds the contribution due for service before the reporting date, an entity recognises that excess as an asset (prepaid expense) to the extent that the prepayment will lead to, for example, a reduction in future payments or a cash refund; and
• as an expense, unless another Standard requires or permits the inclusion of the contribution in the cost of an asset.
Where contributions to a defined contribution plan do not fall due wholly within 12 months after the end of the reporting period in which the employees render the related service, they are discounted. The rate used to discount reflects the time value of money. The currency and term of the financial instrument selected to reflect the time value of money are consistent with the currency and estimated term of the obligation.
Post-employment benefits: Defined benefit plans
Defined benefit plans are post-employment benefit plans other than defined contribution plans.
81NRCS Annual Report 2013/2014
Actuarial gains and losses comprise experience adjustments (the effects of differences between the previous actuarial assumptions and what has actually occurred) and the effects of changes in actuarial assumptions. In measuring its defined benefit liability, the entity recognises actuarial gains and losses in surplus or deficit in the reporting period in which they occur.
Current service cost is the increase in the present value of the defined benefit obligation resulting from employee service in the current period.
Interest cost is the increase during a period in the present value of a defined benefit obligation which arises because the benefits are one period closer to settlement.
Past service cost is the change in the present value of the defined benefit obligation for employee service in prior periods, resulting in the current period from the introduction of, or changes to, post-employment benefits or other long-term employee benefits. Past service cost may be either positive (when benefits are introduced or changed so that the present value of the defined benefit obligation increases) or negative (when existing benefits are changed so that the present value of the defined benefit obligation decreases). In measuring its defined benefit liability, the entity recognises past service cost as an expense in the reporting period in which the plan is amended.
The entity accounts not only for its legal obligation under the formal terms of a defined benefit plan, but also for any constructive obligation that arises from the entity’s informal practices. Informal practices give rise to a constructive obligation where the entity has no realistic alternative but to pay employee benefits. An example of a constructive obligation is where a change in the entity’s informal practices would cause unacceptable damage to its relationship with employees.
The amount recognised as a defined benefit liability is the net total of the following amounts:
• the present value of the defined benefit obligation at the reporting date;
• minus the fair value at the reporting date of plan assets (if any) out of which the obligations are to be settled directly;
• plus any liability that may arise as a result of a minimum funding requirement.
The entity recognises the net total of the following amounts in surplus or deficit, except to the extent that another Standard requires or permits their inclusion in the cost of an asset:
• current service cost;
• interest cost;
• actuarial gains and losses;
• past service cost;
• the effect of any curtailments or settlements.
The entity uses the Projected Unit Credit Method to determine the present value of its defined benefit obligations and the related current service cost and, where applicable, past service cost. The Projected Unit Credit Method (sometimes known as the accrued benefit method pro-rated on service or as the benefit/years of service method) sees each period of service as giving rise to an additional unit of benefit entitlement and measures each unit separately to build up the final obligation.
In determining the present value of its defined benefit obligations and the related current service cost and, where applicable, past service cost, the entity attributes benefit to periods of service under the plan’s benefit formula. However, if an employee’s service in later years will lead to a materially higher level of benefit than in earlier years, the entity attributes benefit on a straight-line basis from:
• the date when service by the employee first leads to benefits under the plan (whether or not the benefits are conditional on further service); until
• the date when further service by the employee will lead to no material amount of further benefits under the plan, other than from further salary increases.
Actuarial valuations are conducted on an annual basis by independent actuaries. The results of the valuation are updated for any material transactions and other material changes in circumstances (including changes in market prices and interest rates) up to the reporting date.
Actuarial assumptions
Actuarial assumptions are unbiased and mutually compatible.
82 NRCS Annual Report 2013/2014
Financial assumptions are based on market expectations, at the reporting date, for the period over which the obligations are to be settled.
The rate used to discount post-employment benefit obligations (both funded and unfunded) reflects the time value of money.
The currency and term of the financial instrument selected to reflect the time value of money is consistent with the currency and estimated term of the post- employment benefit obligations.
Post-employment benefit obligations are measured on a basis that reflects:
• estimated future salary increases;
• the benefits set out in the terms of the plan (or resulting from any constructive obligation that goes beyond those terms) at the reporting date; and
• estimated future changes in the level of any state benefits that affect the benefits payable under a defined benefit plan, if, and only if, either:
– those changes were enacted before the reporting date; or
– past history, or other reliable evidence indicates that those state benefits will change in some predictable manner, for example, in line with future changes in general price levels or general salary levels.
Assumptions about medical costs take account of estimated future changes in the cost of medical services, resulting from both inflation and specific changes in medical costs.
Other post-retirement obligations
The entity provides post-retirement health care benefits upon retirement to some retirees.
The entitlement to post-retirement health care benefits is based on the employee remaining in service up to retirement age and the completion of a minimum service period. The expected costs of these benefits are accrued over the period of employment.
Independent qualified actuaries carry out valuations of these obligations.
The amount recognised as a liability for other long-term employee benefits is the net total of the following amounts:
• the present value of the defined benefit obligation at the reporting date;
• minus the fair value at the reporting date of plan assets (if any) out of which the obligations are to be settled directly.
The entity recognises the net total of the following amounts as expense or revenue, except to the extent that another Standard requires or permits their inclusion in the cost of an asset:
• current service cost;
• interest cost;
• actuarial gains and losses, which are all recognised immediately;
• past service cost, which are all recognised immediately; and
• the effect of any curtailments or settlements.
1.9 Provisions and contingencies
A provision is a liability of uncertain timing or amount. A contingent liability is:
• a possible obligation that arises from past events, and whose existence will be confirmed only by the occurrence or non-occurrence of one or more uncertain future events not wholly within the control of the entity; or
• a present obligation that arises from past events but is not recognised because:
(i) it is not probable that an outflow of resources embodying economic benefits or service potential will be required to settle the obligation;
or
ii) the amount of the obligation cannot be measured with sufficient reliability.
A contingent asset is a possible asset that arises from past events, and whose existence will be confirmed only by the occurrence or non-occurrence of one or more uncertain future events not wholly within the control of the entity.
83NRCS Annual Report 2013/2014
Provisions are recognised when:
• the entity has a present obligation as a result of a past event;
• it is probable that an outflow of resources embodying economic benefits or service potential will be required to settle the obligation; and
• a reliable estimate can be made of the obligation.
The amount of a provision is the best estimate of the expenditure expected to be required to settle the present obligation at the reporting date.
Where the effect of time value of money is material, the amount of a provision is the present value of the expenditures expected to be required to settle the obligation.
The discount rate is a pre-tax rate that reflects current market assessments of the time value of money and the risks specific to the liability.
Where some or all of the expenditure required to settle a provision is expected to be reimbursed by another party, the reimbursement is recognised when, and only when, it is virtually certain that the reimbursement will be received if the entity settles the obligation. The reimbursement is treated as a separate asset. The amount recognised for the reimbursement does not exceed the amount of the provision.
Provisions are reviewed at each reporting date and adjusted to reflect the current best estimate. Provisions are reversed if it is no longer probable that an outflow of resources embodying economic benefits or service potential will be required to settle the obligation.
Where discounting is used, the carrying amount of a provision increases in each period to reflect the passage of time. This increase is recognised as an interest expense.
A provision is used only for expenditures for which the provision was originally recognised. Provisions are not recognised for future operating deficits.
If the entity has a contract that is onerous, the present obligation (net of recoveries) under the contract is recognised and measured as a provision.
Contingent assets and contingent liabilities are not recognised. Contingencies are disclosed in note 26.
1.10 Revenue from exchange transactions
Revenue is the gross inflow of economic benefits or service potential during the reporting period when those inflows result in an increase in net assets, other than increases relating to contributions from owners.
An exchange transaction is one in which the entity receives assets or services, or has liabilities extinguished, and directly gives approximately equal value (primarily in the form of goods, services or use of assets) to the other party in exchange.
Fair value is the amount for which an asset could be exchanged, or a liability settled between knowledgeable, willing parties in an arm’s length transaction.
Measurement
Revenue is measured at the fair value of the consideration received or receivable, net of trade discounts and volume rebates.
Rendering of services
When the outcome of a transaction involving the rendering of services can be estimated reliably, revenue associated with the transaction is recognised by reference to the stage of completion of the transaction at the reporting date. The outcome of a transaction can be estimated reliably when all the following conditions are satisfied:
• the amount of revenue can be measured reliably;
• it is probable that the economic benefits or service potential associated with the transaction will flow to the entity;
• the stage of completion of the transaction at the reporting date can be measured reliably; and
• the costs incurred for the transaction and the costs to complete the transaction can be measured reliably.
When services are performed by an indeterminate number of acts over a specified time frame, revenue is recognised on a straight-line basis over the specified time frame unless there is evidence that some other method better represents the stage of completion. When a specific act is much more significant than any other acts, the recognition of revenue is postponed until the significant act is executed.
84 NRCS Annual Report 2013/2014
When the outcome of the transaction involving the rendering of services cannot be estimated reliably, revenue is recognised only to the extent of the expenses recognised that are recoverable.
Interest
Revenue arising from the use by others of entity assets yielding interest is recognised when:
• it is probable that the economic benefits or service potential associated with the transaction will flow to the entity; and
• the amount of the revenue can be measured reliably.
Interest is recognised, in surplus or deficit, using the effective interest rate method.
1.11 Revenue from non-exchange transactions
Non-exchange transactions are defined as transactions where the entity receives value from another entity without directly giving approximately equal value in exchange.
Revenue is the gross inflow of economic benefits or service potential during the reporting period when those inflows result in an increase in net assets, other than increases relating to contributions from owners.
Fair value is the amount for which an asset could be exchanged, or a liability settled between knowledgeable, willing parties in an arm’s length transaction.
Measurement
Revenue is measured at the fair value of the consideration received or receivable, net of trade discounts and volume rebates.
Levies
Levies are recognised as revenue when:
• it is probable that the economic benefits or service potential associated with the transaction will flow to the entity; and
• the amount of the revenue can be measured reliably.
Levies are based on declarations completed by levy payers. If levies are received unaccompanied by a levy return, levies are estimated based on the following factors:
• the extent and success of procedures to investigate the non-submission of a declaration by defaulting levy payers;
• internal records maintained of historical comparisons of estimated levies with actual levies received from individual levy payers;
• historical information on declarations previously submitted by defaulting levy payers; and
• the accuracy of the database of levy payers as well as the frequency by which it is updated for changes.
Changes to estimates are made when more reliable information becomes available and are processed as an adjustment to levies revenue.
Revenue is then only recognised once it becomes due and payable.
Government grants
Government grants are recognised as revenue when:
• it is probable that the economic benefits or service potential associated with the transaction will flow to the entity;
• the amount of the revenue can be measured reliably; and
• there has been compliance with any restrictions associated with the grant.
The entity assesses the degree of certainty attached to the flow of future economic benefits or service potential on the basis of the available evidence. Certain grants payable by one level of government to another are subject to the availability of funds.
Revenue from these grants is only recognised when it is probable that the economic benefits or service potential associated with the transaction will flow to the entity. An announcement at the beginning of a financial year that grants may be available for qualifying entities in accordance with an agreed programme, may not be sufficient evidence of the probability of the flow.
85NRCS Annual Report 2013/2014
1.12 Investment income
Investment income is recognised on a time-proportion basis using the effective interest method.
1.13 Translation of foreign currencies
Foreign currency transactions
A foreign currency transaction is recorded, on initial recognition in Rands, by applying to the foreign currency amount the spot exchange rate between the functional currency and the foreign currency at the date of the transaction.
At each reporting date:
• foreign currency monetary items are translated using the closing rate;
• non-monetary items that are measured in terms of historical cost in a foreign currency are translated using the exchange rate at the date of the transaction; and
• non-monetary items that are measured at fair value in a foreign currency are translated using the exchange rates at the date when the fair value was determined.
Exchange differences arising on the settlement of monetary items or on translating monetary items at rates different from those at which they were translated on initial recognition during the period or in previous financial statements, are recognised in surplus or deficit in the period in which they arise.
When a gain or loss on a non-monetary item is recognised directly in net assets, any exchange component of that gain or loss is recognised directly in net assets. When a gain or loss on a non-monetary item is recognised in surplus or deficit, any exchange component of that gain or loss is recognised in surplus or deficit.
Cash flows arising from transactions in a foreign currency are recorded in Rands by applying to the foreign currency amount the exchange rate between the Rand and the foreign currency at the date of the cash flow.
1.14 Fruitless and wasteful expenditure
Fruitless and wasteful expenditure is expenditure that was made in vain and would have been avoided had reasonable care been exercised.
All expenditure relating to fruitless and wasteful expenditure is recognised as an expense in the statement of financial performance in the reporting period that the expenditure was incurred. The expenditure is classified in accordance with the nature of the expense, and where recovered, it is subsequently accounted for as revenue in the statement of financial performance.
1.15 Irregular expenditure
Irregular expenditure as defined in section 1 of the PFMA is expenditure other than unauthorised expenditure, incurred in contravention of or that is not in accordance with a requirement of any applicable legislation, including -
(a) the PFMA; or
(b) the State Tender Board Act, No. 86 of 1968 or any regulations made in terms of the Act; or
(c ) any provincial legislation providing for procurement procedures in that provincial government.
Irregular expenditure is accounted for as expenditure in the Statement of Financial Performance and where recovered, it is subsequently accounted for as revenue in the Statement of Financial Performance.
1.16 Budget information
The financial statements and the budget are on the same basis of accounting therefore a comparison with the budgeted amounts for the reporting period has been included in the statement of comparison of budget and actual amounts.
1.17 Related parties
A related party is a person or an entity with the ability
to control or jointly control the other party, or exercise
significant influence over the other party, or vice
versa, or an entity that is subject to common control
or joint control.
The entity operates in an economic sector currently
dominated by entities directly or indirectly owned by
the South African Government. As a consequence of
the constitutional independence of the three spheres
of government in South Africa, only entities within
the national sphere of government are considered to
be related parties.
86 NRCS Annual Report 2013/2014 86 NRCS Annual Report 2013/2014
The entity does not disclose related party transactions if the transaction occurs within a normal supplier and/or client/recipient relationship on terms and conditions no more or less favourable than those which it is reasonable to expect the entity to have adopted if dealing with that individual entity or person in the same circumstances and on terms and conditions within the normal operating parameters established by that reporting entity’s legal mandate.
Management are those persons responsible for planning, directing and controlling the activities of the entity, including those charged with the governance of the entity in accordance with legislation, in instances where they are required to perform such functions.
Close members of the family of a person are considered to be those family members who may be expected to influence, or be influenced by management in their dealings with the entity.
1.18 Transfer of functions from an entity under common control
Assets and liabilities are initially recognised at fair value resulting in the accounting of net assets transferred, including contingent liabilities. The net assets are accounted for as a surplus in the statement of financial performance.
Where assets were transferred and no historical costs were available, the fair values were determined at the reporting date and recognised in the Annual Financial Statements.
1.19 Commitments
Commitments other than lease commitments represent goods and services that have been approved and/or contracted, but where no delivery has taken place at the reporting date.
1.20 Taxation
The NRCS has been exempted from income tax in terms of the provisions of section 10(1)(cA)(I) of the Income Tax Act, No. 58 of 1962.
1.21 Statements of GRAP issued, but changes not yet effective
Statement Effective dateGRAP 5 (revised)
Borrowing costs 1 April 2014
GRAP 18 Segment reporting None announced
GRAP 20 Related party disclosure None announced
GRAP 32 Service concession arrangements: Grantor
None announced
GRAP 100 (revised)
Non-current assets held for sale and discontinued operations
1 April 2014
GRAP 105 Transfer of functions between entities under common control
None announced
GRAP 106 Transfer of functions between entities not under common control
None announced
GRAP 107 Mergers None announced
GRAP 108 Statutory receivables None announced
IGRAP 17 Interpretation of the Standard of GRAP on service concession arrangements where a grantor controls a significant residual interest in an asset
None announced
The implementation of these statements and interpretations of GRAP is not expected to impact materially on the financial statements of the entity.
1.22 Statements of GRAP issued and effective
The following statements of GRAP became effective during the period under review:
Statement
GRAP 25 Employee benefits
GRAP 27 Agriculture
GRAP 31 Intangible assets
IGRAP 1 Applying the probability test on initial recognition of revenue
IGRAP 16 Intangible assets - website costs
The adoption of these standards of GRAP has not had any material impact on the entity as it has already early adopted GRAP 25.
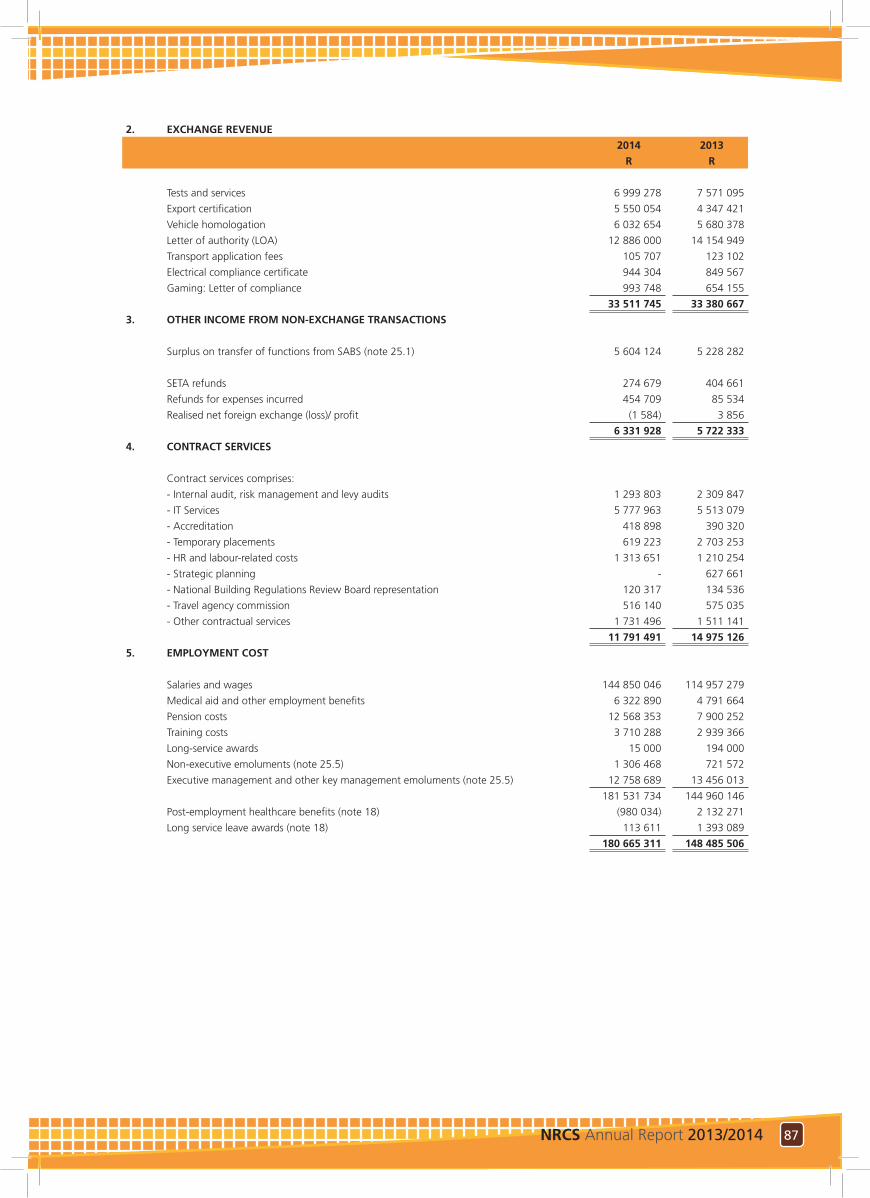
87NRCS Annual Report 2013/2014 87NRCS Annual Report 2013/2014
2. EXCHANGE REVENUE
2014 2013
R R
Tests and services 6 999 278 7 571 095
Export certification 5 550 054 4 347 421
Vehicle homologation 6 032 654 5 680 378
Letter of authority (LOA) 12 886 000 14 154 949
Transport application fees 105 707 123 102
Electrical compliance certificate 944 304 849 567
Gaming: Letter of compliance 993 748 654 155
33 511 745 33 380 667
3. OTHER INCOME FROM NON-EXCHANGE TRANSACTIONS
Surplus on transfer of functions from SABS (note 25.1) 5 604 124 5 228 282
SETA refunds 274 679 404 661
Refunds for expenses incurred 454 709 85 534
Realised net foreign exchange (loss)/ profit (1 584) 3 856
6 331 928 5 722 333
4. CONTRACT SERVICES
Contract services comprises:
- Internal audit, risk management and levy audits 1 293 803 2 309 847
- IT Services 5 777 963 5 513 079
- Accreditation 418 898 390 320
- Temporary placements 619 223 2 703 253
- HR and labour-related costs 1 313 651 1 210 254
- Strategic planning - 627 661
- National Building Regulations Review Board representation 120 317 134 536
- Travel agency commission 516 140 575 035
- Other contractual services 1 731 496 1 511 141
11 791 491 14 975 126
5. EMPLOYMENT COST
Salaries and wages 144 850 046 114 957 279
Medical aid and other employment benefits 6 322 890 4 791 664
Pension costs 12 568 353 7 900 252
Training costs 3 710 288 2 939 366
Long-service awards 15 000 194 000
Non-executive emoluments (note 25.5) 1 306 468 721 572
Executive management and other key management emoluments (note 25.5) 12 758 689 13 456 013
181 531 734 144 960 146
Post-employment healthcare benefits (note 18) (980 034) 2 132 271
Long service leave awards (note 18) 113 611 1 393 089
180 665 311 148 485 506
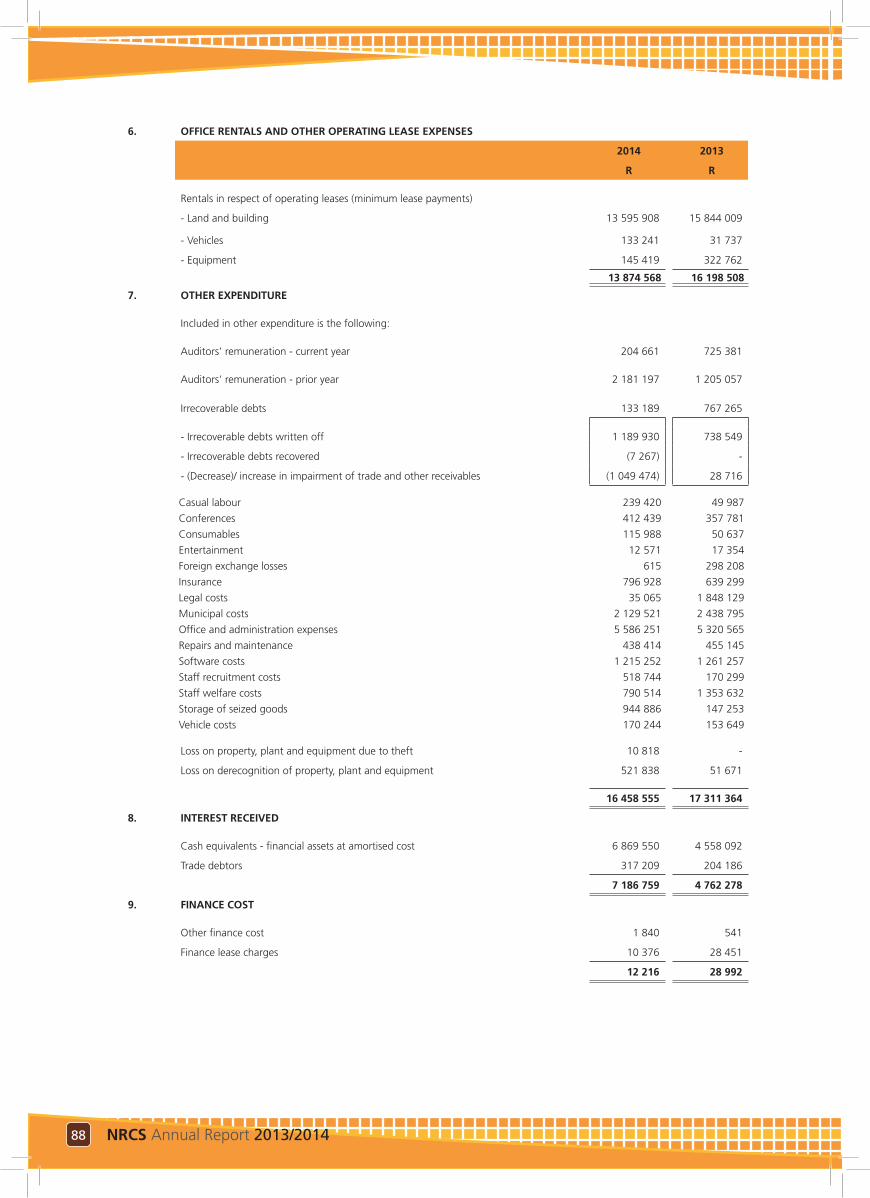
88 NRCS Annual Report 2013/2014
6. OFFICE RENTALS AND OTHER OPERATING LEASE EXPENSES
2014 2013
R R
Rentals in respect of operating leases (minimum lease payments)
- Land and building 13 595 908 15 844 009
- Vehicles 133 241 31 737
- Equipment 145 419 322 762
13 874 568 16 198 508
7. OTHER EXPENDITURE
Included in other expenditure is the following:
Auditors’ remuneration - current year 204 661 725 381
Auditors’ remuneration - prior year 2 181 197 1 205 057
Irrecoverable debts 133 189 767 265
- Irrecoverable debts written off 1 189 930 738 549
- Irrecoverable debts recovered (7 267) -
- (Decrease)/ increase in impairment of trade and other receivables (1 049 474) 28 716
Casual labour 239 420 49 987
Conferences 412 439 357 781
Consumables 115 988 50 637
Entertainment 12 571 17 354
Foreign exchange losses 615 298 208
Insurance 796 928 639 299
Legal costs 35 065 1 848 129
Municipal costs 2 129 521 2 438 795
Office and administration expenses 5 586 251 5 320 565
Repairs and maintenance 438 414 455 145
Software costs 1 215 252 1 261 257
Staff recruitment costs 518 744 170 299
Staff welfare costs 790 514 1 353 632
Storage of seized goods 944 886 147 253
Vehicle costs 170 244 153 649
Loss on property, plant and equipment due to theft 10 818 -
Loss on derecognition of property, plant and equipment 521 838 51 671
16 458 555 17 311 364
8. INTEREST RECEIVED
Cash equivalents - financial assets at amortised cost 6 869 550 4 558 092
Trade debtors 317 209 204 186
7 186 759 4 762 278
9. FINANCE COST
Other finance cost 1 840 541
Finance lease charges 10 376 28 451
12 216 28 992
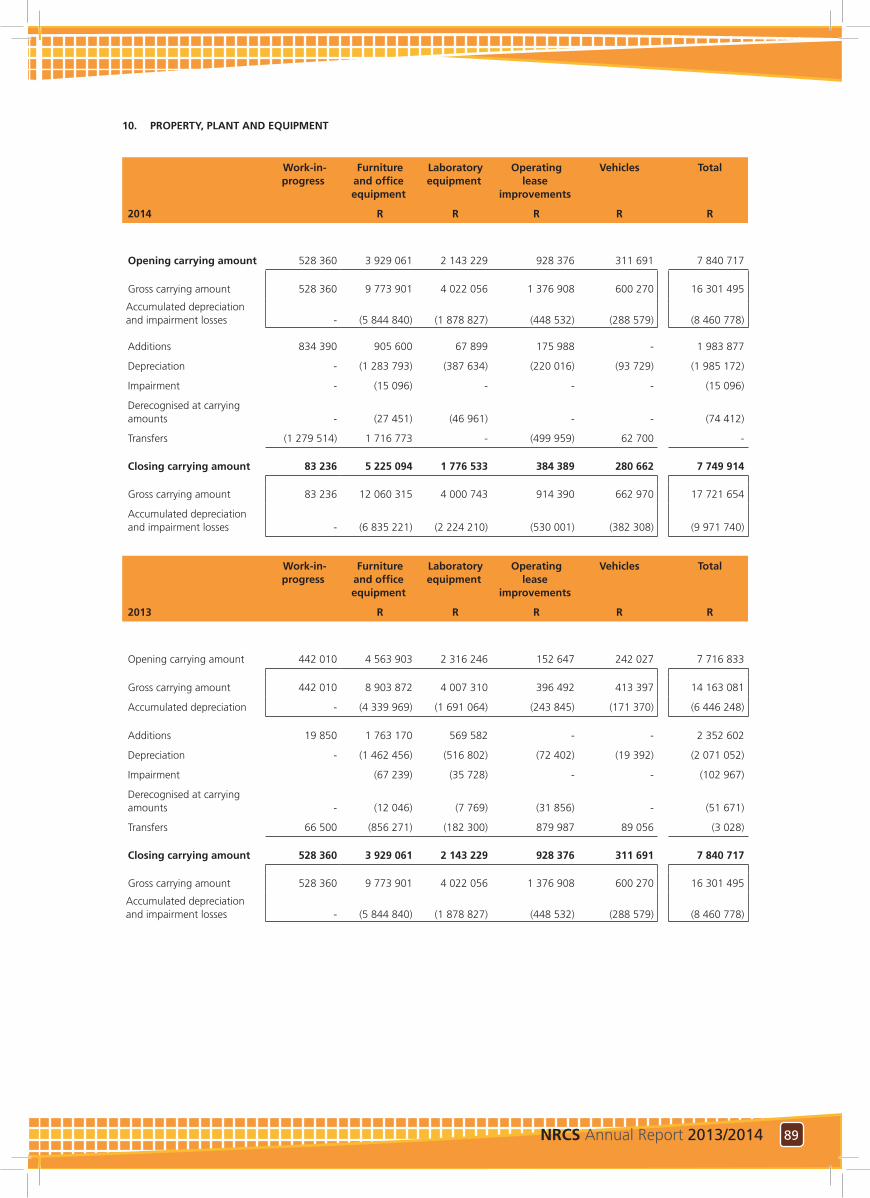
89NRCS Annual Report 2013/2014
10. PROPERTY, PLANT AND EQUIPMENT
Work-in-progress
Furniture and office equipment
Laboratory equipment
Operating lease
improvements
Vehicles Total
2014 R R R R R
Opening carrying amount 528 360 3 929 061 2 143 229 928 376 311 691 7 840 717
Gross carrying amount 528 360 9 773 901 4 022 056 1 376 908 600 270 16 301 495
Accumulated depreciation and impairment losses - (5 844 840) (1 878 827) (448 532) (288 579) (8 460 778)
Additions 834 390 905 600 67 899 175 988 - 1 983 877
Depreciation - (1 283 793) (387 634) (220 016) (93 729) (1 985 172)
Impairment - (15 096) - - - (15 096)
Derecognised at carrying amounts - (27 451) (46 961) - - (74 412)
Transfers (1 279 514) 1 716 773 - (499 959) 62 700 -
Closing carrying amount 83 236 5 225 094 1 776 533 384 389 280 662 7 749 914
Gross carrying amount 83 236 12 060 315 4 000 743 914 390 662 970 17 721 654
Accumulated depreciation and impairment losses - (6 835 221) (2 224 210) (530 001) (382 308) (9 971 740)
Work-in-progress
Furniture and office equipment
Laboratory equipment
Operating lease
improvements
Vehicles Total
2013 R R R R R
Opening carrying amount 442 010 4 563 903 2 316 246 152 647 242 027 7 716 833
Gross carrying amount 442 010 8 903 872 4 007 310 396 492 413 397 14 163 081
Accumulated depreciation - (4 339 969) (1 691 064) (243 845) (171 370) (6 446 248)
Additions 19 850 1 763 170 569 582 - - 2 352 602
Depreciation - (1 462 456) (516 802) (72 402) (19 392) (2 071 052)
Impairment (67 239) (35 728) - - (102 967)
Derecognised at carrying amounts - (12 046) (7 769) (31 856) - (51 671)
Transfers 66 500 (856 271) (182 300) 879 987 89 056 (3 028)
Closing carrying amount 528 360 3 929 061 2 143 229 928 376 311 691 7 840 717
Gross carrying amount 528 360 9 773 901 4 022 056 1 376 908 600 270 16 301 495
Accumulated depreciation and impairment losses - (5 844 840) (1 878 827) (448 532) (288 579) (8 460 778)
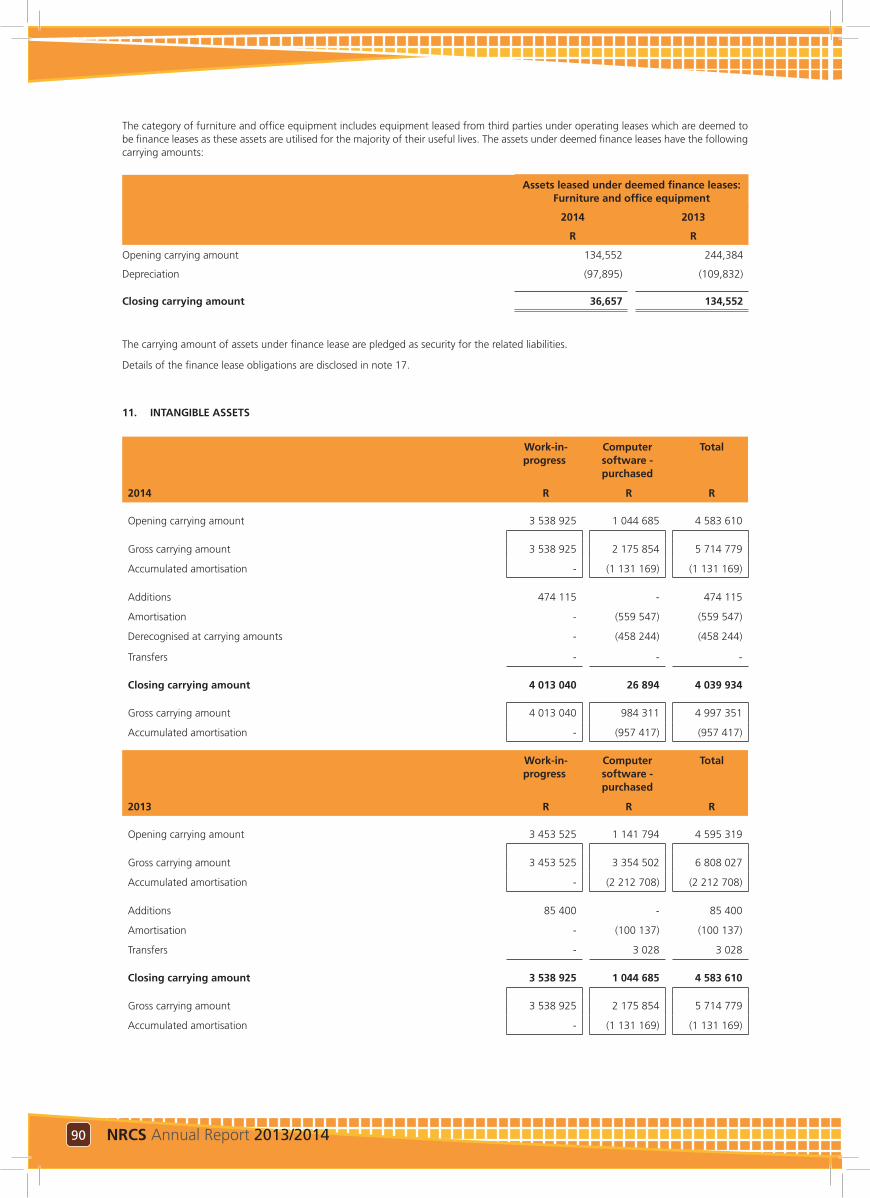
90 NRCS Annual Report 2013/2014
The category of furniture and office equipment includes equipment leased from third parties under operating leases which are deemed to be finance leases as these assets are utilised for the majority of their useful lives. The assets under deemed finance leases have the following carrying amounts:
Assets leased under deemed finance leases: Furniture and office equipment
2014 2013
R R
Opening carrying amount 134,552 244,384
Depreciation (97,895) (109,832)
Closing carrying amount 36,657 134,552
The carrying amount of assets under finance lease are pledged as security for the related liabilities.
Details of the finance lease obligations are disclosed in note 17.
11. INTANGIBLE ASSETS
Work-in-progress
Computer software - purchased
Total
2014 R R R
Opening carrying amount 3 538 925 1 044 685 4 583 610
Gross carrying amount 3 538 925 2 175 854 5 714 779
Accumulated amortisation - (1 131 169) (1 131 169)
Additions 474 115 - 474 115
Amortisation - (559 547) (559 547)
Derecognised at carrying amounts - (458 244) (458 244)
Transfers - - -
Closing carrying amount 4 013 040 26 894 4 039 934
Gross carrying amount 4 013 040 984 311 4 997 351
Accumulated amortisation - (957 417) (957 417)
Work-in-progress
Computer software - purchased
Total
2013 R R R
Opening carrying amount 3 453 525 1 141 794 4 595 319
Gross carrying amount 3 453 525 3 354 502 6 808 027
Accumulated amortisation - (2 212 708) (2 212 708)
Additions 85 400 - 85 400
Amortisation - (100 137) (100 137)
Transfers - 3 028 3 028
Closing carrying amount 3 538 925 1 044 685 4 583 610
Gross carrying amount 3 538 925 2 175 854 5 714 779
Accumulated amortisation - (1 131 169) (1 131 169)
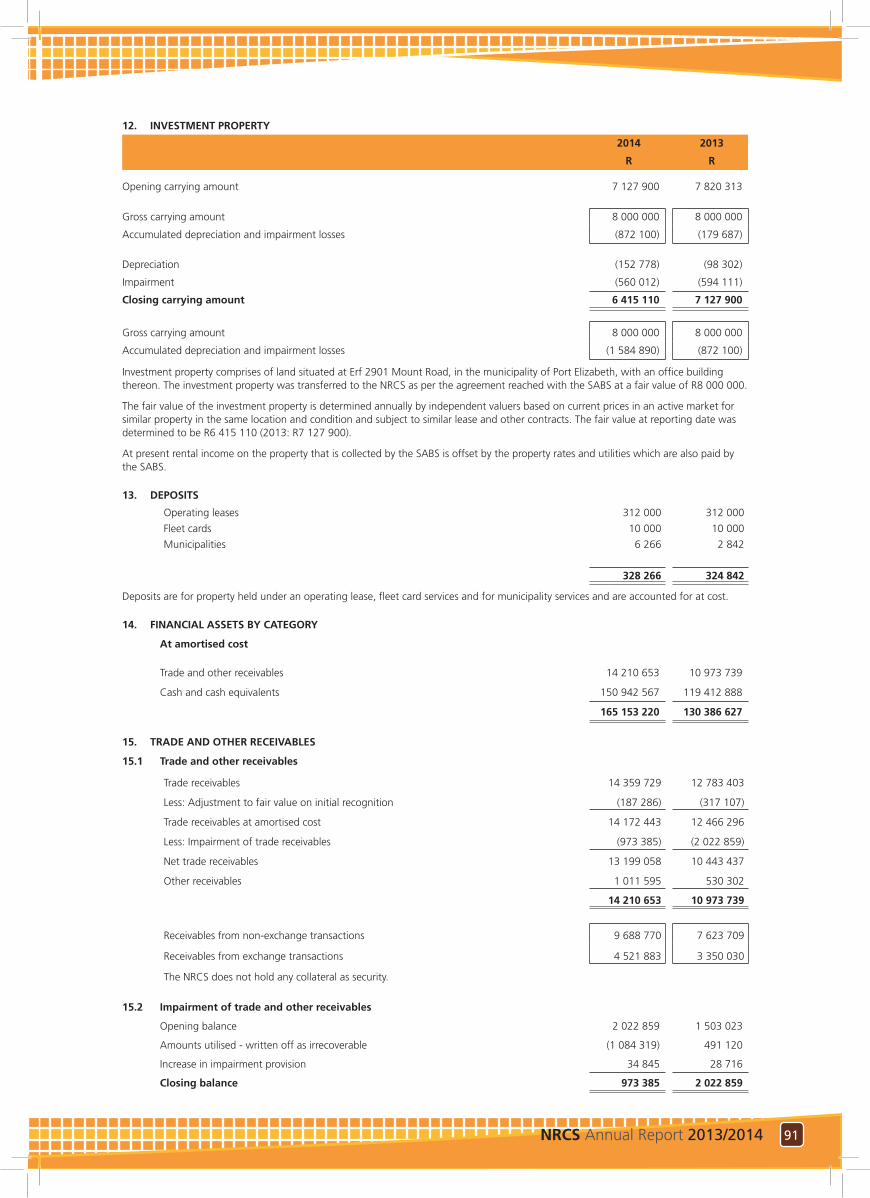
91NRCS Annual Report 2013/2014
12. INVESTMENT PROPERTY
2014 2013
R R
Opening carrying amount 7 127 900 7 820 313
Gross carrying amount 8 000 000 8 000 000
Accumulated depreciation and impairment losses (872 100) (179 687)
Depreciation (152 778) (98 302)
Impairment (560 012) (594 111)
Closing carrying amount 6 415 110 7 127 900
Gross carrying amount 8 000 000 8 000 000
Accumulated depreciation and impairment losses (1 584 890) (872 100)
Investment property comprises of land situated at Erf 2901 Mount Road, in the municipality of Port Elizabeth, with an office building thereon. The investment property was transferred to the NRCS as per the agreement reached with the SABS at a fair value of R8 000 000.
The fair value of the investment property is determined annually by independent valuers based on current prices in an active market for similar property in the same location and condition and subject to similar lease and other contracts. The fair value at reporting date was determined to be R6 415 110 (2013: R7 127 900).
At present rental income on the property that is collected by the SABS is offset by the property rates and utilities which are also paid by the SABS.
13. DEPOSITS
Operating leases 312 000 312 000
Fleet cards 10 000 10 000
Municipalities 6 266 2 842
328 266 324 842
Deposits are for property held under an operating lease, fleet card services and for municipality services and are accounted for at cost.
14. FINANCIAL ASSETS BY CATEGORY
At amortised cost
Trade and other receivables 14 210 653 10 973 739
Cash and cash equivalents 150 942 567 119 412 888
165 153 220 130 386 627
15. TRADE AND OTHER RECEIVABLES
15.1 Trade and other receivables
Trade receivables 14 359 729 12 783 403
Less: Adjustment to fair value on initial recognition (187 286) (317 107)
Trade receivables at amortised cost 14 172 443 12 466 296
Less: Impairment of trade receivables (973 385) (2 022 859)
Net trade receivables 13 199 058 10 443 437
Other receivables 1 011 595 530 302
14 210 653 10 973 739
Receivables from non-exchange transactions 9 688 770 7 623 709
Receivables from exchange transactions 4 521 883 3 350 030
The NRCS does not hold any collateral as security.
15.2 Impairment of trade and other receivables
Opening balance 2 022 859 1 503 023
Amounts utilised - written off as irrecoverable (1 084 319) 491 120
Increase in impairment provision 34 845 28 716
Closing balance 973 385 2 022 859
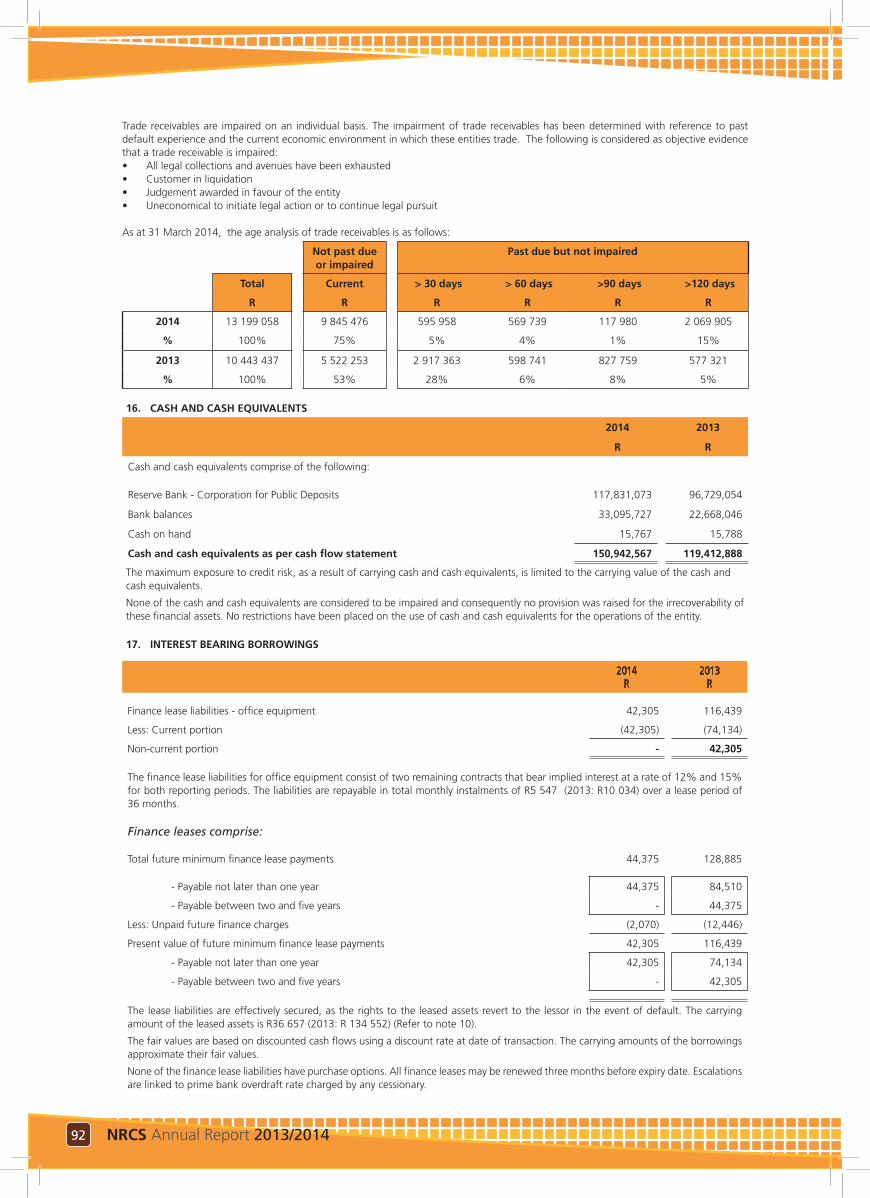
92 NRCS Annual Report 2013/2014
Trade receivables are impaired on an individual basis. The impairment of trade receivables has been determined with reference to past default experience and the current economic environment in which these entities trade. The following is considered as objective evidence that a trade receivable is impaired:• All legal collections and avenues have been exhausted• Customer in liquidation• Judgement awarded in favour of the entity• Uneconomical to initiate legal action or to continue legal pursuit
As at 31 March 2014, the age analysis of trade receivables is as follows:
Not past due or impaired
Past due but not impaired
Total Current > 30 days > 60 days >90 days >120 days
R R R R R R
2014 13 199 058 9 845 476 595 958 569 739 117 980 2 069 905
% 100% 75% 5% 4% 1% 15%
2013 10 443 437 5 522 253 2 917 363 598 741 827 759 577 321
% 100% 53% 28% 6% 8% 5%
16. CASH AND CASH EQUIVALENTS
2014 2013
R R
Cash and cash equivalents comprise of the following:
Reserve Bank - Corporation for Public Deposits 117,831,073 96,729,054
Bank balances 33,095,727 22,668,046
Cash on hand 15,767 15,788
Cash and cash equivalents as per cash flow statement 150,942,567 119,412,888
The maximum exposure to credit risk, as a result of carrying cash and cash equivalents, is limited to the carrying value of the cash and cash equivalents.
None of the cash and cash equivalents are considered to be impaired and consequently no provision was raised for the irrecoverability of these financial assets. No restrictions have been placed on the use of cash and cash equivalents for the operations of the entity.
17. INTEREST BEARING BORROWINGS
2014R
2013R
Finance lease liabilities - office equipment 42,305 116,439
Less: Current portion (42,305) (74,134)
Non-current portion - 42,305
The finance lease liabilities for office equipment consist of two remaining contracts that bear implied interest at a rate of 12% and 15% for both reporting periods. The liabilities are repayable in total monthly instalments of R5 547 (2013: R10 034) over a lease period of 36 months.
Finance leases comprise:
Total future minimum finance lease payments 44,375 128,885
- Payable not later than one year 44,375 84,510
- Payable between two and five years - 44,375
Less: Unpaid future finance charges (2,070) (12,446)
Present value of future minimum finance lease payments 42,305 116,439
- Payable not later than one year 42,305 74,134
- Payable between two and five years - 42,305
The lease liabilities are effectively secured, as the rights to the leased assets revert to the lessor in the event of default. The carrying amount of the leased assets is R36 657 (2013: R 134 552) (Refer to note 10).
The fair values are based on discounted cash flows using a discount rate at date of transaction. The carrying amounts of the borrowings approximate their fair values.
None of the finance lease liabilities have purchase options. All finance leases may be renewed three months before expiry date. Escalations are linked to prime bank overdraft rate charged by any cessionary.
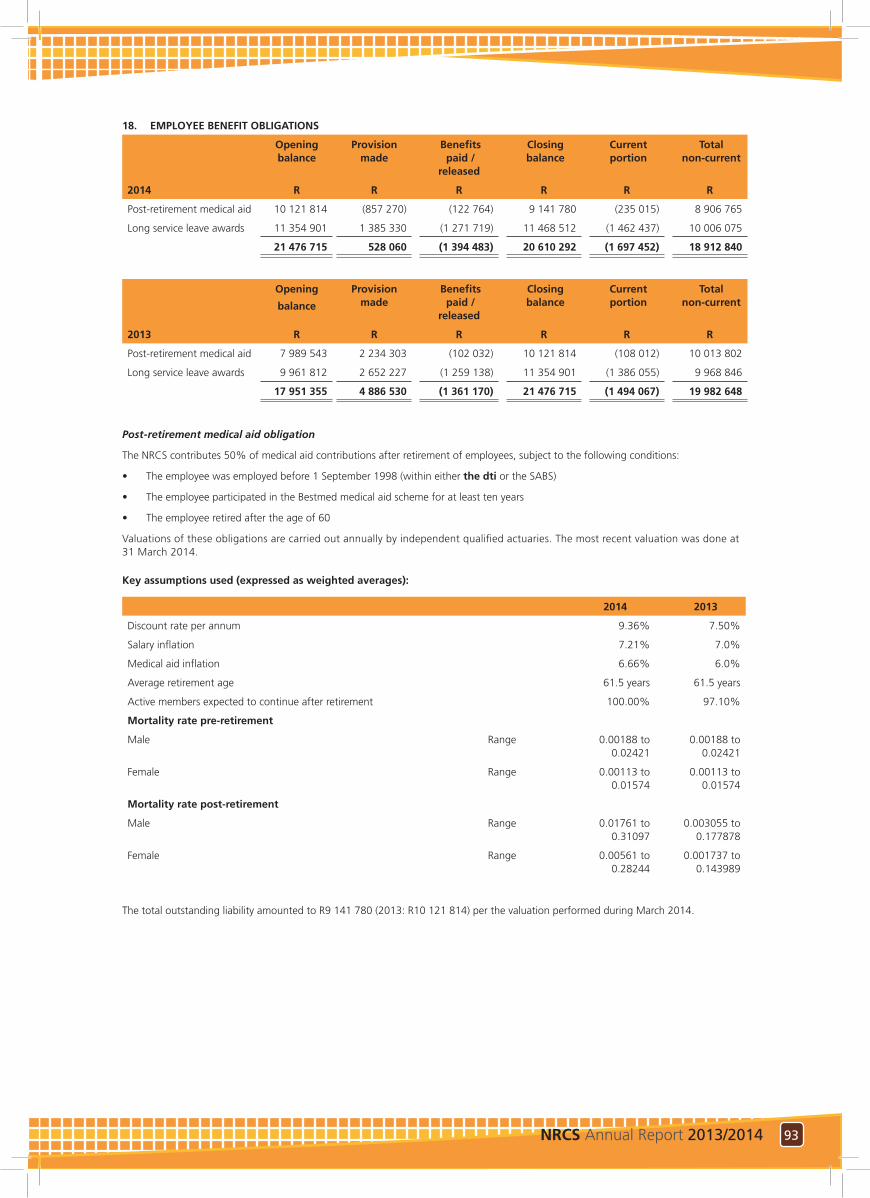
93NRCS Annual Report 2013/2014
18. EMPLOYEE BENEFIT OBLIGATIONS
Openingbalance
Provisionmade
Benefits paid /
released
Closing balance
Current portion
Total non-current
2014 R R R R R R
Post-retirement medical aid 10 121 814 (857 270) (122 764) 9 141 780 (235 015) 8 906 765
Long service leave awards 11 354 901 1 385 330 (1 271 719) 11 468 512 (1 462 437) 10 006 075
21 476 715 528 060 (1 394 483) 20 610 292 (1 697 452) 18 912 840
Opening
balance
Provisionmade
Benefits paid /
released
Closing balance
Current portion
Total non-current
2013 R R R R R R
Post-retirement medical aid 7 989 543 2 234 303 (102 032) 10 121 814 (108 012) 10 013 802
Long service leave awards 9 961 812 2 652 227 (1 259 138) 11 354 901 (1 386 055) 9 968 846
17 951 355 4 886 530 (1 361 170) 21 476 715 (1 494 067) 19 982 648
Post-retirement medical aid obligation
The NRCS contributes 50% of medical aid contributions after retirement of employees, subject to the following conditions:
• The employee was employed before 1 September 1998 (within either the dti or the SABS)
• The employee participated in the Bestmed medical aid scheme for at least ten years
• The employee retired after the age of 60
Valuations of these obligations are carried out annually by independent qualified actuaries. The most recent valuation was done at 31 March 2014.
Key assumptions used (expressed as weighted averages):
2014 2013
Discount rate per annum 9.36% 7.50%
Salary inflation 7.21% 7.0%
Medical aid inflation 6.66% 6.0%
Average retirement age 61.5 years 61.5 years
Active members expected to continue after retirement 100.00% 97.10%
Mortality rate pre-retirement
Male Range 0.00188 to 0.02421
0.00188 to 0.02421
Female Range 0.00113 to 0.01574
0.00113 to 0.01574
Mortality rate post-retirement
Male Range 0.01761 to 0.31097
0.003055 to 0.177878
Female Range 0.00561 to 0.28244
0.001737 to 0.143989
The total outstanding liability amounted to R9 141 780 (2013: R10 121 814) per the valuation performed during March 2014.
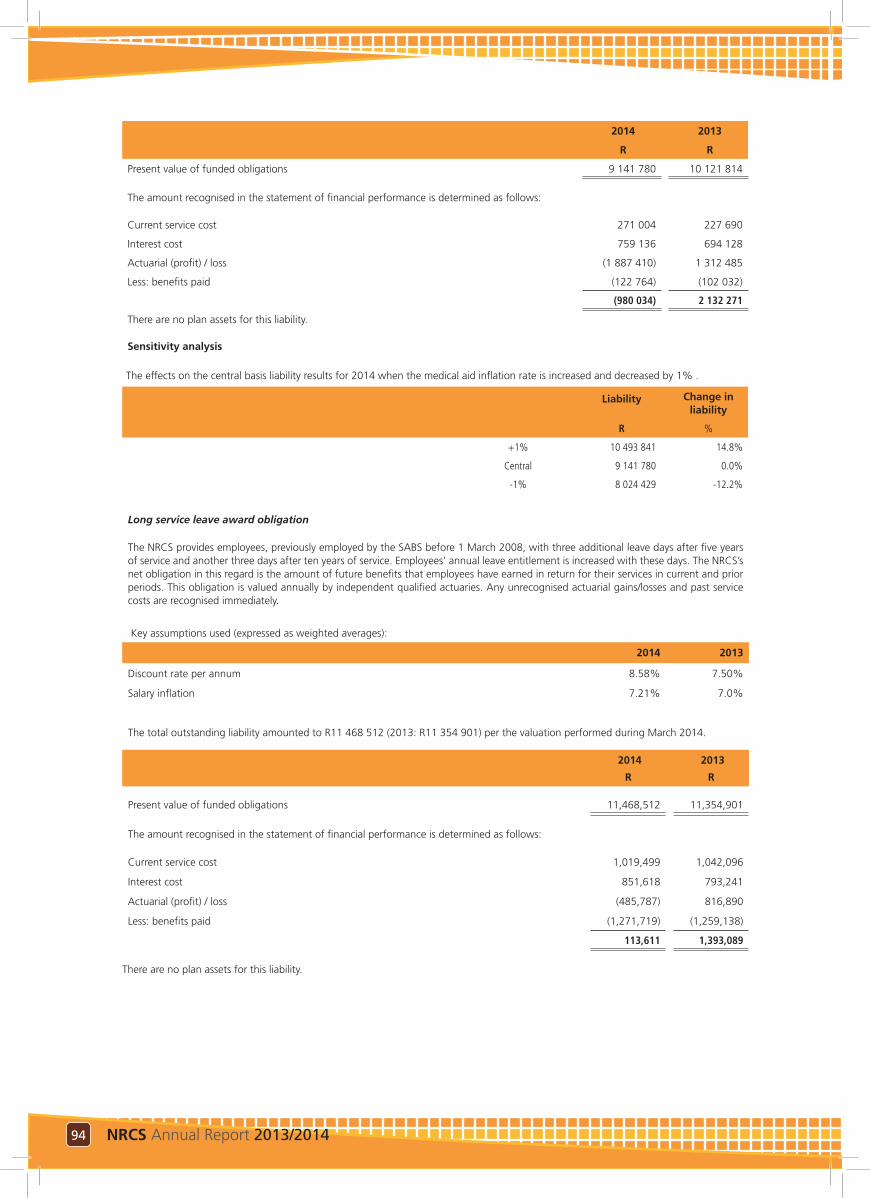
94 NRCS Annual Report 2013/2014
2014 2013
R R
Present value of funded obligations 9 141 780 10 121 814
The amount recognised in the statement of financial performance is determined as follows:
Current service cost 271 004 227 690
Interest cost 759 136 694 128
Actuarial (profit) / loss (1 887 410) 1 312 485
Less: benefits paid (122 764) (102 032)
(980 034) 2 132 271
There are no plan assets for this liability.
Sensitivity analysis
The effects on the central basis liability results for 2014 when the medical aid inflation rate is increased and decreased by 1% .
Liability Change in liability
R %
+1% 10 493 841 14.8%
Central 9 141 780 0.0%
-1% 8 024 429 -12.2%
Long service leave award obligation
The NRCS provides employees, previously employed by the SABS before 1 March 2008, with three additional leave days after five years of service and another three days after ten years of service. Employees’ annual leave entitlement is increased with these days. The NRCS’s net obligation in this regard is the amount of future benefits that employees have earned in return for their services in current and prior periods. This obligation is valued annually by independent qualified actuaries. Any unrecognised actuarial gains/losses and past service costs are recognised immediately.
Key assumptions used (expressed as weighted averages):
2014 2013
Discount rate per annum 8.58% 7.50%
Salary inflation 7.21% 7.0%
The total outstanding liability amounted to R11 468 512 (2013: R11 354 901) per the valuation performed during March 2014.
2014
R
2013
R
Present value of funded obligations 11,468,512 11,354,901
The amount recognised in the statement of financial performance is determined as follows:
Current service cost 1,019,499 1,042,096
Interest cost 851,618 793,241
Actuarial (profit) / loss (485,787) 816,890
Less: benefits paid (1,271,719) (1,259,138)
113,611 1,393,089
There are no plan assets for this liability.
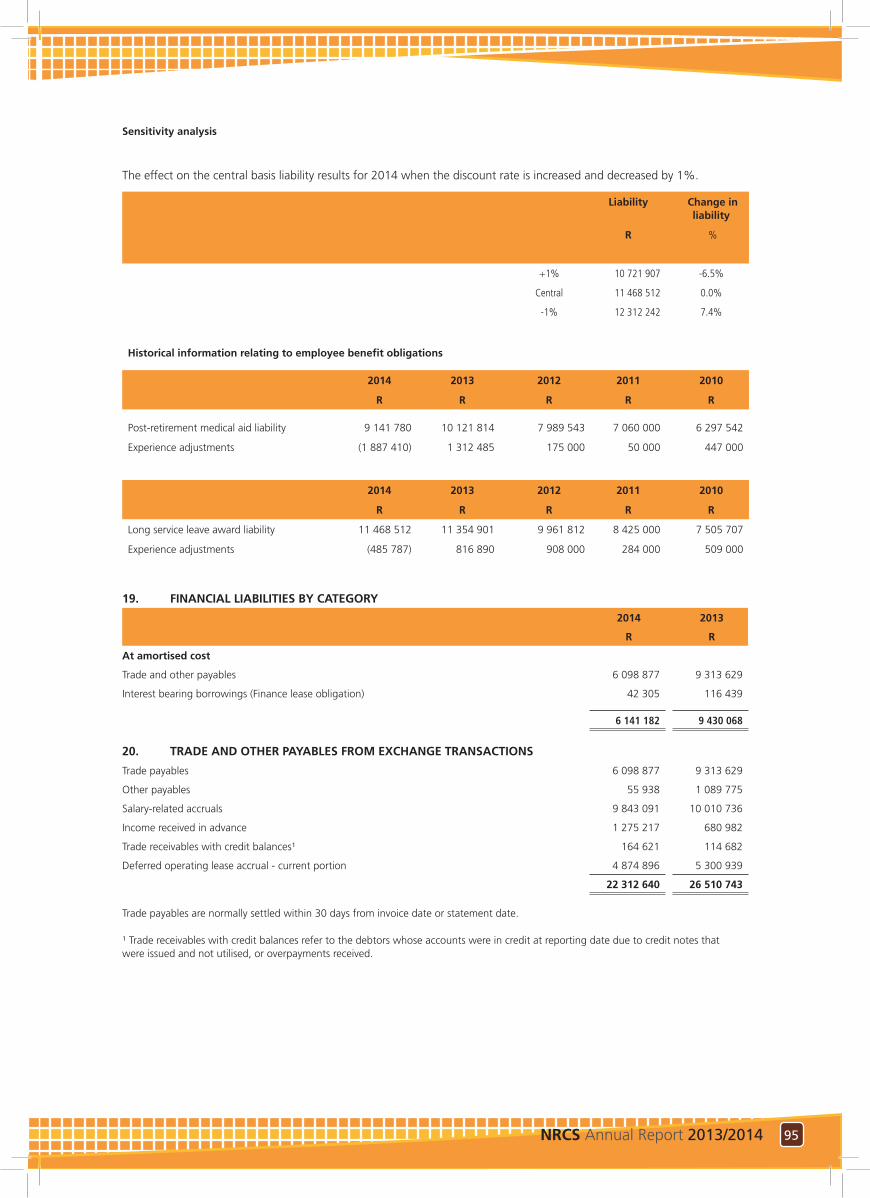
95NRCS Annual Report 2013/2014
Sensitivity analysis
The effect on the central basis liability results for 2014 when the discount rate is increased and decreased by 1%.
Liability Change in liability
R %
+1% 10 721 907 -6.5%
Central 11 468 512 0.0%
-1% 12 312 242 7.4%
Historical information relating to employee benefit obligations
2014 2013 2012 2011 2010
R R R R R
Post-retirement medical aid liability 9 141 780 10 121 814 7 989 543 7 060 000 6 297 542
Experience adjustments (1 887 410) 1 312 485 175 000 50 000 447 000
2014 2013 2012 2011 2010
R R R R R
Long service leave award liability 11 468 512 11 354 901 9 961 812 8 425 000 7 505 707
Experience adjustments (485 787) 816 890 908 000 284 000 509 000
19. FINANCIAL LIABILITIES BY CATEGORY
2014 2013
R R
At amortised cost
Trade and other payables 6 098 877 9 313 629
Interest bearing borrowings (Finance lease obligation) 42 305 116 439
6 141 182 9 430 068
20. TRADE AND OTHER PAYABLES FROM EXCHANGE TRANSACTIONS
Trade payables 6 098 877 9 313 629
Other payables 55 938 1 089 775
Salary-related accruals 9 843 091 10 010 736
Income received in advance 1 275 217 680 982
Trade receivables with credit balances¹ 164 621 114 682
Deferred operating lease accrual - current portion 4 874 896 5 300 939
22 312 640 26 510 743
Trade payables are normally settled within 30 days from invoice date or statement date.
¹ Trade receivables with credit balances refer to the debtors whose accounts were in credit at reporting date due to credit notes that were issued and not utilised, or overpayments received.
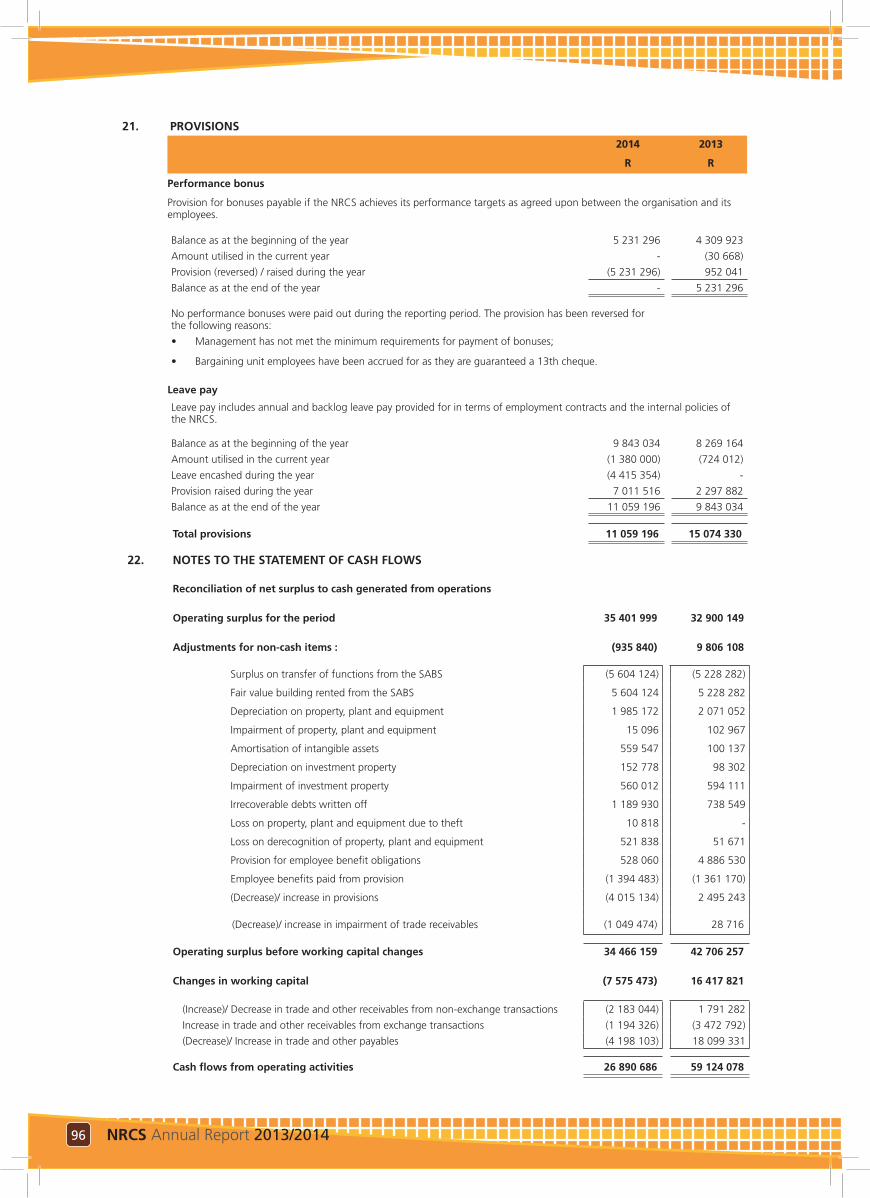
96 NRCS Annual Report 2013/2014
21. PROVISIONS 2014 2013
R R
Performance bonus
Provision for bonuses payable if the NRCS achieves its performance targets as agreed upon between the organisation and its employees.
Balance as at the beginning of the year 5 231 296 4 309 923
Amount utilised in the current year - (30 668)
Provision (reversed) / raised during the year (5 231 296) 952 041
Balance as at the end of the year - 5 231 296
No performance bonuses were paid out during the reporting period. The provision has been reversed for the following reasons:
• Management has not met the minimum requirements for payment of bonuses;
• Bargaining unit employees have been accrued for as they are guaranteed a 13th cheque.
Leave pay
Leave pay includes annual and backlog leave pay provided for in terms of employment contracts and the internal policies of the NRCS.
Balance as at the beginning of the year 9 843 034 8 269 164
Amount utilised in the current year (1 380 000) (724 012)
Leave encashed during the year (4 415 354) -
Provision raised during the year 7 011 516 2 297 882
Balance as at the end of the year 11 059 196 9 843 034
Total provisions 11 059 196 15 074 330
22. NOTES TO THE STATEMENT OF CASH FLOWS
Reconciliation of net surplus to cash generated from operations
Operating surplus for the period 35 401 999 32 900 149
Adjustments for non-cash items : (935 840) 9 806 108
Surplus on transfer of functions from the SABS (5 604 124) (5 228 282)
Fair value building rented from the SABS 5 604 124 5 228 282
Depreciation on property, plant and equipment 1 985 172 2 071 052
Impairment of property, plant and equipment 15 096 102 967
Amortisation of intangible assets 559 547 100 137
Depreciation on investment property 152 778 98 302
Impairment of investment property 560 012 594 111
Irrecoverable debts written off 1 189 930 738 549
Loss on property, plant and equipment due to theft 10 818 -
Loss on derecognition of property, plant and equipment 521 838 51 671
Provision for employee benefit obligations 528 060 4 886 530
Employee benefits paid from provision (1 394 483) (1 361 170)
(Decrease)/ increase in provisions (4 015 134) 2 495 243
(Decrease)/ increase in impairment of trade receivables (1 049 474) 28 716
Operating surplus before working capital changes 34 466 159 42 706 257
Changes in working capital (7 575 473) 16 417 821
(Increase)/ Decrease in trade and other receivables from non-exchange transactions (2 183 044) 1 791 282
Increase in trade and other receivables from exchange transactions (1 194 326) (3 472 792)
(Decrease)/ Increase in trade and other payables (4 198 103) 18 099 331
Cash flows from operating activities 26 890 686 59 124 078
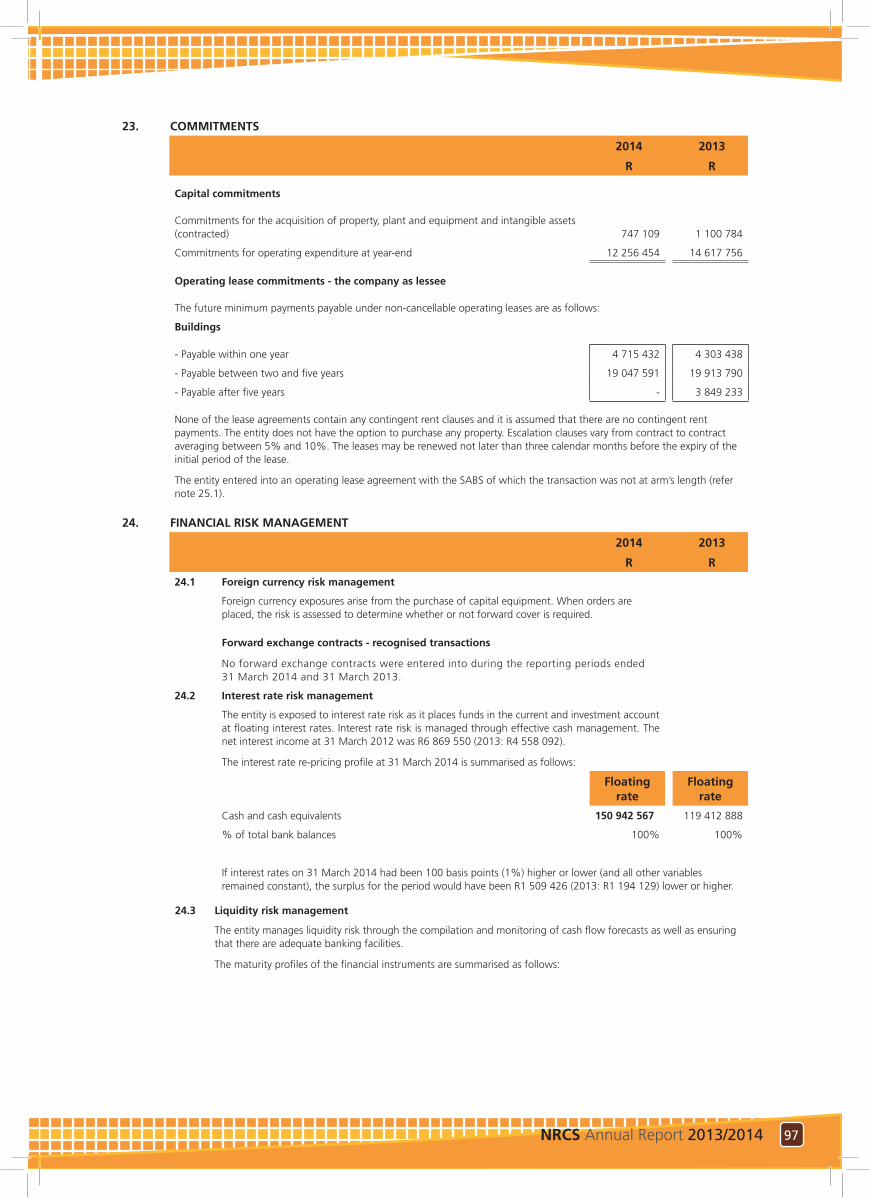
97NRCS Annual Report 2013/2014
23. COMMITMENTS
2014 2013
R R
Capital commitments
Commitments for the acquisition of property, plant and equipment and intangible assets (contracted) 747 109 1 100 784
Commitments for operating expenditure at year-end 12 256 454 14 617 756
Operating lease commitments - the company as lessee
The future minimum payments payable under non-cancellable operating leases are as follows:
Buildings
- Payable within one year 4 715 432 4 303 438
- Payable between two and five years 19 047 591 19 913 790
- Payable after five years - 3 849 233
None of the lease agreements contain any contingent rent clauses and it is assumed that there are no contingent rent payments. The entity does not have the option to purchase any property. Escalation clauses vary from contract to contract averaging between 5% and 10%. The leases may be renewed not later than three calendar months before the expiry of the initial period of the lease.
The entity entered into an operating lease agreement with the SABS of which the transaction was not at arm’s length (refer note 25.1).
24. FINANCIAL RISK MANAGEMENT
2014 2013
R R
24.1 Foreign currency risk management
Foreign currency exposures arise from the purchase of capital equipment. When orders are placed, the risk is assessed to determine whether or not forward cover is required.
Forward exchange contracts - recognised transactions
No forward exchange contracts were entered into during the reporting periods ended 31 March 2014 and 31 March 2013.
24.2 Interest rate risk management
The entity is exposed to interest rate risk as it places funds in the current and investment account at floating interest rates. Interest rate risk is managed through effective cash management. The net interest income at 31 March 2012 was R6 869 550 (2013: R4 558 092).
The interest rate re-pricing profile at 31 March 2014 is summarised as follows:
Floating rate
Floating rate
Cash and cash equivalents 150 942 567 119 412 888
% of total bank balances 100% 100%
If interest rates on 31 March 2014 had been 100 basis points (1%) higher or lower (and all other variables remained constant), the surplus for the period would have been R1 509 426 (2013: R1 194 129) lower or higher.
24.3 Liquidity risk management
The entity manages liquidity risk through the compilation and monitoring of cash flow forecasts as well as ensuring that there are adequate banking facilities.
The maturity profiles of the financial instruments are summarised as follows:
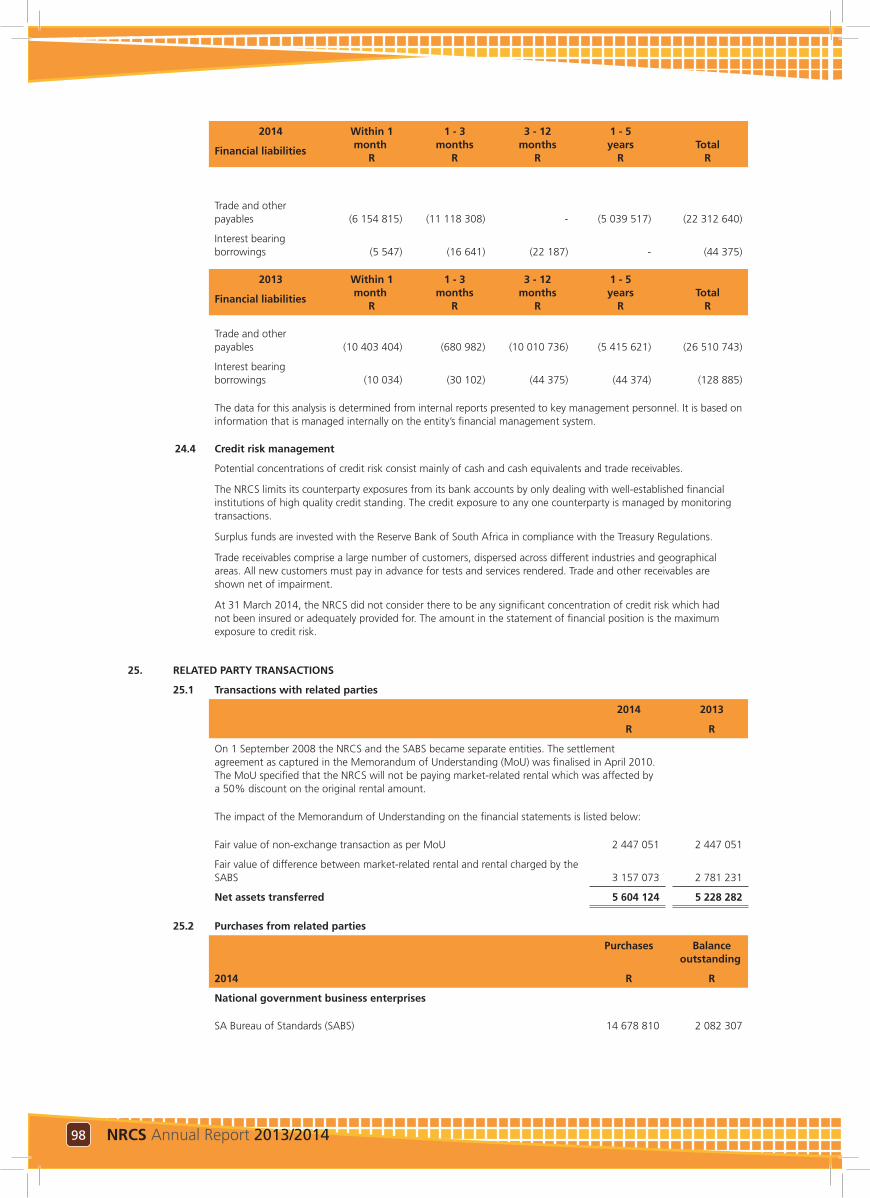
98 NRCS Annual Report 2013/2014
2014 Within 1 month
R
1 - 3 months
R
3 - 12 months
R
1 - 5 years
R Total
R Financial liabilities
Trade and other payables (6 154 815) (11 118 308) - (5 039 517) (22 312 640)
Interest bearing borrowings (5 547) (16 641) (22 187) - (44 375)
2013 Within 1 month
R
1 - 3 months
R
3 - 12 months
R
1 - 5 years
R Total
R Financial liabilities
Trade and other payables (10 403 404) (680 982) (10 010 736) (5 415 621) (26 510 743)
Interest bearing borrowings (10 034) (30 102) (44 375) (44 374) (128 885)
The data for this analysis is determined from internal reports presented to key management personnel. It is based on information that is managed internally on the entity’s financial management system.
24.4 Credit risk management
Potential concentrations of credit risk consist mainly of cash and cash equivalents and trade receivables.
The NRCS limits its counterparty exposures from its bank accounts by only dealing with well-established financial institutions of high quality credit standing. The credit exposure to any one counterparty is managed by monitoring transactions.
Surplus funds are invested with the Reserve Bank of South Africa in compliance with the Treasury Regulations.
Trade receivables comprise a large number of customers, dispersed across different industries and geographical areas. All new customers must pay in advance for tests and services rendered. Trade and other receivables are shown net of impairment.
At 31 March 2014, the NRCS did not consider there to be any significant concentration of credit risk which had not been insured or adequately provided for. The amount in the statement of financial position is the maximum exposure to credit risk.
25. RELATED PARTY TRANSACTIONS
25.1 Transactions with related parties
2014 2013
R R
On 1 September 2008 the NRCS and the SABS became separate entities. The settlement agreement as captured in the Memorandum of Understanding (MoU) was finalised in April 2010. The MoU specified that the NRCS will not be paying market-related rental which was affected by a 50% discount on the original rental amount.
The impact of the Memorandum of Understanding on the financial statements is listed below:
Fair value of non-exchange transaction as per MoU 2 447 051 2 447 051
Fair value of difference between market-related rental and rental charged by the SABS 3 157 073 2 781 231
Net assets transferred 5 604 124 5 228 282
25.2 Purchases from related parties
Purchases Balance outstanding
2014 R R
National government business enterprises
SA Bureau of Standards (SABS) 14 678 810 2 082 307
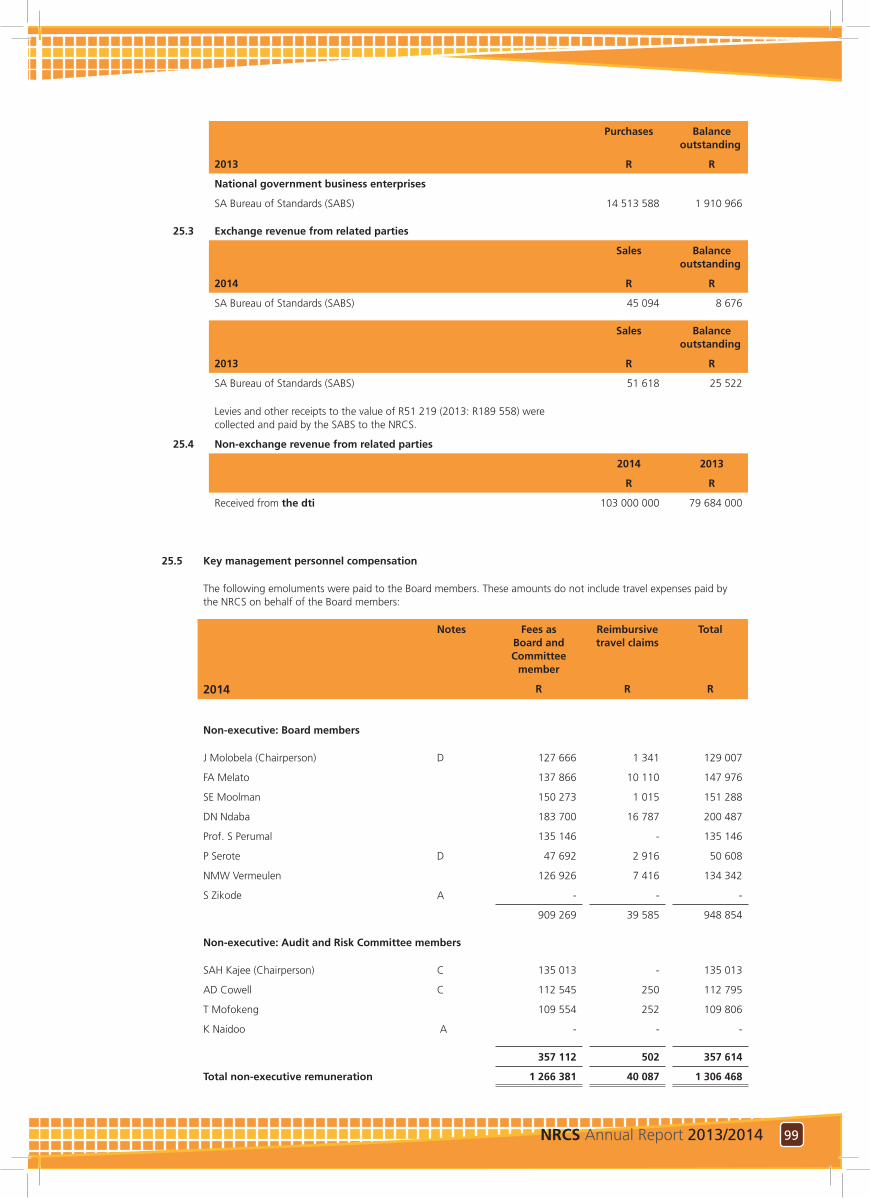
99NRCS Annual Report 2013/2014
Purchases Balance outstanding
2013 R R
National government business enterprises
SA Bureau of Standards (SABS) 14 513 588 1 910 966
25.3 Exchange revenue from related parties
Sales Balance outstanding
2014 R R
SA Bureau of Standards (SABS) 45 094 8 676
Sales Balance outstanding
2013 R R
SA Bureau of Standards (SABS) 51 618 25 522
Levies and other receipts to the value of R51 219 (2013: R189 558) were collected and paid by the SABS to the NRCS.
25.4 Non-exchange revenue from related parties
2014 2013
R R
Received from the dti 103 000 000 79 684 000
25.5 Key management personnel compensation
The following emoluments were paid to the Board members. These amounts do not include travel expenses paid by the NRCS on behalf of the Board members:
Notes Fees as Board and Committee
member
Reimbursive travel claims
Total
2014 R R R
Non-executive: Board members
J Molobela (Chairperson) D 127 666 1 341 129 007
FA Melato 137 866 10 110 147 976
SE Moolman 150 273 1 015 151 288
DN Ndaba 183 700 16 787 200 487
Prof. S Perumal 135 146 - 135 146
P Serote D 47 692 2 916 50 608
NMW Vermeulen 126 926 7 416 134 342
S Zikode A - - -
909 269 39 585 948 854
Non-executive: Audit and Risk Committee members
SAH Kajee (Chairperson) C 135 013 - 135 013
AD Cowell C 112 545 250 112 795
T Mofokeng 109 554 252 109 806
K Naidoo A - - -
357 112 502 357 614
Total non-executive remuneration 1 266 381 40 087 1 306 468
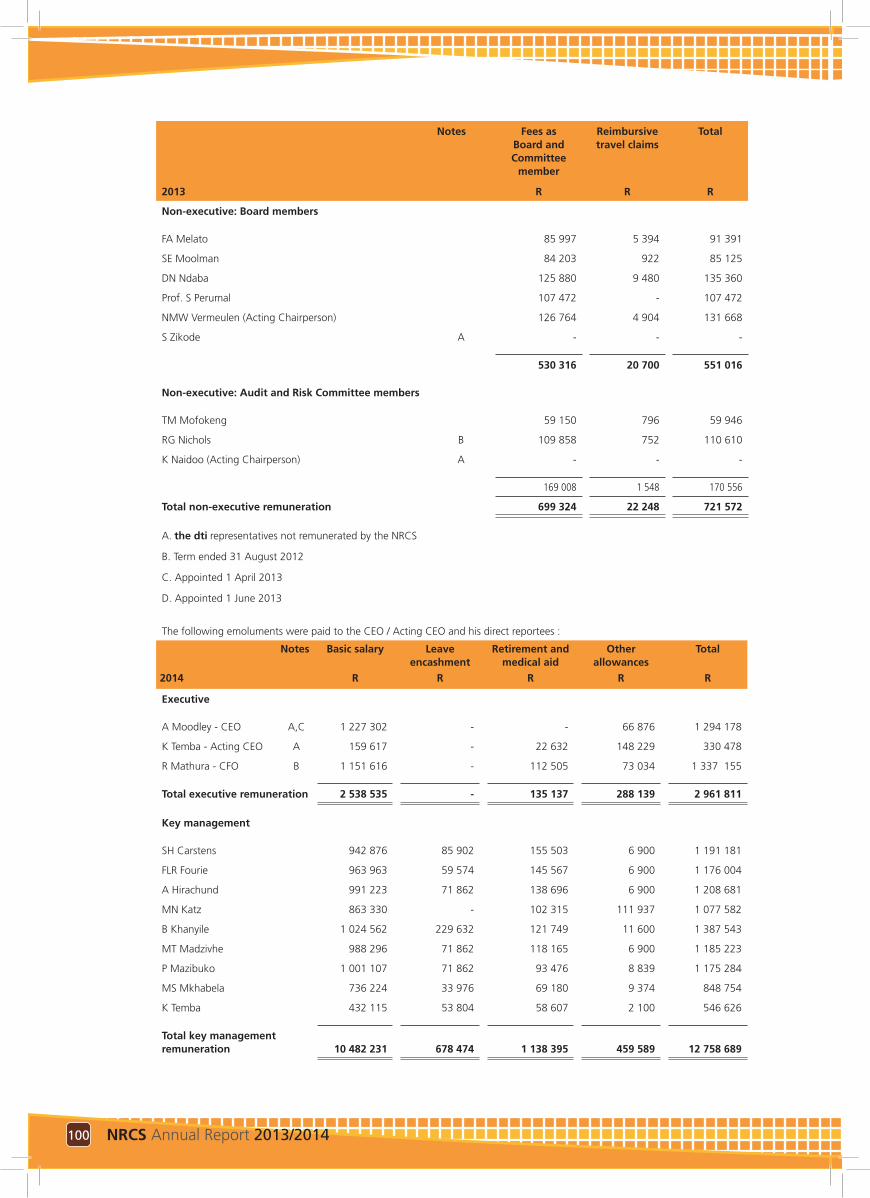
100 NRCS Annual Report 2013/2014
Notes Fees as Board and Committee
member
Reimbursive travel claims
Total
2013 R R R
Non-executive: Board members
FA Melato 85 997 5 394 91 391
SE Moolman 84 203 922 85 125
DN Ndaba 125 880 9 480 135 360
Prof. S Perumal 107 472 - 107 472
NMW Vermeulen (Acting Chairperson) 126 764 4 904 131 668
S Zikode A - - -
530 316 20 700 551 016
Non-executive: Audit and Risk Committee members
TM Mofokeng 59 150 796 59 946
RG Nichols B 109 858 752 110 610
K Naidoo (Acting Chairperson) A - - -
169 008 1 548 170 556
Total non-executive remuneration 699 324 22 248 721 572
A. the dti representatives not remunerated by the NRCS
B. Term ended 31 August 2012
C. Appointed 1 April 2013
D. Appointed 1 June 2013
The following emoluments were paid to the CEO / Acting CEO and his direct reportees :
Notes Basic salary Leave encashment
Retirement and medical aid
Other allowances
Total
2014 R R R R R
Executive
A Moodley - CEO A,C 1 227 302 - - 66 876 1 294 178
K Temba - Acting CEO A 159 617 - 22 632 148 229 330 478
R Mathura - CFO B 1 151 616 - 112 505 73 034 1 337 155
Total executive remuneration 2 538 535 - 135 137 288 139 2 961 811
Key management
SH Carstens 942 876 85 902 155 503 6 900 1 191 181
FLR Fourie 963 963 59 574 145 567 6 900 1 176 004
A Hirachund 991 223 71 862 138 696 6 900 1 208 681
MN Katz 863 330 - 102 315 111 937 1 077 582
B Khanyile 1 024 562 229 632 121 749 11 600 1 387 543
MT Madzivhe 988 296 71 862 118 165 6 900 1 185 223
P Mazibuko 1 001 107 71 862 93 476 8 839 1 175 284
MS Mkhabela 736 224 33 976 69 180 9 374 848 754
K Temba 432 115 53 804 58 607 2 100 546 626
Total key management remuneration 10 482 231 678 474 1 138 395 459 589 12 758 689
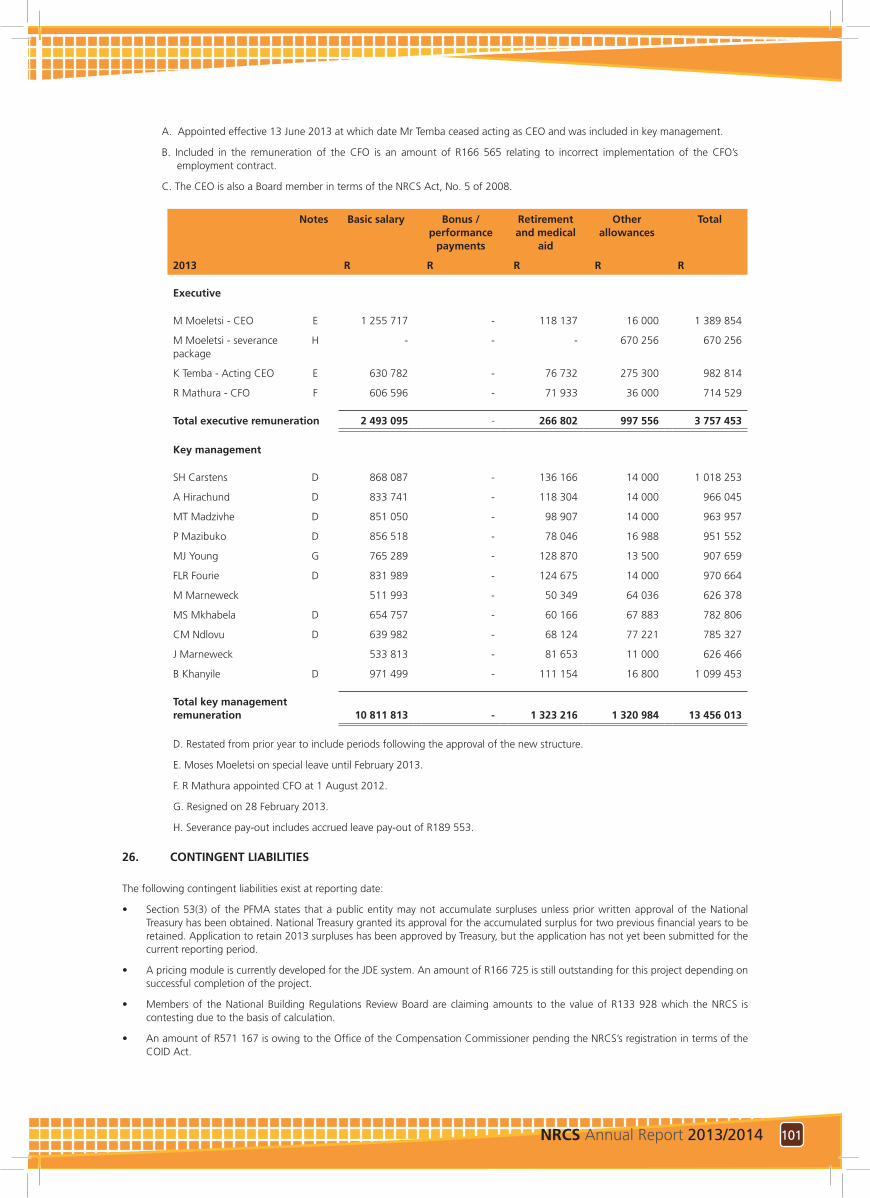
101NRCS Annual Report 2013/2014
A. Appointed effective 13 June 2013 at which date Mr Temba ceased acting as CEO and was included in key management.
B. Included in the remuneration of the CFO is an amount of R166 565 relating to incorrect implementation of the CFO’s employment contract.
C. The CEO is also a Board member in terms of the NRCS Act, No. 5 of 2008.
Notes Basic salary Bonus / performance
payments
Retirement and medical
aid
Other allowances
Total
2013 R R R R R
Executive
M Moeletsi - CEO E 1 255 717 - 118 137 16 000 1 389 854
M Moeletsi - severance package
H - - - 670 256 670 256
K Temba - Acting CEO E 630 782 - 76 732 275 300 982 814
R Mathura - CFO F 606 596 - 71 933 36 000 714 529
Total executive remuneration 2 493 095 - 266 802 997 556 3 757 453
Key management
SH Carstens D 868 087 - 136 166 14 000 1 018 253
A Hirachund D 833 741 - 118 304 14 000 966 045
MT Madzivhe D 851 050 - 98 907 14 000 963 957
P Mazibuko D 856 518 - 78 046 16 988 951 552
MJ Young G 765 289 - 128 870 13 500 907 659
FLR Fourie D 831 989 - 124 675 14 000 970 664
M Marneweck 511 993 - 50 349 64 036 626 378
MS Mkhabela D 654 757 - 60 166 67 883 782 806
CM Ndlovu D 639 982 - 68 124 77 221 785 327
J Marneweck 533 813 - 81 653 11 000 626 466
B Khanyile D 971 499 - 111 154 16 800 1 099 453
Total key management remuneration 10 811 813 - 1 323 216 1 320 984 13 456 013
D. Restated from prior year to include periods following the approval of the new structure.
E. Moses Moeletsi on special leave until February 2013.
F. R Mathura appointed CFO at 1 August 2012.
G. Resigned on 28 February 2013.
H. Severance pay-out includes accrued leave pay-out of R189 553.
26. CONTINGENT LIABILITIES
The following contingent liabilities exist at reporting date:
• Section 53(3) of the PFMA states that a public entity may not accumulate surpluses unless prior written approval of the National Treasury has been obtained. National Treasury granted its approval for the accumulated surplus for two previous financial years to be retained. Application to retain 2013 surpluses has been approved by Treasury, but the application has not yet been submitted for the current reporting period.
• A pricing module is currently developed for the JDE system. An amount of R166 725 is still outstanding for this project depending on successful completion of the project.
• Members of the National Building Regulations Review Board are claiming amounts to the value of R133 928 which the NRCS is contesting due to the basis of calculation.
• An amount of R571 167 is owing to the Office of the Compensation Commissioner pending the NRCS’s registration in terms of the COID Act.
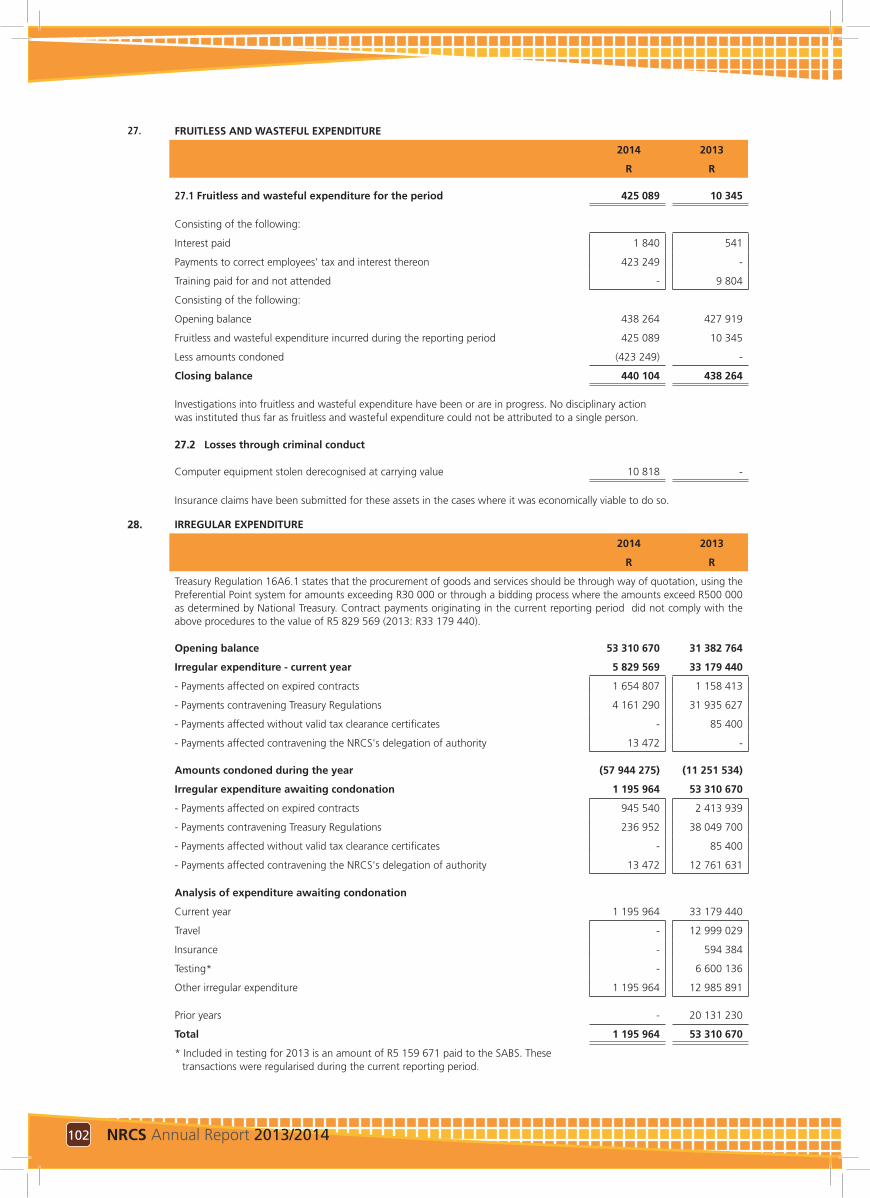
102 NRCS Annual Report 2013/2014
27. FRUITLESS AND WASTEFUL EXPENDITURE
2014 2013
R R
27.1 Fruitless and wasteful expenditure for the period 425 089 10 345
Consisting of the following:
Interest paid 1 840 541
Payments to correct employees’ tax and interest thereon 423 249 -
Training paid for and not attended - 9 804
Consisting of the following:
Opening balance 438 264 427 919
Fruitless and wasteful expenditure incurred during the reporting period 425 089 10 345
Less amounts condoned (423 249) -
Closing balance 440 104 438 264
Investigations into fruitless and wasteful expenditure have been or are in progress. No disciplinary action was instituted thus far as fruitless and wasteful expenditure could not be attributed to a single person.
27.2 Losses through criminal conduct
Computer equipment stolen derecognised at carrying value 10 818 -
Insurance claims have been submitted for these assets in the cases where it was economically viable to do so.
28. IRREGULAR EXPENDITURE
2014 2013
R R
Treasury Regulation 16A6.1 states that the procurement of goods and services should be through way of quotation, using the Preferential Point system for amounts exceeding R30 000 or through a bidding process where the amounts exceed R500 000 as determined by National Treasury. Contract payments originating in the current reporting period did not comply with the above procedures to the value of R5 829 569 (2013: R33 179 440).
Opening balance 53 310 670 31 382 764
Irregular expenditure - current year 5 829 569 33 179 440
- Payments affected on expired contracts 1 654 807 1 158 413
- Payments contravening Treasury Regulations 4 161 290 31 935 627
- Payments affected without valid tax clearance certificates - 85 400
- Payments affected contravening the NRCS's delegation of authority 13 472 -
Amounts condoned during the year (57 944 275) (11 251 534)
Irregular expenditure awaiting condonation 1 195 964 53 310 670
- Payments affected on expired contracts 945 540 2 413 939
- Payments contravening Treasury Regulations 236 952 38 049 700
- Payments affected without valid tax clearance certificates - 85 400
- Payments affected contravening the NRCS's delegation of authority 13 472 12 761 631
Analysis of expenditure awaiting condonation
Current year 1 195 964 33 179 440
Travel - 12 999 029
Insurance - 594 384
Testing* - 6 600 136
Other irregular expenditure 1 195 964 12 985 891
Prior years - 20 131 230
Total 1 195 964 53 310 670
* Included in testing for 2013 is an amount of R5 159 671 paid to the SABS. These transactions were regularised during the current reporting period.
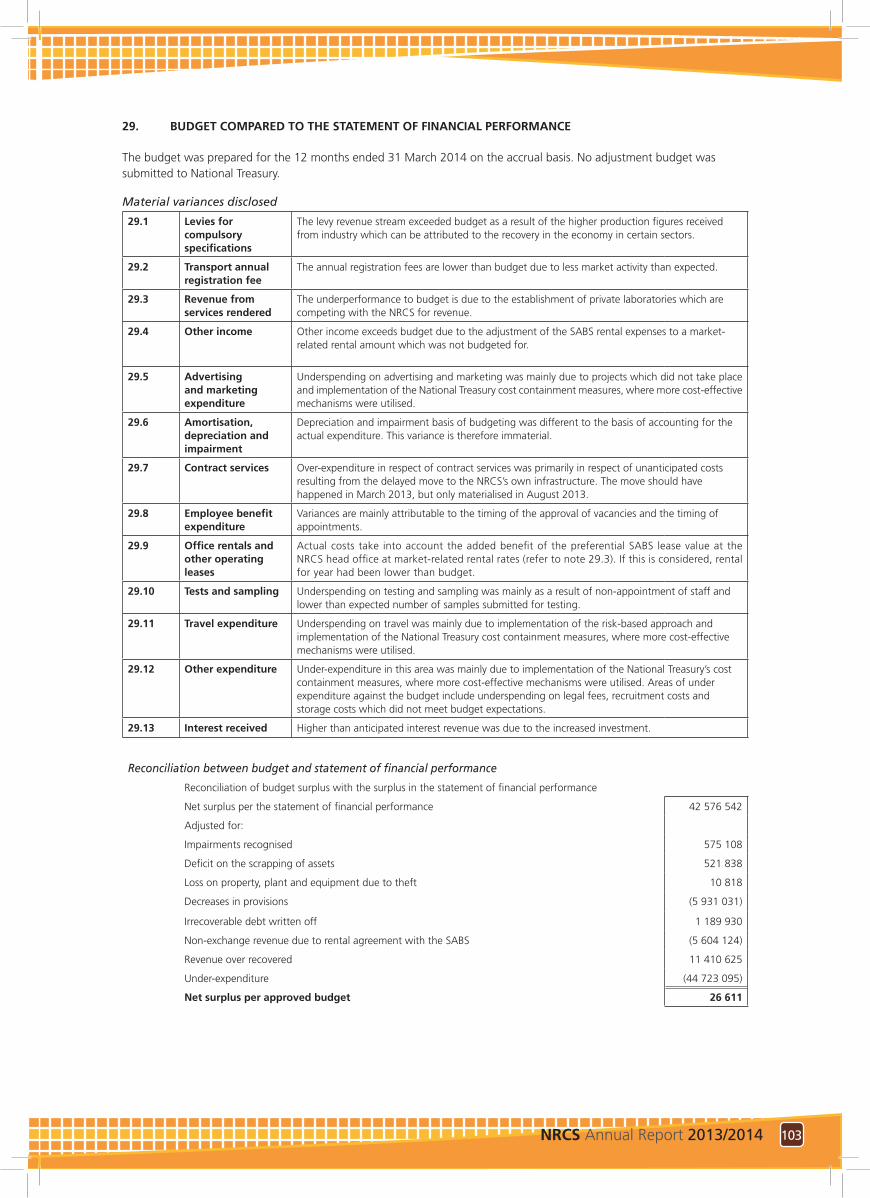
103NRCS Annual Report 2013/2014
29. BUDGET COMPARED TO THE STATEMENT OF FINANCIAL PERFORMANCE
The budget was prepared for the 12 months ended 31 March 2014 on the accrual basis. No adjustment budget was submitted to National Treasury.
Material variances disclosed
29.1 Levies for compulsory specifications
The levy revenue stream exceeded budget as a result of the higher production figures received from industry which can be attributed to the recovery in the economy in certain sectors.
29.2 Transport annual registration fee
The annual registration fees are lower than budget due to less market activity than expected.
29.3 Revenue from services rendered
The underperformance to budget is due to the establishment of private laboratories which are competing with the NRCS for revenue.
29.4 Other income Other income exceeds budget due to the adjustment of the SABS rental expenses to a market-related rental amount which was not budgeted for.
29.5 Advertising and marketing expenditure
Underspending on advertising and marketing was mainly due to projects which did not take place and implementation of the National Treasury cost containment measures, where more cost-effective mechanisms were utilised.
29.6 Amortisation, depreciation and impairment
Depreciation and impairment basis of budgeting was different to the basis of accounting for the actual expenditure. This variance is therefore immaterial.
29.7 Contract services Over-expenditure in respect of contract services was primarily in respect of unanticipated costs resulting from the delayed move to the NRCS’s own infrastructure. The move should have happened in March 2013, but only materialised in August 2013.
29.8 Employee benefit expenditure
Variances are mainly attributable to the timing of the approval of vacancies and the timing of appointments.
29.9 Office rentals and other operating leases
Actual costs take into account the added benefit of the preferential SABS lease value at the NRCS head office at market-related rental rates (refer to note 29.3). If this is considered, rental for year had been lower than budget.
29.10 Tests and sampling Underspending on testing and sampling was mainly as a result of non-appointment of staff and lower than expected number of samples submitted for testing.
29.11 Travel expenditure Underspending on travel was mainly due to implementation of the risk-based approach and implementation of the National Treasury cost containment measures, where more cost-effective mechanisms were utilised.
29.12 Other expenditure Under-expenditure in this area was mainly due to implementation of the National Treasury’s cost containment measures, where more cost-effective mechanisms were utilised. Areas of under expenditure against the budget include underspending on legal fees, recruitment costs and storage costs which did not meet budget expectations.
29.13 Interest received Higher than anticipated interest revenue was due to the increased investment.
Reconciliation between budget and statement of financial performance
Reconciliation of budget surplus with the surplus in the statement of financial performance
Net surplus per the statement of financial performance 42 576 542
Adjusted for:
Impairments recognised 575 108
Deficit on the scrapping of assets 521 838
Loss on property, plant and equipment due to theft 10 818
Decreases in provisions (5 931 031)
Irrecoverable debt written off 1 189 930
Non-exchange revenue due to rental agreement with the SABS (5 604 124)
Revenue over recovered 11 410 625
Under-expenditure (44 723 095)
Net surplus per approved budget 26 611
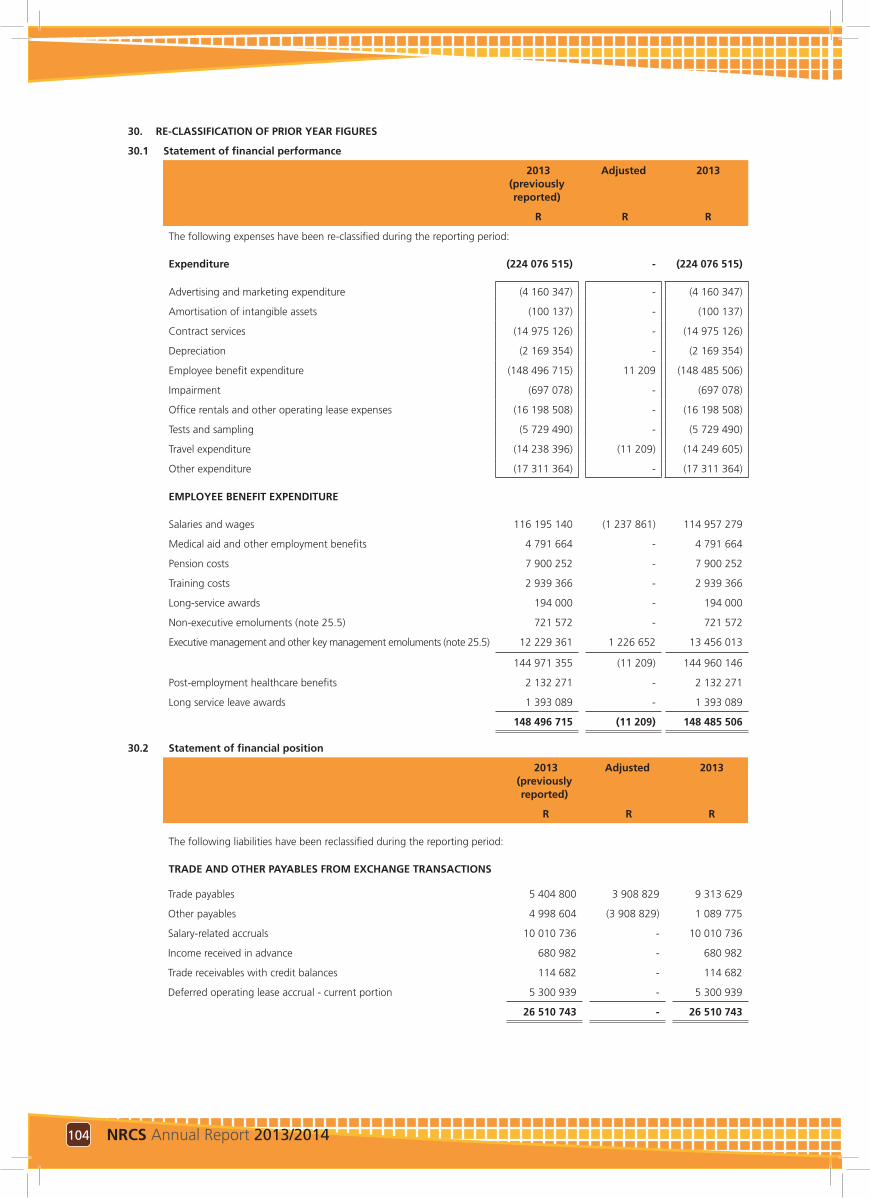
104 NRCS Annual Report 2013/2014
30. RE-CLASSIFICATION OF PRIOR YEAR FIGURES
30.1 Statement of financial performance
2013 (previously reported)
Adjusted 2013
R R R
The following expenses have been re-classified during the reporting period:
Expenditure (224 076 515) - (224 076 515)
Advertising and marketing expenditure (4 160 347) - (4 160 347)
Amortisation of intangible assets (100 137) - (100 137)
Contract services (14 975 126) - (14 975 126)
Depreciation (2 169 354) - (2 169 354)
Employee benefit expenditure (148 496 715) 11 209 (148 485 506)
Impairment (697 078) - (697 078)
Office rentals and other operating lease expenses (16 198 508) - (16 198 508)
Tests and sampling (5 729 490) - (5 729 490)
Travel expenditure (14 238 396) (11 209) (14 249 605)
Other expenditure (17 311 364) - (17 311 364)
EMPLOYEE BENEFIT EXPENDITURE
Salaries and wages 116 195 140 (1 237 861) 114 957 279
Medical aid and other employment benefits 4 791 664 - 4 791 664
Pension costs 7 900 252 - 7 900 252
Training costs 2 939 366 - 2 939 366
Long-service awards 194 000 - 194 000
Non-executive emoluments (note 25.5) 721 572 - 721 572
Executive management and other key management emoluments (note 25.5) 12 229 361 1 226 652 13 456 013
144 971 355 (11 209) 144 960 146
Post-employment healthcare benefits 2 132 271 - 2 132 271
Long service leave awards 1 393 089 - 1 393 089
148 496 715 (11 209) 148 485 506
30.2 Statement of financial position
2013 (previously reported)
Adjusted 2013
R R R
The following liabilities have been reclassified during the reporting period:
TRADE AND OTHER PAYABLES FROM EXCHANGE TRANSACTIONS
Trade payables 5 404 800 3 908 829 9 313 629
Other payables 4 998 604 (3 908 829) 1 089 775
Salary-related accruals 10 010 736 - 10 010 736
Income received in advance 680 982 - 680 982
Trade receivables with credit balances 114 682 - 114 682
Deferred operating lease accrual - current portion 5 300 939 - 5 300 939
26 510 743 - 26 510 743
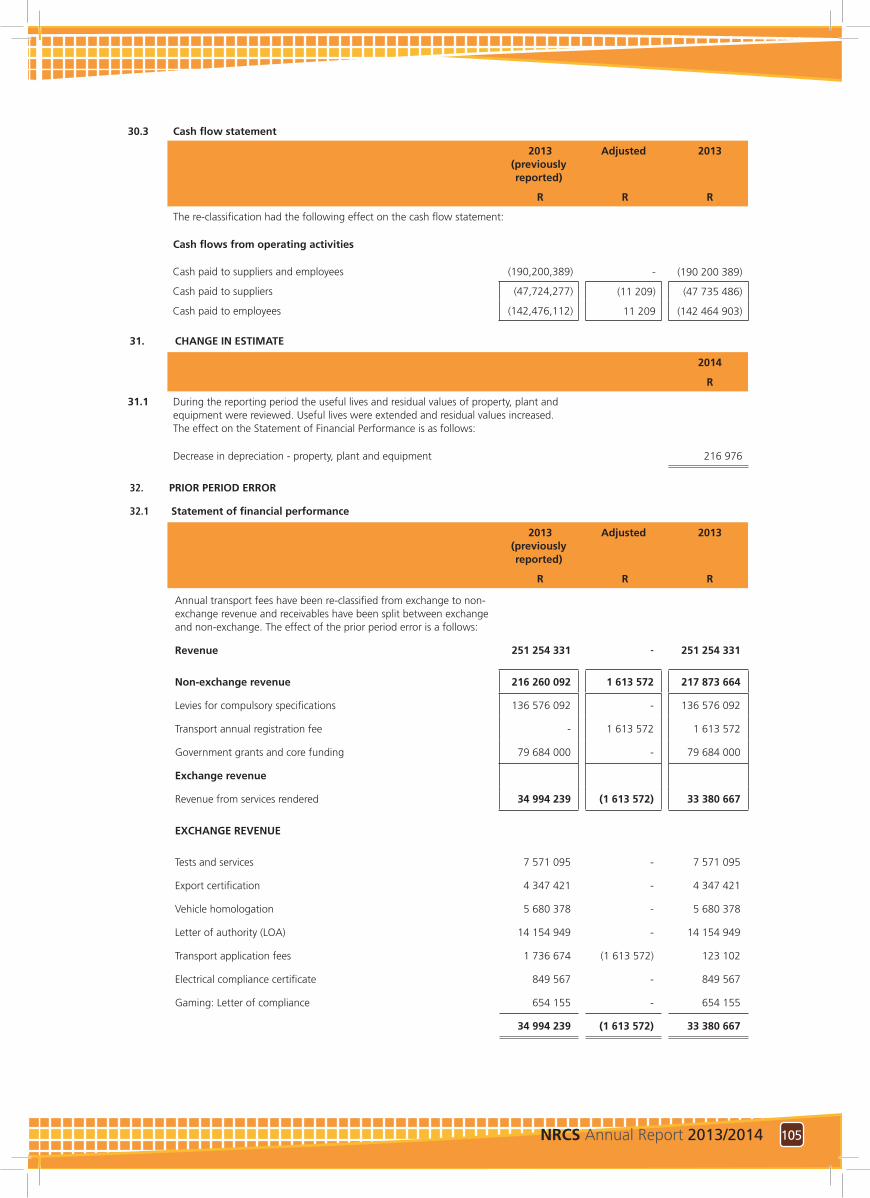
105NRCS Annual Report 2013/2014
30.3 Cash flow statement
2013 (previously reported)
Adjusted 2013
R R R
The re-classification had the following effect on the cash flow statement:
Cash flows from operating activities
Cash paid to suppliers and employees (190,200,389) - (190 200 389)
Cash paid to suppliers (47,724,277) (11 209) (47 735 486)
Cash paid to employees (142,476,112) 11 209 (142 464 903)
31. CHANGE IN ESTIMATE
2014
R
31.1 During the reporting period the useful lives and residual values of property, plant and equipment were reviewed. Useful lives were extended and residual values increased. The effect on the Statement of Financial Performance is as follows:
Decrease in depreciation - property, plant and equipment 216 976
32. PRIOR PERIOD ERROR
32.1 Statement of financial performance
2013 (previously reported)
Adjusted 2013
R R R
Annual transport fees have been re-classified from exchange to non-exchange revenue and receivables have been split between exchange and non-exchange. The effect of the prior period error is a follows:
Revenue 251 254 331 - 251 254 331
Non-exchange revenue 216 260 092 1 613 572 217 873 664
Levies for compulsory specifications 136 576 092 - 136 576 092
Transport annual registration fee - 1 613 572 1 613 572
Government grants and core funding 79 684 000 - 79 684 000
Exchange revenue
Revenue from services rendered 34 994 239 (1 613 572) 33 380 667
EXCHANGE REVENUE
Tests and services 7 571 095 - 7 571 095
Export certification 4 347 421 - 4 347 421
Vehicle homologation 5 680 378 - 5 680 378
Letter of authority (LOA) 14 154 949 - 14 154 949
Transport application fees 1 736 674 (1 613 572) 123 102
Electrical compliance certificate 849 567 - 849 567
Gaming: Letter of compliance 654 155 - 654 155
34 994 239 (1 613 572) 33 380 667
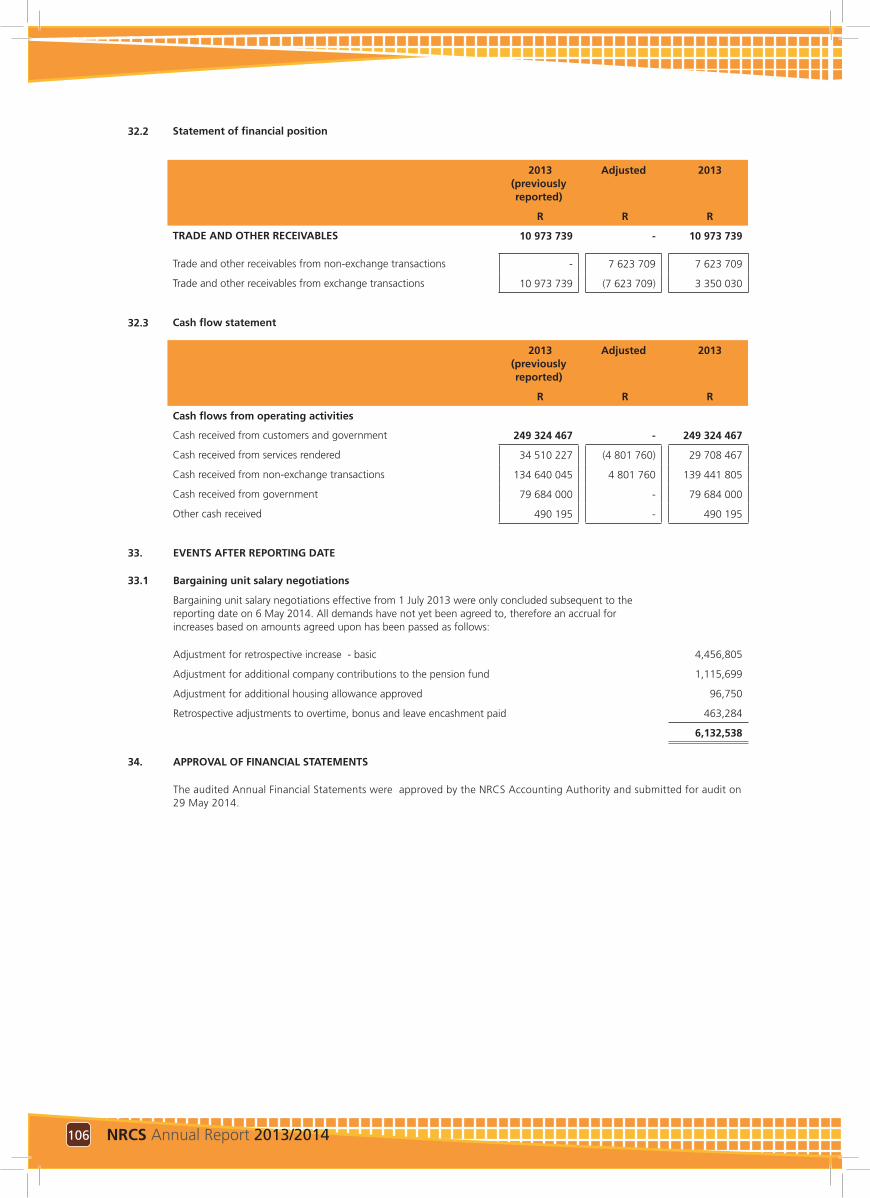
106 NRCS Annual Report 2013/2014
32.2 Statement of financial position
2013 (previously reported)
Adjusted 2013
R R R
TRADE AND OTHER RECEIVABLES 10 973 739 - 10 973 739
Trade and other receivables from non-exchange transactions - 7 623 709 7 623 709
Trade and other receivables from exchange transactions 10 973 739 (7 623 709) 3 350 030
32.3 Cash flow statement
2013 (previously reported)
Adjusted 2013
R R R
Cash flows from operating activities
Cash received from customers and government 249 324 467 - 249 324 467
Cash received from services rendered 34 510 227 (4 801 760) 29 708 467
Cash received from non-exchange transactions 134 640 045 4 801 760 139 441 805
Cash received from government 79 684 000 - 79 684 000
Other cash received 490 195 - 490 195
33. EVENTS AFTER REPORTING DATE
33.1 Bargaining unit salary negotiations
Bargaining unit salary negotiations effective from 1 July 2013 were only concluded subsequent to the reporting date on 6 May 2014. All demands have not yet been agreed to, therefore an accrual for increases based on amounts agreed upon has been passed as follows:
Adjustment for retrospective increase - basic 4,456,805
Adjustment for additional company contributions to the pension fund 1,115,699
Adjustment for additional housing allowance approved 96,750
Retrospective adjustments to overtime, bonus and leave encashment paid 463,284
6,132,538
34. APPROVAL OF FINANCIAL STATEMENTS
The audited Annual Financial Statements were approved by the NRCS Accounting Authority and submitted for audit on 29 May 2014.
107NRCS Annual Report 2013/2014
Notes
108 NRCS Annual Report 2013/2014
Notes