Royal College of Physicians FLS DB patient audit: … · Royal College of Physicians FLS DB patient...
83
Royal College of Physicians FLS DB patient audit: Breaking new ground M Kassim Javaid – FLS DB Clinical Lead Academic Rheumatologist University of Oxford
Transcript of Royal College of Physicians FLS DB patient audit: … · Royal College of Physicians FLS DB patient...

Royal College of Physicians FLS DB patient audit: Breaking new ground
M Kassim Javaid – FLS DB Clinical Lead
Academic Rheumatologist
University of Oxford

Mission: Support NHS service improvement to close the secondary fracture gap
Challenge: Change conversation
Fracture focus > Heal my fracture
Fracture focus > This could happen againPrevent the next fracture
For1. Trauma surgeons2. Patients3. Payers

40 % unable to walk independently
60% needing help with dressing or bathing
80% unable to drive, shopping for food
Cooper AJM 1997
After a hip fracture….

Real world data: effect of Alendronate prescriptions
Hawley 2016 JBMR
10,873 primary hip fracture patients April 1999 and Sept 2012
(12 - 24 months)

Real world data: effect of Alendronate prescriptions
Hawley 2016 JBMR
33% reduction in Hip fractures
van der Velde Bone 2016
UK Incident Use of Alendronate
osteoporosis crisis

ONJ lawsuit
Atr Fib AIM
Television AFF and BP
Jha JBMR 2015; Jarvenin BMJ 2015


• What is the risk of having another fracture
⬇︎20% to 55% AFF & ONJ

Effective osteoporosis care: Population approach
Effective anti-osteoporosis
management for 5 years
Healthy
Low risk
High risk
No Fracture
Previous fracture
Recent fracture
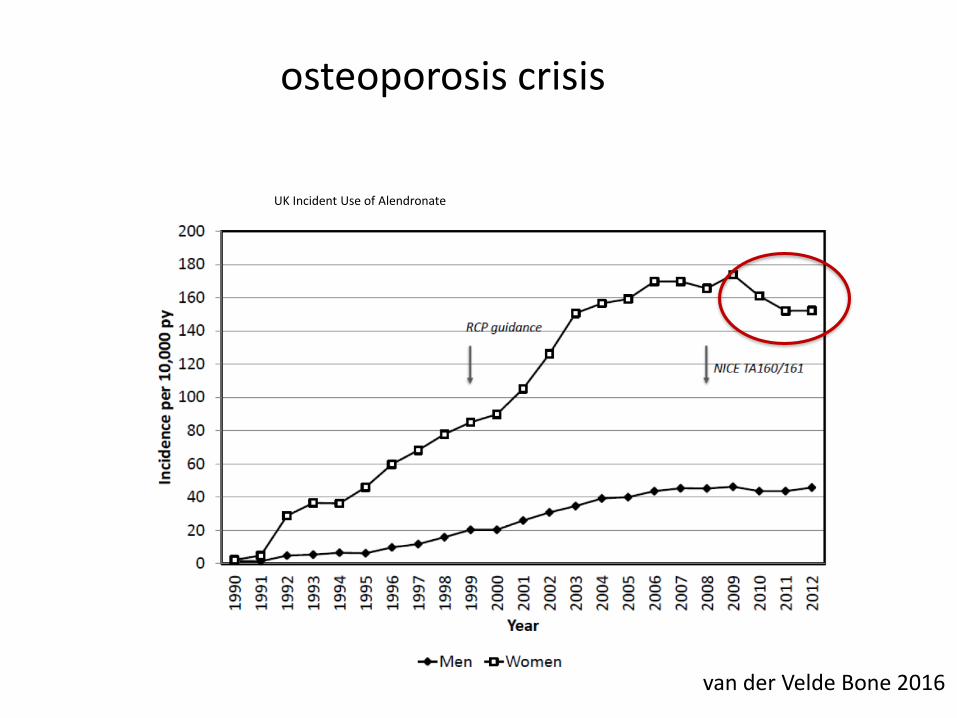
Effective osteoporosis care: targeted sub group
Effective anti-osteoporosis
management for 5 years
High risk
Recent fracture
FLS

80%reduction
Isn’t effectiveness obvious?

Andrew Judge
M Kassim Javaid, Cyrus Cooper, Nigel Arden, Dani Prieto-Alhambra, Andrew Farmer, Janet Lippett, Rachael Gooberman-Hill, Jose Leal, Jasroop Chana,
Alastair Gray, Michael Goldacre, Laura Graham, Sam Hawley, Sally Sheard, Sarah Drew
Regional Evaluation of Fracture Reduction Services after hip Fracture
(REFRESH)

Hospital coding: Primary hip fractures at 11 hospitals
What was the effect of FLS on re-fracture rates?
Hospital 2003 2004 2005 2006 2007 2008 2009 2010 2011 2012 Total
1 255 252 298 304 341 367 344 321 347 286 3,115
2 413 380 376 374 431 375 403 386 422 384 3,944
3 178 185 183 90 199 241 205 217 179 181 1,858
4 133 165 248 330 300 341 335 327 327 313 2,819
5 198 172 165 158 171 183 189 190 209 202 1,837
6 62 69 80 94 109 22 125 105 131 233 1,030
7 583 580 543 583 662 550 584 601 622 587 5,895
8 488 473 487 472 527 529 504 464 510 483 4,937
9 189 201 194 204 158 209 211 210 202 216 1,994
10 400 412 427 435 412 400 416 404 476 436 4,218
11 142 152 135 134 173 151 160 176 154 129 1,506
Total 3,041 3,041 3,136 3,178 3,483 3,368 3,476 3,401 3,579 3,450 33,153
Hawley Age & Aging 2016

Example: hospital 8
Mortality (1-year)
Mortality (30-day)
Hawley Age & Aging 2016

Findings: second fracture within 2-years before and after FLS implementation
Hawley Age & Aging 2016

Not every FLS is automatically effective

How big should your FLS be?
FLS, Fracture Liaison Service.

Big enough to be effective…
How can I tell if my FLS is effective?

Quality and data
Benchmarking
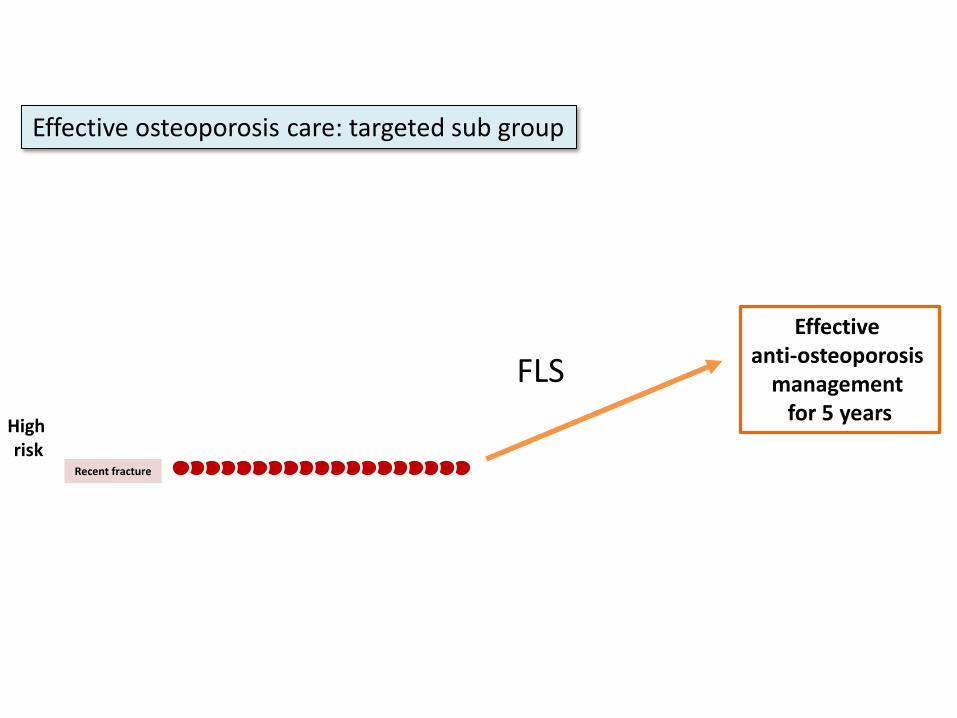
Aim:
Set the standard for FLS1.
Guidance2.
Benchmarking and fine3. -tuning
5 domains, 13 standards
Hip fracture patients-
Inpatient-
Outpatient-
Vertebral fracture patient-
Organization- President: C Cooper
Co-Chair Capture the fracture: K AkessonMK Javaid

199 FLSs
Gold 48Silver 43Bronze 24
Under development 11
Under review 73:63 awaiting response10 awaiting grading


FLS does perform FLS should perform

1. What proportions of fragility fracture patients are assessed for (i) osteoporosis and (ii) falls risk?
2. What proportion of patients is initiated on bone protection therapy within 4 months of fracture?
3. What proportion of patients is initiated on falls prevention intervention within 4 months of fracture?
4. What proportion of patients still persist with (i) bone protection and (ii) fall prevention treatment at 12 months
5. What proportion of patients have a subsequent fracture

FLS-DB workstream
Clinical Lead: Dr M Kassim JavaidRCP : Catherine Gallagher, Sunil Rai, Naomi Vasilakis, Chris Boulton, Roz Stanley, Finbarr Martin
Constituency RCGP -Jonathan Bailey, David StephensBGS – Frances Dockery, Rachael BradleyOrthogeriatrics Celia Gregson BOA – Xavier GriffinBES - Neil GittoesBSR - Gavin ClunieNOS - Sonya Stephenson, Will Carr, Helen Williams, Tim Jones, Jo SayerRCN - Debbie Janaway, Clare CockillPPI – Iona PriceRCS - David Cromwell, Carmen TsangCrowne - Jonathan RobertsWales – Mike Stone

Target patient population
aged • 50yrs +
with a fragility fracture •diagnosed in the NHS between 1 January and 30 June 2016
NICE TA• 161 2.6 definition states ‘Fragility fracture: fracture occurring as the result of a force equivalent to the force of a fall from a height equal to, or less than, the height of an ordinary chair.’

Facilities audit: overview
• Funding
• Structure (people)
• Scope (case mix, identification, investigation, initiation, monitoring pathways)
AIM: Ensure the structure of FLS fit for purposeObjective: To describe the structure of an FLS in terms of: constitution and patient processMethod: Annual facilities audit

Reported number of patients identified by FLS vs estimated fragility fracture caseload
Most FLSs did not see as many patients as expected: 24% (10/42) of FLSs
identified at least 80% of the estimated fragility fracture caseload at their site
57% (24/42) of FLSs
identified less than 50% of
the estimated fragility
fracture caseload at their
site
FLSDB RCP report 2015

Patient audit: overview
Identification•
Investigation•
Initiation•
Monitoring for prescribing•
Re• -fracture/ re-falls
AIM: Ensure the FLS works for its patients Objective: To describe the pathway of patients Method: Annual patient audit upload vs. direct data entry
Audit design
• Section 1 - Patient identification
• Section 2 - Investigation of bone health
• Section 3 - DXA
• Section 4 - Treatment initiation
• Section 5 - Falls risk assessment and outcome
• Section 6 - Follow-up 12-16 weeks post index fracture

Participation
52 • FLSs participated in the facilities audit.
38 • (73%) FLSs submitted data on 18,356 patients.
Check table • 2 to see if your site was included and if not then check table Appendix E table 19 page 67
FLSDB clinical report 2017

Identification: by fracture type
0
200
400
600
800
1,000
1,200
0
20
40
60
80
100
Site missing
Non-hip/non-vertebral fractures recorded
Vertebral fractures recorded
Hip fractures recorded
Total number of fractures
%N for 6 months
FLSDB clinical report 2017
Should the FLSDB should not include hip fracture patients?17/38 FLSs were able to submit their hip fracture patients No relationship with service size

Time to assessment within 90 days: by patient number
No relationship between time to assessment
and volume of patients seen
FLSDB clinical report 2017

NICE TA 161 2006
Post code lottery for interpretation of NICE TA 161
Results Confirmed with FLS

FLSDB clinical report 2017
Marked variation for for when risk is high enough to treat with
bone drug
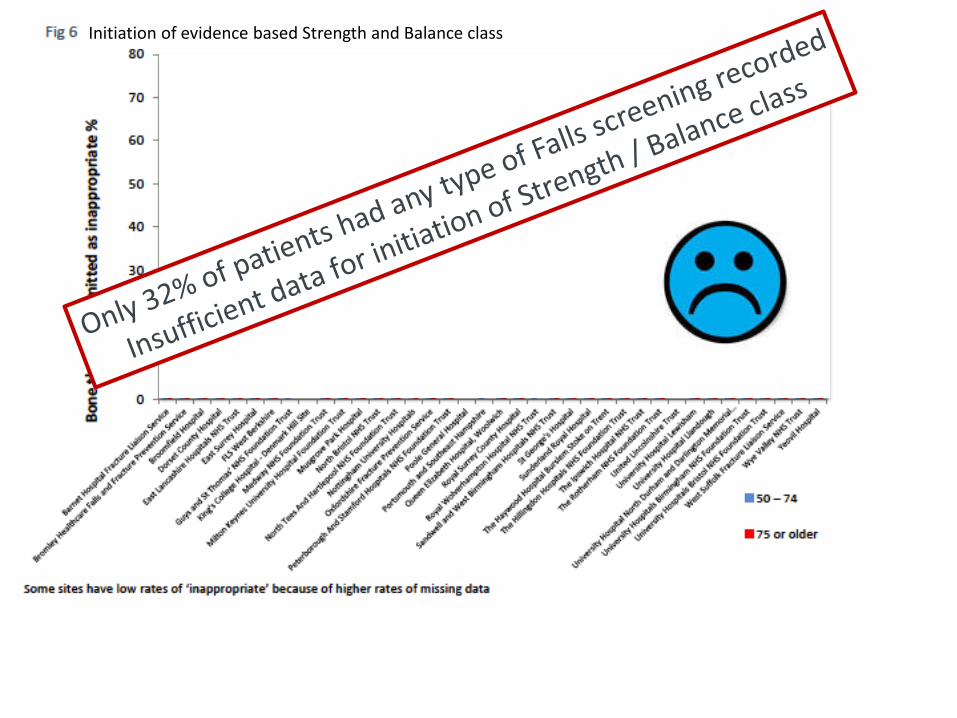
Initiation of evidence based Strength and Balance class
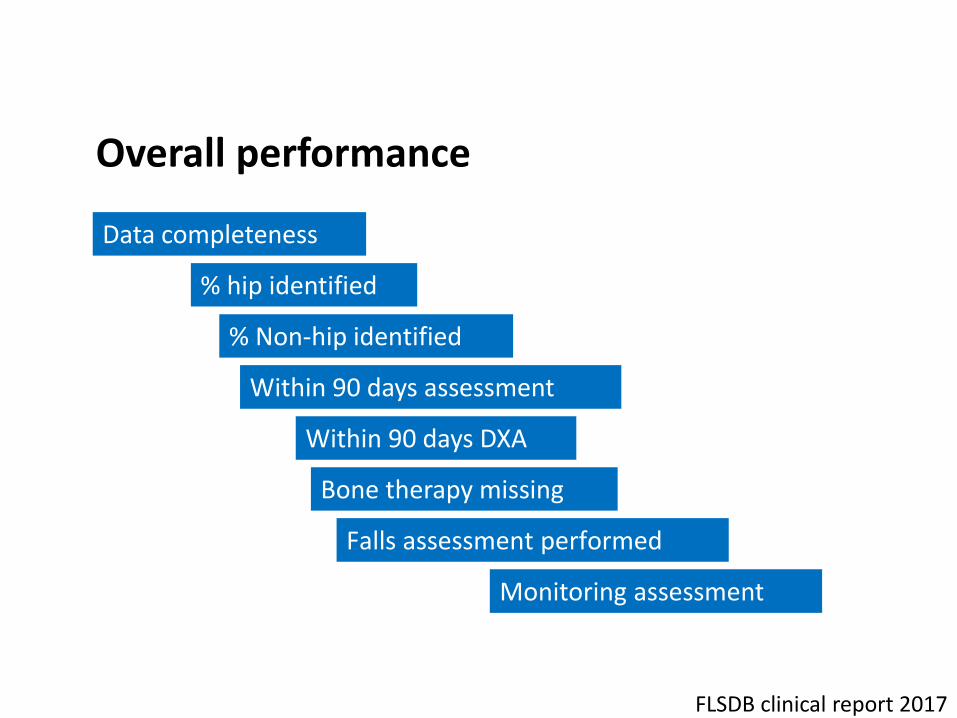
Overall performance
Data completeness
% hip identified
% Non-hip identified
Within 90 days assessment
Within 90 days DXA
Bone therapy missing
Falls assessment performed
Monitoring assessment
FLSDB clinical report 2017

FLS name
Nu
mb
er
of
case
s su
bm
itte
d
Nu
mb
er
of
fie
lds
(ou
t o
f 29
) w
ith
20%
or
gre
ate
r m
issi
ng
dat
a –
n
Hip
cas
e a
sce
rtai
nm
en
t –%
No
n-h
ip c
ase
asc
ert
ain
me
nt
–%
Wit
hin
90
day
s (d
iagn
osi
s to
ass
ess
me
nt)
–
%
Wit
hin
90
day
s (d
iagn
osi
s to
DX
A)
–%
Bo
ne
ther
apy
mis
sin
g –
%
Falls
ass
ess
me
nt
do
ne
or
refe
rre
d –
%
Pat
ien
ts fo
llow
ed
up
(of
tho
se p
resc
rib
ed
b
on
e t
he
rap
y o
r re
ferr
ed
fo
r fu
rth
er
clin
ical
op
inio
n/G
P) –
%
Barnet Hospital Fracture Liaison Service 156 3 * 17.8 93.6 77.1 20.5 91.7 83.3
Bromley Healthcare Falls and Fracture Prevention Service 283 2 6.9 38.7 100 92.4 31.1 100 78.2
Broomfield Hospital 382 9 27.5 30.9 93.7 15.9 5 1.6 0
Dorset County Hospital 536 20 81.3 59.8 90.9 63 36.2 0.9 0
East Lancashire Hospitals NHS Trust 273 3 * 26.3 96 72.5 33.3 8.4 62.5
East Surrey Hospital 233 2 * 22.6 5.2 6.1 * 99.6 0
FLS West Berkshire 358 3 5.1 43.8 96.6 81.2 * 18.2 63.1
Guys and St Thomas’ NHS Foundation Trust 284 21 15.0 62.4 4.9 * 98.7 9.5 0
King’s College Hospital – Denmark Hill site 79 7 * 24.3 98.7 * 100 2.5 0
Medway NHS Foundation Trust 436 12 59.0 53.2 0 * 70.9 0.9 2.2
Milton Keynes University Hospital Foundation Trust 134 12 6.0 22.2 95.5 34.1 44 47 60
Musgrove Park Hospital 811 0 106.5 74.8 77.2 80.5 3.3 65.8 73.7
North Bristol NHS Trust 1,111 9 94.3 81.5 74.9 57.9 2.3 55.1 49.3
North Tees and Hartlepool NHS Foundation Trust 553 9 52.9 53.4 99.8 53.3 14.5 53.9 0
Nottingham University Hospitals 1,250 11 77.2 63.6 99.4 0 82.2 33 0
Oxfordshire Fracture Prevention Service 1,210 7 54.7 70.7 73.8 53.7 0.8 24.9 26.9
Peterborough and Stamford Hospitals NHS Foundation Trust 260 2 5.6 28.5 92.3 67.8 100 95.8 0
Poole General Hospital 69 15 * 3.5 0 0 95.8 40.6 0
Portsmouth and Southeast Hampshire 936 16 11.9 57.0 91.1 72.5 1.6 0.2 0
Queen Elizabeth Hospital, Woolwich 109 7 7.1 13.8 * 0 0 1.8 5.3
Royal Surrey County Hospital 251 1 7.9 38.7 92.8 74.3 13.9 93.2 59.6
Royal Wolverhampton Hospital NHS Trust 285 16 7.8 26.9 96.1 * 60.7 1.1 0
Sandwell and West Birmingham Hospitals NHS Trust 86 11 2.6 1.2 51.2 18.5 69.8 90.7 0
St George’s Hospital 725 15 127.0 131.3 43.7 68.7 51.6 46.9 15.7
Sunderland Royal Hospital 584 2 63.6 49.2 99.1 56.6 90.5 67 30.2
The Haywood Hospital Burslem Stoke-on-Trent 644 0 15.8 38.8 84 83.6 15.1 2.6 45.5
The Hillingdon Hospitals NHS Foundation Trust 110 0 5.0 24.8 90.9 70.8 0 5.5 50
The Ipswich Hospital NHS Trust 944 14 87.2 80.7 35.2 25.9 10.9 52.1 19.3
The Rotherham NHS Foundation Trust 109 8 * 20.6 86.2 86.1 31.8 16.5 0
United Lincolnshire Trust 1,218 13 56.1 63.0 0 86.8 0 0 0
University Hospital Lewisham 191 11 43.2 52.0 74.3 74.5 27.7 31.9 36
University Hospital Llandough 344 10 2.4 32.2 86.6 * 18.9 3.5 13.2
University Hospital of North Durham and Darlington Memorial Hospital
835 14 47.4 46.4 76.2 43.1 22.2 2.2 48.1
University Hospitals Birmingham NHS Foundation Trust 643 4 45.4 58.3 72.3 21.3 20.3 57.4 68.1
University Hospitals Bristol NHS Foundation Trust 679 12 100.6 81.1 20 63.9 0.3 0.6 38.9
West Suffolk Fracture Liaison Service 219 3 29.4 22.4 63.5 74.7 6.4 57.1 76.3
Wye Valley NHS Trust 231 4 * 33.9 98.3 0 0.9 97 0.8
Yeovil Hospital 795 6 97.5 98.3 46.2 * 12.6 30.8 71.8
Overall (Average) 18,356 – 35.6 45.5 66.9 46.5 33.2 32.3 36.4
> 80%> Good
> 50 - 79%> OK
< 50 %> Bad
FLSDB clinical report 2017
I have an FLS commissionedIt is working well

FLS name
Nu
mb
er
of
case
s su
bm
itte
d
Nu
mb
er
of
fie
lds
(ou
t o
f 29
) w
ith
20%
or
gre
ate
r m
issi
ng
dat
a –
n
Hip
cas
e a
sce
rtai
nm
en
t –%
No
n-h
ip c
ase
asce
rtai
nm
ent
–%
Wit
hin
90
day
s (d
iagn
osi
s to
ass
ess
me
nt)
–
%
Wit
hin
90
day
s (d
iagn
osi
s to
DX
A)
–%
Bo
ne
th
era
py
mis
sin
g –
%
Falls
ass
ess
me
nt
do
ne
or
refe
rre
d –
%
Pat
ien
ts fo
llow
ed
up
(of
tho
se p
resc
rib
ed
b
on
e t
he
rap
y o
r re
ferr
ed
fo
r fu
rth
er
clin
ical
op
inio
n/G
P) –
%
Barnet Hospital Fracture Liaison Service 156 3 * 17.8 93.6 77.1 20.5 91.7 83.3
Bromley Healthcare Falls and Fracture Prevention Service 283 2 6.9 38.7 100 92.4 31.1 100 78.2
Broomfield Hospital 382 9 27.5 30.9 93.7 15.9 5 1.6 0
Dorset County Hospital 536 20 81.3 59.8 90.9 63 36.2 0.9 0
East Lancashire Hospitals NHS Trust 273 3 * 26.3 96 72.5 33.3 8.4 62.5
East Surrey Hospital 233 2 * 22.6 5.2 6.1 * 99.6 0
FLS West Berkshire 358 3 5.1 43.8 96.6 81.2 * 18.2 63.1
Guys and St Thomas’ NHS Foundation Trust 284 21 15.0 62.4 4.9 * 98.7 9.5 0
King’s College Hospital – Denmark Hill site 79 7 * 24.3 98.7 * 100 2.5 0
Medway NHS Foundation Trust 436 12 59.0 53.2 0 * 70.9 0.9 2.2
Milton Keynes University Hospital Foundation Trust 134 12 6.0 22.2 95.5 34.1 44 47 60
Musgrove Park Hospital 811 0 106.5 74.8 77.2 80.5 3.3 65.8 73.7
North Bristol NHS Trust 1,111 9 94.3 81.5 74.9 57.9 2.3 55.1 49.3
North Tees and Hartlepool NHS Foundation Trust 553 9 52.9 53.4 99.8 53.3 14.5 53.9 0
Nottingham University Hospitals 1,250 11 77.2 63.6 99.4 0 82.2 33 0
Oxfordshire Fracture Prevention Service 1,210 7 54.7 70.7 73.8 53.7 0.8 24.9 26.9
Peterborough and Stamford Hospitals NHS Foundation Trust 260 2 5.6 28.5 92.3 67.8 100 95.8 0
Poole General Hospital 69 15 * 3.5 0 0 95.8 40.6 0
Portsmouth and Southeast Hampshire 936 16 11.9 57.0 91.1 72.5 1.6 0.2 0
Queen Elizabeth Hospital, Woolwich 109 7 7.1 13.8 * 0 0 1.8 5.3
Royal Surrey County Hospital 251 1 7.9 38.7 92.8 74.3 13.9 93.2 59.6
Royal Wolverhampton Hospital NHS Trust 285 16 7.8 26.9 96.1 * 60.7 1.1 0
Sandwell and West Birmingham Hospitals NHS Trust 86 11 2.6 1.2 51.2 18.5 69.8 90.7 0
St George’s Hospital 725 15 127.0 131.3 43.7 68.7 51.6 46.9 15.7
Sunderland Royal Hospital 584 2 63.6 49.2 99.1 56.6 90.5 67 30.2
The Haywood Hospital Burslem Stoke-on-Trent 644 0 15.8 38.8 84 83.6 15.1 2.6 45.5
The Hillingdon Hospitals NHS Foundation Trust 110 0 5.0 24.8 90.9 70.8 0 5.5 50
The Ipswich Hospital NHS Trust 944 14 87.2 80.7 35.2 25.9 10.9 52.1 19.3
The Rotherham NHS Foundation Trust 109 8 * 20.6 86.2 86.1 31.8 16.5 0
United Lincolnshire Trust 1,218 13 56.1 63.0 0 86.8 0 0 0
University Hospital Lewisham 191 11 43.2 52.0 74.3 74.5 27.7 31.9 36
University Hospital Llandough 344 10 2.4 32.2 86.6 * 18.9 3.5 13.2
University Hospital of North Durham and Darlington Memorial Hospital
835 14 47.4 46.4 76.2 43.1 22.2 2.2 48.1
University Hospitals Birmingham NHS Foundation Trust 643 4 45.4 58.3 72.3 21.3 20.3 57.4 68.1
University Hospitals Bristol NHS Foundation Trust 679 12 100.6 81.1 20 63.9 0.3 0.6 38.9
West Suffolk Fracture Liaison Service 219 3 29.4 22.4 63.5 74.7 6.4 57.1 76.3
Wye Valley NHS Trust 231 4 * 33.9 98.3 0 0.9 97 0.8
Yeovil Hospital 795 6 97.5 98.3 46.2 * 12.6 30.8 71.8
Overall (Average) 18,356 – 35.6 45.5 66.9 46.5 33.2 32.3 36.4
> 80%> Good
> 50 - 79%> OK
< 50 %> Bad
FLSDB clinical report 2017

FLS name
Nu
mb
er o
f ca
ses
sub
mit
ted
Nu
mb
er o
f fi
eld
s (o
ut
of
29)
wit
h 2
0% o
r gr
eate
r m
issi
ng
dat
a –
n
Hip
ca
se a
sce
rtai
nm
ent
–%
No
n-h
ip c
ase
asc
ert
ain
men
t –
%
Wit
hin
90
day
s (d
iagn
osi
s to
ass
ess
men
t) –
%
Wit
hin
90
day
s (d
iagn
osi
s to
DX
A)
–%
Bo
ne
ther
apy
mis
sin
g –
%
Falls
ass
ess
men
t d
on
e o
r re
ferr
ed –
%
Pat
ien
ts f
ollo
wed
up
(o
f th
ose
pre
scri
bed
b
on
e th
erap
y o
r re
ferr
ed f
or
furt
her
clin
ica
l o
pin
ion
/GP
) –
%
Barnet Hospital Fracture Liaison Service 156 3 * 17.8 93.6 77.1 20.5 91.7 83.3
Bromley Healthcare Falls and Fracture Prevention Service 283 2 6.9 38.7 100 92.4 31.1 100 78.2
Broomfield Hospital 382 9 27.5 30.9 93.7 15.9 5 1.6 0
Dorset County Hospital 536 20 81.3 59.8 90.9 63 36.2 0.9 0
East Lancashire Hospitals NHS Trust 273 3 * 26.3 96 72.5 33.3 8.4 62.5
East Surrey Hospital 233 2 * 22.6 5.2 6.1 * 99.6 0
FLS West Berkshire 358 3 5.1 43.8 96.6 81.2 * 18.2 63.1
Guys and St Thomas’ NHS Foundation Trust 284 21 15.0 62.4 4.9 * 98.7 9.5 0
King’s College Hospital – Denmark Hill site 79 7 * 24.3 98.7 * 100 2.5 0
Medway NHS Foundation Trust 436 12 59.0 53.2 0 * 70.9 0.9 2.2
Milton Keynes University Hospital Foundation Trust 134 12 6.0 22.2 95.5 34.1 44 47 60
Musgrove Park Hospital 811 0 106.5 74.8 77.2 80.5 3.3 65.8 73.7
North Bristol NHS Trust 1,111 9 94.3 81.5 74.9 57.9 2.3 55.1 49.3
North Tees and Hartlepool NHS Foundation Trust 553 9 52.9 53.4 99.8 53.3 14.5 53.9 0
Nottingham University Hospitals 1,250 11 77.2 63.6 99.4 0 82.2 33 0
Oxfordshire Fracture Prevention Service 1,210 7 54.7 70.7 73.8 53.7 0.8 24.9 26.9
Peterborough and Stamford Hospitals NHS Foundation Trust 260 2 5.6 28.5 92.3 67.8 100 95.8 0
Poole General Hospital 69 15 * 3.5 0 0 95.8 40.6 0
Portsmouth and Southeast Hampshire 936 16 11.9 57.0 91.1 72.5 1.6 0.2 0
Queen Elizabeth Hospital, Woolwich 109 7 7.1 13.8 * 0 0 1.8 5.3
Royal Surrey County Hospital 251 1 7.9 38.7 92.8 74.3 13.9 93.2 59.6
Royal Wolverhampton Hospital NHS Trust 285 16 7.8 26.9 96.1 * 60.7 1.1 0
Sandwell and West Birmingham Hospitals NHS Trust 86 11 2.6 1.2 51.2 18.5 69.8 90.7 0
St George’s Hospital 725 15 127.0 131.3 43.7 68.7 51.6 46.9 15.7
Sunderland Royal Hospital 584 2 63.6 49.2 99.1 56.6 90.5 67 30.2
The Haywood Hospital Burslem Stoke-on-Trent 644 0 15.8 38.8 84 83.6 15.1 2.6 45.5
The Hillingdon Hospitals NHS Foundation Trust 110 0 5.0 24.8 90.9 70.8 0 5.5 50
The Ipswich Hospital NHS Trust 944 14 87.2 80.7 35.2 25.9 10.9 52.1 19.3
The Rotherham NHS Foundation Trust 109 8 * 20.6 86.2 86.1 31.8 16.5 0
United Lincolnshire Trust 1,218 13 56.1 63.0 0 86.8 0 0 0
University Hospital Lewisham 191 11 43.2 52.0 74.3 74.5 27.7 31.9 36
University Hospital Llandough 344 10 2.4 32.2 86.6 * 18.9 3.5 13.2
University Hospital of North Durham and Darlington Memorial Hospital
835 14 47.4 46.4 76.2 43.1 22.2 2.2 48.1
University Hospitals Birmingham NHS Foundation Trust 643 4 45.4 58.3 72.3 21.3 20.3 57.4 68.1
University Hospitals Bristol NHS Foundation Trust 679 12 100.6 81.1 20 63.9 0.3 0.6 38.9
West Suffolk Fracture Liaison Service 219 3 29.4 22.4 63.5 74.7 6.4 57.1 76.3
Wye Valley NHS Trust 231 4 * 33.9 98.3 0 0.9 97 0.8
Yeovil Hospital 795 6 97.5 98.3 46.2 * 12.6 30.8 71.8
Overall (Average) 18,356 – 35.6 45.5 66.9 46.5 33.2 32.3 36.4
IF we can deliver an effective FLS> Potential patient impact over 5 years
If all patients in England received a comparable service to the highesttreating FLS:
21,848 fractures would be prevented - including 9157 hip fractures.
Saving £151 million from just hip fractures
FLSDB clinical report 2017

FLS name
Nu
mb
er o
f ca
ses
sub
mit
ted
Nu
mb
er o
f fi
eld
s (o
ut
of
29)
wit
h 2
0% o
r gr
eate
r m
issi
ng
dat
a –
n
Hip
ca
se a
sce
rtai
nm
ent
–%
No
n-h
ip c
ase
asc
ert
ain
men
t –
%
Wit
hin
90
day
s (d
iagn
osi
s to
ass
ess
men
t) –
%
Wit
hin
90
day
s (d
iagn
osi
s to
DX
A)
–%
Bo
ne
ther
apy
mis
sin
g –
%
Falls
ass
ess
men
t d
on
e o
r re
ferr
ed –
%
Pat
ien
ts f
ollo
wed
up
(o
f th
ose
pre
scri
bed
b
on
e th
erap
y o
r re
ferr
ed f
or
furt
her
clin
ica
l o
pin
ion
/GP
) –
%
Barnet Hospital Fracture Liaison Service 156 3 * 17.8 93.6 77.1 20.5 91.7 83.3
Bromley Healthcare Falls and Fracture Prevention Service 283 2 6.9 38.7 100 92.4 31.1 100 78.2
Broomfield Hospital 382 9 27.5 30.9 93.7 15.9 5 1.6 0
Dorset County Hospital 536 20 81.3 59.8 90.9 63 36.2 0.9 0
East Lancashire Hospitals NHS Trust 273 3 * 26.3 96 72.5 33.3 8.4 62.5
East Surrey Hospital 233 2 * 22.6 5.2 6.1 * 99.6 0
FLS West Berkshire 358 3 5.1 43.8 96.6 81.2 * 18.2 63.1
Guys and St Thomas’ NHS Foundation Trust 284 21 15.0 62.4 4.9 * 98.7 9.5 0
King’s College Hospital – Denmark Hill site 79 7 * 24.3 98.7 * 100 2.5 0
Medway NHS Foundation Trust 436 12 59.0 53.2 0 * 70.9 0.9 2.2
Milton Keynes University Hospital Foundation Trust 134 12 6.0 22.2 95.5 34.1 44 47 60
Musgrove Park Hospital 811 0 106.5 74.8 77.2 80.5 3.3 65.8 73.7
North Bristol NHS Trust 1,111 9 94.3 81.5 74.9 57.9 2.3 55.1 49.3
North Tees and Hartlepool NHS Foundation Trust 553 9 52.9 53.4 99.8 53.3 14.5 53.9 0
Nottingham University Hospitals 1,250 11 77.2 63.6 99.4 0 82.2 33 0
Oxfordshire Fracture Prevention Service 1,210 7 54.7 70.7 73.8 53.7 0.8 24.9 26.9
Peterborough and Stamford Hospitals NHS Foundation Trust 260 2 5.6 28.5 92.3 67.8 100 95.8 0
Poole General Hospital 69 15 * 3.5 0 0 95.8 40.6 0
Portsmouth and Southeast Hampshire 936 16 11.9 57.0 91.1 72.5 1.6 0.2 0
Queen Elizabeth Hospital, Woolwich 109 7 7.1 13.8 * 0 0 1.8 5.3
Royal Surrey County Hospital 251 1 7.9 38.7 92.8 74.3 13.9 93.2 59.6
Royal Wolverhampton Hospital NHS Trust 285 16 7.8 26.9 96.1 * 60.7 1.1 0
Sandwell and West Birmingham Hospitals NHS Trust 86 11 2.6 1.2 51.2 18.5 69.8 90.7 0
St George’s Hospital 725 15 127.0 131.3 43.7 68.7 51.6 46.9 15.7
Sunderland Royal Hospital 584 2 63.6 49.2 99.1 56.6 90.5 67 30.2
The Haywood Hospital Burslem Stoke-on-Trent 644 0 15.8 38.8 84 83.6 15.1 2.6 45.5
The Hillingdon Hospitals NHS Foundation Trust 110 0 5.0 24.8 90.9 70.8 0 5.5 50
The Ipswich Hospital NHS Trust 944 14 87.2 80.7 35.2 25.9 10.9 52.1 19.3
The Rotherham NHS Foundation Trust 109 8 * 20.6 86.2 86.1 31.8 16.5 0
United Lincolnshire Trust 1,218 13 56.1 63.0 0 86.8 0 0 0
University Hospital Lewisham 191 11 43.2 52.0 74.3 74.5 27.7 31.9 36
University Hospital Llandough 344 10 2.4 32.2 86.6 * 18.9 3.5 13.2
University Hospital of North Durham and Darlington Memorial Hospital
835 14 47.4 46.4 76.2 43.1 22.2 2.2 48.1
University Hospitals Birmingham NHS Foundation Trust 643 4 45.4 58.3 72.3 21.3 20.3 57.4 68.1
University Hospitals Bristol NHS Foundation Trust 679 12 100.6 81.1 20 63.9 0.3 0.6 38.9
West Suffolk Fracture Liaison Service 219 3 29.4 22.4 63.5 74.7 6.4 57.1 76.3
Wye Valley NHS Trust 231 4 * 33.9 98.3 0 0.9 97 0.8
Yeovil Hospital 795 6 97.5 98.3 46.2 * 12.6 30.8 71.8
Overall (Average) 18,356 – 35.6 45.5 66.9 46.5 33.2 32.3 36.4
Marked variation in FLS across all quality indicators
Highlights need for ongoingaudit to improve quality of FLSs
IF the aim of an FLS is to close the care gap
Get funded to meet the FLS DB audit standards
FLSDB clinical report 2017

DedicatedFracture Liaison Service
(FLS)
Identify at risk patients
Systematic investigation and risk assessment
Appropriate Treatment initiation
Lower re-fracture
Fewer Care Home admissions
Fewer Secondarycare admissions
Healthcare savings
Primary care
Ongoing treatment and fracture monitoring

Multiple sites
TraumaJohn Radcliffe HospitalHorton HospitalCommunity Treatment Centres
Bone Density Measuring Machine (DXA) Nuffield Orthopaedic Centre(+ Horton)
ClinicsWitney, Abingdon, Bicester, NOC, Horton

5 years Oxford IMPACT
• Population of 620,000
Hip Other
inpatient Outpatient Vertebral Total
Annual cases 720 695 2,414 555 4384 Proportion
seen by FLS 95% 95% 85% 10%
Number of fractures
prevented after 5 years of FLS
288 152 152 97 629
Hospital savings at 5
years £2.928,960 £172,064 £52,960 £314,862 £3,469,846
+ primary care/ social care/ community
costs
£4,737,024 £210,064 £53,960 £336,784 £5,337,832
UK National Osteoporosis Society Economics Benefit Calculator 2014

Projected volume and savings using NOS FLS calculator
Measure Oxford
Annual Projected Fragility case load (5 * 716) 3580
Annual Actual fragility case load (estimated from 6 months) 2,420
5 years number of prevented All fractures 629
5 years number of prevented hip fractures 288
5 years acute healthcare saving £3.47 million
5 years combined social, community and healthcare saving £5.34 million
Current annual FLS cost £269,000
Optimal annual FLS cost ?

Data quality (Table 2)
National (average) Oxford
Number of cases submitted 18356 1210
Number of fields with >20% missing data
8.3 7
Number of fields with >50% missing data
4 5

Identification: by fracture type
0
200
400
600
800
1,000
1,200
0
10
20
30
40
50
60
70
80
90
100
Hip fractures recordedVertebral fractures recordedNon-hip/non-vertebral fractures recorded
%N

Identification (Table 5)
FLSs should compare the number of submitted fracture cases and their expected number in time for the next audit report.
Percentage of estimated fragility fracture patients submitted
National results
Oxford
Hip 35.4% 54.7
Non-Hip 45.5% 70.7
Spine TBA
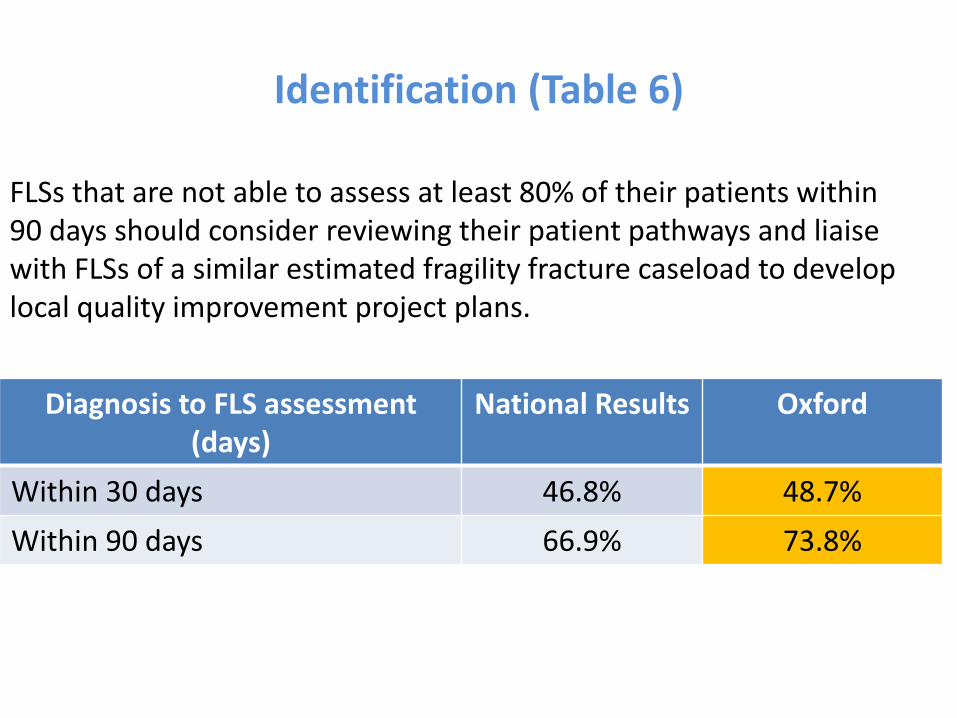
Identification (Table 6)
FLSs that are not able to assess at least 80% of their patients within 90 days should consider reviewing their patient pathways and liaise with FLSs of a similar estimated fragility fracture caseload to develop local quality improvement project plans.
Diagnosis to FLS assessment (days)
National Results Oxford
Within 30 days 46.8% 48.7%
Within 90 days 66.9% 73.8%
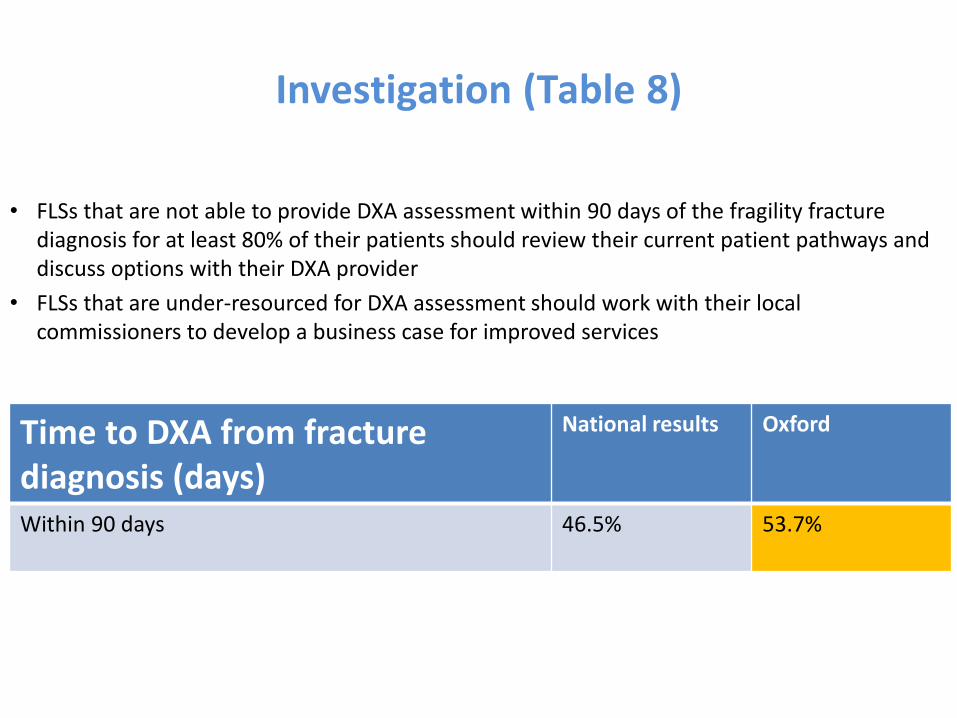
Investigation (Table 8)
• FLSs that are not able to provide DXA assessment within 90 days of the fragility fracture diagnosis for at least 80% of their patients should review their current patient pathways and discuss options with their DXA provider
• FLSs that are under-resourced for DXA assessment should work with their local commissioners to develop a business case for improved services
Time to DXA from fracture diagnosis (days)
National results Oxford
Within 90 days 46.5% 53.7%

Intervention (Table 10)
FLSs with higher than average recorded inappropriate should review their clinical pathway and liaise with other FLSs with similar case loads to understand if quality improvement is required.
FLSs with higher missing therapy decisions should review their data entry methods to the audit.
Bone therapy recommended:
National results Your site
Inappropriate 25.6% 23.1%
Missing 33.2% <5%
Don’t know 6.3% 44.7%

Falls assessments and interventions (Table 13)
• FLSs not routinely performing or referring for falls risk assessment should review their current clinical pathway.
• FLSs with high missing data proportion rates should review their data entry process.
Falls risk assessment National results
Your site
Performed/done/referred by the FLS 32.3% 24.9%
Missing 28.5% 0
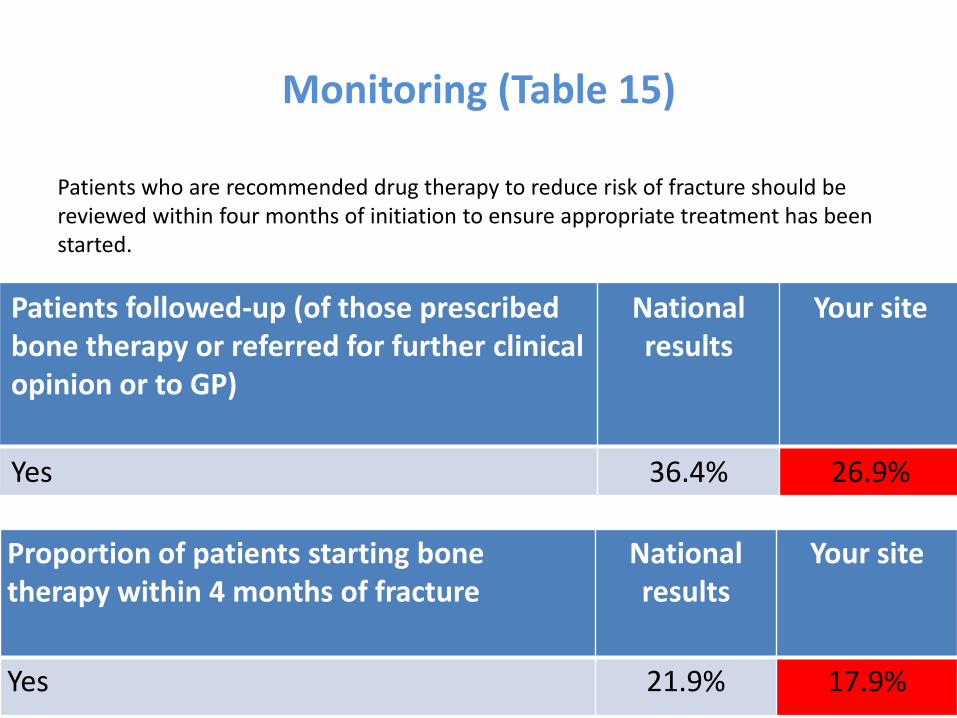
Monitoring (Table 15)
Patients who are recommended drug therapy to reduce risk of fracture should be reviewed within four months of initiation to ensure appropriate treatment has been started.
Patients followed-up (of those prescribed bone therapy or referred for further clinical opinion or to GP)
National results
Your site
Yes 36.4% 26.9%
Proportion of patients starting bone therapy within 4 months of fracture
National results
Your site
Yes 21.9% 17.9%

Our sites priority areas for Quality improvement
Component of Secondary Fracture prevention identified for quality improvement project
Project lead Implementation date
Cost neutral
1. Ensure adequate data transfer ElfinProgrammer
10/5/2017
2. Review monitoring pathway FLS nurse 1 01/09/2017
3. Identify A&E discharged patients FLS nurse 2 01/07/2017
Require additional funding
1. Vertebral fracture identification FLS nurse 2
Next upload deadline end of June 2017.

Projected volume and savings using NOS FLS calculator
Measure Oxford
Annual Projected Fragility case load (5 * 716) 3580
Annual Actual fragility case load (estimated from 6 months) 2,420
5 years number of prevented All fractures 629
5 years number of prevented hip fractures 288
5 years acute healthcare saving £3.47 million
5 years combined social, community and healthcare saving £5.34 million
Current annual FLS cost £269,000
Optimal annual FLS cost

Next phase of Key Performance Indicators
• Easily recorded
• Benchmarked (know what good looks like)
• Standardised
• Informative– Share solutions
– Where to improve
– Case mix
– What matters to patients – Quality of life

Core KPI


Quality improvement
• National level
– DXA in over 75 year olds
– Variability on inappropriate rates
• Fracture types/ age differences

Quality improvement
• FLS level: enable FLSs to get the support they need x2
– Estimated case finding rate• Total
• Hips
• Spine
– Time to • Assess
• DXA
• 4 and 12 months monitoring for Bone and Falls interventions
– Monitoring• At 4 and 12m

Future audit- changing perceptions
FLS Clinical information
FLS DB dataset

Future audit- changing perceptionsFLS DB part of routine FLS pathway
FLS Clinical information
FLS DB dataset
Hip fracture1. Successfully validated NHS number2. Only need NHS number, fracture typeand Date3. NHFD focused on inpatient careUnlikely NHFD will extend monitoring
More sites upload rather than direct entry
51 FLSs with over 52,000 patient records

NHS impact
1. Run charts going public Spring 2018
2. Work with NOS FLS Implementation team1. FLS DB data for KPI2. FLS DB data for benefit and costs statement / comparator with
other sites3. FLS DB data for service improvement 4. Podcast Q&A & resources
1. FLS assessment form 2. Duplicates3. Due monitoring

A work in progress

The vertebral fracture odyssey
• Identification
• Treatment
– Secondary fracture prevention
– Pain
• Drugs
• Physiotherapy
• Radiological augmentation
• Spinal surgery
Already collected by FLS
NOS Vertebral fracture project to identify other quality metrics
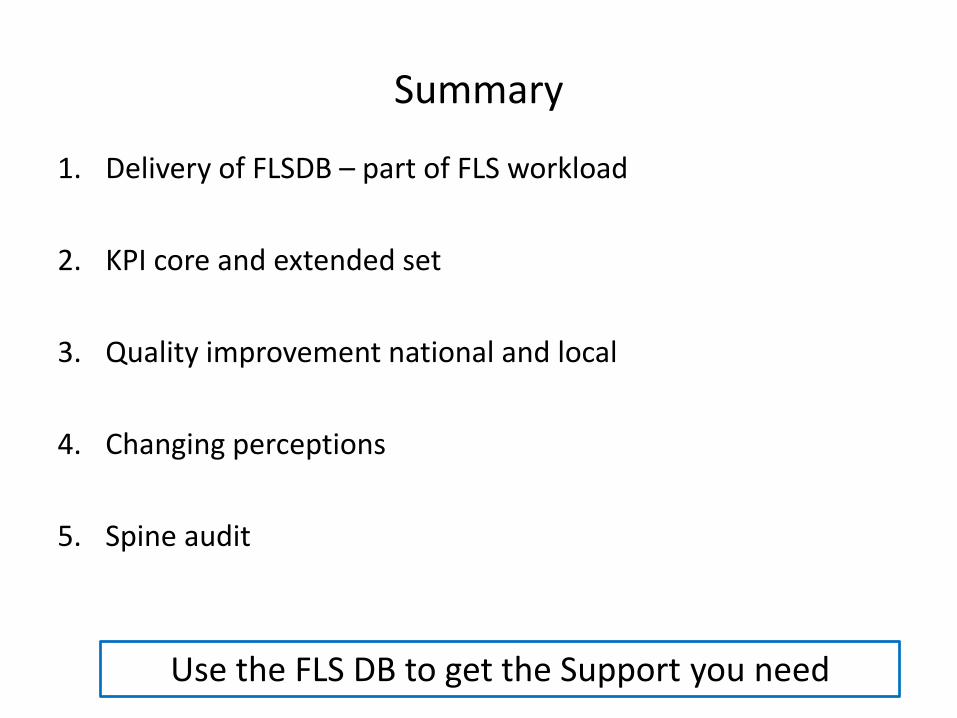
Summary
1. Delivery of FLSDB – part of FLS workload
2. KPI core and extended set
3. Quality improvement national and local
4. Changing perceptions
5. Spine audit
Use the FLS DB to get the Support you need

Oxford Team past and present:
Cooper, Arden, Wass, Willett, Carr, Price, Glyn-Jones, Hamdy, Ramasay
A Soni, K Leyland, S Sheard, R Warne, D Prieto Alhambra, A Judge, S Hawley,
R Pinedo-Villanueva, G Round, R Batra, A Kiran, D Hunter
MSK RD-TRC RUDY / GeCIP teamRajesh Thakker <[email protected]>, Shine Brian (RTH) OUH <[email protected]>, Faisal Ahmed <[email protected]>, Fadil Hannan <[email protected]>, Gittoes Neil (UNIVERSITY HOSPITALS BIRMINGHAM NHS FOUNDATION TRUST) <[email protected]>, Rheumatology JH Tobias <[email protected]>, Nicholas Shenker <[email protected]>, No Name Clunie <[email protected]>, Ken Poole <[email protected]>, Dr. Mike Stone <[email protected]>, RALSTON Stuart <[email protected]>, [email protected], Bockenhauer Detlef (GREAT ORMOND STREET HOSPITAL FOR CHILDREN NHS FOUNDATION TRUST) <[email protected]>, [email protected], [email protected], Peter Selby <[email protected]>, [email protected], No Name <[email protected]>, Eugene McCloskey <[email protected]>, [email protected] Cooper <[email protected]>, keen, richard keen <[email protected]>, [email protected], Paul Wordsworth <[email protected]>, Offiah Amaka <[email protected]>,Shaw Nick Dr (RQ3) BCH <[email protected]>, Hogler Wolfgang (RQ3) BCH <[email protected]>, Ken Poole <[email protected]>, [email protected], [email protected], [email protected], Christine Hall <[email protected]>, [email protected], "Blair Ed (RTH) OUH" <[email protected]>, "Shears Debbie (RTH) OUH" <[email protected]>, [email protected], [email protected], Terry Aspray <[email protected]> [email protected], [email protected], [email protected], [email protected], [email protected], [email protected], [email protected], [email protected], Cristina Ponte <[email protected]>, [email protected], [email protected], "boyde, alan" <[email protected]>, [email protected], [email protected], [email protected], Moira Cheung <[email protected]>, Dyfrig Hughes <[email protected]>, [email protected], [email protected], [email protected], Senniappan Senthil<[email protected]>, "Anthony J. (Prof.) Brookes" <[email protected]>, Irving Melita <[email protected]>, Clinical Medicine EM Clark <[email protected]>, andrew price <[email protected]>, Sion Glyn-Jones <[email protected]>, [email protected], [email protected], [email protected], [email protected], [email protected], Andrew Wilkie <[email protected]>, "Cranston Treena (RTH) OUH" <[email protected]>, Harriet Teare <[email protected]>, Jane Kaye <[email protected]>, [email protected], Jon Palmer <[email protected]>, Rafael Pinedo-Villanueva <[email protected]>, [email protected], [email protected], [email protected], [email protected], [email protected], [email protected], [email protected], [email protected], [email protected], [email protected], [email protected], [email protected],[email protected], [email protected], [email protected], [email protected], [email protected], [email protected], [email protected], [email protected], [email protected], [email protected], [email protected], [email protected], [email protected], "M.P. Snead" <[email protected]>, [email protected], [email protected], [email protected], [email protected], [email protected], [email protected], [email protected], [email protected], [email protected], [email protected], [email protected], [email protected], [email protected], [email protected], [email protected]. [email protected], Elaine Dennison <[email protected]>, [email protected], [email protected], Daniel Perry <[email protected]>
Fracture Prevention Team
Patsy Stevens
Carol Weeks
Linda Lyzba
Rachel Eckert
Karen Taylor
Tracy Dobbins
C Cooper
P Halbourt
K Akesson
P Mitchell
M Schneider
D Pierroz
M Edwards
B Curtis
S Goemaere
T Thomas
W Lems
D O’Gradaigh
RUDY team
A Turner
J Barrett
J Hogg
R Popert
D Grey
N Grey
H Teare
J Kaye
R Luqmani
P Wordsworth

Acknowledgements

Future work
• NHS dissemination
• Vertebral fracture sprint audit
• Future audit

Effect of NICE guidance & generic alendronate on prescribing data
Hawley 2016 JBMR
(12 - 24 months)
National levers lead to major changes in prescribing

ONJ lawsuit
Atr Fib AIM
Television AFF and BP
Jha JBMR 2015; Jarvenin BMJ 2015
Adverse publicity reduces osteoporosis prescribing
International levers lead to major changes in prescribing

0
10
20
30
40
50
60
< 4 months 12 months 24 months 36 months 60 months
Per
cen
tage
of
pat
ien
ts o
n a
nti
-ost
eop
oro
sis
dru
gs (
%)
Time since primary fracture (months)
2b) 2005-2013
East Midlands East of England London North EastNorth West Northern Ireland Scotland South CentralSouth East Coast South West Wales West MidlandsYorkshire & The Hum..
Shah OI, 2016
Percentage of survivors after hip fracture on oral osteoporosis therapy by region of UK
Cross sectional prescribing data does not capture adherenceMajor issue of poor adherence to oral treatments after a hip fracture

NICE TA 161 2006
Post code lottery for interpretation of NICE TA 161
Confirmed with FLS

Real KPI – what matters to patients
Should we use EQ5D-5L as the ultimate performance indicator?
5 questionsOne 0- 100 scaleComplete by paper, phone or online

“67 - 94% of patients aged 75 yearand over were treated with abone sparing agent”
There is only a small care gap!
Atlas of variation 2015
Dissemination into the NHS:Does the left hand know what the right hand is doing?
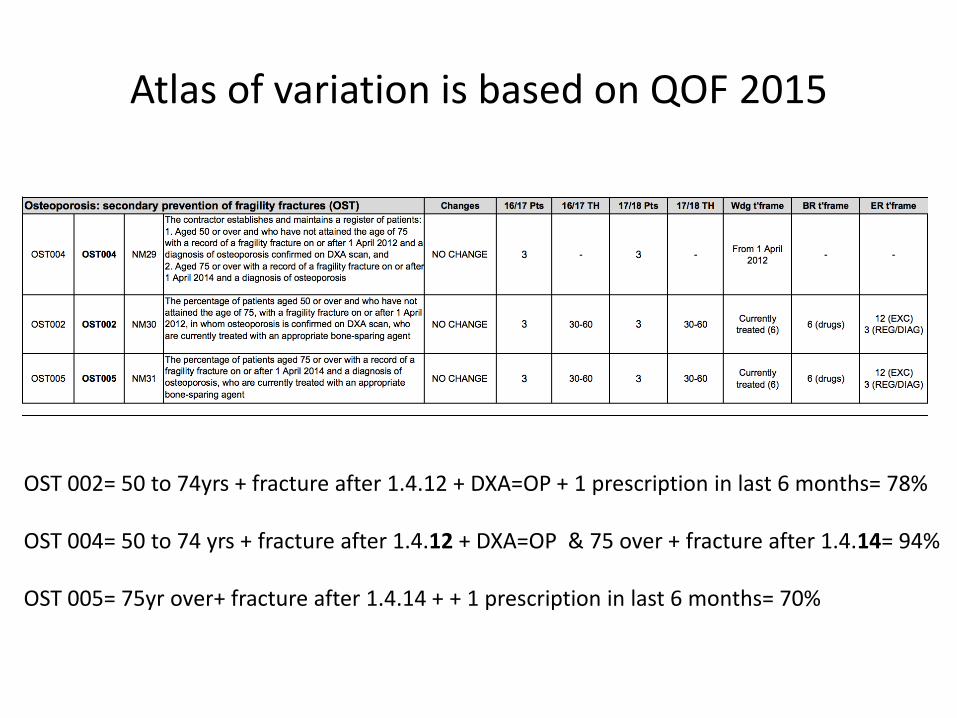
Atlas of variation is based on QOF 2015
OST 002= 50 to 74yrs + fracture after 1.4.12 + DXA=OP + 1 prescription in last 6 months= 78%
OST 004= 50 to 74 yrs + fracture after 1.4.12 + DXA=OP & 75 over + fracture after 1.4.14= 94%
OST 005= 75yr over+ fracture after 1.4.14 + + 1 prescription in last 6 months= 70%

QoF Is data source: denominators are wrong
OST 002: 50 to 74yrs + fracture after 1.4.12 + DXA=OP + 1 prescription in last 6 months= 78%
OST 004: 50to74 yrs + fracture after 2012 + DXA=OP & 75 over + fracture after2014 = 94%
OST 005: 75yr over+ fracture after 1.4.14 + + 1 prescription in last 6 months= 70%
30,178/43,092
since April 2014….. only 43,092 patients over 75 years were recorded on treatment
Estimate 75yrs over on treatment should be about at least 170,000! (NICE TA 161)
QOF results are based on less than 30% of expected patientsmore than 70% patients are missing!!!
> OST OO5 should be 18% not 70%
16,704/ 21.316
21,477/22,847
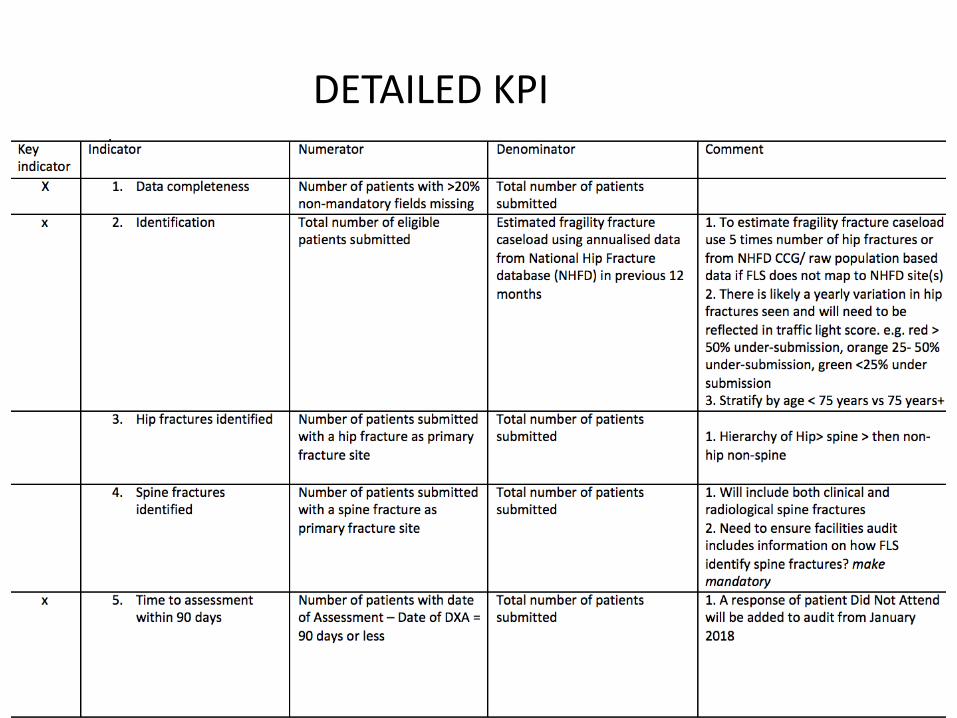
DETAILED KPI


NICE TA 160/1