Royal Bank of Canada Investor Presentation Bank of Canada Investor Presentation Q4/2015 All amounts...
41
0 Royal Bank of Canada Investor Presentation Q4/2015 All amounts are in Canadian dollars and are based on financial statements prepared in compliance with International Accounting Standards 34 Interim Financial Reporting, unless otherwise noted. Our 2015 Annual Report and Supplementary Financial Information are available on our website at rbc.com/investorrelations.
Transcript of Royal Bank of Canada Investor Presentation Bank of Canada Investor Presentation Q4/2015 All amounts...

0
Royal Bank of Canada Investor Presentation
Q4/2015
All amounts are in Canadian dollars and are based on financial statements prepared in compliance with International Accounting Standards
34 Interim Financial Reporting, unless otherwise noted. Our 2015 Annual Report and Supplementary Financial Information are available on
our website at rbc.com/investorrelations.
1
Caution regarding forward-looking statements
From time to time, we make written or oral forward-looking statements within the meaning of certain securities laws, including the “safe harbour”
provisions of the United States Private Securities Litigation Reform Act of 1995 and any applicable Canadian securities legislation. We may make
forward-looking statements in this RBC Investor Presentation, in filings with Canadian regulators or the United States (U.S.) Securities and Exchange
Commission (SEC), in reports to shareholders and in other communications. Forward-looking statements in this presentation include, but are not limited
to, statements relating to our financial performance objectives, vision and strategic goals. The forward-looking information contained in this RBC Investor
Presentation is presented for the purpose of assisting the holders of our securities and financial analysts in understanding our financial position and
results of operations as at and for the periods ended on the dates presented, and our financial performance objectives, vision and strategic goals, and
may not be appropriate for other purposes. Forward-looking statements are typically identified by words such as “believe”, “expect”, “foresee”, “forecast”,
“anticipate”, “intend”, “estimate”, “goal”, “plan” and “project” and similar expressions of future or conditional verbs such as “will”, “may”, “should”, “could” or
“would”.
By their very nature, forward-looking statements require us to make assumptions and are subject to inherent risks and uncertainties, which give rise to the
possibility that our predictions, forecasts, projections, expectations or conclusions will not prove to be accurate, that our assumptions may not be correct
and that our financial performance objectives, vision and strategic goals will not be achieved. We caution readers not to place undue reliance on these
statements as a number of risk factors could cause our actual results to differ materially from the expectations expressed in such forward-looking
statements. These factors – many of which are beyond our control and the effects of which can be difficult to predict – include: credit, market, liquidity and
funding, insurance, operational, regulatory compliance, strategic, reputation, legal and regulatory environment, competitive and systemic risks and other
risks discussed in the Risk management and Overview of other risks sections of our 2015 Annual Report; weak oil and gas prices; the high levels of
Canadian household debt; increasing exposure to more volatile sectors; cybersecurity; anti-money laundering; the business and economic conditions in
Canada, the U.S. and certain other countries in which we operate; the effects of changes in government fiscal, monetary and other policies; tax risk and
transparency; and environmental risk.
We caution that the foregoing list of risk factors is not exhaustive and other factors could also adversely affect our results. When relying on our forward-
looking statements to make decisions with respect to us, investors and others should carefully consider the foregoing factors and other uncertainties and
potential events. Material economic assumptions underlying the forward looking-statements contained in this RBC Investor Presentation are set out in the
Overview and outlook section and for each business segment under the heading Outlook and priorities in our 2015 Annual Report, Except as required by
law, we do not undertake to update any forward-looking statement, whether written or oral, that may be made from time to time by us or on our behalf.
Additional information about these and other factors can be found in the Risk management and the Overview of other risks sections in our 2015 Annual
Report.
Information contained in or otherwise accessible through the websites mentioned does not form part of this RBC Investor Presentation. All references in
this RBC Investor Presentation to websites are inactive textual references and are for your information only.
About RBC

2
About RBC

3
The RBC story
Market leader with a
focused growth strategy
Market leader in Canada and one of the largest financial institutions
globally
Clear strategy for continued long-term growth in Canada, the U.S. and
select global markets
Diversified business
mix supports deep
client relationships
Well-diversified across businesses, geographies and client segments
Ability to capitalize on opportunities created by changing market dynamics
and economic conditions
Wide breadth of products and capabilities allows us to meet all of our
clients’ financial needs and build deep, long-term relationships
Financial strength
underpinned by prudent
risk management
Track record of earnings and dividend growth while maintaining a
disciplined approach to risk
Credit ratings amongst the highest globally
Strong capital position and a high quality liquid balance sheet
Innovation is in our
DNA
Long history of innovation and proven ability to adapt to industry trends
Investments in technology allow us to drive efficiencies and deliver an
exceptional client experience
Focused on simplifying, digitizing and personalizing our products to make it
easier for clients and employees to do business
Leading corporate
citizen
Provide over $100MM in donations, sponsorships and community
investments, including the RBC Kids Pledge and RBC Blue Water Project
Globally recognized as a financial services thought leader
About RBC

4
Market leader with a focused strategy for growth
Top 15 globally One of the 15 largest global banks
by market capitalization with
operations in 39 countries
16 million+ clients Served by ~78,000 employees
worldwide
Purpose
Help clients thrive and communities prosper
Vision
To be one of the world’s most trusted and successful financial institutions
Strategic Goals
In Canada, to be the undisputed leader in financial services
In the U.S., to be the preferred partner to corporate, institutional and high net worth
clients and their businesses
In select global financial centres, to be a leading financial services partner valued for
our expertise
Largest in Canada A market leader across all key
businesses
About RBC

5
Diversified business model
Diversified by business(1)
52% 11% 7% 6% 24%
Personal & Commercial Banking
The Canadian market leader continuing to gain
profitable market share
Capital Markets
A leading North American
investment bank with select
global reach
Wealth Management
A leading global wealth
and asset manager
Insurance
A Canadian market leader
with a broad suite of products
and strong distribution
(1) Earnings for the latest twelve months ended October 31, 2015. Amounts exclude Corporate Support. These are non-GAAP measures. For additional information, refer to our 2015 Annual
Report.
Diversification across businesses, geographies and client segments positions us well to deliver
superior returns and earnings stability through the business cycle
About RBC
Diversified by geography(1)
Canada 75%
U.S. 12%
International 13%
Investor & Treasury Services
A leading specialist provider of
asset services, custody, payments
and treasury services globally

6
Consistent earnings growth
Strong financial profile
13.4% 13.0%
13.5% 13.4% 14.0%
9.9% 9.6% 10.0% 10.1%
10.6%
Q4/14 Q1/15 Q2/15 Q3/15 Q4/15
Total capital Common Equity Tier 1 (CET1)
Leverage Ratio
Liquidity Coverage Ratio
4.3%
127%
Moody’s S&P Fitch DBRS
Aa3 AA- AA AA
Negative Negative Stable Negative
7.5 8.3
9.0
10.0
2012 2013 2014 2015
19.6% 19.7% 19.0% 18.6%
2012 2013 2014 2015
Strong capital position(2)
Strong Return on Equity(1)
Strong leverage and liquidity ratios(2)
Credit ratings(3) amongst the highest globally
Consistent earnings growth and strong ROE while maintaining a strong capital position with a
disciplined approach to risk
About RBC (1) ROE may not have a standardized meaning under GAAP and may not be comparable to similar measures disclosed by other financial institutions. For additional information, see slide 40. (2) Capital calculated to include all regulatory adjustments that will be required by 2019 but
retaining the phase-out rules for non-qualifying capital. Refer to the Capital Management section of our 2015 Annual Report for details on all ratios excluding Liquidity Coverage ratio calculated on a “All-in” Basel III basis and Basel III requirements. (3) Based on long-term senior debt
ratings as of December 1, 2015.
Net income ($BN)

7
21 bps 23 bps
33 bps
53 bps
72 bps
45 bps
34 bps 35 bps 31 bps
27 bps 24 bps
2005 2006 2007 2008 2009 2010 2011 2012 2013 2014 2015
Global financial crisis
Robust risk management
Loan book diversified by portfolio(1) Loan book by geography(1)
Relative stable PCL ratio over the cycle(2)
A disciplined approach and diversification has driven stable credit trends
Wholesale
29%
Credit cards: 3%
Personal loans
19%
Residential
mortgages
48%
Broad geographic diversification across
Canada
Continued low loss rates and stable
delinquency rates with good LTV coverage
Diversified by name, country, industry and
product
Consistent lending standards throughout the
cycle
Approximately 70% of the portfolio is
investment grade
Small business: 1%
Canada 85%
U.S.
8%
International
7%
(1) Does not include letters of credit or guarantees.
(2) PCL ratio is PCL on impaired loans as a percentage of average net loans & acceptances (annualized).
About RBC
Includes home equity lines of credit, auto
loans, and other personal lending products
Approximately 75% of the portfolio is secured,
and its credit quality has remained stable
8
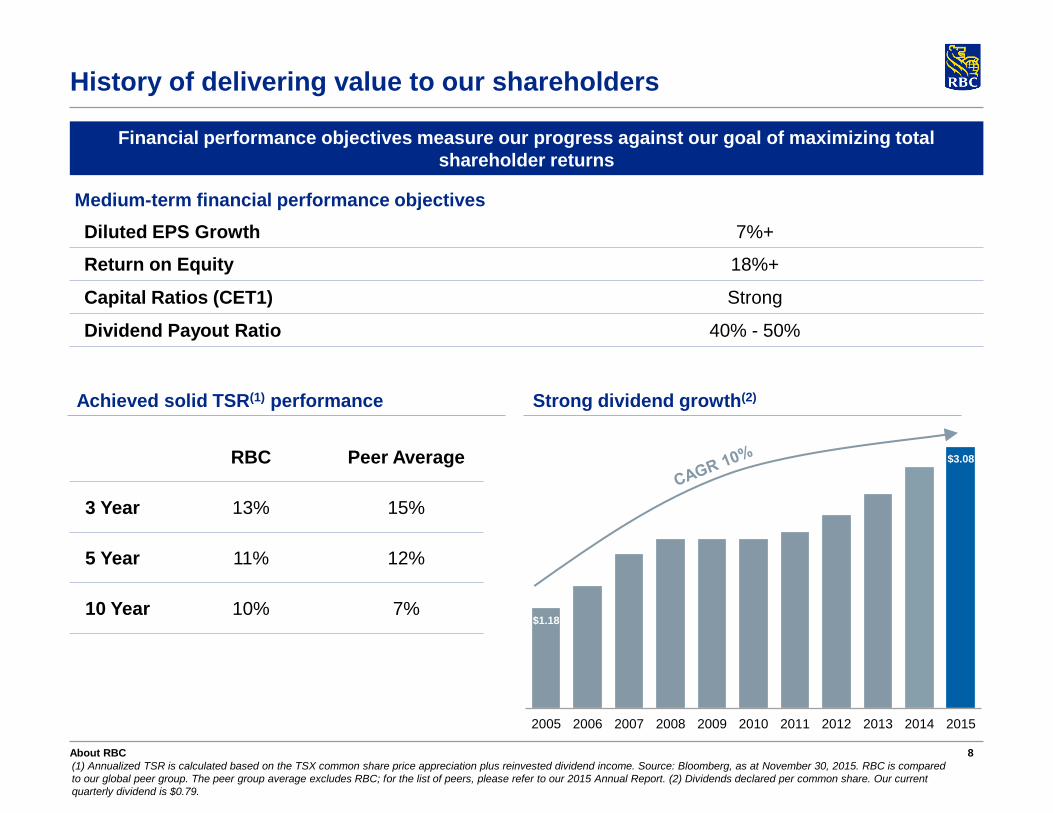
History of delivering value to our shareholders
$1.18
$3.08
2005 2006 2007 2008 2009 2010 2011 2012 2013 2014 2015
(1) Annualized TSR is calculated based on the TSX common share price appreciation plus reinvested dividend income. Source: Bloomberg, as at November 30, 2015. RBC is compared
to our global peer group. The peer group average excludes RBC; for the list of peers, please refer to our 2015 Annual Report. (2) Dividends declared per common share. Our current
quarterly dividend is $0.79.
Financial performance objectives measure our progress against our goal of maximizing total
shareholder returns
Achieved solid TSR(1) performance Strong dividend growth(2)
Medium-term financial performance objectives
Diluted EPS Growth 7%+
Return on Equity 18%+
Capital Ratios (CET1) Strong
Dividend Payout Ratio 40% - 50%
RBC Peer Average
3 Year 13% 15%
5 Year 11% 12%
10 Year 10% 7%
About RBC

9
Innovation is in our DNA
Track record of
innovation and
proven ability to
adapt to trends
First Canadian bank to install a computer, and the first to host a website
Patented the first mobile wallet technology to store secure information in the cloud
and away from a client’s phone
First financial institution to provide clients with the choice of using debit or credit
for their mobile payments
Digitizing and
automating to drive
efficiencies
Well ahead of the development curve, with significant technology costs built into
our run rate
New mortgage origination system reduces the number of manual steps to fulfil a
mortgage
eSignatures has saved up to 24,000 hours per week in administration time
20 million documents taken out of circulation through digitization
Online Customer Service Kiosk offers a searchable database of commonly asked
questions, reducing call volume into our call center
Making it easier for
clients and
employees to do
business
Evolving the branch network to focus on complex issues and sales, while
enhancing digital and ATM capabilities for basic service transactions
Collaborating effectively and finding ways to be more agile in delivering an
exceptional client experience
Leverage data analytics to anticipate and meet client needs
Fostering innovation
across the country
Partner with Communitech in Waterloo and the entrepreneurship program at the
University of Calgary
Run an annual RBC Innovation Challenge for students
Moving at the speed of our clients’ lives without jeopardizing the security and trust they place in us
About RBC
10
Business Segments

11
4.1 4.4 4.5
5.0
2012 2013 2014 2015
Personal & Commercial Banking
2015 Highlights
(1) Based on average balances. (2) Statistic is based on Canadian Banking only. (3) Based on average balances. (4) For the year ended October 31, 2015.
The undisputed financial services leader in Canada
#1 or #2 market share in all key product categories
Most branches and largest sales force in Canada
Superior cross-sell ability
In 17 countries and territories in the Caribbean
2nd largest bank by assets(1) in English Caribbean
Provide innovative direct banking to U.S. cross-border clients
Ongoing investment in digitizing our banking channels
Net income ($BN)
Personal Financial Services
53%
Business Financial Services
22%
Cards and Payment Solutions
19%
Caribbean & U.S.
Banking 6%
Clients (MM) 13.6
Branches 1,355
ATMs 4,816
Active digital and mobile users(2) (MM) 4.9
Employees (FTE) 35,007
Loans & acceptances(3) ($BN) 367.5
Deposits(3) ($BN) 298.6
AUA ($BN) 223.5
Revenue by business line(4)
Business segments

12
Most valuable brand in
Canada(4)
Best Trade Finance Bank
in Canada 3 years in a
row(3)
Bank of the Year in
Canada and #1 bank in
the Caribbean and in
Trinidad and Tobago(2)
Global Retail Bank of the
Year 2 years in a row(1)
Personal & Commercial Banking – Canada
(1) Retail Banker International, 2015. (2) Based on Tier 1 capital. Tier 1 refers to the core measure of a bank’s financial strength based on the sum of its equity capital and disclosed reserves (or
retained earnings). The Banker, 2014. (3) Global Finance, 2015. (4) Brand Finance, 2015.
Strategic Priorities
Offer a differentiated
experience
Be the undisputed leader in Canada
Demonstrate the value for money that sets RBC apart through quality of advice and service,
and industry-leading convenience and access
Make it easier to do
business with us
Maintain focus on digitizing the bank and simplifying our end-to-end processes
Make it simpler and easier for clients to do business with us through self, assisted and full-
serve options
Invest in skills, accreditation and engagement of our employees to enable us to compete more
effectively
Converge into an
integrated multi-channel
network
Leveraging our unparalleled distribution breadth (e.g. most branches and ATMs in Canada),
internal capabilities and strategic external partnerships to maintain our market leadership and
extend our sales power
Adapting our distribution network to ongoing changes in client preferences, including designing
applications, processes and products for online and mobile channels
Recent Awards
Business segments

13
49.2% 49.7% 49.9%
48.4%
44.5% 44.7% 44.2% 44.0%
2012 2013 2014 2015
Product Market
share Rank
Consumer lending(4) 23.6% 1
Personal core deposits + GICs 19.9% 2
Long-Term Mutual Funds(5) 14.4% 1
Business loans ($0-$25MM)(6) 25.0% 1
Business deposits(7) 26.6% 1
23%
14%
RBC Peer Average(8)
Personal & Commercial Banking – Canada
Percent of households with transaction accounts, investments and borrowing products(2)
(1) Based on average balances. (2) Canadian Financial Monitor by Ipsos Reid – 12,000 Canadian households annually – data based on Financial Group results for the first six months of 2015 (January to June); TFSA is considered an Investment. (3) Market share is calculated using most current data
available from OSFI (M4), Investment Funds Institute of Canada (IFIC) and Canadian Bankers Association (CBA). OSFI, IFIC and Consumer Lending CBA data is at July 2015, Business Loans CBA data is at June 2015. Market share is of total Chartered Banks except for Business Loans which is of
total 7 Banks (RBC, BMO, BNS, CIBC, TD, NA, CWB). (4) Consumer Lending market share is of 6 banks (RBC, TD, CIBC, BMO, BNS and NA). Consumer Lending comprises residential mortgages (excluding acquired portfolios), personal loans and credit cards. (5) Mutual fund market share is per IFIC
and is compared to total industry. (6) Business Loans market share is of the 7 Chartered Banks that submit to CBA on a quarterly basis. (7) Business Deposits market share excludes Fixed Term, Government and Deposit Taking Institution balances. (8) Peers include BMO, BNS, CIBC & TD; 2012
through 2014 reflects annual results while the peer average efficiency ratio for 2015 represents 9 months ending Q3 2015 according to the data that is available for the peers.
#1 or #2 market share in all categories(3) Continue to improve our efficiency ratio
Solid volume growth(1) Superior cross-sell ability
307 329 343 359
230 248 264 281
2012 2013 2014 2015
Loans and acceptances Deposits
Peer
Average (8)
Business segments
14
753
886
1,083 1,041
2012 2013 2014 2015
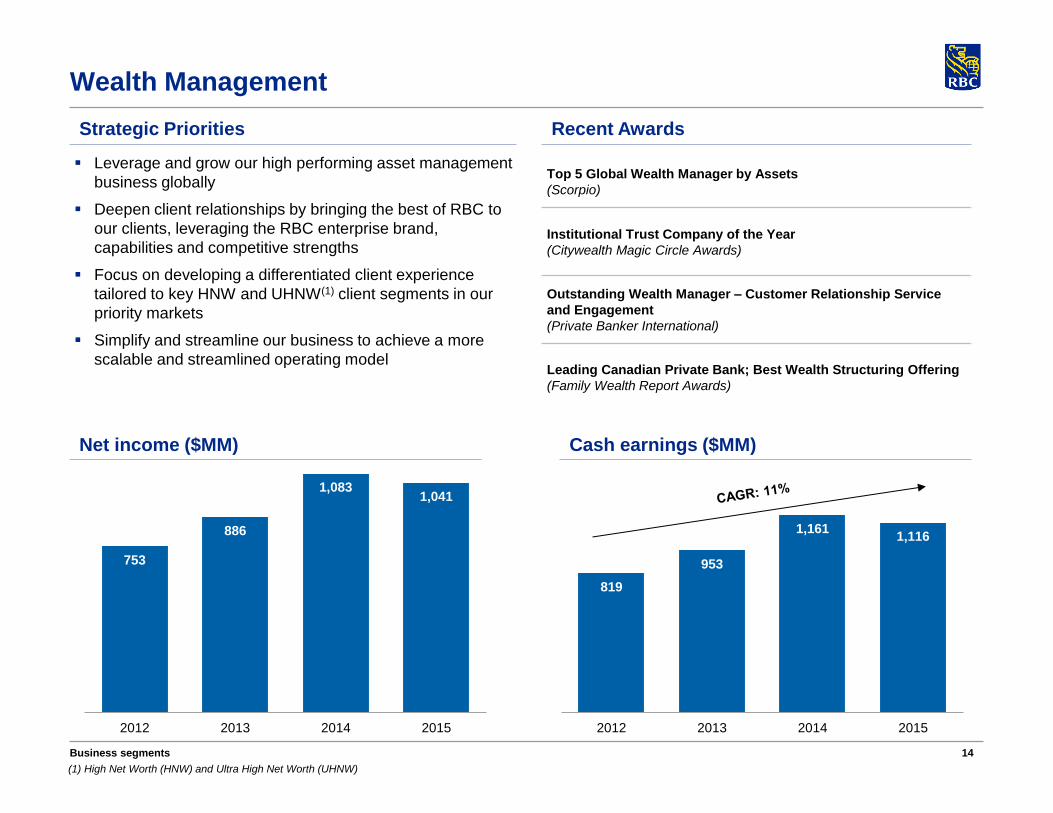
Wealth Management
Net income ($MM) Cash earnings ($MM)
819
953
1,161 1,116
2012 2013 2014 2015
Business segments
Leverage and grow our high performing asset management
business globally
Deepen client relationships by bringing the best of RBC to
our clients, leveraging the RBC enterprise brand,
capabilities and competitive strengths
Focus on developing a differentiated client experience
tailored to key HNW and UHNW(1) client segments in our
priority markets
Simplify and streamline our business to achieve a more
scalable and streamlined operating model
Top 5 Global Wealth Manager by Assets
(Scorpio)
Institutional Trust Company of the Year
(Citywealth Magic Circle Awards)
Outstanding Wealth Manager – Customer Relationship Service
and Engagement
(Private Banker International)
Leading Canadian Private Bank; Best Wealth Structuring Offering
(Family Wealth Report Awards)
Strategic Priorities Recent Awards
(1) High Net Worth (HNW) and Ultra High Net Worth (UHNW)
15
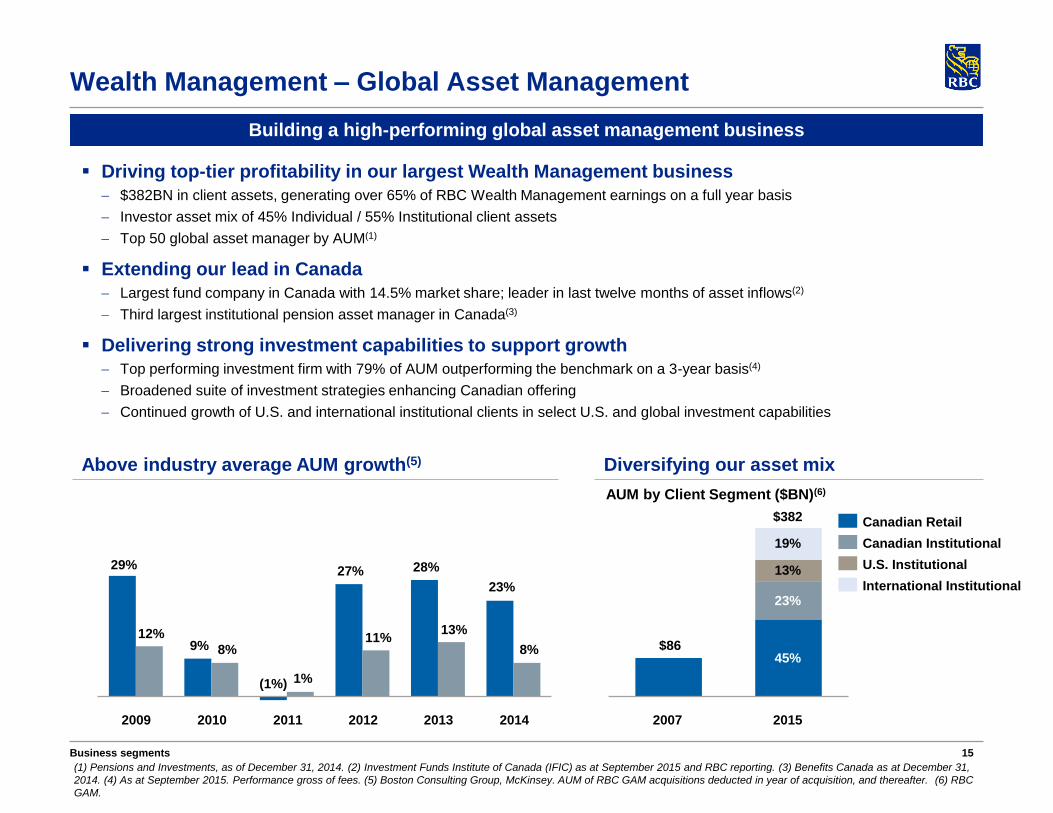
Wealth Management – Global Asset Management
Driving top-tier profitability in our largest Wealth Management business
$382BN in client assets, generating over 65% of RBC Wealth Management earnings on a full year basis
Investor asset mix of 45% Individual / 55% Institutional client assets
Top 50 global asset manager by AUM(1)
Extending our lead in Canada
Largest fund company in Canada with 14.5% market share; leader in last twelve months of asset inflows(2)
Third largest institutional pension asset manager in Canada(3)
Delivering strong investment capabilities to support growth
Top performing investment firm with 79% of AUM outperforming the benchmark on a 3-year basis(4)
Broadened suite of investment strategies enhancing Canadian offering
Continued growth of U.S. and international institutional clients in select U.S. and global investment capabilities
Building a high-performing global asset management business
(1) Pensions and Investments, as of December 31, 2014. (2) Investment Funds Institute of Canada (IFIC) as at September 2015 and RBC reporting. (3) Benefits Canada as at December 31,
2014. (4) As at September 2015. Performance gross of fees. (5) Boston Consulting Group, McKinsey. AUM of RBC GAM acquisitions deducted in year of acquisition, and thereafter. (6) RBC
GAM.
9%
27% 28%
23%
12%
8%
1%
11% 13%
8%
2014 2013 2012 2011 2010 2009
Diversifying our asset mix
AUM by Client Segment ($BN)(6)
Above industry average AUM growth(5)
Business segments
$86
2015
$382
19%
13%
23%
45%
2007
International Institutional
U.S. Institutional
Canadian Institutional
Canadian Retail
29%
(1%)

16
$71
$35
RBC Cdn Peer Average
Over 2.0x the peer average
Wealth Management
Extending our #1 position
Grew HNW market share by ~400 bps to 19% in the last four years(1)
and anticipate reaching 20% market share by 2016
Maintaining profitable growth in a challenging market
Generating ~30% of RBC Wealth Management earnings with strong pre-
tax margin, highest among North American peers(3)
Driving strong advisor productivity
Canadian leader in fee-based assets per advisor(1)
Consistently driving revenue per advisor of over $1.2MM per year, 42%
above Canadian industry average(1)
Competitive hires delivering strong new asset growth
Leveraging Enterprise linkages to continue to extend market share gains
Canada – Extending our industry leadership
U.S. & International
United States
Focus on the successful integration of City National and begin
to deliver on planned synergies
Steadily increasing advisor productivity and continue growing
complementary distribution through successfully recruiting
revenue producers and establishing new clearing relationships
Improving operational efficiencies and leveraging RBC’s
global capabilities to broaden our product offering
International
Focusing on UHNW and HNW client acquisitions from select
markets where we have scale
Leveraging RBC’s global capabilities (Global Asset
Management and Capital Markets)
Fee-based assets per advisor(2) ($MM)
(1) Investor Economics report on RBC’s full wealth and investment offering in Canada, July 2015. (2) Investor Economics report, July 2015. (3) As per BCG Global Wealth Manager
Benchmarking 2014. (4) Total average loans & acceptances.
Loans(4) & Deposits
Average Balances
($BN)
29.231.9
36.239.5
17.715.712.1
9.9
2012 2013 2014 2015
Loans Deposits
Business segments
17
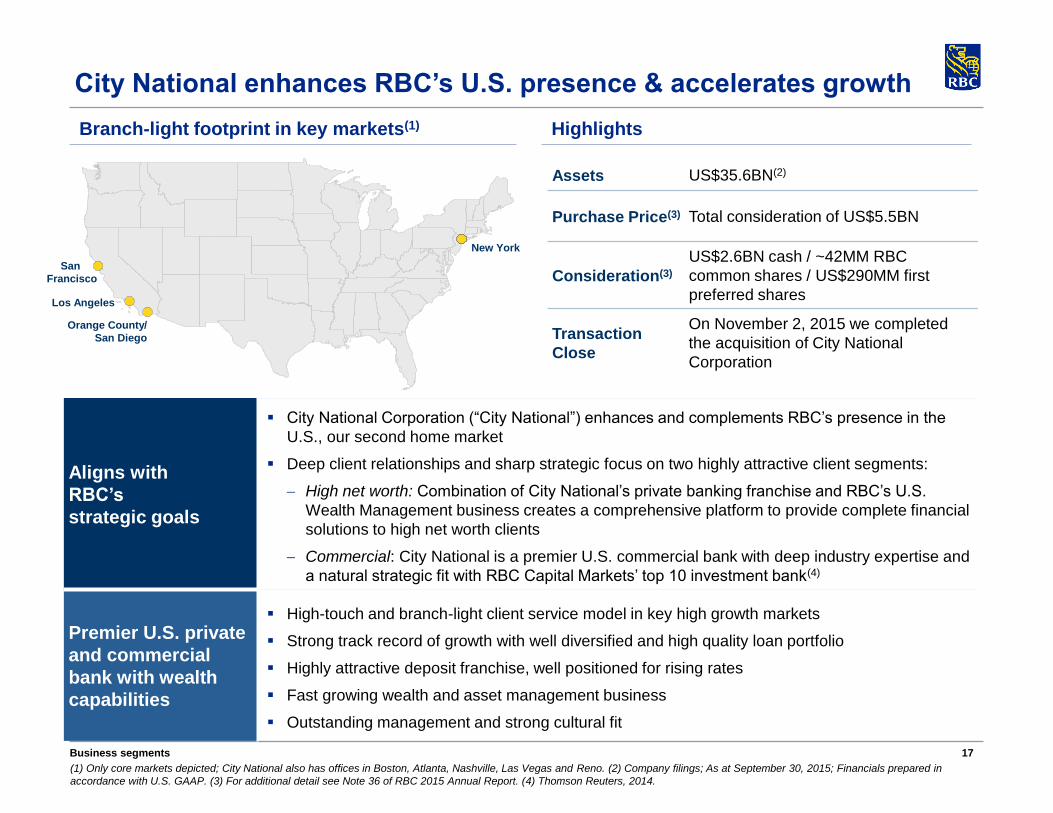
City National enhances RBC’s U.S. presence & accelerates growth
Aligns with
RBC’s
strategic goals
City National Corporation (“City National”) enhances and complements RBC’s presence in the
U.S., our second home market
Deep client relationships and sharp strategic focus on two highly attractive client segments:
High net worth: Combination of City National’s private banking franchise and RBC’s U.S.
Wealth Management business creates a comprehensive platform to provide complete financial
solutions to high net worth clients
Commercial: City National is a premier U.S. commercial bank with deep industry expertise and
a natural strategic fit with RBC Capital Markets’ top 10 investment bank(4)
Premier U.S. private
and commercial
bank with wealth
capabilities
High-touch and branch-light client service model in key high growth markets
Strong track record of growth with well diversified and high quality loan portfolio
Highly attractive deposit franchise, well positioned for rising rates
Fast growing wealth and asset management business
Outstanding management and strong cultural fit
San
Francisco
Los Angeles
New York
Orange County/
San Diego
(1) Only core markets depicted; City National also has offices in Boston, Atlanta, Nashville, Las Vegas and Reno. (2) Company filings; As at September 30, 2015; Financials prepared in
accordance with U.S. GAAP. (3) For additional detail see Note 36 of RBC 2015 Annual Report. (4) Thomson Reuters, 2014.
Business segments
Branch-light footprint in key markets(1) Highlights
Assets US$35.6BN(2)
Purchase Price(3) Total consideration of US$5.5BN
Consideration(3)
US$2.6BN cash / ~42MM RBC
common shares / US$290MM first
preferred shares
Transaction
Close
On November 2, 2015 we completed
the acquisition of City National
Corporation

18
Expanding into U.S.
private & commercial
banking
Introducing City National’s full suite of U.S. private and commercial banking products and
services to RBC clients
~340,000 RBC U.S. Wealth Management households
~204,000 RBC Canadian cross-border clients
~88,000 RBC Canadian commercial clients
Enhancing U.S. wealth &
asset management
platform
Adding scale in wealth and asset management – Combined U.S.-based client assets of ~C$393BN
Brings RBC’s Wealth Management segment to over C$1.3 trillion in client assets globally
Expanding the distribution channels for RBC and City National wealth management products
~2,100 combined advisors
Accessing RBC Capital Markets’ advisory, capital raising and risk management capabilities
Extending full commercial
& corporate capabilities
Extending full commercial and corporate capabilities to City National’s key industry verticals
(entertainment, real estate, technology and healthcare)
Vertical alignment allowing for greater depth
Leveraging RBC Capital Markets’ market-leading platform into additional industry verticals for
City National
Replicate RBC’s successful Canadian referral model between Commercial Banking and
Capital Markets with City National and RBC Capital Markets
Expense synergies Consolidation of non-client facing infrastructure across City National, RBC Wealth Management and
other RBC businesses
Achieving scale benefits in procurement, technology and other functional areas
Improving productivity via cross-sell and referrals
Deposit synergies Ability to attract additional deposits from RBC Wealth Management and Capital Markets clients
Utilize low cost sweep balances from RBC U.S. Wealth Management as an additional competitive
funding advantage to support future loan growth
Growth initiatives Introducing City National’s private and commercial banking solutions through RBC’s U.S. Wealth
Management advisor and client base
Leveraging RBC’s platform and financial strength to increase City National’s market penetration
Accelerating expansion into other new high-growth markets through an expanded network
City National acquisition creates a powerful & scalable engine for growth in the U.S.
The data on this slide, including client assets, number of clients, and number of advisors represents the most currently available data as of October 31, 2015.
Business segments
19
Insurance
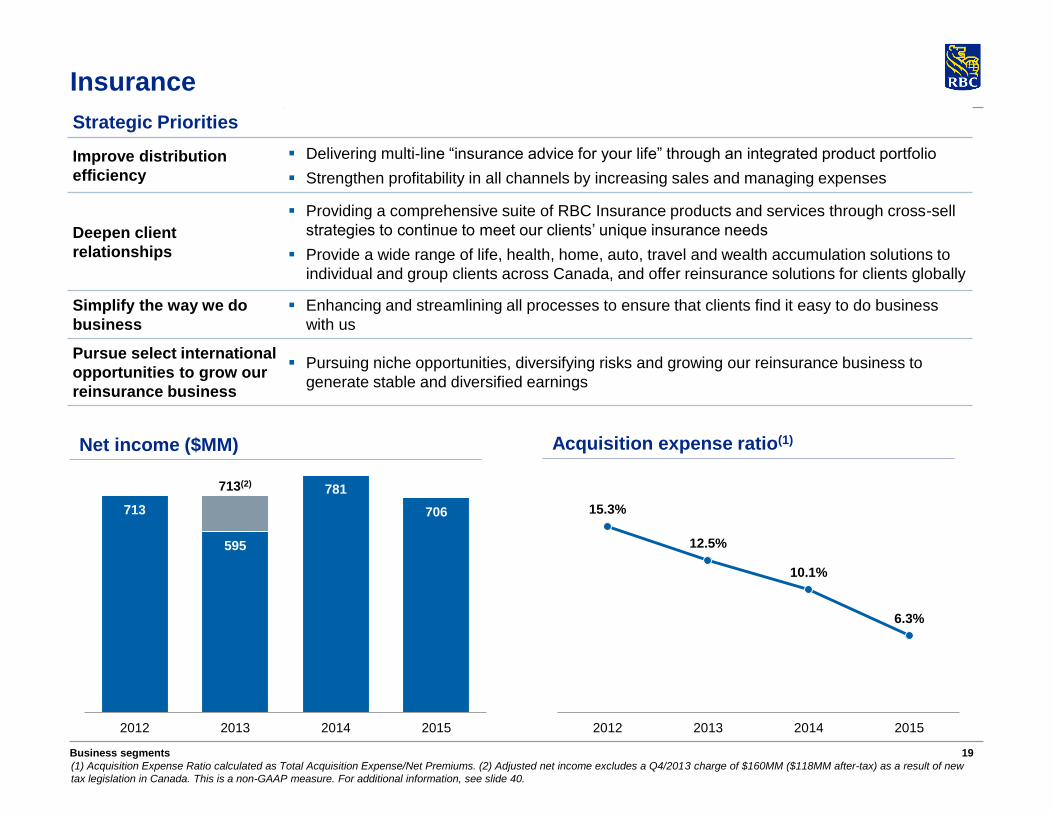
(1) Acquisition Expense Ratio calculated as Total Acquisition Expense/Net Premiums. (2) Adjusted net income excludes a Q4/2013 charge of $160MM ($118MM after-tax) as a result of new
tax legislation in Canada. This is a non-GAAP measure. For additional information, see slide 40.
Net income ($MM)
713
595
781
706
713(2)
2012 2013 2014 2015
Acquisition expense ratio(1)
15.3%
12.5%
10.1%
6.3%
2012 2013 2014 2015
Strategic Priorities
Improve distribution
efficiency
Delivering multi-line “insurance advice for your life” through an integrated product portfolio
Strengthen profitability in all channels by increasing sales and managing expenses
Deepen client
relationships
Providing a comprehensive suite of RBC Insurance products and services through cross-sell
strategies to continue to meet our clients’ unique insurance needs
Provide a wide range of life, health, home, auto, travel and wealth accumulation solutions to
individual and group clients across Canada, and offer reinsurance solutions for clients globally
Simplify the way we do
business
Enhancing and streamlining all processes to ensure that clients find it easy to do business
with us
Pursue select international
opportunities to grow our
reinsurance business
Pursuing niche opportunities, diversifying risks and growing our reinsurance business to
generate stable and diversified earnings
Business segments

20
In Canada, to be the #1 provider of domestic custody,
asset servicing and cash management services
Compete in offshore domicile markets as a leading
provider of fund services from centers of excellence in
Luxembourg and Ireland
Continue to deliver a high-level of investment in client-
focused technology solutions
Enhance client service and improve efficiency
Investor & Treasury Services
3,991
(1) Custody Risk European Awards 2014. (2) Global Investor/ISF magazine’s Global Custody Survey 2014. (3) Excludes a loss of $224MM ($213MM after-tax) related to our acquisition of the
remaining 50% stake of RBC Dexia in Q3/2012. This is a non-GAAP measure. For additional information, see slide 40. (4) Excludes a loss of $44MM ($31MM after-tax) related to the
integration of Investor Services in Q2/2013. This is a non-GAAP measure. For additional information, see slide 40.
Net income ($MM)
102
339
441
556
315(3)
370(4)
2012 2013 2014 2015
Efficiency ratio
77%
75%
68%
64%
2012 2013 2014 2015
Specialist provider of asset services, custody, payments
and treasury services for financial and other institutional
investors worldwide
Top 10 global custodian by AUA
Awarded Best Custodian Overall, #1 Custodian in
North America(1), #1 Custodian in Europe, and
Transfer Agent of the Year(2)
Canadian leader in cash management, correspondent
banking and trade finance for financial institutions
Funding and liquidity management for RBC
Strategic Priorities
Business segments

21
Capital Markets
(1) Thomson Reuters Global Banking Review 2015. (2) For Q4/2015.
Net income ($MM)
1,576 1,700
2,055
2,319
2012 2013 2014 2015
Revenue by geography(2)
A premier North American investment bank with select global reach
10th largest global investment bank by fees(1)
Full suite of integrated Corporate and Investment Banking and Global Markets services
Strategically positioned in the largest financial centers, covering over 90% of global investment banking fee
pool(1)
Top talent with expertise and track record of excellence
54%
28% 13%
5%
U.S.
Full service investment
bank with equity and fixed
income sales & trading
Canada
Full suite of products and
services across all sectors
U.K./Europe
M&A advisory and
origination in key sectors
with fixed income, equity
and FX sales & trading
Asia Pacific
Primarily distribution
with select M&A
advisory and
origination
Business segments

22
Capital Markets
(1) The Economist, 2014. (2) Euromoney, 2015. (3) The Technical Analyst Awards, 2015. (4) Greenwich Associates, 2015.
Strategic Priorities
Maintain our leadership
position in Canada
Focus on long-term client relationships and leverage our global capabilities
Increase focus on product and service cross-sell, and continue to improve collaborative
efforts
Expand and strengthen
client relationships in the
U.S.
Build on our momentum and leverage broader relationships and client investments to
expand origination, advisory, and distribution
Continue to strengthen client relationships to drive cross-sell
Build on core strengths and
capabilities in U.K./Europe
and optimize performance in
Asia Pacific
Continue to grow prudently, deepen client relationships, and selectively expand geographic
and sector coverage
Optimize capital use to earn
high risk-adjusted returns on
assets and equity
Maintain mix between investment banking and lending revenue and trading revenue
Maintain disciplined diligence on the risks and costs of our business
Recent Awards
Business segments
Global #1 Trusted
Investment Bank and
#2 for Expertise and
Skills(1)
#1 for Canadian
Fixed Income
Research, Sales,
and Trading(4)
#1 for Canadian
Equity Research,
Sales, and Trading(4)
Best Investment
Bank in Canada
8 years in a row(2)
Best Bank Fixed
Income Research &
Strategy(3)
23
Capital Markets
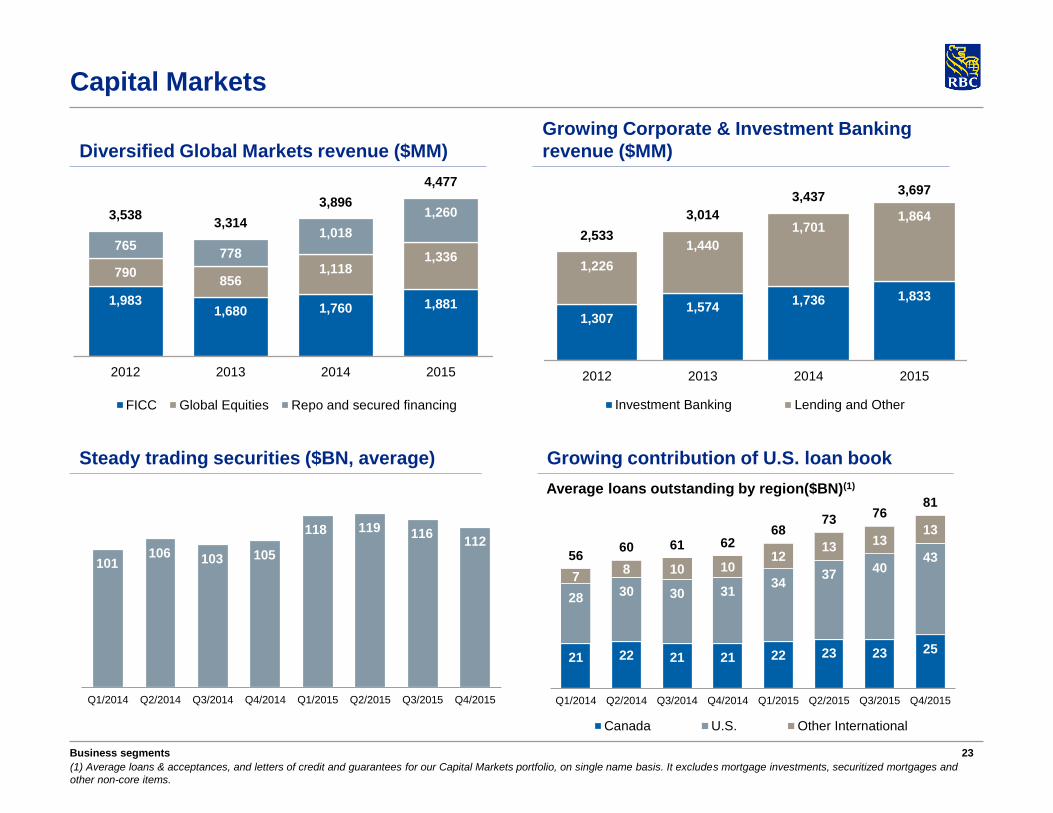
(1) Average loans & acceptances, and letters of credit and guarantees for our Capital Markets portfolio, on single name basis. It excludes mortgage investments, securitized mortgages and
other non-core items.
1,983 1,680 1,760 1,881
790 856
1,118 1,336
765 778
1,018
1,260 3,538 3,314
3,896
4,477
2012 2013 2014 2015
FICC Global Equities Repo and secured financing
1,307 1,574
1,736 1,833
1,226
1,440
1,701 1,864
2,533
3,014
3,437 3,697
2012 2013 2014 2015
Investment Banking Lending and Other
101 106 103 105
118 119 116 112
Q1/2014 Q2/2014 Q3/2014 Q4/2014 Q1/2015 Q2/2015 Q3/2015 Q4/2015
21 22 21 21 22 23 23 25
28 30 30 31
34 37
40 43
7 8 10 10
12 13
13 13
56 60 61 62
68 73
76 81
Q1/2014 Q2/2014 Q3/2014 Q4/2014 Q1/2015 Q2/2015 Q3/2015 Q4/2015
Canada U.S. Other International
Growing contribution of U.S. loan book
Growing Corporate & Investment Banking
revenue ($MM)
Average loans outstanding by region($BN)(1)
Diversified Global Markets revenue ($MM)
Steady trading securities ($BN, average)
Business segments

24
Economic Backdrop

25
(1) International Monetary Fund. (2) World Economic Forum, 2016. (3) International Monetary Fund, RBC Economics Research. (4) Statistics Canada, RBC Economics Research.
Canada’s strong fiscal position
Strong rating as a result of fiscal prudence, conservative bank lending practices and solid
economy
Lowest net debt to GDP ratio among G7 peers(1)
#1 for soundness of banks for the 8th consecutive year(2)
A diversified economy supporting balanced economic growth
20%
11%
11%
11% 9%
8%
7%
7%
4%
11%
Finance, Insurance & Real Estate
Manufacturing
Wholesale and Retail Trade
Scientific, Technical & Educational Serv.
Public Administration and Utilities
Mining, Oil & Gas Extractions
Construction
Health Care
Transportation, Warehousing
Other
Canadian GDP by Industry(4)
(August 2015)
37.8 48.4
79.9 80.3 82.9 89.4
113.5
126.0
Ca
na
da
Ge
rma
ny
U.S
.
U.K
.
G7
ave
rag
e
Fra
nce
Ita
ly
Ja
pa
n
Net Debt as % of GDP(3)
2015
Economic Backdrop

26
Economic fundamentals remain solid despite energy headwinds
The dissipation of the effects of low oil prices is expected to see headline inflation drift higher
and trend around the mid-point of the Bank of Canada’s 1-3% target range through 2016
Labour market resilience expected to persist as a strengthening in economic activity supports
ongoing hiring gains with the unemployment rate expected to resume a modest downward
trend through 2016
Headwinds emanating from the pullback of oil prices, if sustained, point to further weakness
in the oil & gas sector; however, a strengthening U.S. economy and a weak Canadian
currency are expected to be factors supporting a return to an above-potential rate of
economic growth in 2016
(1) Statistics Canada, RBC Economics Research. (2) Statistics Canada, Bureau of Labor Statistics, RBC Economics Research.
Economic Backdrop
Canadian Inflation (YoY%)(1)
Core Headline BoC Target
Unemployment (%)(2)
U.S. Canada

27
2016 Economic Outlook
Projected Economic Indicators for 2016(1)
GDP Growth Inflation Unemployment
Rate
Interest Rate
(3 mth T-bills)
Current Account
Balance/GDP(2)
Budget
Surplus/GDP(3)
Canada 2.2% 2.1% 6.7% 1.1% -2.6% 0.1%
U.S. 2.8% 2.0% 4.9% 0.95% -2.6% -2.2%
Euro Area 1.8% 1.0% 10.6% NA 3.6% -1.8%
Canada
U.S.
Euro area
(1) RBC Economics Research as of November 13, 2015 and reflect forecasts for calendar 2016. (2) European Commission, RBC Economics Research. (3) Department of Finance,
Congressional Budget Office, European Commission, RBC Economics Research.
Economic Backdrop
Economic growth in the U.S. is expected to remain solid in 2016 led by sustained growth in the domestic side of the economy; namely, consumer spending and business investment. Less drag on economic growth from net trade in 2016 is expected as the US currency is poised to stabilize
The U.S. Federal Reserve is expected to begin to raise the Fed funds rate at its December 2015 meeting as unfolding domestic developments confirm sustained progress towards achieving the Fed’s objectives of full employment and price stability
A return to positive growth in the Canadian economy in the 2nd half of 2015 is expected to persist into 2016 alongside a modest rise in crude oil prices. Firm export performance emanating from a strengthening U.S. economy is expected to be accompanied by persistent growth in household spending and a smaller, although still significant, decline in energy sector investment
A strengthening economy and attendant rise in inflation is expected to result in the Bank of Canada starting to reduce policy stimulus by raising the overnight rate in Q4/2016
Consumer spending is expected to remain a key driver of economic growth while housing market activity, nationally, will likely continue to be supported by accommodative borrowing conditions
Further improvement in the Euro zone economy is expected to be supported by a confluence of factors, namely low oil prices, past currency depreciation, improving credit conditions and less drag from fiscal consolidation
Significant monetary stimulus by the European Central Bank has curbed deflationary risks
A sluggish pace of structural reforms is expected to keep growth subdued in parts of the Euro zone
28
Canadian Housing Market

29
(1) Current regulation and lenders recourse. (2) Alberta and Saskatchewan have some limited restrictions on full recourse.
Structural backdrop to the Canadian housing market
Canada(1) U.S.(1)
Regulation
Government influences mortgage underwriting
policies through control of insurance eligibility
rules
Fully insured if loan-to-value (LTV) is over 80%
Must meet 5-year fixed rate mortgage
standards
Government-backed, on homes under $1MM
Down-payment over 20% on non-owner
occupied properties
CMHC recently announced mortgage loan
insurance premiums will rise by ~15% for
new mortgages with LTV over 90%
Re-financing cap of 80% on non-insured
Agency insured only if conforming and LTV under 80%
No regulatory LTV limit – can be over 100%
Not government-backed if private insurer defaults
Consumer
Behaviour
Mortgage interest not tax deductible
Greater incentive to pay off mortgage
Mortgage interest is tax deductible
Less incentive to pay down mortgage
Lender
Behaviour
Strong underwriting discipline; extensive
documentation
Most mortgages are held on balance sheet
Conservative lending policies have historically
led to low delinquency rates
Wide range of underwriting and documentation
requirements
Most mortgages securitized
Lenders
Recourse
Ability to foreclose on non-performing
mortgages, with no stay periods
Full recourse against borrowers(2)
Stay period from 90 days to one year to foreclose on
non-performing mortgages
Limited recourse against borrowers in key states
Canadian Housing Market

30
Legislation and policies – promoting a healthy housing market
February 2010
Borrowers must meet the standards for a five-year fixed rate mortgage
Maximum amount that can be borrowed on a mortgage refinancing lowered to 90% from 95%
Minimum down payment of 20% is required in order to qualify for government-backed mortgage insurance on non-owner-
occupied properties
March 2011
Maximum amortization on government-backed insured mortgages reduced to 30 years from 35 years
Maximum amount that can be borrowed on a mortgage refinancing lowered to 85% from 90%
July 2008
Maximum amortization on government-backed insured mortgages reduced to 35 years from 40 years
A minimum 5% down payment is required in order to qualify for government-backed insured mortgages
Additional – minimum credit score requirements, new loan documentation standards, setting a maximum of 45% on
borrowers total debt service ratio
April 2014
CMHC discontinued offering mortgage insurance on second homes and to self-employed individuals without 3rd party
income validation
July 2012
Maximum amortization on government-backed insured mortgages reduced to 25 years from 30 years
Maximum amount that can be borrowed on a mortgage refinancing lowered to 80% from 85%
CMHC insurance availability is limited to homes with a purchase price of <$1 million lowered from $3.5 million
Set the borrower’s maximum gross debt service ratio at 39% and maximum total debt service ratio at 44%
Canadian Housing Market
31
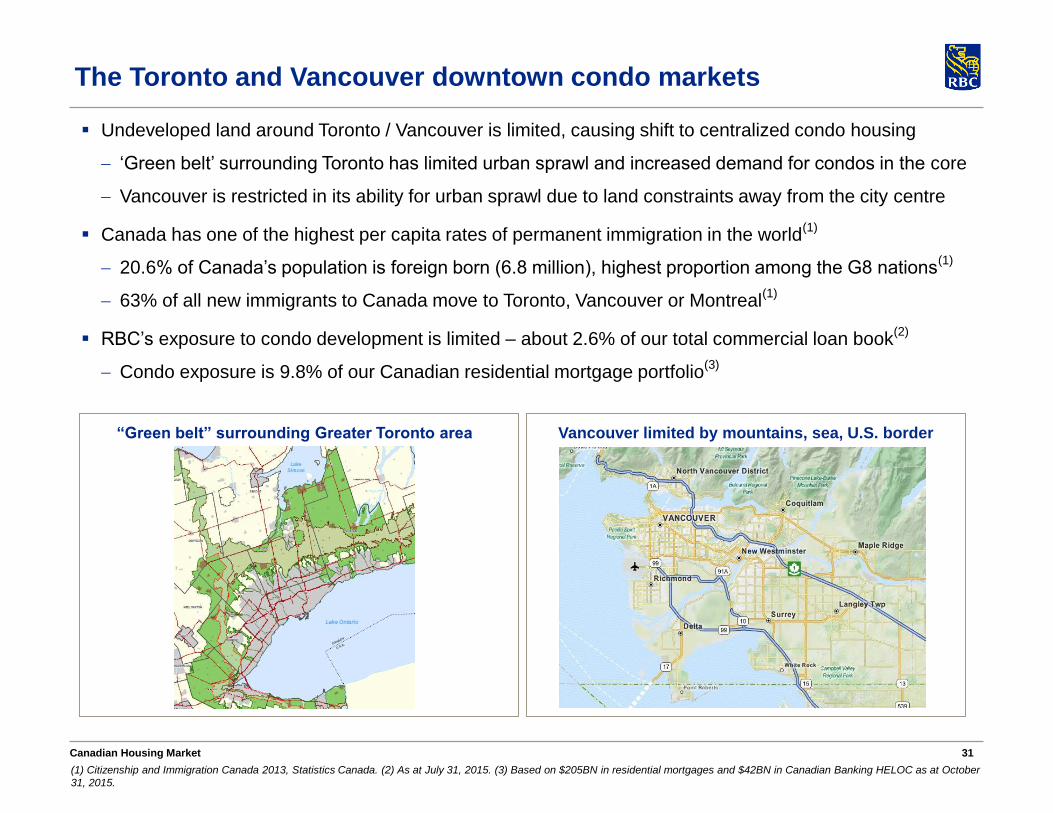
Undeveloped land around Toronto / Vancouver is limited, causing shift to centralized condo housing
‘Green belt’ surrounding Toronto has limited urban sprawl and increased demand for condos in the core
Vancouver is restricted in its ability for urban sprawl due to land constraints away from the city centre
Canada has one of the highest per capita rates of permanent immigration in the world(1)
20.6% of Canada’s population is foreign born (6.8 million), highest proportion among the G8 nations(1)
63% of all new immigrants to Canada move to Toronto, Vancouver or Montreal(1)
RBC’s exposure to condo development is limited – about 2.6% of our total commercial loan book(2)
Condo exposure is 9.8% of our Canadian residential mortgage portfolio(3)
The Toronto and Vancouver downtown condo markets
“Green belt” surrounding Greater Toronto area Vancouver limited by mountains, sea, U.S. border
(1) Citizenship and Immigration Canada 2013, Statistics Canada. (2) As at July 31, 2015. (3) Based on $205BN in residential mortgages and $42BN in Canadian Banking HELOC as at October
31, 2015.
Canadian Housing Market

32
Canadian housing market fundamentals remain sound
Balanced demand-supply conditions continue to prevail in half of the markets in Canada with the exceptions being
some markets in British Columbia and those in and around the Greater Toronto region
Housing affordability is at reasonable levels across Canada with pressure concentrated in a few local markets
Steady population growth, household income gains and low interest rates are supporting balanced conditions
A slowdown in housing market activity in oil-producing provinces (Alberta, Saskatchewan) is being offset by strength
in other regions of the country (net oil consumers) with support from highly stimulative borrowing conditions
Despite recent declines in resale activity in Calgary and Edmonton, these markets remain in balanced territory
Over the forecast horizon, we expect that an erosion of housing affordability on account of rising interest rates will
weigh on overall housing activity, which is expected to gradually ease to lower, more sustainable levels
Relatively stable household debt service cost ratios, with little movement towards higher risk
Lenders maintaining strong underwriting discipline and require extensive documentation
Most mortgages being held on balance sheet and conservative lending policies have led to low delinquency rates
Sales-to-New Listings Ratio(1)
(Residential unit sales to new residential listings)
(1) Canadian Real Estate Association, RBC Economics Research. (2) Statistics Canada, RBC Economics Research. PDI: Personal Disposable Income.
Household Debt Service Costs(2)
(Mortgage & non-mortgage principal & interest payments
as a % of PDI)
Canadian Housing Market

33
Canadians have significant equity ownership in their homes
U.S. Canada
(1) Statistics Canada, Federal Reserve Board, RBC Economics Research. (2) Bank of Canada, RBC Economics Research. (3) Canadian Bankers' Association, Mortgage Bankers’ Association,
RBC Economics Research.
Canadians carry a significant and stable amount of
equity in their homes
The pace of mortgage accumulation continues to
trend within a range well below the double-digit
rates of growth recorded in the mid-2000s
Mortgage delinquency rates remain low in Canada
and have been stable throughout recent credit
cycles
RBC monitors its residential mortgage and broader
retail portfolios closely and performs stress tests
for dramatic movements in house prices, GDP,
interest rates and unemployment rates
U.S. Canada
Equity Ownership(1)
(Owners’ equity as a % of total value of residential real estate assets)
Mortgage Delinquencies(3)
(Mortgages 90+ days in arrears as a % of total mortgages)
Residential Mortgage Growth(2)
(Year-over-year % change)
Canadian Housing Market

34
Appendix

35 Investor Relations – Fixed Income Presentation
128%
coverage
Assets
40% Liquid
Assets
$1,074BN (as at October 31, 2015)
Loan portfolio
represents 44%
of total balance
sheet
excluding
allowances and
including sold
MBS as per
IFRS
Liabilities & Capital
53%
Capital +
Retail-
related
funding
31%
Wholesale
funding
121%
coverage
Derivatives are
on balance
sheet as per
IFRS
Strength of a high quality liquid balance sheet
Business & Government Deposits
Personal Deposits
Capital
Other Liabilities(2)
Securitization(1) and Covered Bonds
Secured Funding
Unsecured Funding Cash and Reverse Repos
Trading & Investment Securities
Residential Mortgages(1)
Other Retail Loans
Wholesale Loans
Other Assets(2)
(1) Securitized agency MBS are on balance sheet as per IFRS. (2) Other assets include $106BN of derivatives related assets, largely offset by derivatives related liabilities in Other
liabilities. Under IFRS derivative amounts with master netting agreements cannot be offset and the gross derivative assets and liabilities are reported on balance sheet.

36 Investor Relations – Fixed Income Presentation
Oct 2010
Oct 2015
HISA(2) $18 $29
Advisory Channel Deposits(3) $13 $34
Other Personal Deposits $131 $155
Business Deposits $131 $205
Total Deposits $293 $422
30
50
70
90
110
130
150
170
Jan-07 Dec-07 Nov-08 Oct-09 Sep-10 Aug-11 Jul-12 Jun-13
Avera
ge
Bala
nc
es ($
B C
AD
)
5.98% CAGR
9.42% CAGR
Cdn Business Deposits
Cdn Personal Deposits
Gaining Canadian market share
Initiated successful strategies to grow relationship
deposit base
Leveraging our Wealth Management network with
targeted strategies and product development
Canadian relationship deposits continue to grow at
a faster pace than the market
Between October 2010 and June 2015, our share
of the Canadian personal deposit market has
grown from 18.7% to 20.1%(1)
RBC Relationship Deposits
($BN)
(1) Canadian deposit market share is based on Canadian Banking personal deposits and Wealth Management advisory channel deposits. Source: OSFI (M4 report). (2) High Interest Savings
Account; Includes CAD and USD deposits. (3) Sourced largely from RBC Wealth Management network.
RBC Canadian Deposits
($BN)
Leveraging our international reach
Strong deposit growth in our International Wealth
Management and Investor Services platforms
Leveraging the strength of our distribution channels
Strong deposit growth is a result of successful initiatives & strong distribution network
Jun-15
37 Investor Relations – Fixed Income Presentation
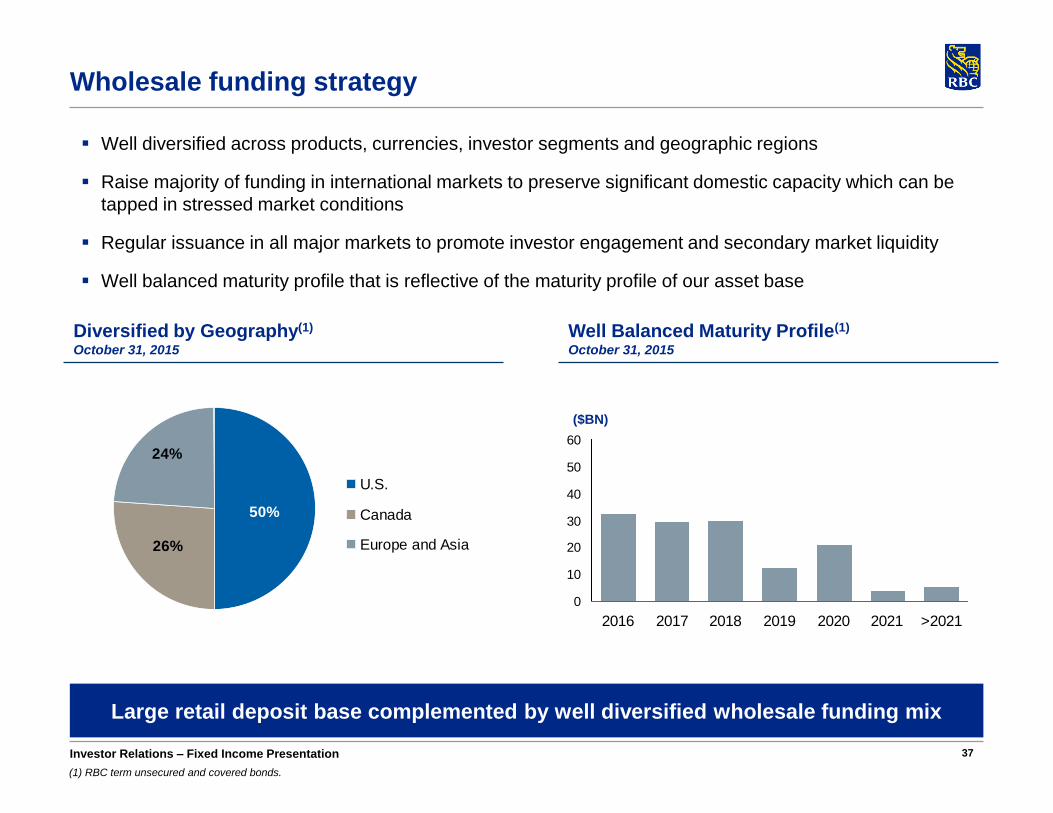
Wholesale funding strategy
50%
26%
24%
U.S.
Canada
Europe and Asia
(1) RBC term unsecured and covered bonds.
Well diversified across products, currencies, investor segments and geographic regions
Raise majority of funding in international markets to preserve significant domestic capacity which can be
tapped in stressed market conditions
Regular issuance in all major markets to promote investor engagement and secondary market liquidity
Well balanced maturity profile that is reflective of the maturity profile of our asset base
Diversified by Geography(1)
October 31, 2015
Well Balanced Maturity Profile(1)
October 31, 2015
0
10
20
30
40
50
60
2016 2017 2018 2019 2020 2021 >2021
Large retail deposit base complemented by well diversified wholesale funding mix
($BN)
38 Investor Relations – Fixed Income Presentation
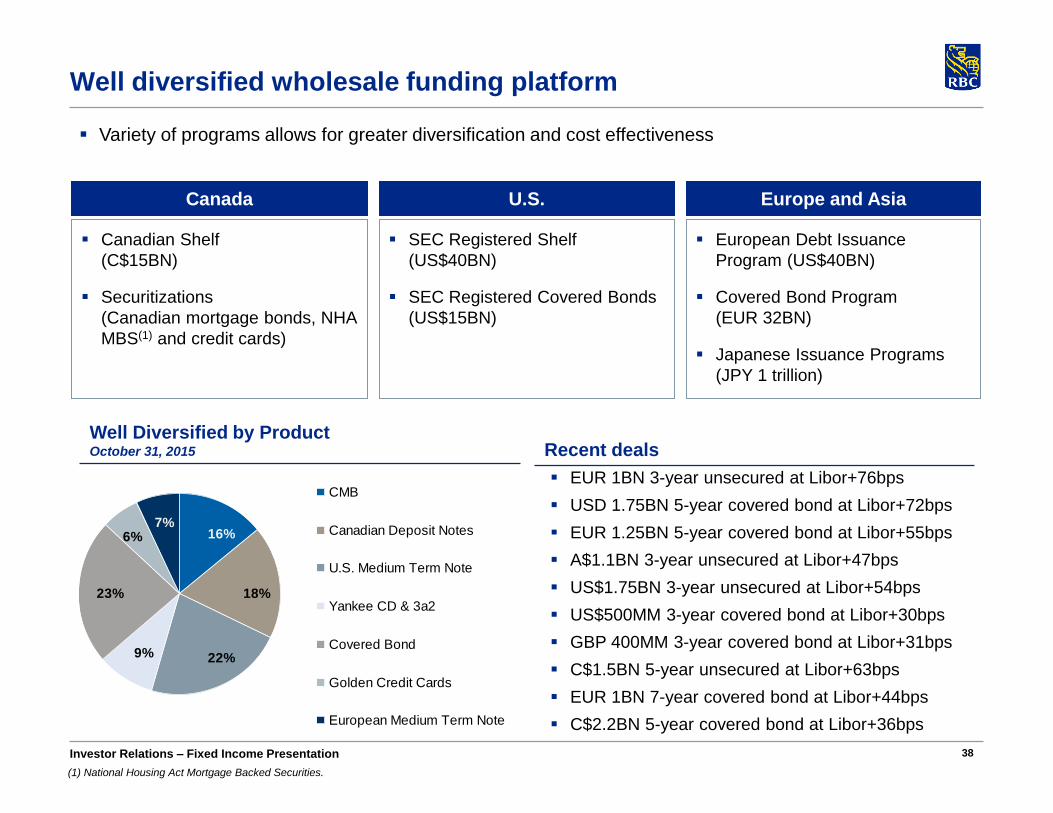
7%6%
23%
9% 22%
18%
16%
CMB
Canadian Deposit Notes
U.S. Medium Term Note
Yankee CD & 3a2
Covered Bond
Golden Credit Cards
European Medium Term Note
Variety of programs allows for greater diversification and cost effectiveness
Well diversified wholesale funding platform
(1) National Housing Act Mortgage Backed Securities.
Well Diversified by Product
October 31, 2015 Recent deals
SEC Registered Shelf
(US$40BN)
SEC Registered Covered Bonds
(US$15BN)
U.S.
European Debt Issuance
Program (US$40BN)
Covered Bond Program
(EUR 32BN)
Japanese Issuance Programs
(JPY 1 trillion)
Europe and Asia
Canadian Shelf
(C$15BN)
Securitizations
(Canadian mortgage bonds, NHA
MBS(1) and credit cards)
Canada
EUR 1BN 3-year unsecured at Libor+76bps
USD 1.75BN 5-year covered bond at Libor+72bps
EUR 1.25BN 5-year covered bond at Libor+55bps
A$1.1BN 3-year unsecured at Libor+47bps
US$1.75BN 3-year unsecured at Libor+54bps
US$500MM 3-year covered bond at Libor+30bps
GBP 400MM 3-year covered bond at Libor+31bps
C$1.5BN 5-year unsecured at Libor+63bps
EUR 1BN 7-year covered bond at Libor+44bps
C$2.2BN 5-year covered bond at Libor+36bps

39
RBC Covered Bond Program
U.S. Registration
U.S. covered bond program is SEC registered
Issued US$13.75BN across seven deals since
September 2012
Index eligible and Trace eligible
Strong Issuer
Largest Canadian bank by market capitalization
Strong credit ratings
Well capitalized and consistent historical
profitability
Well diversified business mix
Canadian Legislative Changes
Canadian legislation protects claims of covered
bond investors and overrides any other
conflicting law related to bankruptcy and
insolvency
Extensive regulatory oversight and pool audit
requirements
Mandatory property value indexation
Globally Active
Active program in six different currencies: EUR,
CAD, USD, CHF, AUD and GBP
C$33.6BN currently outstanding
Seven benchmark transactions since January 2015
USD 1.75BN 5-year EUR 1.0BN 7-year
EUR 1.25BN 5-year C$2.2BN 5-year
GBP 400MM 3-year US$2.0BN 5-year
US$500MM 3-year
Investor Relations – Fixed Income Presentation

40
Note to users
Amy Cairncross, VP & Head (416) 955-7803
Lynda Gauthier, Managing Director (416) 955-7808
Stephanie Phillips, Director (416) 955-7809
Brendon Buckler, Associate Director (416) 955-7807
www.rbc.com/investorrelations
Investor Relations Contacts
We use a variety of financial measures to evaluate our performance. In addition to generally accepted
accounting principles (GAAP) prescribed measures, we use certain key performance and non-GAAP
measures we believe provide useful information to investors regarding our financial condition and result of
operations. Readers are cautioned that key performance measures, such as ROE and non-GAAP measures
such as earnings and revenue excluding Corporate Support, earnings excluding specified items related to
sale of RBC Jamaica as previously announced on January 29, 2014, and provisions related to post-
employment benefits and restructuring charges in the Caribbean, release of foreign currency translation
adjustment (CTA) that was previously booked in other components of equity, revenue excluding FV adjusted
net interest margin and Capital Markets trading and geographic revenue excluding specified items do not
have any standardized meanings prescribed by GAAP, and therefore are unlikely to be comparable to similar
measures disclosed by other financial institutions.
Additional information about our ROE and non-GAAP measures can be found under the “Key performance
and non-GAAP measures” section of our 2015 Annual Report.
Definitions can be found under the “Glossary” sections in our Q4/2015 Supplementary Financial Information
and our 2015 Annual Report.