Rousselet, G. A., Ince, R. A.A., van Rijsbergen, N. J ...eprints.gla.ac.uk/99393/1/99393.pdf ·...
25
s Rousselet, G. A., Ince, R. A.A., van Rijsbergen, N. J., and Schyns, P. G. (2014) Eye coding mechanisms in early human face event-related potentials. Journal of Vision, 14 (13). Art. 7. Copyright © 2014 ARVO http://eprints.gla.ac.uk/99393 Deposited on: 30 January 2015 Enlighten – Research publications by members of the University of Glasgow http://eprints.gla.ac.uk
Transcript of Rousselet, G. A., Ince, R. A.A., van Rijsbergen, N. J ...eprints.gla.ac.uk/99393/1/99393.pdf ·...

s
Rousselet, G. A., Ince, R. A.A., van Rijsbergen, N. J., and Schyns, P. G. (2014) Eye coding mechanisms in early human face event-related potentials. Journal of Vision, 14 (13). Art. 7. Copyright © 2014 ARVO http://eprints.gla.ac.uk/99393 Deposited on: 30 January 2015
Enlighten – Research publications by members of the University of Glasgow
http://eprints.gla.ac.uk

Eye coding mechanisms in early human face event-relatedpotentials
Guillaume A. Rousselet # $Institute of Neuroscience and Psychology, University of
Glasgow, Glasgow, UK
Robin A. A. InceInstitute of Neuroscience and Psychology, University of
Glasgow, Glasgow, UK
Nicola J. van RijsbergenInstitute of Neuroscience and Psychology, University of
Glasgow, Glasgow, UK
Philippe G. SchynsInstitute of Neuroscience and Psychology, University of
Glasgow, Glasgow, UK
In humans, the N170 event-related potential (ERP) is anintegrated measure of cortical activity that varies inamplitude and latency across trials. Researchers oftenconjecture that N170 variations reflect corticalmechanisms of stimulus coding for recognition. Here, tosettle the conjecture and understand corticalinformation processing mechanisms, we unraveled thecoding function of N170 latency and amplitudevariations in possibly the simplest socially importantnatural visual task: face detection. On each experimentaltrial, 16 observers saw face and noise pictures sparselysampled with small Gaussian apertures. Reverse-correlation methods coupled with information theoryrevealed that the presence of the eye specificallycovaries with behavioral and neural measurements: theleft eye strongly modulates reaction times and lateralelectrodes represent mainly the presence of thecontralateral eye during the rising part of the N170, withmaximum sensitivity before the N170 peak.Furthermore, single-trial N170 latencies code moreabout the presence of the contralateral eye than N170amplitudes and early latencies are associated with fasterreaction times. The absence of these effects in controlimages that did not contain a face refutes alternativeaccounts based on retinal biases or allocation ofattention to the eye location on the face. We concludethat the rising part of the N170, roughly 120–170 mspost-stimulus, is a critical time-window in human faceprocessing mechanisms, reflecting predominantly, in aface detection task, the encoding of a single feature: thecontralateral eye.
Introduction
Electrophysiological studies of human recognitionmechanisms have identified face preferential responseswithin 200 ms following stimulus onset. The mostimportant of these are the N170 event-related potential(ERP) measured from scalp recordings (Rossion &Jacques, 2008) and the N200 ERP measured fromintracranial recordings (Allison, Puce, Spencer, &McCarthy, 1999; Rosburg et al., 2010; Rossion &Jacques, 2008). Irrespective of recognition task, pref-erential responses typically correspond to larger ERPamplitudes to face pictures compared with other objectcategories (Rousselet, Gaspar, Wieczorek, & Pernet,2011; Rousselet, Husk, Bennett, & Sekuler, 2008).However, such coarse characterization under-specifies agenuine mechanistic account of the N170, leading toconsiderable debate about the functional role andtiming of the underlying mechanisms. Simply stated, wedo not fully understand the specific informationprocessing mechanisms that the N170 reflects. Withintegrated ERP measurements, these mechanisms canreflect processing of a succession of specific informationcontents, i.e., a succession of image features thatmodulate N170 ERP amplitudes, to a different degreeand at different time points. Understanding such adetailed relationship between information content andERP modulations is a necessary prerequisite tounderstand the transformations of visual informationthat the visual system operates en route to recogni-
Citation: Rousselet, G. A., Ince, R. A. A., van Rijsbergen, N. J., & Schyns, P. G. (2014). Eye coding mechanisms in early human faceevent-related potentials. Journal of Vision, 14(13):7, 1–24, http://www.journalofvision.org/content/14/13/7, doi:10.1167/14.13.7.
Journal of Vision (2014) 14(13):7, 1–24 1http://www.journalofvision.org/content/14/13/7
doi: 10 .1167 /14 .13 .7 ISSN 1534-7362 � 2014 ARVOReceived May 1, 2014; published November 10, 2014

tion—i.e., the information processing mechanisms(Schyns, Gosselin, & Smith, 2009).
To understand these mechanisms, researchers havesought to specify the visual information associated withsingle-trial N170 responses. Classification images candepict these associations because they represent thecovariations between pixel visibility and the subjects’brain and behavioral responses (Murray, 2011, 2012).For instance, bubbles is one of several techniques(Haig, 1985) that produce classification images viareverse correlation (Gosselin & Schyns, 2001). Withbubbles, contiguous face image pixels are randomlysampled with Gaussian apertures. Bubbles revealedthat the presence of the contralateral eye initiallymodulates N170 amplitudes at left and right occipital-temporal electrodes, followed by the features diagnosticof the task—e.g., the mouth to categorize a ‘‘happy’’face (Schyns, Jentzsch, Johnson, Schweinberger, &Gosselin, 2003; Schyns, Petro, & Smith, 2007; Smith,Gosselin, & Schyns, 2004, 2007; van Rijsbergen &Schyns, 2009). Precedence of the contralateral eyesuggests that cortical face mechanisms could use the eyeas an anchor from which the face is scanneddownwards, until diagnostic information is reachedand integrated (Schyns et al., 2007). In other ERPstudies, in which face features were defined a priori asregions of interest, the eyes alone elicited large N170s(Bentin, Allison, Puce, Perez, & McCarthy, 1996; Itier,Alain, Sedore, & McIntosh, 2007; Nemrodov & Itier,2011). Computational models have also highlighted theimportance of the eyes in face detection (Tsao &Livingstone, 2008; Ullman, Vidal-Naquet, & Sali,2002). Finally, recordings in monkey face patchessuggested the prominence of the eye area in drivingearly neuronal responses (Freiwald, Tsao, & Living-stone, 2009; Issa & DiCarlo, 2012; Ohayon, Freiwald,& Tsao, 2012). A recent bubbles study in monkeysrevealed that early responses from posterior and middleface patches are tuned to the contralateral eye (Issa &DiCarlo, 2012), in a size- and translation-invariantmanner, suggesting that the early response is acandidate for local processing of features in the eyeregion.
The reviewed computational models and human andmonkey electrophysiology evidence lead to a straight-forward prediction: Early neuronal activity in humansshould reflect early coding mechanisms of the contra-lateral eye in a face detection task, with consequencesfor behavioral decisions (e.g., faster and more accurateresponses). To test this prediction and understandcoding mechanisms over the parameters of early humanbrain responses (i.e., N170 amplitude and latency), wedesigned an experiment in which observers discrimi-nated faces from noise textures, both sparsely maskedby Gaussian apertures. We contrasted noise textureslacking sharp edges with faces to ensure that any face
feature was sufficient to perform the task. Sparsesampling of the images with Gaussian aperturesrevealed contiguous pixel areas without introducingsharp discontinuities. To measure the associationbetween randomly sampled image pixels and behaviorand brain activity, we used mutual information, arobust measure of association (Cover & Thomas,2006). As predicted, reverse correlation coupled withinformation theoretic analyses revealed that presence ofthe contralateral eye led to larger and earlier N170s, aswell as to shorter reaction times and more accurateresponses.
Methods
Subjects
The study comprised 16 subjects: nine females, 15right handed, median age¼ 23 (min 20, max 36). Priorto the experiment, all subjects read a study informationsheet and signed an informed consent form. Theexperiment was approved by the local ethics committeewith approval no. CSE00740. Subjects did not reportany eye condition, history of mental illness, takingpsychotropic medications, or suffering from anyneurological condition. Subjects’ visual acuity andcontrast sensitivity were assessed in the lab on the dayof the first session using a Colenbrander mixed contrastcard set and a Pelli-Robson chart. All subjects hadnormal or corrected-to-normal vision and contrastsensitivity of 1.95 and above (normal score). Subjectswere compensated £6/hr for their participation.
Stimuli
Stimuli were gray-scale pictures of faces and textures(Figure 1). Faces from 10 identities were front viewphotographs, oval cropped to remove hair, and pastedon a uniform gray background (Gold, Bennett, &Sekuler, 1999). A unique image was presented on eachtrial by introducing noise (70% phase coherence) intothe face images (Rousselet, Pernet, Bennett, & Sekuler,2008). Textures were face images with random phase(0% phase coherence). As a result of phase randomi-zation, these textures lacked local edges characteristicsof faces, so that all face features were diagnostic, i.e.,they were all sufficient to detect faces. All stimuli hadan amplitude spectrum set to the mean amplitude of allfaces. All stimuli also had the same mean pixelintensity, 0.2 contrast variance, spanned 9.38 · 9.38 ofvisual angle. The face oval was 4.98 · 7.08 of visualangle.
Journal of Vision (2014) 14(13):7, 1–24 Rousselet, Ince, van Rijsbergen, & Schyns 2

Face and noise pictures were revealed through 10two-dimensional Gaussian apertures (sigma ¼ 0.368)randomly positioned with the constraint that the centerof each aperture remained in the face oval and was at aunique position. In the rest of this article, we refer tothese masks with Gaussian apertures as bubble masks.Information sampling was dense enough to reveal facefeatures, but sparse enough to prevent the task frombeing trivial.
Experimental procedure
During the experiment, subjects sat in a soundattenuated booth and rested their head on a chin rest.Viewing distance measured from the chin rest to themonitor screen was 80 cm. At the beginning of each oftwo experimental sessions, subjects were fitted withhead cap and EEG electrodes. Stimuli were displayedon a Samsung SyncMaster 1100Mb monitor (600 · 800pixels; height and width 228 · 288 of visual angle; 85-Hz refresh rate). Subjects were given experimentalinstructions including a request to minimize blinkingand movement. Subjects were asked to categorizeimages of faces and textures as fast and accurately aspossible: they pressed one for face and two for texture,on the numerical pad of a keyboard, using the indexand middle fingers of their dominant hand. At the endof every block they received feedback on their overallperformance and, after Block 1, on their performancein the previous block: Median reaction times andpercent correct remained on the screen until subjectspress a key to move on to the next block. Before the
main experiment, subjects performed a practice blockwith images without bubble masks, to minimize spatialuncertainty. After the practice block, subjects per-formed 11 blocks of the images with bubble masks. All12 blocks had the same structure: they consisted of 100trials, with 10 face identities, each repeated five times,each time with a unique noise field, and 50 unique noisetextures. Subjects could take a break at the end of eachblock. The whole session consisted of 1,200 trials,including 100 practice trials. All subjects participated intwo experimental sessions, bringing their total ofbubble trial number to 2,200. Each session lasted about60 to 75 min, including breaks, excluding the timerequired to apply the EEG electrodes prior to actualtesting.
Each trial began with a small black fixation cross(0.48 · 0.48 of visual angle) displayed at the center ofthe monitor screen for a random time interval of about500–1000 ms, followed by an image of a face or atexture presented for seven frames (;82 ms). A blankgray screen followed stimulus presentation until sub-ject’s response. The fixation cross, the stimulus, and theblank response screen were all displayed on a uniformgray background with mean luminance ; 43 cd/m2.
EEG recording and preprocessing
EEG data were recorded at 512 Hz using an activeelectrode amplifier system (BIOSEMI) with 128 elec-trodes mounted on an elastic cap. Four additionalelectrodes were placed at the outer canthi and belowthe eyes.
Figure 1. Examples of stimuli. Row 1 shows the 10 face identities used throughout the experiment. Row 2 shows examples of textures.
Rows 3 and 4 show the same faces and textures with examples of masks with Gaussian apertures. The fixation cross fell around the
midline, on the nose, thus coinciding with natural saccade landing positions (Bindemann, Scheepers, & Burton, 2009; Hsiao & Cottrell,
2008).
Journal of Vision (2014) 14(13):7, 1–24 Rousselet, Ince, van Rijsbergen, & Schyns 3

EEG data were preprocessed using Matlab 2013a,RRID:nlx_153,890, and the open-source toolboxEEGLAB version 11, RRID:nif-0000-00076 (Delormeet al., 2011). Data were first re-referenced off-line toan average reference. Data were then band-passfiltered between 1 Hz and 30 Hz using a noncausalfourth order Butterworth filter. This high-pass non-causal filtering improves independent componentanalysis (ICA) but can potentially distort onsets(Acunzo, Mackenzie, & van Rossum, 2012; Rousselet,2012; Widmann & Schroger, 2012). Therefore, wechecked for timing distortions by creating a seconddataset in which data were preprocessed with fourthorder Butterworth filters: high-pass causal filter at 2Hz and low-pass noncausal filter at 30 Hz. All ourresults were virtually identical for the two filtersettings, except for onset timings, as expected. Datafrom the two datasets were then downsampled to 500Hz, and epoched between �300 and 1000 ms aroundstimulus onset. Baseline correction was performedusing the average activity between time 0 and�300 msonly for the high-pass causal filtered data set; for thenoncausal filtered dataset, the channel mean wasremoved from each channel instead (Groppe, Makeig,& Kutas, 2009). Noisy electrodes and trials weredetected by visual inspection of the noncausal datasetand rejected from the two datasets on a subject-by-subject basis. The reduction of blink and eye-movement artifacts was performed using ICA, asimplemented in the infomax algorithm from EE-GLAB. ICA was performed on the noncausal filtereddataset and the ICA weights were then applied to thecausal filtered dataset (on a subject by subject basis) inorder to ensure removal of the same components fromboth datasets (Ullsperger & Debener, 2010). Compo-nents representing blinks and eye movements wereidentified by visual inspection of their topographies,time-courses and amplitude spectra. After rejection ofartifactual components (median ¼ 4; min ¼ 1; max ¼10), baseline correction was performed again, anddata epochs were removed based on an absolutethreshold value larger than 100 lV and the presence ofa linear trend with an absolute slope larger than 75 lVper epoch and R2 larger than 0.3. The median numberof bubble trials accepted for analysis was, out of1,100: face trials ¼ 1,090 [min: 1,074, max: 1,098];noise trials ¼ 1,090 [min: 1,057, max: 1,100]. Finally,we computed single-trial spherical spline currentsource density (CSD) waveforms using the CSDtoolbox (Kayser & Tenke, 2006; Tenke & Kayser,2012). CSD waveforms were computed using param-eters 50 iterations, m ¼ 4, lambda ¼ 1.0e-5. The headradius was arbitrarily set to 10 cm, so that the ERPunits in all figures are lV/cm2. The CSD transforma-tion is a spatial high-pass filtering of the data, whichsharpens ERP topographies and reduces the influence
of volume-conducted activity. CSD waveforms alsohave the advantage of being reference free.
Electrode selection
For each subject, we proceeded in two steps. First,we computed classic ERPs by averaging EEG responsesseparately for all face bubble trials and all noise bubbletrials and then subtracting the resulting ERPs. Fromthese ERP differences we selected posterior-lateral lefthemisphere (LE), and right hemisphere (RE) electrodeswith the constraint that the electrodes displayed thelargest N170—i.e., local minimum ERP differencearound 150–220 ms. Thus the electrode selection wasdifferent across subjects (Foxe & Simpson, 2002;Rousselet & Pernet, 2011). However, not surprisingly,all the electrodes were A10/B7 (PO7/PO8) or theirimmediate neighbors, electrode locations typicallyassociated with the N170. To this electrode selection,we added four posterior midline electrodes: from top tobottom CPz, Pz, POz, Oz. These electrodes have beenassociated with task-relevant feature sensitivity, possi-bly reflecting perceptual decisions (Schyns, Thut, &Gross, 2011; Smith et al., 2004; Smith, Gosselin, &Schyns, 2006).
Statistical analyses
Analysis framework
Here, we applied mutual information (henceforth,MI) in two categories of analyses (green and red linksin Figure 2). First, we used MI to reveal the imagepixels statistically associated with behavioral (greenbox) and EEG modulations (red box); we refer to thisapproach as the forward analysis. It is equivalent tothe reverse-correlation technique used in previousEEG studies (Schyns et al., 2003; Schyns et al., 2007;Smith et al., 2004) because it reveals the imagelocations statistically associated with fluctuations inbehavioral or EEG response distributions. Second(not illustrated in Figure 2), we used MI to reveal theEEG components associated with specific imageparts; we refer to this approach as the reverse analysis(Smith et al., 2004). Statistical analyses were per-formed in Matlab 2013a and 2013b. For groupanalyses, the mean was used as a measure of centraltendency in most cases, except for some descriptivestatistics and for the N170 latency, for which we usedthe Harrell-Davis estimate of the median (Wilcox,2012). Throughout this paper, square brackets indi-cate 95% confidence intervals computed using thepercentile bootstrap technique, with 1,000 bootstrapsamples.
Journal of Vision (2014) 14(13):7, 1–24 Rousselet, Ince, van Rijsbergen, & Schyns 4

Mutual information
In single subjects, we used mutual information (MI),
to quantify the relationship existing between the
variables of interest: sampled image pixels and behav-
ioral and EEG responses to the pixels—we detail the
specific measurements below and illustrate the overallframework in Figure 2. We used MI because it is anonparametric (i.e., model free) measurement thatprecisely quantifies (in bits) the dependence, whetherlinear or nonlinear, between pairs of variables (Fair-hall, Shea-Brown, & Barreiro, 2012; Ince, Petersen,
Figure 2. Framework to analyze information processing mechanisims. Colored links represent the different information theoretic
quantities computed between information samples (obtained with bubbles from face pictures), behavioral measurements (reaction
times and accuracy), and brain measurements (single trial EEG measured at three sensors, left hemisphere electrode [LE], and right
hemisphere electrode [RE] and Oz). Colored boxes represent three outcomes of our computations: in green, information values
between samples and categorization behavior; in red, schematic information values between samples and single-trial distributions of
brain activity at different sensors and time points; in blue, schematic information values between brain activity and behavior (reaction
times and face identification accuracy). In the red box, the right eye is shown as a green disk, the left eye an orange disk, and the
mouth as a yellow oval.
Journal of Vision (2014) 14(13):7, 1–24 Rousselet, Ince, van Rijsbergen, & Schyns 5

Swan, & Panzeri, 2009; Magri, Whittingstall, Singh,Logothetis, & Panzeri, 2009; Panzeri, Brunel, Logo-thetis, & Kayser, 2010; Schyns et al., 2011). Directestimation of mutual information between discretevariables from limited amounts of data results in asystematic upward bias. Whereas several techniquesexist to correct for this bias we do not employ themhere (Panzeri, Senatore, Montemurro, & Petersen,2007). Instead, we use MI as the effect size of astatistical test of independence (Ince, Mazzoni, Bartels,Logothetis, & Panzeri, 2012).
To compute MI, we first grouped the data from eachbehavioral, EEG, and image pixel variable into bins.Here, we used three equiprobable bins—using four,five, or six bins did not change the results but increasedMI values (due to increased bias). At first glance, theuse of such a small number of bins may seem a crudeapproximation of the signal, but the use of equiprob-able bins effectively makes the resulting mutualinformation value a robust rank statistic. We havefound that this makes it ideally suited to the propertiesof the EEG signal given its relatively low signal-to-noise ratio, large amplitude differences across subjects,and so forth. We calculated MI directly from thestandard definition (Ince, Mazzoni, Petersen, & Pan-zeri, 2010), using the following formula:
IðBi;RÞ ¼X
b;r
Pðb; rÞlog2
Pðb; rÞPðbÞPðrÞ; ð1Þ
where Bi represents the bubble mask value (pixelvisibility) at pixel i and R represents the response ofinterest (either behavioral or EEG recording). P(b) isthe probability of pixel i having bubble mask fallinginside bin b (of the three equiprobable bins); P(r) is theprobability of the considered response falling inside binr, and P(b,r) is the joint probability of the coincidenceof both events. I(Bi ; R) quantifies the reduction ofuncertainty about the neural/behavioral response thatcan be gained from knowledge of the visibility of pixeli. To evaluate MI values, it is useful to consider anupper bound on the measure. The maximum MI valuein MI(X, Y) is the smallest entropy of the twovariables—i.e., the maximum uncertainty that could beremoved from X by perfect knowledge of Y, or viceversa, if their association was noiseless. When werepresent Y with two bins, e.g., as in MI(pixels; correctvs. incorrect responses), the upper bound of MI islog2(2)¼ 1 bit, assuming equally likely possibilities.Based on the average proportion correct of 93% (seeResults), the upper bound of MI is given by the entropy�0.93log2(0.93)� 0.07log2(0.07)¼ 0.3659 bit. When werepresent Y with three bins, e.g., as in MI(pixels;reaction times, and MI(pixels; ERPs), the upper boundis log2(3)¼1.585 bit. Intuitively, 1 bit of MI means thaton average, two equally likely possibilities are perfectlydiscriminated from a single observation. That is,
observation of variable X (e.g., a particular pixelintensity) allows correct prediction of variable Y (e.g., acorrect response). When the association between pixelintensities and correct versus incorrect responses isweaker, more trials need to be observed to determine ifthe response was correct or incorrect; for example avalue of 0.04 bit suggests on average 25 observationswould be required to determine which of the responseclasses was sampled.
Other measures of association could be used insteadof MI, for instance correlation techniques and gener-al(ized) linear models. However, in our view MI has anumber of advantages that justify its selection here.First, MI has the potential to detect association of anyorder, making it an excellent choice when the nature ofthe association is unknown. Second, as described abovethe binning procedure results in a statistic with robuststatistical properties, whereas alternative correlationtechniques can be strongly affected by deviation fromideal conditions (Pernet, Wilcox, & Rousselet, 2012;Rousselet & Pernet, 2012). Finally, we believe that theMI provides substantially greater statistical power forinvestigations such as this. To confirm this, weperformed a comparison between MI, Pearson’scorrelation, which estimates linear association, andSpearman’s rank correlation, which estimates mono-tonic association. We restricted this analysis to EEGresponses at 160 ms (latency of the strongest MIbetween ERP amplitudes and image pixel intensities),at the six electrodes of interest. All methods identifiedvery similar spatial regions affecting the EEG responses(results not shown). However, the MI measure ap-peared to demonstrate a much higher statisticalpower—for the strongest effects the MI value was 24/26standard deviations further away from the permutationnull distribution than that for Spearman/Pearsoncorrelation, respectively. A more rigorous systematiccomparison between such measures over a range ofdifferent experimental conditions would be an inter-esting topic for future methodological studies. Giventhat the MI is closely related (via a scale factor) to thelog-likelihood ratio significance test statistic, which bythe Neyman-Pearson lemma is the most powerful testfor a given a, we would expect the above findings tohold over any situation in which there is no fine-grainedrelationships that would be lost in the binningprocedure. Finally, for all the analyses, we included allthe trials, regardless of whether subjects were correct ornot (VanRullen, 2011).
Statistical significance of mutual information
To establish statistical significance (and control formultiple comparisons), we used a permutation testcoupled with threshold-free cluster enhancement orTFCE (Smith & Nichols, 2009). TFCE scores trans-
Journal of Vision (2014) 14(13):7, 1–24 Rousselet, Ince, van Rijsbergen, & Schyns 6

form pixel MI values to represent how they locallysupport clustering. Clustered pixels (e.g., correspondingto spatially contiguous modulating regions) will gethigher TFCE scores, whereas isolated individual pixelswon’t. This enhances the statistical power of themaximum statistics multiple comparison approach,based on the assumption that a real effect is unlikely tobe restricted to a single pixel. For permutation, weshuffled subjects’ responses 500 times while keeping thebubble masks constant. For each repetition, we derivedan MI map, TFCE-scored it, and extracted themaximum TFCE score across pixels. The 500 TFCEmaxima produced a distribution, the 95th percentile ofwhich was used as threshold for statistical comparisonwith the original TFCE scores. This procedure achieveda family-wise error rate across pixels of 0.05. The mainadvantage of TFCE is to allow inferences at the pixellevel, in contrast to cluster-based statistics that allowinferences about clusters, but not their componentpixels (Smith & Nichols, 2009). Here, TFCE parame-ters were E¼ 1, H¼ 2 and dh¼ 0.1, the default for 2-Dfields. A Matlab implementation of TFCE is availablein the LIMO EEG toolbox, RRID:nlx_155,782 (Pernet,Chauveau, Gaspar, & Rousselet, 2011; Pernet, Latinus,Nichols, & Rousselet, 2014). We computed thecentroids of the significant clusters with Matlab’sregionprops function (with option WeightedCentroid).
Results
Behavior (green link and box in Figure 2)
Subjects were fast and accurate: median of themedian reaction times¼ 383 ms [351, 409]; meanpercent correct¼ 0.93 [0.92, 0.94]. To determine imagefeatures significantly associated with reaction times(RT) and accuracy, in the forward analysis we appliedMI measures between pairs of variables:
1. MI(PIX, RT) measures in bits the associationstrength between bubble masks and subject’s RTs,computed independently for face and noise trials.
2. MI(PIX, RESP) measures the association betweenbubble masks and subject’s face versus noisebehavioral responses.
3. MI(PIX, CORRECT) measures the associationbetween bubble masks and subject’s correct versusincorrect responses.
MI(PIX, RT) revealed for all subjects a strongassociation between presence of the left eye and RT, asrevealed by significantly high MI values (Figure 3, Row1). We also found significant MI for the right eye in afew subjects. Subjects were faster on trials that revealedthe left, the right eye, or both. On noise trials, MI
values were low, mainly nonsignificant, and not clearlyclustered (Figure 3, Row 2). Thus, the relationshipbetween presence of the left eye and RT seemed to bedue to the presence of structured, high contrastelements in the eye area.
MI(PIX, CORRECT) and MI(PIX, RESP) weresignificant in a few subjects and clustered primarilyaround the left eye (Figure 3, Rows 3–5), indicating inthese subjects stronger associations between the left eyeand correct face detection responses.
Forward ERP analysis (red link and box inFigure 2)
Full scalp analysis
We removed one subject from analysis due to poorEEG signal, for a total of 15 subjects for EEG analyses.First, we consider the maximum across electrodes ofthe absolute differences between mean face bubbleERPs and mean noise bubble ERPs (Figure 4, Row 1).We computed the peak amplitudes and latencies ofERPs in a 200 ms time window following stimulusonset, after applying a 20 Hz low-pass fourth orderButterworth noncausal filter. ERP differences reveal atypical P1 ERP, with a peak shortly after 100 ms,followed by a typical N170 ERP, with a larger andmore sustained peak at 176 ms [170, 186]. ERPdifferences in practice trials without bubbles peaked at137 ms [134, 142], and in the bubble trials about 38 mslater (we consider the possible cause of this delay in theDiscussion).
Having established classic ERPs in face detection asreported in the literature, our aim is now to understandthe information processing function of the ERP signals.To this aim, we computed, for each electrode and timepoint, MI between single-trial ERP distributions andthree variables, leading to three quantities (Figure 4).
(1) MI(PIX, ERP) measures in bits the associationstrength between bubble masks and single-trial ERPsmeasured at six electrodes of interest and across all timepoints, separately for face and noise trials. For eachsubject, we derived a 3-D volume per electrode (i.e.,two image coordinates by time points). We appliedsimilar statistical thresholding methods as with behav-ior, swapping behavioral response with single-trialERPs. To remove small clusters, we applied TFCE toEEG MI images filtered by a 3-D Gaussian kernel (5 ·5 Pixels · 5 Time Points). Figure 4, Row 2, shows thatsingle-trial face ERPs strongly associate with faceinformation (as sampled by image pixels): MI(PIX,ERP) shows a sharp increase shortly after 100 ms andpeaked about 15 ms [11, 20] before the N170.
(2) MI(ERP, RT) measures the association betweensingle-trial ERPs and behavioral reaction times, sepa-rately for face and noise trials. Figure 4, Row 2 shows
Journal of Vision (2014) 14(13):7, 1–24 Rousselet, Ince, van Rijsbergen, & Schyns 7

Figure 3. Behavioral results. The first column shows the mean MI across 16 subjects. MI was much larger for face trial RT than for
noise trial RT or responses, and independent scales had to be used to visualize the results. The second column shows the number of
subjects showing significant effects at any pixel. In that column, in each plot the top left corner indicates the maximum number of
�
Journal of Vision (2014) 14(13):7, 1–24 Rousselet, Ince, van Rijsbergen, & Schyns 8
that the measure started to increase slightly afterMI(PIX, ERP), peaking slightly before the N170,followed by a large sustained period around 300–800ms, corresponding to the time window of subjects’motor responses.
(3) MI(ERP, CORRECT) measures the associationbetween single-trial ERPs and correct versus incorrectresponses. It is not shown because it was flat for allsubjects, indicating that brain activity was not statis-tically associated with correct responses.
The early ERP differences and MI around 100 mswere partly due to filter distortions, as demonstrated bytheir strong attenuation in causal filtered data (Figure4, insets). All later effects were virtually identical withthe noncausal filtered data, and were thus not due tofiltering distortions.
In noise trials, no clear peak could be identified forMI(PIX, ERP) and MI(ERP, RT) in the N170 period.There was a small MI(PIX, ERP) peak shortly after 100ms, but with a medial topography, as opposed to thelateral effects observed in face trials. Finally, consistentwith the involvement of motor related brain activity,we did observe the same long sustained period ofMI(ERP, RT) as in face trials, beyond 200 ms.
In sum, full scalp ERP analyses revealed anassociation between single-trial ERP distributions atlateral electrodes and image pixels as well as RT.Associations between ERPs and pixels were maximumaround 160 ms, before the peak of the N170, and wereabsent in noise trials. The ERP results appeared to bespecific to face trials, similar to results for behavior,and thus rule out a spatial attention bias as anexplanation of the effects.
Information content
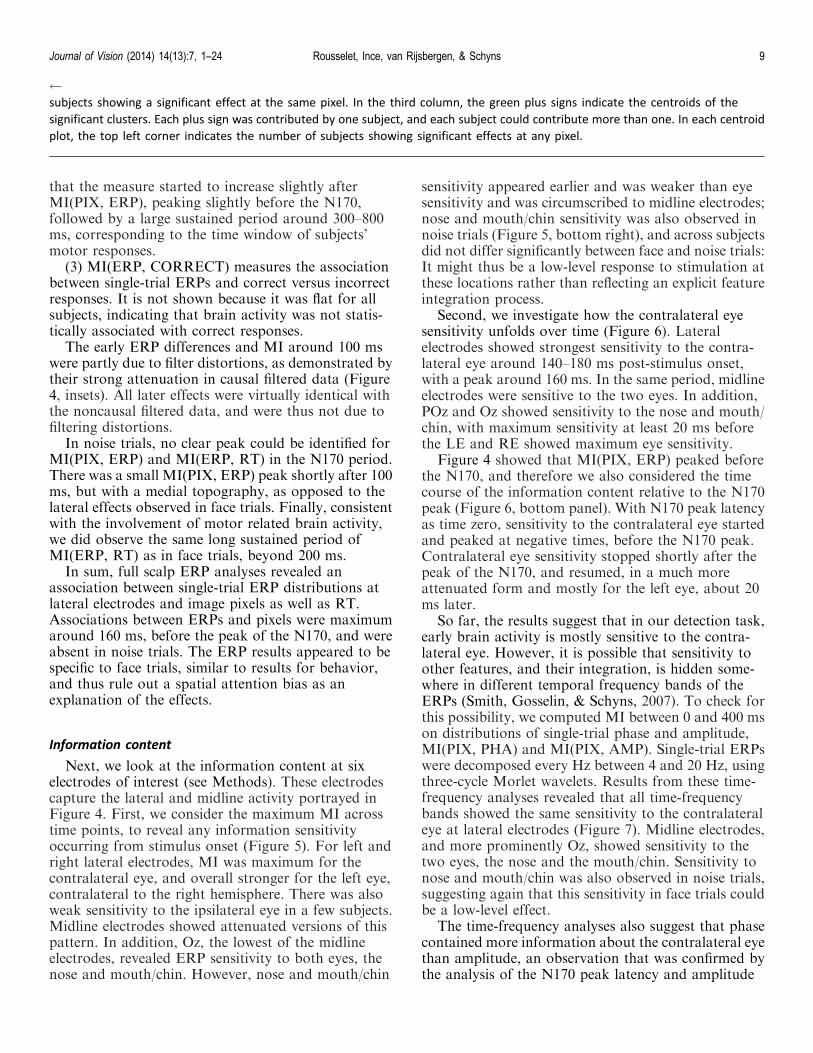
Next, we look at the information content at sixelectrodes of interest (see Methods). These electrodescapture the lateral and midline activity portrayed inFigure 4. First, we consider the maximum MI acrosstime points, to reveal any information sensitivityoccurring from stimulus onset (Figure 5). For left andright lateral electrodes, MI was maximum for thecontralateral eye, and overall stronger for the left eye,contralateral to the right hemisphere. There was alsoweak sensitivity to the ipsilateral eye in a few subjects.Midline electrodes showed attenuated versions of thispattern. In addition, Oz, the lowest of the midlineelectrodes, revealed ERP sensitivity to both eyes, thenose and mouth/chin. However, nose and mouth/chin
sensitivity appeared earlier and was weaker than eyesensitivity and was circumscribed to midline electrodes;nose and mouth/chin sensitivity was also observed innoise trials (Figure 5, bottom right), and across subjectsdid not differ significantly between face and noise trials:It might thus be a low-level response to stimulation atthese locations rather than reflecting an explicit featureintegration process.
Second, we investigate how the contralateral eyesensitivity unfolds over time (Figure 6). Lateralelectrodes showed strongest sensitivity to the contra-lateral eye around 140–180 ms post-stimulus onset,with a peak around 160 ms. In the same period, midlineelectrodes were sensitive to the two eyes. In addition,POz and Oz showed sensitivity to the nose and mouth/chin, with maximum sensitivity at least 20 ms beforethe LE and RE showed maximum eye sensitivity.
Figure 4 showed that MI(PIX, ERP) peaked beforethe N170, and therefore we also considered the timecourse of the information content relative to the N170peak (Figure 6, bottom panel). With N170 peak latencyas time zero, sensitivity to the contralateral eye startedand peaked at negative times, before the N170 peak.Contralateral eye sensitivity stopped shortly after thepeak of the N170, and resumed, in a much moreattenuated form and mostly for the left eye, about 20ms later.
So far, the results suggest that in our detection task,early brain activity is mostly sensitive to the contra-lateral eye. However, it is possible that sensitivity toother features, and their integration, is hidden some-where in different temporal frequency bands of theERPs (Smith, Gosselin, & Schyns, 2007). To check forthis possibility, we computed MI between 0 and 400 mson distributions of single-trial phase and amplitude,MI(PIX, PHA) and MI(PIX, AMP). Single-trial ERPswere decomposed every Hz between 4 and 20 Hz, usingthree-cycle Morlet wavelets. Results from these time-frequency analyses revealed that all time-frequencybands showed the same sensitivity to the contralateraleye at lateral electrodes (Figure 7). Midline electrodes,and more prominently Oz, showed sensitivity to thetwo eyes, the nose and the mouth/chin. Sensitivity tonose and mouth/chin was also observed in noise trials,suggesting again that this sensitivity in face trials couldbe a low-level effect.
The time-frequency analyses also suggest that phasecontained more information about the contralateral eyethan amplitude, an observation that was confirmed bythe analysis of the N170 peak latency and amplitude
subjects showing a significant effect at the same pixel. In the third column, the green plus signs indicate the centroids of the
significant clusters. Each plus sign was contributed by one subject, and each subject could contribute more than one. In each centroid
plot, the top left corner indicates the number of subjects showing significant effects at any pixel.
Journal of Vision (2014) 14(13):7, 1–24 Rousselet, Ince, van Rijsbergen, & Schyns 9

Figure 4. Maximum mean ERP differences and mutual information across all electrodes. In all panels, thick lines show the mean across
subjects and the shaded areas portray 95% confidence intervals. To summarize the results, for every subject and every time point, we
computed the maximum MI across electrodes, leading to one virtual electrode per subject. Waveforms at these virtual electrodes
were then averaged across subjects. Results were baseline corrected to facilitate comparison. The head maps show the normalized
average across subjects of the topographic distributions at the latency of the mean peaks occurring under 200 ms. The maps range
from zero in blue to the matching mean peak value in red. Not surprisingly, MI was maximum at posterior lateral electrodes. Row 1
�
Journal of Vision (2014) 14(13):7, 1–24 Rousselet, Ince, van Rijsbergen, & Schyns 10
presented below. This phase advantage is likely due tothe more robust single-trial measure of the transientsforming the ERP provided by phase. Indeed, phase issensitive to local maxima and minima that might besmaller in amplitude than other nontask relatedfluctuations in the single-trial signal.
In sum, the forward analysis has demonstrated thatin a face detection task, brain activity is mostlyassociated with the presence of the eyes. This associ-ation is maximum at lateral electrodes and shortlybefore the peak of the N170.
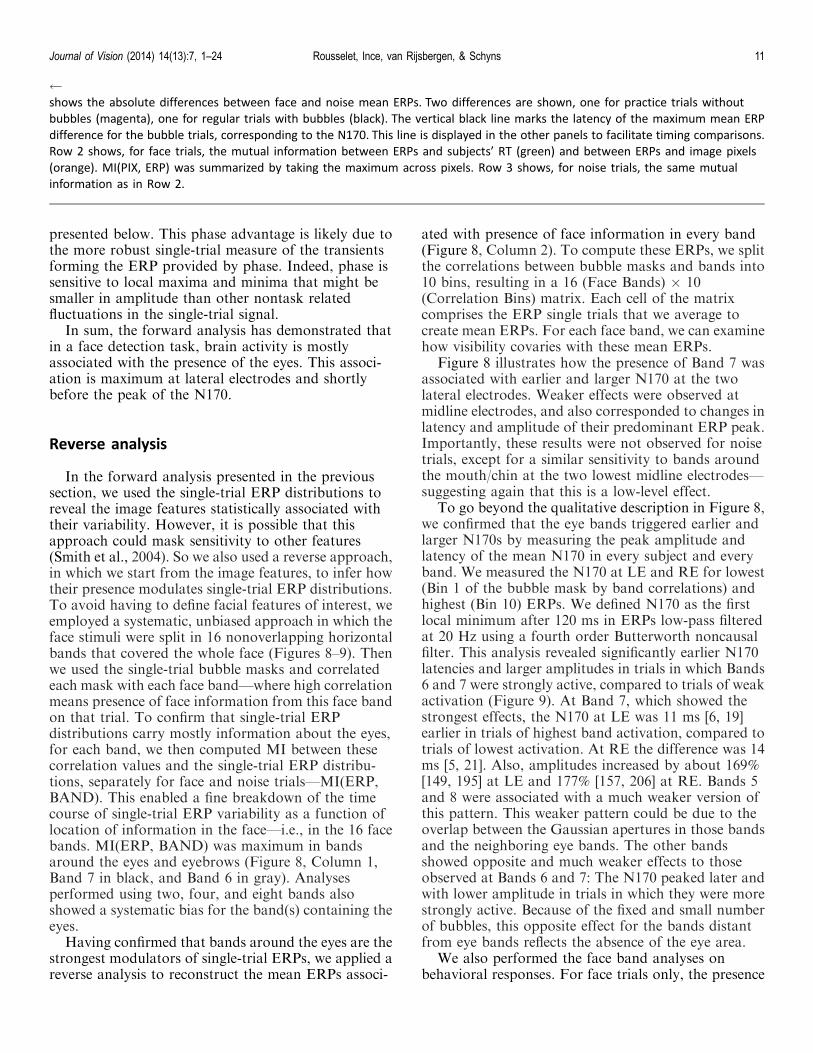
Reverse analysis
In the forward analysis presented in the previoussection, we used the single-trial ERP distributions toreveal the image features statistically associated withtheir variability. However, it is possible that thisapproach could mask sensitivity to other features(Smith et al., 2004). So we also used a reverse approach,in which we start from the image features, to infer howtheir presence modulates single-trial ERP distributions.To avoid having to define facial features of interest, weemployed a systematic, unbiased approach in which theface stimuli were split in 16 nonoverlapping horizontalbands that covered the whole face (Figures 8–9). Thenwe used the single-trial bubble masks and correlatedeach mask with each face band—where high correlationmeans presence of face information from this face bandon that trial. To confirm that single-trial ERPdistributions carry mostly information about the eyes,for each band, we then computed MI between thesecorrelation values and the single-trial ERP distribu-tions, separately for face and noise trials—MI(ERP,BAND). This enabled a fine breakdown of the timecourse of single-trial ERP variability as a function oflocation of information in the face—i.e., in the 16 facebands. MI(ERP, BAND) was maximum in bandsaround the eyes and eyebrows (Figure 8, Column 1,Band 7 in black, and Band 6 in gray). Analysesperformed using two, four, and eight bands alsoshowed a systematic bias for the band(s) containing theeyes.
Having confirmed that bands around the eyes are thestrongest modulators of single-trial ERPs, we applied areverse analysis to reconstruct the mean ERPs associ-
ated with presence of face information in every band(Figure 8, Column 2). To compute these ERPs, we splitthe correlations between bubble masks and bands into10 bins, resulting in a 16 (Face Bands) · 10(Correlation Bins) matrix. Each cell of the matrixcomprises the ERP single trials that we average tocreate mean ERPs. For each face band, we can examinehow visibility covaries with these mean ERPs.
Figure 8 illustrates how the presence of Band 7 wasassociated with earlier and larger N170 at the twolateral electrodes. Weaker effects were observed atmidline electrodes, and also corresponded to changes inlatency and amplitude of their predominant ERP peak.Importantly, these results were not observed for noisetrials, except for a similar sensitivity to bands aroundthe mouth/chin at the two lowest midline electrodes—suggesting again that this is a low-level effect.
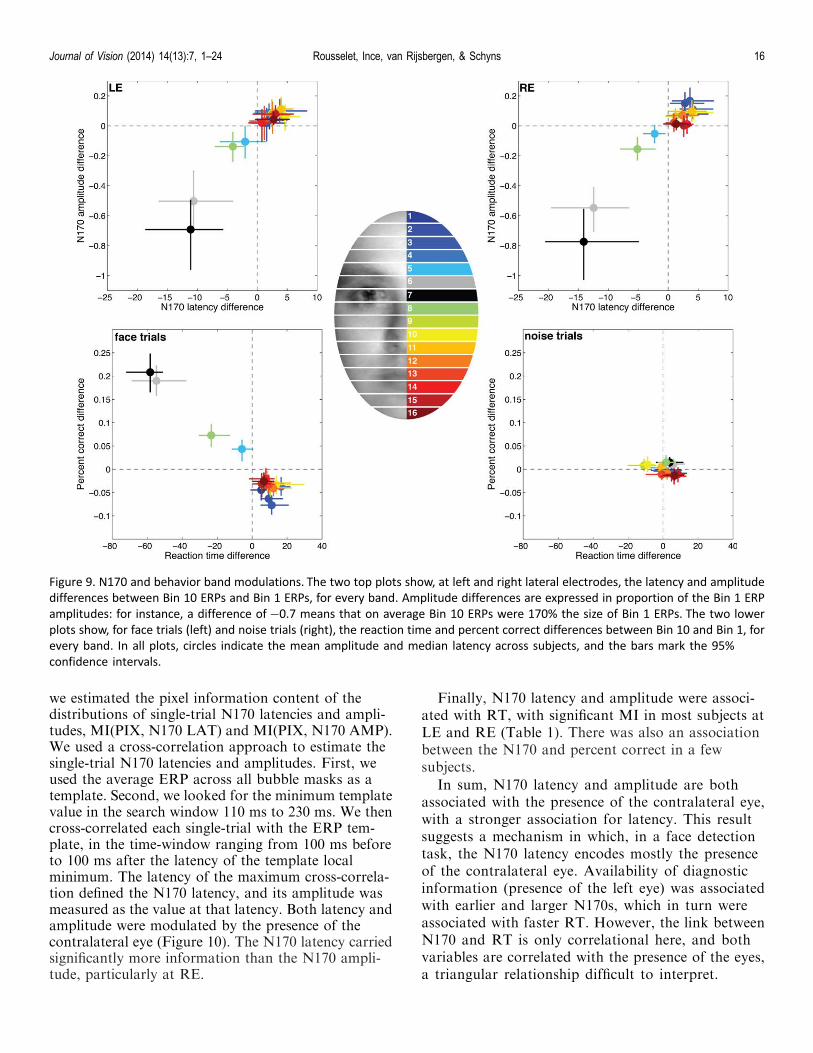
To go beyond the qualitative description in Figure 8,we confirmed that the eye bands triggered earlier andlarger N170s by measuring the peak amplitude andlatency of the mean N170 in every subject and everyband. We measured the N170 at LE and RE for lowest(Bin 1 of the bubble mask by band correlations) andhighest (Bin 10) ERPs. We defined N170 as the firstlocal minimum after 120 ms in ERPs low-pass filteredat 20 Hz using a fourth order Butterworth noncausalfilter. This analysis revealed significantly earlier N170latencies and larger amplitudes in trials in which Bands6 and 7 were strongly active, compared to trials of weakactivation (Figure 9). At Band 7, which showed thestrongest effects, the N170 at LE was 11 ms [6, 19]earlier in trials of highest band activation, compared totrials of lowest activation. At RE the difference was 14ms [5, 21]. Also, amplitudes increased by about 169%[149, 195] at LE and 177% [157, 206] at RE. Bands 5and 8 were associated with a much weaker version ofthis pattern. This weaker pattern could be due to theoverlap between the Gaussian apertures in those bandsand the neighboring eye bands. The other bandsshowed opposite and much weaker effects to thoseobserved at Bands 6 and 7: The N170 peaked later andwith lower amplitude in trials in which they were morestrongly active. Because of the fixed and small numberof bubbles, this opposite effect for the bands distantfrom eye bands reflects the absence of the eye area.
We also performed the face band analyses onbehavioral responses. For face trials only, the presence
shows the absolute differences between face and noise mean ERPs. Two differences are shown, one for practice trials without
bubbles (magenta), one for regular trials with bubbles (black). The vertical black line marks the latency of the maximum mean ERP
difference for the bubble trials, corresponding to the N170. This line is displayed in the other panels to facilitate timing comparisons.
Row 2 shows, for face trials, the mutual information between ERPs and subjects’ RT (green) and between ERPs and image pixels
(orange). MI(PIX, ERP) was summarized by taking the maximum across pixels. Row 3 shows, for noise trials, the same mutual
information as in Row 2.
Journal of Vision (2014) 14(13):7, 1–24 Rousselet, Ince, van Rijsbergen, & Schyns 11

Figure 5. Maximum MI(PIX, ERP) across frames. The rows correspond to different electrodes; the first pair of columns shows mean MI
across subjects, and the second pair of columns shows frequency of effects, separately for face and noise trials. In every frequency
plot, the top left corner indicates the maximum number of subjects showing a significant effect at the same pixel, whereas the top
right corner indicates the number of subjects showing significant effects at any pixel.
Journal of Vision (2014) 14(13):7, 1–24 Rousselet, Ince, van Rijsbergen, & Schyns 12

of the different bands affected RT and percent correct,following a pattern very similar to that observed for theN170: the four bands around the eyes were associatedwith faster and more accurate responses—for Bands 6and 7 around 60 ms faster and 20% more accurate,whereas the other bands had the opposite effect. TheRT effect confirms the direction of the dependencebetween eye information and RT, depicted as MI(PIX,RT) in Figure 3. The effect on percent correct issomewhat unexpected because the forward analysissuggested effects in only a few subjects. This discrep-ancy demonstrates the importance of the reverseanalysis to get a full description of the effects.
In sum, the reverse analysis complements theforward analysis and demonstrates that the presence ofpixels around the eyes is associated with earlier andlarger N170s in both hemispheres, as well as faster andmore accurate behavioral responses.
Forward analysis: Single-trial N170s
Finally, based on the reverse analysis, we predictedthat the latency and amplitude of the N170 might codefor the presence of the contralateral eye. To test thisprediction, we perform a new forward analysis in which
Figure 6. MI(PIX, ERP) time course at six electrodes. The top panel shows the MI time courses time-locked to stimulus onset, from 130
to 190 ms. Each oval shows the mutual information between face pixels and ERP amplitudes, with the first two rows illustrating
sensitivity to the contralateral eye: right eye for LE and left eye for RE. The bottom panel shows the MI time courses time locked to
the peak of the N170, marked as time zero. The realignment of time courses was performed in every subject individually, and then the
new time courses were averaged across subjects. The color scale in the lower panel was used to illustrate results at LE and RE in both
panels, whereas results at midline electrodes are illustrated using the color scale in the upper panel. To put the MI results in
perspective, we compare them to Spearman’s correlation estimates at 160 ms post-stimulus. At LE, the median across subjects of the
maximum MI across pixels was 0.06 [0.03, 0.08], min¼ 0.01, max¼ 0.20; Spearman’s correlation was 0.28 [0.19, 0.34], min¼ 0.08,
max¼ 0.49. At RE median maximum MI was 0.08 [0.05, 0.11], min¼ 0.01, max¼ 0.13; Spearman’s correlation was 0.34 [0.29, 0.41],
min ¼ 0.11, max ¼ 0.45.
Journal of Vision (2014) 14(13):7, 1–24 Rousselet, Ince, van Rijsbergen, & Schyns 13

Figure 7. Maximum MI(PIX, PHA) and MI(PIX, AMP) across time frames. Results are shown for temporal frequencies between 4 and 20
Hz, at six electrodes, for phase (left column) and amplitude (right column), for face trials. The black rectangle shows Oz phase results
for noise trials, with nose and mouth/chin sensitivity similar to that observed for face trials. The feature sensitivity at all electrodes
was maximum around 100–200 ms after stimulus onset. The left hand side color scale was used to illustrate results at LE and RE,
whereas midline electrode results are illustrated using the right hand side color scale.
Journal of Vision (2014) 14(13):7, 1–24 Rousselet, Ince, van Rijsbergen, & Schyns 14

Figure 8. MI(ERP, BAND) and ERP modulations. The six rows correspond to the six electrodes of interest. Columns 1 and 2 show the
face trials, and Columns 3 and 4 the noise trials. MI, in Columns 1 and 3, is color coded with one color per band, as shown in the oval
inset. A larger version of the color code is available in Figure 9. The ERP modulation associated with Band 7 is shown in Columns 2 and
4. For face trials, but not for noise trials, the N170 becomes larger and leftward shifted as band activity increased from minimal in
cyan (Bin 1), to maximum in magenta (Bin 10). In Column 2, top two plots, the dashed vertical lines mark the transition between the
P1 and the N170, the critical time window in which we observed sensitivity to the eyes.
Journal of Vision (2014) 14(13):7, 1–24 Rousselet, Ince, van Rijsbergen, & Schyns 15
we estimated the pixel information content of thedistributions of single-trial N170 latencies and ampli-tudes, MI(PIX, N170 LAT) and MI(PIX, N170 AMP).We used a cross-correlation approach to estimate thesingle-trial N170 latencies and amplitudes. First, weused the average ERP across all bubble masks as atemplate. Second, we looked for the minimum templatevalue in the search window 110 ms to 230 ms. We thencross-correlated each single-trial with the ERP tem-plate, in the time-window ranging from 100 ms beforeto 100 ms after the latency of the template localminimum. The latency of the maximum cross-correla-tion defined the N170 latency, and its amplitude wasmeasured as the value at that latency. Both latency andamplitude were modulated by the presence of thecontralateral eye (Figure 10). The N170 latency carriedsignificantly more information than the N170 ampli-tude, particularly at RE.
Finally, N170 latency and amplitude were associ-ated with RT, with significant MI in most subjects atLE and RE (Table 1). There was also an associationbetween the N170 and percent correct in a fewsubjects.
In sum, N170 latency and amplitude are bothassociated with the presence of the contralateral eye,with a stronger association for latency. This resultsuggests a mechanism in which, in a face detectiontask, the N170 latency encodes mostly the presenceof the contralateral eye. Availability of diagnosticinformation (presence of the left eye) was associatedwith earlier and larger N170s, which in turn wereassociated with faster RT. However, the link betweenN170 and RT is only correlational here, and bothvariables are correlated with the presence of the eyes,a triangular relationship difficult to interpret.
Figure 9. N170 and behavior band modulations. The two top plots show, at left and right lateral electrodes, the latency and amplitude
differences between Bin 10 ERPs and Bin 1 ERPs, for every band. Amplitude differences are expressed in proportion of the Bin 1 ERP
amplitudes: for instance, a difference of�0.7 means that on average Bin 10 ERPs were 170% the size of Bin 1 ERPs. The two lower
plots show, for face trials (left) and noise trials (right), the reaction time and percent correct differences between Bin 10 and Bin 1, for
every band. In all plots, circles indicate the mean amplitude and median latency across subjects, and the bars mark the 95%
confidence intervals.
Journal of Vision (2014) 14(13):7, 1–24 Rousselet, Ince, van Rijsbergen, & Schyns 16

Discussion
In a face detection task, we found that both behaviorand neuronal activity were mostly modulated by thepresence of the eyes: Behavioral responses were fasterand more accurate when the left eye was present; theN170 ERP component, recorded at lateral electrodes,was both larger and peaked earlier in response to thecontralateral eye. Earlier and larger single-trial N170swere also associated with faster reaction times. The
N170 was also modulated, in a few subjects and to alesser extent, by the ipsilateral eye. Other face featureshad virtually no effect on behavior or the N170.Overall, our analyses point to the N170, and inparticular the transition between the P1 and the N170,as a critical time window in which the brain extractstask-relevant information: in this case the presence ofthe contralateral eye. Although both eyes wereprocessed contralaterally, their presence or absence wasnot equally weighted: The presence (or absence) of the
Figure 10. MI(PIX, N170 LAT) & MI(PIX, N170 AMP). Results are shown averaged across subjects at the left lateral electrode (LE,
Column 1) and the right lateral electrode (RE, Column 2). The matching frequencies of significant effects are shown in Columns 3 and
4. Row 1 shows MI(PIX, N170 LAT), Row 2 shows MI(PIX, N170 AMP), and Row 3 shows the difference between Row 1 and Row 2. In
every frequency plot in Columns 3 and 4, the top left corner indicates the maximum number of subjects showing a significant effect at
the same pixel, whereas the top right corner indicates the number of subjects showing significant effects at any pixel.
Journal of Vision (2014) 14(13):7, 1–24 Rousselet, Ince, van Rijsbergen, & Schyns 17

left eye largely dominated modulations of the reactiontime distributions. The right eye, while containingidentical potential information, only modulated reac-tion time distributions in a few subjects. This suggeststhat the left eye is the preferred stimulus for facedetection, which is consistent with the reported righthemisphere dominance for face processing (Sergent,Ohta, & MacDonald, 1992), as well as for attention ingeneral (Driver & Vuilleumier, 2001).
The independent processing of the contralateral eyeby each hemisphere, observed here and in previousstudies, echoes findings of a division of labor betweenthe two hemispheres in human and nonhuman primates(Kravitz, Vinson, & Baker, 2008; Rousselet, Thorpe, &Fabre-Thorpe, 2004). This result is also consistent withthe observation of independent variability of single-trial N170 amplitudes in the two hemispheres (Nguyen& Cunnington, 2014). The apparent independence ofthe two hemispheres, and their sensitivity to mostly onefeature—the contralateral eye, is not due a lack ofsensitivity of our technique, or the masking of otherfeatures by the predominant eyes. First, we used twounbiased and systematic approaches, forward andreverse analyses to establish feature sensitivity. Second,as in a previous reverse-correlation experiment (Schynset al., 2011), we found sensitivity to the two eyes andthe mouth at midline electrodes. However, in thepresent experiment, the mouth sensitivity might be dueto low-level factors, because it was also present fornoise trials, and occurred earlier and was weaker thancontralateral eye sensitivity. Sensitivity to the two eyescould reflect explicit feature integration, or passivesummation of eye-related activity from the twohemispheres at the scalp level. Reverse correlationtechniques explicitly testing feature integration wouldbe necessary to resolve this question. For instance,EEG frequency tagging could be used to provideobjective signatures of integration of specific features(Boremanse, Norcia, & Rossion, 2013). This wouldrequire testing a large number of combinations offeatures, parts or aspects of a face, which could be doneby combining EEG frequency tagging with the sort ofsystematic sparse sampling we used in the currentexperiment.
Sensitivity to the contralateral eye tended to belarger for the N170 latency than its amplitude.Similarly, after time-frequency decomposition of thesingle-trial ERPs, we found that phase contributedmore information than amplitude, confirming resultsfrom a recent report (Schyns et al., 2011). Because thepresence of the contralateral eye is associated with aleftward shift of the N170, it means that ERPamplitudes start to vary strongly before the peak of theN170, and more precisely at the transition between thepreceding P1 and the N170. Indeed, we found thatcontralateral eye sensitivity was maximum before theN170 peak, which speaks against analyses limited toERP peaks (Rousselet & Pernet, 2011; Rousselet,Pernet, Caldara, & Schyns, 2011; Schyns et al., 2007).
Many studies using categorical designs have reportedearly face responses or adaptation of these responses toeyes or the eye area (Bentin et al., 1996; Eimer, Kiss, &Nicholas, 2010; Harris & Nakayama, 2008; Itier et al.,2007; McCarthy, Puce, Belger, & Allison, 1999;Nemrodov & Itier, 2011). Reverse-correlation studiesin humans go a step further, by showing thatirrespective of the task, early face responses seem tofirst encode the presence of the contralateral eye,followed by sensitivity to task-relevant features, andtheir combinations (Schyns et al., 2003; Schyns et al.,2007; Schyns et al., 2011; Smith et al., 2004, 2007; vanRijsbergen & Schyns, 2009). This two-step process hasled to the suggestion that face processing could startwith the eyes, used as anchors to localize and integrateinformation from the rest of the face (Schyns et al.,2007). This is akin to the idea of using pre-alignment tohelp template-matching routines (Karlinsky, Diner-stein, Harari, & Ullman, 2010; Ullman, 1996). In ourcase, the eyes are sufficient to detect a face, and hencethe integration process stops there. A link between eyeprocessing and detection is consistent with a recentreverse correlation study in monkeys in which single-unit and multi-unit recordings from the left posteriorand middle lateral face patches revealed strongsensitivity to the right eye (Issa & DiCarlo, 2012). Thismodulation by the contralateral eye was present inmost neurons during their first period of activity and isconsistent with the idea that diagnostic features are firstencoded in posterior IT cortex (Nielsen, Logothetis, &
LE RE
Mean þ CI Frequency Mean þ CI Frequency
MI(RT, LAT) 0.0361 [0.0168, 0.0629] 12 0.0447 [0.0270, 0.0692] 15
MI(RT, AMP) 0.0216 [0.0089, 0.0362] 11 0.0265 [0.0146, 0.0398] 14
MI(CORRECT, LAT) 0.0022 [0.0010, 0.0040] 3 0.0022 [0.0013, 0.0033] 2
MI(CORRECT, AMP) 0.0028 [0.0015, 0.0044] 5 0.0027 [0.0018, 0.0038] 4
Table 1. MI(N170, RT) and MI(N170, CORRECT). Results are presented separately for N170 latency (LAT) and amplitude (AMP).Confidence intervals (CI) are indicated in square brackets. Frequency refers to the number of subjects showing a significant effect.
Journal of Vision (2014) 14(13):7, 1–24 Rousselet, Ince, van Rijsbergen, & Schyns 18

Rainer, 2006b). It remains to be determined if this earlycoding of the contralateral eye is task dependent, andwhat these neurons process over longer periods. Inparticular, the actual computational goal of the systemresponding strongly to eyes remains unclear: Instead ofeye detection per se, the response of the putative eyedetection neurons could reflect an early bias towardsinformation present in the eyes, such as emotion orgaze. Diagnostic information is always task relative:We cannot assume that the information processinggoals will not adapt to task demands and theavailability of stimulus information (Schyns, 1998).
Is it possible that the N170 coding of the contralat-eral eye is equivalent to the neuronal responses fromposterior and middle lateral patches in macaquemonkeys? Even though the equivalence betweenmonkey and human face areas is largely unknown, theearly activation and location of the monkey lateralpatches suggest that they could reflect activity aroundthe STS or OFA in our subjects (Janssens, Zhu,Popivanov, & Vanduffel, 2014; Yovel & Freiwald,2013). In our data, the topographic maps of thecontralateral eye sensitivity suggest the involvement ofposterior-lateral sources. Furthermore, studies usingsource analyses or correlations between BOLD andERP amplitudes suggest N170 sources around the STS(Itier & Taylor, 2004; Nguyen & Cunnington, 2014;Sato, Kochiyama, Uono, & Yoshikawa, 2008; Wata-nabe, Kakigi, & Puce, 2003), the fusiform gyrus(Horovitz, Rossion, Skudlarski, & Gore, 2004), or both(Dalrymple et al., 2011; Prieto, Caharel, Henson, &Rossion, 2011; Sadeh, Podlipsky, Zhdanov, & Yovel,2010). However, none of these studies has linkedBOLD information content to ERP informationcontent. A single-trial fMRI-EEG experiment usingbubbles would help solve this problem. More directly,intracranial data also support the involvement ofoccipital and temporal lateral areas, such as the rightinferior occipital gyrus, in generating the scalp N1/N170 (Engell & McCarthy, 2011; Jonas et al., 2012;Jonas et al., 2014; Rosburg et al., 2010; Sehatpour etal., 2008). In addition, an MEG reverse-correlationstudy revealed sensitivity to face features, including theeyes, in the time window of the M170 in lateral corticalareas (Smith, Fries, Gosselin, Goebel, & Schyns, 2009).So, it seems plausible that lateral sources are involvedin the generation of the N170 contralateral eyesensitivity. But the timing of this sensitivity differsdramatically between monkeys and humans: It startedaround 60 ms and peaked around 100 ms in monkeys(Issa & DiCarlo, 2012), whereas in humans the effectsstarted around 100 ms and peaked at about 160 ms.The delay between human and monkey eye sensitivitycould be explained by differences in brain sizes. Forinstance, if one follows the 3/5 rule (Kelly, Vanegas,Schroeder, & Lalor, 2013), the timings agree very well
between species. Also, we observed later ERPs inbubble trials compared to trials without bubbles, whichcould be due lower stimulus energy in the bubble trials,and would fit with recent observations of strong N170latency sensitivity to luminance (Bieniek, Frei, &Rousselet, 2013). Alternatively, delayed ERPs inbubble trials might reflect extra processing required foroccluded stimuli (Harris & Aguirre, 2008; Tang et al.,2014) and suggest the possibility that stimulus occlu-sion, necessary to infer information content throughreverse correlation, could alter how faces are processed.An alternative to the 2-D sampling used in the currentexperiment would be to use 3-D bubbles, in which thesampling is performed independently in differentspatial frequency bands (Schyns et al., 2007; Schyns,Petro, & Smith, 2009). This technique allows thepresentation of extended face areas at lower spatialscales, and hence preserves a constant face context,without complete occlusion of face features. Never-theless, whatever the origin of the delay, it cannotexplain inter-species differences, unless bubbles have astronger effect on scalp ERPs than single-unit record-ings. But this is rather speculative at this point,especially given that Issa and DiCarlo used a singlelarge Gaussian aperture per trial, compared to 10smaller apertures in our experiment. The effect of thesedifferences in sampling strategies on neuronal timingsremains to be tested. Alternatively, the N170 coding ofthe contralateral eye could reflect a stage at which thisinformation is available in areas that do not contributeto eye detection per se, but rather process task-relatedfeatures, possibly involving re-entrant connectionsfrom other face areas (Rossion et al., 2003; Tang et al.,2014).
It would be necessary to carry out studies using thesame stimuli and the same tasks in both monkeys andhumans (Nielsen, Logothetis, & Rainer, 2006a, 2008)to establish the equivalence of the N170 eye response tothe response from monkeys’ lateral patches, and moregenerally to firmly establish differences in timing,location, and information content of visual brainactivity. This work could also be extended to otherspecies (Alemi-Neissi, Rosselli, & Zoccolan, 2013;Gibson, Lazareva, Gosselin, Schyns, & Wasserman,2007; Gibson, Wasserman, Gosselin, & Schyns, 2005).Nevertheless, in keeping with results from Issa andDiCarlo (2012), our results support a bottom-up, data-driven model of face processing, in which the presenceof a face is first inferred by detecting the contralateraleye, before integrating other task-relevant features.Following Issa and DiCarlo, next we will need todetermine if the encoding of the contralateral eye istolerant to changes in contrast, size, position, andorientation. A full account of face detection mecha-nisms should also consider the impact of corticalmagnification and fixation location (de Lissa et al.,
Journal of Vision (2014) 14(13):7, 1–24 Rousselet, Ince, van Rijsbergen, & Schyns 19

2014; Nemrodov, Anderson, Preston, & Itier, 2014;Rousselet, Husk, Bennett, & Sekuler, 2005; Zerouali,Lina, & Jemel, 2013). Also, by testing the same subjectsusing the same stimuli in various tasks (e.g., detection,gender, expression, age discrimination tasks) we will beable to test a clear prediction of systematic contralat-eral eye sensitivity followed by task specific sensitivityto diagnostic information (Schyns et al., 2007). Finally,it might be possible to establish a causal relationshipbetween feature sensitivity and brain activity: TMS hasbeen used to determine the contribution of lateralvisual areas to behavior and the N170 to differentcategories (Pitcher, Charles, Devlin, Walsh, & Duch-aine, 2009; Sadeh et al., 2011). Using reverse correla-tion, it would be possible to go one step further, byproviding a mechanistic account of how TMS affectsthe shape and the information content of the N170, andits relationship to behavior.
Keywords: N170, face detection, ERPs, information,reverse-correlation
Acknowledgments
This research was supported by the LeverhulmeTrust grant F/00 179/BD to GAR and the BBSRCgrant BB/J018929/1 to GAR, PGS, and NJV. Wethank Hanna Isolatus, Sean Henderson, Fei Li, andMagdalena M. Bieniek for their help with datacollection.
Commercial relationships: none.Corresponding author: Guillaume A. Rousselet.Email: [email protected]: Institute of Neuroscience and Psychology,University of Glasgow, Glasgow, UK.
References
Acunzo, D. J., Mackenzie, G., & van Rossum, M. C.(2012). Systematic biases in early ERP and ERFcomponents as a result of high-pass filtering.Journal of Neuroscience Methods, 209(1), 212–218.doi:10.1016/j.jneumeth.2012.06.011.
Alemi-Neissi, A., Rosselli, F. B., & Zoccolan, D.(2013). Multifeatural shape processing in ratsengaged in invariant visual object recognition.Journal of Neuroscience, 33(14), 5939–5956. doi:10.1523/JNEUROSCI.3629-12.2013.
Allison, T., Puce, A., Spencer, D. D., & McCarthy, G.(1999). Electrophysiological studies of human faceperception. I: Potentials generated in occipitotem-
poral cortex by face and non-face stimuli. CerebralCortex, 9(5), 415–430.
Bentin, S., Allison, T., Puce, A., Perez, E., & Mc-Carthy, G. (1996). Electrophysiological studies offace perception in humans. Journal of CognitiveNeuroscience, 8(6), 551–565. doi:10.1162/jocn.1996.8.6.551.
Bieniek, M. M., Frei, L. S., & Rousselet, G. A. (2013).Early ERPs to faces: Aging, luminance, andindividual differences. Frontiers in Psychology, 4,268. doi:10.3389/fpsyg.2013.00268.
Bindemann, M., Scheepers, C., & Burton, A. M.(2009). Viewpoint and center of gravity affect eyemovements to human faces. Journal of Vision, 9(2):7, 1–16, http://journalofvision.org/content/9/2/7,doi:10.1167/9.2.7. [PubMed] [Article]
Boremanse, A., Norcia, A. M., & Rossion, B. (2013).An objective signature for visual binding of faceparts in the human brain. Journal of Vision, 13(11):6, 1–18, http://www.journalofvision.org/content/13/11/6, doi:10.1167/13.11.6. [PubMed] [Article]
Cover, T. M., & Thomas, J. A. (2006). Elements ofinformation theory (2nd ed.). Hoboken, NJ: Wiley-Interscience.
Dalrymple, K. A., Oruc, I., Duchaine, B., Pancaroglu,R., Fox, C. J., Iaria, G., . . . Barton, J. J. S. (2011).The anatomic basis of the right face-selective N170in acquired prosopagnosia: A combined ERP/fMRI study. Neuropsychologia, 49(9), 2553–2563.doi:10.1016/j.neuropsychologia.2011.05.003.
de Lissa, P., McArthur, G., Hawelka, S., Palermo, R.,Mahajan, Y., & Hutzler, F. (2014). Fixationlocation on upright and inverted faces modulatesthe N170. Neuropsychologia, 57, 1–11. doi:10.1016/j.neuropsychologia.2014.02.006.
Delorme, A., Mullen, T., Kothe, C., Akalin Acar, Z.,Bigdely-Shamlo, N., Vankov, A., . . . Makeig, S.(2011). EEGLAB, SIFT, NFT, BCILAB, andERICA: New tools for advanced EEG processing.Computational Intelligence and Neuroscience, 2011,130714. doi:10.1155/2011/130714.
Driver, J., & Vuilleumier, P. (2001). Perceptualawareness and its loss in unilateral neglect andextinction. Cognition, 79(1-2), 39–88.
Eimer, M., Kiss, M., & Nicholas, S. (2010). Responseprofile of the face-sensitive N170 component: Arapid adaptation study. Cerebral Cortex, 20(10),2442–2452. doi:10.1093/cercor/bhp312.
Engell, A. D., & McCarthy, G. (2011). The relationshipof gamma oscillations and face-specific ERPsrecorded subdurally from occipitotemporal cortex.Cerebral Cortex, 21(5), 1213–1221. doi:10.1093/cercor/bhq206.
Journal of Vision (2014) 14(13):7, 1–24 Rousselet, Ince, van Rijsbergen, & Schyns 20

Fairhall, A., Shea-Brown, E., & Barreiro, A. (2012).Information theoretic approaches to understandingcircuit function. Current Opinion in Neurobiology,22(4), 653–659. doi:10.1016/j.conb.2012.06.005.
Foxe, J. J., & Simpson, G. V. (2002). Flow of activationfrom V1 to frontal cortex in humans. A frameworkfor defining ‘‘early’’ visual processing. ExperimentalBrain Research, 142(1), 139–150.
Freiwald, W. A., Tsao, D. Y., & Livingstone, M. S.(2009). A face feature space in the macaquetemporal lobe. Nature Neuroscience, 12(9), 1187–1196. doi:10.1038/nn.2363.
Gibson, B. M., Lazareva, O. F., Gosselin, F., Schyns,P. G., & Wasserman, E. A. (2007). Nonaccidentalproperties underlie shape recognition in Mamma-lian and nonmammalian vision. Current Biology,17(4), 336–340. doi:10.1016/j.cub.2006.12.025.
Gibson, B. M., Wasserman, E. A., Gosselin, F., &Schyns, P. G. (2005). Applying bubbles to localizefeatures that control pigeons’ visual discriminationbehavior. Journal of Experimental Psychology,31(3), 376–382. doi:10.1037/0097-7403.31.3.376.
Gold, J., Bennett, P. J., & Sekuler, A. B. (1999).Identification of band-pass filtered letters and facesby human and ideal observers. Vision Research,39(21), 3537–3560.
Gosselin, F., & Schyns, P. G. (2001). Bubbles: Atechnique to reveal the use of information inrecognition tasks. Vision Research, 41(17), 2261–2271. doi:10.1016/S0042-6989(01)00097-9.
Groppe, D. M., Makeig, S., & Kutas, M. (2009).Identifying reliable independent components viasplit-half comparisons. Neuroimage, 45(4), 1199–1211. doi:10.1016/j.neuroimage.2008.12.038.
Haig, N. D. (1985). How faces differ—A newcomparative technique. Perception, 14(5), 601–615.
Harris, A., & Nakayama, K. (2008). Rapid adaptationof the m170 response: Importance of face parts.Cerebral Cortex, 18(2), 467–476. doi:10.1093/cercor/bhm078.
Harris, A. M., & Aguirre, G. K. (2008). The effects ofparts, wholes, and familiarity on face-selectiveresponses in MEG. Journal of Vision, 8(10):4, 1–12,http://www.journalofvision.org/content/8/10/4,doi:10.1167/8.10.4. [PubMed] [Article]
Horovitz, S. G., Rossion, B., Skudlarski, P., & Gore, J.C. (2004). Parametric design and correlationalanalyses help integrating fMRI and electrophysio-logical data during face processing. Neuroimage,22(4), 1587–1595.
Hsiao, J. H. -w. & G. Cottrell, (2008). Two fixationssuffice in face recognition. Psychological Science,
19(10), 998–1006. doi:10.1111/j.1467-9280.2008.02191.x.
Ince, R. A., Mazzoni, A., Bartels, A., Logothetis, N.K., & Panzeri, S. (2012). A novel test to determinethe significance of neural selectivity to single andmultiple potentially correlated stimulus features.Journal of Neuroscience Methods, 210(1), 49–65.doi:10.1016/j.jneumeth.2011.11.013.
Ince, R. A., Mazzoni, A., Petersen, R. S., & Panzeri, S.(2010). Open source tools for the informationtheoretic analysis of neural data. Frontiers inNeuroscience, 4, doi:10.3389/neuro.01.011.2010.
Ince, R. A., Petersen, R. S., Swan, D. C., & Panzeri, S.(2009). Python for information theoretic analysis ofneural data. Frontiers in Neuroinformatics, 3, 4. doi:10.3389/neuro.11.004.2009.
Issa, E. B., & DiCarlo, J. J. (2012). Precedence of theeye region in neural processing of faces. Journal ofNeuroscience, 32(47), 16666–16682. doi:10.1523/JNEUROSCI.2391-12.2012.
Itier, R. J., Alain, C., Sedore, K., & McIntosh, A. R.(2007). Early face processing specificity: It’s in theeyes! Journal of Cognitive Neuroscience, 19(11),1815–1826. doi:10.1162/jocn.2007.19.11.1815.
Itier, R. J., & Taylor, M. J. (2004). Source analysis ofthe N170 to faces and objects. Neuroreport, 15(8),1261–1265.
Janssens, T., Zhu, Q., Popivanov, I. D., & Vanduffel,W. (2014). Probabilistic and single-subject retino-topic maps reveal the topographic organization offace patches in the macaque cortex. Journal ofNeuroscience, 34(31), 10156–10167. doi:10.1523/JNEUROSCI.2914-13.2013.
Jonas, J., Descoins, M., Koessler, L., Colnat-Coulbois,S., Sauvee, M., Guye, M., . . . Maillard, L. (2012).Focal electrical intracerebral stimulation of a face-sensitive area causes transient prosopagnosia.Neuroscience, 222, 281–288. doi:10.1016/j.neuroscience.2012.07.021.
Jonas, J., Rossion, B., Krieg, J., Koessler, L., Colnat-Coulbois, S., Vespignani, H., . . . Maillard, L.(2014). Intracerebral electrical stimulation of aface-selective area in the right inferior occipitalcortex impairs individual face discrimination. Neu-roimage, 99, 487–497. doi:10.1016/j.neuroimage.2014.06.017.
Karlinsky, L., Dinerstein, M., Harari, D., & Ullman, S.(2010). The chains model for detecting parts bytheir context. 2010 IEEE Conference on ComputerVision and Pattern Recognition (Cvpr), 25–32. doi:10.1109/Cvpr.2010.5540232.
Kayser, J., & Tenke, C. E. (2006). Principal compo-nents analysis of Laplacian waveforms as a generic
Journal of Vision (2014) 14(13):7, 1–24 Rousselet, Ince, van Rijsbergen, & Schyns 21

method for identifying ERP generator patterns: I.Evaluation with auditory oddball tasks. ClinicalNeurophysiology, 117(2), 348–368. doi:10.1016/j.clinph.2005.08.034.
Kelly, S. P., Vanegas, M. I., Schroeder, C. E., & Lalor,E. C. (2013). The cruciform model of striategeneration of the early VEP, re-illustrated, notrevoked: A reply to Ales et al. (2013). Neuroimage,82, 154–159. doi:10.1016/j.neuroimage.2013.05.112.
Kravitz, D. J., Vinson, L. D., & Baker, C. I. (2008).How position dependent is visual object recogni-tion? Trends in Cognitive Sciences, 12(3), 114–122.doi:10.1016/j.tics.2007.12.006.
Magri, C., Whittingstall, K., Singh, V., Logothetis, N.K., & Panzeri, S. (2009). A toolbox for the fastinformation analysis of multiple-site LFP, EEGand spike train recordings. BMC Neuroscience, 10,81. doi:10.1186/1471-2202-10-81.
McCarthy, G., Puce, A., Belger, A., & Allison, T.(1999). Electrophysiological studies of human faceperception. II: Response properties of face-specificpotentials generated in occipitotemporal cortex.Cerebral Cortex, 9(5), 431–444.
Murray, R. F. (2011). Classification images: A review.Journal of Vision, 11(5):2, 1–25, http://www.journalofvision.org/content/11/5/2, doi:10.1167/11.5.2. [PubMed] [Article]
Murray, R. F. (2012). Classification images andbubbles images in the generalized linear model.Journal of Vision, 12(7):2, 1–8, http://www.journalofvision.org/content/12/7/2, doi:10.1167/12.7.2. [PubMed] [Article]
Nemrodov, D., Anderson, T., Preston, F. F., & Itier,R. J. (2014). Early sensitivity for eyes within faces:A new neuronal account of holistic and featuralprocessing. Neuroimage, 97, 81–94. doi:10.1016/j.neuroimage.2014.04.042.
Nemrodov, D., & Itier, R. J. (2011). The role of eyes inearly face processing: A rapid adaptation study ofthe inversion effect. British Journal of Psychology,102(4), 783–798. doi:10.1111/j.2044-8295.2011.02033.x.
Nguyen, V. T., & Cunnington, R. (2014). The superiortemporal sulcus and the N170 during face pro-cessing: Single trial analysis of concurrent EEG–fMRI. Neuroimage, 86(C), 492–502. doi:10.1016/j.neuroimage.2013.10.047.
Nielsen, K. J., Logothetis, N. K., & Rainer, G. (2006a).Discrimination strategies of humans and rhesusmonkeys for complex visual displays. CurrentBiology, 16(8), 814–820. doi:10.1016/j.cub.2006.03.027.
Nielsen, K. J., Logothetis, N. K., & Rainer, G. (2006b).
Dissociation between local field potentials andspiking activity in macaque inferior temporalcortex reveals diagnosticity-based encoding ofcomplex objects. Journal of Neuroscience, 26(38),9639–9645. doi:10.1523/Jneurosci.2273-06.2006.
Nielsen, K. J., Logothetis, N. K., & Rainer, G. (2008).Object features used by humans and monkeys toidentify rotated shapes. Journal of Vision, 8(2):9, 1–15, http://www.journalofvision.org/content/8/2/9,doi:10.1167/8.2.9. [PubMed] [Article]
Ohayon, S., Freiwald, W. A., & Tsao, D. Y. (2012).What makes a cell face selective? The importance ofcontrast. Neuron, 74(3), 567–581. doi:10.1016/j.neuron.2012.03.024.
Panzeri, S., Brunel, N., Logothetis, N. K., & Kayser, C.(2010). Sensory neural codes using multiplexedtemporal scales. Trends in Neurosciences, 33(3),111–120. doi:10.1016/j.tins.2009.12.001.
Panzeri, S., Senatore, R., Montemurro, M. A., &Petersen, R. S. (2007). Correcting for the samplingbias problem in spike train information measures.Journal of Neurophysiology, 98(3), 1064–1072. doi:10.1152/jn.00559.2007.
Pernet, C. R., Chauveau, N., Gaspar, C., & Rousselet,G. A. (2011). LIMO EEG: A toolbox for hierar-chical LInear MOdeling of ElectroEncephalo-Graphic data. Computational Intelligence andNeuroscience, 2011, 831409. doi:10.1155/2011/831409.
Pernet, C. R., Latinus, M., Nichols, T. E., & Rousselet,G. A. (2014). Cluster-based computational methodsfor mass univariate analyses of event-related brainpotentials/fields: A simulation study. Journal ofNeuroscience Methods, in press, doi:10.1016/j.jneumeth.2014.08.003.
Pernet, C. R., Wilcox, R., & Rousselet, G. A. (2012).Robust correlation analyses: False positive andpower validation using a new open source matlabtoolbox. Frontiers in Psychology, 3(606), 606. doi:10.3389/fpsyg.2012.00606.
Pitcher, D., Charles, L., Devlin, J. T., Walsh, V., &Duchaine, B. (2009). Triple dissociation of faces,bodies, and objects in extrastriate cortex. CurrentBiology, 19(4), 319–324. doi:10.1016/j.cub.2009.01.007.
Prieto, E. A., Caharel, S., Henson, R., & Rossion, B.(2011). Early (n170/m170) face-sensitivity despiteright lateral occipital brain damage in acquiredprosopagnosia. Frontiers in Human Neuroscience, 5,138. doi:10.3389/fnhum.2011.00138.
Rosburg, T., Ludowig, E., Dumpelmann, M., Alba-Ferrara, L., Urbach, H., & Elger, C. E. (2010). Theeffect of face inversion on intracranial and scalp
Journal of Vision (2014) 14(13):7, 1–24 Rousselet, Ince, van Rijsbergen, & Schyns 22

recordings of event-related potentials. Psychophys-iology, 47(1), 147–157. doi:10.1111/j.1469-8986.2009.00881.x.
Rossion, B., Caldara, R., Seghier, M., Schuller, A. M.,Lazeyras, F., & Mayer, E. (2003). A network ofoccipito-temporal face-sensitive areas besides theright middle fusiform gyrus is necessary for normalface processing. Brain, 126(Pt 11), 2381–2395. doi:10.1093/Brain/Awg241.
Rossion, B., & Jacques, C. (2008). Does physicalinterstimulus variance account for early electro-physiological face sensitive responses in the humanbrain? Ten lessons on the N170. Neuroimage, 39(4),1959–1979. doi:10.1016/j.neuroimage.2007.10.011.
Rousselet, G. A. (2012). Does filtering preclude us fromstudying ERP time-courses? Frontiers in Psycholo-gy, 3(131), 131. doi:10.3389/fpsyg.2012.00131.
Rousselet, G. A., Gaspar, C. M., Wieczorek, K. P., &Pernet, C. R. (2011). Modeling single-trial ERPreveals modulation of bottom-up face visualprocessing by top-down task constraints (in somesubjects). Frontiers in Psychology, 2(137), 137. doi:10.3389/fpsyg.2011.00137.
Rousselet, G. A., Husk, J. S., Bennett, P. J., & Sekuler,A. B. (2005). Spatial scaling factors explaineccentricity effects on face ERPs. Journal of Vision,5(10):1, 755–763, http://www.journalofvision.org/content/5/10/1, doi:10.1167/5.10.1. [PubMed][Article]
Rousselet, G. A., Husk, J. S., Bennett, P. J., & Sekuler,A. B. (2008). Time course and robustness of ERPobject and face differences. Journal of Vision, 8(12):3, 1–18, http://journalofvision.org/content/8/12/3,doi:10.1167/8.12.3. [PubMed] [Article]
Rousselet, G. A., & Pernet, C. R. (2012). Improvingstandards in brain-behavior correlation analyses.Frontiers in Human Neuroscience, 6(119), 119. doi:10.3389/fnhum.2012.00119.
Rousselet, G. A., & Pernet, C. R. (2011). Quantifyingthe time course of visual object processing usingERPs: It’s time to up the game. Frontiers inPsychology, 2(107), doi:10.3389/fpsyg.2011.00107.
Rousselet, G. A., Pernet, C. R., Bennett, P. J., &Sekuler, A. B. (2008). Parametric study of EEGsensitivity to phase noise during face processing.BMC Neuroscience, 9, 98. doi:10.1186/1471-2202-9-98.
Rousselet, G. A., Pernet, C. R., Caldara, R., & Schyns,P. G. (2011). Visual object categorization in thebrain: What can we really learn from ERP peaks?Frontiers in Human Neuroscience, 5, 156. doi:10.3389/fnhum.2011.00156.
Rousselet, G. A., Thorpe, S. J., & Fabre-Thorpe, M.
(2004). How parallel is visual processing in theventral pathway? Trends in Cognitive Sciences, 8(8),363–370.
Sadeh, B., Pitcher, D., Brandman, T., Eisen, A.,Thaler, A., & Yovel, G. (2011). Stimulation ofcategory-selective brain areas modulates ERP totheir preferred categories. Current Biology, 21(22),1894–1899. doi:10.1016/j.cub.2011.09.030.
Sadeh, B., Podlipsky, I., Zhdanov, A., & Yovel, G.(2010). Event-related potential and functional MRImeasures of face-selectivity are highly correlated: Asimultaneous ERP-fMRI investigation. HumanBrain Mapping, 31(10), 1490–1501. doi:10.1002/hbm.20952.
Sato, W., Kochiyama, T., Uono, S., & Yoshikawa, S.(2008). Time course of superior temporal sulcusactivity in response to eye gaze: A combined fMRIand MEG study. Social Cognitive and AffectiveNeuroscience, 3(3), 224–232. doi:10.1093/scan/nsn016.
Schyns, P. G. (1998). Diagnostic recognition: Taskconstraints, object information, and their interac-tions. Cognition, 67(1-2), 147–179. doi:10.1016/S0010-0277(98)00016-X.
Schyns, P. G., Gosselin, F., & Smith, M. L. (2009).Information processing algorithms in the brain.Trends in Cognitive Sciences, 13(1), 20–26. doi:10.1016/j.tics.2008.09.008.
Schyns, P. G., Jentzsch, I., Johnson, M., Schwein-berger, S. R., & Gosselin, F. (2003). A principledmethod for determining the functionality of brainresponses. Neuroreport, 14(13), 1665–1669. doi:10.1097/01.wnr.0000088408.04452.e9.
Schyns, P. G., Petro, L. S., & Smith, M. L. (2007).Dynamics of visual information integration in thebrain for categorizing facial expressions. CurrentBiology, 17(18), 1580–1585. doi:10.1016/j.cub.2007.08.048.
Schyns, P. G., Petro, L. S., & Smith, M. L. (2009).Transmission of facial expressions of emotion co-evolved with their efficient decoding in the brain:Behavioral and brain evidence. PLoS One, 4(5),e5625 doi:10.1371/journal.pone.0005625.
Schyns, P. G., Thut, G., & Gross, J. (2011). Crackingthe code of oscillatory activity. PLoS Biology, 9(5),e1001064. doi:10.1371/journal.pbio.1001064.
Sehatpour, P., Molholm, S., Schwartz, T. H., Maho-ney, J. R., Mehta, A. D., Javitt, D. C., . . . Foxe,J. J. (2008). A human intracranial study of long-range oscillatory coherence across a frontal-occip-ital-hippocampal brain network during visualobject processing. Proceedings of the NationalAcademy of Sciences, USA, 105(11), 4399–4404.
Journal of Vision (2014) 14(13):7, 1–24 Rousselet, Ince, van Rijsbergen, & Schyns 23

Sergent, J., Ohta, S., & MacDonald, B. (1992).Functional neuroanatomy of face and objectprocessing. A positron emission tomography study.Brain, 115 Pt, 1, 15–36.
Smith, M. L., Fries, P., Gosselin, F., Goebel, R., &Schyns, P. G. (2009). Inverse mapping the neuronalsubstrates of face categorizations. Cerebral Cortex,19(10), 2428–2438. doi:10.1093/cercor/bhn257.
Smith, M. L., Gosselin, F., & Schyns, P. G. (2007).From a face to its category via a few informationprocessing states in the brain. Neuroimage, 37(3),974–984. doi:10.1016/j.neuroimage.2007.05.030.
Smith, M. L., Gosselin, F., & Schyns, P. G. (2006).Perceptual moments of conscious visual experienceinferred from oscillatory brain activity. Proceedingsof the National Academy of Sciences, USA, 103(14),5626–5631.
Smith, M. L., Gosselin, F., & Schyns, P. G. (2004).Receptive fields for flexible face categorizations.Psychological Science, 15(11), 753–761. doi:10.1111/j.0956-7976.2004.00752.x.
Smith, S. M., & Nichols, T. E. (2009). Threshold-freecluster enhancement: Addressing problems ofsmoothing, threshold dependence and localisationin cluster inference. Neuroimage, 44(1), 83–98. doi:10.1016/j.neuroimage.2008.03.061.
Tang, H., Buia, C., Madhavan, R., Crone, N. E.,Madsen, J. R., Anderson, W. S., . . . Kreiman, G.(2014). Spatiotemporal dynamics underlying objectcompletion in human ventral visual cortex. Neuron,83(3), 736–748. doi:10.1016/j.neuron.2014.06.017.
Tenke, C. E., & Kayser, J. (2012). Generator localiza-tion by current source density (CSD): Implicationsof volume conduction and field closure at intra-cranial and scalp resolutions. Clinical Neurophysi-ology, 123(12), 2328–2345. doi:10.1016/j.clinph.2012.06.005.
Tsao, D. Y., & Livingstone, M. S. (2008). Mechanismsof face perception. Annual Review of Neuroscience,
31, 411–437. doi:10.1146/annurev.neuro.30.051606.094238.
Ullman, S. (1996). High-level vision. Cambridge, MA:MIT Press.
Ullman, S., Vidal-Naquet, M., & Sali, E. (2002). Visualfeatures of intermediate complexity and their use inclassification. Nature Neuroscience, 5(7), 682–687.
Ullsperger, M., & Debener, S. (2010). SimultaneousEEG and fMRI: Recording, analysis, and applica-tion. Oxford, UK: Oxford University Press.
van Rijsbergen, N. J., & Schyns, P. G. (2009).Dynamics of trimming the content of face repre-sentations for categorization in the brain. PLoSComputational Biology, 5(11), e1000561. doi:10.1371/journal.pcbi.1000561.
VanRullen, R. (2011). Four common conceptualfallacies in mapping the time course of recognition.Frontiers in Psychology, 2, 365. doi:10.3389/fpsyg.2011.00365.
Watanabe, S., Kakigi, R., & Puce, A. (2003). Thespatiotemporal dynamics of the face inversioneffect: a magneto- and electro-encephalographicstudy. Neuroscience, 116, 879–895.
Widmann, A., & Schroger, E. (2012). Filter effects andfilter artifacts in the analysis of electrophysiologicaldata. Frontiers in Psychology, 3, 233. doi:10.3389/fpsyg.2012.00233.
Wilcox, R. R. (2012). Introduction to robust estimationand hypothesis testing. Boston: Academic Press.
Yovel, G., & Freiwald, W. A. (2013). Face recognitionsystems in monkey and human: Are they the samething? F1000prime Reports, 5, 10. doi:10.12703/P5-10.
Zerouali, Y., Lina, J.-M., & Jemel, B. (2013). Optimaleye-gaze fixation position for face-related neuralresponses. PLoS One, 8(6), e60128. doi:10.1371/journal.pone.0060128.
Journal of Vision (2014) 14(13):7, 1–24 Rousselet, Ince, van Rijsbergen, & Schyns 24
![Impacts of mesoscale activity on the water massesdoglioli/Rousselet... · The latter study and Qiu et al. [2009] also showed that barotropic instabilities of 49 the NVJ and the NCJ](https://static.fdocuments.us/doc/165x107/5f31b27db60c5d6c5f38d178/impacts-of-mesoscale-activity-on-the-water-masses-dogliolirousselet-the-latter.jpg)


![CFD modelling of a pilot-scale counter-current spray drying tower …eprints.whiterose.ac.uk/99393/1/Final Manuscript -TM rev... · 2021. 4. 16. · 4 Wawrzyniak et al.[32] developed](https://static.fdocuments.us/doc/165x107/612e8d311ecc51586942e2af/cfd-modelling-of-a-pilot-scale-counter-current-spray-drying-tower-manuscript-tm.jpg)


![[C. J. Van Rijsbergen] the Geometry of Information(BookFi.org)](https://static.fdocuments.us/doc/165x107/577cc7071a28aba7119fd12f/c-j-van-rijsbergen-the-geometry-of-informationbookfiorg.jpg)