Rotationally Resolved Diode Laser Jet Spectroscopy of Propadienone (CH 2 CCO) in the 3 Band Region...
19
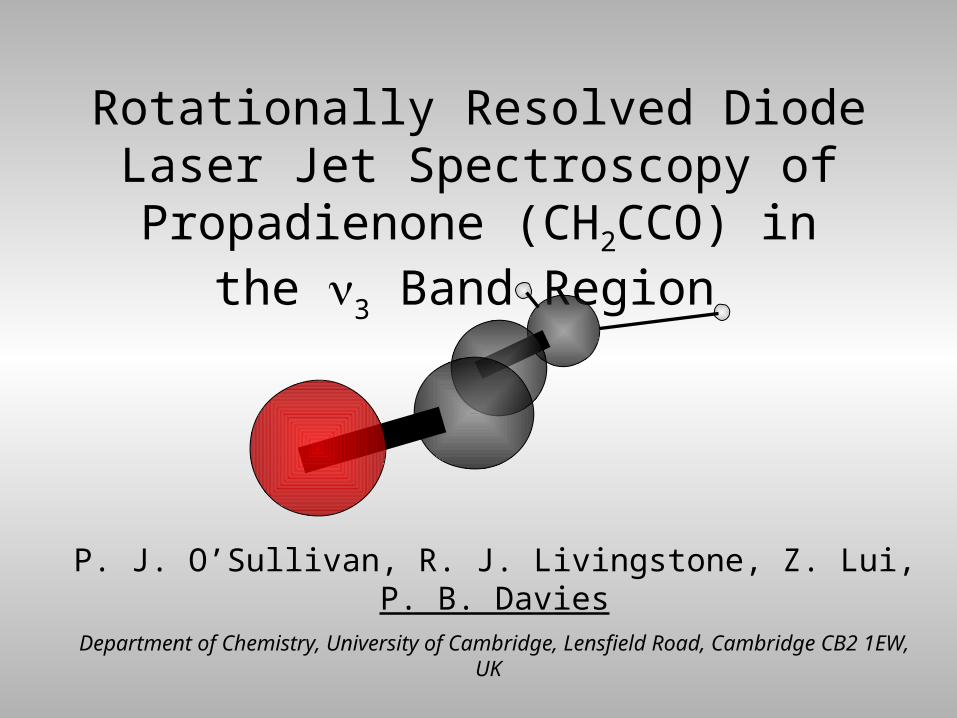
Rotationally Resolved Diode Laser Jet Spectroscopy of Propadienone (CH 2 CCO) in the 3 Band Region P. J. O’Sullivan, R. J. Livingstone, Z. Lui, P. B. Davies Department of Chemistry, University of Cambridge, Lensfield Road, Cambridge CB2 1EW, UK
-
Upload
nathaniel-jared-obrien -
Category
Documents
-
view
217 -
download
4
Transcript of Rotationally Resolved Diode Laser Jet Spectroscopy of Propadienone (CH 2 CCO) in the 3 Band Region...
Rotationally Resolved Diode Laser Jet Spectroscopy of Propadienone
(CH2CCO) in the 3 Band Region
P. J. O’Sullivan, R. J. Livingstone, Z. Lui, P. B. DaviesDepartment of Chemistry, University of Cambridge, Lensfield Road, Cambridge CB2 1EW, UK

Introduction
• Propadienone is a member of the cumolenone series (H2CnO), is short lived and has a non rigid kinked backbone.
• Microwave spectra measured in the low frequency ν12 bending mode : Brown, Godfrey and Champion, J. Mol. Spec., 123, 93 (1987)
• Infrared spectra in N2 and Ar matrices; no rotationally resolved gas phase spectra
• Pulse Pyrolysis Infrared Laser Jet Spectroscopy used to produce a rotationally resolved spectrum

The Kinked Structure of Propadienone (PPD)

Double-Well Potential for PPD1
• Vibrational levels split by quantum tunnelling through inversion barrier.
• Lowest pair of vibrational levels separated by 3.7GHz (0.123cm-1).
• Splitting of subsequent levels dependent on energy in relation to the inversion barrier and component of vibration along inversion axis.
1 R.D. Brown, P.D. Godfrey, R. Champion J.Mol.Spec 123, 93 (1987)

4000 3500 3000 2500 2000 1500
Wavenumber (cm-1)
A
bsor
banc
e
0
0.2
0.4
0.6
0.8
1.0
1.2
1.4
1.6
Infrared Spectrum of Matrix-isolated PPD1
1 O.L. Chapman, M.D. Miller, S.M. Pitzenberger J. Am. Chem. Soc. 109, 6867 (1987)
argon matrix
Freq. (cm-1) Intensity
3049
3024
2978
2974
2603 0.58
2177 14.21
2125 72.06
2079 0.83
1959 0.68
1690 1.16
1444 0.65
1046 3.44
980 2.51
903 0.40
668 -
473 0.77
nitrogen matrix
Freq. (cm-1) Intensity
3037
3026
2978
2968
2604 0.51
2172 6.17
2124 82.93
2075 0.95
1973 0.33
1685 0.87
1457 0.17
1047 2.25
988 2.40
910 0.15
674 0.27
479 0.65
1.37
1.62
1.18
1.16

Experimental

Experimental – Flash Pyrolysis Nozzle1
• Ceramic tube: 1mm i.d., 2mm o.d., 42mm long
• Heating coil: thin NiCr wire, insulated by MgO, inside a stainless steel sheath. 10mm long, 3.5 Ω
• Applied power of 10W → 1500K inside tube.
1. P. Chen, S.D. Colson, W.A.Chupka, J.A. Berson J.Phys.Chem. 90, 2319 (1986)
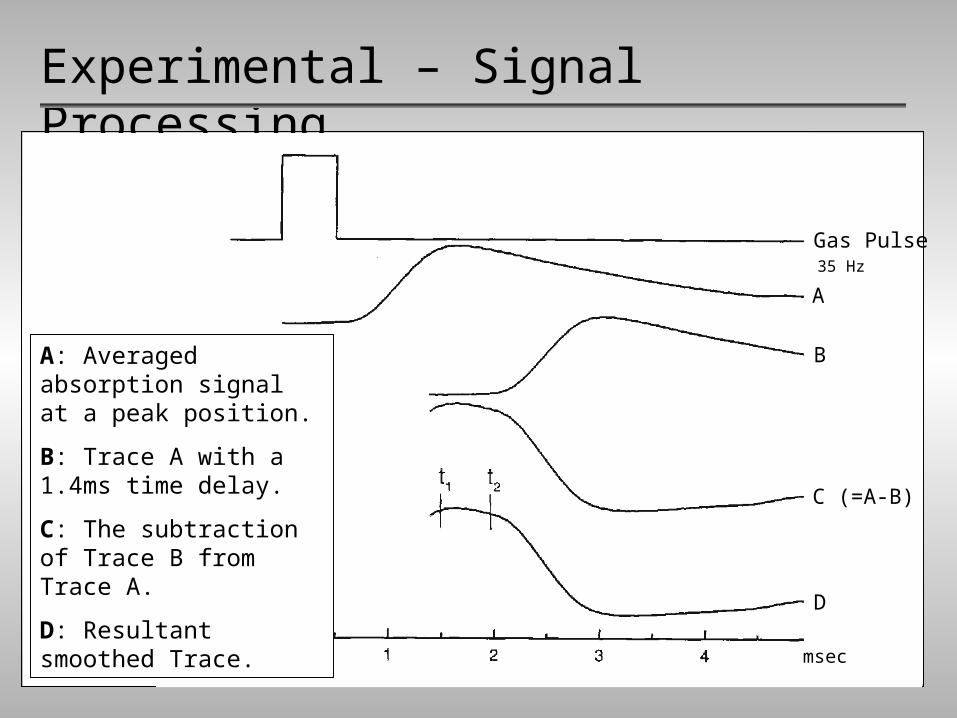
Experimental – Signal Processing
A: Averaged absorption signal at a peak position.
B: Trace A with a 1.4ms time delay.
C: The subtraction of Trace B from Trace A.
D: Resultant smoothed Trace.
Gas Pulse
A
B
C (=A-B)
D
35 Hz
msec
• Synthesis of Propadienone based on pyrolysis of either
(ii) diazotetronic acid:• Synthesis of Propadienone based on pyrolysis of either
(i) 2,2-dimethyl-5-methylene-1,3-dioxan-4,6-dione:
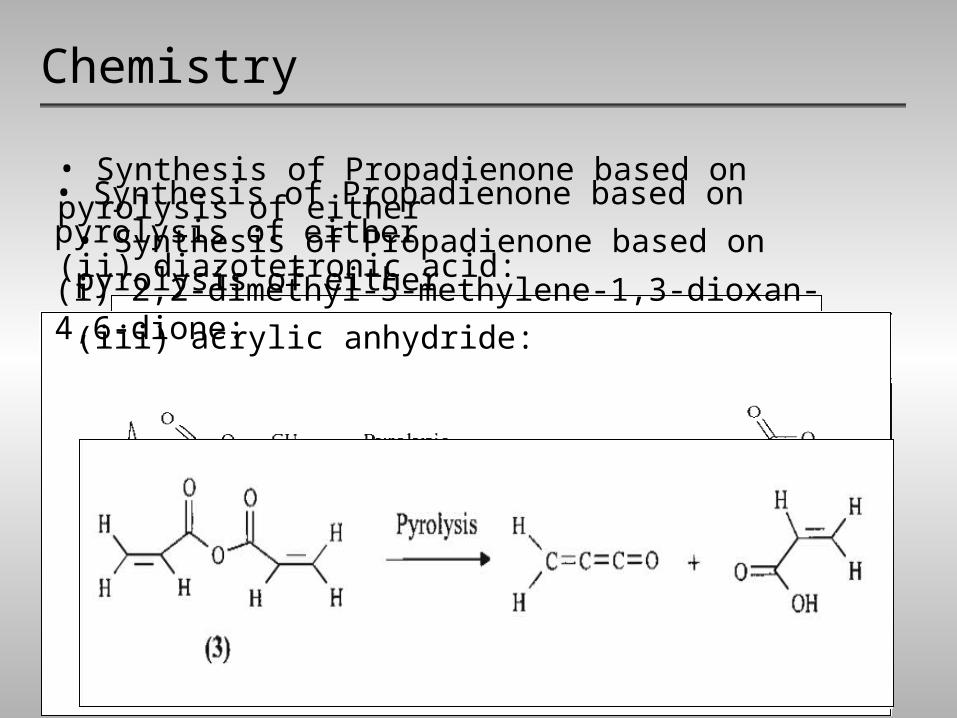
Chemistry
• Synthesis of Propadienone based on pyrolysis of either
(iii) acrylic anhydride:

Chemistry
• All three starting compounds have to be synthesised in the laboratory but only acrylic anhydride (iii) is stable for more than a few days and was therefore the preferred reagent.
• Conditions:
Acrylic anhydride heated to 80oC
Nozzle temperature of 600oC (heating length = 20mm)
Backing pressure of argon = 2.5 bar
Nozzle-laser distance = 5mm

Spectral Details
• Continuous spectral coverage from 2123.2cm-1 to 2132.9cm-1, using several modes from a single diode laser.
• Over 180 intense lines observed and measured with an estimated accuracy of 0.0003cm-1.
• Several series of regularly spaced lines separated by the order of (B + C) = 0.288 cm-1 for the ground state.
• Absorption signals disappeared below 450oC.

Sample Spectra
2127.0 2127.5 2128.0
2128.5 2129.0 2129.5Frequency (cm-1)

Loomis-Wood Plot of Hypothetical PPD
0
50
100
150
200
250
300
350
400
450
0.00 0.05 0.10 0.15 0.20 0.25
R-branch
Q-branch
P-branch
Upper state constants identical to ground state constants:
• Very regular series of lines with no distortion, as expected.
• Indication of approximate magnitude of asymmetry doubling.
• Q-branch expected, although not intense and may be dispersed in real spectrum.

Loomis-Wood Plot PPD
0.00 0.05 0.10 0.15 0.20 0.25
cm-1 (B+C = 0.29cm-1)0.00 0.05 0.10 0.15 0.20 0.250.00 0.05 0.10 0.15 0.20 0.250.00 0.05 0.10 0.15 0.20 0.25

Q-branch structures in CCO Antisym. Stretch of Ketene1
1. J.L. Duncan, A.M.Ferguson, J.Harper, K.H.Tonge, F.Hegelund J. Mol. Spec. 122, 72 (1987)
• Q-branch structures of isotopically-substituted ketenes suggest an unusual arrangement of the Ka sub-bands.
• If propadienone is similarly erratic, this could account for:
A dispersed and unidentified Q-branch
The apparent lack of a relationship between the observed series in the Loomis-Wood plot.

Ground State Combination Differences (cm-1) for PPD
JKc’ – JKc” Microwave Infrared Obs-Calc (104)
Ka = 0
22 – 00 0.8651 0.8675 23
33 – 11 1.4419 1.4422 3
44 – 22 2.0186 2.0194 8
55 – 33 2.5951 2.5958 7
66 – 44 3.1716 3.1723 7
77 – 55 3.7479 3.7480 1
88 – 66 4.3240 4.3212 -28
99 – 77 4.9000 4.9025 26
1010 – 88 5.4757 5.4789 32
1111 – 99 6.0511 6.0501 10
1212 – 1010 6.6262 6.6075 -187
1313 – 1111
1414 – 1212
1515 – 1313 8.3469 8.3467 -2
JKc’ – JKc” Microwave Infrared Obs-Calc (104)
Ka = 1
33 – 11 1.4313 1.4335 22
32 – 10 1.4530 1.4521 -9
44 – 22 2.0038 2.0035 -3
43 – 21 2.0341 2.0340 -1
55 – 33 2.5762 2.5747 -15
54 – 32 2.6153 2.6176 23
66 – 44 3.1487 3.1481 -6
65 – 43 3.1964 3.1954 -10
77 – 55 3.7212 3.7213 1
76 – 54 3.7775 3.7769 -6
88 – 66 4.2936 4.2932 -4
87 – 65 4.3586 4.3581 -5
99 – 77 4.8660 4.8683 23
98 – 76 4.9396 4.9415 19
1010 – 88
109 – 87 5.5207 5.5204 -3
1111 – 99 6.0107 5.9963 -144
1110 – 98 6.1016 6.1011 -5
1212 – 1010
1211 – 109 6.6826 6.6823 -2

Molecular Constants (cm-1) of PPD
υ12 = 0 υ12 = 1
Ground State υ3=1 Ground State υ3=1v0 2127.690641(32) 2127.690624(32)
A 5.122646(2) 5.006123(113) 5.112639(3) 4.99517(117)
B 0.146336(1) 0.145570(6) 0.1463560(1) 0.145595(6)
C 0.142036(1) 0.142583(5) 0.1420173(1) 0.142561(5)
Δ (amuǺ2) 0.197 -0.919 0.221 -0.888
DJ(x10-8) 5.82(10) -60.9(13) 5.79(10) -60.5(13)
DJK(x10-5) -2.621(13) -101.51(17) -2.596(10) -101.57(17)
DK(x10-1) -1.1284(33) 4.8595(16) -1.1292(33)4.8486(16)
D1(x10-9) 7.61(17) -4642(21) -7.17(17) -4669(21)
Hkj(x10-7) 1.03(67) -981.5(24) -9.21(67) -977.5(25)
κ -0.998 -0.999 -0.998 -0.999
Lines 135 135
Rms 0.0028 0.0028

• Rotationally resolved spectrum of the ν3 C-O stretching fundamental of propadienone recorded
• Combination Differences and Loomis Wood plots lead to assignment of many Ka = 0 and 1 P-and R-branch lines
• Structure of the IR spectrum and of the upper state constants indicate a significant change in the ν12 inter-conversion potential for the upper level and/or perturbations of the upper level
• Next step? Analysis of congested region about 4.5 cm-1 below band origin – possible intersystem v12 = 0-1 lines ( Δ Ka = -1)
Conclusions

Ray LivingstoneZhuan Liu Paul O’SullivanIain Bell
£££££ EPSRC
Acknowledgements