Ross Stores, Inc. - Texas Tech...
162
Ross Stores, Inc. Equity Valuation Report Michael Moss [email protected] Dee Foster [email protected] Alex Hart [email protected] Neil Merkling [email protected] Garrett Harless [email protected] Emily Dale [email protected]
Transcript of Ross Stores, Inc. - Texas Tech...
Ross Stores, Inc.
Equity Valuation Report
Michael Moss [email protected] Dee Foster [email protected] Alex Hart [email protected] Neil Merkling [email protected] Garrett Harless [email protected] Emily Dale [email protected]

2
Table of Contents
Executive Summary 5
Business and Industry Analysis 12
Company Overview 12
Industry Overview 13
Five Forces Model 14
Rivalry Among Existing Firms 14
Threat of New Entrants 19
Threat of Substitute Products 22
Bargaining Power of Buyers 23
Bargaining Power of Suppliers 25
Analysis of Key Success Factors 27
Firm Competitive Advantage Analysis 32
Tight Cost Control System 32
Differentiation 35
Accounting Analysis 36
Key Accounting Policies 38
Operating and Capital Lease Disclosure 38
Company Growth Statistics 39
Purchasing, Merchandise, and Inventory 39
Goodwill and Hedging 40
Potential Accounting Flexibility 41

3
Actual Accounting Strategy 44
Qualitative Analysis of Disclosure 45
Quantitative Analysis 48
Core Sales Manipulation Diagnostics 48
Expense Manipulation Diagnostics 54
Identifying Potential “Red Flags” 55
Analysis of Investment Activities 56
Undoing Accounting Distortions 58
Financial Analysis, Forecast Financials, and Cost of Capital 60
Financial Ratio Analysis 61
Liquidity Ratios 61
Profitability Ratios 69
Capital Structure Analysis 76
Altman Z-Score 79
Internal and Sustainable Growth Rate Analysis 80
Financial Forecast Analysis 82
Forecasted Income Statement 83
Forecasted Balance Sheet 84
Forecasted Statement of Cash Flows 87
Weighted Average Cost of Capital 89
Cost of Equity 89
Cost of Debt 92
Weighted Average Cost of Capital 93

4
Financial Valuations 93
Method of Comparables 93
Intrinsic Valuations 98
Discounted Dividend Model 99
Discounted Free Cash Flows Model 101
Residual Income Model 103
Abnormal Earnings Growth Model 105
Long Run Residual Income Perpetuity Model 106
Analyst Recommendation 109
Appendix 111
Ross Financial Statements as Stated 112
Ross Financial Statements Restated 116
Kohl’s Financial Statements 120
T.J. Maxx Financial Statements 123
J.C. Penney Financial Statements 126
Manipulation Diagnostics 129
Lease Capitalization 132
Financial Ratios 134
Altman Z-Scores 141
Intrinsic Valuations 142
Regressions 149
Reference 162

5
Executive Summary
Investment Recommendation: Overvalued, Sell April 1, 2008
ROST - NASDAQ (04/01/2008) $31.07 Altman Z-Scores 52 week range $21.23 - $34.69 2002 2003 2004 2005 2006 2007 Revenue $5.57 B As Stated 7.27 6.08 6.25 5.76 5.85 5.26 Market Capitalization $4.32 B Restated 3.66 3.36 3.45 3.44 3.55 3.31 Shares Outstanding 139.02 M Percentage Institutional Ownership 97.30% Market Price 04/01/2008 $31.07 As Stated Restated Financial Based Estimated Valuations As Stated Restated Book Value per Share $6.54 $6.54 P/E (Trailing) $24.59 $29.70 Return on Equity 28.90% 34.86% P/E (Forecasted) $24.85 $31.82 Return on Assets 12.46% 9.13% P/B $15.42 $15.42 D/P $19.47 $19.47 Cost of Capital P.E.G. $17.27 $23.75 Estimated R-square Beta Ke EV/EBITDA $31.26 $52.59 3-month 0.1067 0.7395 7.20% EV/FCF $42.86 $77.74 1-year 0.1071 0.7408 7.14% 2-year 0.1068 0.7395 7.00% Intrinsic Valuations As Stated Restated 5-year 0.1058 0.7356 7.78% Discounted Dividends $4.01 $3.65 10-year 0.1049 0.7325 8.72% Free Cash Flows $38.73 $65.20 Residual Income $10.00 $10.19 As Stated Restated AEG $8.55 $8.16 Ke Based on Long-Run Residual Income 17.25% 18.89% Long Run Residual Income $22.26 $24.80 Published Beta 0.04 Cost of Debt 5.94% 5.91% WACC (BT) 14.17% 13.41% WACC (AT) 13.54% 12.44%
http://moneycentral.msn.com

6
Industry Analysis
Ross Stores Inc. started out as a junior retail store in the small California
town of San Bruno in 1957. The business remained relatively unchanged for
over 25 years until it was bought out by a group of investors in 1982. These
investors, lead by Stuart Moldaw and Don Rowlett, created a discount retail giant
out of a few junior retail stores. They were able to do this by saturating the
west coast market with discount retail stores before its competitors.
In the discount retail industry there is high rivalry among firms, high
threat of substitute products, and high bargaining power of buyers. These three
factors would imply that it is a commodity industry. Due to economies of scale
there is also low threat of new entrants. Suppliers have low bargaining power
due to the nature of the firms’ buying strategies. The standard industry practice
is to buy off-season merchandise, factory overruns, and overstocked
merchandise. They then place these purchases into storage until the next
appropriate selling season.
We have concluded that Ross’ main competitors are T.J. Maxx, Kohl’s, and
J.C. Penney. These companies operate similarly to Ross in their buying
strategies and asset management. They also all target consumers looking for
fashionable clothing at affordable prices. Therefore, companies in this industry
compete on product selection and cost.
In order to remain viable in the industry, firms must maintain low input
costs, tight cost control system, cost leadership, and economies of scale. Firms’
input cost can be controlled through their buying strategy. Tight cost control
systems are implemented using technology and minimal waste. This allows the
firms to compete on cost. Economies of scale translate into volume purchasing
and mass merchandising of goods. This requires a large number of stores and a
solid distribution network, making it difficult to enter the discount retail industry.

7
These are the key success factors that must be met in order to succeed in the
discount retail industry.
Accounting Analysis
When valuing a firm, it is important to look closely at the firm’s financial
statements. In order to provide an accurate valuation, it is necessary to question
the accuracy of these statements. Though the SEC regulates the level of
disclosure that firms must provide through GAAP, it is preferable that a firm
discloses more information than the required amount. GAAP also allows a fair
amount of flexibility when it comes to making key accounting practice decisions.
This often can lead to managers manipulating financial statement data to paint a
better picture of the company. It is necessary to identify any manipulations that
may be taking place and evaluate their impact on the financials.
We determined that Ross has a high level of disclosure in their
statements. They provide detailed information on the use of operating leases,
purchasing and inventory practices, and goodwill and other long-term assets.
Ross also disclosed their investment activities in detail. Because of this high level
of disclosure, we were able to easily determine their key accounting policies.
The only policy that had any significant effect on the appearance of the
financials was Ross’ decision to use operating leases for their stores. By using
operating leases instead of capital leases, Ross avoided recording a substantial
amount of liabilities and assets. We found it necessary to capitalize the leases to
see the effect it would have on the balance sheet. The result was significant
enough that we decided to restate all of Ross’s financial statements in order to
ensure we had an accurate picture of Ross. Because of the capitalization of the
leases, Ross’s assets and liabilities in 2007 increased from $2.3 billion to $3.7
billion. This means that Ross avoided recording over $1.37 billion in assets and

8
liabilities. These restatements proved to be crucial to our forecasts and
valuations.
In order to detect manipulation in the sales and core expenses, we
performed several diagnostics. These diagnostics are designed to discover
abnormal changes in key expense ratios. As certain elements change, the results
can cause us to question the validity of the financial information presented by
the company. During our review of these diagnostics we did not find any
abnormal or unusual results.
Financial Analysis, Forecast Financials, & Cost of
Capital Estimation
When looking at a firm and attempting to perform a financial analysis,
there are three areas that need to be evaluated. Each one contains its own set of
ratios in order to perform this task. These ratios are categorized into liquidity,
profitability, and capital structure. Each of these gives a better understanding of
how the company works. Also, it is necessary to use past and current data in
order to forecast out the firm’s financial statements and gain an idea of how the
company may perform in the future. Lastly, a regression model must be created
in order to configure a Beta, cost of debt, cost of equity, and a weighted average
of the cost of capital so that we may use these key components in valuation
models later on.
After calculating all of the liquidity ratios, we found that Ross is a little less
liquid than other firms in the industry. This means that Ross is less able to
convert current assets into cash than its competitors. For example, Ross’ six-
year average current ratio was 1.49 in comparison to an industry average of
1.86. Also, Ross’ performance is not in keeping with the industry average when

9
it comes to inventory turnover. The industry average was 4.23, and Ross was
3.80. In regards to Ross’ profitability, they are doing a good job keeping up with
the industry average. In most cases Ross’ ratios were either at or above the
industry average. However, in comparing Ross’ ratios with the restated
financials, some of the results differed from the original ones. As for evaluating
their capital structure, we found that Ross is primarily financed through debt
rather than equity. This is likely due to the fact that Ross has a lower cost of
debt than cost of equity.
We then, with the aid of the financial ratios, were able to forecast
Ross’ financial statements ten years out. We did this by analyzing past data as a
benchmark to determine any trends in growth. In order to do this, we needed to
establish an average growth rate for Ross. We used the average sales growth
over the past three years, and our knowledge of current economic events, to
determine the growth rate to be 10.26%. We then used different ratios to link
all of the financial statements together based on this sales growth figure. We
were then able to forecast all of the important line items for all of the financial
statements. These forecasts would be used to help us predict future business
performance, and were also used in performing certain valuation models.
As far as our cost of capital analysis, we first used the CAPM model to find
the cost of equity. After running several regressions, we soon found that the
explanatory power was too insufficient to provide an accurate beta for Ross.
Instead, we were forced to use the long run residual income perpetuity model to
find the cost of equity. Using this model we found it to be 17.25% as stated and
18.89% restated. Cost of debt was fairly simple to calculate since they had only
a few liability accounts and few interest rates involved. We calculated Ross’ cost
of debt to be 5.94% as stated and 5.91% restated. We then used the cost of
equity and the cost of debt to calculate the weighted average cost of capital to
be 13.54% as stated and 12.44% restated.

10
Valuations
The valuations are the capstone of the entire analysis. At this point in the
process, we have all of the information needed to begin. We valued Ross two
ways; we used the method of comparables and we used intrinsic models.
The first type of valuation uses simple ratios; this is called the method of
comparables. The method of comparables is a popular way to value companies
because it is easy to understand and explain to investors. There are six ratios
that are generally used in valuing the company. These include: P/E trailing and
forecasted, P.E.G., P/B, P/EBITDA, EV/EBITDA, and P/FCF. Utilizing the method
of comparables, most ratios indicated that we were overvalued. When we
computed Ross’ EV/EBITDA we came up with $31.26; this closely mirrors the
published stock price as of April 1, 2008. This is probably due to the fact that
EV/EBITDA has become the new standard in comparables valuations. Although
easy to compute and understand, there is no financial theory backing the
method of comparables.
Intrinsic models are preferred by financial analysts because they are
backed by financial theory. The intrinsic models used were: the discounted
dividend model, discounted free cash flows, residual income, abnormal earnings
growth, long run residual income. We ran sensitivity analysis on each model to
determine the sensitivity to variables such as cost of equity, weighted average
cost of capital, return on equity, and growth rates. Through this analysis it
became apparent that the DFCF model is unreliable because of its extreme
sensitivity to variable changes. The dividend discount model is also unreliable
due to its heavy reliance on the perpetuity growth rate. This model is generally
inapplicable because investors can never recoup their initial investment from
dividends.
The abnormal earnings growth model, residual income model, and long
run residual income model are more reliable models. These models take into

11
account more factors which allows for a more complete valuation of the firm.
When we ran a sensitivity analysis on the residual income model, long run
residual income, and abnormal earnings growth model we found that all models
are very sensitive to the cost of equity. This shows that the models rely more on
forecasted information than the perpetuity because growth rates cause minimal
changes.
We found Ross to be overvalued in four of the five models and therefore
conclude that it is overvalued. The only model that differs from this is the
discounted free cash flows model, which we disregard due to the extreme range
of values that it returned.

12
Business and Industry Analysis
Company Overview
Ross Stores, Inc. (ROST) first opened its doors to the people of California
in 1957 as a junior’s specialty retailer. The company continued its business as a
junior’s specialty retailer until August of 1982 when two investors, Stuart Moldaw
and Donald Rowlett, gained control of the company and began to shape the
company into its current form.
These two men had plenty of experience in the off-price retail industry
and put that experience to work. They realized that the discount retail industry
had yet to pioneer the West, and decided the market for discount clothing was
there. They took advantage of the lack of competition by first adding men and
women’s clothing to the store and selling them at discount prices. They decided
soon to expand quickly into other cities and opened 20 stores within the first two
years of ownership, expanding the Ross company more than threefold. This
rapid expansion was intended to saturate the market and make it difficult for
competitors to in enter the market.
This extraordinary growth has continued for more than 20 years, and
Ross Stores, Inc. is now the nation’s second largest discount retailer next to the
TJX Companies, Inc. Ross Stores, Inc. now does business in 771 Ross Dress for
Less stores across 27 states and Guam. The company also runs 26 dd’s
Discounts stores spread out over the state of California. However, Ross
maintains a market cap of approximately $4.32 billion, which is relatively small,
compared to its competitors.
Ross Stores, Inc. competitors include TJX Companies, Inc., Kohl’s, and
J.C. Penney. These three competitors are the biggest competitors to Ross
Stores, Inc.

13
Ross Stores, Inc. stock price has been indicative of how well the company
has done for that specific year. They have kept their commitment to maintain
competitive prices and continue company growth. The total assets as well as the
net sales are constantly increasing from year to year. This is important because
it proves that Ross’s strong growth is good news for stockholders.
Industry Overview
Ross Stores, Inc. is currently operating in the off-price retail apparel
industry with its main competitors being T.J. Maxx, Kohl’s, and J. C. Penney.
The off-price retail apparel industry is a highly competitive industry but does
allow all companies to have increases in net sales. The way this is possible is by
companies buying low, and selling low. This is possible because every company
in the industry has several stores and warehousing to store inventory goods.
Industry leaders benefit from trouble in high-end retail industries by capitalizing
on inventory liquidity. (WSJ.com: TJX, Ross benefit from other retailer
downturns)
Each company in the industry competes in six different submarkets.
These submarkets are ladies’ apparel, men’s apparel, fine jewelry accessories
lingerie and fragrances, shoes, and children’s clothing. The sales of these goods
directly determine the net sales for the companies. This allows companies to
decide what to compete in.

14
Five Forces Model
The five forces model is a model that helps to define and classify an
industry. The model helps to identify who the players are in a given industry, as
well as, the overall size and condition of the industry. The model is divided into
two broad sections: Actual and Potential Competition and the Bargaining Power
of Buyers and Sellers. These broad categories give a picture of the macro view
of an industry. These broad categories are then broken down into smaller
categories. The sub-categories for the competition category are Rivalry Among
Existing Firms, Threat of New Entrants, and Threat of Substitute Products.
Bargaining Power is divided into buyer’s bargaining power and supplier’s
bargaining power. Analysts can use the information contained in the five forces
model to determine the potential profitability of an industry and/or a particular
firm within the industry.
Ross Stores, Inc.
Rivalry Among Existing Firms High
Threat of New Entrants Low
Threat of Substitute Products High
Bargaining Power of Buyers High
Bargaining Power of Suppliers Low
Rivalry Among Existing Firms
Rivalry among existing firms is very useful for determining what kind of
profits are possible in a given industry or sector of an industry. Firms compete
against other firms in an industry for the same consumers’ dollars. There are

15
two basic ways that firms compete: price and differentiation. The degree of
rivalry and type of product or service that is being sold will determine the
strategy that firms pursue. The degree of rivalry for Ross in the retail apparel
industry is very high. The sector that includes Ross, Kohl’s, T.J. Maxx and J.C.
Penney competes on price.
Industry Growth
Industry growth is an important measure of how firms are doing as a
whole. The most recent five years of data provide an indication of trends and
cycles within the industry. They also give an indication of the industry’s potential
for future growth. Growth is also an indicator of how a firm will compete. Firms
have to fiercely compete for other firms’ existing customers in a stale growth
environment. Conversely, there will be plenty of new customers to increase an
individual firm’s market share in a high growth situation. The retail apparel and
home accents industry is a highly competitive and segmented industry and relies
heavily on the middle class as its primary customers. The off-price retail industry
is a very competitive segment of the overall retail environment. Discount retailers
do better as other department stores do worse (WSJ.com, Lookahead:Retail
Check-up). There are well-established firms that have been controlling and
In d u s try G ro w th R a te
-5 0 .0 0 %
-4 0 .0 0 %
-3 0 .0 0 %
-2 0 .0 0 %
-1 0 .0 0 %
0 .0 0 %
1 0 .0 0 %
2 0 .0 0 %
3 0 .0 0 %
2 0 0 2 2 0 0 3 2 0 0 4 2 0 0 5 2 0 0 6
Y e a r
R o s sK o h l'sT .J . M a x xJ .C . P e n n yIn d u s try
c

16
growing majority market share for years. As seen in the preceding graph, the
industry itself is not a very quickly growing entity. Its sales growth ratio for the
past five years has remained fairly level. Ross’ sales growth ratio trends have
remained in keeping with that of the industry.
Concentration
Relative Market Share
8%
21%
27%
44%Ross Stores, Inc
Kohl's Corporation
T.J. Maxx
J.C. Penney
Industry concentration refers to the number of firms in an industry. An
industry may have thousands of small firms or only a few large ones. It also
defines the relative size of firms to others in the industry and the proportion of
market share they hold in the industry as a whole.
The off-price retail industry is one of medium-low concentration. The
number of firms within the industry is somewhat limited; however, sufficient
competitive pressures exist to limit any one firm’s ability to earn extraordinary
gains. The main players in the industry are J.C. Penney (JCP), Kohl’s (KSS), Ross
(ROST), and T.J. Maxx (TJX). Each firm within the industry is competing for

17
essentially the same resources. These resources include employees, product,
store space, and customers. The firms with greater resources are able to
compete more aggressively for these assets, which can lead to competitive
advantages for them.
In the off-price retail industry, there are a few large firms controlling the
market share, as shown in the preceding graph. J.C. Penney controls the
greatest percentage of the industry at 44 percent, whereas Ross commands the
least amount at eight percent. In this aspect, Ross is at somewhat of a
disadvantage in that it has fewer resources with which to compete against such
strong competitors as J.C. Penney and T.J. Maxx.
Differentiation
The term differentiation refers to how similar or dissimilar competing
firm’s products are when compared to each other. If two firms have very similar
products, then they are extremely likely to engage in competition based on price.
Firms with more differentiated products are able to compete on other factors
such as style or features. There are varying levels of differentiation within the
retail apparel industry. Typically, price is the largest indicator of the level of
differentiation for a particular retailer’s products. Higher quality and more elite
brands will typically carry a higher price. The off-price retail apparel industry
sells national and recognizable name brands at heavily discounted prices. In this
way, these firms differentiate themselves from mass merchandisers such as Wal-
Mart or K Mart, but not to the same extent as firms like Nordstrom’s. Off-price
retailers are, however, very price competitive among themselves.
Switching Costs
Switching costs are the cost of buying from one firm versus another.
Firms within the off-price retail industry compete mainly on the basis of price.
With many of the firms within the industry offering identical and/or similar
products, customers have a high propensity to follow the price leader. Switching

18
costs are minimal for customers and therefore are of great concern to firms.
Switching costs for firms are different from that of customers. For instance, if
firm A and firm B offer similar quality products, a customer can buy from either
based solely on price. With firms in the off-price retail industry offering similar or
identical product mixes, there are very few switching costs for customers.
Economies of Scale
The term, economies of scale, refers to factors mainly involving the size of
operations. In an industry where economies of scale are of great importance,
the size of a firm can be vital to its survival. High volumes in purchases and
capital investments can give a firm a more profitable operation. Economies of
scale are of strategic importance to firms within this industry. Firms with the
resources to purchase in mass quantities have a distinct advantage over those
who cannot. It is imperative that firms have the ability to offer large quantities
of high quality goods at the lowest possible prices. Additionally, firms must have
the space to offer large amounts of product for sale and also store the products
they purchased.
In the off-price retail industry, each firm uses large scale centralized
distributing centers to supply a minimum of 750 stores. Ross is at the lower end
with 771 stores, while J.C. Penney leads the industry with 1073 locations. Ross’
other two main competitors, T.J. Maxx and Kohl’s, each have 800 and 930
stores, respectively. Such even numbers create a fairly level space distribution
physically amongst the firms in this industry, establishing an industry where
obtaining economy of scale is vital to a firm’s sustainability.
Excess Capacity
Excess capacity in an industry is basically when the supply of goods or
services is higher than the demand for those goods or services. When this
situation occurs, firms are inclined to cut prices to dump excess capacity
(product). Higher priced products do them no good setting on the shelves.

19
Firms within the retail industry must carefully plan and execute purchase and
sales plans. If not, a problem of excess capacity will arise. When firms within
the retail apparel industry experience excess capacity, price competition shortly
follows. A very intense and/or lengthy price war can lead to damaging results
for a firm and industry. Intense price competition can lead to pricing below
marginal costs.
Exit Barriers
Exit barriers are essentially the costs and/or legal problems
associated with a firm’s exiting an industry. Firms that have specialized assets
will have an especially hard time exiting an industry because of the difficulty in
liquidating their assets. The retail industry has little specialized equipment or
legal barriers to leaving the industry, making the exit barriers very low.
Conclusion
The industry has experienced respectable growth over the past five years
making it an attractive market. However, there are currently a large number of
competitors with little differentiation between firms making it very hard to stand
out amongst the crowd. In order to achieve the necessary economies of scale,
companies have to work hard to acquire resources before their competitors do.
Combined with the low switching costs for consumers, firms become highly
competitive amongst themselves in order to make a profit.
Threat of New Entrants
The threat of new entrants refers to the ability for a new firm to enter the
existing market. The overall profitability is largely determined by how easily new
firms can enter the arena. Large profits within an industry will be attractive to
new firms; therefore existing firms in the market will lower their pricing and
reduce their profits in order to discourage new entrants. Due to the large

20
economies of scale needed and the presence of large established companies, the
threat of new entrants is low.
Economies of Scale
For new entrants, the economy of scale refers to how much capital
resources they need in order to make a profit and be competitive in the industry.
The off-price retail sector requires a company to have a large amount of
inventory and a wide product mix. This means that it needs a great deal of initial
investment money in order to buy beginning inventory. Profit margins are slim,
averaging about 7% of sales. In order to make the business profitable, large
amounts of sales are needed. Additionally, the common business tactic in off-
price retail of buying products at a discount at the end of the season and storing
them until the next year requires large warehousing capabilities in order to be
effective.
In order to successfully enter the industry, new entrants need a large
amount of capital to achieve the necessary economies of scale. This makes it
very hard for new firms to enter the market. In the following table, we
document the number of stores that each firm had at the end of that year.
Considering the large number of stores needed, it would take a significant
amount of capital to be able to enter into the industry.
Number of Stores at Year End 2002 2003 2004 2005 2006Ross Stores 507 586 649 734 797Kohl's 457 542 637 732 817T.J. Maxx 713 745 771 799 821J.C. Penney 1043 1020 1017 1019 1033

21
First Mover Advantage
Traditionally, the first firm to enter a market has a great advantage over
any future competitor. First entrants can buy up vital resources and establish
exclusive relationships with key suppliers, making it harder for followers to set up
shop. Prime locations can be acquired without intense competition from related
firms. Name recognition is another advantage of the first mover. Typically,
consumers associate an industry with the first firm to establish itself within that
industry. The off-price retail industry already has several existing well-established
firms, such as Ross, J.C. Penney, Kohl’s and T.J. Maxx. Therefore, new entrants
will have a hard time gaining name recognition among consumers in the face of
existing competition.
Access to Channels of Distribution and Relationships
In the retail industry, the channels of distribution refer to the suppliers
and how a company gets its merchandise to the store. Established relationships
along with the high costs of creating new distribution channels present a
formidable barrier to new entrants. To be competitive, off-price retailers need a
large number of suppliers and have to spend resources in order to find and
maintain relationships with these suppliers. Ross has four centralized distribution
centers with which they supply all stores. There they use third party cross docks
to distribute merchandise that is then delivered to stores through contracted
vendors.
Legal Barrier
The legal barriers to entering an industry are the licensing fees,
regulations, copyrights, patents, and other government regulated requirements
for operating a business. For the retail industry, these are mostly licensing and
registration fees. There are minimal legal barriers to entry for the retail industry.

22
Conclusion
The threat of new entrants into the off-price retail industry is low.
Economies of scale are necessary for survival in this industry, and it is very
challenging for a new firm to achieve the amount of initial investment money
needed to enter this segment successfully. Also, prospective entrants are at a
disadvantage because this industry already has several existing, well-established
firms and would face great difficulty in pulling market share away from them.
Finally, a fledgling company would not easily be able to set up distribution
channels because of the strong relationships between existing suppliers and
firms.
Threat of Substitute Products
It is important to understand that, in many cases there are products or
services that serve the same purpose and are of similar quality and value. This
situation creates the possibility that consumers will choose a substitute product
over a product being offered by a competitor. In the off-price retail apparel
industry, there are not very many direct substitutes for clothing. However,
abundant substitution opportunities exist within the clothing market for
consumers to choose from. Many firms also carry the exact same name brand
clothing lines. This leads to a high threat of substitution. Customers will
purchase from the cost leader, given identical or similar products. Ross and its
competitors offer similar, if not identical, name brands and product mixes.
Therefore, the danger of substitute products is high within the industry.

23
Bargaining Power of Buyers
Buyers have power over the retail apparel industry to the degree that they
can affect changes in price. How they exercise this power and their reasons for
doing so influences, to a great extent, the business strategy of a company. When
buyers have a high degree of power they can demand and reasonably expect low
prices and a wide range of benefits from a company. Conversely, a low degree of
power on the buyer’s side gives the company more flexibility in pricing and what
they are willing to offer.
During strong economic growth, retailers’ bargaining power rises as
buyers are less likely to purchase based on price and are more willing to buy
entertainment items. That shifts the balance of power to the retailers favor.
Currently, the retail market is entering into a recession, with January sales being
the worst recorded (WSJ.com, Retailers' Sales Results for January Could Be
Worst Since 1969). Consumers are becoming more conservative in their
purchases. As a result, retailers have to lower prices and offer more concessions
in order to attract customers. Consequently the buyer’s power has risen.
Price Sensitivity
Price sensitivity refers to how much effort the average consumer is willing
to exert in order to find the price they are willing to pay. This effort can be either
through price comparison, bargaining, or simply waiting for a sale or discount.
When consumers in an industry are highly price sensitive, companies compete on
a cost-leader basis. This places a greater emphasis on finding cheap suppliers,
low overhead costs, and efficient distribution chains. The combined costs-of-
goods sold and operating expenses averages 90% of sales for this sector of the
retail apparel industry. With such a narrow profit margin, companies are
dependent on attracting a large number of customers.

24
For customers, especially the value-conscious group who go to Ross, there
is little differentiation within the industry. They look for quality apparel at
discount prices and brand loyalty gives way to price savings. So for them, it does
not matter where they make purchases. Additionally, there is no cost in
switching between retailers in order to find what they want at the price they
want. The increasing cultural emphasis on fashion combined with a large number
of manufacturers means that there are a lot of clothing styles out on the market.
The product assortment offered by any retail store is no longer unique to one
store or retail chain. Since clothes can last for a long time and be a large
purchase for the average consumer, there is a greater willingness to delay
purchases in order to find the best deal. The combination of these factors means
that consumers within this market sector are highly price sensitive.
Relative Bargaining Power
The buyer’s bargaining power is determined by the volume of consumers
relative to the number of retailers and the scale of purchases made by those
consumers. When there is a large number of consumers and a small number of
providers, the providers have power over the buyers. In the case of Ross and
other off-price department stores, there are a lot of buyers and a large number
of competing retailers. So individual buyers have little bargaining power, but
when large numbers of buyers decide to go to other locations, it drives the
company to respond. The high price sensitivity of consumers means that there is
a large probability that they will abandon any company that does not meet their
expectations. This tendency is deadly to retail companies due to the previously
mentioned narrow profit margin. Although an individual consumer does not make
large-scale purchases, meaning that the loss of one customer is statistically
insignificant in regard to total sales, it is in the store’s best interest to keep as
many customers as possible. Easy return policies are one way of keeping
customers happy (WSJ.com, Many Happy Returns? It Depends). This trait of the
retail industry means that buyers have a high level of bargaining power.

25
Conclusion
The high price sensitivity and level of relative bargaining power means
that the retail apparel industry is very susceptible to pressure from the buyers.
This means that retailers must keep prices low in order to stay competitive. In
order to make a profit they have to focus on reducing costs. In this sector of the
retail industry, buyers have a high level of bargaining power.
Bargaining Power of Suppliers
The suppliers’ bargaining power determines how much they can charge
retailers for goods and services. This directly affects a company’s costs-of-goods
sold expense, profit margin, and pricing structure. The level of power suppliers
have is based on the ratio of suppliers to retailers, the number of substitute
products available to retailers, and the degree to which a supplier’s product is
necessary for the retailer’s success. A high power level means that suppliers can
set prices and control the distribution schedule to firms in their target industry.
When suppliers have a low level of power, they are not in control of pricing their
own products and have to deliver goods when retailers want them.
In the off-price retail industry, the current strategy is to buy manufacturer
overruns, canceled orders, and overstocked merchandise. Suppliers are eager to
sell these dead-weight items in order to either recover manufacturing costs or to
clear space for the next shipment of goods. This allows retailers to bargain for
lower prices. However, the recent trend of retailers to have minimal levels of
inventory (WSJ.com, Retail Squeeze Felt Far Beyond Malls) means that there is
less need for offering discounts or selling off overstocked inventory.

26
Price Sensitivity
A supplier’s price sensitivity determines the price at which they are willing
to sell their product. This sensitivity varies depending on the season, economic
market, and a product’s quality and popularity. Apparel choices vary according to
the weather, making summer styles very cheap in winter and vice versa. Low
economic growth creates a reduction in prices in order to spur purchasing and
consumers are more willing to spend more when a product is of higher quality or
very popular, so suppliers can sell at a higher price.
Because of the nature of off-price retail, suppliers are not price sensitive.
Their major concern is to sell leftover merchandise as quickly as possible.
Suppliers have no incentive in retaining merchandise for later sales. In fact, it
can be more costly for a firm to store merchandise than to sell it at below-cost.
Relative Bargaining Power
In the off-price retail industry, firms usually have a large number of
potential suppliers. Ross, for example, deals with more than 6,000 vendors and
manufacturers. This high level of competition amongst suppliers significantly
reduces their bargaining power. Most products that retailers buy are not unique
to any one manufacturer, though there are some exceptions (WSJ.com, Kohl’s to
License Liz Claiborne Brand), so they are not dependent on any one product for
their business. This makes it hard for suppliers to gain a competitive advantage
because they have nothing unique to offer.
Conclusion
Suppliers have a low level of bargaining power. The market pressure to
dispose of unwanted goods makes it hard for suppliers to set prices they want.
The sheer number of potential vendors makes the individual contributions
insignificant in the market. Retailers have large amount of leeway in determining
from whom they will buy from and at what price.

27
Analysis of Key Success Factors
Overall Industry Classification
When looking at the industry in which Ross competes, it is easy to see
that this is an industry that contains high rivalry among existing firms, with a
very low threat of new entrants. This is due to the costs associated with entering
the industry. The segment in which Ross competes tends to focus on “off –
priced” products that they can sell to the masses at a discount. There also tends
to be a fairly high threat of substitute products in the industry, but this is likely
due to the lack of differentiation throughout the industry as a whole. A few of
the important factors in the industry as far as value creation are: utilizing
economies of scale and scope, being able to focus on the consumer’s wants and
needs, maintaining solid relationships with merchandisers and vendors, and also
operating within a tight cost control system.
In order to successfully compete within the retail industry, a company
must be able to distinguish itself from the masses. Doing this is easier said than
done. The firm must be able to utilize their resources in order to convert raw
inputs into a product with value. This is done through competitive strategies that
are often determined by the industry itself, and followed by firms such as Ross,
T.J. Maxx, J.C. Penney, and Kohl’s. In order to achieve and sustain a competitive
advantage in this industry a firm must have the capabilities to implement a
strategy using both a cost leadership and slightly differentiated approach. This is
essential in order to maximize the profits and reach the full capacity of the
market.

28
Competitive Strategy
In order to compete within the retail industry, a firm must be able to
adapt to the demands of its consumers. This is done by using a cost leadership
approach, yet some differentiation approaches are needed in order to create a
unique value for the firm. As stated before this is all done by implementing
economies of scale and scope, implementing efficient production systems,
utilization of brand recognition, and bringing into play a tight cost control
system.
Economies of Scale and Scope
The industry in which Ross finds itself in is very susceptible to economies
of scale. In an industry with large economies of scale, new entrants are faced
with the problem of creating enough beginning capital in order to get their
business launched off the ground. Even when a firm is able to accumulate
enough capital to start a business, there is no guarantee that the funds will be
utilized properly right away. Therefore, as mentioned above there are very few
new entrants that pose a serious threat to market share in the retail industry.
This is a perfect example as to why economies of scale are so important. In the
long – run firms can decrease the cost of making their goods by increasing their
volume to a point where they can mass produce and therefore cut down on their
ratio of fixed to variable costs. A good way to accomplish this task in the retail
industry would be to construct large distribution warehouses that are centrally
located within their retail stores. It is also beneficial to carry the same inventories
at each store, so that the products are made readily available to all consumers.
Economies of scope refer to the strategy associated with increasing or
decreasing the scope of marketing and distribution within an industry. This
is where the aspect of advertising and other marketing techniques
becomes extremely valuable because familiarizing potential customers with

29
the brands available is a vital key to the success of a firm in the retail
industry.
Low Input Costs
One of the key ways to increase profits within the retail industry is
to cut costs, specifically input costs. A simple way for large retailers in the
industry to do so is to maintain strong relationships with their suppliers.
Because most retailers place orders of such large quantities, most
suppliers are inclined to give large discounts for their raw goods. This
obviously allows retailers to sell their products for less, which once again
ties into the strategy of cost leadership. One aspect of the retail industry
that makes it difficult to cut input costs is that their business is extremely
volatile within the seasons. This means that firms within the industry are
likely to have a lot of excess inventory at the end of each season. Hence,
providing sales at huge discounts. This often makes it hard for retailers to
turn a profit during certain “slow months” of the fiscal year.
Tight Cost Control System
When operating a firm within the retail industry, it is essential to
employ a tight cost control system. This aspect of cost leadership is
basically the backbone of such a competitive strategy. Without a firm’s
dedication to operating within a tight cost control system, ultimately it will
fail within the retail industry. In essence, it holds all other cost leadership
practices together as one. As mentioned above, retailers benefit from
having large distribution warehouses throughout the country / world that
allow them to do most of their shipping from a few centrally located
warehouses. Also, retailers are at an advantage in that they often have the

30
same products at each store and are not very differentiated which
familiarizes the consumer with the products being offered.
Product Quality and Variety
Up until now the focus of this analysis has been completely on cost
leadership. Yet, in the retail industry there is also a need to differentiate
yourself from your competitors. Retailers must somehow find a way to
bring something “extra” to the table. This is where product quality and
variety come into play. As most retailers carry numerous brands, it is often
a focus to sell particular brands that contain a certain level of brand
recognition among consumers. This brand recognition is extremely
important not only so that you can sell these products, but it also brings
potential consumers into the store so that they might purchase other
products as well. However, this particular segment of the retail industry
deals primarily with durable products that are sold primarily for an “off –
price” while also selling a very diverse range of high quality products at
reasonably affordable prices.
Investment in Brand Image
In the retail industry, it is important to have brand recognition. Not
only do consumers generally have an idea of what they are looking for and
a price range to which they are willing to pay, but often times their
tendencies are swayed because of brand recognition. Most large retailers
in the industry try to gain contractual agreements with major brands so
that they can continue to employ the brand name in their stores. These
agreements are the basis behind getting customers through the doors to
shop in their stores.

31
Investment in Research and Development
In the retail industry research and development is important
because firms always want to know where the next trend is heading. In
order to stay ahead of the curve, firms must always have a good sense of
where the industry is headed. Consumers always want to feel like they are
getting the newest items on the market, and in order to do this retailers
must keep their shelves stocked with the latest fashionable items. A lot of
retailers’ research is done by analyzing feedback from their consumers. Yet
in order to maximize market share, retailers must be aware of the
direction that their competitors are going as well. This is especially true
with department store retailers.
Industry Analysis Conclusion
In conclusion, it has been determined that the ultimate goal for a
firm in the retail industry is to focus on cost leadership while also varying
their products enough to keep them differentiated from competitors.
Finding ways to bring value to the company and maximizing profits by
cutting costs and implementing a tight cost control system is key to
excelling in the industry. Economies of scale and scope keep the big
players on top by not allowing new entrants into the market and brand
recognition and investment in research and development pave the way for
the future of the firm.

32
Firm Competitive Advantage Analysis
In the highly competitive industry of apparel retail, it is essential for a
company to be able to set itself apart from the competition. A firm is able to do
this by capitalizing on the industry’s key success factors and implementing
strategies based on those factors to differentiate themselves from the
competition. Ross Stores Inc. is able to do this through a combination of
different strategies. Cost control and differentiation are areas that Ross Stores
excel in.
Tight Cost Control
Purchasing System
Ross employs a unique purchasing system that caters directly to the off-
price retailer. The company practices what they call “close out” and “packaway”
purchases. Close out purchases are purchases of a manufacturer’s excess
product. This is a strategy that allows Ross to take advantage of the imbalance
between manufacturers’ supply and retailers’ demand. (Ross 10-K) Packaway
purchases work much the same way as close out purchases, but where close out
purchases are more in-season, packaway purchases are bought out-of-season
and packed away until the next corresponding season. Packaway items
accounted for 38% of total inventory as of February 3, 2007. Also, Ross has a
network of over 6,000 vendors. A unique practice that Ross employs with their
vendors is that they do not require that manufacturers provide promotional
allowance, return privileges, or delayed deliveries. (Ross 10-K) By doing this
Ross is able to acquire merchandise at a cheaper cost than competitors.

33
Stores
The Ross stores are set up in such a way as to eliminate as much cost a
possible. All stores are laid out according to a flexible design plan, but they are
generally very similar. (Ross 10-K) Merchandise is relatively in the same place in
each store. These layouts help reduce cost when it comes to building and
converting existing buildings into new stores. This allows Ross to build without
wasting time and money on new designs for each of its new stores. Another
way that Ross uses its stores to cut costs also derives from the layouts. The
stores are designed with self-service for the customer in mind. This reduces cost
in the form of fewer employees. Fewer employees helping customers
throughout the store means a lower wage expense. One other way that Ross
controls their costs at a store level is a weekly review done by management of
specific departments in order to assess what product is not selling and what
could be done, like sales or markdowns, to encourage faster turnaround. (Ross
10-K)
Economies of Scale
Ross is able to use economies of scale to its advantage in several ways.
For one, Ross is not the largest discount retailer, but makes up for deficit in
number of stores by clustering their stores into a certain region, predominantly
the south and the southwest. As of February 3, 2007 Ross operated 771 stores
in 27 states, including one in Guam, and 26 dd’s DISCOUNTS in California. (Ross
10-K) Compared to Kohl’s 817 stores in 45 states and T.J. Maxx’s 821 stores in
48 sates Ross’ concentration of stores is greater than the competition (Kohl’s 10-
K, TJX Companies 10-K). Ross’ purpose for clustering their stores is to better
achieve economies of scale for that certain region. Also, Ross has a total of
seven distribution centers (four owned and three leased) spread out across the
country. Two of these centers are 1.3 million square feet each. (Well above any
distribution centers owned by Kohl’s or T.J. Maxx.) With all of its distribution
centers combined, Ross has a total of 4.449 million square feet of property, and

34
485,000 of that space is designated to storage of packaway items. (Ross 10-K)
The large amount of storage and distribution space allows for a high volume of
product to pass through, which leads to economies of scale. A central office for
merchandising, purchasing, and marketing decisions also leads to economies of
scale as for general and administrative costs. (Ross 10-K)
Information systems
Ross has, and is in the process of developing, many information systems
geared towards lowering costs. For example, a recent system put in to place is a
store-level Task Management System. This system allows Ross to monitor
employee efficiency and provides new avenues of communication between front-
line and higher-level management. (Ross 10-K) Being able to identify problems in
personnel effectiveness quickly leads to a faster solution of those problems
affectedly reducing labor costs by increasing individual productivity. Another
system that Ross had made recent enhancements on is their Warehouse
Management System. This system is in place for inventory control and
transaction accountability.
2002 2003 2004 2005 2006Merchandise Inventory $716,518 $841,112 $853,112 $938,091 $1,051,729
*Taken from Ross Selected Financial Data, in 1,000’s
The above graph illustrates how important an inventory management system is
to Ross. The amount of inventory that Ross handles is a major part of their
business and that much inventory not being sold translates to high costs to Ross.
By enhancing the inventory management system Ross stands to lower costs
exponentially.

35
Differentiation
Product Quality and Variety
Ross prides itself on the quality and the variety of their product line. As
an off-price retailer Ross offers brand name, designer products at %20 to %60
off the price of department stores. (Ross 10-K) Ross also offers a wider product
range than most people recognize. They offer everything from apparel to home
furnishing and even fine jewelry in some cases. Though Ross is known mostly
for the apparel section of their business, actually 22% of their sales for 2006
were generated by Home Accents and Bed and Bath. This is second only to
Women’s Apparel which was 33%. (Ross 10-K) These figures demonstrate how
much Ross depends on the width of their product range.
Investment in Brand Image
Ross’ investment in brand images is interesting in that they invest in other
companies’ brand image. Ross builds its brand image on the product mix that it
carries. By carrying top brands such as Polo, Tommy Hilfiger, Adidas, Nike, and
Reebok, Ross sets itself apart from the competition in creating an image of top
quality for a discount price. They rely very heavily on the image of each of the
brands they carry, in addition to their discounts, to create value for the
customers.

36
Accounting Analysis
Domestic publicly traded companies are required to prepare financial
statements for their shareholders and potential investors to provide a clear and
useful picture of the company’s value. The company’s largest financial report
would generally be the company’s 10-k annual report. In this document,
companies should provide investors with valid information through accurate and
transparent reporting. The Securities Exchange Commissions (SEC) protects
investors by requiring managers to follow Generally Accepted Accounting Policies
(GAAP). These Generally Accepted Accounting Policies give managers several
options in accounting so they can illustrate their company in the context of the
industry. The problem with this is that managers are often given incentives to
manipulate the balance sheet to improve the company’s performance. Because
managers have incentives to manipulate financial statements investors should be
skeptical of the information provided by companies.
Accounting analysis is a tool we use to assess the relevance of information
given in a firm’s 10-k. There are six steps in accounting analysis that must be
executed in order to provide a clear view of the company’s value. These steps in
order are: identify principal accounting policies, assess accounting flexibility,
evaluate accounting strategy, evaluate the quality of disclosure, identify potential
red flags, and undo accounting distortions.
The first step is to identify the principal accounting policies. We decide
the principal accounting policies by looking at “… the policies and the estimates
the firm uses to measure its critical factors and risks” (Palepu & Healy 3-7). It is
important to understand how they estimate items and their policies. These
policies and estimates may cause companies to overstate assets and/or
understate liabilities; both are problems when we try to value a company.
Second, we need to assess the accounting flexibility the company uses.
Not all companies have the same amount of flexibility in their choice of

37
accounting policies. We must determine amount of flexibility the firm has to
change the numbers. For instance most retail stores have the ability to measure
their inventory using LIFO, FIFO, or Weighted Average. Each accounting method
produces different results but is allowed under GAAP.
Once we have assessed the accounting flexibility we need to evaluate the
accounting policies the firm has used. We should compare the accounting
policies with the industry norm and if the managers had an incentive to use
these strategies. For instance, if Ross decides to use FIFO in a time of rising
costs then they will be lowering their COGS and improve the net income.
Understanding the company’s accounting strategy is critical in clearly valuing the
company.
When we feel the accounting strategy is understood we check for the
quality of disclosure. Does the company give us enough information to make a
good decision on their value? A company is required to give basic information to
investors. If they decide to disclose more than the minimum, they are adding
value to the company and reassuring investors of their investment.
The fifth step in the accounting analysis is identifying potential red flags.
We do this step to insure that managers not trying to ‘cook the books’.
Examples of red flags include “… unexplained transactions that boost profits,
unusual increases in inventories in relation to sales increases” (book) and a
whole host of others. This step insures that our valuation of the firm is accurate
and true.
The final step we would use to analyze the firms accounting practices
would be to undo the accounting distortions. The past five steps we used to find
the accounting distortions. Now we need to correct these distortions. Without
correcting these accounting distortions it is impossible to accurately value the
company with its competitors.
In conclusion, accounting analysis is a key factor in valuing a company; if
the accounting is wrong then the valuation of the company is wrong.

38
Key Accounting Policies
Firms have to disclose a lot of information in their financial reports. What
they choose to disclose and how much information they give out determines how
well an investor can make a decision about the firm. The information that they
disclose shows how they measure their key success factors and how they
manage risk. Their choice of aggressive or conservative accounting methods can
influence the potential investor’s view of the company’s financial health.
Disclosure related to core business activities are the most relevant to
determining the success of a firm.
Ross Stores, Inc. being in the highly competitive retail industry focuses on
tight cost control and economies of scale. We have identified several key
accounting policies that Ross Stores, Inc. uses that relate to these strategies.
According to our analysis, these policies include but are not limited to, operating
and capital lease disclosure, company growth statistics, and inventory purchasing
and management.
Operating and Capital Lease Disclosure
In an operating lease, the firm gains only the right to use the asset and
does not assume any of the risks of ownership. In contrast, in a capital lease,
the lessee is considered to have effective ownership of the asset and so the
value of the lease is recorded on the balance sheet. Trouble occurs when leases
that should be capitalized are treated as operating leases. This can present a
false view of the company’s status. Specific disclosure policies concerning capital
versus operating leases can lead to an understatement of a firm’s liabilities

39
Ross does not have any capital leases recorded in its financial
statements, as opposed to its competitors, which do record a combination of
operating and capital leases. Ross leases the majority of its retail sites and
computer equipment. As of February 3, 2007, their total estimated lease
payments were stated at $1.7 billion.
Company Growth Statistics
Large companies have better economies of scale. As companies increase
in size, fixed costs can be spread over a wider area and bulk purchases allow for
lower input costs. Company growth statistics show how fast a company can
achieve these economies of scale and how much of their resources they put into
internal development.
Included in the 10-k of Ross Stores, Inc. are statistics on the number of
stores opened during the year and total number of stores at year-end, the sales
mix (such as Ladies apparel, home accents, etc.), fiscal amount spent on store
renovations and improvements, and the number of employees and common
stockholders at year-end. The variety of data offered gives us an overall view of
Ross’ growth. (http://pages.stern.nyu.edu)
Purchasing, Merchandise, and Inventory
In the retail industry, the bulk of a firm’s sales are directly determined by
their merchandise, and the amount of inventory possessed. Also, inventory
usually accounts for the majority of a firm’s assets on the books. In order to
understand the success of the company, it is required to understand how the
inventories move throughout the firm, the breakdown of the inventory, and how

40
the inventory is stored. As far as purchasing is involved, one of the main
concerns for a firm in the retail industry is maintaining solid supply chains in
order to efficiently turn inventory into sales.
Ross discloses information about the purchasing process that they go
through to acquire their merchandise. They reduce costs by buying on closeout
sales and placing merchandise in storage to sell next year. This practice accounts
for 38% of their inventory. Additionally, they show information on the
breakdown of sales by department. These percentages show how much of
inventory is current and how well Ross sells to its target market.
Goodwill and Hedging
It is important, when identifying key accounting policies, to look more
closely at a firm’s goodwill, and also at hedging activities. Goodwill is an
intangible asset that really does nothing more, but show how much a firm paid in
excess of the market value of a firm’s assets during an acquisition. There are
two main important details to look for when examining a firm’s goodwill. One is
the total amount of goodwill on the balance sheet and how much of their total
assets it accounts for. If goodwill accounts for a large percentage of total assets,
then there is a good chance that assets are overstated. The second thing to look
for is how often a company is impairing their goodwill. Technically a firm does
not have to write-off goodwill at any particular rate, so it is possible for a firm to
keep a large amount of goodwill on the balance sheet long after the transaction
took place where they acquired it.
In Ross’s case only 0.1% of their total assets include goodwill. This
amount is so small that it has no significant affect on the true amount of assets.
This is true for most of the other firms in the industry. As far as impairment
goes, Ross has only impaired long-term liabilities once in the last five years, and

41
this was only due to a sell of a corporate headquarters. This is fairly normal for
the industry but still requires some investigation into whether they are impairing
enough.
Hedging is a way for companies to compensate for currency risk. Firms
that have large international investments are at a high risk of declining currency
value. It is important for investors to look at a firm’s hedging activities to asses
the firm’s vulnerability to the associated risk. Ross did not have any hedging
activities as of Feb 3, 2007 (Ross 10-K). This is definitely not the industry norm,
but because Ross does not have an international scope of their business, and no
investments in foreign currency, Ross is not subject to those risks.
Potential Accounting Flexibility
Although GAAP sets forth rules for accounting, there is also room allotted
for flexibility within these standards. It is important to recognize the flexibility in
the choices the firm has made, and to evaluate how a certain choice affects the
appearance of the company.
One of the most important areas of flexibility that Ross uses to their
advantage is the choice of using operating leases instead of capital leases. An
operating lease is one where the firm does not have effective ownership of the
leased property. These generally mature before the useful life of the asset is up,
but it is possible for firms to draw up provisions for several renewals, so that
would essentially extend the lease through the asset’s useful life. Operating
lease expenses are treated as rent expense so they just go on the income
statement, and whether or not they are using the asset for its useful life, it
bypasses the balance sheet altogether. Because of the nature of operating
leases, it is possible for firms to understate liabilities.

42
Capital leases, on the other hand, are such that a firm does have effective
ownership of the property. These types of leases last for the whole useful life of
the property, and the firm acquires a liability and asset when the lease is signed.
The expense recognized for a capital lease is a combination of interest and
principal payments and depreciation expense. Since there is an initial recognition
of a liability in a capital lease, firms with a substantial amount of buildings or
equipment have a tendency to use operating leases in order to make the balance
sheet look more attractive to potential investors. Ross is no exception to this,
and by using only operating leases they are able to understate a significant
amount of liabilities.
Another area of accounting flexibility that deserves some attention is
accounting for goodwill. Goodwill is an intangible asset that is generally the
portion over the book value that is paid for a company in an acquisition. It is
said to indicate a strong brand image or good customer relations that the
acquired company had before the purchase. (www.investopedia.com) Goodwill is
a long-term, intangible asset, and like other long-term assets, is assumed to
depreciate in value over time. However, GAAP allows flexibility when it comes to
writing off goodwill. Technically, a firm does not have to write off goodwill at
any specific rate; they just write it off as the firm feels necessary. This allows
companies to overstate their assets. By never writing off goodwill, companies
are able to maintain a large number of long-term assets. In respect to Ross,
their books show an insignificant amount of goodwill. It makes up less than
0.1% of their total assets. (Ross 10-K) Other firms in the industry also have
insignificant amounts of goodwill.
Goodwill as a Percentage of Total Assets for 2006
Ross Kohl’s T.J. Maxx J.C. Penney
0.12% 0.1% 3.0% N/A
*Taken from respective 10-K’s

43
In other industries it is not uncommon for firms to accrue a large amount
of goodwill and overstate their total assets.
One more area that needs to be examined is inventory, and there are a
few areas of accounting for inventory that GAAP allows flexibility. One is the
process the firm uses to costs its inventory. Some of these methods are LIFO,
FIFO, and weighted average. Ross uses lower of cost or market with the cost
determined by weighted average. Because this process uses an average, it is
less prone to over or understate net income than FIFO or LIFO. Most other firms
in the industry use either LIFO or FIFO, which leads to more potential distortion
on the income statement. Another area of inventory flexibility that should be
looked at is how firms classify their inventory. This is another area in which Ross
is unique because they classify a portion of their inventory as “packaway”.
“Packaway” is inventory that was purchased out of season with intent of holding
the inventory until the next season. Though this system works for Ross it has a
lot of inherit risk. Inventory in the retail industry that is up to a year old can
decrease in value significantly. Though Ross is using this to their advantage in
order to provide substantial discounts on their merchandise, if Ross values the
merchandise incorrectly it can lead to distortions in inventory.
It is important to have a general understanding of the flexibility of
accounting that GAAP allows. This flexibility can sometimes lead to firms
manipulating their financial statements in order to paint a better picture for the
investor than what is really there.

44
Actual Accounting Strategy
Financial statements serve to express the economic activity of a company.
Within GAAP standards, there is a given level of discretion in which managers
may manipulate the firm’s financial standing to either depict a transparent
picture of the firm’s performance, or may use this flexibility to portray a more
positive picture of the actual business activities in order to appeal to investors.
There are many different options for recording and presenting this data. The
reports may be documented using aggressive, conservative, or a mixture of
accounting methods. Aggressive accounting seeks to minimize liabilities and
maximize revenue while conservative accounting does the opposite. While each
method has the potential to give an honest view of the company, Ross has
chosen to utilize a more aggressive documentation.
For retail industries, inventory accounts for a substantial portion of their
assets. Small changes in the method of valuing merchandise and calculating the
Cost-of-Goods Sold can have a large effect on the financial statements. Ross
Stores, Inc. uses the lower of cost or market to determine the value of inventory.
This appears to be standard practice within the industry and accurately reflects
the value of their inventory.
Many department store retailers choose to record a large number of
operating leases instead of capital leases. Usually, there is a combination of the
two; however, Ross Stores, Inc. is unusual in that it does not record any capital
leases at all. By using only operating leases, Ross Stores, Inc. keeps a substantial
portion of potential liabilities off the balance sheet. If all of these operating
leases were instead recorded as capital leases, an additional $1.37 billion of
liabilities would need to be added to the balance sheet, creating a significantly
different economic picture of the company than before. The practice of using
large amounts of operating leases is common in this industry, and is disclosed in
45
the financial report. It is considered to be an aggressive accounting tactic that
can distort the status of a company.
Qualitative Analysis of Disclosure Thanks to acts such as the Sarbanes-Oxley, and organizations like GAAP,
and FASB we have increased the transparency of a firm’s financial statements in
comparison to ten years ago. Shareholders and financial analysts often rely on
these statements to make educated business decisions in the future. These
statements also have very important economic effects such as manager’s
compensation and the quality of a company’s long-term debt obligations. The
primary qualities are that the information be relevant, and also reliable. In order
for the statements to be useful to decision makers, it must contain both qualities.
Lacking either of these two qualities in a financial statement negates the
usefulness of the information. In order for the information to be reliable, it must
be verifiable. This means that the numbers must be backed by business activities
mentioned in the 10-K. In order for the information to be relevant, it must
represent the activities being performed in a timely manner. With these elements
of quality in the financial statements, shareholders and investors can have a
greater confidence in the firm’s future projects and investments.
Accounts Receivable
In the retail industry, most sales are on a cash basis. Within our industry,
there are some accounts receivable, however they do not constitute a large
portion of assets. This being said, it is also a gateway for firms to misstate their
earnings. Accounts receivable do not guarantee that a company receives cash for

46
its credit sales, but it does increase total sales and net income. A red flag is
raised when a firm increases its accounts receivable without increasing its sales.
For the most part Ross has been consistent in reporting their receivables and has
shown incremental increases over the years, but the total amount of accounts
receivables is negligible. Therefore, their effect on the financial statements is
immaterial.
Sales Mix
Another way Ross demonstrates effective disclosure in their 10-K is by
breaking down their sales by department. This is done for many reasons, but
mainly to determine a targeted market in order to discover where the larger
profits are and also which departments are value drivers. Below is a breakdown
of Ross’ sales mix.
Sales Mix
2004 2005 2006Ladies 34% 34% 33%Home Accents, Bed, and Bath 21% 21% 22%Men's 16% 16% 15%Fine jewelry, accessories, lingerie, and fragrances 12% 11% 11%Shoes 8% 9% 10%Children's 9% 9% 9%

47
Impairment of Long Lived Assets
According to Ross’ 10-K, “During fiscal 2004, we relocated our corporate
headquarters from Newark, California, to Pleasanton, California, and sold the
facility for net proceeds of approximately $17.4 million. We recognized a net
impairment of approximately $15.8 million related to the disposal”. This raises a
“red flag” as far as disclosure is concerned. The fact that Ross was carrying the
value of their headquarters at $33.2 million, and not depreciating the value of
their buildings at a high enough rate on the income statement is something to be
examined. In the last five years, the company has only impaired long term assets
one time, and it was when the building was sold. They could have avoided such
a large impairment at the time of sale by disclosing more depreciation over the
long run.
Conclusion
Overall, Ross does a fine job of disclosing information in their financial
reports. They demonstrate transparency throughout their reports, which gives
financial analysts, investors, and other decision makers the ability to make those
decisions on future projects for the firm. They also provide shareholders with
information on the firm’s operating activities in order to give peace of mind and
insight on the future of the company.

48
Quantitative Analysis
When performing a quantitative analysis of a firm, it is important to realize
that often times the financial statements are not completely accurate
representations of the firm’s performance in any given fiscal year. This is
primarily due to the flexibility of GAAP rules and regulations. This flexibility allows
managers to “sculpt” the financial statements in a way that appears more
attractive to potential investors and important decision makers. Therefore, it is
important to never take a firm’s financial statements for granted and to
investigate them thoroughly in order to form one’s own confidence in the figures.
In order to perform such a task, you must look at both the sales and
expense manipulation diagnostics of the firm. By doing this you will be able to
better identify where numbers may be impaired and therefore misstated. Any
misstated numbers that are found should raise a red flag to decision makers, and
potentially question the integrity of the company.
Core Sales Manipulation Diagnostics
In accounting analysis we use core sales manipulation diagnostics to
determine if a company has over/under stated their revenues. The three ratios
we determined were worth taking note in include net sales over cash from sales,
net sales over accounts receivable, and net sales over inventory. Unearned
Revenue and Warranty Liabilities were inapplicable for the industry and were
therefore excluded. We review these ratios over a five year period to determine
if the year by year changes are industry specific or firm specific. If these
changes are firm specific more research is needed to determine its causes.
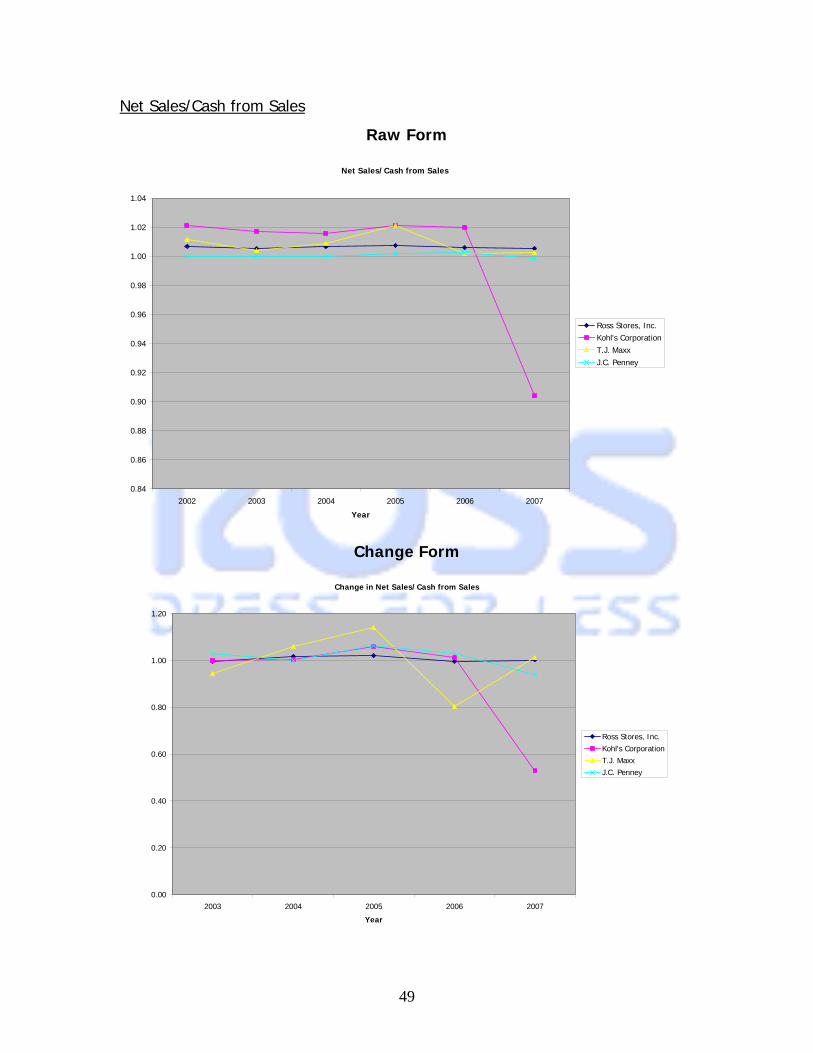
49
Net Sales/Cash from Sales
Raw Form
Net Sales/Cash from Sales
0.84
0.86
0.88
0.90
0.92
0.94
0.96
0.98
1.00
1.02
1.04
2002 2003 2004 2005 2006 2007
Year
Ross Stores, Inc.Kohl's CorporationT.J. MaxxJ.C. Penney
Change Form
Change in Net Sales/Cash from Sales
0.00
0.20
0.40
0.60
0.80
1.00
1.20
2003 2004 2005 2006 2007
Year
Ross Stores, Inc.Kohl's CorporationT.J. MaxxJ.C. Penney

50
The graphs above illustrate the relationship of sales to cash collected from
sales. In an ideal world the cash from sales would be exactly equal to your
sales. This would mean that cash would be exchanged on every transaction.
Some industries are incapable of maintaining a ratio of one for their sales over
cash from sales. These industries would probably be for large dollar items such
as cars where financing is required. The discount retail industry is not one of
those industries and therefore most of the companies above maintain a ratio
very near to one. Looking at Ross in particular they maintain between 1.02 and
1. Keeping the company’s sales to cash from sales around one gives a company
a consistent cash flow to buy and repay loans etc.
The only company that seems to differ from the industry standard would
be Kohl’s. Kohl’s differs because they have their own credit card and seem to
not mind selling on credit. In 2006 they sold their accounts receivable to a credit
agency and therefore had much smaller sales to cash ratio for that period. With
a smaller cost of the items the firms sell they need the cash for their product
now. This is because the time value of money; a dollar today provides more
purchasing power than a dollar a month from now. This is why Ross has very
little accounts receivables.

51
Net Sales/Accounts Receivable
Raw Form
Net Sales/Net Accounts Receivable
0.00
50.00
100.00
150.00
200.00
250.00
2002 2003 2004 2005 2006 2007
Year
Ross Stores, Inc.Kohl's CorporationT.J. MaxxJ.C. Penney
Change Form
Change in Net Sales/Net Accounts Receivable
-400.00
-200.00
0.00
200.00
400.00
600.00
800.00
2003 2004 2005 2006 2007
Year
Ross Stores, Inc.Kohl's CorporationT.J. MaxxJ.C. Penney
The graphs above illustrate the net sales over net accounts receivable for
a six year period. Looking at the net sales over net accounts receivable changes
doesn’t seem to tell much from year to year though because the net accounts

52
receivable are so small. Since the discount retail industry tends to avoid selling
on accounts the changes from year to year will be drastic. However, the thing to
look at is how each look compared to each other, and all the companies tend to
move the same from year to year. Ross again seems to be close to the industry
standard. This just goes to show how being in a certain industry varies your
results.
Again Kohl’s seems to be giving us problems. When looking at their 10-k
they don’t provide Accounts Receivable. This makes it difficult to value the
company; without stating accounts receivable Kohl’s makes it impossible to
graph the 2006 year. Kohl’s having these problems makes Ross appear fairly
well in disclosure, though they all have problems.
Net Sales/Inventory
Raw Form
Net Sales/Inventory
0.00
1.00
2.00
3.00
4.00
5.00
6.00
7.00
8.00
9.00
2002 2003 2004 2005 2006 2007
Year
Ross Stores, Inc.Kohl's CorporationT.J. MaxxJ.C. Penney
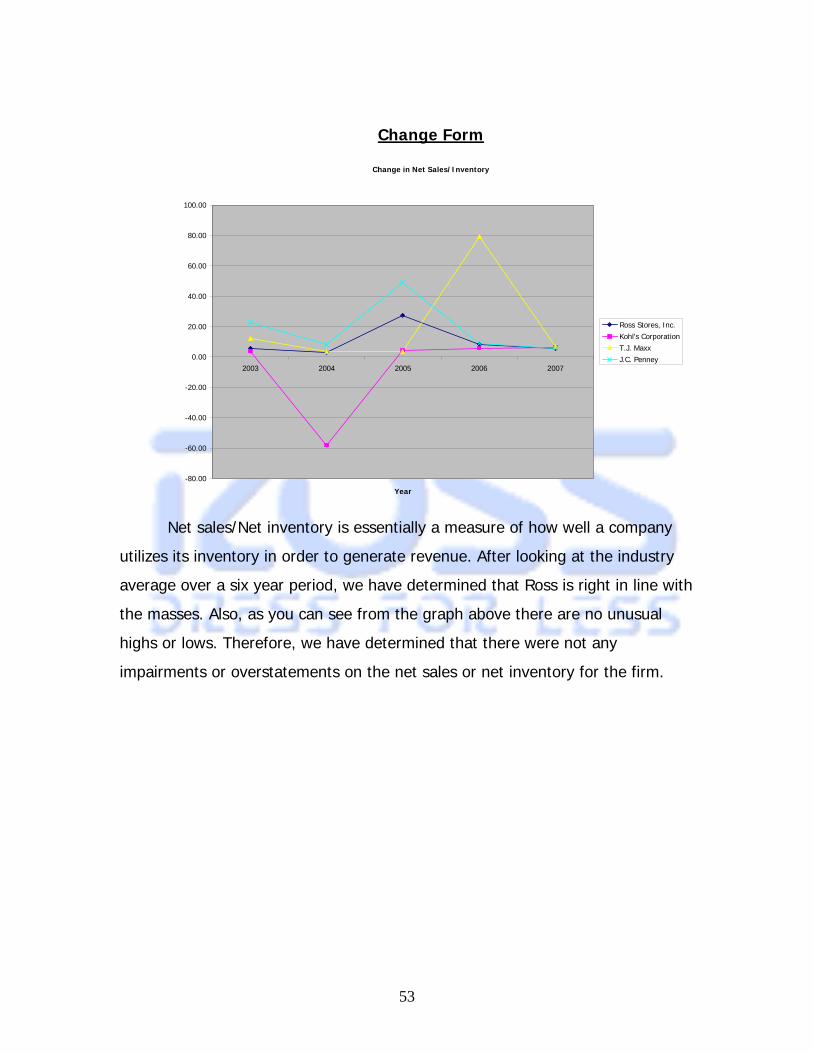
53
Change Form
Change in Net Sales/Inventory
-80.00
-60.00
-40.00
-20.00
0.00
20.00
40.00
60.00
80.00
100.00
2003 2004 2005 2006 2007
Year
Ross Stores, Inc.Kohl's CorporationT.J. MaxxJ.C. Penney
Net sales/Net inventory is essentially a measure of how well a company
utilizes its inventory in order to generate revenue. After looking at the industry
average over a six year period, we have determined that Ross is right in line with
the masses. Also, as you can see from the graph above there are no unusual
highs or lows. Therefore, we have determined that there were not any
impairments or overstatements on the net sales or net inventory for the firm.

54
Expense Manipulation Diagnostics
So far we have talked about diagnostics that have had to do with sales.
This would show the cash to cash cycle, and all kinds of events but now we will
talk about asset turnover and some things engrained more deeply in the firm. In
this section we will look at how the company portrays the firm and later will
examine how the firm looks in our eyes.
Asset Turnover
Asset Turnover
0.00
0.50
1.00
1.50
2.00
2.50
3.00
3.50
4.00
2003 2004 2005 2006 2007
Year
Ross Stores, Inc.Kohl's CorporationT.J. MaxxJ.C. PenneyRoss Stores, Inc. Restated
The asset turnover is a great view of how well the company uses its
assets. We calculate it by looking at the net income for that year over beginning
assets for that year. Looking at the graph, it would seem that Ross and T.J.

55
Maxx are utilizing their assets almost twice as well as the other companies. This
has to do with the amount of assets off the books as operating leases.
Therefore, Ross’ restated asset turnover ratio is much smaller because of the
increase in assets from capitalized leases.
Conclusion
After careful examination of the retail industry that Ross competes within,
it has been determined that they are fairly consistent within the industry as a
whole. There does not appear to be any underlying impairments that may
misstate the financial statements of their respective companies. As stated before,
most of these apparent spikes or lows within these diagnostic ratios are mainly
due to changes in accounting policies and or revenues/expenses. Ross’ financial
statements did not contain any information that would indicate any such changes
within their key accounting policies.
Identifying Potential “Red Flags”
In order to completely analyze the accounting strategies and performance
of a firm, one must go through and identify any potential errors, omissions, or
false information. These “red flags” are mistakes ranging from “unexplained
changes in accounting practices to large fourth quarter adjustments which may
result from aggressive management of interim reporting.” (Palepu and Healy)
These mistakes often require adjustments to the firm’s books in order to undo
distortions.
As far as Ross Stores is concerned, the financial statements have few
obvious distortions. After examination it was discovered that Ross only had one
56
capitalized lease on the books, which was one of its distribution centers. Other
than this single capitalized lease, every other asset lease is classified as
operating. This obviously is quite a large distortion that leaves the firm’s liabilities
understated by approximately $1.3 billion. This distortion would also affect the
statement of cash flows for Ross Stores.
Ross’ financial statements contain a very high level of disclosure, and
when compared to the statements of years past, it seems as though they are
becoming more and more transparent. For example, in their 2007 10-K, Ross
even discloses the 5.8% interest rate being paid on the one capital lease they
possess. Also, Ross discloses that they currently use the British Bankers
Association’s discount rate, plus 45 basis points, for their long-term debt discount
rate. This equates to a 5.88% discount rate.
Analysis of Investment Activities
Investment activities can be important to a firm for several reasons.
Investments can be used to earn extra income on excess money. By investing in
short term securities, firms can earn extra cash while not tying up their cash for
too long. Short-term investments have maturity periods of one year or less.
Conversely, long-term securities tie up cash for periods longer than one year.
Long-term investments may also have penalties associated with early conversion.
It is worthy of mentioning that for the last five years or so, short-term
investments have had a higher yield than long-term investments.
Ross has made a few interesting choices with their investments. It should
be noted that investing is not one of Ross’ core competencies. However, they
did have a significant amount of money tied up in investments. In 2006, Ross
had $1.6 million in mortgage-backed securities. By 2007, they had increased to
$5.6 million. This seems to be an odd choice considering the volatility of the

57
credit and mortgage markets. The current market situation would dictate the
selling of these securities instead of the acquisition of more. Ross is taking a
huge unnecessary risk. The mix of securities changed by volume and also in
type. They dumped all of their municipal bonds and acquired auction rate
securities. The most intriguing move that they made was changing the overall
mix of short-term and long-term securities. In 2006, the short-term and long-
term securities were $12.7 million and $11.2 million respectively, for a total $24
million. In 2007, the mix of short-term and long-term securities was $5.2
million and $31.1 million respectively, for a total of $36 million. (Ross 10-K) The
amount seems relatively small when compared to their overall assets. However,
when compared to their long-term debt of $150 million, it is significant. The
amount that they have invested is approximately 24% of their outstanding long-
term debt balance. The reason that this is so significant is because they have
chosen to invest their money in securities that are paying less interest to them
than they are paying on their debt. The net effect of these investments is
negative, which translates to a net loss on investments.
2007 Investment Mix
Short-term Long-term Auction-rate securities $3,200 - Asset-backed securities $299 $2,476 Corporate securities $1,748 $11,832 U.S Government and agency securities
- $11,217
Mortgage-backed securities
- $5,611
Total $5,247 $31,136

58
2006 Investment Mix
2006 & 2007 Short and Long-Term Investments
Undoing Accounting Distortions
In order to use financial statements to understand a company, it is
important that they correctly state their finances. Certain accounting practices
can distort these views requiring that the financial statements be adjusted in
order for them to be useful. In Ross Stores, Inc., the greatest change is their
heavy use of operating leases. If these leases were restated as capital leases, an
additional $1.3 billion would have to be added to the assets and liabilities of the
Short-term Long-term Municipal securities $12,650 - Corporate securities - $6,548 U.S. Government and agency securities
- $1,961
Asset-backed securities $113 $1,055 Mortgage-backed securities
- $1,638
Total $12,763 $11,202
$0$5,000
$10,000$15,000$20,000$25,000$30,000$35,000
Short-TermInvestments
Long-TermInvestments
20062007

59
company. This change in financial statements, in an unusual turn of events,
increases their net income.
Comparison of Total Assets
$0$500,000
$1,000,000$1,500,000$2,000,000$2,500,000$3,000,000$3,500,000$4,000,000
2002 2003 2004 2005 2006 2007
Year
($00
0) Total AssetsRestated Total Assets
Comparison of Total Liabilities
$0
$500,000
$1,000,000
$1,500,000
$2,000,000
$2,500,000
$3,000,000
2002 2003 2004 2005 2006 2007
Year
($00
0) Total LiabilitiesRestated Total Liabilities
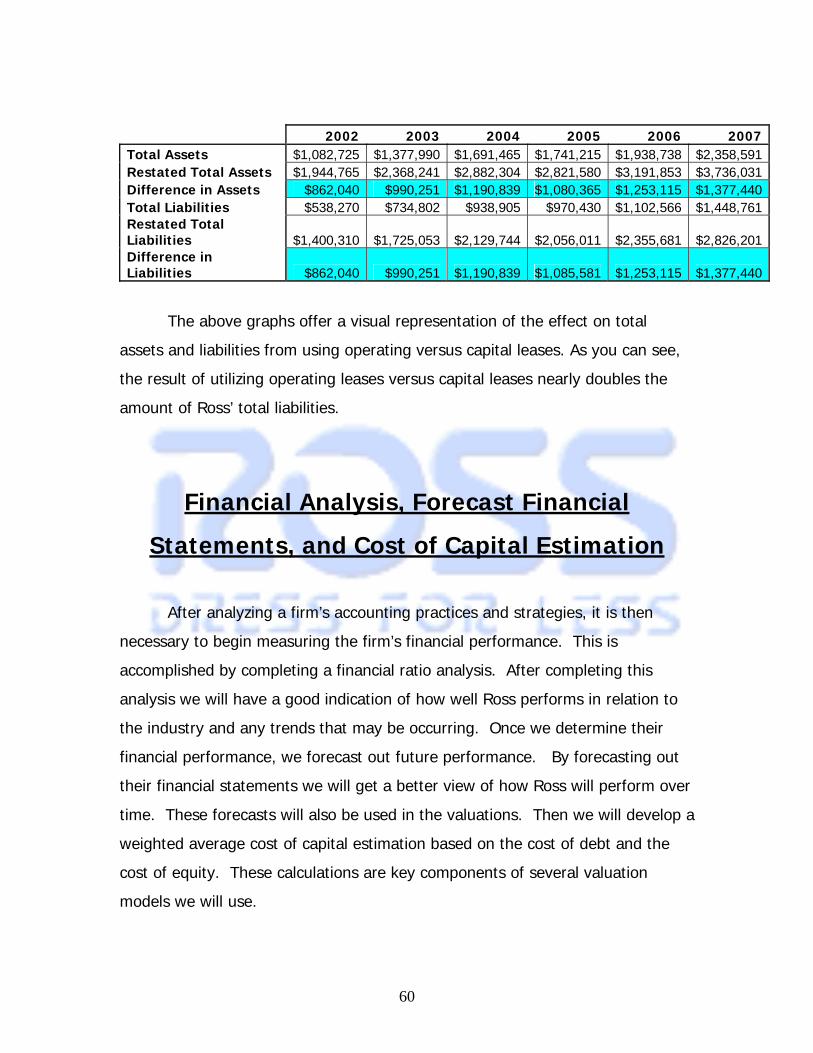
60
2002 2003 2004 2005 2006 2007Total Assets $1,082,725 $1,377,990 $1,691,465 $1,741,215 $1,938,738 $2,358,591 Restated Total Assets $1,944,765 $2,368,241 $2,882,304 $2,821,580 $3,191,853 $3,736,031 Difference in Assets $862,040 $990,251 $1,190,839 $1,080,365 $1,253,115 $1,377,440 Total Liabilities $538,270 $734,802 $938,905 $970,430 $1,102,566 $1,448,761 Restated Total Liabilities $1,400,310 $1,725,053 $2,129,744 $2,056,011 $2,355,681 $2,826,201 Difference in Liabilities $862,040 $990,251 $1,190,839 $1,085,581 $1,253,115 $1,377,440
The above graphs offer a visual representation of the effect on total
assets and liabilities from using operating versus capital leases. As you can see,
the result of utilizing operating leases versus capital leases nearly doubles the
amount of Ross’ total liabilities.
Financial Analysis, Forecast Financial
Statements, and Cost of Capital Estimation
After analyzing a firm’s accounting practices and strategies, it is then
necessary to begin measuring the firm’s financial performance. This is
accomplished by completing a financial ratio analysis. After completing this
analysis we will have a good indication of how well Ross performs in relation to
the industry and any trends that may be occurring. Once we determine their
financial performance, we forecast out future performance. By forecasting out
their financial statements we will get a better view of how Ross will perform over
time. These forecasts will also be used in the valuations. Then we will develop a
weighted average cost of capital estimation based on the cost of debt and the
cost of equity. These calculations are key components of several valuation
models we will use.

61
Financial Ratio Analysis
Ratios allow an analyst to tie numbers within the financial statements with
key success factors that have been identified for the subject company.
Furthermore, ratios allow for measuring how effectively the management is
progressing towards achieving their corporate goals. These ratios are divided
amongst three groups: liquidity ratios, profitability ratios, and capital structure
ratios. By comparing Ross’s financial ratios against other companies within the
industry, we are able to gauge Ross’s overall performance within the context of
the retail industry.
Liquidity Ratios
Liquidity ratios measure a company’s ability to service short term debt
with assets on hand. There are six ratios we use to determine the liquidity of a
company. Three of these ratios; the current ratio, quick ratio, and cash ratio
determine liquidity by comparing certain short term assets to short term
liabilities. The other three ratios measure how quickly firms turnover their
assets. These ratios include the accounts receivable turnover, inventory turnover
and working capital turnover.

62
Current Ratio
Current Ratio
-
0.50
1.00
1.50
2.00
2.50
3.00
2002 2003 2004 2005 2006 2007
Year
RossKohl'sT.J. MaxxJ.C. PennyIndustry
The current ratio is a measure of a firm’s ability to pay its current liabilities
using all of its current assets. “Since both current assets and current liabilities
have comparable duration, the current ratio is a key index of a firm’s short term
liquidity.”(Business Analysis & Valuation) Judging from the graph, it seems there
is a slight downward trend for the industry’s average current ratio. Since 2005
the industry average has dropped from just under 2 to 1.66. It also seems that
all of the firms are converging to around 1.5 to 2. In 2007 Ross stores had a
current ratio of 1.4. This indicates that for every 1 dollar of current liabilities, it
has 1 dollar and 40 cents of current assets to cover those liabilities. These
findings are substantially in line with the 2007 industry average of 1.66.
Although this would indicate that Ross has the ability to pay its current liabilities
given their current assets, one cannot rely on the current ratio alone. The
current ratio assumes that all of the current assets can quickly and easily be

63
converted into cash. Assets such as inventory can become impaired or obsolete
making it difficult to convert into cash.
Quick Asset Ratio
Quick Asset Ratio
-
0.20
0.40
0.60
0.80
1.00
1.20
1.40
1.60
1.80
2002 2003 2004 2005 2006 2007
Year
RossKohl'sT.J. MaxxJ.C. PennyIndustry
The quick asset ratio measures a firm’s ability to use its cash and cash
equivalents to pay its current liabilities. For purposes of this ratio, cash and cash
equivalents are defined as cash, short term investments and accounts receivable.
By removing the inventory component of current assets, we are able to see the
firm’s ability to pay its current liabilities using assets that can be converted into
cash in the short term, usually thirty days. The quick ratio is going to be
substantially lower than the current ratio because most firms in the retail
industry have inventory as a large portion of their current assets.
Ross has a quick asset ratio of .43 in 2007. This is on the low end of the
scale but it is within an acceptable margin of the industry average. With a quick
asset ratio for the industry being well below one, the industry as whole is at

64
greater risk for insolvency due to economic factors such as decreases in
consumer spending or inflation.
Cash Ratio
Cash Ratio
-
0.20
0.40
0.60
0.80
1.00
1.20
1.40
1.60
2002 2003 2004 2005 2006 2007
Year
RossKohl'sT.J. MaxxJ.C. PennyIndustryExcluding J.C. Penny
The cash ratio illustrates how much of the current liabilities can be paid
immediately. This ratio is the amount of cash and cash equivalents divided by
the current liabilities. It removes even more of the distortion caused by assets
that could have an impaired value or be uncollectible. Excluding J.C. Penny,
which has an unusually large amount of cash as compared the other companies,
the industry average for 2007 was .27. Ross had a ratio of .34 for 2007. This
ratio is so low because retail companies have most of their current assets in the
form of inventory. A low amount of cash means that Ross is vulnerable to
economic downturns. However, because of the nature of the industry, most of
their cash is immediately reinvested into inventory and operating capital.
Therefore it is not unreasonable for the cash ratio to be low.

65
Inventory Turnover
Inventory Turnover
-
1.00
2.00
3.00
4.00
5.00
6.00
7.00
2002 2003 2004 2005 2006 2007
Year
RossKohl'sT.J. MaxxJ.C. PennyIndustry
In order for discount retail firms to generate sales they need a large
number of assets on hand. Inventory comprises most of the firms’ current
assets. The Inventory turnover ratio is the rate at which a company effectively
replaces its inventory. A higher ratio means that a firm is selling its inventory at a
faster rate. This leads to a shorter cash flow cycle making it easier to generate
cash. Ross had an inventory turnover rate of 4.11 in 2007, meaning that they
replaced their inventory every 3 months. The 6 year industry average was 4.23
meaning the industry as a whole replaces its inventory every 3 months. This
trend in the retail industry is to be expected because there are four distinct
selling seasons.

66
Days Supply of Inventory
Days Supply of Inventory
-
20.00
40.00
60.00
80.00
100.00
120.00
2002 2003 2004 2005 2006 2007
Year
RossKohl'sT.J. MaxxJ.C. PennyIndustry
The Days Supply of Inventory measures how many days worth of
inventory a firm has on hand. This number is derived utilizing the inventory
turnover ratio to determine how quickly inventory would run out if not
replenished. Ross’ 2007 Days Supply of Inventory (88.91) is substantially in line
with the 2007 industry average of 89.62. This is fairly standard for the industry
considering the large amounts of non-perishable goods that must be kept on
hand to meet demand. It is also important to remember that this industry relies
heavily on “packaway” inventory to be sold during the same season the following
year.
Cash to Cash Cycle
The cash to cash cycle for a business is defined as the length of time in
days required for a company to “convert resource inputs into cash flows

67
(Investopedia.com).” In Ross’ case, it is essentially just the firm’s days supply of
inventory, because they do not have any accounts receivable.
Receivables Turnover
Receivables Turnover
-
50.00
100.00
150.00
200.00
250.00
2002 2003 2004 2005 2006 2007
Year
RossKohl'sT.J. MaxxJ.C. PennyIndustry
Receivables turnover measures how quickly a firm collects on its sales on
account. This is relevant to companies that make a lot of sales on credit. Ross
does not disclose in its financial statements how much of its sales are made on
credit. This makes the receivables turnover rate irrelevant to understanding their
financial position.

68
Working Capital Turnover
Working Capital Turnover
-
5.00
10.00
15.00
20.00
25.00
2002 2003 2004 2005 2006 2007
Year
RossKohl'sT.J. MaxxJ.C. PennyIndustry
The working capital turnover measures the ability of a firm to turn its
assets into sales revenue. Working capital is the portion of a firm’s current assets
that is greater than their current liabilities. With an industry that has such a large
amount of its capital tied into inventory, it is important that they generate as
much revenue as they can from each sale. Ross has been doing better then the
industry average in this aspect.
Conclusion
The ratios above are used to determine the liquidity of a company. We
compared Ross to its main competitors on a year by year basis to determine if it
met the industry average. Ross consistently maintained a current ratio, quick
ratio, and cash ratio lower than the rest of the industry. However, Ross’s
inventory turnover grew to the industry average and Ross’s working capital
turnover exceeded the industry average. Therefore, we have concluded that
although Ross has a higher working capital turnover it is less liquid than its

69
competitors and would have more difficulty meeting its short term debt
obligations.
Profitability Analysis
The collection of ratios in the profitability analysis seeks to measure how
successful a company is. It does this by looking at a firm’s profit margin and how
well it uses its assets in generating revenue. The profitability ratios are: gross
profit margin, operating profit margin, net profit margin, asset turnover, return
on assets, and return on equity. Each of these looks at the firm’s sales from a
different perspective to evaluate their profitability.

70
Gross Profit Margin
Gross Profit Margin
-
0.05
0.10
0.15
0.20
0.25
0.30
0.35
0.40
0.45
2002 2003 2004 2005 2006 2007
Year
RossKohl'sT.J. MaxxJ.C. PennyIndustry
Gross profit margin measures the percent of revenue that is left after
accounting for the cost of goods sold. This ratio helps to illustrate how much of
each dollar of sales is potential profit. A higher gross profit margin means that a
company has a greater ability to handle administrative expenses and financing
costs, as well as leading to a higher net income. Ross has the lowest gross profit
margin as of 2007 at .24. This means that they have low funding to expand their
operations without a significant increase in sales volume.

71
Operating Profit Margin
Operating Profit Margin
-
0.02
0.04
0.06
0.08
0.10
0.12
0.14
2002 2003 2004 2005 2006 2007
Year
RossKohl'sT.J. MaxxJ.C. PennyIndustryRoss Restated
Operating profit margin is a measure of a firm’s positive income from
operations (profit before interest expense and taxes) as a percentage of sales. In
the fiscal year 2007, Ross reported in their 10-K that they operated at a margin
of .07 or 7%. Although after capitalizing all of Ross’ leases, we have restated
their operating profit margin at .11 or 11% of sales. This is slightly above the
industry’s average operating profit margin of 9%. This shows that in 2007, Ross
executed their main operations, while also managing their overhead efficiently
enough to keep up with the industry standard. It also shows once again how
Ross has been able to implement a tight cost control system as a part of one of
the key success factors in the industry. This is demonstrated in the graph above.
Observation of the graph implies that Kohl’s is operating more efficiently than the
rest of the industry. Ross and T.J. Maxx are more closely related structurally.
Their movements parallel each other within a numerically close proximity. Each
firm seems to behave similarly in the year by year movements of their ratios.

72
This suggests that all firms in the industry are sensitive to the same
environmental conditions.
Net Profit Margin
Net Profit Margin
(0.06)
(0.04)
(0.02)
-
0.02
0.04
0.06
0.08
2002 2003 2004 2005 2006 2007
Year
RossKohl'sT.J. MaxxJ.C. PennyIndustryRoss Restated
Net profit margin is essentially a calculation used to determine a firm’s net
profits as a percentage of sales. Or, how much of each dollar earned will roll into
retained earnings as a part of their shareholder’s equity. In 2007, Ross reported
a net profit margin of 4%, but we restated this figure to actually be 5%. Once
again, this is right in line with the industry average of 5% and shows that Ross is
performing at an acceptable level. Above is another example how Ross has been
effectively operating within a tight cost control system.

73
Asset Turnover Ratio
Asset Turnover
-
0.50
1.00
1.50
2.00
2.50
3.00
3.50
4.00
2003 2004 2005 2006 2007
Year
RossKohl'sT.J. MaxxJ.C. PennyIndustryRoss Restated
The Asset Turnover Ratio (ATO) is a measure of a firm’s efficiency at
using its assets to generate sales or revenue (Investopedia.com). It allows us to
compare companies of different sizes on an equal basis. For example, a firm with
only $1,000 in assets which generates $100,000 in sales is much better off than
a company with $1,000,000 in assets which generates $100,000 in sales.
Therefore, the higher a firm’s asset turnover ratio, the better that firm is doing.
As stated, Ross had an ATO of 2.87 for 2007 which was better than the industry
average of 2.33.
However, after restating Ross’ financial statements using capital leases
instead of operating leases, the ATO was 1.75. This drop in ATO can be
attributed to the large increase in assets caused by the restatement. Ross’
stated assets were $2.35 billion in 2007. The 2007 restated assets were $3.7
billion.

74
Return on Assets
Return on Assets
(0.10)
(0.05)
-
0.05
0.10
0.15
0.20
2003 2004 2005 2006 2007
Year
RossKohl'sT.J. MaxxJ.C. PennyIndustryRoss Restated
Return on Assets (ROA), shows the amount of net income that a company
derives from each dollar of assets of which they control (Wikipedia.com). In
2007(stated), Ross had an ROA of 12%. This means that for every one dollar of
assets which they control, they generated 12 cents of net income. Ross’ ROA
was in line with the industry average of 12%. However, Ross’ 2007 ROA
(restated) was 9%, which is significantly less than the industry average. This
25% decrease is due to the large increase in assets from the capitalization of
leases. As stated, Ross is performing at the industry average, but when the
restatement is taken into consideration, it casts doubt on Ross’ ability to
generate income from their assets.

75
Return on Equity
Return on Equity
(0.20)
(0.10)
-
0.10
0.20
0.30
0.40
0.50
2003 2004 2005 2006 2007
Year
RossKohl'sT.J. MaxxJ.C. PennyIndustryRoss Restated
Return on Equity illustrates the return on the shareholders’ investments in
the company. This specifically details the after tax profit earned per dollar of the
shareholders’ investment (Fabozzi Series Analysis of Financial Statements). This
is important for current and prospective shareholders because investors want to
maximize the return on their investments. The higher the ratio is, the higher the
return on the investors’ capital. In 2007 Ross had an ROE of 29 percent; slightly
above the industry average of 25 percent. According to our restatement of
Ross’s financials, 2007 ROE would be 35 percent; this 6 percent difference is due
to the larger net income that would be realized after capitalization of all
operating leases.
Conclusion
After analyzing each of the profitability ratios we have determined
that in most cases Ross is performing at or above the industry average.
However, Ross is falling short of the industry average in two important areas;

76
Asset Turnover and Return on Assets. This means that though Ross’ margins are
adequate, their asset management lags behind that of the industry. This
difference may be due to differences in strategy and execution of operations.
Capital Structure Analysis
The capital structure analysis is necessary in order to assess how a firm
finances its operations. We will look at three different ratios including: debt to
equity, times interest earned, and debt service margin. These ratios will assist in
determining if Ross uses more debt or equity.
Debt to Equity Ratio
Debt to Equity Ratio
-
0.50
1.00
1.50
2.00
2.50
3.00
3.50
2002 2003 2004 2005 2006 2007
Year
RossKohl'sT.J. MaxxJ.C. PennyIndustryRoss Restated
The debt to equity ratio is representative of a firm’s proportion of total
liabilities to shareholder’s equity utilized in financing its assets and is a

77
measurement of a company’s financial leverage. A higher debt to equity ratio
indicates the firm is financing its growth more through debt. In 2007, Ross’
debt/equity ratio of 1.59 was higher than the industry average of 1.45. This
means that it finances its increasing operations through debt more aggressively
than its industry competitors do. Also, when calculating Ross’ restated debt to
equity ratio, which takes into account its operating leases, the measurement
increases to 3.11, a figure considerably higher than its previous calculation for
2007 and the industry standard.
Times Interest Earned
Times Interest Earned
(100.00)
-
100.00
200.00
300.00
400.00
500.00
600.00
700.00
800.00
900.00
2002 2003 2004 2005 2006 2007
Year
RossKohl'sT.J. MaxxJ.C. PennyIndustryRoss Restated
Times interest earned is the measure of how many times over a firm is
able to cover their interest expense utilizing only their net income before interest
and taxes. This is also known as NIBIT. In Ross’ case, the majority of their
interest expenses are kept off the income statement through the use of
operating leases. Upon restatement, the times interest earned ratio was in line
with the industry. However, could not compare it to the restated financials of the

78
other companies. So, we were not able to use the times interest earned as a
benchmark for financial performance.
Debt Service Margin
Debt Service Margin
-
100.00
200.00
300.00
400.00
500.00
600.00
700.00
800.00
2002 2003 2004 2005 2006 2007
Year
Ross Stores, Inc.Kohl's Corp.T.J. MaxxJ.C. PennyIndustry Ratio AveragesRoss Stores, Inc. (Restated)
The debt service margin is a measure of a firm’s ability to serve its debt.
It measures a firm’s ability to pay the current portion of their long-term debt
utilizing only the cash flows from operations. The Ross financial statements do
not disclose the current portion of their long-term debt. Therefore, we were
unable to calculate a debt service margin for them. Furthermore, we feel that
this would be materially insignificant, due to the fact that Ross does not have
much long-term debt. However, after capitalizing Ross’s operating leases, we
were able to estimate a current portion of long term debt based on the payments
for those leases. From this we were able to develop some sort of comparison to
the industry. The numbers for each firm are so different from each other that it
is impossible to draw any conclusion about how well one firm is compared to the
other.

79
Altman Z-Score
Altman Z-Score
0.00
2.00
4.00
6.00
8.00
10.00
12.00
2002 2003 2004 2005 2006 2007
Year
Ross Stores, Inc.
Kohl's Corp.
T.J. Maxx
J.C. Penney
Ross Stores, Inc. (Restated)
The Altman Z-score is a measurement that has been developed in order to
predict the chance that a firm will go into bankruptcy within a year (Palepu &
Healy 10-15). It uses a collection of ratios that measure profitability and a firm’s
financial leverage. Each ratio is then given a fixed weight determined by Altman
and the total is then considered an indication of the firm’s potential for
bankruptcy. For publicly traded companies, a score less than 1.81 indicates that
a firm is most likely to go bankrupt, while a score between 1.81 and 2.67 is at
risk but the model does not predict accurately within this range. Using the
stated financial data, we found that in 2007, Ross Stores’ Z-score was 5.26, well
above the threshold level set by the model. From 2003 to 2006, Ross was in line
with Kohl’s and T.J. Maxx, with J.C. Penney being very different from the rest of
the industry. When we calculated the z-score using the restated financial data,
Ross’ score became 3.31. According to this model, Ross is not in danger of

80
bankruptcy. However, J.C. Penney was below the threshold level between 2002
and 2005 and did not go bankrupt. This shows that the Altman z-score model is
not completely accurate.
Internal and Sustainable Growth Rate Analysis Internal Growth Rate
Internal Growth Rate
-10.0%
-5.0%
0.0%
5.0%
10.0%
15.0%
20.0%
2003 2004 2005 2006 2007
Years
Ross (Actual)
Ross (Restated)
J.C. Penny
T.J. Maxx
Kohl's
Average
The internal growth rate is the maximum rate that a firm can grow from
using only internal sources of financing. (www.investopedia.com) It is derived
from a firm’s return on assets, and if the company pays dividends we use the
dividend payout ratio. It is the safest way for a company to grow and provides a
basis for sustainable growth rate, which is discussed below. As the graph above
illustrates, Ross does not have a consistent internal growth rate. There was a
significant drop during the course of the 2004 fiscal year. This was due to a
restatement of their financial documents to better follow GAAP regarding their
operating lease expenses. Ross’s IGR, both as stated and restated, is pretty

81
near but a little below the industry average. This means that they have less
potential for growth than the industry itself, using only internal financing.
Sustainable Growth Rate
Sustainable Growth Rate
-20.0%
-10.0%
0.0%
10.0%
20.0%
30.0%
40.0%
50.0%
2003 2004 2005 2006 2007
Years
Ross (Actual)
Ross (Restated)
J.C. Penny
T.J. Maxx
Kohl's
Average
The sustainable growth rate is the maximum rate of growth that a
company can achieve without changing their capital structure. It is the rate at
which a company can grow by adding a proportional amount of debt with its
growth in equity. This number is found by using the firm’s internal growth rate
and the debt to equity ratio. Ross does not have a stable sustainable growth
rate, much like their internal growth rate. There is also a significant drop during
2004, again due to the restatement of their financial documents. Overall, Ross
stated sustainable growth rate was pretty near the average. However, with the
restated financials, Ross’s SGR is the highest of the industry. Though this might
change if we restated all the companies’ financials, the fact remains that the
restated SGR is higher than the stated SGR. This shows that Ross has a lot of
room to grow.

82
Conclusion
We found that Ross relies heavily on debt to finance its operations. This
is due mostly to the cost of debt being lower than the cost of equity. Ross’ cost
of debt in 2007 was 5.94 %( stated) and 5.91 %( restated). This is substantially
lower than the cost of equity, which is 17.25 %( stated) and 18.89 %( restated).
It is easier to repay the lower cost debt than it is to consistently generate the
investors’ required rate of return.
Financial Forecast Analysis
In order to value a company, we need to be able to see what it will be like
in the future. The value of a company for a stockholder is the financial benefit
that they can receive in the future. Using historical data and financial ratios, we
can create a plausible prediction of what the state of the company will be in the
future.
We begin our forecast by estimating the future sales of the company. We
used a 10.26% growth rate determined by averaging the growth rate of the
industry over the past three years. Then, we used the sales predictions and an
estimated asset turnover ratio to determine the assets for the period. This
provided the basis for predicting the future balance sheet amounts. In order to
predict cash flow from operations, we used the ratio of cash flow from
operations divided by net income. The primary driver of our predictions was
future sales.

83
Forecasted Income Statement
As the primary driver of the financial statements, it is important that we
chose a predicted sales growth that is supported not only by past historical data,
but also by present economic events. Ross had a six year average sales growth
of 13.33%. However, their sales growth has been inconsistent over this time
period, with declines in 2002 to 2004 and then a general increase from 2005 to
2007. Additionally, there is a projected economic recession that will occur in the
next twelve months which will depress sales across the entire industry. For these
reasons, we decided to use the average growth rate of Ross and its competitors
over the past three years.
Projected costs and expenses were determined by using percentage rates
based on Ross’ historical data. Costs of goods sold, SGA expenses, and total
costs and expenses were figured by using the average percentage of costs based
on sales over the past three years. These were 77.65%, 15.50%, and 93.21%
respectively. We did not use the data from 2002 to 2004 as there was a
consistent shift in percentages from those years as compared to the years 2005
to 2007. Total costs and expenses was figured as a percentage of sales rather
than the sum of costs of goods sold and SGA expenses in order to account for
unusual expenses that cannot be forecast. The predicted provision for taxes on
earnings was calculated using a projected stable tax rate of 39%. Ross has had a
tax rate of 39% over the past six years and it is not expected to change in the
near future. Gross profit, operating income, and net income were all determined
using standard accounting practices.
Restating the financial documents caused a large increase in the net
earnings of Ross Stores, Inc. These changes ranged from 12.29% in 2002 to
40.53% in 2006, with a six year average change of 22.43%. The figures for sales
and costs of goods sold were not affected, but the percentages for SGA
expenses and total expenses were changed because of the decrease in rent

84
expense and the increases in depreciation and interest expenses. This increase in
net earnings is predicted to be about 28% greater than net earnings as stated. ROSS STORES INC Income Statement Reported in Thousands
February 3, 2007 Average Assume 2008 2009 2010 2011 2012 2013 2014 2015 2016 2017
SALES $5,570,210 0.1026 $6,141,714 $6,771,853 $7,466,646 $8,232,723 $9,077,401 $10,008,742 $11,035,639 $12,167,896 $13,416,322 $14,792,836
COSTS AND EXPENSES Cost of goods sold $4,317,527 77.65% $4,768,983 $5,258,281 $5,797,781 $6,392,633 $7,048,517 $7,771,695 $8,569,071 $9,448,258 $10,417,649 $11,486,500 Selling, general and administrative $863,033 15.50% $951,979 $1,049,653 $1,157,347 $1,276,091 $1,407,018 $1,551,378 $1,710,549 $1,886,051 $2,079,560 $2,292,923 Impairment of long-lived assets $0 Interest (income) expense, net ($8,627) Total costs and expenses $5,171,933 93.21% $5,724,672 $6,312,023 $6,959,636 $7,673,695 $8,461,016 $9,329,117 $10,286,284 $11,341,657 $12,505,311 $13,788,355 Gross Profit $1,252,683 $1,372,730 $1,513,572 $1,668,865 $1,840,090 $2,028,884 $2,237,047 $2,466,568 $2,719,638 $2,998,673 $3,306,336 Operating Income $389,650 $417,042 $459,830 $507,009 $559,028 $616,384 $679,626 $749,355 $826,239 $911,011 $1,004,481 Income (loss) from continuing operations before income taxes $398,277 $417,042 $459,830 $507,009 $559,028 $616,384 $679,626 $749,355 $826,239 $911,011 $1,004,481 Provision for taxes on earnings $156,643 0.39 $162,646 $179,334 $197,734 $218,021 $240,390 $265,054 $292,248 $322,233 $355,294 $391,748 Net earnings $241,634 $254,396 $280,497 $309,276 $341,007 $375,995 $414,572 $457,107 $504,006 $555,717 $612,733
Forecasted Balance Sheet
To forecast the balance sheet, we began by linking it to the forecasted
income statement using the asset turnover ratio. To determine ATO, we used the
formula ATO = (Salest/Assetst-1). So 2008 forecasted assets are based on sales
for 2009. We used an ATO of 2.5 because Ross’ ATO was declining until 2006
then went down again in 2007 and the upcoming recession will further decline
sales. We feel that 2.5 better reflects current market trends.
Further assets, such as cash and cash equivalents and accounts
receivables, were forecasted using the average six-year historical percentages.
Merchandise inventory was determined by dividing the forecasted costs of goods
ROSS STORES INC Income Statement Restated Reported in Thousands
February 3, 2007 Average Assume 2008 2009 2010 2011 2012 2013 2014 2015 2016 2017
SALES $5,570,210 0.1026 $6,141,714 $6,771,853 $7,466,646 $8,232,723 $9,077,401 $10,008,742 $11,035,639 $12,167,896 $13,416,322 $14,792,836
COSTS AND EXPENSES Cost of goods sold $4,317,527 77.65% $4,768,983 $5,258,281 $5,797,781 $6,392,633 $7,048,517 $7,771,695 $8,569,071 $9,448,258 $10,417,649 $11,486,500 Selling, general and administrative $702,451 12.15% $745,997 $822,537 $906,929 $999,980 $1,102,578 $1,215,702 $1,340,433 $1,477,962 $1,629,600 $1,796,797 Impairment of long-lived assets $0 Interest of capital leases $80,993 Interest (income) expense, net $72,366 Total costs and expenses $5,092,344 91.31% $5,607,948 $6,183,324 $6,817,733 $7,517,232 $8,288,500 $9,138,901 $10,076,552 $11,110,406 $12,250,334 $13,507,218 Gross Profit $1,252,683 $1,372,730 $1,513,572 $1,668,865 $1,840,090 $2,028,884 $2,237,047 $2,466,568 $2,719,638 $2,998,673 $3,306,336 Operating Income $550,232 $533,765 $588,529 $648,913 $715,491 $788,900 $869,842 $959,087 $1,057,490 $1,165,988 $1,285,618 Income (loss) from continuing operations before income taxes $477,866 $533,765 $588,529 $648,913 $715,491 $788,900 $869,842 $959,087 $1,057,490 $1,165,988 $1,285,618 Provision for taxes on earnings $186,368 0.39 $208,168 $229,526 $253,076 $279,041 $307,671 $339,238 $374,044 $412,421 $454,735 $501,391 Net earnings $291,498 $325,597 $359,003 $395,837 $436,449 $481,229 $530,603 $585,043 $645,069 $711,253 $784,227 Change in deferred taxes from capitalization of leases $29,725 $45,522 $50,193 $55,342 $61,020 $67,281 $74,184 $81,796 $90,188 $99,441 $109,644 Change in net earnings from capitalization of leases $49,864 $71,201 $78,506 $86,561 $95,442 $105,235 $116,032 $127,937 $141,063 $155,536 $171,494 Net change in income $79,589 $116,723 $128,699 $141,903 $156,463 $172,516 $190,216 $209,732 $231,251 $254,977 $281,138 Percentage change in net earnings from capitalization of leases 20.64% 22.43% 27.99% 27.99% 27.99% 27.99% 27.99% 27.99% 27.99% 27.99% 27.99% 27.99%

85
sold by Ross’ average inventory turnover ratio of 3.8. We felt that these numbers
were sufficiently stable to give a fair view of future trends. Total current assets
were calculated by adding cash and cash equivalents, accounts receivables, and
merchandise inventory. The other aspects of current assets were deemed to be
not worth forecasting so they were ignored for the purposes of this analysis.
We then forecasted stockholder’s equity by adding the projected net
earnings from the income statement to the previous year’s equity and
subtracting the projected dividend payout. The method we used to determine
future dividends will be detailed in the section on the statement of cash flows.
We considered forecasting stockholder’s equity to be more important than
liabilities, therefore total liabilities was determined by simply subtracting
stockholder’s equity from total assets. Current liabilities were calculated by
dividing current assets by the current ratio of 1.49. We felt that Ross’ six-year
average current ratio was good enough to give a view of the forecasted current
liabilities. Due to the limitations of this forecasting model, the projections for
total liabilities cannot be considered accurate.
When comparing the forecasted balance sheet using the restated financial
statements, there is a huge difference in the projected liabilities. Restated
liabilities started at 2.18 times the amount projected using the stated documents
in 2008 and grew to 3.02 times in 2017. Additionally, the asset turnover ratio
was very different between the two financials. For the restated forecasted
balance sheet, we used 1.45 using roughly the same point drop as we did for the
stated forecast. We feel that the restated forecasted balance sheet provides a
more accurate picture of Ross’ future condition.

86
ROSS STORES INC Balance Sheet Reported in Thousands
February 3, 2007 Average Assume 2008 2009 2010 2011 2012 2013 2014 2015 2016 2017 ASSETS
CURRENT ASSETS Cash and cash equivalents $367,388 9.78% $264,853 $292,027 $321,989 $355,025 $391,451 $431,613 $475,897 $524,724 $578,561 $637,921 Short-term investments $5,247 Accounts receivable $30,105 1.55% $41,948 $46,252 $50,997 $56,229 $61,998 $68,359 $75,373 $83,106 $91,633 $101,035 Merchandise inventory $1,051,729 3.8 $1,254,996 $1,383,758 $1,525,732 $1,682,272 $1,854,873 $2,045,183 $2,255,019 $2,486,384 $2,741,487 $3,022,763 Prepaid expenses and other $44,245 Deferred income taxes $16,242 Total current assets $1,514,956 $1,561,796 $1,722,037 $1,898,718 $2,093,526 $2,308,322 $2,545,156 $2,806,289 $3,094,214 $3,411,680 $3,761,719
PROPERTY AND EQUIPMENT Land and buildings $134,804 Fixtures and equipment $859,750 Leasehold improvements $402,921 Construction-in-progress $22,681
$1,420,156 Less accumulated depreciation and amortization $671,923 Property and equipment, net $748,233
Long-term investments $31,136 Other long-term assets $64,266 Total non-current assets $843,635 $1,146,945 $1,264,621 $1,394,372 $1,537,434 $1,695,175 $1,869,100 $2,060,870 $2,272,315 $2,505,454 $2,762,514 Total assets $2,358,591 2.5 $2,708,741 $2,986,658 $3,293,089 $3,630,960 $4,003,497 $4,414,256 $4,867,158 $5,366,529 $5,917,135 $6,524,233
LIABILITIES AND STOCKHOLDERS' EQUITY
CURRENT LIABILITIES Accounts payable $698,063 Accrued expenses and other $206,516 Accrued payroll and benefits $145,101 Income taxes payable $33,577 Short-term debt $0 Total current liabilities $1,083,257 1.49 $1,048,186 $1,155,729 $1,274,307 $1,405,051 $1,549,209 $1,708,158 $1,883,415 $2,076,654 $2,289,718 $2,524,643
Long-term debt $150,000 Other long-term liabilities $129,303 Deferred income taxes $86,201 Total Liabilities $1,448,761 $1,597,344 $1,653,432 $1,715,095 $1,782,304 $1,855,031 $1,933,242 $2,016,900 $2,105,966 $2,200,396 $2,300,140
STOCKHOLDERS' EQUITY Common stock, par value $.01 per share Authorized 600,000,000 shares Issued and outstanding 139,356,000 and 144,112,000 shares, respectively $1,402 Additional paid-in capital $545,702 Treasury stock ($22,031) Deferred compensation $0 Accumulated other comprehensive income ($163) (loss) Retained earnings $384,920 $586,487 $808,316 $1,053,085 $1,323,746 $1,623,556 $1,956,104 $2,325,348 $2,735,652 $3,191,829 $3,699,182 Total stockholders equity $909,830 $1,111,397 $1,333,226 $1,577,995 $1,848,656 $2,148,466 $2,481,014 $2,850,258 $3,260,562 $3,716,739 $4,224,092 Total liabilities and stockholders equity $2,358,591 $2,708,741 $2,986,658 $3,293,089 $3,630,960 $4,003,497 $4,414,256 $4,867,158 $5,366,529 $5,917,135 $6,524,233
ROSS STORES INC Balance Sheet Restated Reported in Thousands
February 3, 2007 Average Assume 2008 2009 2010 2011 2012 2013 2014 2015 2016 2017 ASSETS CURRENT ASSETS Cash and cash equivalents $367,388 5.89% $275,215 $303,452 $334,587 $368,915 $406,766 $448,500 $494,516 $545,254 $601,197 $662,879 Short-term investments 5,247 Accounts receivable 30,105 0.92% $43,050 $47,467 $52,337 $57,707 $63,628 $70,156 $77,354 $85,290 $94,041 $103,690 Merchandise inventory 1,051,729 3.8 $1,254,996 $1,383,758 $1,525,732 $1,682,272 $1,854,873 $2,045,183 $2,255,019 $2,486,384 $2,741,487 $3,022,763 Prepaid expenses and other 44,245 Deferred income taxes 16,242 Total current assets 1,514,956 $1,573,261 $1,734,678 $1,912,656 $2,108,894 $2,325,267 $2,563,839 $2,826,889 $3,116,928 $3,436,724 $3,789,332
PROPERTY AND EQUIPMENT Land and buildings 134,804 Fixtures and equipment 859,750 Leasehold improvements 402,921 Construction-in-progress 22,681
1,420,156 Less accumulated depreciation and amortization 671,923 Property and equipment, net 748,233
Long-term investments 31,136 Other long-term assets 64,266 Restated capital leases 1,377,440 Total non-current assets 2,221,075 $3,096,983 $3,414,733 $3,765,085 $4,151,382 $4,577,314 $5,046,947 $5,564,763 $6,135,708 $6,765,232 $7,459,344 Total assets $3,736,031 1.45 $4,670,244 $5,149,411 $5,677,740 $6,260,276 $6,902,581 $7,610,786 $8,391,652 $9,252,636 $10,201,956 $11,248,677
LIABILITIES AND STOCKHOLDERS' EQUITY
CURRENT LIABILITIES Accounts payable $698,063 Accrued expenses and other 206,516 Accrued payroll and benefits 145,101 Income taxes payable 33,577 Short-term debt 0 Total current liabilities 1,083,257 1.49 $1,055,880 $1,164,213 $1,283,661 $1,415,365 $1,560,582 $1,720,697 $1,897,241 $2,091,898 $2,306,526 $2,543,176
Long-term debt 150,000 Other long-term liabilities 129,303 Deferred income taxes 86,201 Restated long-term capital leases 1,377,440 Total Liabilities $2,826,201 $3,487,646 $3,744,984 $4,028,545 $4,340,419 $4,682,914 $5,058,570 $5,470,193 $5,920,872 $6,414,016 $6,953,383
STOCKHOLDERS' EQUITY Common stock, par value $.01 per share Authorized 600,000,000 shares Issued and outstanding 139,356,000 and 144,112,000 shares, respectively 1,402 Additional paid-in capital 545,702 Treasury stock (22031) Deferred compensation 0 Accumulated other comprehensive income (163) (loss) Retained earnings 384,920 $657,688 $958,023 $1,289,353 $1,655,457 $2,060,502 $2,509,081 $3,006,262 $3,557,629 $4,169,342 $4,848,189 Total stockholders equity 909,830 $1,182,598 $1,404,427 $1,649,196 $1,919,857 $2,219,667 $2,552,215 $2,921,459 $3,331,763 $3,787,940 $4,295,294 Total liabilities and stockholders equity $3,736,031 $4,670,244 $5,149,411 $5,677,740 $6,260,276 $6,902,581 $7,610,786 $8,391,652 $9,252,636 $10,201,956 $11,248,677

87
Forecasted Statement of Cash Flows
The statement of cash flows is the most difficult financial document to
forecast. As a result, we have only calculated the net earnings, net cash provided
by operating activities, net cash used in investing activities, and dividends paid.
Net earnings were taken directly from our forecasted income statement. In order
to calculate the operating cash flow, we compared the ratios for CFFO/Operating
Income, CFFO/Net Income, and CFFO/Sales over six years eliminating the 2004
ratio as an unusual event caused by the restatement of their financial documents
in order to better follow GAAP. We decided that the CFFO/Net Income ratio was
the most stable and had the best explanatory power of the three. Using the
adjusted average of 1.83, we multiplied the forecasted net income to arrive at
our projected cash flows from operations.
Net cash used in investing activities was forecasted by finding the
change between total assets from year to year. Projected dividends paid were
determined by finding the average per share dividend growth rate and
multiplying that by the number of shares outstanding as of March 16, 2007. Due
to the difficulty of forecasting changes in the number of shares outstanding, we
did not attempt to modify this number. The forecasted dividends were then used
in calculating the stockholder’s equity on the balance sheet.
Due to the restatement, there was a huge increase in cash flows from
operations, and cash used in investing activities. The increase in CFFO was due
in part due to changing our CFFO/Net Income ratio to be inline with our restated
financial statements. The ratio used was 2.64.
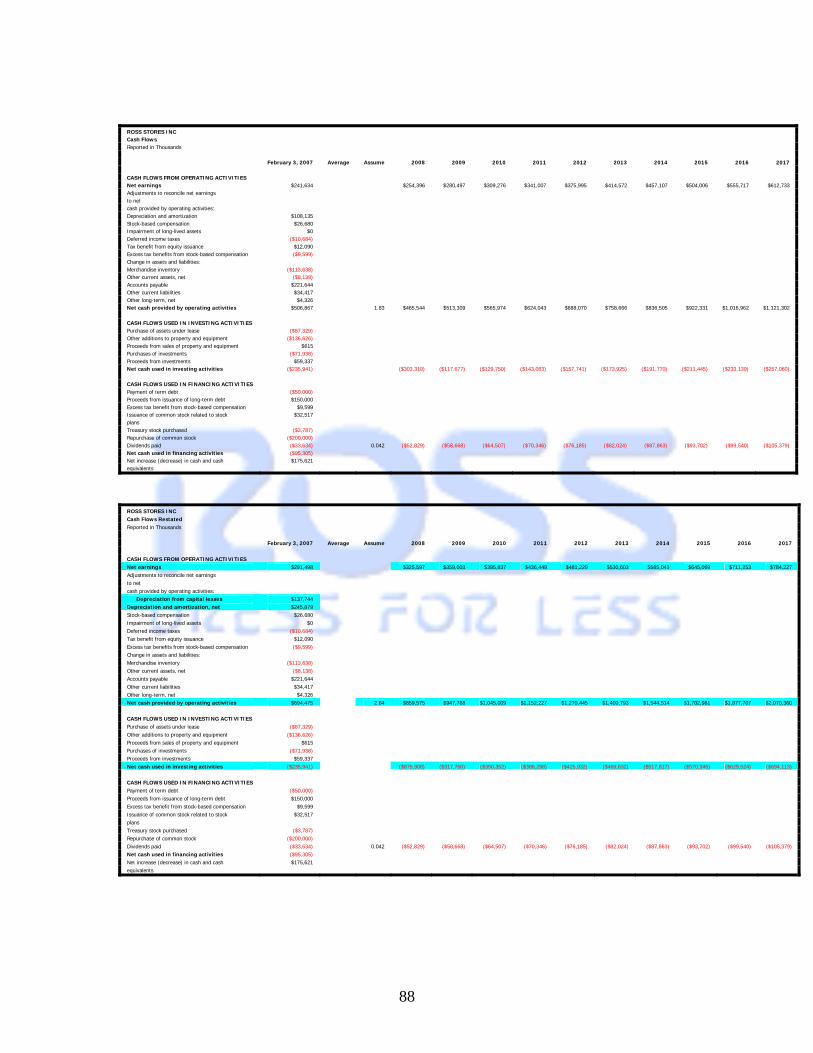
88
ROSS STORES INC Cash Flows Reported in Thousands
February 3, 2007 Average Assume 2008 2009 2010 2011 2012 2013 2014 2015 2016 2017
CASH FLOWS FROM OPERATING ACTIVITIES Net earnings $241,634 $254,396 $280,497 $309,276 $341,007 $375,995 $414,572 $457,107 $504,006 $555,717 $612,733 Adjustments to reconcile net earnings to net cash provided by operating activities: Depreciation and amortization $108,135 Stock-based compensation $26,680 Impairment of long-lived assets $0 Deferred income taxes ($10,684) Tax benefit from equity issuance $12,090 Excess tax benefits from stock-based compensation ($9,599) Change in assets and liabilities: Merchandise inventory ($113,638) Other current assets, net ($8,138) Accounts payable $221,644 Other current liabilities $34,417 Other long-term, net $4,326 Net cash provided by operating activities $506,867 1.83 $465,544 $513,309 $565,974 $624,043 $688,070 $758,666 $836,505 $922,331 $1,016,962 $1,121,302
CASH FLOWS USED IN INVESTING ACTIVITIES Purchase of assets under lease ($87,329) Other additions to property and equipment ($136,626) Proceeds from sales of property and equipment $615 Purchases of investments ($71,938) Proceeds from investments $59,337 Net cash used in investing activities ($235,941) ($303,310) ($117,677) ($129,750) ($143,063) ($157,741) ($173,925) ($191,770) ($211,445) ($233,139) ($257,060)
CASH FLOWS USED IN FINANCING ACTIVITIES Payment of term debt ($50,000) Proceeds from issuance of long-term debt $150,000 Excess tax benefit from stock-based compensation $9,599 Issuance of common stock related to stock $32,517 plans Treasury stock purchased ($3,787) Repurchase of common stock ($200,000) Dividends paid ($33,634) 0.042 ($52,829) ($58,668) ($64,507) ($70,346) ($76,185) ($82,024) ($87,863) ($93,702) ($99,540) ($105,379) Net cash used in financing activities ($95,305) Net increase (decrease) in cash and cash $175,621 equivalents
ROSS STORES INC Cash Flows Restated Reported in Thousands
February 3, 2007 Average Assume 2008 2009 2010 2011 2012 2013 2014 2015 2016 2017
CASH FLOWS FROM OPERATING ACTIVITIES Net earnings $291,498 $325,597 $359,003 $395,837 $436,449 $481,229 $530,603 $585,043 $645,069 $711,253 $784,227 Adjustments to reconcile net earnings to net cash provided by operating activities: Depreciation from capital leases $137,744 Depreciation and amortization, net $245,879 Stock-based compensation $26,680 Impairment of long-lived assets $0 Deferred income taxes ($10,684) Tax benefit from equity issuance $12,090 Excess tax benefits from stock-based compensation ($9,599) Change in assets and liabilities: Merchandise inventory ($113,638) Other current assets, net ($8,138) Accounts payable $221,644 Other current liabilities $34,417 Other long-term, net $4,326 Net cash provided by operating activities $694,475 2.64 $859,575 $947,768 $1,045,009 $1,152,227 $1,270,445 $1,400,793 $1,544,514 $1,702,981 $1,877,707 $2,070,360
CASH FLOWS USED IN INVESTING ACTIVITIES Purchase of assets under lease ($87,329) Other additions to property and equipment ($136,626) Proceeds from sales of property and equipment $615 Purchases of investments ($71,938) Proceeds from investments $59,337 Net cash used in investing activities ($235,941) ($875,908) ($317,750) ($350,352) ($386,298) ($425,932) ($469,632) ($517,817) ($570,945) ($629,524) ($694,113)
CASH FLOWS USED IN FINANCING ACTIVITIES Payment of term debt ($50,000) Proceeds from issuance of long-term debt $150,000 Excess tax benefit from stock-based compensation $9,599 Issuance of common stock related to stock $32,517 plans Treasury stock purchased ($3,787) Repurchase of common stock ($200,000) Dividends paid ($33,634) 0.042 ($52,829) ($58,668) ($64,507) ($70,346) ($76,185) ($82,024) ($87,863) ($93,702) ($99,540) ($105,379) Net cash used in financing activities ($95,305) Net increase (decrease) in cash and cash $175,621 equivalents

89
Weighted Average Cost of Capital
Investing in a company is always risky. Stockholders and lenders both
wish to know what profit they could make and the chance for failure that exists.
The Weighted Average Cost of Capital (WACC), gives a look at the opportunity
costs that is inherent in investing in a business, (Investors need a good WACC).
In order to calculate Ross’ WACC, we need to find their cost of equity and their
weighted average cost of debt.
Cost of Equity
The primary means of determining cost of equity is by using the Capital
Asset Pricing Model or CAPM, where the risk-free rate is added to the market risk
premium multiplied by beta. Since it is possible that CAPM can not adequately
measure the cost of capital, we first worked on finding a beta that would explain
the difference between Ross’ stock return and the market return.
In order to find the beta, we ran 25 regression models comparing the
monthly stock return and the market return minus the risk free rate over a
period ranging from 24 to 27 months. The risk free rate was calculated using
the rate of return for the U.S. treasury bonds for 3 months, 6 months, 2 years, 5
years and 10 years. The market return was taken from the Yahoo financials
webpage S&P 500 historical data. The monthly stock return for Ross was also
taken from the Yahoo financial webpage and adjusted for dividends paid and the
2003 stock split.
After running the regression models, we found the highest adjusted R-
squared of .11088 was for the 6 month return over 72 months. As this indicates
that only 11% of the changes in the stock price can be explained by changes in
the market, we felt that CAPM could not adequately estimate Ross’ cost of
equity.

90
We calculated the cost of equity for each of the returns over 72 months in
order to get an idea of what CAPM would calculate for Ross Stores. The risk free
rate was the yield for each of the individual treasury bills during February 2008.
We decided that the market risk premium would be 6.80%, as that has been the
returns for the Standard and Poor’s 500 index from 1926 to 2005 (Palepu &
Healy 8-3). The betas were calculated from our regression analyses. We found
the cost of equity to be between 7.00% and 8.72%. Again, we decided not to
use these results because of the poor relationship between the stock price and
the market returns.
Cost of Equity using CAPM Beta Ke RF MRP 3mo 72 0.7395 7.20% 2.17% 6.80% 6mo 72 0.7408 7.14% 2.10% 6.80% 2yr 72 0.7395 7.00% 1.97% 6.80% 5yr 72 0.7356 7.78% 2.78% 6.80%
10yr 72 0.7325 8.72% 3.74% 6.80%

91
Instead of CAPM, we decided to use a different model, where the cost of
equity is derived from the long run residual income perpetuity model and is
supported by the current stock price (Moore, Mark). This model is expressed as
Ke=(ROE+(P/B-1)*g)/(P/B). P or the market value of equity of 3.87 billion, was
taken from the Yahoo finance page as of March 30, 2008 and B, the book value
of equity, was taken from Ross’ 2007 10-k. The growth rate of 13.33%, or g,
was calculated using Ross’ five-year average growth rate. Return on equity was
the five-year average ROE of .30 for the financial documents as stated and .37
restated. Using these numbers, we calculated a cost of equity of 17.25% as
stated and 18.89% restated.
Cost of Equity derived from the long run residual income perpetuity model and supported by the current stock price
As stated Restated Market value of equity $3,870,000 $3,870,000 Book value of equity $909,830 $909,830 P/B 4.25 4.25 Five-year average ROE 0.30 0.37 Five-year average sales growth 0.13 0.13 P/B-1 3.25 3.25 (P/B-1)*g 0.43 0.43 ROE+(P/B-1)*g 0.73 0.80 Ke 17.25% 18.89% Ke lower bound 12.44% 12.84% Ke upper bound 22.06% 24.95%

92
Cost of Debt
Calculating cost of debt was more straightforward. We used the interest
rate that Ross uses for its bank credit as stated in their 2007 10-k which was
LIBOR plus 45 points. As of February 2, 2007, this rate was equal to 5.88%. We
applied this rate to all portions of their liability expect for their long-term senior
notes, which were stated in the 10-k as having interest rates of 6.83% and
6.53%. The cost of debt was then calculated as being 5.94% as stated and
5.91% restated.
Weighted Average Cost of Debt Weight Weighted Rate
As Stated Restated
Cost of Debt
As stated Restated
Accounts payable $698,063 $698,063 48.18% 24.70% 5.88% 2.83% 1.45%Accrued expenses and other $206,516 $206,516 14.25% 7.31% 5.88% 0.84% 0.43%Accrued payroll and benefits $145,101 $145,101 10.02% 5.13% 5.88% 0.59% 0.30%Income taxes payable $33,577 $33,577 2.32% 1.19% 5.88% 0.14% 0.07%Short-term debt $0 $0 0.00% 0.00% 5.88% 0.00% 0.00%Total current liabilities $1,083,257 $1,083,257 74.77% 38.33%
Long-term debt, Note A $85,000 $85,000 5.87% 3.01% 6.38% 0.37% 0.19%Long-term debt, Note B $65,000 $65,000 4.49% 2.30% 6.53% 0.29% 0.15%Other long-term liabilities $129,303 $129,303 8.93% 4.58% 5.88% 0.52% 0.27%Deferred income taxes $86,201 $86,201 5.95% 3.05% 5.88% 0.35% 0.18%Restated long-term capital leases $0 $1,377,440 0.00% 48.74% 5.88% 0.00% 2.87%Total Liabilities $1,448,761 $2,826,201 100.00% 100.00% Average Cost 5.94% 5.91%
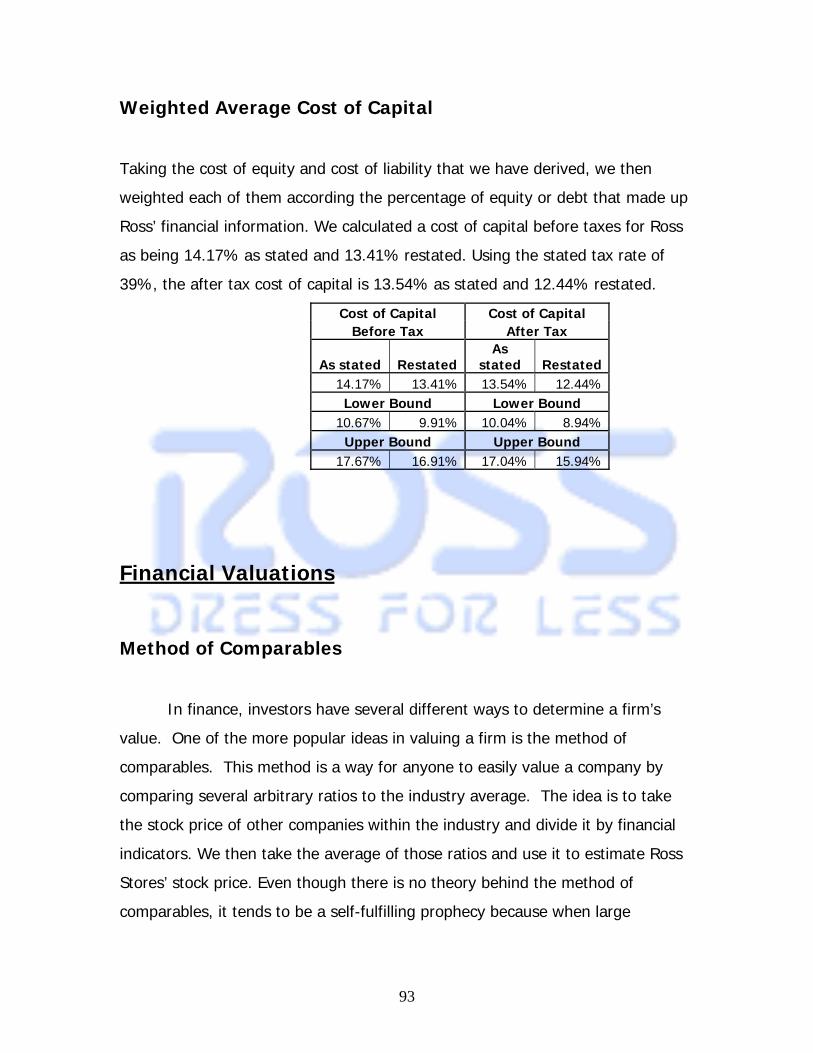
93
Weighted Average Cost of Capital
Taking the cost of equity and cost of liability that we have derived, we then
weighted each of them according the percentage of equity or debt that made up
Ross’ financial information. We calculated a cost of capital before taxes for Ross
as being 14.17% as stated and 13.41% restated. Using the stated tax rate of
39%, the after tax cost of capital is 13.54% as stated and 12.44% restated.
Cost of Capital Cost of Capital Before Tax After Tax
As stated RestatedAs
stated Restated 14.17% 13.41% 13.54% 12.44%
Lower Bound Lower Bound 10.67% 9.91% 10.04% 8.94%
Upper Bound Upper Bound 17.67% 16.91% 17.04% 15.94%
Financial Valuations
Method of Comparables
In finance, investors have several different ways to determine a firm’s
value. One of the more popular ideas in valuing a firm is the method of
comparables. This method is a way for anyone to easily value a company by
comparing several arbitrary ratios to the industry average. The idea is to take
the stock price of other companies within the industry and divide it by financial
indicators. We then take the average of those ratios and use it to estimate Ross
Stores’ stock price. Even though there is no theory behind the method of
comparables, it tends to be a self-fulfilling prophecy because when large

94
numbers of investors buy according to these methods, the market will mirror the
ratios (Moore).
Ross Ross Restated Kohl's T.J. Maxx J.C. Penney Average Value Restated
P/E (Trailing) 17.96 14.87 13.65 20.88 8.11 14.21 $24.59 $29.70
P/E
(Forecasting) 17.07 13.33 13.90 15.26 11.80 13.65 $24.85 $31.82
P/B 4.75 4.75 2.61 6.74 2.11 2.36 $15.46 $15.46
D/P 0.0078 0.0078 0.0000 0.0080 0.0169 0.01 $19.47 $19.47
PEG 1.94 1.41 0.99 1.66 0.59 1.08 $17.27 $23.75
EV/EBITDA 10.99 9.39 10.71 11.37 6.31 11.04 $31.26 $42.68
EV/FCF 19.80 15.50 10.39 22.48 29.22 25.85 $51.09 $85.97
(Numbers in red were dropped as outliers)
Price to Earnings (Trailing)
In today’s marketplace many investors find it beneficial to see the market
value of earnings. Investors use the price to earnings ratio to determine how the
market values a firm’s earnings. To determine a company’s P/E ratio you divide
the market price of the firm by the earnings per share. The number given is
called the P/E multiple; it tells us how much more people are willing to pay for
earnings. For example, Ross’s trailing P/E is $17.96; meaning investors are
willing to pay $17.96 for every dollar of earnings. In order to determine what
the price should be for Ross Stores Inc. we determined the average P/E multiple
of the industry and multiplied it by Ross’s most current stated earnings per share
giving us a stock price of $24.59. This ratio is not the most accurate way to
value stocks though because it uses past information. In finance stocks are
priced based on expected future cash flows while the stated earnings per share
represent past performance (trailing).

95
Price to Earnings Ratio (Forecasted)
Stock price is based on the market’s expectation of a firm’s future
performance. The price to earnings ratio (trailing) utilizes historical earnings. In
order to get a better picture of the firm’s future performance, we use the
projected future earnings to determine the P/E forecasted ratio. This makes sure
that the price and earnings are both stated in future terms. Thus, the inputs are
within the same time frame as the results. Finance is a forward looking
discipline; therefore, this method is more consistent with financial theory. We
used the industry average P/E ratio of 13.65 to calculate Ross’ implied stock
price of $24.85 using the stated financial data. The restated financial data
yielded a price of $31.82. According to this ratio, Ross’ stock is slightly
overvalued.
P/B Ratio
The price to book method of comparables utilizes a firm’s current price per
share and book value of equity in order to formulate a valuation. In order to do
so we took the current price per share, and divide this number by the book value
of equity per share. According to Ross’ financial statements, they are operating
at a P/B ratio of 4.75. After computing the same ratios for our competitors, we
have configured the industry average to be 2.36. Once we found this number,
we multiplied it times our book value of equity per share in order to derive a
share price of $15.46. This would indicate that Ross Stores is currently being
overvalued according to this method due to the fact that their current share price
is valued at $31.07.
Dividend Yield
The dividend yield is another ratio that is used in the method of
comparables. Obviously, this ratio is only applicable if the firm pays dividends,
and since Ross is a dividend paying company, it was important that we use it. It
is computed by dividing a firm’s dividend paid per share by the firm’s prices per

96
share. By using the same process as with the other ratios we calculated an
industry average dividend yield (D/P) excluding any outliers. The only outlier in
this case was Kohl’s because they do not pay dividends. So excluding Kohl’s,
and Ross, we figured the average to be 0.01. Ross was below the average with
a D/P of .0078, both stated and restated. When then calculated the fair share
price using Ross’s dividends per share and dividing that by the industry average
D/P. The share price we determined was $19.47. This is well below the
benchmark price of $31.07 as of April 1, 2008. This means that based on this
ratio analysis, Ross is overvalued.
PEG Ratio
PEG is a ratio that is widely used to determine a stock’s potential value. It
is similar to the price to earnings ratio, but goes further to take into account
earnings growth. We used our calculated earnings per share (trailing), divided
by the projected five year earnings growth rate, to find the PEG for each of Ross’
competitors. We then averaged those figures and arrived at an overall industry
ratio of 1.08. Utilizing this number, Ross’ value, using stated data, was
determined to be $17.27, and using restated data was found to be $23.75. This
figure indicates that Ross’ stock is overvalued.
Enterprise Value to EBITDA
This ratio takes the enterprise value of a firm and divides that by its
earnings before interest, taxes, depreciation, and amortization (EBITDA). This
ratio seeks to value a firm by comparing its value producing assets to its income
after cash based operating expenses. We found Ross’ enterprise value by taking
the market value of its assets and subtracting cash and cash equivalents, and
short and long-term investments. The EBITDA was derived from information
found in their 2007 financial statements. The average EV/EBITDA ratio amongst
Ross’ competitors was 11.04. Using this to determine the value of Ross’ Stock,
we found that the value under the stated financials was $31.26, and under the
97
restated financials it was $42.68. So, according to this method of valuing a firm,
Ross’ stock price was undervalued.
Enterprise Value to Free Cash Flow
The enterprise value to free cash flow ratio is a valuation measurement
that compares a firm’s value producing assets to its free cash flow. A company’s
free cash flow is determined by taking its cash flow from operations, adding in
cash flow from investments and any changes in debt. To calculate the EV/FCF
ratio, the firm’s stock price is then divided by the computed free cash flow.
Upon doing this with Ross’ competitors, the industry average EV/FCF was found
to be 25.85, a figure that puts Ross’ market price at a value of $51.09, a number
well above its actual price of $26.28. Furthermore, when using Ross’ restated
statistics that take into account is operating leases to calculate its value via the
industry average EV/FCF, its value raises to $85.97, one still overwhelmingly over
its actual price of $35.55. In this aspect, Ross’ market price is undervalued.
Conclusion
According to the method of comparables, we have found that in the
majority of instances Ross’ ratios indicate that the company’s share price is
overvalued. It is clear that the method of comparables is not a reliable source for
valuing a company. This method does not take into consideration aspects of a
firm such as economies of scale, different key accounting policies, or intrinsic
valuations. These intrinsic valuations are necessary to add that extra aspect that
takes into account the firm’s future operating, financing, and investing activities.
This will be further discussed in the following section.

98
Intrinsic Valuations
Intrinsic valuation models are another way of valuing companies. They
tend to be more accurate than the method of comparables because they capture
more of the firm’s operating activities. The four different valuation models we
are using include the discounted dividend, free cash-flow, residual income, and
the abnormal earnings growth model. All of these models are designed to look
past the numbers being used in the method of comparables to get a more
thorough look at the firm. These models are further examined and discussed in
the following sections. For ease of comprehension, we have marked the stock
prices that fall outside the range of the stock price of $31.07 plus or minus 20%.
Prices that are below $24.86 are marked in red indicating that they are
overvalued, while prices that are above $37.28 are marked in green indicating
that they are undervalued.

99
Discounted Dividend Model
Stated
0.00 0.02 0.04 0.06 0.08 0.10 0.12
12.44% $5.65 $6.09 $6.73 $7.78 $9.77 $15.01 $68.09
14.04% $4.97 $5.27 $5.68 $6.30 $7.33 $9.39 $15.46
15.65% $4.44 $4.64 $4.92 $5.32 $5.92 $6.94 $9.10
17.25% $4.01 $4.16 $4.35 $4.61 $4.99 $5.57 $6.61
18.85% $3.65 $3.76 $3.90 $4.08 $4.33 $4.70 $5.27
20.46% $3.36 $3.44 $3.55 $3.67 $3.85 $4.08 $4.43
22.06% $3.11 $3.18 $3.25 $3.35 $3.47 $3.63 $3.86
Restated
0.00 0.02 0.04 0.06 0.08 0.10 0.12
12.84% $5.46 $5.86 $6.43 $7.35 $9.01 $13.02 $36.13
14.86% $4.68 $4.93 $5.27 $5.76 $6.53 $7.94 $11.33
16.88% $4.10 $4.26 $4.47 $4.76 $5.18 $5.84 $7.04
18.89% $3.65 $3.75 $3.89 $4.07 $4.32 $4.68 $5.24
20.91% $3.29 $3.36 $3.46 $3.57 $3.73 $3.94 $4.25
22.93% $3.00 $3.05 $3.11 $3.20 $3.30 $3.43 $3.61
24.95% $2.76 $2.79 $2.84 $2.90 $2.97 $3.06 $3.17
The dividend discount model is an intrinsic method of valuing a company.
It assumes investors buy stock for future dividend payments. The model
produces a per share value of stock based on the present value of forecasted
dividend payments. Above is the sensitivity analysis of the discounted dividend
model. We assume different growth rates labeled from 0 to 12% with cost of
equity ranging from 12.44% to 22.06%. We calculated these values by totaling
the present value of dividend payments for the next 10 years plus the present
value of the dividend perpetuity. This number gives us an expected stock price
as of February 2007, and then we brought forward these numbers to April 1,
2008 using the future value. The stock price as of April 1, 2008 was 31.07.
Using the dividend discount model, this stock price is overvalued in every

100
instance other than at a 12% growth rate with a 12.44% cost of equity. A 12%
growth rate with a 12.44% cost of equity is an unreasonable assumption
because the growth rate cannot exceed the cost of equity. Using the dividend
discount model as stated and restated, it appears that the stock is extremely
overvalued. The dividend discount model is the worst model because it values a
stock solely on future dividend payments. To assume that investors buy stock
for the dividend payout alone is erroneous. In order to accept the results of this
model, one would have to ignore the fact that investors invest for capital
appreciation. Due to the lack of explanatory power of this model, we feel that it
does not provide a reliable representation of the value for Ross’ stock.

101
Discounted Free Cash Flows Model
Stated
0.07 0.08 0.09 0.10 0.11 0.12 0.13
10.67% $88.97 $117.57 $180.47 $431.61 ($831.19) ($197.57) ($107.41)
11.83% $64.16 $77.92 $101.39 $150.45 $317.03 ($1,534.28) ($207.65)
13.00% $48.98 $56.74 $68.37 $87.75 $126.51 $242.66 $148,918.22
14.17% $38.73 $43.54 $50.21 $60.08 $76.18 $107.13 $191.08
15.33% $31.33 $34.51 $38.69 $44.45 $52.85 $66.30 $91.26
16.50% $25.74 $27.94 $30.73 $34.37 $39.35 $46.53 $57.81
17.67% $21.35 $22.93 $24.87 $27.32 $30.51 $34.82 $40.97
Restated
0.07 0.08 0.09 0.10 0.11 0.12 0.13
9.91% $177.85 $262.72 $533.24 ($5,517.60) ($420.87) ($211.71) ($138.12)
11.08% $118.89 $153.19 $220.47 $412.22 $5,333.97 ($456.28) ($211.63)
12.25% $86.10 $103.75 $132.26 $186.14 $326.40 $1,598.92 ($511.77)
13.41% $65.20 $75.54 $90.56 $114.38 $157.93 $263.06 $875.58
14.58% $50.69 $57.27 $66.20 $79.03 $99.02 $134.50 $214.88
15.75% $40.02 $44.44 $50.18 $57.91 $68.90 $85.76 $114.88
16.91% $31.82 $34.93 $38.82 $43.83 $50.54 $59.99 $74.26
The discounted free cash flows model is an intrinsic model that values the
company based on its net cash flows, excluding those from financing (equity). In
layman’s terms it is essentially your cash flows from operations that are not
being used to acquire new assets. The free cash flows were figured by
forecasting out the cash flows from operations and investing. We then
subtracted the cash flows from investing from the cash flows from operations to
find the forecasted free cash flows. Next we discounted those forecasted figures
back to today’s dollars. This gives us a present value of expected future assets.
When then subtract the current book value of liabilities to get an estimated value
of equity. This number is divided by the total number of shares outstanding to

102
get a per share value. In order to have a time consistent comparison, it’s
necessary to bring forward this value to April 1, 2008. We have growth rates
ranging from 7% to 13% and a WACCBT of 13.41% plus or minus 3.5%. Given
these assumptions, it is apparent through our sensitivity analysis, when using the
discounted free cash flow model that Ross is undervalued. Utilizing this model,
there are no significant differences between the as-stated and restated figures.
Given that the values range from $148,918.22 to $21.35, it obvious that this
model is too sensitive to the changes in the growth rate. Thus, this model is
undesirable due to its sensitivity to changes in the growth rate.

103
Residual Income Model
As Stated
0.00 (0.10) (0.20) (0.30) (0.40) (0.50)
12.44% $13.23 $13.64 $13.80 $13.88 $13.94 $13.97
14.04% $11.98 $12.28 $12.41 $12.47 $12.52 $12.55
15.65% $10.86 $11.08 $11.18 $11.24 $11.27 $11.30
17.25% $9.86 $10.03 $10.11 $10.15 $10.18 $10.20
18.85% $8.97 $9.10 $9.16 $9.20 $9.22 $9.24
20.46% $8.17 $8.27 $8.32 $8.35 $8.37 $8.39
22.06% $7.46 $7.54 $7.58 $7.61 $7.62 $7.64
Restated
0.00 (0.10) (0.20) (0.30) (0.40) (0.50)
12.84% $13.92 $15.10 $15.56 $15.81 $15.96 $16.07
14.86% $12.47 $13.28 $13.62 $13.81 $13.93 $14.01
16.88% $11.15 $11.70 $11.96 $12.11 $12.20 $12.27
18.89% $9.95 $10.35 $10.55 $10.66 $10.74 $10.79
20.91% $8.89 $9.18 $9.33 $9.42 $9.48 $9.53
22.93% $7.96 $8.18 $8.29 $8.36 $8.41 $8.45
24.95% $7.15 $7.31 $7.40 $7.45 $7.49 $7.52
The residual income model is an intrinsic valuation model that values a
company based on the sum of a firm’s forecasted residual income. The residual
income for a firm is the difference between the actual, or projected, net income
and the expected net income given the cost of equity. Similar to the other
valuation models, we must find the present value of the forecasted residual
income to estimate a fair value for the firm. The reason residual income is used
is because it based on the cost of equity. The cost of equity is derived from
actual (not estimated) data; therefore, it provides a benchmark from which to
compare expected net income to forecasted net income. This model meets all of
the requirements for a “good” model. It is grounded in theory, it uses
information that is easily forecasted, has a lot of explanatory power, and is not

104
sensitive to changes in growth rate or cost of capital. We have a cost of equity
of 17.25% plus or minus 5%. We have growth rates ranging from 0% to -50%.
The growth rate must be negative in order for the expected net income to
eventually match up with the forecasted net income. Since residual income
changes depending on the cost of equity, we calculated the terminal residual
income perpetuity value by using linear regression analysis over the ten year
forecast. This allows the terminal residual income perpetuity to reflect the trends
created by different costs of equity. Using this method, it is clear that Ross is
overvalued at an April 1, 2008 stock price of $31.07. Given that this model has
about 45% explanatory power (Moore), we are extremely confident in the results
that it provides us.

105
Abnormal Earnings Growth Model
Growth Ke 0.00 (0.10) (0.20) (0.30) (0.40) (0.50)
12.44% $17.32 $17.28 $17.27 $17.26 $17.26 $17.26 14.04% $13.19 $13.60 $13.76 $13.85 $13.91 $13.95 15.65% $10.48 $11.01 $11.24 $11.37 $11.45 $11.51 17.25% $8.56 $9.10 $9.35 $9.49 $9.59 $9.65 18.85% $7.16 $7.66 $7.91 $8.05 $8.15 $8.21 20.46% $6.11 $6.56 $6.78 $6.92 $7.01 $7.08 22.06% $5.30 $5.69 $5.90 $6.02 $6.11 $6.17
Ke 0.00 (0.10) (0.20) (0.30) (0.40) (0.50)12.84% $19.10 $19.54 $19.72 $19.81 $19.87 $19.91 14.86% $13.74 $14.53 $14.87 $15.05 $15.17 $15.25 16.88% $10.39 $11.20 $11.57 $11.78 $11.92 $12.01 18.89% $8.17 $8.89 $9.24 $9.45 $9.59 $9.69 20.91% $6.63 $7.24 $7.56 $7.75 $7.87 $7.97 22.93% $5.53 $6.03 $6.30 $6.47 $6.59 $6.67 24.95% $4.71 $5.12 $5.35 $5.50 $5.60 $5.67
The abnormal earnings growth model is yet another intrinsic way to value
a firm. This model sets itself apart from other models by accounting for
adjustments in earnings. According to this model, a firm has a benchmark
income which is the amount of income that is suspected based on that firm’s
cost of equity. Also, the AEG model operates on the assumption that dividends
paid are reinvested into the firm. The return on the dividends reinvested from
the previous year added to the net income of the current year make up a firm’s
cumulative earnings. We compare the firm’s cumulative earnings to the
benchmark earnings to calculate the abnormal earnings growth. Then, to
calculate the terminal perpetuity value, we used a growth rate found by
performing a linear regression analysis of the last five years of forecasted AEG.
Since AEG changes depending on the cost of equity, this allows the sensitivity
analysis to more accurately reflect changes in Ke. After finding the present value
of each year’s abnormal earnings growth, we then find the present value of the
terminal value perpetuity. These figures added to the first year forecasted net

106
income equals the average adjusted perpetuity value. After finding this figure,
we use the cost of equity to then derive the market value of equity as of fiscal
year end February 2007. Once we divide that number by the number of shares
outstanding, we get a share price of that date. To be time consistent, we
brought that price up to April 1, 2008. The price we calculated was $8.55.
Compared to a published price of $31.07, the firm is significantly over valued.
Long Run Residual Income Perpetuity Model
As Stated
Growth Ke 0.0826 0.0926 0.1026 0.1126 0.1226
12.44% $39.04 $48.96 $67.98 $119.29 $744.34 Constant Return on Equity 14.84% $25.40 $28.57 $33.12 $40.22 $52.80
0.30 17.25% $19.06 $20.46 $22.26 $24.66 $28.02 19.65% $15.39 $16.10 $16.95 $18.01 $19.36 22.06% $13.01 $13.38 $13.82 $14.33 $14.95 Return on Equity Ke 0.28 0.29 0.30 0.31 0.32 12.44% $61.09 $64.54 $67.98 $71.43 $74.87 Constant Growth Rate 14.84% $29.77 $31.44 $33.12 $34.80 $36.48
0.1026 17.25% $20.00 $21.13 $22.26 $23.38 $24.51 19.65% $15.24 $16.10 $16.95 $17.81 $18.67 22.06% $12.42 $13.12 $13.82 $14.52 $15.22 Return on Equity Growth 0.28 0.29 0.30 0.31 0.32 0.0826 $17.30 $18.18 $19.06 $19.93 $20.81 Constant Cost of Equity 0.0926 $18.48 $19.47 $20.46 $21.44 $22.43
17.25% 0.1026 $20.00 $21.13 $22.26 $23.38 $24.51 0.1126 $22.02 $23.34 $24.66 $25.97 $27.29 0.1226 $24.86 $26.44 $28.02 $29.60 $31.18

107
Restated
Growth Ke 0.0826 0.0926 0.1026 0.1126 0.1226
12.84% $47.29 $58.40 $78.13 $122.85 $322.08 Constant Return on Equity 15.87% $29.36 $32.63 $37.06 $43.42 $53.31
0.37 18.89% $21.64 $23.06 $24.80 $27.00 $29.86 21.92% $17.35 $18.07 $18.91 $19.91 $21.12 24.95% $14.61 $15.00 $15.45 $15.96 $16.54 Return on Equity Ke 0.35 0.36 0.37 0.38 0.39 12.84% $72.29 $75.21 $78.13 $81.05 $83.97 Constant Growth Rate 15.87% $34.29 $35.68 $37.06 $38.45 $39.84
0.1026 18.89% $22.95 $23.87 $24.80 $25.73 $26.66 21.92% $17.49 $18.20 $18.91 $19.62 $20.32 24.95% $14.29 $14.87 $15.45 $16.02 $16.60 Return on Equity Growth 0.35 0.36 0.37 0.38 0.39 0.0826 $20.14 $20.89 $21.64 $22.40 $23.15 Constant Cost of Equity 0.0926 $21.40 $22.23 $23.06 $23.89 $24.72
18.89% 0.1026 $22.95 $23.87 $24.80 $25.73 $26.66 0.1126 $24.90 $25.95 $27.00 $28.05 $29.10 0.1226 $27.45 $28.66 $29.86 $31.07 $32.28
The Long Run Residual Income Perpetuity Model is a simple model. It
requires the book value of equity, the return on equity, the cost of equity, and a
growth rate which is usually based on net income. Due to the simplicity of the
model and the ease of finding the various inputs, this model provides a good
way to get a general overview of the value of the company. Additionally, it is
very easy to adjust the values used in the model and determine how sensitive
the firm’s stock price is to changes. For Ross Stores’ we used the stated book
value of equity, our calculated cost of equity for both the stated (17.25%) and
restated (18.89%) financial statements, a forecasted net income growth rate of
10.26%, and Ross’ six year average return on equity for the stated (.30) and
restated (.37) financials. Using these numbers, we valued Ross’ stock price at
$22.26 as stated and $24.80 restated. After running the sensitivity analysis, we
determined that Ross’ stock price was extremely sensitive to changes in the cost

108
of equity. As demonstrated in the tables, when the cost of equity varies, the
stock price has a wide range of values. However, when the cost of equity is held
constant, there is very little variation in stock price.
Conclusion
The intrinsic valuation models must be based on financial theory. This
means that they are more clearly linked to the values found on the firm’s
financial statements. Also, these models use easily forecastable data which
provides a more accurate view of future earnings and therefore future share
prices which is the overall objective of such a model. In conclusion, based on
these intrinsic models, we have determined that as of April 1, 2008 the published
stock price of $31.07 is overvalued. We also ran sensitivity analyses on all of
these models in order to encompass a range of all possible stock prices based on
different factors in the market, and have confirmed our conclusion that Ross’
stock price is overvalued.

109
Analyst Recommendation
Upon completion of our analysis we have concluded that Ross is
overvalued. The conclusion was developed by careful evaluation of Ross and its
competitors. We used industry analysis, accounting analysis, financial analysis,
forecasted financial statements, method of comparables and valuation models to
determine the company’s per share value.
Using the five forces model we analyzed the industry and determined that
the discount retail industry has high rivalry among existing firms, high threat of
substitute products, high bargaining power of buyers, low threat of new
entrants, and low bargaining power of suppliers. We decided that Ross’ main
competitors are T.J. Maxx, Kohl’s, and J.C. Penney. These businesses were
chosen due to the similar business size and structure. When comparing Ross to
its competitors we noticed that Ross maintained a six year average sales growth
of 13.4% while the industry sales growth average was 11.04%. This is
important because a larger revenue growth generally leads to larger profit
growth.
In the accounting analysis we used revenue and expense diagnostics to
flush out any obvious accounting manipulations but found no reason to assume
revenue overstatements or expense understatements. In all cases companies
with large changes had credible explanations. In 2006 Kohl’s sold their credit
card and lost their accounts receivable explaining the dip in accounts receivable.
Ross had a lot off the books operating leases that we had to capitalize in order to
get a better view of Ross’ assets. Therefore, after capitalizing the operating
leases we restated the financials and were able to see the differences in ratios.
When looking at the financial ratios we decided that Ross is a less liquid
company than the industry, a slightly more profitable company than the industry,
and maintains a capital structure mostly financed by debt. This would imply that
110
Ross is a riskier investment with a higher possible upside than the industry as a
whole.
When we look at Ross using the method of comparables we conclude that
Ross is slightly overvalued as stated and restated. It is interesting that the
results of EV/EBITDA ratio are only 19 cents above the April 1st stated price of
$31.07. This is probably due to it being the latest fad to hit Wall Street. The
forward P/E ratio also closely mimics the share price as well. These methods
give us a basket of mixed results that we don’t feel give a true valuation of the
company.
With our extensive knowledge of Finance we feel that models based in
theory will yield more accurate and reliable results. The range of values we
arrived at using the residual model and abnormal earnings growth model suggest
the company to be extremely overvalued. All models except the DCFC model
suggested the same results; DCFC model was discarded due to the extreme
range of results. The method of comparables and the intrinsic valuation models
both suggest that Ross is overvalued. We trust our assumptions and trust in the
models. Therefore, we recommend that Ross shareholders sell their stock and
potential buyers explore other options.

111
Appendix
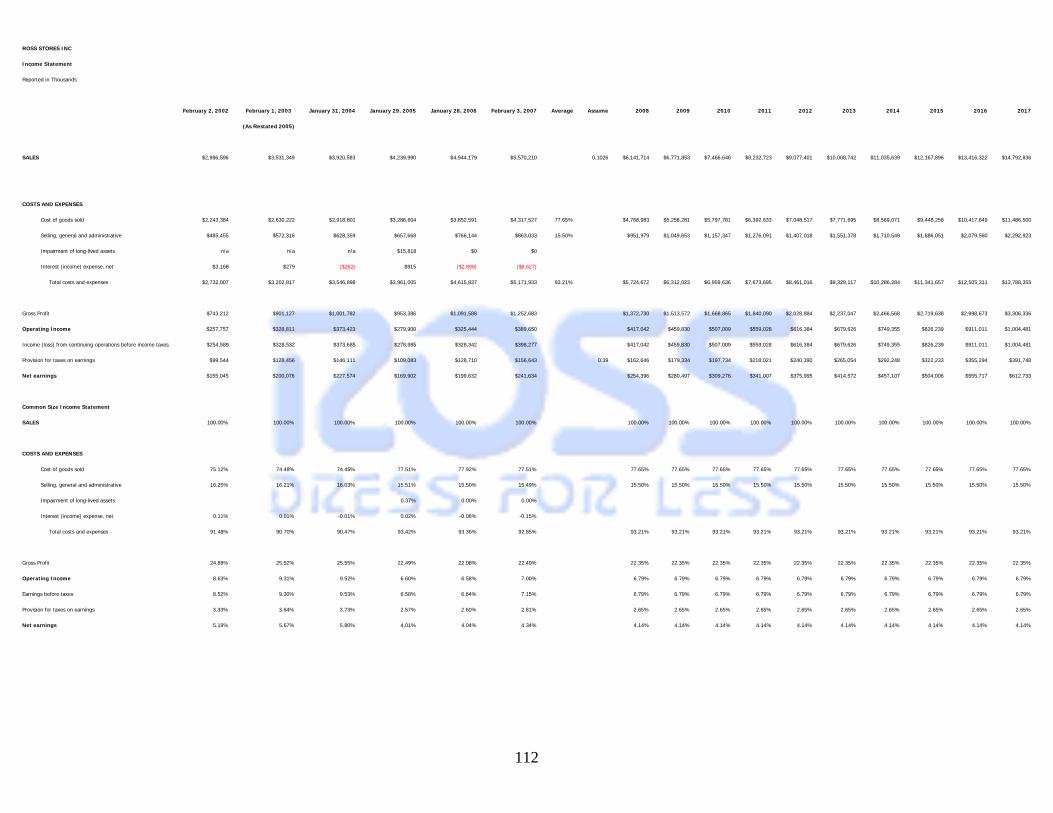
112
ROSS STORES INC
Income Statement
Reported in Thousands
February 2, 2002 February 1, 2003 January 31, 2004 January 29, 2005 January 28, 2006 February 3, 2007 Average Assume 2008 2009 2010 2011 2012 2013 2014 2015 2016 2017
(As Restated 2005)
SALES $2,986,596 $3,531,349 $3,920,583 $4,239,990 $4,944,179 $5,570,210 0.1026 $6,141,714 $6,771,853 $7,466,646 $8,232,723 $9,077,401 $10,008,742 $11,035,639 $12,167,896 $13,416,322 $14,792,836
COSTS AND EXPENSES
Cost of goods sold $2,243,384 $2,630,222 $2,918,801 $3,286,604 $3,852,591 $4,317,527 77.65% $4,768,983 $5,258,281 $5,797,781 $6,392,633 $7,048,517 $7,771,695 $8,569,071 $9,448,258 $10,417,649 $11,486,500
Selling, general and administrative $485,455 $572,316 $628,359 $657,668 $766,144 $863,033 15.50% $951,979 $1,049,653 $1,157,347 $1,276,091 $1,407,018 $1,551,378 $1,710,549 $1,886,051 $2,079,560 $2,292,923
Impairment of long-lived assets n/a n/a n/a $15,818 $0 $0
Interest (income) expense, net $3,168 $279 ($262) $915 ($2,898) ($8,627)
Total costs and expenses $2,732,007 $3,202,817 $3,546,898 $3,961,005 $4,615,837 $5,171,933 93.21% $5,724,672 $6,312,023 $6,959,636 $7,673,695 $8,461,016 $9,329,117 $10,286,284 $11,341,657 $12,505,311 $13,788,355
Gross Profit $743,212 $901,127 $1,001,782 $953,386 $1,091,588 $1,252,683 $1,372,730 $1,513,572 $1,668,865 $1,840,090 $2,028,884 $2,237,047 $2,466,568 $2,719,638 $2,998,673 $3,306,336
Operating Income $257,757 $328,811 $373,423 $279,900 $325,444 $389,650 $417,042 $459,830 $507,009 $559,028 $616,384 $679,626 $749,355 $826,239 $911,011 $1,004,481
Income (loss) from continuing operations before income taxes $254,589 $328,532 $373,685 $278,985 $328,342 $398,277 $417,042 $459,830 $507,009 $559,028 $616,384 $679,626 $749,355 $826,239 $911,011 $1,004,481
Provision for taxes on earnings $99,544 $128,456 $146,111 $109,083 $128,710 $156,643 0.39 $162,646 $179,334 $197,734 $218,021 $240,390 $265,054 $292,248 $322,233 $355,294 $391,748
Net earnings $155,045 $200,076 $227,574 $169,902 $199,632 $241,634 $254,396 $280,497 $309,276 $341,007 $375,995 $414,572 $457,107 $504,006 $555,717 $612,733
Common Size Income Statement
SALES 100.00% 100.00% 100.00% 100.00% 100.00% 100.00% 100.00% 100.00% 100.00% 100.00% 100.00% 100.00% 100.00% 100.00% 100.00% 100.00%
COSTS AND EXPENSES
Cost of goods sold 75.12% 74.48% 74.45% 77.51% 77.92% 77.51% 77.65% 77.65% 77.65% 77.65% 77.65% 77.65% 77.65% 77.65% 77.65% 77.65%
Selling, general and administrative 16.25% 16.21% 16.03% 15.51% 15.50% 15.49% 15.50% 15.50% 15.50% 15.50% 15.50% 15.50% 15.50% 15.50% 15.50% 15.50%
Impairment of long-lived assets 0.37% 0.00% 0.00%
Interest (income) expense, net 0.11% 0.01% -0.01% 0.02% -0.06% -0.15%
Total costs and expenses 91.48% 90.70% 90.47% 93.42% 93.36% 92.85% 93.21% 93.21% 93.21% 93.21% 93.21% 93.21% 93.21% 93.21% 93.21% 93.21%
Gross Profit 24.88% 25.52% 25.55% 22.49% 22.08% 22.49% 22.35% 22.35% 22.35% 22.35% 22.35% 22.35% 22.35% 22.35% 22.35% 22.35%
Operating Income 8.63% 9.31% 9.52% 6.60% 6.58% 7.00% 6.79% 6.79% 6.79% 6.79% 6.79% 6.79% 6.79% 6.79% 6.79% 6.79%
Earnings before taxes 8.52% 9.30% 9.53% 6.58% 6.64% 7.15% 6.79% 6.79% 6.79% 6.79% 6.79% 6.79% 6.79% 6.79% 6.79% 6.79%
Provision for taxes on earnings 3.33% 3.64% 3.73% 2.57% 2.60% 2.81% 2.65% 2.65% 2.65% 2.65% 2.65% 2.65% 2.65% 2.65% 2.65% 2.65%
Net earnings 5.19% 5.67% 5.80% 4.01% 4.04% 4.34% 4.14% 4.14% 4.14% 4.14% 4.14% 4.14% 4.14% 4.14% 4.14% 4.14%

113
ROSS STORES INC
Balance Sheet
Reported in Thousands
February 2, 2002 February 1, 2003 January 31, 2004 January 29, 2005 January 28, 2006 February 3, 2007 Average Assume 2008 2009 2010 2011 2012 2013 2014 2015 2016 2017
(Restated 2005)
ASSETS
CURRENT ASSETS
Cash and cash equivalents $40,351 $150,649 $201,546 $115,331 $191,767 $367,388 9.78% $264,853 $292,027 $321,989 $355,025 $391,451 $431,613 $475,897 $524,724 $578,561 $637,921
Short-term investments n/a n/a n/a $67,400 $12,763 $5,247
Accounts receivable $20,540 $18,349 $25,292 $31,154 $29,122 $30,105 1.55% $41,948 $46,252 $50,997 $56,229 $61,998 $68,359 $75,373 $83,106 $91,633 $101,035
Merchandise inventory $623,390 $716,518 $841,491 $853,112 $938,091 $1,051,729 3.8 $1,254,996 $1,383,758 $1,525,732 $1,682,272 $1,854,873 $2,045,183 $2,255,019 $2,486,384 $2,741,487 $3,022,763
Prepaid expenses and other $30,710 $36,904 $29,467 $46,756 $37,090 $44,245
Deferred income taxes n/a $16,645 $24,578 $14,184 $20,014 $16,242
Total current assets $714,991 $939,065 $1,122,374 $1,127,937 $1,228,847 $1,514,956 $1,561,796 $1,722,037 $1,898,718 $2,093,526 $2,308,322 $2,545,156 $2,806,289 $3,094,214 $3,411,680 $3,761,719
PROPERTY AND EQUIPMENT
Land and buildings $54,432 $54,772 $57,057 $28,572 $74,298 $134,804
Fixtures and equipment $351,288 $412,496 $532,964 $652,882 $740,540 $859,750
Leasehold improvements $209,086 $232,388 $299,814 $345,195 $376,411 $402,921
Construction-in-progress $24,109 $61,720 $74,507 $17,860 $21,266 $22,681
$638,915 $761,376 $964,342 $1,044,509 $1,212,515 $1,420,156
Less accumulated depreciation and amortization $307,365 $358,693 $447,724 $488,331 $572,663 $671,923
Property and equipment, net $331,550 $402,683 $516,618 $556,178 $639,852 $748,233
Long-term investments n/a n/a n/a n/a $11,202 $31,136
Other long-term assets $36,184 $36,242 $52,473 $57,100 $58,837 $64,266
Total non-current assets $367,734 $438,925 $569,091 $613,278 $709,891 $843,635 $1,146,945 $1,264,621 $1,394,372 $1,537,434 $1,695,175 $1,869,100 $2,060,870 $2,272,315 $2,505,454 $2,762,514
Total assets $1,082,725 $1,377,990 $1,691,465 $1,741,215 $1,938,738 $2,358,591 2.5 $2,708,741 $2,986,658 $3,293,089 $3,630,960 $4,003,497 $4,414,256 $4,867,158 $5,366,529 $5,917,135 $6,524,233
LIABILITIES AND STOCKHOLDERS' EQUITY
CURRENT LIABILITIES
Accounts payable $314,530 $397,193 $448,044 $451,861 $474,614 $698,063
Accrued expenses and other $92,760 $114,586 $143,393 $154,017 $200,723 $206,516
Accrued payroll and benefits $70,413 $99,115 $112,284 $105,683 $128,060 $145,101
Income taxes payable $11,885 $15,790 $9,146 n/a $25,586 $33,577
Short-term debt n/a n/a n/a n/a $50,000 $0
Total current liabilities $489,588 $626,684 $712,867 $711,561 $878,983 $1,083,257 1.49 $1,048,186 $1,155,729 $1,274,307 $1,405,051 $1,549,209 $1,708,158 $1,883,415 $2,076,654 $2,289,718 $2,524,643
Long-term debt n/a $25,000 $50,000 $50,000 $0 $150,000
Other long-term liabilities $48,682 $41,452 $96,329 $116,668 $122,926 $129,303
Deferred income taxes n/a $41,666 $79,709 $97,417 $100,657 $86,201
Total Liabilities $538,270 $734,802 $938,905 $970,430 $1,102,566 $1,448,761 $1,597,344 $1,653,432 $1,715,095 $1,782,304 $1,855,031 $1,933,242 $2,016,900 $2,105,966 $2,200,396 $2,300,140
STOCKHOLDERS' EQUITY
Common stock, par value $.01 per share
Authorized 600,000,000 shares
Issued and outstanding 139,356,000 and
144,112,000 shares, respectively $790 $1,550 $1,514 $1,472 $1,448 $1,402
Additional paid-in capital $289,734 $340,266 $412,104 $449,524 $522,566 $545,702
Treasury stock n/a n/a ($3,656) ($11,618) ($18,244) ($22,031)
Deferred compensation n/a n/a ($26,892) ($25,266) ($29,375) $0
Accumulated other comprehensive income n/a n/a n/a n/a $20 ($163)
(loss)
Retained earnings $253,931 $301,372 $369,490 $351,457 $359,757 $384,920 $586,487 $808,316 $1,053,085 $1,323,746 $1,623,556 $1,956,104 $2,325,348 $2,735,652 $3,191,829 $3,699,182
Total stockholders equity $544,455 $643,188 $752,560 $765,569 $836,172 $909,830 $1,111,397 $1,333,226 $1,577,995 $1,848,656 $2,148,466 $2,481,014 $2,850,258 $3,260,562 $3,716,739 $4,224,092
Total liabilities and stockholders equity $1,082,725 $1,377,990 $1,691,465 $1,741,215 $1,938,738 $2,358,591 $2,708,741 $2,986,658 $3,293,089 $3,630,960 $4,003,497 $4,414,256 $4,867,158 $5,366,529 $5,917,135 $6,524,233

114
ROSS STORES INC
Common Size Balance Sheet February 2, 2002 February 1, 2003 January 31, 2004 January 29, 2005 January 28, 2006 February 3, 2007 Average Assume 2008 2009 2010 2011 2012 2013 2014 2015 2016 2017
ASSETS (Restated 2005)
CURRENT ASSETS
Cash and cash equivalents 3.73% 10.93% 11.92% 6.62% 9.89% 15.58% 9.78% 9.78% 9.78% 9.78% 9.78% 9.78% 9.78% 9.78% 9.78% 9.78%
Short-term investments n/a n/a n/a 3.87% 0.66% 0.22%
Accounts receivable 1.90% 1.33% 1.50% 1.79% 1.50% 1.28% 1.55% 1.55% 1.55% 1.55% 1.55% 1.55% 1.55% 1.55% 1.55% 1.55%
Merchandise inventory 57.58% 52.00% 49.75% 49.00% 48.39% 44.59% 46.33% 46.33% 46.33% 46.33% 46.33% 46.33% 46.33% 46.33% 46.33% 46.33%
Prepaid expenses and other 2.84% 2.68% 1.74% 2.69% 1.91% 1.88%
Deferred income taxes n/a 1.21% 1.45% 0.81% 1.03% 0.69%
Total current assets 66.04% 68.15% 66.36% 64.78% 63.38% 64.23% 57.66% 57.66% 57.66% 57.66% 57.66% 57.66% 57.66% 57.66% 57.66% 57.66%
PROPERTY AND EQUIPMENT
Land and buildings 5.03% 3.97% 3.37% 1.64% 3.83% 5.72%
Fixtures and equipment 32.44% 29.93% 31.51% 37.50% 38.20% 36.45%
Leasehold improvements 19.31% 16.86% 17.73% 19.82% 19.42% 17.08%
Construction-in-progress 2.23% 4.48% 4.40% 1.03% 1.10% 0.96%
59.01% 55.25% 57.01% 59.99% 62.54% 60.21%
Less accumulated depreciation and amortization 28.39% 26.03% 26.47% 28.05% 29.54% 28.49%
Property and equipment, net 30.62% 29.22% 30.54% 31.94% 33.00% 31.72%
Long-term investments n/a n/a n/a n/a 0.58% 1.32%
Other long-term assets 3.34% 2.63% 3.10% 3.28% 3.03% 2.72%
Total non-current assets 33.96% 31.85% 33.64% 35.22% 36.62% 35.77% 42.34% 42.34% 42.34% 42.34% 42.34% 42.34% 42.34% 42.34% 42.34% 42.34%
Total assets 100.00% 100.00% 100.00% 100.00% 100.00% 100.00% 100.00% 100.00% 100.00% 100.00% 100.00% 100.00% 100.00% 100.00% 100.00% 100.00%
LIABILITIES AND STOCKHOLDERS' EQUITY
CURRENT LIABILITIES
Accounts payable 58.43% 54.05% 47.72% 46.56% 43.05% 48.18%
Accrued expenses and other 17.23% 15.59% 15.27% 15.87% 18.21% 14.25%
Accrued payroll and benefits 13.08% 13.49% 11.96% 10.89% 11.61% 10.02%
Income taxes payable 2.21% 2.15% 0.97% n/a 2.32% 2.32%
Short-term debt n/a n/a n/a n/a 4.53% 0.00%
Total current liabilities 90.96% 85.29% 75.93% 73.32% 79.72% 74.77% 65.62% 69.90% 74.30% 78.83% 83.51% 88.36% 93.38% 98.61% 104.06% 109.76%
Long-term debt n/a 3.40% 5.33% 5.15% 0.00% 10.35%
Other long-term liabilities 9.04% 5.64% 10.26% 12.02% 11.15% 8.93%
Deferred income taxes n/a 5.67% 8.49% 10.04% 9.13% 5.95%
Total Liabilities 100.00% 100.00% 100.00% 100.00% 100.00% 100.00% 100.00% 100.00% 100.00% 100.00% 100.00% 100.00% 100.00% 100.00% 100.00% 100.00%
STOCKHOLDERS' EQUITY
Common stock, par value $.01 per share
Authorized 600,000,000 shares
Issued and outstanding 139,356,000 and
144,112,000 shares, respectively 0.15% 0.24% 0.20% 0.19% 0.17% 0.15%
Additional paid-in capital 53.22% 52.90% 54.76% 58.72% 62.50% 59.98%
Treasury stock n/a n/a -0.49% -1.52% -2.18% -2.42%
Deferred compensation n/a n/a -3.57% -3.30% -3.51% 0.00%
Accumulated other comprehensive income n/a n/a n/a n/a 0.00% -0.02%
(loss) 0.00% 0.00% 0.00% 0.00% 0.00% 0.00%
Retained earnings 46.64% 46.86% 49.10% 45.91% 43.02% 42.31% 52.77% 60.63% 66.74% 71.61% 75.57% 78.84% 81.58% 83.90% 85.88% 87.57%
Total stockholders equity 100.00% 100.00% 100.00% 100.00% 100.00% 100.00% 100.00% 100.00% 100.00% 100.00% 100.00% 100.00% 100.00% 100.00% 100.00% 100.00%

115
ROSS STORES INC
Cash Flows
Reported in Thousands
February 2, 2002 February 1, 2003 January 31, 2004 January 29, 2005 January 28, 2006 February 3, 2007 Average Assume 2008 2009 2010 2011 2012 2013 2014 2015 2016 2017
CASH FLOWS FROM OPERATING ACTIVITIES
Net earnings $155,045 $200,076 $227,574 $169,902 $199,632 $241,634 $254,396 $280,497 $309,276 $341,007 $375,995 $414,572 $457,107 $504,006 $555,717 $612,733
Adjustments to reconcile net earnings
to net
cash provided by operating activities:
Depreciation and amortization $62,621 $69,765 $81,785 $80,548 $94,180 $108,135
Stock-based compensation n/a n/a n/a $14,045 $16,668 $26,680
Impairment of long-lived assets n/a n/a n/a $15,818 $0 $0
Deferred income taxes $12,633 $16,667 $31,607 $28,101 ($2,590) ($10,684)
Tax benefit from equity issuance $12,075 $16,584 $15,089 $14,802 $21,947 $12,090
Excess tax benefits from stock-based compensation n/a n/a n/a $0 $0 ($9,599)
Change in assets and liabilities:
Merchandise inventory ($63,824) ($93,128) ($124,973) ($11,621) ($84,979) ($113,638)
Other current assets, net ($16,901) ($4,003) $494 ($23,151) $11,698 ($8,138)
Accounts payable $54,064 $81,958 $48,881 $2,908 $21,448 $221,644
Other current liabilities $34,384 $54,541 $35,331 ($5,123) $94,670 $34,417
Other long-term, net $4,867 $12,255 $5,683 $11,928 $2,517 $4,326
Net cash provided by operating activities $254,964 $354,715 $321,471 $298,157 $375,191 $506,867 1.83 $465,544 $513,309 $565,974 $624,043 $688,070 $758,666 $836,505 $922,331 $1,016,962 $1,121,302
CASH FLOWS USED IN INVESTING ACTIVITIES
Purchase of assets under lease n/a n/a n/a $0 $0 ($87,329)
Other additions to property and equipment ($86,002) ($138,852) ($152,694) ($149,541) ($175,851) ($136,626)
Proceeds from sales of property and equipment n/a n/a n/a $17,400 $0 $615
Purchases of investments n/a n/a n/a ($165,050) ($313,569) ($71,938)
Proceeds from investments n/a n/a n/a $97,650 $357,024 $59,337
Net cash used in investing activities ($86,002) ($138,852) ($152,694) ($199,541) ($132,396) ($235,941) ($303,310) ($117,677) ($129,750) ($143,063) ($157,741) ($173,925) ($191,770) ($211,445) ($233,139) ($257,060)
CASH FLOWS USED IN FINANCING ACTIVITIES
Payment of term debt ($64,000) n/a n/a $0 $0 ($50,000)
Proceeds from issuance of long-term debt n/a $25,000 $25,000 $0 $0 $150,000
Excess tax benefit from stock-based compensation n/a n/a n/a $0 $0 $9,599
Issuance of common stock related to stock $42,506 $34,279 $28,351 $23,391 $45,982 $32,517
plans
Treasury stock purchased n/a n/a ($3,656) ($7,962) ($6,626) ($3,787)
Repurchase of common stock ($130,676) ($149,997) ($150,003) ($175,000) ($175,000) ($200,000)
Dividends paid ($13,595) ($14,847) ($17,572) ($25,260) ($30,715) ($33,634) 0.042 ($52,829) ($58,668) ($64,507) ($70,346) ($76,185) ($82,024) ($87,863) ($93,702) ($99,540) ($105,379)
Net cash used in financing activities ($165,765) ($105,565) ($117,880) ($184,831) ($166,359) ($95,305)
Net increase (decrease) in cash and cash $3,197 $110,298 $50,897 ($86,215) $76,436 $175,621
equivalents
Cash and cash equivalents:
Beginning of year $37,154 $40,351 $150,649 $201,546 $115,331 $191,767
End of year $40,351 $150,649 $201,546 $115,331 $191,767 $367,388
SUPPLEMENTAL CASH FLOW DISCLOSURES
Interest paid $3,332 $409 $825 $1,545 $2,543 $759
Income taxes paid $61,433 $91,874 $105,731 $86,046 $74,120 $147,122
NON-CASH INVESTING ACTIVITIES
Straight-line rent capitalized in build-out n/a $2,110 $4,657 $4,277 $3,290 $-
period
Change in fair value of investment securities n/a n/a $0 $- $20 ($183)
CFFO/Net Income 1.6445 1.7729 1.4126 1.7549 1.8794 2.0977 1.8299
CFFO/Operating Income 0.9892 1.0788 0.8609 1.0652 1.1529 1.3008 1.1174
CFFO/Sales 0.0854 0.1004 0.0820 0.0703 0.0759 0.0910 0.0846

116
ROSS STORES INC
Income Statement Restated
Reported in Thousands
February 2, 2002 February 1, 2003 January 31, 2004 January 29, 2005 January 28, 2006 February 3, 2007 Average Assume 2008 2009 2010 2011 2012 2013 2014 2015 2016 2017
(Restated 2005)
SALES $2,986,596 $3,531,349 $3,920,583 $4,239,990 $4,944,179 $5,570,210 0.1026 $6,141,714 $6,771,853 $7,466,646 $8,232,723 $9,077,401 $10,008,742 $11,035,639 $12,167,896 $13,416,322 $14,792,836
COSTS AND EXPENSES
Cost of goods sold $2,243,384 $2,630,222 $2,918,801 $3,286,604 $3,852,591 $4,317,527 77.65% $4,768,983 $5,258,281 $5,797,781 $6,392,633 $7,048,517 $7,771,695 $8,569,071 $9,448,258 $10,417,649 $11,486,500
Selling, general and administrative $424,719 $485,473 $523,781 $537,795 $551,003 $702,451 12.15% $745,997 $822,537 $906,929 $999,980 $1,102,578 $1,215,702 $1,340,433 $1,477,962 $1,629,600 $1,796,797
Impairment of long-lived assets n/a n/a n/a $15,818 $0 $0
Interest of capital leases $29,913 $29,212 $35,487 $51,533 $83,583 $80,993
Interest (income) expense, net $33,081 $29,491 $35,225 $52,448 $80,685 $72,366
Total costs and expenses $2,701,184 $3,145,186 $3,477,807 $3,892,665 $4,484,279 $5,092,344 91.31% $5,607,948 $6,183,324 $6,817,733 $7,517,232 $8,288,500 $9,138,901 $10,076,552 $11,110,406 $12,250,334 $13,507,218
Gross Profit $743,212 $901,127 $1,001,782 $953,386 $1,091,588 $1,252,683 $1,372,730 $1,513,572 $1,668,865 $1,840,090 $2,028,884 $2,237,047 $2,466,568 $2,719,638 $2,998,673 $3,306,336
Operating Income $318,493 $415,654 $478,001 $399,773 $540,585 $550,232 $533,765 $588,529 $648,913 $715,491 $788,900 $869,842 $959,087 $1,057,490 $1,165,988 $1,285,618
Income (loss) from continuing operations before income taxes $285,412 $386,163 $442,776 $347,325 $459,900 $477,866 $533,765 $588,529 $648,913 $715,491 $788,900 $869,842 $959,087 $1,057,490 $1,165,988 $1,285,618
Provision for taxes on earnings $111,311 $150,604 $172,683 $135,457 $179,361 $186,368 0.39 $208,168 $229,526 $253,076 $279,041 $307,671 $339,238 $374,044 $412,421 $454,735 $501,391
Net earnings $174,101 $235,559 $270,093 $211,868 $280,539 $291,498 $325,597 $359,003 $395,837 $436,449 $481,229 $530,603 $585,043 $645,069 $711,253 $784,227
Change in deferred taxes from capitalization of leases $11,767 $22,148 $26,572 $26,374 $50,651 $29,725 $45,522 $50,193 $55,342 $61,020 $67,281 $74,184 $81,796 $90,188 $99,441 $109,644
Change in net earnings from capitalization of leases $19,056 $35,483 $42,519 $41,966 $80,907 $49,864 $71,201 $78,506 $86,561 $95,442 $105,235 $116,032 $127,937 $141,063 $155,536 $171,494
Net change in income $30,823 $57,631 $69,091 $68,340 $131,558 $79,589 $116,723 $128,699 $141,903 $156,463 $172,516 $190,216 $209,732 $231,251 $254,977 $281,138
Percentage change in net earnings from capitalization of leases 12.29% 17.73% 18.68% 24.70% 40.53% 20.64% 22.43% 27.99% 27.99% 27.99% 27.99% 27.99% 27.99% 27.99% 27.99% 27.99% 27.99%
Common Size Income Statement Restated
SALES 100.00% 100.00% 100.00% 100.00% 100.00% 100.00% 100.00% 100.00% 100.00% 100.00% 100.00% 100.00% 100.00% 100.00% 100.00% 100.00%
COSTS AND EXPENSES
Cost of goods sold 75.12% 74.48% 74.45% 77.51% 77.92% 77.51% 77.65% 77.65% 77.65% 77.65% 77.65% 77.65% 77.65% 77.65% 77.65% 77.65%
Selling, general and administrative 14.22% 13.75% 13.36% 12.68% 11.14% 12.61% 12.15% 12.15% 12.15% 12.15% 12.15% 12.15% 12.15% 12.15% 12.15% 12.15%
Impairment of long-lived assets 0.37% 0.00% 0.00%
Interest (income) expense, net 1.11% 0.84% 0.90% 1.24% 1.63% 1.30%
Total costs and expenses 90.44% 89.06% 88.71% 91.81% 90.70% 91.42% 91.31% 91.31% 91.31% 91.31% 91.31% 91.31% 91.31% 91.31% 91.31% 91.31%
Gross Profit 24.88% 25.52% 25.55% 22.49% 22.08% 22.49% 22.35% 22.35% 22.35% 22.35% 22.35% 22.35% 22.35% 22.35% 22.35% 22.35%
Operating Income 10.66% 11.77% 12.19% 9.43% 10.93% 9.88% 8.69% 8.69% 8.69% 8.69% 8.69% 8.69% 8.69% 8.69% 8.69% 8.69%
Earnings before taxes 9.56% 10.94% 11.29% 8.19% 9.30% 8.58% 8.69% 8.69% 8.69% 8.69% 8.69% 8.69% 8.69% 8.69% 8.69% 8.69%
Provision for taxes on earnings 3.73% 4.26% 4.40% 3.19% 3.63% 3.35% 3.39% 3.39% 3.39% 3.39% 3.39% 3.39% 3.39% 3.39% 3.39% 3.39%
Net earnings 5.83% 6.67% 6.89% 5.00% 5.67% 5.23% 5.30% 5.30% 5.30% 5.30% 5.30% 5.30% 5.30% 5.30% 5.30% 5.30%
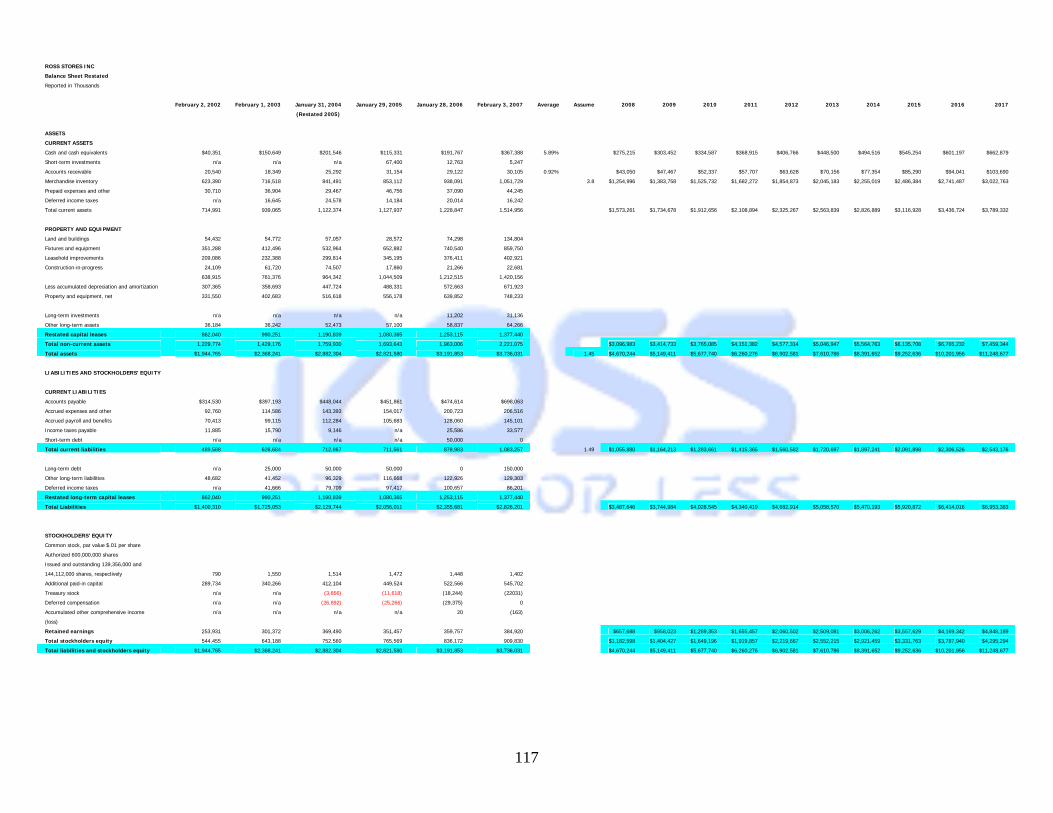
117
ROSS STORES INC
Balance Sheet Restated
Reported in Thousands
February 2, 2002 February 1, 2003 January 31, 2004 January 29, 2005 January 28, 2006 February 3, 2007 Average Assume 2008 2009 2010 2011 2012 2013 2014 2015 2016 2017
(Restated 2005)
ASSETS
CURRENT ASSETS
Cash and cash equivalents $40,351 $150,649 $201,546 $115,331 $191,767 $367,388 5.89% $275,215 $303,452 $334,587 $368,915 $406,766 $448,500 $494,516 $545,254 $601,197 $662,879
Short-term investments n/a n/a n/a 67,400 12,763 5,247
Accounts receivable 20,540 18,349 25,292 31,154 29,122 30,105 0.92% $43,050 $47,467 $52,337 $57,707 $63,628 $70,156 $77,354 $85,290 $94,041 $103,690
Merchandise inventory 623,390 716,518 841,491 853,112 938,091 1,051,729 3.8 $1,254,996 $1,383,758 $1,525,732 $1,682,272 $1,854,873 $2,045,183 $2,255,019 $2,486,384 $2,741,487 $3,022,763
Prepaid expenses and other 30,710 36,904 29,467 46,756 37,090 44,245
Deferred income taxes n/a 16,645 24,578 14,184 20,014 16,242
Total current assets 714,991 939,065 1,122,374 1,127,937 1,228,847 1,514,956 $1,573,261 $1,734,678 $1,912,656 $2,108,894 $2,325,267 $2,563,839 $2,826,889 $3,116,928 $3,436,724 $3,789,332
PROPERTY AND EQUIPMENT
Land and buildings 54,432 54,772 57,057 28,572 74,298 134,804
Fixtures and equipment 351,288 412,496 532,964 652,882 740,540 859,750
Leasehold improvements 209,086 232,388 299,814 345,195 376,411 402,921
Construction-in-progress 24,109 61,720 74,507 17,860 21,266 22,681
638,915 761,376 964,342 1,044,509 1,212,515 1,420,156
Less accumulated depreciation and amortization 307,365 358,693 447,724 488,331 572,663 671,923
Property and equipment, net 331,550 402,683 516,618 556,178 639,852 748,233
Long-term investments n/a n/a n/a n/a 11,202 31,136
Other long-term assets 36,184 36,242 52,473 57,100 58,837 64,266
Restated capital leases 862,040 990,251 1,190,839 1,080,365 1,253,115 1,377,440
Total non-current assets 1,229,774 1,429,176 1,759,930 1,693,643 1,963,006 2,221,075 $3,096,983 $3,414,733 $3,765,085 $4,151,382 $4,577,314 $5,046,947 $5,564,763 $6,135,708 $6,765,232 $7,459,344
Total assets $1,944,765 $2,368,241 $2,882,304 $2,821,580 $3,191,853 $3,736,031 1.45 $4,670,244 $5,149,411 $5,677,740 $6,260,276 $6,902,581 $7,610,786 $8,391,652 $9,252,636 $10,201,956 $11,248,677
LIABILITIES AND STOCKHOLDERS' EQUITY
CURRENT LIABILITIES
Accounts payable $314,530 $397,193 $448,044 $451,861 $474,614 $698,063
Accrued expenses and other 92,760 114,586 143,393 154,017 200,723 206,516
Accrued payroll and benefits 70,413 99,115 112,284 105,683 128,060 145,101
Income taxes payable 11,885 15,790 9,146 n/a 25,586 33,577
Short-term debt n/a n/a n/a n/a 50,000 0
Total current liabilities 489,588 626,684 712,867 711,561 878,983 1,083,257 1.49 $1,055,880 $1,164,213 $1,283,661 $1,415,365 $1,560,582 $1,720,697 $1,897,241 $2,091,898 $2,306,526 $2,543,176
Long-term debt n/a 25,000 50,000 50,000 0 150,000
Other long-term liabilities 48,682 41,452 96,329 116,668 122,926 129,303
Deferred income taxes n/a 41,666 79,709 97,417 100,657 86,201
Restated long-term capital leases 862,040 990,251 1,190,839 1,080,365 1,253,115 1,377,440
Total Liabilities $1,400,310 $1,725,053 $2,129,744 $2,056,011 $2,355,681 $2,826,201 $3,487,646 $3,744,984 $4,028,545 $4,340,419 $4,682,914 $5,058,570 $5,470,193 $5,920,872 $6,414,016 $6,953,383
STOCKHOLDERS' EQUITY
Common stock, par value $.01 per share
Authorized 600,000,000 shares
Issued and outstanding 139,356,000 and
144,112,000 shares, respectively 790 1,550 1,514 1,472 1,448 1,402
Additional paid-in capital 289,734 340,266 412,104 449,524 522,566 545,702
Treasury stock n/a n/a (3,656) (11,618) (18,244) (22031)
Deferred compensation n/a n/a (26,892) (25,266) (29,375) 0
Accumulated other comprehensive income n/a n/a n/a n/a 20 (163)
(loss)
Retained earnings 253,931 301,372 369,490 351,457 359,757 384,920 $657,688 $958,023 $1,289,353 $1,655,457 $2,060,502 $2,509,081 $3,006,262 $3,557,629 $4,169,342 $4,848,189
Total stockholders equity 544,455 643,188 752,560 765,569 836,172 909,830 $1,182,598 $1,404,427 $1,649,196 $1,919,857 $2,219,667 $2,552,215 $2,921,459 $3,331,763 $3,787,940 $4,295,294
Total liabilities and stockholders equity $1,944,765 $2,368,241 $2,882,304 $2,821,580 $3,191,853 $3,736,031 $4,670,244 $5,149,411 $5,677,740 $6,260,276 $6,902,581 $7,610,786 $8,391,652 $9,252,636 $10,201,956 $11,248,677

118
ROSS STORES INC
Common Size Balance Sheet Restated February 2, 2002 February 1, 2003 January 31, 2004 January 29, 2005 January 28, 2006 February 3, 2007 Average Assume 2008 2009 2010 2011 2012 2013 2014 2015 2016 2017
ASSETS (Restated 2005)
CURRENT ASSETS
Cash and cash equivalents 2.07% 6.36% 6.99% 4.09% 6.01% 9.83% 5.89% 5.89% 5.89% 5.89% 5.89% 5.89% 5.89% 5.89% 5.89% 5.89%
Short-term investments n/a n/a n/a 2.39% 0.40% 0.14%
Accounts receivable 1.06% 0.77% 0.88% 1.10% 0.91% 0.81% 0.92% 0.92% 0.92% 0.92% 0.92% 0.92% 0.92% 0.92% 0.92% 0.92%
Merchandise inventory 32.05% 30.26% 29.20% 30.24% 29.39% 28.15% 26.87% 26.87% 26.87% 26.87% 26.87% 26.87% 26.87% 26.87% 26.87% 26.87%
Prepaid expenses and other 1.58% 1.56% 1.02% 1.66% 1.16% 1.18%
Deferred income taxes n/a 0.70% 0.85% 0.50% 0.63% 0.43%
Total current assets 36.76% 39.65% 38.94% 39.98% 38.50% 40.55% 33.69% 33.69% 33.69% 33.69% 33.69% 33.69% 33.69% 33.69% 33.69% 33.69%
PROPERTY AND EQUIPMENT
Land and buildings 2.80% 2.31% 1.98% 1.01% 2.33% 3.61%
Fixtures and equipment 18.06% 17.42% 18.49% 23.14% 23.20% 23.01%
Leasehold improvements 10.75% 9.81% 10.40% 12.23% 11.79% 10.78%
Construction-in-progress 1.24% 2.61% 2.58% 0.63% 0.67% 0.61%
32.85% 32.15% 33.46% 37.02% 37.99% 38.01%
Less accumulated depreciation and amortization 15.80% 15.15% 15.53% 17.31% 17.94% 17.98%
Property and equipment, net 17.05% 17.00% 17.92% 19.71% 20.05% 20.03%
Long-term investments n/a n/a n/a n/a 0.35% 0.83%
Other long-term assets 1.86% 1.53% 1.82% 2.02% 1.84% 1.72%
Total non-current assets 63.24% 60.35% 61.06% 60.02% 61.50% 59.45% 66.31% 66.31% 66.31% 66.31% 66.31% 66.31% 66.31% 66.31% 66.31% 66.31%
Total assets 100.00% 100.00% 100.00% 100.00% 100.00% 100.00% 100.00% 100.00% 100.00% 100.00% 100.00% 100.00% 100.00% 100.00% 100.00% 100.00%
LIABILITIES AND STOCKHOLDERS' EQUITY
CURRENT LIABILITIES
Accounts payable 22.46% 23.02% 21.04% 21.98% 20.15% 24.70%
Accrued expenses and other 6.62% 6.64% 6.73% 7.49% 8.52% 7.31%
Accrued payroll and benefits 5.03% 5.75% 5.27% 5.14% 5.44% 5.13%
Income taxes payable 0.85% 0.92% 0.43% n/a 1.09% 1.19%
Short-term debt n/a n/a n/a n/a 2.12% 0.00%
Total current liabilities 34.96% 36.33% 33.47% 34.61% 37.31% 38.33% 30.27% 31.09% 31.86% 32.61% 33.33% 34.02% 34.68% 35.33% 35.96% 36.57%
Long-term debt n/a 1.45% 2.35% 2.43% 0.00% 5.31%
Other long-term liabilities 3.48% 2.40% 4.52% 5.67% 5.22% 4.58%
Deferred income taxes n/a 2.42% 3.74% 4.74% 4.27% 3.05%
Total Liabilities 100.00% 100.00% 100.00% 100.00% 100.00% 100.00% 100.00% 100.00% 100.00% 100.00% 100.00% 100.00% 100.00% 100.00% 100.00% 100.00%
STOCKHOLDERS' EQUITY
Common stock, par value $.01 per share
Authorized 600,000,000 shares
Issued and outstanding 139,356,000 and
144,112,000 shares, respectively 0.15% 0.24% 0.20% 0.19% 0.17% 0.15%
Additional paid-in capital 53.22% 52.90% 54.76% 58.72% 62.50% 59.98%
Treasury stock n/a n/a -0.49% -1.52% -2.18% -2.42%
Deferred compensation n/a n/a -3.57% -3.30% -3.51% 0.00%
Accumulated other comprehensive income n/a n/a n/a n/a 0.00% -0.02%
(loss) 0.00% 0.00% 0.00% 0.00% 0.00% 0.00%
Retained earnings 46.64% 46.86% 49.10% 45.91% 43.02% 42.31% 55.61% 68.21% 78.18% 86.23% 92.83% 98.31% 102.90% 106.78% 110.07% 112.87%
Total stockholders equity 100.00% 100.00% 100.00% 100.00% 100.00% 100.00% 100.00% 100.00% 100.00% 100.00% 100.00% 100.00% 100.00% 100.00% 100.00% 100.00%

119
ROSS STORES INC
Cash Flows Restated
Reported in Thousands
February 2, 2002 February 1, 2003 January 31, 2004 January 29, 2005 January 28, 2006 February 3, 2007 Average Assume 2008 2009 2010 2011 2012 2013 2014 2015 2016 2017
CASH FLOWS FROM OPERATING ACTIVITIES
Net earnings $174,101 $235,559 $270,093 $211,868 $280,539 $291,498 $325,597 $359,003 $395,837 $436,449 $481,229 $530,603 $585,043 $645,069 $711,253 $784,227
Adjustments to reconcile net earnings
to net
cash provided by operating activities:
Depreciation from capital leases $86,204 $99,025 $119,084 $108,037 $125,312 $137,744
Depreciation and amortization, net $148,825 $168,790 $200,869 $188,585 $219,492 $245,879
Stock-based compensation n/a n/a n/a $14,045 $16,668 $26,680
Impairment of long-lived assets n/a n/a n/a $15,818 $0 $0
Deferred income taxes $12,633 $16,667 $31,607 $28,101 ($2,590) ($10,684)
Tax benefit from equity issuance $12,075 $16,584 $15,089 $14,802 $21,947 $12,090
Excess tax benefits from stock-based compensation n/a n/a n/a $0 $0 ($9,599)
Change in assets and liabilities:
Merchandise inventory ($63,824) ($93,128) ($124,973) ($11,621) ($84,979) ($113,638)
Other current assets, net ($16,901) ($4,003) $494 ($23,151) $11,698 ($8,138)
Accounts payable $54,064 $81,958 $48,881 $2,908 $21,448 $221,644
Other current liabilities $34,384 $54,541 $35,331 ($5,123) $94,670 $34,417
Other long-term, net $4,867 $12,255 $5,683 $11,928 $2,517 $4,326
Net cash provided by operating activities $360,224 $489,223 $483,074 $448,160 $581,410 $694,475 2.64 $859,575 $947,768 $1,045,009 $1,152,227 $1,270,445 $1,400,793 $1,544,514 $1,702,981 $1,877,707 $2,070,360
CASH FLOWS USED IN INVESTING ACTIVITIES
Purchase of assets under lease n/a n/a n/a $0 $0 ($87,329)
Other additions to property and equipment ($86,002) ($138,852) ($152,694) ($149,541) ($175,851) ($136,626)
Proceeds from sales of property and equipment n/a n/a n/a $17,400 $0 $615
Purchases of investments n/a n/a n/a ($165,050) ($313,569) ($71,938)
Proceeds from investments n/a n/a n/a $97,650 $357,024 $59,337
Net cash used in investing activities ($86,002) ($138,852) ($152,694) ($199,541) ($132,396) ($235,941) ($875,908) ($317,750) ($350,352) ($386,298) ($425,932) ($469,632) ($517,817) ($570,945) ($629,524) ($694,113)
CASH FLOWS USED IN FINANCING ACTIVITIES
Payment of term debt ($64,000) n/a n/a $0 $0 ($50,000)
Proceeds from issuance of long-term debt n/a $25,000 $25,000 $0 $0 $150,000
Excess tax benefit from stock-based compensation n/a n/a n/a $0 $0 $9,599
Issuance of common stock related to stock $42,506 $34,279 $28,351 $23,391 $45,982 $32,517
plans
Treasury stock purchased n/a n/a ($3,656) ($7,962) ($6,626) ($3,787)
Repurchase of common stock ($130,676) ($149,997) ($150,003) ($175,000) ($175,000) ($200,000)
Dividends paid ($13,595) ($14,847) ($17,572) ($25,260) ($30,715) ($33,634) 0.042 ($52,829) ($58,668) ($64,507) ($70,346) ($76,185) ($82,024) ($87,863) ($93,702) ($99,540) ($105,379)
Net cash used in financing activities ($165,765) ($105,565) ($117,880) ($184,831) ($166,359) ($95,305)
Net increase (decrease) in cash and cash $3,197 $110,298 $50,897 ($86,215) $76,436 $175,621
equivalents
Cash and cash equivalents:
Beginning of year $37,154 $40,351 $150,649 $201,546 $115,331 $191,767
End of year $40,351 $150,649 $201,546 $115,331 $191,767 $367,388
SUPPLEMENTAL CASH FLOW DISCLOSURES
Interest paid $33,245 $29,621 $36,312 $53,078 $86,126 $81,752
Income taxes paid $61,433 $91,874 $105,731 $86,046 $74,120 $147,122
NON-CASH INVESTING ACTIVITIES
Straight-line rent capitalized in build-out n/a $2,110 $4,657 $4,277 $3,290 $-
period
Change in fair value of investment securities n/a n/a $0 $- $20 ($183)
CFFO/Net Income 2.3234 2.4452 2.1227 2.6378 2.9124 2.8741 2.6386
CFFO/Operating Income 1.3975 1.4879 1.2936 1.6011 1.7865 1.7823 1.6111
CFFO/Sales 0.1206 0.1385 0.1232 0.1057 0.1176 0.1247 0.1214

120
KOHL'S CORPORATION
Income Statement
February 2, 2002 February 1, 2003 January 31, 2004 January 29, 2005 January 28, 2006 February 3, 2007
(Restated) (Restated) (Restated) (Restated)
Net sales $7,488,654 $9,120,287 $10,282,094 $11,700,619 $13,402,217 $15,544,184
Cost of merchandise sold $4,923,527 $5,981,219 $6,887,033 $7,586,992 $8,639,278 $9,890,513
Gross margin $2,565,127 $3,139,068 $3,395,061 $4,113,627 $4,762,939 $5,653,671
Operating expenses:
Selling, general and administrative $1,583,489 $1,882,889 $2,157,030 $2,582,996 $2,963,472 $3,401,434
Depreciation and amortization $158,417 $193,497 $239,558 $288,173 $338,916 $387,674
Preopening expenses $33,360 $41,198 $47,029 $49,131 $44,370 $49,762
Total operating expenses $1,775,266 $2,117,584 $2,443,617 $2,920,300 $3,346,758 $3,838,870
Operating income $789,861 $1,021,484 $951,444 $1,193,327 $1,416,181 $1,814,801
Other expense (income):
Interest expense $57,351 $59,449 $75,240 $64,761 $73,925 $66,743
Interest income ($7,240) ($3,440) ($2,309) ($2,309) ($3,534) ($26,387)
Income before income taxes $739,750 $965,475 $878,513 $1,130,875 $1,345,790 $1,774,445
Provision for income taxes $281,327 $364,950 $332,050 $427,474 $503,830 $665,764
Net income $458,423 $600,525 $546,463 $703,401 $841,960 $1,108,681

121
KOHL'S CORPORATION Balance Sheet Reported in Thousands
February 2, 2002
February 1, 2003
January 31, 2004
January 29, 2005
January 28, 2006
February 3, 2007
(Restated) ASSETS Current assets: Cash and cash equivalents $106,722 $90,085 $112,748 $116,717 $126,839 $189,170 Short-term investments $229,377 $475,991 $34,285 $88,767 $160,077 $431,230 Accounts receivable trade, net of allowance $835,946 $990,810 $1,150,157 $1,389,632 $1,652,065 $0 for doubtful accounts of $0 and $26,335, respectively Merchandise inventories $1,198,307 $1,626,996 $1,606,990 $1,946,977 $2,237,568 $2,588,099 Deferred income taxes $52,292 $56,693 $49,822 $54,050 $23,677 $40,190 Other $41,400 $43,714 $70,894 $47,294 $66,327 $152,351
Total current assets $2,464,044 $3,284,289 $3,024,896 $3,643,437 $4,266,553 $3,401,040
Property and equipment, net $2,199,494 $2,739,290 $3,316,486 $3,987,945 $4,616,303 $5,352,974 Income (loss) from continuing operations before income taxes
$174,860 $180,420 $235,491 $224,903 $212,380 $219,286
Goodwill $9,338 $9,338 $9,338 $9,338 $9,338 $9,338 Other assets $81,850 $102,361 $104,539 $113,676 $48,920 $58,539
Total assets $4,929,586 $6,315,698 $6,690,750 $7,979,299 $9,153,494 $9,041,177
LIABILITIES AND SHAREHOLDERS EQUITY Current liabilities: Accounts payable $478,870 $650,731 $532,599 $704,655 $829,971 $829,971 Accrued liabilities $259,598 $359,842 $441,961 $570,757 $642,091 $732,178 Income taxes payable $125,085 $142,150 $135,527 $177,182 $166,908 $233,263 Current portion of long-term debt and capital $16,418 $355,464 $12,529 $3,464 $107,941 $18,841 leases
Total current liabilities $879,971 $1,508,187 $1,122,616 $1,456,058 $1,746,911 $1,918,658
Long-term debt and capital leases $1,095,420 $1,058,784 $1,075,973 $1,103,441 $1,046,104 $1,040,057 Deferred income taxes $114,228 $171,951 $209,893 $229,381 $217,801 $243,530 Other long-term liabilities $48,561 $64,859 $133,759 $156,521 $185,340 $235,537
Total liabilities $2,138,180 $2,803,781 $2,542,241 $2,945,401 $3,196,156 $3,437,782
Shareholders equity: Common stock $.01 par value, 800,000 shares $3,351 $3,373 $3,401 $3,433 $3,450 $3,485 authorized, 348,502 and 345,088 shares issued Paid-in capital $1,005,169 $1,082,277 $1,170,519 $1,501,572 $1,583,035 $1,748,792 Treasury stock at cost, 27,516 and 0 shares, ($1,628,416)respectively Retained earnings $1,782,886 $2,426,267 $2,974,589 $3,528,893 $4,370,853 $5,479,534
Total shareholders equity $2,791,406 $3,511,917 $4,148,509 $5,033,898 $5,957,338 $5,603,395
Total liabilities and shareholders equity $4,929,586 $6,315,698 $6,690,750 $7,979,299 $9,153,494 $9,041,177

122
KOHL'S CORPORATION
Cash Flows
Reported in Thousands
February 2, 2002 February 1, 2003 January 31, 2004 January 29, 2005 January 28, 2006 February 3, 2007
(Restated) (Restated) (Restated)
Operating activities
Net income $495,676 $635,470 $546,463 $703,401 $841,960 $1,108,681
Adjustments to reconcile net income to
net cash provided by operating activities:
Depreciation and amortization $157,939 $194,468 $246,594 $288,892 $339,608 $388,299
Share-based compensation $55,358 $43,375 $43,941 $44,699
Excess tax benefits from share-based compensation ($14,797) ($10,563) ($14,458) ($25,707)
Deferred income taxes $17,211 $48,412 $54,629 $78,274 $18,793 $9,216
Amortization of debt discount $9,110 $9,381 $3,576 $216 $218 $216
Changes in operating assets and liabilities:
Accounts receivable trade, net ($154,690) ($154,864) ($159,347) ($239,475) ($262,433) $1,652,065
Merchandise inventories ($195,017) ($428,689) $20,006 ($339,987) ($290,591) ($350,531)
Other current and long-term assets ($15,801) ($2,781) ($27,180) $19,188 ($20,095) ($63,781)
Income (loss) from continuing operations before income taxes $78,931 $171,861 ($118,132) $172,056 $125,316 $104,405
Accrued and other long-term liabilities $79,337 $133,326 $107,471 $151,558 $95,203 $139,754
Income taxes $69,121 $62,999 $25,023 $70,160 $4,184 $92,062
Net cash provided by operating activities $541,817 $669,583 $739,664 $937,095 $881,646 $3,099,378
Investing activities
Acquisition of property and equipment ($662,011) ($715,968) ($831,599) ($919,005) ($828,095) ($1,142,247)
and favorable lease rights
Purchases of short-term investments n/a n/a n/a ($2,880,481) ($2,978,529) ($13,509,169)
Sales of short-term investments n/a n/a n/a $2,825,999 $2,907,219 $13,238,936
Net (purchases) sales of short-term investments ($180,777) ($246,614) $441,706 ($54,482) ($71,310) ($270,233)
Other ($28,520) ($32,473) ($25,624) ($4,004) ($4,333) ($6,856)
Net cash used in investing activities ($871,308) ($995,055) ($415,517) ($977,491) ($903,738) ($1,419,336)
Financing activities
Net repayments of short-term debt ($5,000)
Proceeds from public debt offering, net $299,503 $297,759
Excess tax benefits from share-based compensation $14,797 $10,563 $14,458 $25,707
Payments of long-term debt and capital ($18,039) ($20,223) ($362,538) ($13,292) ($5,102) ($109,596)
leases
Net proceeds from issuance of common stock $36,128 $31,299 $46,257 $47,094 $22,858 $94,594
Treasury stock purchases ($1,628,416)
Net cash (used in) provided by financing $312,592 $308,835 ($301,484) $44,365 $32,214 ($1,617,711)
activities
Net increase in cash and cash equivalents ($16,899) ($16,637) $22,663 $3,969 $10,122 $62,331
Cash and cash equivalents at beginning $123,621 $106,722 $90,085 $112,748 $116,717 $126,839
of year
Cash and cash equivalents at end of year $106,722 $90,085 $112,748 $116,717 $126,839 $189,170

123
TJX COMPANIES INC.
Income Statement
Reported in Thousands
January 26, 2002 January 25, 2003 January 31, 2004 January 29, 2005 January 28, 2006 January 27, 2007
(53 Weeks)
Net sales $10,708,998 $11,981,207 $13,327,938 $14,860,746 $15,955,943 $17,404,637
Cost of sales, including buying and occupancy costs $8,122,922 $9,079,579 $10,101,279 $11,357,391 $12,214,671 $13,213,703
Selling, general and administrative expenses $1,686,389 $1,938,531 $2,212,669 $2,487,804 $2,703,271 $2,928,520
Interest expense, net $25,643 $25,373 $27,252 $25,757 $29,632 $15,566
Income from continuing operations before income taxes $874,044 $937,724 $986,738 $989,794 $1,008,369 $1,246,848
Provision for income taxes $333,647 $359,336 $377,326 $379,577 $318,535 $470,092
Income from continuing operations $540,397 $578,388 $609,412 $610,217 $689,834 $776,756
Discontinued operations:
Loss on disposal of discontinued operations, $0 $0 ($38,110)
net of income taxes
Income (loss) of discontinued operations, ($40,000) ($518) $589 ($607)
net of income taxes
Net income $500,397 $578,388 $609,412 $609,699 $690,423 $738,039
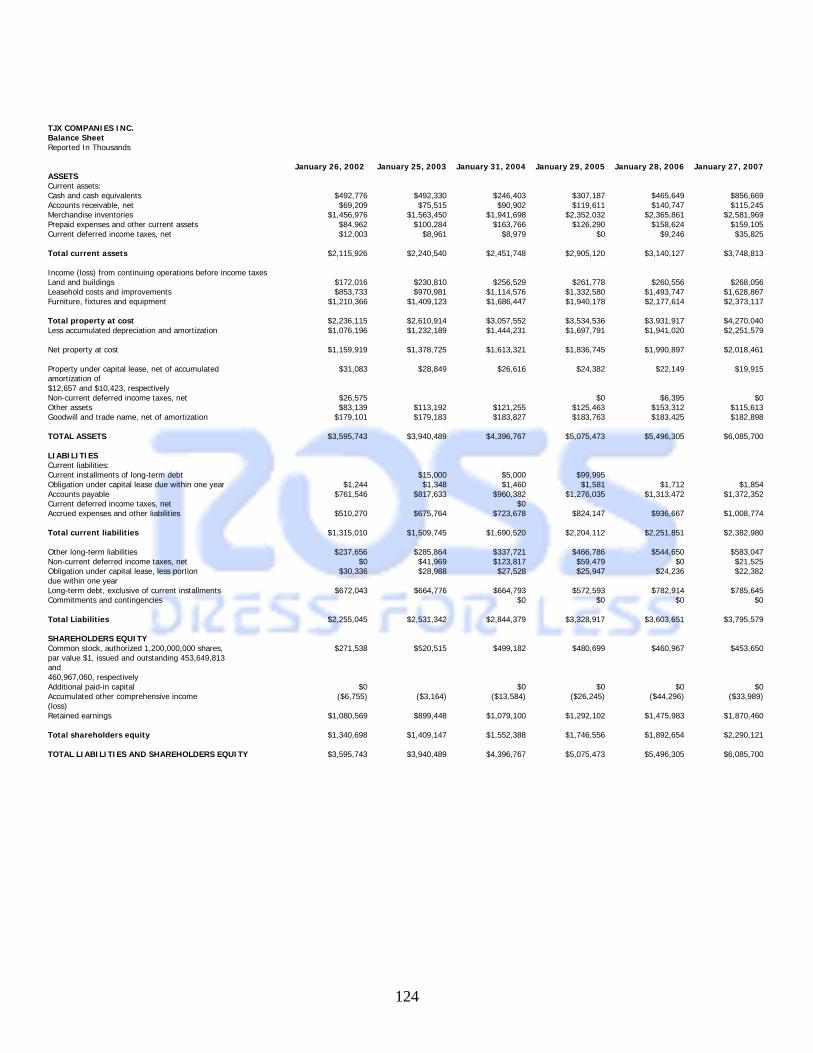
124
TJX COMPANIES INC. Balance Sheet Reported In Thousands
January 26, 2002 January 25, 2003 January 31, 2004 January 29, 2005 January 28, 2006 January 27, 2007
ASSETS Current assets: Cash and cash equivalents $492,776 $492,330 $246,403 $307,187 $465,649 $856,669 Accounts receivable, net $69,209 $75,515 $90,902 $119,611 $140,747 $115,245 Merchandise inventories $1,456,976 $1,563,450 $1,941,698 $2,352,032 $2,365,861 $2,581,969 Prepaid expenses and other current assets $84,962 $100,284 $163,766 $126,290 $158,624 $159,105 Current deferred income taxes, net $12,003 $8,961 $8,979 $0 $9,246 $35,825
Total current assets $2,115,926 $2,240,540 $2,451,748 $2,905,120 $3,140,127 $3,748,813
Income (loss) from continuing operations before income taxes Land and buildings $172,016 $230,810 $256,529 $261,778 $260,556 $268,056 Leasehold costs and improvements $853,733 $970,981 $1,114,576 $1,332,580 $1,493,747 $1,628,867 Furniture, fixtures and equipment $1,210,366 $1,409,123 $1,686,447 $1,940,178 $2,177,614 $2,373,117
Total property at cost $2,236,115 $2,610,914 $3,057,552 $3,534,536 $3,931,917 $4,270,040 Less accumulated depreciation and amortization $1,076,196 $1,232,189 $1,444,231 $1,697,791 $1,941,020 $2,251,579
Net property at cost $1,159,919 $1,378,725 $1,613,321 $1,836,745 $1,990,897 $2,018,461
Property under capital lease, net of accumulated $31,083 $28,849 $26,616 $24,382 $22,149 $19,915 amortization of $12,657 and $10,423, respectively Non-current deferred income taxes, net $26,575 $0 $6,395 $0 Other assets $83,139 $113,192 $121,255 $125,463 $153,312 $115,613 Goodwill and trade name, net of amortization $179,101 $179,183 $183,827 $183,763 $183,425 $182,898
TOTAL ASSETS $3,595,743 $3,940,489 $4,396,767 $5,075,473 $5,496,305 $6,085,700
LIABILITIES Current liabilities: Current installments of long-term debt $15,000 $5,000 $99,995 Obligation under capital lease due within one year $1,244 $1,348 $1,460 $1,581 $1,712 $1,854 Accounts payable $761,546 $817,633 $960,382 $1,276,035 $1,313,472 $1,372,352 Current deferred income taxes, net $0 Accrued expenses and other liabilities $510,270 $675,764 $723,678 $824,147 $936,667 $1,008,774
Total current liabilities $1,315,010 $1,509,745 $1,690,520 $2,204,112 $2,251,851 $2,382,980
Other long-term liabilities $237,656 $285,864 $337,721 $466,786 $544,650 $583,047 Non-current deferred income taxes, net $0 $41,969 $123,817 $59,479 $0 $21,525 Obligation under capital lease, less portion $30,336 $28,988 $27,528 $25,947 $24,236 $22,382 due within one year Long-term debt, exclusive of current installments $672,043 $664,776 $664,793 $572,593 $782,914 $785,645 Commitments and contingencies $0 $0 $0 $0
Total Liabilities $2,255,045 $2,531,342 $2,844,379 $3,328,917 $3,603,651 $3,795,579
SHAREHOLDERS EQUITY Common stock, authorized 1,200,000,000 shares, $271,538 $520,515 $499,182 $480,699 $460,967 $453,650 par value $1, issued and outstanding 453,649,813 and 460,967,060, respectively Additional paid-in capital $0 $0 $0 $0 $0 Accumulated other comprehensive income ($6,755) ($3,164) ($13,584) ($26,245) ($44,296) ($33,989)(loss) Retained earnings $1,080,569 $899,448 $1,079,100 $1,292,102 $1,475,983 $1,870,460
Total shareholders equity $1,340,698 $1,409,147 $1,552,388 $1,746,556 $1,892,654 $2,290,121
TOTAL LIABILITIES AND SHAREHOLDERS EQUITY $3,595,743 $3,940,489 $4,396,767 $5,075,473 $5,496,305 $6,085,700

125
TJX COMPANIES INC Cash Flows Reported in Thousands
January 26, 2002 January 25, 2003 January 31, 2004 January 29, 2005 January 28, 2006 January 27, 2007 (53 Weeks)
Cash flows from operating activities: Net income $500,397 $578,388 $609,412 $609,699 $690,423 $738,039 Adjustments to reconcile net income to net cash provided by operating activities: Loss from discontinued operations, net of income taxes $40,000 Depreciation and amortization $204,081 $207,876 $238,385 $279,059 $314,285 $353,110 Loss on property disposals $6,832 $8,699 $5,679 $4,908 $10,600 $32,743 Amortization of stock compensation expense $30,644 $11,767 $91,797 $100,121 $91,190 $69,804 Excess tax benefits from stock compensation $2,672 $3,197 ($2,552) ($3,022) $0 ($3,632)expense Deferred income tax provision $35,230 $72,138 $62,747 $22,758 ($88,245) $6,286 Changes in assets and liabilities: Income (loss) from continuing operations before income taxes ($7,615) ($5,983) ($11,818) ($27,731) ($20,997) $26,397 (Increase) in merchandise inventories ($13,292) ($85,644) ($310,673) ($390,655) ($8,772) ($201,413)(Increase) decrease in prepaid expenses ($1,273) ($22,208) ($51,413) $35,912 ($35,197) ($4,873)and other current assets (Increase) in income taxes recoverable $0 $0 ($18,306)Increase in accounts payable $120,770 $45,559 $118,832 $305,344 $35,010 $50,165 Increase in accrued expenses and other $16,054 $133,115 ($11,663) $154,282 $163,362 $170,592 liabilities Increase (decrease) in income taxes payable $34,298 $3,314 $7,903 ($42,558)Other, net ($22,054) ($38,344) ($5,083) ($17,180) ($1,543) $18,679
Net cash provided by operating activities $912,446 $908,560 $767,948 $1,076,809 $1,158,019 $1,195,033
Cash flows from investing activities: Property additions ($449,444) ($396,724) ($409,037) ($429,133) ($495,948) ($378,011)Proceeds from sale of property $0 $0 $9,688 $0 Issuance of note receivable ($5,527) Acquisition of Bob s Stores, net of cash acquired $0 ($57,138) Proceeds from repayments on note receivable $125 $564 $606 $652 $652 $700
Net cash (used in) investing activities ($454,846) ($396,160) ($465,569) ($428,481) ($485,608) ($377,311)
Cash flows from financing activities: Principal payments on long-term debt ($73) $0 ($15,000) ($5,002) ($100,000) $0 Payments on short-term debt, net ($39,000) Payments on capital lease obligation ($992) ($1,244) ($1,348) ($1,460) ($1,580) ($1,712)Proceeds from sale and issuance of common $65,202 $33,916 $59,159 $96,861 $102,438 $260,197 stock Proceeds from borrowings of long-term $347,579 $0 $0 $204,427 $0 debt Cash payments for repurchase of common ($424,163) ($481,734) ($520,746) ($594,580) ($603,739) ($557,234)stock Excess tax benefits from stock compensation $2,552 $3,022 $0 $3,632 expense Cash dividends paid ($48,290) ($60,025) ($68,889) ($83,418) ($105,251) ($122,927)
Net cash (used in) financing activities ($99,737) ($509,087) ($544,272) ($584,577) ($503,705) ($418,044)
Effect of exchange rate changes on cash $2,378 ($3,759) ($4,034) ($2,967) ($10,244) ($8,658)
Net increase in cash and cash equivalents $360,241 ($446) ($245,927) $60,784 $158,462 $391,020 Cash and cash equivalents at beginning $132,535 $492,776 $492,330 $246,403 $307,187 $465,649 of year
Cash and cash equivalents at end of year $492,776 $492,330 $246,403 $307,187 $465,649 $856,669

126
J.C. Penney Company, Inc.
Annual Income Statement
Reported in Thousands
2002 2003 2004 2005 2006 2007
Retail sales, net $32,004,000 $32,347,000 $17,786,000 $18,424,000 $18,781,000 $19,903,000
Cost of goods sold $22,789,000 $22,573,000 $11,166,000 $11,285,000 $11,405,000 $12,078,000
Gross margin $9,215,000 $9,774,000 $6,620,000 $7,139,000 $7,376,000 $7,825,000
Selling, general & administrative expenses $8,459,000 $8,667,000 $5,830,000 $5,827,000 $5,799,000 $5,521,000
Other operating expenses $25,000 $93,000 $0 $0 $0 $450,000
Total operating expenses $8,459,000 $8,667,000 $5,830,000 $5,827,000 $5,799,000 $5,903,000
Operating income $756,000 $1,107,000 $790,000 $1,312,000 $1,577,000 $1,922,000
Net interest expense ($386,000) ($388,000) $261,000 $233,000 $169,000 $130,000
Bond premiums & unamortized costs $0 $0 - $47,000 $18,000 $0
Real estate activities $0 $0 $28,000 $30,000 $39,000 $0
Net gains from sale of real estate $0 $0 $51,000 $8,000 $27,000 $0
Asset impair, PVOL & other unit closing costs $0 $0 ($57,000) ($19,000) ($12,000) $0
Management transition costs $0 $0 - ($29,000) $0 $0
Other real estate other income (expense) $0 $0 ($5,000) ($2,000) $0 $0
Real estate & other income (expense) $0 $0 ($17,000) $12,000 $54,000 $0
Acquisition amortization $121,000 $42,000 $0 $0 $0 $0
Restructuring & other charges, net $21,000 $0 $0 $0 $0 $0
Total costs & expenses $31,801,000 $31,763,000 $17,336,000 $17,442,000 $17,403,000 $18,179,000
Income (loss) from continuing operations before income taxes $203,000 $584,000 $546,000 $1,020,000 $1,444,000 $1,792,000
current income taxes (benefit) $3,000 $72,000 $45,000 $354,000 $530,000 $699,000
deferred income taxes (benefit) $86,000 $141,000 $137,000 ($1,000) ($63,000) ($41,000)
Income tax expense $89,000 $213,000 $182,000 $353,000 $467,000 $658,000
Income (loss) from continuing operations $114,000 $371,000 $364,000 $667,000 $977,000 $1,134,000
Income (loss) from discontinued operations $0 $0 $0 $0 $111,000 $19,000
Gain (loss) on sale of discontinued operations ($16,000) $34,000 $0 $0 $0 $0
Discontinued operations, net $0 $0 ($1,292,000) ($143,000) $0 $0
Net income (loss) $98,000 $405,000 ($928,000) $524,000 $1,088,000 $1,153,000

127
J.C. Penney Company, Inc. Balance Sheet Reported in Thousands 2002 2003 2004 2005 2006 2007 Cash & short-term investments $2,840,000 $2,474,000 $2,994,000 $4,687,000 $3,016,000 $2,747,000 Receivables, net $698,000 $705,000 $233,000 $404,000 $270,000 $263,000 Merchandise inventories $4,930,000 $4,945,000 $3,156,000 $3,169,000 $3,210,000 $3,400,000 Prepaid expenses $209,000 $229,000 $130,000 $167,000 $206,000 $238,000 Total current assets $8,677,000 $8,353,000 $6,513,000 $8,427,000 $6,702,000 $6,648,000 Land & buildings $2,987,000 $2,940,000 $2,760,000 $2,896,000 $3,045,000 $3,378,000 Furniture & fixtures $4,105,000 $3,946,000 $2,203,000 $2,145,000 $2,078,000 $2,104,000 Leasehold improvements $1,225,000 $1,268,000 $674,000 $674,000 $722,000 $795,000 Accumulated depreciation $3,328,000 $3,253,000 $2,122,000 $2,077,000 $2,097,000 $2,115,000 Property & equipment, net $4,989,000 $4,901,000 $3,515,000 $3,638,000 $3,748,000 $4,162,000 Prepaid pension - - $1,320,000 $1,538,000 $1,469,000 $1,235,000 Goodwill & other intangible assets, net $2,740,000 $2,798,000 $42,000 - - - Real estate investments - $106,000 $169,000 $192,000 $270,000 $350,000 Leveraged lease investments - $131,000 $134,000 $139,000 $135,000 $140,000 Capitalized software, net - $228,000 $97,000 $99,000 $89,000 $95,000 Goodwill - Renner - - - $43,000 - - Deferred catalog book costs - $73,000 $77,000 - - - Income (loss) from continuing operations before income taxes - $46,000 $52,000 $31,000 $24,000 $21,000 Prepaid pension - $1,172,000 - - - - Other assets $1,642,000 $59,000 $27,000 $20,000 $24,000 $22,000 Total other assets - $1,815,000 $556,000 $524,000 $542,000 $628,000 Assets of discontinued operations - - $6,354,000 - - - Total non-current assets $9,371,000 $9,514,000 $11,787,000 $5,700,000 $5,759,000 $6,025,000 Total assets $18,048,000 $17,867,000 $18,300,000 $14,127,000 $12,461,000 $12,673,000 Trade payables $1,551,000 $1,792,000 $1,167,000 $1,200,000 $1,171,000 $1,366,000 Accrued salaries, vacation & bonus $541,000 $570,000 $409,000 $443,000 $453,000 $455,000 Customer gift cards/certificates $161,000 $173,000 $179,000 $207,000 $219,000 $231,000 Taxes other than income taxes - - - $125,000 $74,000 $116,000 Capital expenditures payable - - - - $47,000 $88,000 Interest payable $137,000 $122,000 $132,000 $107,000 $95,000 $84,000 Current portion of retirement plan liabilities - - - - - $74,000 Advertising payables $136,000 $187,000 $79,000 $78,000 $99,000 $93,000 Current portion of workers' compensation $102,000 $99,000 $63,000 $68,000 $72,000 $67,000 Occupancy & rent-related payables - $91,000 - - $51,000 $46,000 Common dividends payable $34,000 $34,000 $35,000 $35,000 $29,000 $41,000 Reserves for discontinued operations - - - $221,000 $79,000 $34,000 Taxes payable $158,000 $123,000 $119,000 $79,000 - - Pharmacy payables - $131,000 - - - - Restructuring reserves $55,000 $37,000 - - - - Funds due for common stock repurchases - - - $51,000 - - Other accrued expenses & other current liabilities $590,000 $432,000 $368,000 $352,000 $344,000 $363,000 Total accrued expenses & other current liabilities - - - $1,766,000 $1,562,000 $1,692,000 Accounts payable & accrued expenses $3,465,000 $3,791,000 $2,551,000 - - - Current maturities of long term debt $920,000 $275,000 $242,000 $459,000 $21,000 $434,000 Income taxes payable - - - - $8,000 - Short-term debt $15,000 $13,000 $18,000 $22,000 - - Deferred taxes $99,000 $80,000 $943,000 - - - Total current liabilities $4,499,000 $4,159,000 $3,754,000 $3,447,000 $2,762,000 $3,492,000 Notes $2,625,000 $1,928,000 $2,165,000 $1,857,000 $1,763,000 $1,763,000 Debentures $1,525,000 $1,525,000 $1,525,000 $1,525,000 $1,369,000 $1,369,000 Notes & debentures $4,150,000 $3,453,000 $3,690,000 $3,382,000 $3,132,000 $3,132,000 Medium-term notes $700,000 $493,000 $493,000 $493,000 $300,000 $300,000 Convertible subordinated notes $650,000 $650,000 $650,000 - - - Sinking fund debentures $405,000 $392,000 $313,000 - - - Original issue discount debentures $146,000 $156,000 $167,000 - - - Equipment financing notes - $25,000 $21,000 $15,000 $10,000 $4,000 Total notes & debentures - - - $3,890,000 $3,442,000 $3,436,000 Capital lease obligations & other long-term debt $48,000 $46,000 $22,000 $33,000 $23,000 $8,000 Total long-term debt, including current maturities - - - $3,923,000 $3,465,000 $3,444,000 Less: current maturities $920,000 $275,000 $242,000 $459,000 $21,000 $434,000 Long-term debt $5,179,000 $4,940,000 $5,114,000 $3,464,000 $3,444,000 $3,010,000 Deferred taxes $1,231,000 $1,391,000 $1,217,000 $1,318,000 $1,287,000 $1,206,000 Retirement benefit plan liabilities - - - $634,000 $590,000 $324,000 Long-term portion of workers' compensation & - - - $157,000 $164,000 $152,000 Developer/tenant allowances - - - $111,000 $122,000 $120,000 Reserves for discontinued operations - - - $114,000 $54,000 $51,000 Other liabilities $1,010,000 $1,007,000 $804,000 $26,000 $31,000 $30,000 Total other liabilities - - - $1,042,000 $961,000 $677,000 Liabilities of discontinued operations - - $1,986,000 - - - Total Non-Current Liabilities $7,420,000 $7,338,000 $9,121,000 $5,824,000 $5,692,000 $4,893,000 Total liabilities $11,919,000 $11,497,000 $12,875,000 $9,271,000 $8,454,000 $8,385,000 Preferred stock $363,000 $333,000 $304,000 - - - Common stock & additional paid-in capital $3,324,000 $3,423,000 $3,531,000 $4,176,000 $3,479,000 $3,542,000 Deferred stock compensation ($6,000) - - - - - Reinvested earnings $2,573,000 $2,817,000 $1,728,000 $812,000 $512,000 $922,000 Foreign currency translation ($100,000) ($164,000) ($115,000) ($104,000) - - Non-qualified plan minimum liability adjustments ($51,000) ($58,000) ($82,000) ($102,000) ($102,000) - Net unrealized gains on investments $14,000 $19,000 $60,000 $74,000 $118,000 $166,000 Net actuarial gain/(loss) & prior service (co - - - - - ($342,000) Other comprehensive (loss) from discontinued operations - - ($1,000) - - - Accumulated other comprehensive income (loss) ($137,000) ($203,000) ($138,000) ($132,000) $16,000 ($176,000) Total stockholders' equity $6,129,000 $6,370,000 $5,425,000 $4,856,000 $4,007,000 $4,288,000 Total liabilities and stockholders' equity $18,048,000 $17,867,000 $18,300,000 $14,127,000 $12,461,000 $12,673,000

128
J.C. Penney Company, Inc.
Annual Cash Flow
Reported in Thousands
2002 2003 2004 2005 2006 2007
Net income (loss) $114,000 $371,000 $364,000 $667,000 $1,088,000 $1,153,000
Loss (income) from discontinued operations - - - - ($111,000) ($19,000)
Asset impair, PVOL & other unit closing costs - $104,000 $35,000 $19,000 $12,000 $4,000
Restructuring & other charges, net $56,000 - - - - -
Depreciation & amortization $717,000 $667,000 $394,000 $368,000 $372,000 $389,000
Net gains on sale of assets - ($18,000) ($51,000) ($8,000) ($27,000) ($8,000)
Real estate (gain) ($26,000) - - - - -
Co contributions to savings & profits sharing $58,000 $47,000 - - - -
Benefit plans expense (income) ($73,000) $30,000 $135,000 $45,000 $49,000 ($51,000)
Pension contribution - ($300,000) ($300,000) ($300,000) - ($300,000)
Stock-based compensation - $4,000 $9,000 $23,000 $38,000 $60,000
Tax benefits on stock options exercised - - - - - $6,000
Deferred stock compensation $6,000 - - - - -
Deferred taxes $86,000 $141,000 $137,000 $1,000 $15,000 ($6,000)
Receivables $3,000 ($6,000) $3,000 ($34,000) ($44,000) $29,000
Sale of drugstore receivables $200,000 - - - - -
Other receivables - - - - - -
Income (loss) from continuing operations before income taxes $343,000 $82,000 ($100,000) ($13,000) ($67,000) ($190,000)
Prepaid expenses & other assets - ($36,000) ($36,000) $9,000 ($16,000) ($37,000)
Other assets ($57,000) - - - - -
Accounts payable ($420,000) $138,000 - $33,000 - -
Trade payables - - - - $28,000 $195,000
Accounts payable & accrued expenses - - $94,000 - - -
Current income taxes payable ($70,000) $3,000 ($17,000) $182,000 ($124,000) ($1,000)
Accrued expenses & other liabilities - - - $135,000 $124,000 $31,000
Other liabilities $50,000 $102,000 $145,000 - - -
Net cash flows from operating activities $987,000 $1,329,000 $812,000 $1,127,000 $1,337,000 $1,255,000
Net Cash flows from investing activities n/a ($277,000) ($239,000) $4,302,000 ($221,000) ($752,000)
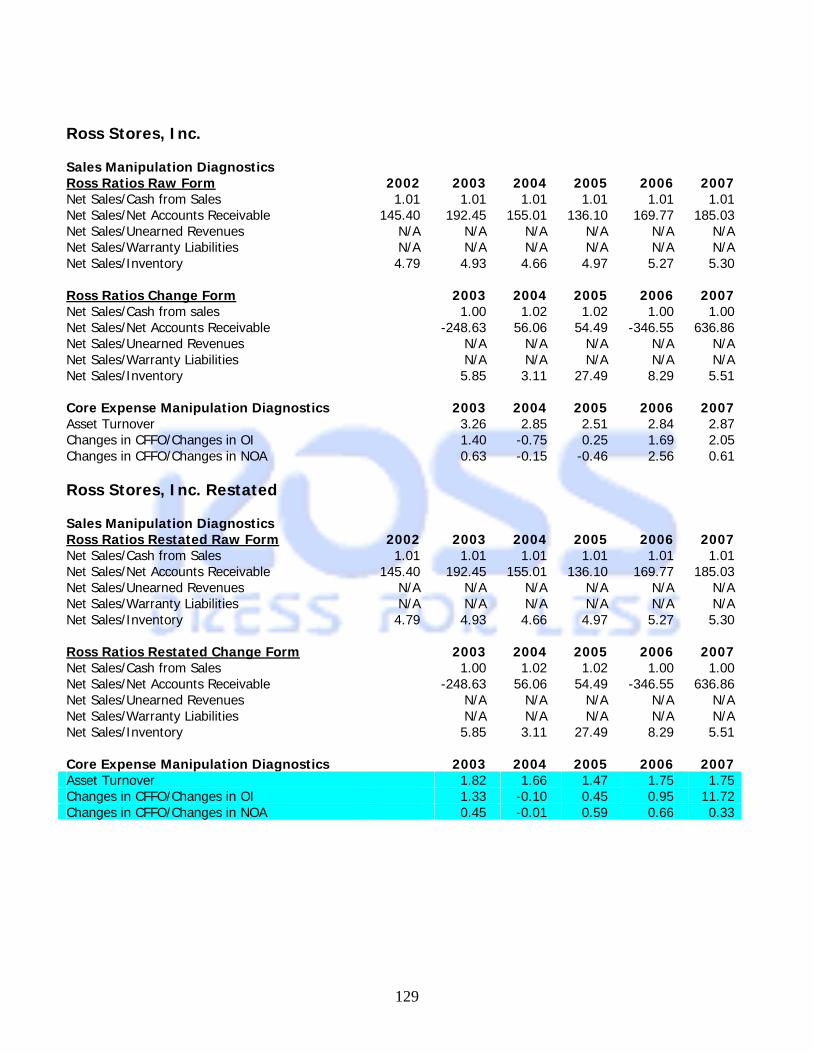
129
Ross Stores, Inc. Sales Manipulation Diagnostics Ross Ratios Raw Form 2002 2003 2004 2005 2006 2007Net Sales/Cash from Sales 1.01 1.01 1.01 1.01 1.01 1.01 Net Sales/Net Accounts Receivable 145.40 192.45 155.01 136.10 169.77 185.03 Net Sales/Unearned Revenues N/A N/A N/A N/A N/A N/ANet Sales/Warranty Liabilities N/A N/A N/A N/A N/A N/ANet Sales/Inventory 4.79 4.93 4.66 4.97 5.27 5.30 Ross Ratios Change Form 2003 2004 2005 2006 2007Net Sales/Cash from sales 1.00 1.02 1.02 1.00 1.00 Net Sales/Net Accounts Receivable -248.63 56.06 54.49 -346.55 636.86 Net Sales/Unearned Revenues N/A N/A N/A N/A N/ANet Sales/Warranty Liabilities N/A N/A N/A N/A N/ANet Sales/Inventory 5.85 3.11 27.49 8.29 5.51 Core Expense Manipulation Diagnostics 2003 2004 2005 2006 2007Asset Turnover 3.26 2.85 2.51 2.84 2.87 Changes in CFFO/Changes in OI 1.40 -0.75 0.25 1.69 2.05 Changes in CFFO/Changes in NOA 0.63 -0.15 -0.46 2.56 0.61 Ross Stores, Inc. Restated Sales Manipulation Diagnostics Ross Ratios Restated Raw Form 2002 2003 2004 2005 2006 2007Net Sales/Cash from Sales 1.01 1.01 1.01 1.01 1.01 1.01 Net Sales/Net Accounts Receivable 145.40 192.45 155.01 136.10 169.77 185.03 Net Sales/Unearned Revenues N/A N/A N/A N/A N/A N/ANet Sales/Warranty Liabilities N/A N/A N/A N/A N/A N/ANet Sales/Inventory 4.79 4.93 4.66 4.97 5.27 5.30 Ross Ratios Restated Change Form 2003 2004 2005 2006 2007Net Sales/Cash from Sales 1.00 1.02 1.02 1.00 1.00 Net Sales/Net Accounts Receivable -248.63 56.06 54.49 -346.55 636.86 Net Sales/Unearned Revenues N/A N/A N/A N/A N/ANet Sales/Warranty Liabilities N/A N/A N/A N/A N/ANet Sales/Inventory 5.85 3.11 27.49 8.29 5.51 Core Expense Manipulation Diagnostics 2003 2004 2005 2006 2007Asset Turnover 1.82 1.66 1.47 1.75 1.75 Changes in CFFO/Changes in OI 1.33 -0.10 0.45 0.95 11.72 Changes in CFFO/Changes in NOA 0.45 -0.01 0.59 0.66 0.33

130
Kohl's Corporation Sales Manipulation Diagnostics Kohl's Ratios Raw Form 2002 2003 2004 2005 2006 2007Net Sales/Cash from Sales 1.02 1.02 1.02 1.02 1.02 0.90Net Sales/Net Accounts Receivable 8.96 9.20 8.94 8.42 8.11 N/ANet Sales/Unearned Revenues N/A N/A N/A N/A N/A N/ANet Sales/Warranty Liabilities N/A N/A N/A N/A N/A N/ANet Sales/Inventory 6.25 5.61 6.40 6.01 5.99 6.01 Kohl's Ratios Change Form 2003 2004 2005 2006 2007Net Sales/Cash from Sales 1.00 1.00 1.06 1.01 0.53Net Sales/Net Accounts Receivable 10.54 7.29 5.92 6.48 -1.30Net Sales/Unearned Revenues N/A N/A N/A N/A N/ANet Sales/Warranty Liabilities N/A N/A N/A N/A N/ANet Sales/Inventory 3.81 -58.07 4.17 5.86 6.11 Core Expense Manipulation Diagnostics 2003 2004 2005 2006 2007Asset Turnover 1.85 1.63 1.75 1.68 1.70Changes in CFFO/Changes in OI 0.55 -1.00 0.82 -0.25 5.56Changes in CFFO/Changes in NOA 0.17 0.09 0.21 -0.06 -7.81 T.J. Maxx Sales Manipulation Diagnostics T.J. Maxx Raw Form 2002 2003 2004 2005 2006 2007Net Sales/Cash from Sales 1.01 1.00 1.01 1.02 1.00 1.00 Net Sales/Net Accounts Receivable 154.73 158.66 146.62 124.24 113.37 151.02Net Sales/Unearned Revenues N/A N/A N/A N/A N/A N/ANet Sales/Warranty Liabilities N/A N/A N/A N/A N/A N/ANet Sales/Inventory 7.35 7.66 6.86 6.32 6.74 6.74 T.J. Maxx Change Form 2003 2004 2005 2006 2007Net Sales/Cash from Sales 0.94 1.06 1.14 0.80 1.01Net Sales/Net Accounts Receivable 201.75 87.52 53.39 51.82 -56.81Net Sales/Unearned Revenues N/A N/A N/A N/A N/ANet Sales/Warranty Liabilities N/A N/A N/A N/A N/ANet Sales/Inventory 11.95 3.56 3.74 79.20 6.70 Core Expense Manipulation Diagnostics 2003 2004 2005 2006 2007Asset Turnover 3.33 3.38 3.38 3.14 3.17Changes in CFFO/Changes in OI -0.10 -4.53 383.68 1.02 0.43Changes in CFFO/Changes in NOA -0.03 -0.51 1.87 0.22 0.08

131
J.C. Penney Sales Manipulation Diagnostics J.C. Penney Raw Form 2002 2003 2004 2005 2006 2007Net Sales/Cash from Sales 1.00 1.00 1.00 1.00 1.00 1.00 Net Sales/Net Accounts Receivable 45.85 45.88 76.33 45.60 69.56 75.68 Net Sales/Unearned Revenues N/A N/A N/A N/A N/A N/ANet Sales/Warranty Liabilities N/A N/A N/A N/A N/A N/ANet Sales/Inventory 6.49 6.54 5.64 5.81 5.85 5.85 J.C. Penney Change Form 2003 2004 2005 2006 2007Net Sales/Cash from Sales 1.03 1.00 1.06 1.03 0.94 Net Sales/Net Accounts Receivable 1.03 1.00 1.06 1.03 0.94 Net Sales/Unearned Revenues N/A N/A N/A N/A N/ANet Sales/Warranty Liabilities N/A N/A N/A N/A N/ANet Sales/Inventory 22.87 8.14 49.08 8.71 5.91 Core Expense Manipulation Diagnostics 2003 2004 2005 2006 2007Asset Turnover 1.79 1.00 1.01 1.33 1.60 Changes in CFFO/Changes in OI 0.97 1.63 0.60 0.79 -0.24 Changes in CFFO/Changes in NOA 2.15 -0.62 -0.08 -0.21 0.16

132
Ross Stores, Inc.
Restatement of Operating Leases to Capital Leases
Year Period Operating PV Factor
PV of Operating Beginning Interest Payment Depreciation Effect on Ending
Lease Lease Balance Expense Expense Income Statement Balance
2003 1 $185,868 0.97135 $180,542 $990,251 $29,212 $185,868 $99,025 $57,630 $833,596 2004 2 $171,862 0.94351 $162,154 $833,596 $24,591 $171,862 $99,025 $48,246 $686,325 2005 3 $156,404 0.91648 $143,340 $686,325 $20,247 $156,404 $99,025 $37,132 $550,167 2006 4 $137,851 0.89021 $122,717 $550,167 $16,230 $137,851 $99,025 $22,596 $428,546 2007 5 $124,206 0.86471 $107,402 $428,546 $12,642 $124,206 $99,025 $12,539 $316,983 2008 6 $69,116 0.83993 $58,052 $316,983 $9,351 $69,116 $99,025 -$39,260 $257,218 2009 7 $69,116 0.81586 $56,389 $257,218 $7,588 $69,116 $99,025 -$37,497 $195,690 2010 8 $69,116 0.79248 $54,773 $195,690 $5,773 $69,116 $99,025 -$35,682 $132,347 2011 9 $69,116 0.76977 $53,203 $132,347 $3,904 $69,116 $99,025 -$33,814 $67,135 2012 10 $69,116 0.74772 $51,679 $67,135 $1,980 $69,116 $99,025 -$31,890 $0
$1,121,770 $990,251 $1,121,770 $0 Discount rate derived from 12 month Libor at January 31, 2003 plus 1.5 2.95%
Ross Stores, Inc.
Restatement of Operating Leases to Capital Leases ($000)
Year Period Operating PV Factor
PV of Operating Beginning Interest Payment Depreciation Effect on Ending
Lease Lease Balance Expense Expense Income Statement Balance
2002 1 $146,940 0.96646 $142,012 $862,040 $29,913 $146,940 $86,204 $30,823 $745,013 2003 2 $144,152 0.93405 $134,645 $745,013 $25,852 $144,152 $86,204 $32,096 $626,713 2004 3 $127,737 0.90273 $115,312 $626,713 $21,747 $127,737 $86,204 $19,786 $520,723 2005 4 $112,325 0.87245 $97,998 $520,723 $18,069 $112,325 $86,204 $8,052 $426,467 2006 5 $101,188 0.84319 $85,321 $426,467 $14,798 $101,188 $86,204 $186 $340,077 2007 6 $75,257 0.81492 $61,328 $340,077 $11,801 $75,257 $86,204 -$22,748 $276,621 2008 7 $75,257 0.78759 $59,271 $276,621 $9,599 $75,257 $86,204 -$20,546 $210,963 2009 8 $75,257 0.76117 $57,284 $210,963 $7,320 $75,257 $86,204 -$18,268 $143,027 2010 9 $75,257 0.73565 $55,363 $143,027 $4,963 $75,257 $86,204 -$15,910 $72,733 2011 10 $75,257 0.71098 $53,506 $72,733 $2,524 $75,257 $86,204 -$13,471 $0
$1,008,626 $862,040 $1,008,626 $0 Discount rate derived from 12 month Libor at February 1, 2002 plus .9 3.47%

133
Ross Stores, Inc. Restatement of Operating Leases to Capital Leases
Year Period Operating PV Factor
PV of Operating Beginning Interest Payment Depreciation Effect on Ending
Lease Lease Balance Expense Expense Income Statement Balance
2005 1 $227,910 0.95447 $217,534 $1,080,365 $51,533 $227,910 $108,037 $68,340 $903,989 2006 2 $205,107 0.91102 $186,856 $903,989 $43,120 $205,107 $108,037 $53,950 $742,002 2007 3 $189,363 0.86954 $164,659 $742,002 $35,394 $189,363 $108,037 $45,933 $588,033 2008 4 $170,697 0.82995 $141,670 $588,033 $28,049 $170,697 $108,037 $34,611 $445,385 2009 5 $140,732 0.79216 $111,483 $445,385 $21,245 $140,732 $108,037 $11,451 $325,898 2010 6 $74,796 0.75610 $56,553 $325,898 $15,545 $74,796 $108,037 -$48,786 $266,647 2011 7 $74,796 0.72167 $53,979 $266,647 $12,719 $74,796 $108,037 -$45,959 $204,570 2012 8 $74,796 0.68882 $51,521 $204,570 $9,758 $74,796 $108,037 -$42,998 $139,531 2013 9 $74,796 0.65746 $49,175 $139,531 $6,656 $74,796 $108,037 -$39,896 $71,391 2014 10 $74,796 0.62752 $46,936 $71,391 $3,405 $74,796 $108,037 -$36,646 $0
$1,307,790 $1,080,365 $1,307,790 $0 Discount rate derived from 12 month Libor at January 28, 2005 plus 1.5 4.77%
Ross Stores, Inc. Restatement of Operating Leases to Capital Leases
Year Period Operating PV Factor
PV of Operating Beginning Interest Payment Depreciation Effect on Ending
Lease Lease Balance Expense Expense Income Statement Balance
2004 1 $223,662 0.97106 $217,190 $1,190,839 $35,487 $223,662 $119,084 $69,091 $1,002,664 2005 2 $209,917 0.94296 $197,944 $1,002,664 $29,879 $209,917 $119,084 $60,954 $822,626 2006 3 $179,770 0.91567 $164,611 $822,626 $24,514 $179,770 $119,084 $36,172 $667,371 2007 4 $164,406 0.88918 $146,186 $667,371 $19,888 $164,406 $119,084 $25,434 $522,852 2008 5 $146,804 0.86345 $126,757 $522,852 $15,581 $146,804 $119,084 $12,139 $391,629 2009 6 $85,465 0.83846 $71,659 $391,629 $11,671 $85,465 $119,084 -$45,289 $317,835 2010 7 $85,465 0.81420 $69,586 $317,835 $9,471 $85,465 $119,084 -$43,090 $241,841 2011 8 $85,465 0.79064 $67,572 $241,841 $7,207 $85,465 $119,084 -$40,826 $163,582 2012 9 $85,465 0.76776 $65,617 $163,582 $4,875 $85,465 $119,084 -$38,493 $82,992 2013 10 $85,465 0.74554 $63,718 $82,992 $2,473 $85,465 $119,084 -$36,092 $0
$1,351,885 $1,190,839 $1,351,885 $0 Discount rate derived from 12 month Libor at January 30, 2004 plus 1.5 2.98%

134
Ross Stores, Inc. Restatement of Operating Leases to Capital Leases
Year Period Operating PV Factor PV of Operating Beginning Interest Payment Depreciation Effect on Ending
Lease Lease Balance Expense Expense Income Statement Balance
2007 1 $298,326 0.94447 $281,759 $1,377,440 $80,993 $298,326 $137,744 $79,588 $1,160,108 2008 2 $275,498 0.89201 $245,748 $1,160,108 $68,214 $275,498 $137,744 $69,540 $952,824 2009 3 $247,519 0.84248 $208,529 $952,824 $56,026 $247,519 $137,744 $53,749 $761,331 2010 4 $221,703 0.79569 $176,407 $761,331 $44,766 $221,703 $137,744 $39,193 $584,394 2011 5 $188,292 0.75150 $141,502 $584,394 $34,362 $188,292 $137,744 $16,186 $430,465 2012 6 $101,857 0.70977 $72,295 $430,465 $25,311 $101,857 $137,744 -$61,198 $353,919 2013 7 $101,857 0.67035 $68,280 $353,919 $20,810 $101,857 $137,744 -$56,697 $272,872 2014 8 $101,857 0.63312 $64,488 $272,872 $16,045 $101,857 $137,744 -$51,931 $187,059 2015 9 $101,857 0.59796 $60,907 $187,059 $10,999 $101,857 $137,744 -$46,886 $96,201 2016 10 $101,857 0.56476 $57,525 $96,201 $5,657 $101,857 $137,744 -$41,543 $0
$1,740,625 $1,377,440 $1,740,625 $0 Discount rate derived from 12 month Libor at February 2, 2007 plus .45 5.88% Ross Stores, Inc.
Ross Stores, Inc. Restatement of Operating Leases to Capital Leases
Year Period Operating PV Factor
PV of Operating Beginning Interest Payment Depreciation Effect on Ending
Lease Lease Balance Expense Expense Income Statement Balance
2006 1 $340,453 0.93747 $319,165 $1,253,115 $83,583 $340,453 $125,312 $131,559 $996,245 2007 2 $237,459 0.87885 $208,691 $996,245 $66,450 $237,459 $125,312 $45,698 $825,235 2008 3 $214,002 0.82390 $176,316 $825,235 $55,043 $214,002 $125,312 $33,647 $666,277 2009 4 $188,085 0.77238 $145,273 $666,277 $44,441 $188,085 $125,312 $18,333 $522,632 2010 5 $162,724 0.72408 $117,826 $522,632 $34,860 $162,724 $125,312 $2,553 $394,768 2011 6 $95,431 0.67881 $64,779 $394,768 $26,331 $95,431 $125,312 -$56,212 $325,668 2012 7 $95,431 0.63636 $60,729 $325,668 $21,722 $95,431 $125,312 -$51,603 $251,959 2013 8 $95,431 0.59657 $56,931 $251,959 $16,806 $95,431 $125,312 -$46,686 $173,333 2014 9 $95,431 0.55927 $53,371 $173,333 $11,561 $95,431 $125,312 -$41,442 $89,464 2015 10 $95,431 0.52430 $50,034 $89,464 $5,967 $95,431 $125,312 -$35,848 $0
$1,619,878 $1,253,115 $1,619,878 $0 Discount rate derived from 12 month Libor at January 27, 2006 plus 1.75 6.67%

135
Ross Stores, Inc. All numbers except ratios stated in thousands 2002 2003 2004 2005 2006 2007 Assets Current Assets $714,991 $939,065 $1,122,374 $1,127,937 $1,228,847 $1,514,956 Cash & Cash Equivalents $40,351 $150,649 $201,546 $115,331 $191,767 $367,388 Inventory $623,390 $716,518 $841,491 $853,112 $938,091 $1,051,729 Accounts Receivable $20,540 $18,349 $25,292 $31,154 $29,122 $30,105 Total Assets $1,082,725 $1,377,990 $1,691,465 $1,741,215 $1,938,738 $2,358,591 Liabilities Cost of Goods Sold $2,243,384 $2,630,222 $2,918,801 $3,286,604 $3,852,591 $4,317,527 Current Liabilities $489,588 $626,684 $712,867 $711,561 $878,983 $1,083,257 Current Notes Payable n/a n/a n/a n/a $50,000 n/a Total Liabilities $538,270 $734,802 $938,905 $975,646 $1,102,566 $1,448,761 Working Capital $225,403 $312,381 $409,507 $416,376 $349,864 $431,699 Income Statement Sales $2,986,596 $3,531,349 $3,920,583 $4,239,990 $4,944,179 $5,570,210 Gross Profit $743,212 $901,127 $1,001,782 $953,386 $1,091,588 $1,252,683 Operating Income $257,757 $328,811 $373,423 $295,718 $325,444 $389,650 Net Income $155,045 $200,076 $227,574 $169,902 $199,632 $241,634 Equity $544,455 $643,188 $752,560 $765,569 $836,172 $909,830 NIBIT $257,757 $328,811 $373,423 $279,900 $325,444 $389,650 Interest Expense $3,332 $409 $825 $1,545 $2,543 $759 Operating Cash Flow $254,964 $354,715 $321,471 $298,157 $375,191 $506,867 2002 2003 2004 2005 2006 2007 Average Liquidity Ratios Current Ratio 1.46 1.50 1.57 1.59 1.40 1.40 1.49 Quick Asset Ratio 0.19 0.36 0.39 0.39 0.33 0.43 0.35 Cash Ratio 0.08 0.24 0.28 0.16 0.22 0.34 0.22 Inventory Turnover 3.60 3.67 3.47 3.85 4.11 4.11 3.80 Receivables Turnover 145.40 192.45 155.01 136.10 169.77 185.03 163.96 Working Capital Turnover 13.25 11.30 9.57 10.18 14.13 12.90 11.89 Profitability Analysis Gross Profit Margin 0.25 0.26 0.26 0.22 0.22 0.22 0.24 Operating Profit Margin 0.09 0.09 0.10 0.07 0.07 0.07 0.08 Net Profit Margin 0.05 0.06 0.06 0.04 0.04 0.04 0.05 Asset Turnover 3.26 2.85 2.51 2.84 2.87 2.87 Return on Assets 0.18 0.17 0.10 0.11 0.12 0.14 Return on Equity 0.37 0.35 0.23 0.26 0.29 0.30 Capital Structure Analysis Debt to Equity Ratio 0.99 1.14 1.25 1.27 1.32 1.59 1.26 Times Interest Earned 77.36 803.94 452.63 181.17 127.98 513.37 359.41 Debt Service Margin n/a n/a n/a n/a 7.50 n/a 7.50 365 Liquidity Ratios Days Supply of Inventory 101.43 99.43 105.23 94.74 88.88 88.91 96.44 Sales Growth Rate 18.24% 11.02% 8.15% 16.61% 12.66% 13.34%

136
Ross Stores, Inc. (Restated) All numbers except ratios stated in thousands
2002 2003 2004 2005 2006 2007 Assets Current Assets $714,991 $939,065 $1,122,374 $1,127,937 $1,228,847 $1,514,956 Cash & Cash Equivalents $40,351 $150,649 $201,546 $115,331 $191,767 $367,388 Inventory $623,390 $716,518 $841,491 $853,112 $938,091 $1,051,729 Accounts Receivable $20,540 $18,349 $25,292 $31,154 $29,122 $30,105 Total Assets $1,944,765 $2,368,241 $2,882,304 $2,821,580 $3,191,853 $3,736,031 Liabilities Cost of Goods Sold $2,243,384 $2,630,222 $2,918,801 $3,286,604 $3,852,591 $4,317,527 Current Liabilities $489,588 $626,684 $712,867 $711,561 $878,983 $1,083,257 Current Notes Payable $146,940 $185,868 $223,662 $227,910 $390,453 $298,326 Total Liabilities $1,400,310 $1,725,053 $2,129,744 $2,056,011 $2,355,681 $2,826,201 Working Capital $225,403 $312,381 $409,507 $416,376 $349,864 $431,699 Income Statement Sales $2,986,596 $3,531,349 $3,920,583 $4,239,990 $4,944,179 $5,570,210 Gross Profit $743,212 $901,127 $1,001,782 $953,386 $1,091,588 $1,252,683 Operating Income $348,406 $444,866 $513,488 $451,306 $624,168 $631,225 Net Income $174,101 $235,559 $270,093 $211,868 $280,539 $291,498 Equity $544,455 $643,188 $752,560 $765,569 $836,172 $909,830 NIBIT $348,406 $444,866 $513,488 $451,306 $624,168 $631,225 Interest Expense $33,245 $29,621 $36,312 $53,078 $86,126 $81,752 Operating Cash Flow $360,224 $489,223 $483,074 $448,160 $581,410 $694,475 2002 2003 2004 2005 2006 2007 Average Liquidity Ratios Current Ratio 1.46 1.50 1.57 1.59 1.40 1.40 1.49 Quick Asset Ratio 0.19 0.36 0.39 0.39 0.33 0.43 0.35 Cash Ratio 0.08 0.24 0.28 0.16 0.22 0.34 0.22 Inventory Turnover 3.60 3.67 3.47 3.85 4.11 4.11 3.80 Receivables Turnover 145.40 192.45 155.01 136.10 169.77 185.03 163.96 Working Capital Turnover 13.25 11.30 9.57 10.18 14.13 12.90 11.89 Profitability Analysis Gross Profit Margin 0.25 0.26 0.26 0.22 0.22 0.22 0.24 Operating Profit Margin 0.12 0.13 0.13 0.11 0.13 0.11 0.12 Net Profit Margin 0.06 0.07 0.07 0.05 0.06 0.05 0.06 Asset Turnover 1.82 1.66 1.47 1.75 1.75 1.69 Return on Assets 0.12 0.11 0.07 0.10 0.09 0.10 Return on Equity 0.43 0.42 0.28 0.37 0.35 0.37 Capital Structure Analysis Debt to Equity Ratio 2.57 2.68 2.83 2.69 2.82 3.11 2.78 Times Interest Earned 10.48 15.02 14.14 8.50 7.25 7.72 10.52 Debt Service Margin 2.45 2.63 2.16 1.97 1.49 2.33 2.17 365 Liquidity Ratios Days Supply of Receivables 2.51 1.90 2.35 2.68 2.15 1.97 2.26 Days Supply of Inventory 101.43 99.43 105.23 94.74 88.88 88.91 96.44 Sales Growth Rate 18.24% 11.02% 8.15% 16.61% 12.66% 13.34%

137
Kohl's Corp. All numbers except ratios stated in thousands 2002 2003 2004 2005 2006 2007 Assets Current Assets $2,464,044 $3,284,289 $3,024,896 $3,643,437 $4,266,553 $3,401,040 Cash & Cash Equivalents $106,722 $90,085 $112,748 $116,717 $126,839 $189,170 Inventory $1,198,307 $1,626,996 $1,606,990 $1,946,977 $2,237,568 $2,588,099 Accounts Receivable $835,946 $990,810 $1,150,157 $1,389,632 $1,652,065 $0 Total Assets $4,929,586 $6,315,698 $6,690,750 $7,979,299 $9,153,494 $9,041,177 Liabilities Cost of Goods Sold $4,923,527 $5,981,219 $6,887,033 $7,586,992 $8,639,278 $9,890,513 Current Liabilities $879,971 $1,508,187 $1,122,616 $1,456,058 $1,746,911 $1,918,658 Current Notes Payable $16,418 $355,464 $12,529 $3,464 $107,941 $18,841 Total Liabilities $2,138,180 $2,803,781 $2,542,241 $2,945,401 $3,196,156 $3,437,782 Working Capital $1,584,073 $1,776,102 $1,902,280 $2,187,379 $2,519,642 $1,482,382 Income Statement Sales $7,488,654 $9,120,287 $10,282,094 $11,700,619 $13,402,217 $15,544,184 Gross Profit $2,565,127 $3,139,068 $3,395,061 $4,113,627 $4,762,939 $5,653,671 Operating Income $789,861 $1,021,484 $951,444 $1,193,327 $1,416,181 $1,814,801 Net Income $458,423 $600,525 $546,463 $703,401 $841,960 $1,108,681 Equity $2,791,406 $3,511,917 $4,148,509 $5,033,898 $5,957,338 $5,603,395 NIBIT $789,861 $1,021,484 $951,444 $1,193,327 $1,416,181 $1,814,801 Interest Expense $50,111 $56,009 $72,931 $64,761 $73,925 $66,743 Operating Cash Flow $541,817 $669,583 $739,664 $937,095 $881,646 $3,099,378 2002 2003 2004 2005 2006 2007 Average Liquidity Ratios Current Ratio 2.80 2.18 2.69 2.50 2.44 1.77 2.40 Quick Asset Ratio 1.44 1.10 1.26 1.17 1.16 0.42 1.09 Cash Ratio 0.12 0.06 0.10 0.08 0.07 0.10 0.09 Inventory Turnover 4.11 3.68 4.29 3.90 3.86 3.82 3.94 Receivables Turnover 8.96 9.20 8.94 8.42 8.11 - 7.27 Working Capital Turnover 4.73 5.14 5.41 5.35 5.32 10.49 6.07 Profitability Analysis Gross Profit Margin 0.34 0.34 0.33 0.35 0.36 0.36 0.35 Operating Profit Margin 0.11 0.11 0.09 0.10 0.11 0.12 0.11 Net Profit Margin 0.06 0.07 0.05 0.06 0.06 0.07 0.06 Asset Turnover 1.85 1.63 1.75 1.68 1.70 1.72 Return on Assets 0.12 0.09 0.11 0.11 0.12 0.11 Return on Equity 0.22 0.16 0.17 0.17 0.19 0.18 Capital Structure Analysis Debt to Equity Ratio 0.77 0.80 0.61 0.59 0.54 0.61 0.65 Times Interest Earned 15.76 18.24 13.05 18.43 19.16 27.19 18.64 Debt Service Margin 33.00 1.88 59.04 270.52 8.17 164.50 89.52 365 Liquidity Ratios Days Supply of Inventory 88.84 99.29 85.17 93.67 94.53 95.51 92.83 Sales Growth Rate 21.79% 12.74% 13.80% 14.54% 15.98% 15.77%
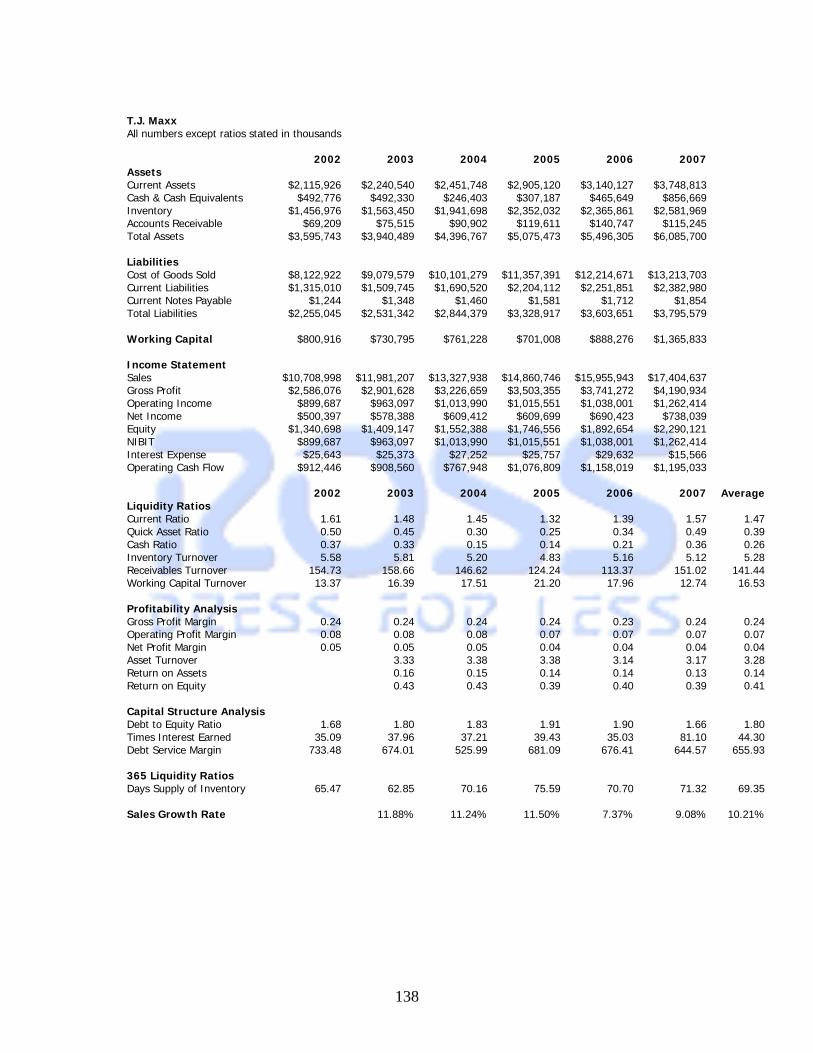
138
T.J. Maxx All numbers except ratios stated in thousands 2002 2003 2004 2005 2006 2007 Assets Current Assets $2,115,926 $2,240,540 $2,451,748 $2,905,120 $3,140,127 $3,748,813 Cash & Cash Equivalents $492,776 $492,330 $246,403 $307,187 $465,649 $856,669 Inventory $1,456,976 $1,563,450 $1,941,698 $2,352,032 $2,365,861 $2,581,969 Accounts Receivable $69,209 $75,515 $90,902 $119,611 $140,747 $115,245 Total Assets $3,595,743 $3,940,489 $4,396,767 $5,075,473 $5,496,305 $6,085,700 Liabilities Cost of Goods Sold $8,122,922 $9,079,579 $10,101,279 $11,357,391 $12,214,671 $13,213,703 Current Liabilities $1,315,010 $1,509,745 $1,690,520 $2,204,112 $2,251,851 $2,382,980 Current Notes Payable $1,244 $1,348 $1,460 $1,581 $1,712 $1,854 Total Liabilities $2,255,045 $2,531,342 $2,844,379 $3,328,917 $3,603,651 $3,795,579 Working Capital $800,916 $730,795 $761,228 $701,008 $888,276 $1,365,833 Income Statement Sales $10,708,998 $11,981,207 $13,327,938 $14,860,746 $15,955,943 $17,404,637 Gross Profit $2,586,076 $2,901,628 $3,226,659 $3,503,355 $3,741,272 $4,190,934 Operating Income $899,687 $963,097 $1,013,990 $1,015,551 $1,038,001 $1,262,414 Net Income $500,397 $578,388 $609,412 $609,699 $690,423 $738,039 Equity $1,340,698 $1,409,147 $1,552,388 $1,746,556 $1,892,654 $2,290,121 NIBIT $899,687 $963,097 $1,013,990 $1,015,551 $1,038,001 $1,262,414 Interest Expense $25,643 $25,373 $27,252 $25,757 $29,632 $15,566 Operating Cash Flow $912,446 $908,560 $767,948 $1,076,809 $1,158,019 $1,195,033 2002 2003 2004 2005 2006 2007 Average Liquidity Ratios Current Ratio 1.61 1.48 1.45 1.32 1.39 1.57 1.47 Quick Asset Ratio 0.50 0.45 0.30 0.25 0.34 0.49 0.39 Cash Ratio 0.37 0.33 0.15 0.14 0.21 0.36 0.26 Inventory Turnover 5.58 5.81 5.20 4.83 5.16 5.12 5.28 Receivables Turnover 154.73 158.66 146.62 124.24 113.37 151.02 141.44 Working Capital Turnover 13.37 16.39 17.51 21.20 17.96 12.74 16.53 Profitability Analysis Gross Profit Margin 0.24 0.24 0.24 0.24 0.23 0.24 0.24 Operating Profit Margin 0.08 0.08 0.08 0.07 0.07 0.07 0.07 Net Profit Margin 0.05 0.05 0.05 0.04 0.04 0.04 0.04 Asset Turnover 3.33 3.38 3.38 3.14 3.17 3.28 Return on Assets 0.16 0.15 0.14 0.14 0.13 0.14 Return on Equity 0.43 0.43 0.39 0.40 0.39 0.41 Capital Structure Analysis Debt to Equity Ratio 1.68 1.80 1.83 1.91 1.90 1.66 1.80 Times Interest Earned 35.09 37.96 37.21 39.43 35.03 81.10 44.30 Debt Service Margin 733.48 674.01 525.99 681.09 676.41 644.57 655.93 365 Liquidity Ratios Days Supply of Inventory 65.47 62.85 70.16 75.59 70.70 71.32 69.35 Sales Growth Rate 11.88% 11.24% 11.50% 7.37% 9.08% 10.21%

139
J.C. Penny All numbers except ratios stated in thousands 2002 2003 2004 2005 2006 2007 Assets Current Assets $8,677,000 $8,353,000 $6,513,000 $8,427,000 $6,702,000 $6,648,000 Cash & Cash Equivalents $2,841,000 $2,474,000 $2,994,000 $4,687,000 $3,016,000 $2,747,000 Inventory $4,930,000 $4,945,000 $3,156,000 $3,169,000 $3,210,000 $3,400,000 Accounts Receivable $698,000 $705,000 $233,000 $404,000 $270,000 $263,000 Total Assets $18,048,000 $17,867,000 $18,300,000 $14,127,000 $12,461,000 $12,673,000 Liabilities Cost of Goods Sold $22,789,000 $22,573,000 $11,166,000 $11,285,000 $11,405,000 $12,078,000 Current Liabilities $4,499,000 $4,159,000 $3,754,000 $3,447,000 $2,762,000 $3,492,000 Current Notes Payable $935,000 $283,000 $260,000 $481,000 $21,000 $434,000 Total Liabilities $11,919,000 $11,497,000 $12,875,000 $9,271,000 $8,454,000 $8,385,000 Working Capital $4,178,000 $4,194,000 $2,759,000 $4,980,000 $3,940,000 $3,156,000 Income Statement Sales $32,004,000 $32,347,000 $17,786,000 $18,424,000 $18,781,000 $19,903,000 Gross Profit $9,215,000 $9,774,000 $6,620,000 $7,139,000 $7,376,000 $7,825,000 Operating Income $756,000 $1,107,000 $790,000 $1,312,000 $1,577,000 $1,922,000 Net Income $98,000 $405,000 ($928,000) $524,000 $1,088,000 $1,153,000 Equity $6,129,000 $6,370,000 $5,425,000 $4,856,000 $4,007,000 $4,288,000 NIBIT ($199,000) $230,000 ($485,000) $1,110,000 $1,724,000 $1,941,000 Interest Expense ($386,000) ($388,000) $261,000 $233,000 $169,000 $130,000 Operating Cash Flow $987,000 $1,329,000 $812,000 $1,127,000 $1,337,000 $1,255,000 2002 2003 2004 2005 2006 2007 Average Liquidity Ratios Current Ratio 1.93 2.01 1.73 2.44 2.43 1.90 2.07 Quick Asset Ratio 0.83 0.82 0.89 1.53 1.26 0.93 1.04 Cash Ratio 0.63 0.59 0.80 1.36 1.09 0.79 0.88 Inventory Turnover 4.62 4.56 3.54 3.56 3.55 3.55 3.90 Receivables Turnover 45.85 45.88 76.33 45.60 69.56 75.68 59.82 Working Capital Turnover 7.66 7.71 6.45 3.70 4.77 6.31 6.10 Profitability Analysis Gross Profit Margin 0.29 0.30 0.37 0.39 0.39 0.39 0.36 Operating Profit Margin 0.02 0.03 0.04 0.07 0.08 0.10 0.06 Net Profit Margin 0.00 0.01 (0.05) 0.03 0.06 0.06 0.02 Asset Turnover 1.79 1.00 1.01 1.33 1.60 1.34 Return on Assets 0.02 (0.05) 0.03 0.08 0.09 0.03 Return on Equity 0.07 (0.15) 0.10 0.22 0.29 0.11 Capital Structure Analysis Debt to Equity Ratio 1.94 1.80 2.37 1.91 2.11 1.96 2.02 Times Interest Earned 0.52 (0.59) (1.86) 4.76 10.20 14.93 4.66 Debt Service Margin 1.06 4.70 3.12 2.34 63.67 2.89 12.96 365 Liquidity Ratios Days Supply of Inventory 78.96 79.96 103.16 102.50 102.73 102.75 95.01 Sales Growth Rate 1.07% -45.01% 3.59% 1.94% 5.97% 3.14%

140
Industry Ratio Averages 2002 2003 2004 2005 2006 2007 Average Liquidity Ratios Current Ratio 1.95 1.79 1.86 1.96 1.92 1.66 1.86 Quick Asset Ratio 0.74 0.68 0.71 0.83 0.78 0.57 0.72 Cash Ratio 0.30 0.31 0.33 0.44 0.40 0.40 0.36 Cash Ratio Excluding J.C. Penney 0.19 0.21 0.18 0.13 0.17 0.27 0.19 Inventory Turnover 4.48 4.43 4.12 4.03 4.17 4.15 4.23 Receivables Turnover 88.74 101.55 96.73 78.59 90.20 102.93 93.12 Working Capital Turnover 9.75 10.14 9.73 10.11 10.55 10.61 10.15 Profitability Analysis Gross Profit Margin 0.28 0.29 0.30 0.30 0.30 0.31 0.30 Operating Profit Margin 0.07 0.08 0.08 0.08 0.08 0.09 0.08 Net Profit Margin 0.04 0.05 0.03 0.04 0.05 0.05 0.04 Asset Turnover 2.56 2.21 2.16 2.25 2.33 2.30 Return on Assets 0.12 0.09 0.09 0.11 0.12 0.11 Return on Equity 0.27 0.20 0.22 0.26 0.29 0.25 Capital Structure Analysis Debt to Equity Ratio 1.35 1.39 1.52 1.42 1.47 1.45 1.43 Times Interest Earned 32.18 214.89 125.26 60.95 48.09 159.15 106.75 Debt Service Margin 255.84 226.86 196.05 317.99 188.94 270.65 242.72 365 Liquidity Ratios Days Supply of Inventory 83.67 85.38 90.93 91.62 89.21 89.62 88.41 Sales Growth Rate 13.24% 11.67% 9.26% 10.11% 10.92% 11.04% Relative Market Share Total Industry Sales $ 53,188,248 $ 56,979,843 $ 45,316,615 $ 49,225,355 $ 53,083,339 $ 58,422,031 Ross Stores, Inc 5.62% 6.20% 8.65% 8.61% 9.31% 9.53% 7.99% Kohl's Corporation 14.08% 16.01% 22.69% 23.77% 25.25% 26.61% 21.40% T.J. Maxx 20.13% 21.03% 29.41% 30.19% 30.06% 29.79% 26.77% J.C. Penney 60.17% 56.77% 39.25% 37.43% 35.38% 34.07% 43.84% 100.00%

141
Altman Z-Scores Model 2002 2003 2004 2005 2006 2007 2002 2003 2004 2005 2006 2007 Ross Stores, Inc. Coefficient Ratios Ratios Ratios Ratios Ratios Ratios Score Score Score Score Score Score Net Working Capital/Total Assets 1.2 0.21 0.23 0.24 0.24 0.18 0.18 0.25 0.27 0.29 0.29 0.22 0.22 Retained Earnings/Total Assets 1.4 0.23 0.22 0.22 0.20 0.19 0.16 0.33 0.31 0.31 0.28 0.26 0.23 EBIT/Total Assets 3.3 0.24 0.24 0.22 0.16 0.17 0.17 0.79 0.79 0.73 0.53 0.55 0.55 Market Value of Equity/Book Value of Liabilities 0.6 5.25 3.59 4.35 3.70 3.79 3.18 3.15 2.15 2.61 2.22 2.27 1.91 Sales/Total Assets 1.0 2.76 2.56 2.32 2.44 2.55 2.36 2.76 2.56 2.32 2.44 2.55 2.36 Total Score 7.27 6.08 6.25 5.76 5.85 5.26 Model 2002 2003 2004 2005 2006 2007 2002 2003 2004 2005 2006 2007 Ross Stores, Inc. (Restated) Coefficient Ratios Ratios Ratios Ratios Ratios Ratios Score Score Score Score Score Score Net Working Capital/Total Assets 1.2 0.12 0.13 0.14 0.15 0.11 0.12 0.14 0.16 0.17 0.18 0.13 0.14 Retained Earnings/Total Assets 1.4 0.13 0.13 0.13 0.12 0.11 0.10 0.18 0.18 0.18 0.17 0.16 0.14 EBIT/Total Assets 3.3 0.18 0.19 0.18 0.16 0.20 0.17 0.59 0.62 0.59 0.53 0.65 0.56 Market Value of Equity/Book Value of Liabilities 0.6 2.02 1.53 1.92 1.76 1.77 1.63 1.21 0.92 1.15 1.05 1.06 0.98 Sales/Total Assets 1.0 1.54 1.49 1.36 1.50 1.55 1.49 1.54 1.49 1.36 1.50 1.55 1.49 Total Score 3.66 3.36 3.45 3.44 3.55 3.31 Model 2002 2003 2004 2005 2006 2007 2002 2003 2004 2005 2006 2007 Kohl's Corp. Coefficient Ratios Ratios Ratios Ratios Ratios Ratios Score Score Score Score Score Score Net Working Capital/Total Assets 1.2 0.32 0.28 0.28 0.27 0.28 0.16 0.39 0.34 0.34 0.33 0.33 0.20 Retained Earnings/Total Assets 1.4 0.36 0.38 0.44 0.44 0.48 0.61 0.51 0.54 0.62 0.62 0.67 0.85 EBIT/Total Assets 3.3 0.16 0.16 0.14 0.15 0.15 0.20 0.53 0.53 0.47 0.49 0.51 0.66 Market Value of Equity/Book Value of Liabilities 0.6 11.07 6.51 5.28 5.19 5.61 6.92 6.64 3.90 3.17 3.11 3.37 4.15 Sales/Total Assets 1.0 1.52 1.44 1.54 1.47 1.46 1.72 1.52 1.44 1.54 1.47 1.46 1.72 Total Score 9.58 6.76 6.14 6.02 6.34 7.58 Model 2002 2003 2004 2005 2006 2007 2002 2003 2004 2005 2006 2007 T.J. Maxx Coefficient Ratios Ratios Ratios Ratios Ratios Ratios Score Score Score Score Score Score Net Working Capital/Total Assets 1.2 0.22 0.19 0.17 0.14 0.16 0.22 0.27 0.22 0.21 0.17 0.19 0.27 Retained Earnings/Total Assets 1.4 0.30 0.23 0.25 0.25 0.27 0.31 0.42 0.32 0.34 0.36 0.38 0.43 EBIT/Total Assets 3.3 0.25 0.24 0.23 0.20 0.19 0.21 0.83 0.81 0.76 0.66 0.62 0.68 Market Value of Equity/Book Value of Liabilities 0.6 4.38 3.45 3.92 3.09 3.04 3.33 2.63 2.07 2.35 1.85 1.82 2.00 Sales/Total Assets 1.0 2.98 3.04 3.03 2.93 2.90 2.86 2.98 3.04 3.03 2.93 2.90 2.86 Total Score 7.12 6.46 6.69 5.96 5.92 6.24 Model 2002 2003 2004 2005 2006 2007 2002 2003 2004 2005 2006 2007 J.C. Penney Coefficient Ratios Ratios Ratios Ratios Ratios Ratios Score Score Score Score Score Score Net Working Capital/Total Assets 1.2 0.23 0.23 0.15 0.35 0.32 0.25 0.28 0.28 0.18 0.42 0.38 0.30 Retained Earnings/Total Assets 1.4 0.14 0.16 0.09 0.06 0.04 0.07 0.20 0.22 0.13 0.08 0.06 0.10 EBIT/Total Assets 3.3 (0.01) 0.01 (0.03) 0.08 0.14 0.15 (0.04) 0.04 (0.09) 0.26 0.46 0.51 Market Value of Equity/Book Value of Liabilities 0.6 0.41 0.34 0.59 1.15 1.75 2.13 0.25 0.20 0.36 0.69 1.05 1.28 Sales/Total Assets 1.0 1.77 1.81 0.97 1.30 1.51 1.57 1.77 1.81 0.97 1.30 1.51 1.57 Total Score 2.46 2.56 1.55 2.76 3.45 3.75
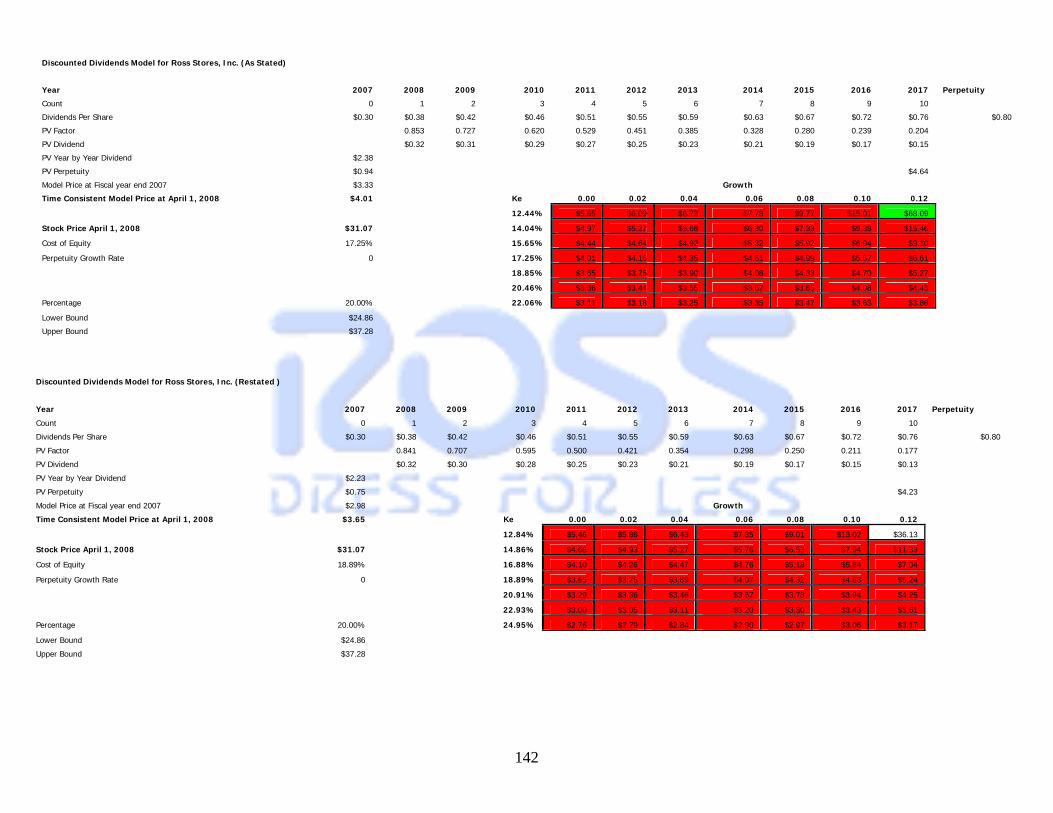
142
Discounted Dividends Model for Ross Stores, Inc. (Restated )
Year 2007 2008 2009 2010 2011 2012 2013 2014 2015 2016 2017 Perpetuity
Count 0 1 2 3 4 5 6 7 8 9 10
Dividends Per Share $0.30 $0.38 $0.42 $0.46 $0.51 $0.55 $0.59 $0.63 $0.67 $0.72 $0.76 $0.80
PV Factor 0.841 0.707 0.595 0.500 0.421 0.354 0.298 0.250 0.211 0.177
PV Dividend $0.32 $0.30 $0.28 $0.25 $0.23 $0.21 $0.19 $0.17 $0.15 $0.13
PV Year by Year Dividend $2.23
PV Perpetuity $0.75 $4.23
Model Price at Fiscal year end 2007 $2.98 Growth
Time Consistent Model Price at April 1, 2008 $3.65 Ke 0.00 0.02 0.04 0.06 0.08 0.10 0.12
12.84% $5.46 $5.86 $6.43 $7.35 $9.01 $13.02 $36.13
Stock Price April 1, 2008 $31.07 14.86% $4.68 $4.93 $5.27 $5.76 $6.53 $7.94 $11.33
Cost of Equity 18.89% 16.88% $4.10 $4.26 $4.47 $4.76 $5.18 $5.84 $7.04
Perpetuity Growth Rate 0 18.89% $3.65 $3.75 $3.89 $4.07 $4.32 $4.68 $5.24
20.91% $3.29 $3.36 $3.46 $3.57 $3.73 $3.94 $4.25
22.93% $3.00 $3.05 $3.11 $3.20 $3.30 $3.43 $3.61
Percentage 20.00% 24.95% $2.76 $2.79 $2.84 $2.90 $2.97 $3.06 $3.17
Lower Bound $24.86
Upper Bound $37.28
Discounted Dividends Model for Ross Stores, Inc. (As Stated)
Year 2007 2008 2009 2010 2011 2012 2013 2014 2015 2016 2017 Perpetuity
Count 0 1 2 3 4 5 6 7 8 9 10
Dividends Per Share $0.30 $0.38 $0.42 $0.46 $0.51 $0.55 $0.59 $0.63 $0.67 $0.72 $0.76 $0.80
PV Factor 0.853 0.727 0.620 0.529 0.451 0.385 0.328 0.280 0.239 0.204
PV Dividend $0.32 $0.31 $0.29 $0.27 $0.25 $0.23 $0.21 $0.19 $0.17 $0.15
PV Year by Year Dividend $2.38
PV Perpetuity $0.94 $4.64
Model Price at Fiscal year end 2007 $3.33 Growth
Time Consistent Model Price at April 1, 2008 $4.01 Ke 0.00 0.02 0.04 0.06 0.08 0.10 0.12
12.44% $5.65 $6.09 $6.73 $7.78 $9.77 $15.01 $68.09
Stock Price April 1, 2008 $31.07 14.04% $4.97 $5.27 $5.68 $6.30 $7.33 $9.39 $15.46
Cost of Equity 17.25% 15.65% $4.44 $4.64 $4.92 $5.32 $5.92 $6.94 $9.10
Perpetuity Growth Rate 0 17.25% $4.01 $4.16 $4.35 $4.61 $4.99 $5.57 $6.61
18.85% $3.65 $3.76 $3.90 $4.08 $4.33 $4.70 $5.27
20.46% $3.36 $3.44 $3.55 $3.67 $3.85 $4.08 $4.43
Percentage 20.00% 22.06% $3.11 $3.18 $3.25 $3.35 $3.47 $3.63 $3.86
Lower Bound $24.86
Upper Bound $37.28

143
Discounted Free Cash Flows Model for Ross Stores, Inc. (Restated) Year 2007 2008 2009 2010 2011 2012 2013 2014 2015 2016 2017 Perpetuity Count 0 1 2 3 4 5 6 7 8 9 10 Cash Flows from Operations $694,475 $859,575 $947,768 $1,045,009 $1,152,227 $1,270,445 $1,400,793 $1,544,514 $1,702,981 $1,877,707 $2,070,360 Cash Flows from Investing ($235,941) ($875,908) ($317,750) ($350,352) ($386,298) ($425,932) ($469,632) ($517,817) ($570,945) ($629,524) ($694,113) Free Cash Flows $458,534 ($16,332) $630,017 $694,657 $765,929 $844,513 $931,160 $1,026,697 $1,132,037 $1,248,183 $1,376,247 $1,517,450 Free Cash Flows Growth Rate -103.56% -3957.50% 10.26% 10.26% 10.26% 10.26% 10.26% 10.26% 10.26% 10.26% PV Factor 0.882 0.777 0.685 0.604 0.533 0.470 0.414 0.365 0.322 0.284 PV of Year by Year Free Cash Flows ($14,401) $489,797 $476,174 $462,930 $450,055 $437,537 $425,368 $413,537 $402,035 $390,854 PV of Total Free Cash Flows $3,933,887 PV of Perpetuity $6,718,546 $23,656,891 Implied Market Value of Assets $10,652,433 Implied Value of Equity $7,826,232 Model Price at Fiscal year end 2007 $56.29 Growth Time Consistent Model Price at April 1, 2008 $65.20 WACC 0.07 0.08 0.09 0.10 0.11 0.12 0.13 9.91% $177.85 $262.72 $533.24 ($5,517.60) ($420.87) ($211.71) ($138.12) Stock Price April 1, 2008 $31.07 11.08% $118.89 $153.19 $220.47 $412.22 $5,333.97 ($456.28) ($211.63) Weighted Average Cost of Capital 13.41% 12.25% $86.10 $103.75 $132.26 $186.14 $326.40 $1,598.92 ($511.77) Perpetuity Growth Rate 0.07 13.41% $65.20 $75.54 $90.56 $114.38 $157.93 $263.06 $875.58 Total Shares Outstanding 139,023 14.58% $50.69 $57.27 $66.20 $79.03 $99.02 $134.50 $214.88 Book Value of Liabilities $2,826,201 15.75% $40.02 $44.44 $50.18 $57.91 $68.90 $85.76 $114.88 16.91% $31.82 $34.93 $38.82 $43.83 $50.54 $59.99 $74.26 Percentage 20.00% Lower Bound $24.86 Upper Bound $37.28
Discounted Free Cash Flows Model for Ross Stores, Inc. (As Stated) Year 2007 2008 2009 2010 2011 2012 2013 2014 2015 2016 2017 Perpetuity Count 0 1 2 3 4 5 6 7 8 9 10 Cash Flows from Operations $506,867 $465,544 $513,309 $565,974 $624,043 $688,070 $758,666 $836,505 $922,331 $1,016,962 $1,121,302 Cash Flows from Investing ($235,941) ($303,310) ($117,677) ($129,750) ($143,063) ($157,741) ($173,925) ($191,770) ($211,445) ($233,139) ($257,060) Free Cash Flows $270,926 $162,234 $395,632 $436,224 $480,981 $530,329 $584,741 $644,735 $710,885 $783,822 $864,242 $952,914 Free Cash Flows Growth Rate -40.12% 143.87% 10.26% 10.26% 10.26% 10.26% 10.26% 10.26% 10.26% 10.26% PV Factor 0.876 0.767 0.672 0.589 0.516 0.452 0.396 0.346 0.303 0.266 PV of Year by Year Free Cash Flows $142,101 $303,530 $293,139 $283,104 $273,413 $264,054 $255,014 $246,285 $237,854 $229,712 PV of Total Free Cash Flows $2,528,205 PV of Perpetuity $3,533,368 $13,293,568 Implied Market Value of Assets $6,061,573 Implied Value of Equity $4,612,812 Model Price at Fiscal year end 2007 $33.18 Growth Time Consistent Model Price at April 1, 2008 $38.73 WACC 0.07 0.08 0.09 0.10 0.11 0.12 0.13 10.67% $88.97 $117.57 $180.47 $431.61 ($831.19) ($197.57) ($107.41) Stock Price April 1, 2008 $31.07 11.83% $64.16 $77.92 $101.39 $150.45 $317.03 ($1,534.28) ($207.65) Weighted Average Cost of Capital 14.17% 13.00% $48.98 $56.74 $68.37 $87.75 $126.51 $242.66 $148,918.22 Perpetuity Growth Rate 0.07 14.17% $38.73 $43.54 $50.21 $60.08 $76.18 $107.13 $191.08 Total Shares Outstanding 139,023 15.33% $31.33 $34.51 $38.69 $44.45 $52.85 $66.30 $91.26 Book Value of Liabilities $1,448,761 16.50% $25.74 $27.94 $30.73 $34.37 $39.35 $46.53 $57.81 17.67% $21.35 $22.93 $24.87 $27.32 $30.51 $34.82 $40.97 Percentage 20.00% Lower Bound $24.86 Upper Bound $37.28

144
Residual Income Model for Ross Stores, Inc. (As Stated) Year 2007 2008 2009 2010 2011 2012 2013 2014 2015 2016 2017 Perpetuity Count 0 1 2 3 4 5 6 7 8 9 10 Net Income $254,396 $280,497 $309,276 $341,007 $375,995 $414,572 $457,107 $504,006 $555,717 $612,733 Dividend Payment ($52,829) ($58,668) ($64,507) ($70,346) ($76,185) ($82,024) ($87,863) ($93,702) ($99,540) ($105,379) Book Value of Equity $909,830 $1,111,397 $1,333,226 $1,577,995 $1,848,656 $2,148,466 $2,481,014 $2,850,258 $3,260,562 $3,716,739 $4,224,092 Benchmark Earnings $156,937 $191,706 $229,969 $272,190 $318,876 $370,591 $427,952 $491,643 $562,417 $641,103 Residual Income $97,458 $88,791 $79,306 $68,818 $57,118 $43,981 $29,154 $12,362 ($6,700) ($28,370) ($31,400) PV Factor 0.853 0.727 0.620 0.529 0.451 0.385 0.328 0.280 0.239 0.204 Year by Year PV of RI $83,121 $64,588 $49,202 $36,413 $25,777 $16,928 $9,571 $3,461 ($1,600) ($5,778) Total Year by Year PV of RI $281,682 Terminal Value of Perpetuity ($37,073) ($182,036) Market Value of Equity $1,154,438 Model Price at Fiscal year end 2007 $8.30 Growth Time Consistent Model Price at April 1, 2008 $10.00 Ke 0.00 (0.10) (0.20) (0.30) (0.40) (0.50) 12.44% $17.28 $15.89 $15.35 $15.07 $14.90 $14.78 Stock Price April 1, 2008 $31.07 14.04% $14.17 $13.56 $13.31 $13.17 $13.08 $13.02 Cost of Equity 17.25% 15.65% $11.81 $11.67 $11.60 $11.56 $11.54 $11.52 Perpetuity Growth Rate 0 17.25% $10.00 $10.12 $10.17 $10.20 $10.22 $10.24 Total Shares Outstanding 139,023 18.85% $8.57 $8.84 $8.97 $9.04 $9.09 $9.13 20.46% $7.43 $7.77 $7.95 $8.05 $8.12 $8.17 Percentage 20.00% 22.06% $6.51 $6.88 $7.08 $7.20 $7.29 $7.34 Lower Bound $24.86 Upper Bound $37.28 Change in Residual Income ($8,667) ($9,485) ($10,489) ($11,699) ($13,137) ($14,826) ($16,792) ($19,063) ($21,670) Abnormal Earnings Growth ($8,667) ($9,485) ($10,489) ($11,699) ($13,137) ($14,826) ($16,792) ($19,063) ($21,670) Residual Income Ke 2008 2009 2010 2011 2012 2013 2014 2015 2016 2017 Perpetuity 12.44% $141,223 $142,252 $143,438 $144,723 $146,043 $147,327 $148,497 $149,467 $150,141 $150,414 $152,376 14.04% $126,635 $124,431 $122,061 $119,421 $116,402 $112,879 $108,716 $103,765 $97,860 $90,819 $91,117 15.65% $112,047 $106,611 $100,683 $94,119 $86,760 $78,430 $68,935 $58,064 $45,580 $31,225 $29,859 17.25% $97,458 $88,791 $79,306 $68,818 $57,118 $43,981 $29,154 $12,362 ($6,700) ($28,370) ($31,400) 18.85% $82,870 $70,970 $57,929 $43,516 $27,477 $9,532 ($10,627) ($33,339) ($58,981) ($87,965) ($92,658) 20.46% $68,281 $53,150 $36,552 $18,214 ($2,165) ($24,917) ($50,408) ($79,041) ($111,261) ($147,560) ($153,916) 22.06% $53,693 $35,330 $15,175 ($7,088) ($31,807) ($59,366) ($90,189) ($124,742) ($163,542) ($207,155) ($215,175)

145
Residual Income Model for Ross Stores, Inc. (Restated) Year 2007 2008 2009 2010 2011 2012 2013 2014 2015 2016 2017 Perpetuity Count 0 1 2 3 4 5 6 7 8 9 10 Net Income $325,597 $359,003 $395,837 $436,449 $481,229 $530,603 $585,043 $645,069 $711,253 $784,227 Dividend Payment ($52,829) ($58,668) ($64,507) ($70,346) ($76,185) ($82,024) ($87,863) ($93,702) ($99,540) ($105,379) Book Value of Equity $909,830 $1,182,598 $1,482,933 $1,814,263 $2,180,367 $2,585,412 $3,033,991 $3,531,172 $4,082,539 $4,694,252 $5,373,099 Benchmark Earnings $171,910 $223,449 $280,197 $342,801 $411,975 $488,508 $573,266 $667,207 $771,387 $886,968 Residual Income $153,686 $135,554 $115,640 $93,649 $69,254 $42,096 $11,777 ($22,138) ($60,134) ($102,741) ($110,980) PV Factor 0.841 0.707 0.595 0.500 0.421 0.354 0.298 0.250 0.211 0.177 Year by Year PV of RI $129,263 $95,893 $68,805 $46,865 $29,149 $14,903 $3,507 ($5,544) ($12,666) ($18,202) Total Year by Year PV of RI $351,971 Terminal Value of Perpetuity ($104,058) ($587,357) Market Value of Equity $1,157,744 Model Price at Fiscal year end 2007 $8.33 Growth Time Consistent Model Price at April 1, 2008 $10.19 Ke 0.00 (0.10) (0.20) (0.30) (0.40) (0.50) 12.84% $20.13 $18.59 $17.99 $17.67 $17.47 $17.33 Stock Price April 1, 2008 $31.07 14.86% $15.67 $15.19 $14.98 $14.87 $14.79 $14.74 Cost of Equity 18.89% 16.88% $12.51 $12.56 $12.58 $12.60 $12.61 $12.61 Perpetuity Growth Rate 0 18.89% $10.19 $10.51 $10.66 $10.75 $10.81 $10.86 Total Shares Outstanding 139,023 20.91% $8.45 $8.89 $9.11 $9.24 $9.33 $9.40 22.93% $7.12 $7.59 $7.84 $8.00 $8.11 $8.18 Percentage 20.00% 24.95% $6.08 $6.55 $6.81 $6.97 $7.08 $7.17 Lower Bound $24.86 Upper Bound $37.28 Change in Residual Income ($18,133) ($19,914) ($21,991) ($24,395) ($27,158) ($30,318) ($33,916) ($37,996) ($42,607) Abnormal Earnings Growth ($18,133) ($19,914) ($21,991) ($24,395) ($27,158) ($30,318) ($33,916) ($37,996) ($42,607) Residual Income Ke 2008 2009 2010 2011 2012 2013 2014 2015 2016 2017 Perpetuity 12.84% $208,786 $207,172 $205,446 $203,520 $201,297 $198,668 $195,516 $191,709 $187,105 $181,543 $182,043 14.86% $190,419 $183,299 $175,511 $166,896 $157,282 $146,477 $134,270 $120,427 $104,692 $86,781 $84,369 16.88% $172,053 $159,426 $145,575 $130,272 $113,268 $94,286 $73,024 $49,144 $22,279 ($7,980) ($13,305) 18.89% $153,686 $135,554 $115,640 $93,649 $69,254 $42,096 $11,777 ($22,138) ($60,134) ($102,741) ($110,980) 20.91% $135,320 $111,681 $85,704 $57,025 $25,239 ($10,095) ($49,469) ($93,421) ($142,547) ($197,502) ($208,654) 22.93% $116,954 $87,808 $55,769 $20,401 ($18,775) ($62,286) ($110,715) ($164,703) ($224,959) ($292,263) ($306,329) 24.95% $98,587 $63,936 $25,833 ($16,223) ($62,789) ($114,477) ($171,961) ($235,986) ($307,372) ($387,025) ($404,003)

146
Abnormal Earnings Growth Model for Ross Stores, Inc. (As Stated) Year 2007 2008 2009 2010 2011 2012 2013 2014 2015 2016 2017 Perpetuity Count 0 1 2 3 4 5 6 7 8 9 10 Net Income $254,396 $280,497 $309,276 $341,007 $375,995 $414,572 $457,107 $504,006 $555,717 $612,733 Dividend Payment ($52,829) ($58,668) ($64,507) ($70,346) ($76,185) ($82,024) ($87,863) ($93,702) ($99,540) ($105,379) Earnings on Reinvested Dividends $9,112 $10,120 $11,127 $12,134 $13,141 $14,148 $15,155 $16,163 $17,170 Cumulative Earnings $289,609 $319,395 $352,134 $388,129 $427,713 $471,255 $519,161 $571,879 $629,903 Benchmark Earnings $298,277 $328,880 $362,623 $399,828 $440,850 $486,081 $535,953 $590,942 $651,573 Abnormal Earnings Growth ($8,667) ($9,485) ($10,489) ($11,699) ($13,137) ($14,826) ($16,792) ($19,063) ($21,670) ($24,883) Percentage Change in AEG -9.43% -10.59% -11.54% -12.29% -12.86% -13.26% -13.52% -13.68% -14.15% Present Value Factor 0.853 0.727 0.620 0.529 0.451 0.385 0.328 0.280 0.239 Year by Year PV of AEG ($7,392) ($6,899) ($6,507) ($6,190) ($5,929) ($5,707) ($5,512) ($5,337) ($5,174) Total Year by Year PV of AEG ($54,649) Present Value of Terminal Perpetuity ($29,380) ($144,259) Average Adjusted Perpetuity Value $170,367 Market Value of Equity $987,688 Growth Model Price at Fiscal year end 2007 $7.10 Ke 0.00 (0.10) (0.20) (0.30) (0.40) (0.50) Time Consistent Model Price at April 1, 2008 $8.55 12.44% $17.32 $17.28 $17.27 $17.26 $17.26 $17.26 14.04% $13.19 $13.60 $13.76 $13.85 $13.91 $13.95 Stock Price April 1, 2008 $31.07 15.65% $10.48 $11.01 $11.24 $11.37 $11.45 $11.51 Cost of Equity 17.25% 17.25% $8.56 $9.10 $9.35 $9.49 $9.59 $9.65 Perpetuity Growth Rate 0 18.85% $7.16 $7.66 $7.91 $8.05 $8.15 $8.21 Total Shares Outstanding 139,023 20.46% $6.11 $6.56 $6.78 $6.92 $7.01 $7.08 22.06% $5.30 $5.69 $5.90 $6.02 $6.11 $6.17 Percentage 20.00% Lower Bound $24.86 Upper Bound $37.28 Change in Residual Income ($8,667) ($9,485) ($10,489) ($11,699) ($13,137) ($14,826) ($16,792) ($19,063) ($21,670) Abnormal Earnings Growth ($8,667) ($9,485) ($10,489) ($11,699) ($13,137) ($14,826) ($16,792) ($19,063) ($21,670) Change in AEG Ke 2010 2011 2012 2013 2014 2015 2016 2017 Perpetuity 12.44% 15.32% 8.37% 2.72% -2.73% -8.90% -17.14% -30.49% -59.41% -64.22% 14.04% -7.59% -11.33% -14.41% -16.67% -18.14% -18.95% -19.27% -19.24% -20.33% 15.65% -9.05% -10.74% -12.12% -13.19% -13.97% -14.51% -14.83% -14.99% -15.64% 17.25% -9.43% -10.59% -11.54% -12.29% -12.86% -13.26% -13.52% -13.68% -14.15% 18.85% -9.60% -10.52% -11.28% -11.88% -12.34% -12.67% -12.90% -13.04% -13.42% 20.46% -9.69% -10.48% -11.13% -11.64% -12.04% -12.33% -12.53% -12.66% -12.99% 22.06% -9.76% -10.46% -11.03% -11.49% -11.84% -12.10% -12.29% -12.41% -12.71%

147
Abnormal Earnings Growth Model for Ross Stores, Inc. (Restated) Year 2007 2008 2009 2010 2011 2012 2013 2014 2015 2016 2017 Perpetuity Count 0 1 2 3 4 5 6 7 8 9 10 Net Income $325,597 $359,003 $395,837 $436,449 $481,229 $530,603 $585,043 $645,069 $711,253 $784,227 Dividend Payment ($52,829) ($58,668) ($64,507) ($70,346) ($76,185) ($82,024) ($87,863) ($93,702) ($99,540) ($105,379) Earnings on Reinvested Dividends $9,982 $11,085 $12,188 $13,292 $14,395 $15,498 $16,601 $17,705 $18,808 Cumulative Earnings $368,985 $406,922 $448,638 $494,521 $544,998 $600,541 $661,670 $728,957 $803,035 Benchmark Earnings $387,117 $426,836 $470,629 $518,916 $572,156 $630,860 $695,586 $766,953 $845,642 Abnormal Earnings Growth ($18,133) ($19,914) ($21,991) ($24,395) ($27,158) ($30,318) ($33,916) ($37,996) ($42,607) ($48,033) Percentage Change in AEG -9.82% -10.43% -10.93% -11.33% -11.64% -11.87% -12.03% -12.14% -12.40% Present Value Factor 0.841 0.707 0.595 0.500 0.421 0.354 0.298 0.250 0.211 Year by Year PV of AEG ($15,251) ($14,087) ($13,085) ($12,208) ($11,431) ($10,733) ($10,099) ($9,515) ($8,975) Total Year by Year PV of AEG ($105,384) Present Value of Terminal Perpetuity ($45,037) ($254,214) Average Adjusted Perpetuity Value $175,175 Market Value of Equity $927,110 Growth Model Price at Fiscal year end 2007 $6.67 Ke 0.00 (0.10) (0.20) (0.30) (0.40) (0.50) Time Consistent Model Price at April 1, 2008 $8.16 12.84% $19.10 $19.54 $19.72 $19.81 $19.87 $19.91 14.86% $13.74 $14.53 $14.87 $15.05 $15.17 $15.25 Stock Price April 1, 2008 $31.07 16.88% $10.39 $11.20 $11.57 $11.78 $11.92 $12.01 Cost of Equity 18.89% 18.89% $8.17 $8.89 $9.24 $9.45 $9.59 $9.69 Perpetuity Growth Rate 0 20.91% $6.63 $7.24 $7.56 $7.75 $7.87 $7.97 Total Shares Outstanding 139,023 22.93% $5.53 $6.03 $6.30 $6.47 $6.59 $6.67 24.95% $4.71 $5.12 $5.35 $5.50 $5.60 $5.67 Percentage 20.00% Lower Bound $24.86 Upper Bound $37.28 Change in Residual Income ($18,133) ($19,914) ($21,991) ($24,395) ($27,158) ($30,318) ($33,916) ($37,996) ($42,607) Abnormal Earnings Growth ($18,133) ($19,914) ($21,991) ($24,395) ($27,158) ($30,318) ($33,916) ($37,996) ($42,607) Change in AEG Ke 2010 2011 2012 2013 2014 2015 2016 2017 Perpetuity 12.84% -6.93% -11.60% -15.46% -18.22% -19.92% -20.75% -20.97% -20.78% -21.98% 14.86% -9.39% -10.60% -11.60% -12.39% -12.98% -13.40% -13.67% -13.82% -14.32% 16.88% -9.70% -10.48% -11.12% -11.63% -12.02% -12.31% -12.50% -12.63% -12.97% 18.89% -9.82% -10.43% -10.93% -11.33% -11.64% -11.87% -12.03% -12.14% -12.40% 20.91% -9.89% -10.41% -10.83% -11.17% -11.43% -11.63% -11.77% -11.87% -12.10% 22.93% -9.93% -10.39% -10.77% -11.07% -11.30% -11.48% -11.61% -11.70% -11.90% 24.95% -9.96% -10.38% -10.72% -11.00% -11.21% -11.38% -11.50% -11.58% -11.77%

148
Long Run Residual Income Perpetuity Model for Ross Stores, Inc. (As Stated) Growth Initial Book Value of Equity $909,830 Ke 0.0826 0.0926 0.1026 0.1126 0.1226 Return on Equity 0.30 12.44% $39.04 $48.96 $67.98 $119.29 $744.34 Cost of Equity (Ke) 17.25% Constant Return on Equity 14.84% $25.40 $28.57 $33.12 $40.22 $52.80 Forward Earnings Growth Rate 0.1026 0.30 17.25% $19.06 $20.46 $22.26 $24.66 $28.02 19.65% $15.39 $16.10 $16.95 $18.01 $19.36 Market Value of Equity $2,569,727 22.06% $13.01 $13.38 $13.82 $14.33 $14.95 Number of Shares 139,023 Model Price at Fiscal year end 2007 $18.48 Return on Equity Time Consistent Model Price at April 1, 2008 $22.26 Ke 0.28 0.29 0.30 0.31 0.32 12.44% $61.09 $64.54 $67.98 $71.43 $74.87 Stock Price at April 1, 2008 $31.07 Constant Growth Rate 14.84% $29.77 $31.44 $33.12 $34.80 $36.48 0.1026 17.25% $20.00 $21.13 $22.26 $23.38 $24.51 Percentage 20.00% 19.65% $15.24 $16.10 $16.95 $17.81 $18.67 Lower Bound $24.86 22.06% $12.42 $13.12 $13.82 $14.52 $15.22 Upper Bound $37.28 Return on Equity Growth 0.28 0.29 0.30 0.31 0.32 0.0826 $17.30 $18.18 $19.06 $19.93 $20.81 Constant Cost of Equity 0.0926 $18.48 $19.47 $20.46 $21.44 $22.43 17.25% 0.1026 $20.00 $21.13 $22.26 $23.38 $24.51 0.1126 $22.02 $23.34 $24.66 $25.97 $27.29 0.1226 $24.86 $26.44 $28.02 $29.60 $31.18 Long Run Residual Income Perpetuity Model for Ross Stores, Inc. (Restated) Growth Initial Book Value of Equity $909,830 Ke 0.0826 0.0926 0.1026 0.1126 0.1226 Return on Equity 0.37 12.84% $47.29 $58.40 $78.13 $122.85 $322.08 Cost of Equity (Ke) 18.89% Constant Return on Equity 15.87% $29.36 $32.63 $37.06 $43.42 $53.31 Forward Earnings Growth Rate 0.1026 0.37 18.89% $21.64 $23.06 $24.80 $27.00 $29.86 21.92% $17.35 $18.07 $18.91 $19.91 $21.12 Market Value of Equity $2,817,544 24.95% $14.61 $15.00 $15.45 $15.96 $16.54 Number of Shares 139,023 Model Price at Fiscal year end 2007 $20.27 Return on Equity Time Consistent Model Price at April 1, 2008 $24.80 Ke 0.35 0.36 0.37 0.38 0.39 12.84% $72.29 $75.21 $78.13 $81.05 $83.97 Stock Price at April 1, 2008 $31.07 Constant Growth Rate 15.87% $34.29 $35.68 $37.06 $38.45 $39.84 0.1026 18.89% $22.95 $23.87 $24.80 $25.73 $26.66 Percentage 20.00% 21.92% $17.49 $18.20 $18.91 $19.62 $20.32 Lower Bound $24.86 24.95% $14.29 $14.87 $15.45 $16.02 $16.60 Upper Bound $37.28 Return on Equity Growth 0.35 0.36 0.37 0.38 0.39 0.0826 $20.14 $20.89 $21.64 $22.40 $23.15 Constant Cost of Equity 0.0926 $21.40 $22.23 $23.06 $23.89 $24.72 18.89% 0.1026 $22.95 $23.87 $24.80 $25.73 $26.66 0.1126 $24.90 $25.95 $27.00 $28.05 $29.10 0.1226 $27.45 $28.66 $29.86 $31.07 $32.28

149
SUMMARY OUTPUT 3 Month Rate over 60 months
Regression Statistics Multiple R 0.235280502 R Square 0.055356915 Adjusted R Square 0.039069965 Standard Error 0.073166224 Observations 60 ANOVA
df SS MS F Significance F Regression 1 0.018195056 0.018195056 3.398850943 0.070352555 Residual 58 0.310491184 0.005353296 Total 59 0.32868624
Coefficients Standard Error t Stat P-value Lower 95% Upper 95% Lower 95.0% Upper 95.0% Intercept 0.006163401 0.009677953 0.636849677 0.526728474 -0.013209126 0.025535928 -0.013209126 0.025535928 X Variable 1 0.672131248 0.364575959 1.843597283 0.070352555 -0.057646818 1.401909313 -0.057646818 1.401909313
SUMMARY OUTPUT 3 Month Rate over 72 months
Regression Statistics Multiple R 0.345419859 R Square 0.119314879 Adjusted R Square 0.106733663 Standard Error 0.070973328 Observations 72 ANOVA
df SS MS F Significance F Regression 1 0.047770779 0.047770779 9.483572858 0.002961184 Residual 70 0.352604931 0.005037213 Total 71 0.400375711
Coefficients Standard Error t Stat P-value Lower 95% Upper 95% Lower 95.0% Upper 95.0% Intercept 0.009100418 0.008368129 1.087509295 0.2805422 -0.007589289 0.025790125 -0.007589289 0.025790125 X Variable 1 0.739537307 0.240145302 3.079541014 0.002961184 0.26058261 1.218492003 0.26058261 1.218492003

150
SUMMARY OUTPUT 3 Month Rate over 48 months
Regression Statistics Multiple R 0.119954272 R Square 0.014389027 Adjusted R Square -0.007037298 Standard Error 0.074665528 Observations 48 ANOVA
df SS MS F Significance F Regression 1 0.003743898 0.003743898 0.671558334 0.416734668 Residual 46 0.256447292 0.005574941 Total 47 0.26019119
Coefficients Standard Error t Stat P-value Lower 95% Upper 95% Lower 95.0% Upper 95.0% Intercept 0.00377176 0.010797787 0.349308662 0.728451654 -0.017963057 0.025506578 -0.017963057 0.025506578 X Variable 1 0.377171841 0.460253807 0.819486628 0.416734668 -0.549271008 1.303614689 -0.549271008 1.303614689
SUMMARY OUTPUT 3 Month Rate over 36 months
Regression Statistics Multiple R 0.028253835 R Square 0.000798279 Adjusted R Square -0.028590007 Standard Error 0.068150181 Observations 36 ANOVA
df SS MS F Significance F Regression 1 0.000126158 0.000126158 0.027163176 0.870067516 Residual 34 0.157911202 0.004644447 Total 35 0.15803736
Coefficients Standard Error t Stat P-value Lower 95% Upper 95% Lower 95.0% Upper 95.0% Intercept 0.003479376 0.011370564 0.305998512 0.761471669 -0.01962839 0.026587141 -0.01962839 0.026587141 X Variable 1 -0.078022482 0.473401345 -0.164812548 0.870067516 -1.04008976 0.884044796 -1.04008976 0.884044796

151
SUMMARY OUTPUT 3 Month Rate over 24 months
Regression Statistics Multiple R 0.033897735 R Square 0.001149056 Adjusted R Square -0.044253259 Standard Error 0.070611547 Observations 24 ANOVA
df SS MS F Significance F Regression 1 0.000126187 0.000126187 0.025308322 0.875052619 Residual 22 0.109691793 0.004985991 Total 23 0.10981798
Coefficients Standard Error t Stat P-value Lower 95% Upper 95% Lower 95.0% Upper 95.0% Intercept 0.003981002 0.014414666 0.276177166 0.784989813 -0.025913186 0.03387519 -0.025913186 0.03387519 X Variable 1 0.090208052 0.567039911 0.159085896 0.875052619 -1.085760742 1.266176847 -1.085760742 1.266176847
SUMMARY OUTPUT 6 Month Rate over 72 months
Regression Statistics Multiple R 0.345945073 R Square 0.119677993 Adjusted R Square 0.107101965 Standard Error 0.070958695 Observations 72 ANOVA
df SS MS F Significance F Regression 1 0.047916162 0.047916162 9.516358193 0.002915037 Residual 70 0.352459549 0.005035136 Total 71 0.400375711
Coefficients Standard Error t Stat P-value Lower 95% Upper 95% Lower 95.0% Upper 95.0% Intercept 0.009190628 0.008365558 1.09862696 0.275695231 -0.007493952 0.025875208 -0.007493952 0.025875208 X Variable 1 0.740830038 0.240150333 3.084859509 0.002915037 0.261865308 1.219794768 0.261865308 1.219794768

152
SUMMARY OUTPUT 6 Month Rate over 60 months
Regression Statistics Multiple R 0.23612703 R Square 0.055755975 Adjusted R Square 0.039475905 Standard Error 0.073150768 Observations 60 ANOVA
df SS MS F Significance F Regression 1 0.018326222 0.018326222 3.424799558 0.069318947 Residual 58 0.310360019 0.005351035 Total 59 0.32868624
Coefficients Standard Error t Stat P-value Lower 95% Upper 95% Lower 95.0% Upper 95.0% Intercept 0.006243223 0.009664998 0.645962194 0.52085153 -0.013103372 0.025589819 -0.013103372 0.025589819 X Variable 1 0.674263829 0.364344555 1.850621398 0.069318947 -0.05505103 1.403578689 -0.05505103 1.403578689
SUMMARY OUTPUT 6 Month Rate over 48 months
Regression Statistics Multiple R 0.120957413 R Square 0.014630696 Adjusted R Square -0.006790376 Standard Error 0.074656374 Observations 48 ANOVA
df SS MS F Significance F Regression 1 0.003806778 0.003806778 0.683004843 0.412820196 Residual 46 0.256384412 0.005573574 Total 47 0.26019119
Coefficients Standard Error t Stat P-value Lower 95% Upper 95% Lower 95.0% Upper 95.0% Intercept 0.003827526 0.010792184 0.354657177 0.724467263 -0.017896015 0.025551066 -0.017896015 0.025551066 X Variable 1 0.380428185 0.460321006 0.82644107 0.412820196 -0.546149928 1.307006298 -0.546149928 1.307006298

153
SUMMARY OUTPUT 6 Month Rate over 36 months
Regression Statistics Multiple R 0.027326856 R Square 0.000746757 Adjusted R Square -0.028643044 Standard Error 0.068151938 Observations 36 ANOVA
df SS MS F Significance F Regression 1 0.000118016 0.000118016 0.025408714 0.874296026 Residual 34 0.157919345 0.004644687 Total 35 0.15803736
Coefficients Standard Error t Stat P-value Lower 95% Upper 95% Lower 95.0% Upper 95.0% Intercept 0.003465798 0.011367938 0.304874849 0.762319987 -0.019636632 0.026568229 -0.019636632 0.026568229 X Variable 1 -0.075476368 0.473499636 -0.159401111 0.874296026 -1.037743398 0.886790662 -1.037743398 0.886790662
SUMMARY OUTPUT 6 Month Rate over 24 months
Regression Statistics Multiple R 0.035067406 R Square 0.001229723 Adjusted R Square -0.044168926 Standard Error 0.070608696 Observations 24 ANOVA
df SS MS F Significance F Regression 1 0.000135046 0.000135046 0.027087214 0.870775868 Residual 22 0.109682934 0.004985588 Total 23 0.10981798
Coefficients Standard Error t Stat P-value Lower 95% Upper 95% Lower 95.0% Upper 95.0% Intercept 0.003991726 0.01441495 0.276915716 0.784429985 -0.02590305 0.033886503 -0.02590305 0.033886503 X Variable 1 0.093336124 0.567110373 0.164581938 0.870775868 -1.0827788 1.269451048 -1.0827788 1.269451048

154
SUMMARY OUTPUT 2 Year Rate over 72 months
Regression Statistics Multiple R 0.345477228 R Square 0.119354515 Adjusted R Square 0.106773866 Standard Error 0.070971731 Observations 72 ANOVA
df SS MS F Significance F Regression 1 0.047786649 0.047786649 9.487150299 0.002956111 Residual 70 0.352589062 0.005036987 Total 71 0.400375711
Coefficients Standard Error t Stat P-value Lower 95% Upper 95% Lower 95.0% Upper 95.0% Intercept 0.009392033 0.008365606 1.122695991 0.26540266 -0.007292643 0.026076709 -0.007292643 0.026076709 X Variable 1 0.739546276 0.240102932 3.080121799 0.002956111 0.260676083 1.218416469 0.260676083 1.218416469
SUMMARY OUTPUT 2 Year Rate over 60 months
Regression Statistics Multiple R 0.236836826 R Square 0.056091682 Adjusted R Square 0.039817401 Standard Error 0.073137763 Observations 60 ANOVA
df SS MS F Significance F Regression 1 0.018436564 0.018436564 3.446645733 0.068461682 Residual 58 0.310249676 0.005349132 Total 59 0.32868624
Coefficients Standard Error t Stat P-value Lower 95% Upper 95% Lower 95.0% Upper 95.0% Intercept 0.006355361 0.009649337 0.658631891 0.512738398 -0.012959885 0.025670608 -0.012959885 0.025670608 X Variable 1 0.677416766 0.364886351 1.856514404 0.068461682 -0.052982616 1.407816148 -0.052982616 1.407816148

155
SUMMARY OUTPUT 2 Year Rate over 48 months
Regression Statistics Multiple R 0.122902914 R Square 0.015105126 Adjusted R Square -0.006305632 Standard Error 0.074638399 Observations 48 ANOVA
df SS MS F Significance F Regression 1 0.003930221 0.003930221 0.705492365 0.405288779 Residual 46 0.256260969 0.005570891 Total 47 0.26019119
Coefficients Standard Error t Stat P-value Lower 95% Upper 95% Lower 95.0% Upper 95.0% Intercept 0.003862271 0.0107869 0.358051961 0.721942294 -0.017850633 0.025575175 -0.017850633 0.025575175 X Variable 1 0.386446213 0.460090109 0.839935929 0.405288779 -0.539667128 1.312559555 -0.539667128 1.312559555
SUMMARY OUTPUT 2 Year Rate over 36 months
Regression Statistics Multiple R 0.026182571 R Square 0.000685527 Adjusted R Square -0.028706075 Standard Error 0.068154026 Observations 36 ANOVA
df SS MS F Significance F Regression 1 0.000108339 0.000108339 0.023323907 0.879520523 Residual 34 0.157929021 0.004644971 Total 35 0.15803736
Coefficients Standard Error t Stat P-value Lower 95% Upper 95% Lower 95.0% Upper 95.0% Intercept 0.003466865 0.011369412 0.304929131 0.762278999 -0.01963856 0.02657229 -0.01963856 0.02657229 X Variable 1 -0.072329604 0.47360408 -0.152721666 0.879520523 -1.034808889 0.890149681 -1.034808889 0.890149681
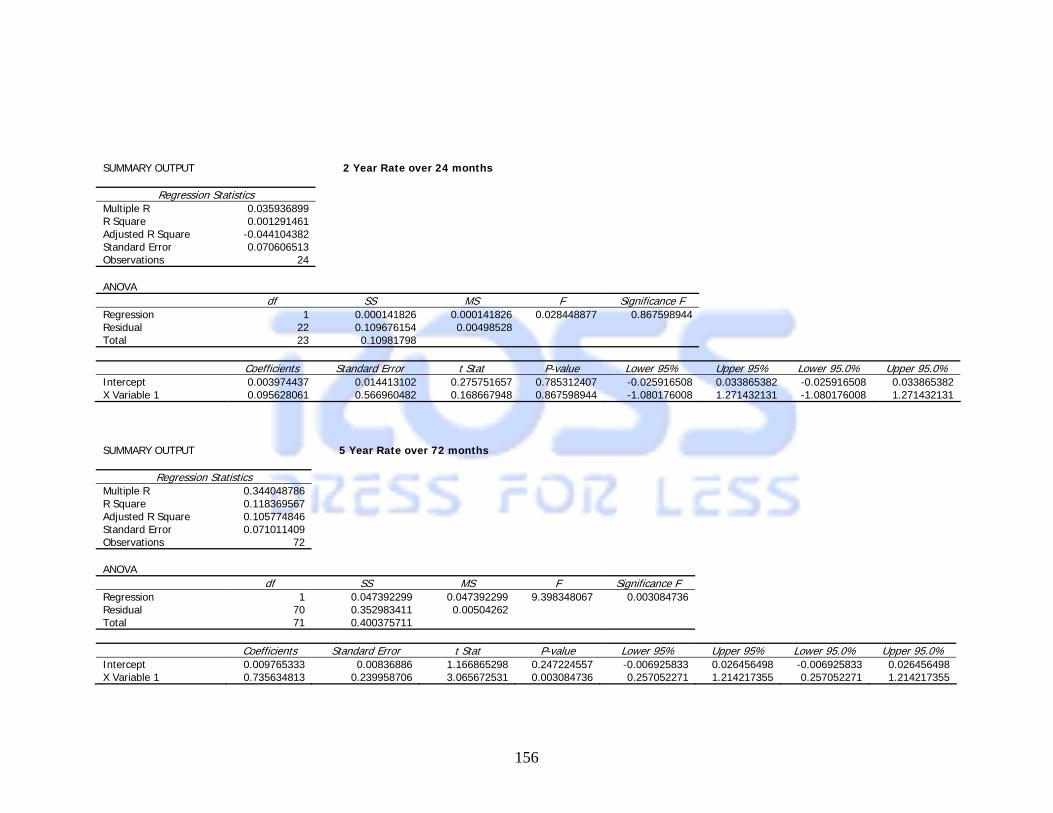
156
SUMMARY OUTPUT 2 Year Rate over 24 months
Regression Statistics Multiple R 0.035936899 R Square 0.001291461 Adjusted R Square -0.044104382 Standard Error 0.070606513 Observations 24 ANOVA
df SS MS F Significance F Regression 1 0.000141826 0.000141826 0.028448877 0.867598944 Residual 22 0.109676154 0.00498528 Total 23 0.10981798
Coefficients Standard Error t Stat P-value Lower 95% Upper 95% Lower 95.0% Upper 95.0% Intercept 0.003974437 0.014413102 0.275751657 0.785312407 -0.025916508 0.033865382 -0.025916508 0.033865382 X Variable 1 0.095628061 0.566960482 0.168667948 0.867598944 -1.080176008 1.271432131 -1.080176008 1.271432131
SUMMARY OUTPUT 5 Year Rate over 72 months
Regression Statistics Multiple R 0.344048786 R Square 0.118369567 Adjusted R Square 0.105774846 Standard Error 0.071011409 Observations 72 ANOVA
df SS MS F Significance F Regression 1 0.047392299 0.047392299 9.398348067 0.003084736 Residual 70 0.352983411 0.00504262 Total 71 0.400375711
Coefficients Standard Error t Stat P-value Lower 95% Upper 95% Lower 95.0% Upper 95.0% Intercept 0.009765333 0.00836886 1.166865298 0.247224557 -0.006925833 0.026456498 -0.006925833 0.026456498 X Variable 1 0.735634813 0.239958706 3.065672531 0.003084736 0.257052271 1.214217355 0.257052271 1.214217355

157
SUMMARY OUTPUT 5 Year Rate over 60 months
Regression Statistics Multiple R 0.235463418 R Square 0.055443021 Adjusted R Square 0.039157556 Standard Error 0.073162889 Observations 60 ANOVA
df SS MS F Significance F Regression 1 0.018223358 0.018223358 3.404448132 0.070128178 Residual 58 0.310462882 0.005352808 Total 59 0.32868624
Coefficients Standard Error t Stat P-value Lower 95% Upper 95% Lower 95.0% Upper 95.0% Intercept 0.006645993 0.00962363 0.690591009 0.492577131 -0.012617797 0.025909782 -0.012617797 0.025909782 X Variable 1 0.674655662 0.365644301 1.845114666 0.070128178 -0.057260922 1.406572245 -0.057260922 1.406572245
SUMMARY OUTPUT 5 Year Rate over 48 months
Regression Statistics Multiple R 0.122851209 R Square 0.015092419 Adjusted R Square -0.006318615 Standard Error 0.074638881 Observations 48 ANOVA
df SS MS F Significance F Regression 1 0.003926915 0.003926915 0.704889788 0.405487909 Residual 46 0.256264275 0.005570963 Total 47 0.26019119
Coefficients Standard Error t Stat P-value Lower 95% Upper 95% Lower 95.0% Upper 95.0% Intercept 0.003954335 0.010781995 0.366753534 0.715484579 -0.017748696 0.025657366 -0.017748696 0.025657366 X Variable 1 0.385017899 0.458585492 0.839577148 0.405487909 -0.538066804 1.308102603 -0.538066804 1.308102603

158
SUMMARY OUTPUT 5 Year Rate over 36 months
Regression Statistics Multiple R 0.026419411 R Square 0.000697985 Adjusted R Square -0.02869325 Standard Error 0.068153601 Observations 36 ANOVA
df SS MS F Significance F Regression 1 0.000110308 0.000110308 0.023748076 0.878438754 Residual 34 0.157927052 0.004644913 Total 35 0.15803736
Coefficients Standard Error t Stat P-value Lower 95% Upper 95% Lower 95.0% Upper 95.0% Intercept 0.003462672 0.011368034 0.304597237 0.762529617 -0.019639953 0.026565297 -0.019639953 0.026565297 X Variable 1 -0.072739071 0.47201254 -0.154104107 0.878438754 -1.031983958 0.886505815 -1.031983958 0.886505815
SUMMARY OUTPUT 5 Year Rate over 24 months
Regression Statistics Multiple R 0.035017377 R Square 0.001226217 Adjusted R Square -0.044172592 Standard Error 0.07060882 Observations 24 ANOVA
df SS MS F Significance F Regression 1 0.000134661 0.000134661 0.027009887 0.870958721 Residual 22 0.109683319 0.004985605 Total 23 0.10981798
Coefficients Standard Error t Stat P-value Lower 95% Upper 95% Lower 95.0% Upper 95.0% Intercept 0.003978384 0.014413852 0.276011134 0.785115684 -0.025914116 0.033870883 -0.025914116 0.033870883 X Variable 1 0.092797934 0.56464687 0.164346849 0.870958721 -1.078207998 1.263803865 -1.078207998 1.263803865

159
SUMMARY OUTPUT 10 Year Rate over 72 months
Regression Statistics Multiple R 0.342832318 R Square 0.117533998 Adjusted R Square 0.104927341 Standard Error 0.071045051 Observations 72 ANOVA
df SS MS F Significance F Regression 1 0.047057758 0.047057758 9.323169256 0.003198185 Residual 70 0.353317952 0.005047399 Total 71 0.400375711
Coefficients Standard Error t Stat P-value Lower 95% Upper 95% Lower 95.0% Upper 95.0% Intercept 0.010093069 0.008373027 1.205426534 0.23209777 -0.006606407 0.026792545 -0.006606407 0.026792545 X Variable 1 0.732470367 0.239887863 3.053386522 0.003198185 0.254029117 1.210911617 0.254029117 1.210911617
SUMMARY OUTPUT 10 Year Rate over 60 months
Regression Statistics Multiple R 0.233870965 R Square 0.054695628 Adjusted R Square 0.038397277 Standard Error 0.073191829 Observations 60 ANOVA
df SS MS F Significance F Regression 1 0.0179777 0.0179777 3.355899459 0.072100886 Residual 58 0.31070854 0.005357044 Total 59 0.32868624
Coefficients Standard Error t Stat P-value Lower 95% Upper 95% Lower 95.0% Upper 95.0% Intercept 0.006930544 0.009601102 0.721848851 0.473287634 -0.012288149 0.026149237 -0.012288149 0.026149237 X Variable 1 0.670609679 0.366071018 1.831911422 0.072100886 -0.062161072 1.40338043 -0.062161072 1.40338043

160
SUMMARY OUTPUT 10 Year Rate over 48 months
Regression Statistics Multiple R 0.121972677 R Square 0.014877334 Adjusted R Square -0.006538376 Standard Error 0.07464703 Observations 48 ANOVA
df SS MS F Significance F Regression 1 0.003870951 0.003870951 0.694692533 0.408879955 Residual 46 0.256320239 0.005572179 Total 47 0.26019119
Coefficients Standard Error t Stat P-value Lower 95% Upper 95% Lower 95.0% Upper 95.0% Intercept 0.004062355 0.010778805 0.376883581 0.707993182 -0.017634254 0.025758963 -0.017634254 0.025758963 X Variable 1 0.381062649 0.45719352 0.833482173 0.408879955 -0.539220162 1.301345459 -0.539220162 1.301345459
SUMMARY OUTPUT 10 Year Rate over 36 months
Regression Statistics Multiple R 0.026911232 R Square 0.000724214 Adjusted R Square -0.02866625 Standard Error 0.068152706 Observations 36 ANOVA
df SS MS F Significance F Regression 1 0.000114453 0.000114453 0.024641136 0.876193058 Residual 34 0.157922907 0.004644791 Total 35 0.15803736
Coefficients Standard Error t Stat P-value Lower 95% Upper 95% Lower 95.0% Upper 95.0% Intercept 0.003452181 0.011365127 0.30375207 0.763167934 -0.019644536 0.026548898 -0.019644536 0.026548898 X Variable 1 -0.073822304 0.470280788 -0.156974953 0.876193058 -1.029547847 0.881903239 -1.029547847 0.881903239
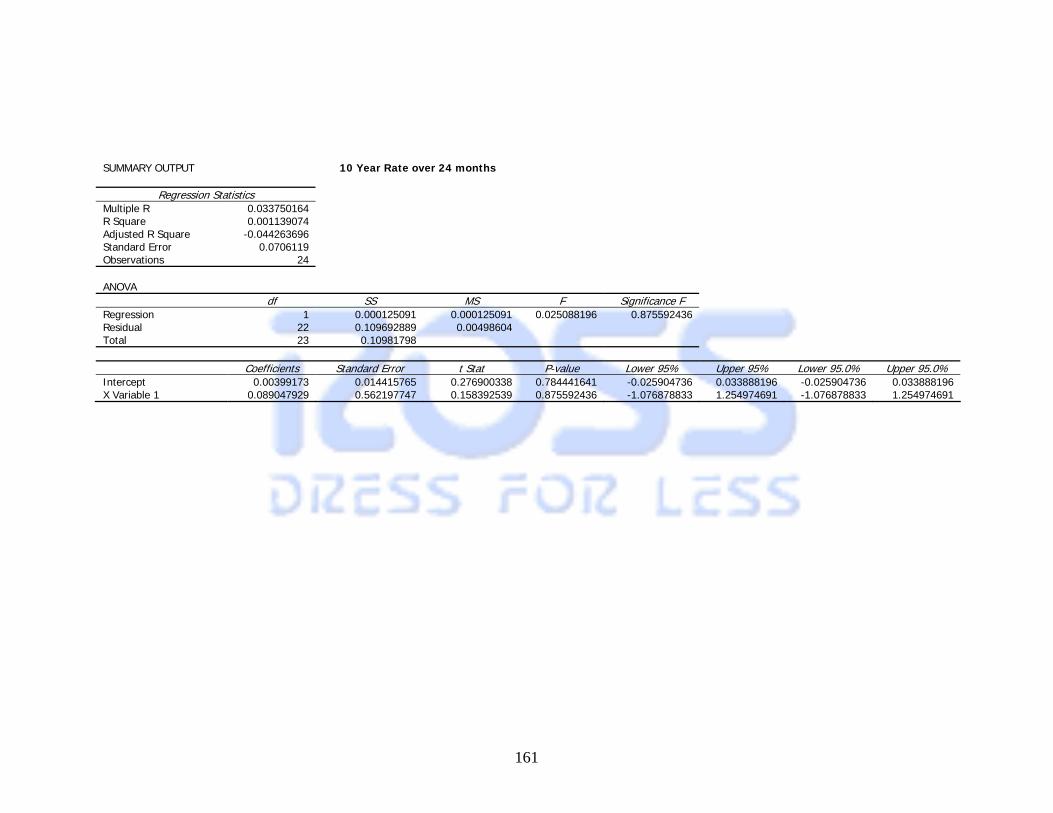
161
SUMMARY OUTPUT 10 Year Rate over 24 months
Regression Statistics Multiple R 0.033750164 R Square 0.001139074 Adjusted R Square -0.044263696 Standard Error 0.0706119 Observations 24 ANOVA
df SS MS F Significance F Regression 1 0.000125091 0.000125091 0.025088196 0.875592436 Residual 22 0.109692889 0.00498604 Total 23 0.10981798
Coefficients Standard Error t Stat P-value Lower 95% Upper 95% Lower 95.0% Upper 95.0% Intercept 0.00399173 0.014415765 0.276900338 0.784441641 -0.025904736 0.033888196 -0.025904736 0.033888196 X Variable 1 0.089047929 0.562197747 0.158392539 0.875592436 -1.076878833 1.254974691 -1.076878833 1.254974691
162
Reference Page
1. Business Analysis & Valuation: Using Financial Statements. Thomson
South-Western. 2008. Palepu & Healy. 3 –7
2. http://pages.stern.nyu.edu
3. Ross 10-K
4. Kohl’s 10-K
5. TJX Companies 10-K
6. J.C. Penney 10-K
7. www.bba.uk.org
8. http://www.investopedia.com
9. Investors need a good WACC, by Ben McClure. Investopedia.com, March
30, 2008
10. www.rossstores.com
11. Wall Street Journal (http://online.wsj.com/home/us)
12. Kroger Evaluation 2007
13. Sonic Evaluation 2007
14. J.C. Penney Evaluation 2007
15. MSN Money. http://moneycentral.msn.com
16. http://phx.coporate-ir.net/phoenix.zhtml?c=64847&p=irol-irhome
17. http://www.referenceforbusiness.com/history2/12/Ross-Stores-Inc.html
18. http://www.forbes.com/finance/mktguideapps/personinfo/FromPersonIdP
ersonTearsheat.jhtml?passedPersonId=888863
19. Strategic Management Concepts 11th edition. David, Fred R.
20. Financial Statements Analysis. FIN 3321. Moore, Mark. Spring 2008