ROPOSED AST OOD AND IXED-USE ETAIL UILDING
168
STORMWATER MANAGEMENT REPORT PROPOSED FAST FOOD AND MIXED-USE RETAIL BUILDING BLOCK 88.01, LOT 43 1165 NJ STATE ROUTE 27 TOWNSHIP OF FRANKLIN SOMERSET COUNTY, NEW JERSEY PREPARED FOR: 3 RONSON, LLC PREPARED BY: STONEFIELD ENGINEERING & DESIGN, LLC SEPTEMBER 22 ND , 2020 PRI - 200007 PAUL D. MUTCH (PE) NEW JERSEY PROFESSIONAL ENGINEER LICENSE # 55094
Transcript of ROPOSED AST OOD AND IXED-USE ETAIL UILDING
STORMWATER MANAGEMENT REPORT
PROPOSED FAST FOOD AND MIXED-USE RETAIL BUILDING
BLOCK 88.01, LOT 43
1165 NJ STATE ROUTE 27
TOWNSHIP OF FRANKLIN
SOMERSET COUNTY, NEW JERSEY
PREPARED FOR:
3 RONSON, LLC
PREPARED BY:
STONEFIELD ENGINEERING & DESIGN, LLC
SEPTEMBER 22ND, 2020
PRI - 200007
PAUL D. MUTCH (PE)
NEW JERSEY PROFESSIONAL ENGINEER LICENSE # 55094
REPORT CONTENTS
1.0 PROJECT DESCRIPTION ..................................................................................................... 1
2.0 EXISTING CONDITIONS .................................................................................................... 1
2.1 EXISTING DRAINAGE AREAS ......................................................................................................... 1
2.2 PROJECT SOILS ............................................................................................................................ 2
3.0 PROPOSED CONDITIONS .................................................................................................. 3
3.1 PROPOSED DRAINAGE AREAS ...................................................................................................... 3
4.0 ANALYSIS METHODOLOGY & DESIGN PARAMETERS ........................................................ 4
4.1 HYDROLOGIC & HYDRAULIC ANALYSES ....................................................................................... 4
4.2 NEW JERSEY STORMWATER DESIGN PARAMETERS ....................................................................... 5
4.3 SUBSURFACE STORMWATER INVESTIGATION ................................................................................ 5
5.0 PROJECT ANALYSIS RESULTS ........................................................................................... 6
5.1 STORMWATER QUANTITY CONTROL ........................................................................................... 6
5.2 GROUNDWATER RECHARGE ........................................................................................................ 7
5.3 STORMWATER QUALITY CONTROL .............................................................................................. 8
5.4 STORMWATER CONVEYANCE SYSTEMS ........................................................................................ 8
5.5 SOIL EROSION & SEDIMENT CONTROL ....................................................................................... 8
5.6 STORMWATER OPERATIONS & MAINTENANCE ............................................................................ 8
6.0 CONCLUSIONS .................................................................................................................. 9
APPENDICIES
PROJECT FIGURES ...................................................................................................................... A
USGS LOCATION MAP ................................................................................................................ FIGURE 1
ZONING/TAX MAP ...................................................................................................................... FIGURE 2
AERIAL MAP ................................................................................................................................ FIGURE 3
NRCS COUNTY SOILS SURVEY ................................................................................................. B
DESIGN CALCULATIONS & DIAGRAMS ...................................................................................... C
HYDROCAD ROUTING DIAGRAM ........................................................................................................ C-1
2-YEAR STORM EVENT HYDROGRAPHS ................................................................................................ C-2
10-YEAR STORM EVENT HYDROGRAPHS .............................................................................................. C-3
100-YEAR STORM EVENT HYDROGRAPHS ............................................................................................ C-4
BMP STORAGE & DISCHARGE TABLES................................................................................................. C-5
WATER QUALITY STORM EVENT HYDROGRAPHS ................................................................................. C-6
2-YEAR STORM EVENT HYDROGRAPHS (INFILTRATION ON) ................................................................ C-7
72 HOUR DRAW-DOWN TIME ............................................................................................................. C-8
NEW JERSEY GROUNDWATER RECHARGE SPREADSHEET ...................................................................... C-9
SUBSURFACE STORMWATER INVESTIGATION RESULTS ............................................................ D
DRAINAGE AREA MAPS ............................................................................................................. E
EXISTING DRAINAGE AREA MAP ...................................................................................................... 1 OF 5
PROPOSED DRAINAGE AREA MAP .................................................................................................... 2 OF 5
PROPOSED INLET DRAINAGE AREA MAP .......................................................................................... 3 OF 5
WATER QUALITY REQUIREMENTS MAP ........................................................................................... 4 OF 5
PROPOSED WATER QUALITY MAP ................................................................................................... 5 OF 5
STORMWATER MANAGEMENT REPORT
PROPOSED FAST FOOD RESTAURANT AND MIXED-USE RETAIL BUILDING
SEPTEMBER 22ND, 2020
1
1.0 PROJECT DESCRIPTION
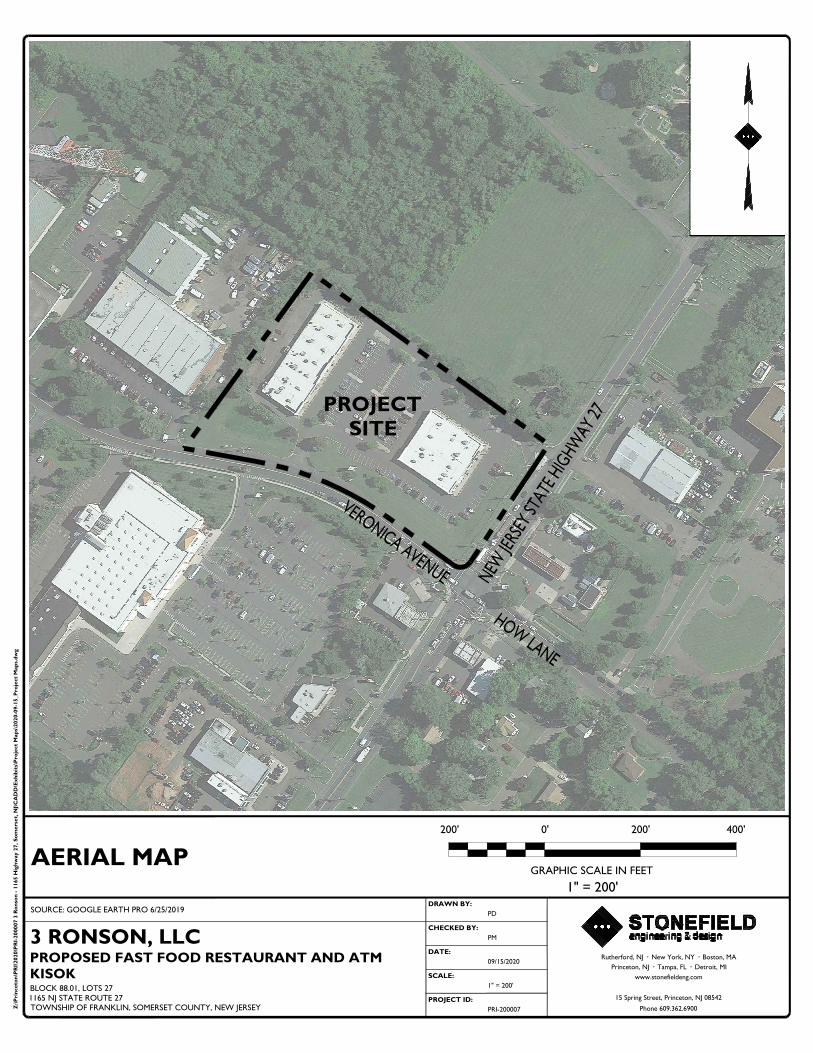
3 Ronson, LLC is proposing the construction of a 1,748 SF Fast Food Restaurant with an additional 1,159 SF
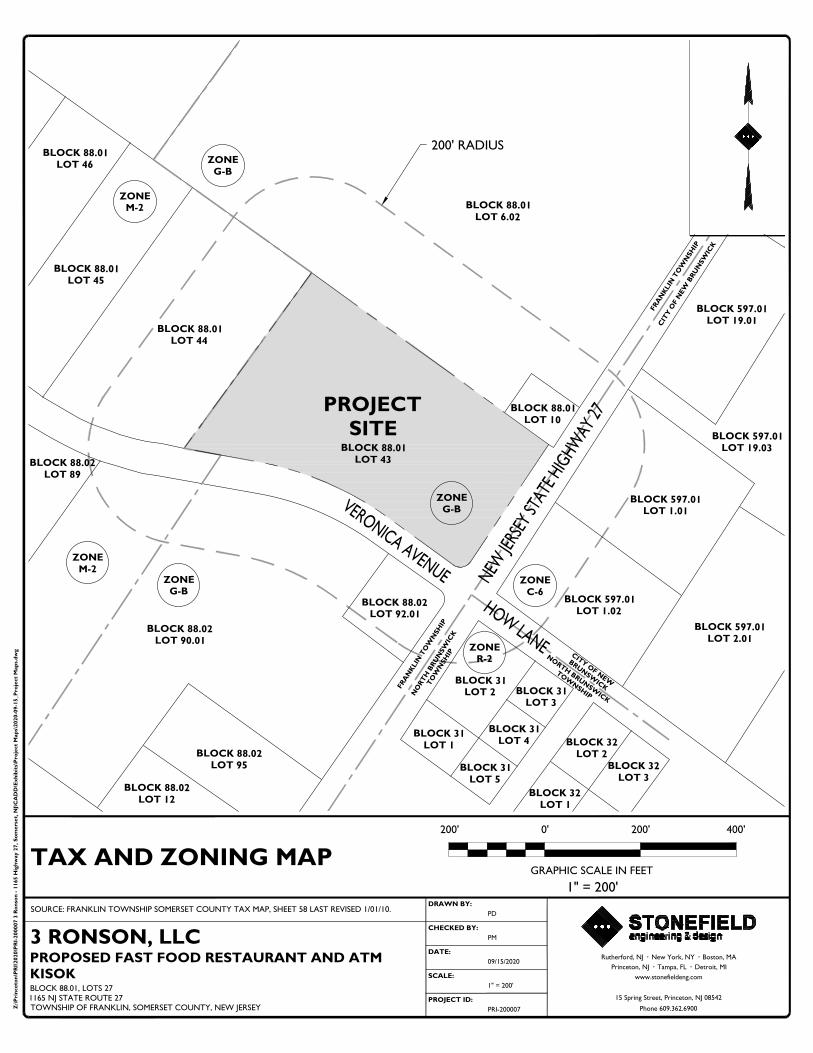
of Mixed-Use Retail Space within. The subject property is designated Block 88.01, Lot 43, commonly known as
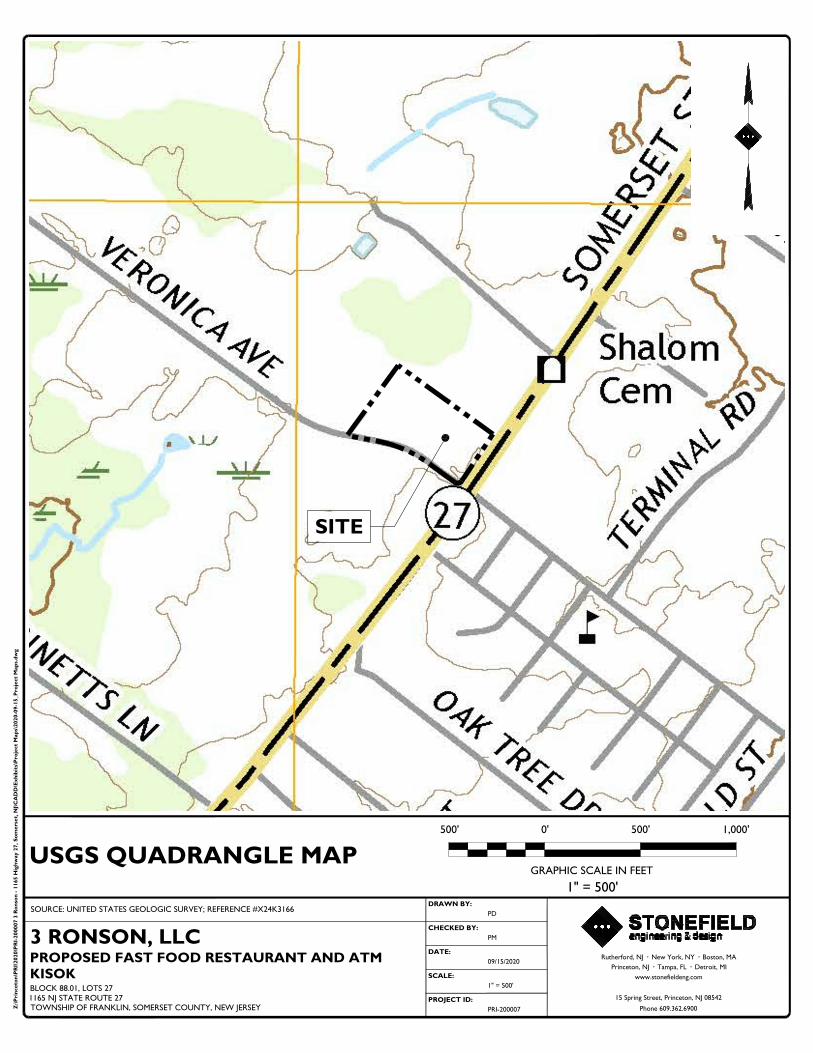
1165 NJ State Route 27, located at the corner of Veronica Avenue and Lincoln Highway (NJ State Route 27).
The total project area is 217,811 SF (5.00 acres), the total area of new impervious surfaces is 5,146 SF (0.12
acres, and the total area of disturbance is 55,468 SF (1.27 acres). Project Figures can be found in Appendix A of
this Report.
This Stormwater Management Report has been prepared to analyze the potential stormwater runoff impacts
of the proposed project and discuss the measures proposed to conform to the stormwater management
requirements set forth by the Township of Franklin, Somerset Union Soil Conservation District, NJ Department
of Transportation and the New Jersey Department of Environmental Protection (NJDEP).
2.0 EXISTING CONDITIONS
The project site is currently developed with two (2) existing Mixed-Use Retail Buildings, of 17,626 SF and
13,228 SF respectively. Existing site access is provided via a full movement driveway along Veronica Avenue and a
Right Ingress / Right Egress driveway along NJ State Route 27. The project site largely consists of impervious
paved surfaces and parking area with vegetated grasses surrounding the perimeter of the site with a large above
ground basin at the south-west corner of the site.
2.1 EXISTING DRAINAGE AREAS
Under existing drainage conditions, the site is comprised of four (4) drainage areas which convey stormwater
runoff offsite to two (2) Points of interest along Veronica Avenue and NJ State Route 27 respectively. The
majority of the site runoff is directed to the above ground basin at the southwest corner of the site which is
currently insufficiently sized to handle the 100-year storm event. The site generally slopes from the Northeast
corner of the Site to the Southwest corner of the site with a change in elevation of approximately four feet. The
site is previously developed by two (2) one-story Mixed-Use Retail Buildings with associated asphalt pavement in
the parking areas and concrete walkways.
STORMWATER MANAGEMENT REPORT
PROPOSED FAST FOOD RESTAURANT AND MIXED-USE RETAIL BUILDING
SEPTEMBER 22ND, 2020
2
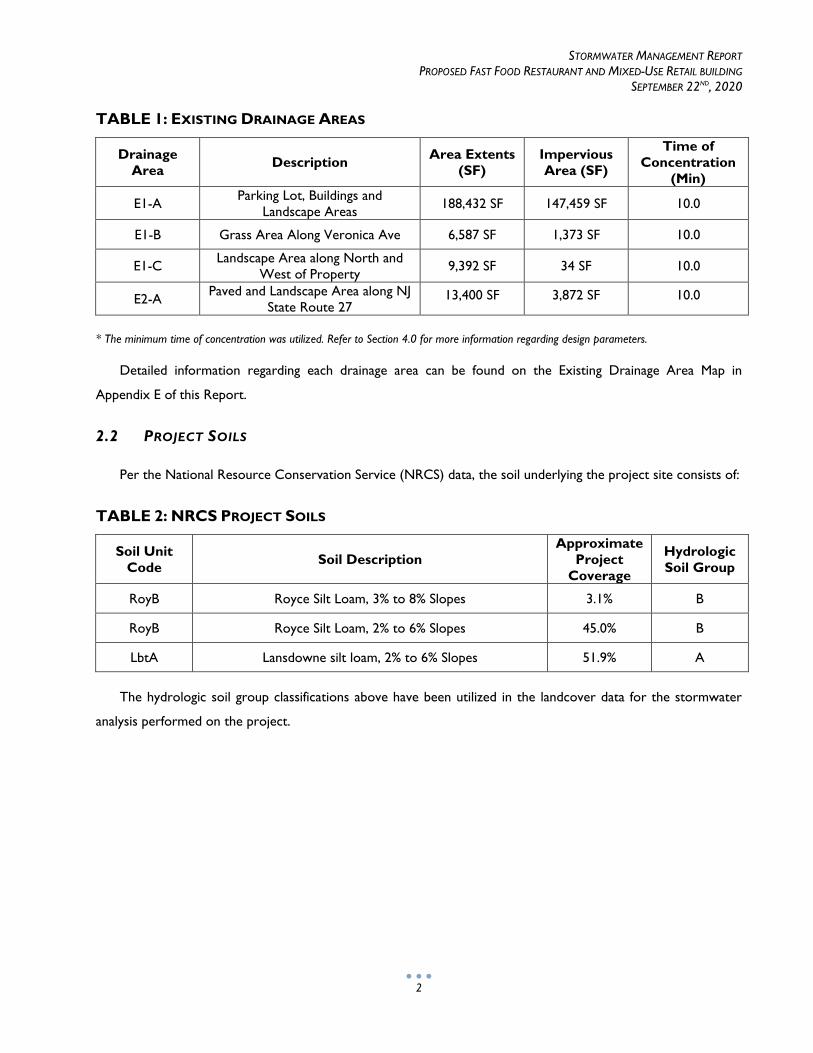
TABLE 1: EXISTING DRAINAGE AREAS
Drainage
Area Description
Area Extents
(SF)
Impervious
Area (SF)
Time of
Concentration
(Min)
E1-A Parking Lot, Buildings and
Landscape Areas 188,432 SF 147,459 SF 10.0
E1-B Grass Area Along Veronica Ave 6,587 SF 1,373 SF 10.0
E1-C Landscape Area along North and
West of Property 9,392 SF 34 SF 10.0
E2-A Paved and Landscape Area along NJ
State Route 27 13,400 SF 3,872 SF 10.0
* The minimum time of concentration was utilized. Refer to Section 4.0 for more information regarding design parameters.
Detailed information regarding each drainage area can be found on the Existing Drainage Area Map in
Appendix E of this Report.
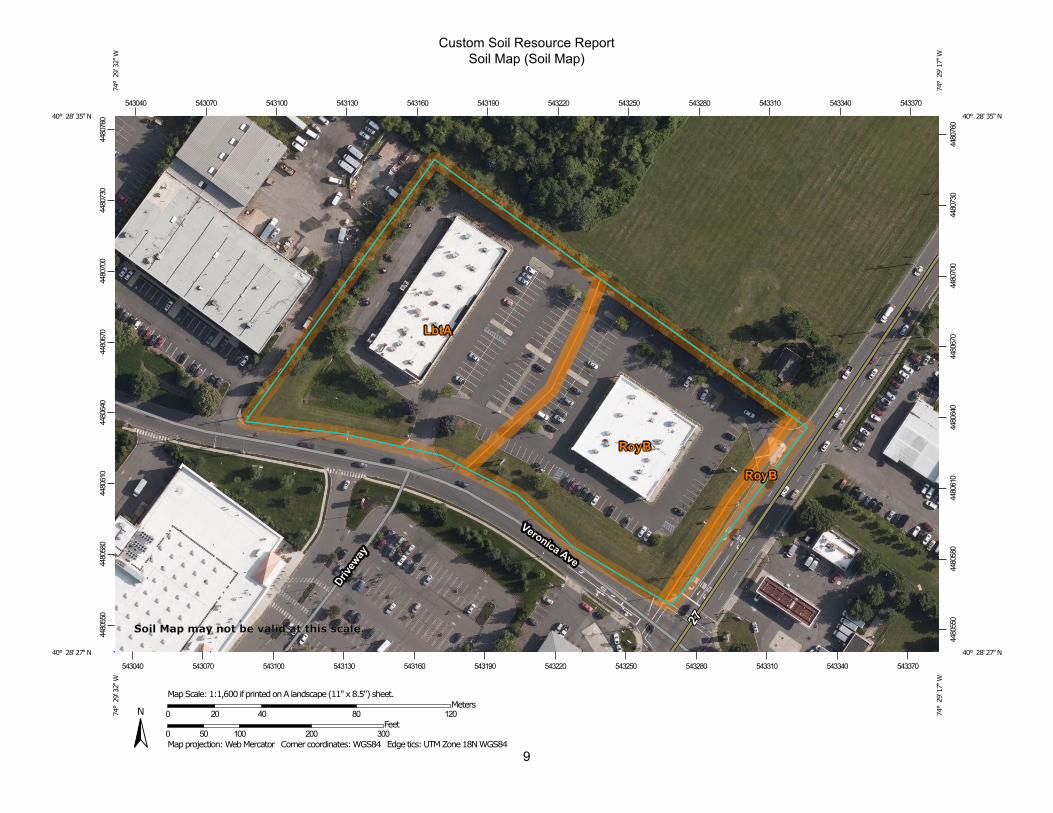
2.2 PROJECT SOILS
Per the National Resource Conservation Service (NRCS) data, the soil underlying the project site consists of:
TABLE 2: NRCS PROJECT SOILS
Soil Unit
Code Soil Description
Approximate
Project
Coverage
Hydrologic
Soil Group
RoyB Royce Silt Loam, 3% to 8% Slopes 3.1% B
RoyB Royce Silt Loam, 2% to 6% Slopes 45.0% B
LbtA Lansdowne silt loam, 2% to 6% Slopes 51.9% A
The hydrologic soil group classifications above have been utilized in the landcover data for the stormwater
analysis performed on the project.
STORMWATER MANAGEMENT REPORT
PROPOSED FAST FOOD RESTAURANT AND MIXED-USE RETAIL BUILDING
SEPTEMBER 22ND, 2020
3
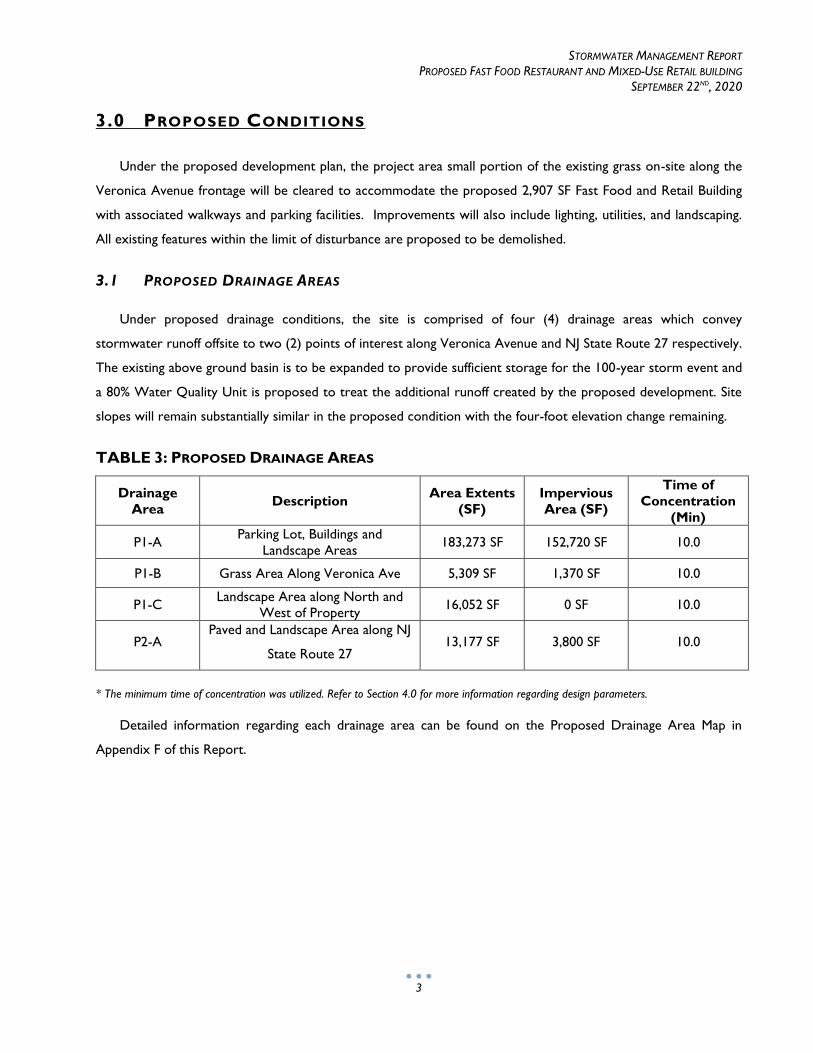
3.0 PROPOSED CONDITIONS
Under the proposed development plan, the project area small portion of the existing grass on-site along the
Veronica Avenue frontage will be cleared to accommodate the proposed 2,907 SF Fast Food and Retail Building
with associated walkways and parking facilities. Improvements will also include lighting, utilities, and landscaping.
All existing features within the limit of disturbance are proposed to be demolished.
3.1 PROPOSED DRAINAGE AREAS
Under proposed drainage conditions, the site is comprised of four (4) drainage areas which convey
stormwater runoff offsite to two (2) points of interest along Veronica Avenue and NJ State Route 27 respectively.
The existing above ground basin is to be expanded to provide sufficient storage for the 100-year storm event and
a 80% Water Quality Unit is proposed to treat the additional runoff created by the proposed development. Site
slopes will remain substantially similar in the proposed condition with the four-foot elevation change remaining.
TABLE 3: PROPOSED DRAINAGE AREAS
Drainage
Area Description
Area Extents
(SF)
Impervious
Area (SF)
Time of
Concentration
(Min)
P1-A Parking Lot, Buildings and
Landscape Areas 183,273 SF 152,720 SF 10.0
P1-B Grass Area Along Veronica Ave 5,309 SF 1,370 SF 10.0
P1-C Landscape Area along North and
West of Property 16,052 SF 0 SF 10.0
P2-A Paved and Landscape Area along NJ
State Route 27 13,177 SF 3,800 SF 10.0
* The minimum time of concentration was utilized. Refer to Section 4.0 for more information regarding design parameters.
Detailed information regarding each drainage area can be found on the Proposed Drainage Area Map in
Appendix F of this Report.

STORMWATER MANAGEMENT REPORT
PROPOSED FAST FOOD RESTAURANT AND MIXED-USE RETAIL BUILDING
SEPTEMBER 22ND, 2020
4
4.0 ANALYSIS METHODOLOGY & DESIGN PARAMETERS
4.1 HYDROLOGIC & HYDRAULIC ANALYSES
The existing and proposed drainage areas have been analyzed utilizing a modified version of the NRCS SCS
TR-20 method. The analysis program “HydroCAD” Version 9.10 by HydroCAD Software Solutions LLC was
used to calculate and plot the runoff hydrographs. The program incorporates the time of concentration, CN
values, 24-hour rainfall events, and project drainage areas to calculate the runoff characteristics. Key variables
utilized include the SCS Unit Hydrograph, a minimum time of concentration of 10 minutes, separate runoff
calculations for impervious and pervious areas, and dynamic storage and conveyance routing to account for any
variable tailwater conditions.
STORMWATER MANAGEMENT REPORT
PROPOSED FAST FOOD RESTAURANT AND MIXED-USE RETAIL BUILDING
SEPTEMBER 22ND, 2020
5
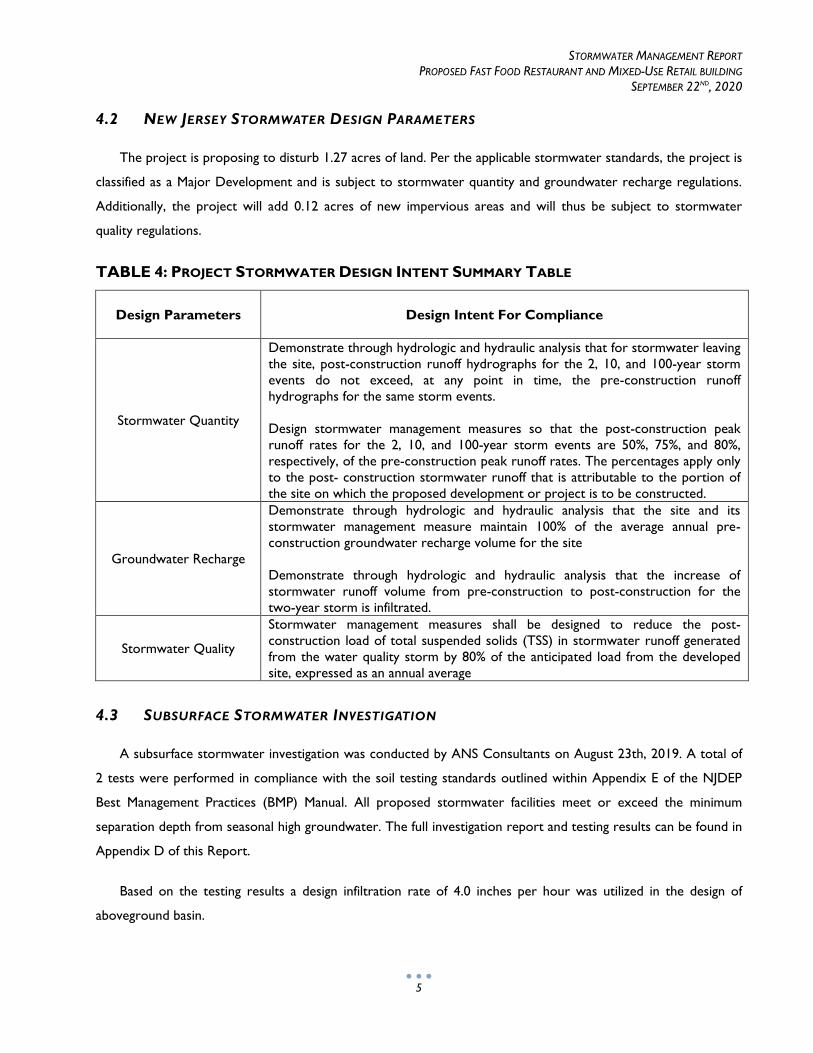
4.2 NEW JERSEY STORMWATER DESIGN PARAMETERS
The project is proposing to disturb 1.27 acres of land. Per the applicable stormwater standards, the project is
classified as a Major Development and is subject to stormwater quantity and groundwater recharge regulations.
Additionally, the project will add 0.12 acres of new impervious areas and will thus be subject to stormwater
quality regulations.
TABLE 4: PROJECT STORMWATER DESIGN INTENT SUMMARY TABLE
Design Parameters Design Intent For Compliance
Stormwater Quantity
Demonstrate through hydrologic and hydraulic analysis that for stormwater leaving
the site, post-construction runoff hydrographs for the 2, 10, and 100-year storm
events do not exceed, at any point in time, the pre-construction runoff
hydrographs for the same storm events.
Design stormwater management measures so that the post-construction peak
runoff rates for the 2, 10, and 100-year storm events are 50%, 75%, and 80%,
respectively, of the pre-construction peak runoff rates. The percentages apply only
to the post- construction stormwater runoff that is attributable to the portion of
the site on which the proposed development or project is to be constructed.
Groundwater Recharge
Demonstrate through hydrologic and hydraulic analysis that the site and its
stormwater management measure maintain 100% of the average annual pre-
construction groundwater recharge volume for the site
Demonstrate through hydrologic and hydraulic analysis that the increase of
stormwater runoff volume from pre-construction to post-construction for the
two-year storm is infiltrated.
Stormwater Quality
Stormwater management measures shall be designed to reduce the post-
construction load of total suspended solids (TSS) in stormwater runoff generated
from the water quality storm by 80% of the anticipated load from the developed
site, expressed as an annual average
4.3 SUBSURFACE STORMWATER INVESTIGATION
A subsurface stormwater investigation was conducted by ANS Consultants on August 23th, 2019. A total of
2 tests were performed in compliance with the soil testing standards outlined within Appendix E of the NJDEP
Best Management Practices (BMP) Manual. All proposed stormwater facilities meet or exceed the minimum
separation depth from seasonal high groundwater. The full investigation report and testing results can be found in
Appendix D of this Report.
Based on the testing results a design infiltration rate of 4.0 inches per hour was utilized in the design of
aboveground basin.
STORMWATER MANAGEMENT REPORT
PROPOSED FAST FOOD RESTAURANT AND MIXED-USE RETAIL BUILDING
SEPTEMBER 22ND, 2020
6
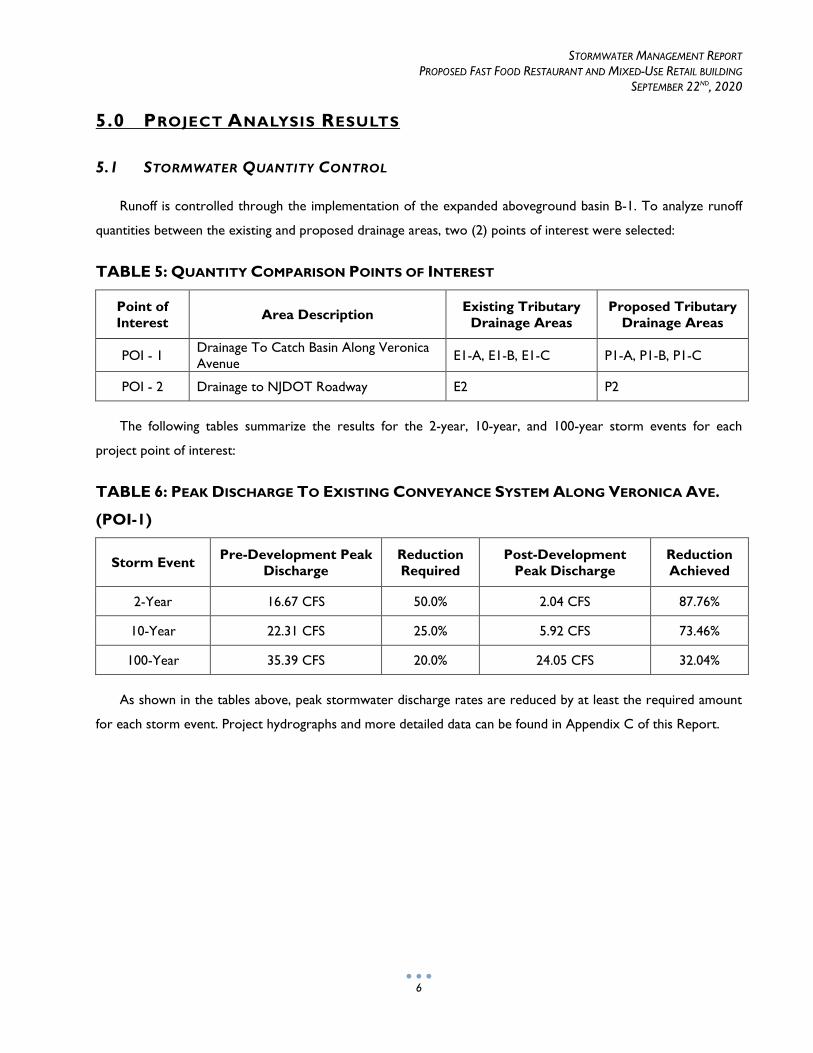
5.0 PROJECT ANALYSIS RESULTS
5.1 STORMWATER QUANTITY CONTROL
Runoff is controlled through the implementation of the expanded aboveground basin B-1. To analyze runoff
quantities between the existing and proposed drainage areas, two (2) points of interest were selected:
TABLE 5: QUANTITY COMPARISON POINTS OF INTEREST
Point of
Interest Area Description
Existing Tributary
Drainage Areas
Proposed Tributary
Drainage Areas
POI - 1 Drainage To Catch Basin Along Veronica
Avenue E1-A, E1-B, E1-C P1-A, P1-B, P1-C
POI - 2 Drainage to NJDOT Roadway E2 P2
The following tables summarize the results for the 2-year, 10-year, and 100-year storm events for each
project point of interest:
TABLE 6: PEAK DISCHARGE TO EXISTING CONVEYANCE SYSTEM ALONG VERONICA AVE.
(POI-1)
Storm Event Pre-Development Peak
Discharge
Reduction
Required
Post-Development
Peak Discharge
Reduction
Achieved
2-Year 16.67 CFS 50.0% 2.04 CFS 87.76%
10-Year 22.31 CFS 25.0% 5.92 CFS 73.46%
100-Year 35.39 CFS 20.0% 24.05 CFS 32.04%
As shown in the tables above, peak stormwater discharge rates are reduced by at least the required amount
for each storm event. Project hydrographs and more detailed data can be found in Appendix C of this Report.
STORMWATER MANAGEMENT REPORT
PROPOSED FAST FOOD RESTAURANT AND MIXED-USE RETAIL BUILDING
SEPTEMBER 22ND, 2020
7
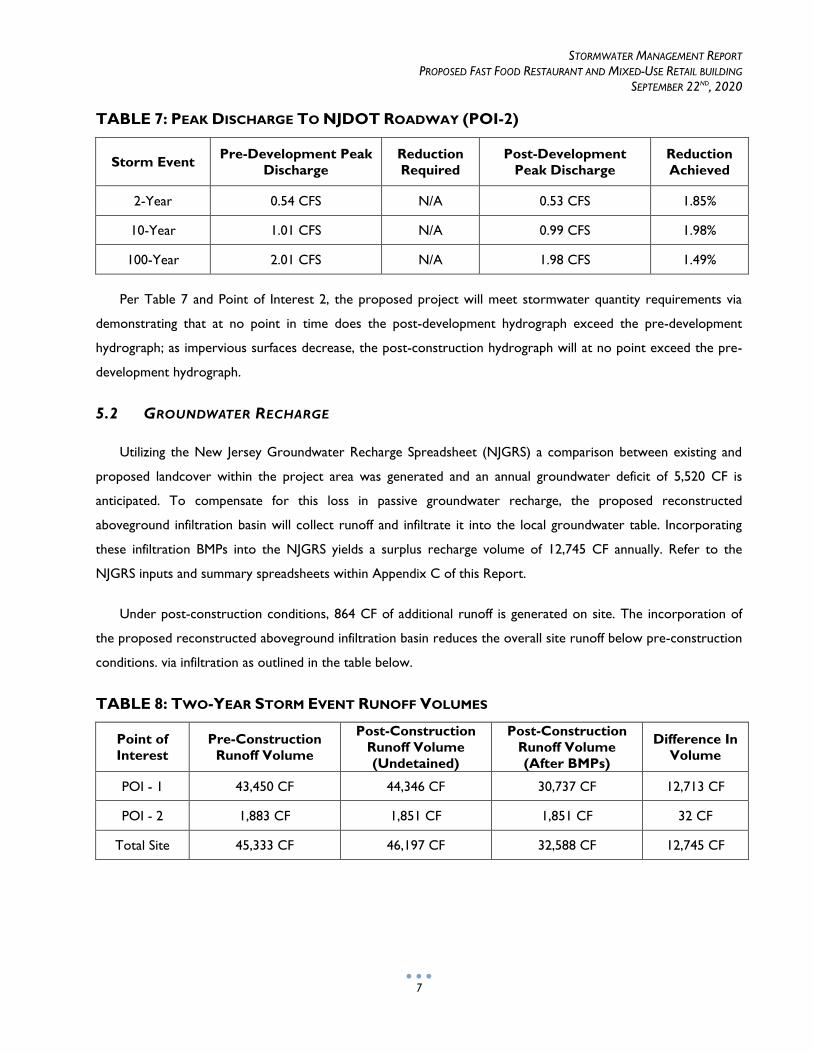
TABLE 7: PEAK DISCHARGE TO NJDOT ROADWAY (POI-2)
Storm Event Pre-Development Peak
Discharge
Reduction
Required
Post-Development
Peak Discharge
Reduction
Achieved
2-Year 0.54 CFS N/A 0.53 CFS 1.85%
10-Year 1.01 CFS N/A 0.99 CFS 1.98%
100-Year 2.01 CFS N/A 1.98 CFS 1.49%
Per Table 7 and Point of Interest 2, the proposed project will meet stormwater quantity requirements via
demonstrating that at no point in time does the post-development hydrograph exceed the pre-development
hydrograph; as impervious surfaces decrease, the post-construction hydrograph will at no point exceed the pre-
development hydrograph.
5.2 GROUNDWATER RECHARGE
Utilizing the New Jersey Groundwater Recharge Spreadsheet (NJGRS) a comparison between existing and
proposed landcover within the project area was generated and an annual groundwater deficit of 5,520 CF is
anticipated. To compensate for this loss in passive groundwater recharge, the proposed reconstructed
aboveground infiltration basin will collect runoff and infiltrate it into the local groundwater table. Incorporating
these infiltration BMPs into the NJGRS yields a surplus recharge volume of 12,745 CF annually. Refer to the
NJGRS inputs and summary spreadsheets within Appendix C of this Report.
Under post-construction conditions, 864 CF of additional runoff is generated on site. The incorporation of
the proposed reconstructed aboveground infiltration basin reduces the overall site runoff below pre-construction
conditions. via infiltration as outlined in the table below.
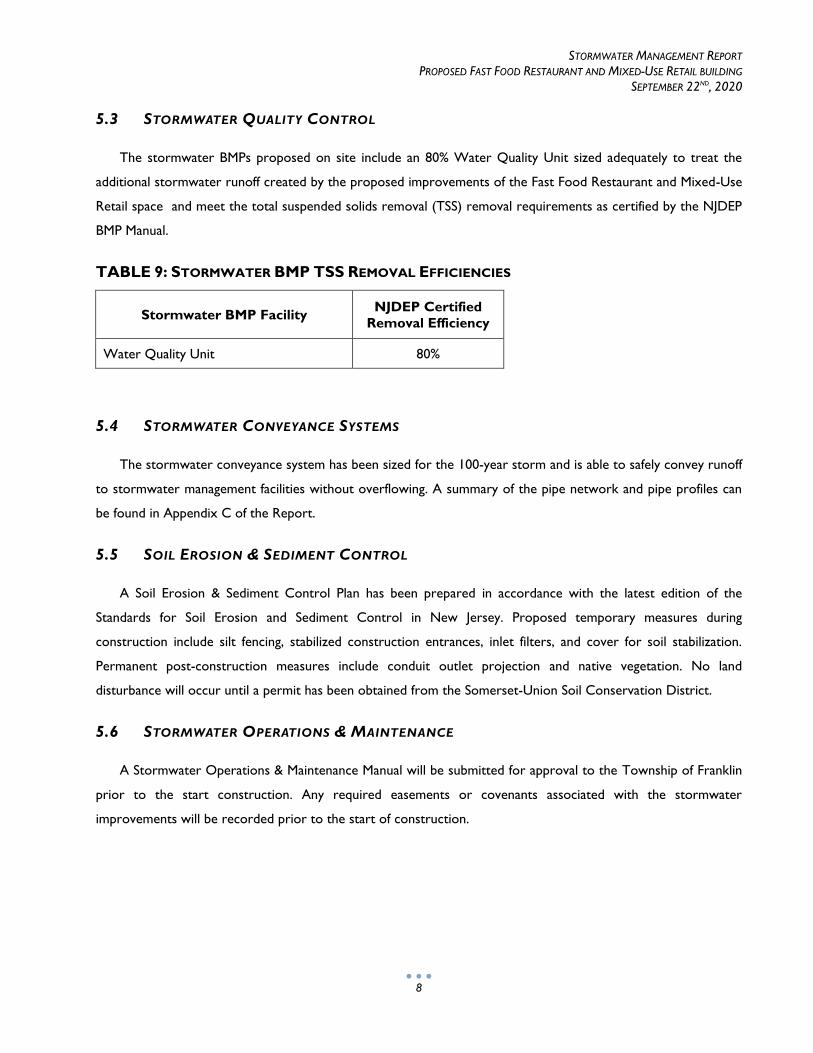
TABLE 8: TWO-YEAR STORM EVENT RUNOFF VOLUMES
Point of
Interest
Pre-Construction
Runoff Volume
Post-Construction
Runoff Volume
(Undetained)
Post-Construction
Runoff Volume
(After BMPs)
Difference In
Volume
POI - 1 43,450 CF 44,346 CF 30,737 CF 12,713 CF
POI - 2 1,883 CF 1,851 CF 1,851 CF 32 CF
Total Site 45,333 CF 46,197 CF 32,588 CF 12,745 CF
STORMWATER MANAGEMENT REPORT
PROPOSED FAST FOOD RESTAURANT AND MIXED-USE RETAIL BUILDING
SEPTEMBER 22ND, 2020
8
5.3 STORMWATER QUALITY CONTROL
The stormwater BMPs proposed on site include an 80% Water Quality Unit sized adequately to treat the
additional stormwater runoff created by the proposed improvements of the Fast Food Restaurant and Mixed-Use
Retail space and meet the total suspended solids removal (TSS) removal requirements as certified by the NJDEP
BMP Manual.
TABLE 9: STORMWATER BMP TSS REMOVAL EFFICIENCIES
Stormwater BMP Facility NJDEP Certified
Removal Efficiency
Water Quality Unit 80%
5.4 STORMWATER CONVEYANCE SYSTEMS
The stormwater conveyance system has been sized for the 100-year storm and is able to safely convey runoff
to stormwater management facilities without overflowing. A summary of the pipe network and pipe profiles can
be found in Appendix C of the Report.
5.5 SOIL EROSION & SEDIMENT CONTROL
A Soil Erosion & Sediment Control Plan has been prepared in accordance with the latest edition of the
Standards for Soil Erosion and Sediment Control in New Jersey. Proposed temporary measures during
construction include silt fencing, stabilized construction entrances, inlet filters, and cover for soil stabilization.
Permanent post-construction measures include conduit outlet projection and native vegetation. No land
disturbance will occur until a permit has been obtained from the Somerset-Union Soil Conservation District.
5.6 STORMWATER OPERATIONS & MAINTENANCE
A Stormwater Operations & Maintenance Manual will be submitted for approval to the Township of Franklin
prior to the start construction. Any required easements or covenants associated with the stormwater
improvements will be recorded prior to the start of construction.
STORMWATER MANAGEMENT REPORT
PROPOSED FAST FOOD RESTAURANT AND MIXED-USE RETAIL BUILDING
SEPTEMBER 22ND, 2020
9
6.0 CONCLUSIONS
The proposed project complies with all applicable stormwater management regulations and standards. Runoff
quantity, recharge, and quality requirements are addressed by the implementation of one (1) water quality unit,
and an above-ground infiltration basin, As such, the project is not anticipated to have any adverse impacts or
neighboring properties, downstream watercourses, or conveyance systems within the watershed. The
reconstructed aboveground infiltration basin is now sufficiently sized to handle the 2, 10 and 100-Year Storm
events while treating any additional runoff created by the proposed development with the 80% Water Quality
Unit.
APPENDIX A
PROJECT FIGURES
INVENTORY
USGS LOCATION MAP
ZONING/TAX MAP
AERIAL MAP
PROJECT
SITE
NEW
JERS
EY ST
ATE
HIG
HWAY
27
VERONICA AVENUE
HOW LANE
Z:\P
rin
ceto
n\P
RI\
2020\P
RI-
200007 3
Ro
nso
n -
1165 H
igh
way 2
7, S
om
ers
et,
NJ\
CA
DD
\Exh
ibit
s\P
roje
ct
Map
s\2020-0
9-1
5_P
roje
ct
Map
s.d
wg
DRAWN BY:
PDSOURCE: GOOGLE EARTH PRO 6/25/2019
CHECKED BY:
PM
DATE:
SCALE:
1" = 200'
PROJECT ID:
09/15/2020
PRI-200007
GRAPHIC SCALE IN FEET
0' 400'200'200'
1" = 200'
AERIAL MAP
BLOCK 88.01, LOTS 27
1165 NJ STATE ROUTE 27TOWNSHIP OF FRANKLIN, SOMERSET COUNTY, NEW JERSEY
PROPOSED FAST FOOD RESTAURANT AND ATMKISOK
3 RONSON, LLCRutherford, NJ · New York, NY · Boston, MA
Princeton, NJ · Tampa, FL · Detroit, MI
www.stonefieldeng.com
15 Spring Street, Princeton, NJ 08542
Phone 609.362.6900
200' RADIUS
VERONICA AVENUE
BLOCK 88.01LOT 44
BLOCK 88.01LOT 45
BLOCK 88.01LOT 46
BLOCK 88.02LOT 90.01
BLOCK 88.02LOT 92.01
BLOCK 88.02LOT 89
BLOCK 88.01LOT 10
BLOCK 88.01LOT 6.02
BLOCK 31LOT 2
BLOCK 597.01LOT 1.02
BLOCK 597.01LOT 1.01
BLOCK 597.01LOT 2.01
BLOCK 597.01LOT 19.03
BLOCK 597.01LOT 19.01C
ITY
OF N
EW
BR
UN
SW
ICK
FR
AN
KLIN
TO
WN
SH
IP
NEW
JERS
EY ST
ATE
HIG
HWAY
27
HOW LANENO
RTH BRU
NSW
ICK
TOW
NSH
IP
CITY O
F NEW
BRUN
SWICK
NO
RT
H B
RU
NSW
ICK
TO
WN
SH
IP
FR
AN
KLIN
TO
WN
SH
IP
ZONE
G-B
ZONEG-B
ZONEM-2
ZONE
M-2ZONE
C-6
ZONER-2
BLOCK 88.01LOT 43
ZONEG-B
PROJECTSITE
BLOCK 88.02LOT 95
BLOCK 88.02LOT 12
BLOCK 31LOT 3
BLOCK 31LOT 4
BLOCK 31LOT 1
BLOCK 31LOT 5
BLOCK 32LOT 2
BLOCK 32LOT 1
BLOCK 32LOT 3
Z:\P
rin
ceto
n\P
RI\
2020\P
RI-
200007 3
Ro
nso
n -
1165 H
igh
way 2
7, S
om
ers
et,
NJ\
CA
DD
\Exh
ibit
s\P
roje
ct
Map
s\2020-0
9-1
5_P
roje
ct
Map
s.d
wg
DRAWN BY:
PDSOURCE: FRANKLIN TOWNSHIP SOMERSET COUNTY TAX MAP, SHEET 58 LAST REVISED 1/01/10.
CHECKED BY:
PM
DATE:
SCALE:
1" = 200'
PROJECT ID:
09/15/2020
PRI-200007
GRAPHIC SCALE IN FEET
0' 400'200'200'
1" = 200'
TAX AND ZONING MAP
BLOCK 88.01, LOTS 27
1165 NJ STATE ROUTE 27TOWNSHIP OF FRANKLIN, SOMERSET COUNTY, NEW JERSEY
PROPOSED FAST FOOD RESTAURANT AND ATMKISOK
3 RONSON, LLCRutherford, NJ · New York, NY · Boston, MA
Princeton, NJ · Tampa, FL · Detroit, MI
www.stonefieldeng.com
15 Spring Street, Princeton, NJ 08542
Phone 609.362.6900
Z:\P
rin
ceto
n\P
RI\
2020\P
RI-
200007 3
Ro
nso
n -
1165 H
igh
way 2
7, S
om
ers
et,
NJ\
CA
DD
\Exh
ibit
s\P
roje
ct
Map
s\2020-0
9-1
5_P
roje
ct
Map
s.d
wg
DRAWN BY:
PDSOURCE: UNITED STATES GEOLOGIC SURVEY; REFERENCE #X24K3166
CHECKED BY:
PM
DATE:
SCALE:
1" = 500'
PROJECT ID:
09/15/2020
PRI-200007
GRAPHIC SCALE IN FEET
0' 1,000'500'500'
1" = 500'
USGS QUADRANGLE MAP
BLOCK 88.01, LOTS 27
1165 NJ STATE ROUTE 27TOWNSHIP OF FRANKLIN, SOMERSET COUNTY, NEW JERSEY
SITE
PROPOSED FAST FOOD RESTAURANT AND ATMKISOK
3 RONSON, LLCRutherford, NJ · New York, NY · Boston, MA
Princeton, NJ · Tampa, FL · Detroit, MI
www.stonefieldeng.com
15 Spring Street, Princeton, NJ 08542
Phone 609.362.6900
APPENDIX B
NRCS COUNTY SOIL SURVEY
United StatesDepartment ofAgriculture
A product of the NationalCooperative Soil Survey,a joint effort of the UnitedStates Department ofAgriculture and otherFederal agencies, Stateagencies including theAgricultural ExperimentStations, and localparticipants
Custom Soil Resource Report forMiddlesex County, New Jersey, and Somerset County, New Jersey
NaturalResourcesConservationService
June 17, 2020

PrefaceSoil surveys contain information that affects land use planning in survey areas. They highlight soil limitations that affect various land uses and provide information about the properties of the soils in the survey areas. Soil surveys are designed for many different users, including farmers, ranchers, foresters, agronomists, urban planners, community officials, engineers, developers, builders, and home buyers. Also, conservationists, teachers, students, and specialists in recreation, waste disposal, and pollution control can use the surveys to help them understand, protect, or enhance the environment.
Various land use regulations of Federal, State, and local governments may impose special restrictions on land use or land treatment. Soil surveys identify soil properties that are used in making various land use or land treatment decisions. The information is intended to help the land users identify and reduce the effects of soil limitations on various land uses. The landowner or user is responsible for identifying and complying with existing laws and regulations.
Although soil survey information can be used for general farm, local, and wider area planning, onsite investigation is needed to supplement this information in some cases. Examples include soil quality assessments (http://www.nrcs.usda.gov/wps/portal/nrcs/main/soils/health/) and certain conservation and engineering applications. For more detailed information, contact your local USDA Service Center (https://offices.sc.egov.usda.gov/locator/app?agency=nrcs) or your NRCS State Soil Scientist (http://www.nrcs.usda.gov/wps/portal/nrcs/detail/soils/contactus/?cid=nrcs142p2_053951).
Great differences in soil properties can occur within short distances. Some soils are seasonally wet or subject to flooding. Some are too unstable to be used as a foundation for buildings or roads. Clayey or wet soils are poorly suited to use as septic tank absorption fields. A high water table makes a soil poorly suited to basements or underground installations.
The National Cooperative Soil Survey is a joint effort of the United States Department of Agriculture and other Federal agencies, State agencies including the Agricultural Experiment Stations, and local agencies. The Natural Resources Conservation Service (NRCS) has leadership for the Federal part of the National Cooperative Soil Survey.
Information about soils is updated periodically. Updated information is available through the NRCS Web Soil Survey, the site for official soil survey information.
The U.S. Department of Agriculture (USDA) prohibits discrimination in all its programs and activities on the basis of race, color, national origin, age, disability, and where applicable, sex, marital status, familial status, parental status, religion, sexual orientation, genetic information, political beliefs, reprisal, or because all or a part of an individual's income is derived from any public assistance program. (Not all prohibited bases apply to all programs.) Persons with disabilities who require
2

alternative means for communication of program information (Braille, large print, audiotape, etc.) should contact USDA's TARGET Center at (202) 720-2600 (voice and TDD). To file a complaint of discrimination, write to USDA, Director, Office of Civil Rights, 1400 Independence Avenue, S.W., Washington, D.C. 20250-9410 or call (800) 795-3272 (voice) or (202) 720-6382 (TDD). USDA is an equal opportunity provider and employer.
3
ContentsPreface.................................................................................................................... 2How Soil Surveys Are Made..................................................................................5Soil Map.................................................................................................................. 8
Soil Map (Soil Map).............................................................................................. 9Legend................................................................................................................10Map Unit Legend (Soil Map)...............................................................................12Map Unit Descriptions (Soil Map)....................................................................... 12
Middlesex County, New Jersey.......................................................................14RoyB—Royce silt loam, 3 to 8 percent slopes............................................ 14
Somerset County, New Jersey........................................................................16LbtA—Lansdowne silt loam, 0 to 2 percent slopes..................................... 16RoyB—Royce silt loam, 2 to 6 percent slopes............................................ 17
References............................................................................................................19
4

How Soil Surveys Are MadeSoil surveys are made to provide information about the soils and miscellaneous areas in a specific area. They include a description of the soils and miscellaneous areas and their location on the landscape and tables that show soil properties and limitations affecting various uses. Soil scientists observed the steepness, length, and shape of the slopes; the general pattern of drainage; the kinds of crops and native plants; and the kinds of bedrock. They observed and described many soil profiles. A soil profile is the sequence of natural layers, or horizons, in a soil. The profile extends from the surface down into the unconsolidated material in which the soil formed or from the surface down to bedrock. The unconsolidated material is devoid of roots and other living organisms and has not been changed by other biological activity.
Currently, soils are mapped according to the boundaries of major land resource areas (MLRAs). MLRAs are geographically associated land resource units that share common characteristics related to physiography, geology, climate, water resources, soils, biological resources, and land uses (USDA, 2006). Soil survey areas typically consist of parts of one or more MLRA.
The soils and miscellaneous areas in a survey area occur in an orderly pattern that is related to the geology, landforms, relief, climate, and natural vegetation of the area. Each kind of soil and miscellaneous area is associated with a particular kind of landform or with a segment of the landform. By observing the soils and miscellaneous areas in the survey area and relating their position to specific segments of the landform, a soil scientist develops a concept, or model, of how they were formed. Thus, during mapping, this model enables the soil scientist to predict with a considerable degree of accuracy the kind of soil or miscellaneous area at a specific location on the landscape.
Commonly, individual soils on the landscape merge into one another as their characteristics gradually change. To construct an accurate soil map, however, soil scientists must determine the boundaries between the soils. They can observe only a limited number of soil profiles. Nevertheless, these observations, supplemented by an understanding of the soil-vegetation-landscape relationship, are sufficient to verify predictions of the kinds of soil in an area and to determine the boundaries.
Soil scientists recorded the characteristics of the soil profiles that they studied. They noted soil color, texture, size and shape of soil aggregates, kind and amount of rock fragments, distribution of plant roots, reaction, and other features that enable them to identify soils. After describing the soils in the survey area and determining their properties, the soil scientists assigned the soils to taxonomic classes (units). Taxonomic classes are concepts. Each taxonomic class has a set of soil characteristics with precisely defined limits. The classes are used as a basis for comparison to classify soils systematically. Soil taxonomy, the system of taxonomic classification used in the United States, is based mainly on the kind and character of soil properties and the arrangement of horizons within the profile. After the soil
5
scientists classified and named the soils in the survey area, they compared the individual soils with similar soils in the same taxonomic class in other areas so that they could confirm data and assemble additional data based on experience and research.
The objective of soil mapping is not to delineate pure map unit components; the objective is to separate the landscape into landforms or landform segments that have similar use and management requirements. Each map unit is defined by a unique combination of soil components and/or miscellaneous areas in predictable proportions. Some components may be highly contrasting to the other components of the map unit. The presence of minor components in a map unit in no way diminishes the usefulness or accuracy of the data. The delineation of such landforms and landform segments on the map provides sufficient information for the development of resource plans. If intensive use of small areas is planned, onsite investigation is needed to define and locate the soils and miscellaneous areas.
Soil scientists make many field observations in the process of producing a soil map. The frequency of observation is dependent upon several factors, including scale of mapping, intensity of mapping, design of map units, complexity of the landscape, and experience of the soil scientist. Observations are made to test and refine the soil-landscape model and predictions and to verify the classification of the soils at specific locations. Once the soil-landscape model is refined, a significantly smaller number of measurements of individual soil properties are made and recorded. These measurements may include field measurements, such as those for color, depth to bedrock, and texture, and laboratory measurements, such as those for content of sand, silt, clay, salt, and other components. Properties of each soil typically vary from one point to another across the landscape.
Observations for map unit components are aggregated to develop ranges of characteristics for the components. The aggregated values are presented. Direct measurements do not exist for every property presented for every map unit component. Values for some properties are estimated from combinations of other properties.
While a soil survey is in progress, samples of some of the soils in the area generally are collected for laboratory analyses and for engineering tests. Soil scientists interpret the data from these analyses and tests as well as the field-observed characteristics and the soil properties to determine the expected behavior of the soils under different uses. Interpretations for all of the soils are field tested through observation of the soils in different uses and under different levels of management. Some interpretations are modified to fit local conditions, and some new interpretations are developed to meet local needs. Data are assembled from other sources, such as research information, production records, and field experience of specialists. For example, data on crop yields under defined levels of management are assembled from farm records and from field or plot experiments on the same kinds of soil.
Predictions about soil behavior are based not only on soil properties but also on such variables as climate and biological activity. Soil conditions are predictable over long periods of time, but they are not predictable from year to year. For example, soil scientists can predict with a fairly high degree of accuracy that a given soil will have a high water table within certain depths in most years, but they cannot predict that a high water table will always be at a specific level in the soil on a specific date.
After soil scientists located and identified the significant natural bodies of soil in the survey area, they drew the boundaries of these bodies on aerial photographs and
Custom Soil Resource Report
6

identified each as a specific map unit. Aerial photographs show trees, buildings, fields, roads, and rivers, all of which help in locating boundaries accurately.
Custom Soil Resource Report
7

Soil MapThe soil map section includes the soil map for the defined area of interest, a list of soil map units on the map and extent of each map unit, and cartographic symbols displayed on the map. Also presented are various metadata about data used to produce the map, and a description of each soil map unit.
8
9
Custom Soil Resource ReportSoil Map (Soil Map)
4480
550
4480
580
4480
610
4480
640
4480
670
4480
700
4480
730
4480
760
4480
550
4480
580
4480
610
4480
640
4480
670
4480
700
4480
730
4480
760
543040 543070 543100 543130 543160 543190 543220 543250 543280 543310 543340 543370
543040 543070 543100 543130 543160 543190 543220 543250 543280 543310 543340 543370
40° 28' 35'' N74
° 2
9' 3
2'' W
40° 28' 35'' N
74° 2
9' 1
7'' W
40° 28' 27'' N
74° 2
9' 3
2'' W
40° 28' 27'' N
74° 2
9' 1
7'' W
N
Map projection: Web Mercator Corner coordinates: WGS84 Edge tics: UTM Zone 18N WGS840 50 100 200 300
Feet0 20 40 80 120
MetersMap Scale: 1:1,600 if printed on A landscape (11" x 8.5") sheet.
Soil Map may not be valid at this scale.
MAP LEGEND MAP INFORMATION
Area of Interest (AOI)Area of Interest (AOI)
SoilsSoil Map Unit Polygons
Soil Map Unit Lines
Soil Map Unit Points
Special Point FeaturesBlowout
Borrow Pit
Clay Spot
Closed Depression
Gravel Pit
Gravelly Spot
Landfill
Lava Flow
Marsh or swamp
Mine or Quarry
Miscellaneous Water
Perennial Water
Rock Outcrop
Saline Spot
Sandy Spot
Severely Eroded Spot
Sinkhole
Slide or Slip
Sodic Spot
Spoil Area
Stony Spot
Very Stony Spot
Wet Spot
Other
Special Line Features
Water FeaturesStreams and Canals
TransportationRails
Interstate Highways
US Routes
Major Roads
Local Roads
BackgroundAerial Photography
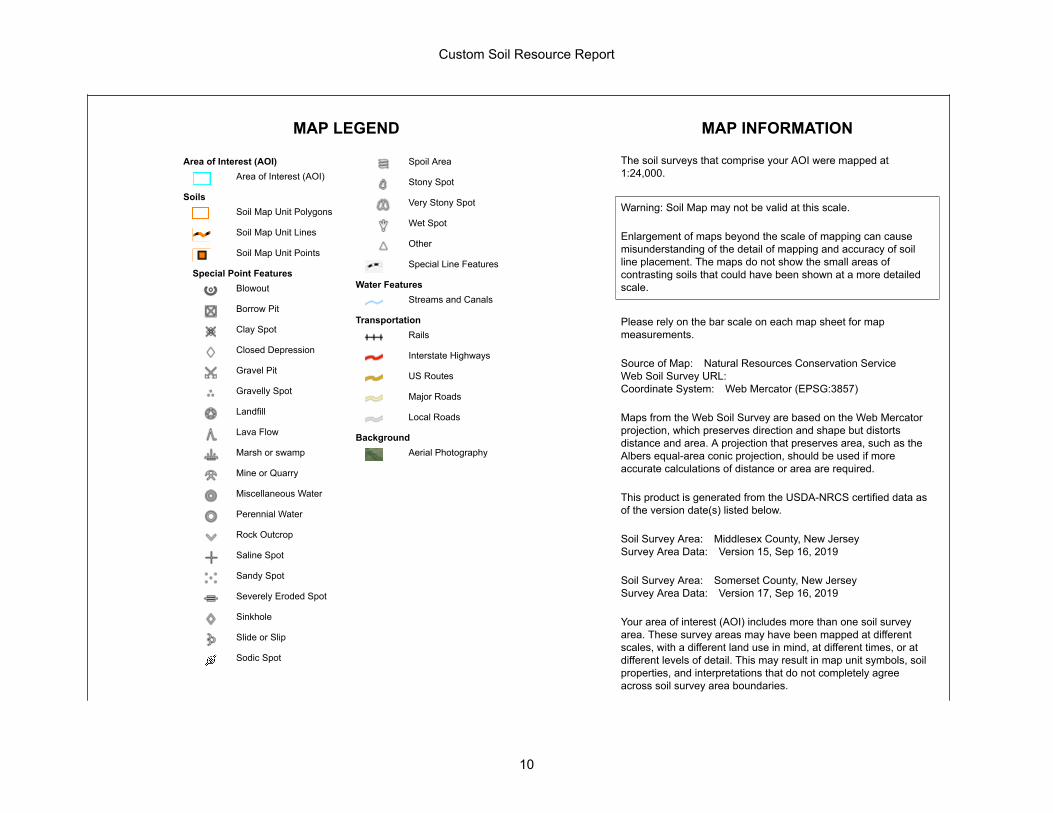
The soil surveys that comprise your AOI were mapped at 1:24,000.
Warning: Soil Map may not be valid at this scale.
Enlargement of maps beyond the scale of mapping can cause misunderstanding of the detail of mapping and accuracy of soil line placement. The maps do not show the small areas of contrasting soils that could have been shown at a more detailed scale.
Please rely on the bar scale on each map sheet for map measurements.
Source of Map: Natural Resources Conservation ServiceWeb Soil Survey URL: Coordinate System: Web Mercator (EPSG:3857)
Maps from the Web Soil Survey are based on the Web Mercator projection, which preserves direction and shape but distorts distance and area. A projection that preserves area, such as the Albers equal-area conic projection, should be used if more accurate calculations of distance or area are required.
This product is generated from the USDA-NRCS certified data as of the version date(s) listed below.
Soil Survey Area: Middlesex County, New JerseySurvey Area Data: Version 15, Sep 16, 2019
Soil Survey Area: Somerset County, New JerseySurvey Area Data: Version 17, Sep 16, 2019
Your area of interest (AOI) includes more than one soil survey area. These survey areas may have been mapped at different scales, with a different land use in mind, at different times, or at different levels of detail. This may result in map unit symbols, soil properties, and interpretations that do not completely agree across soil survey area boundaries.
Custom Soil Resource Report
10
MAP LEGEND MAP INFORMATION
Soil map units are labeled (as space allows) for map scales 1:50,000 or larger.
Date(s) aerial images were photographed: Jun 22, 2019—Jul 13, 2019
The orthophoto or other base map on which the soil lines were compiled and digitized probably differs from the background imagery displayed on these maps. As a result, some minor shifting of map unit boundaries may be evident.
Custom Soil Resource Report
11
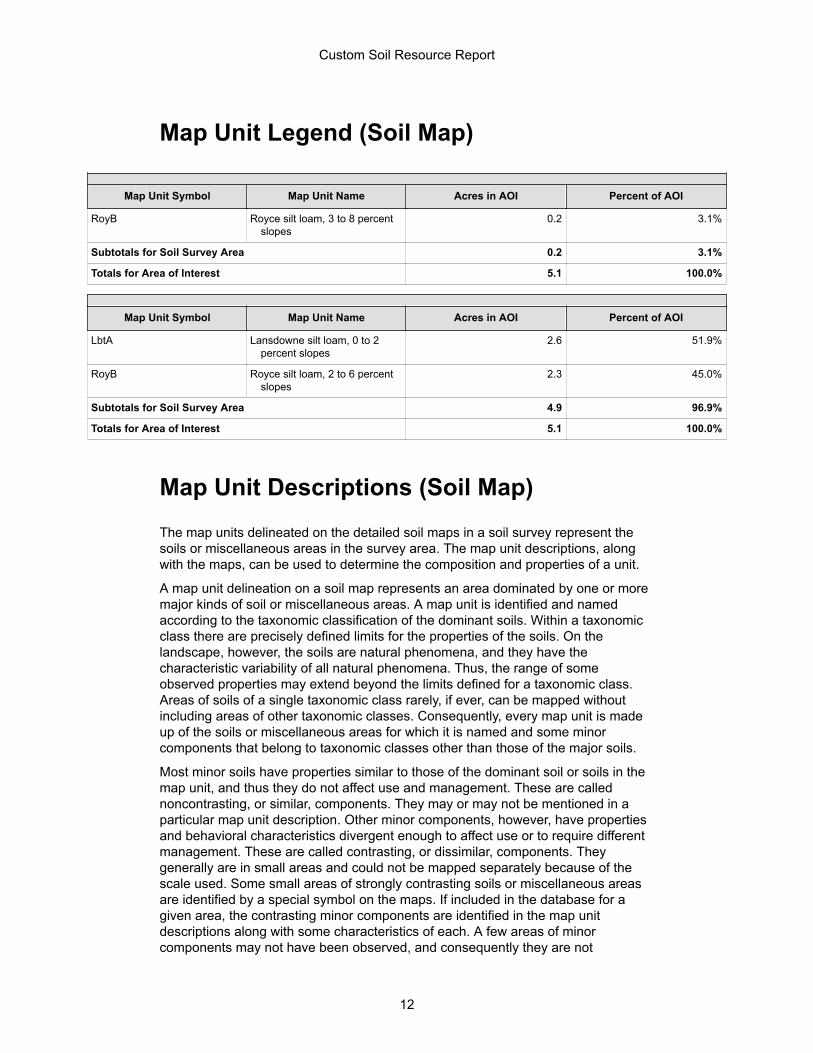
Map Unit Legend (Soil Map)
Map Unit Symbol Map Unit Name Acres in AOI Percent of AOI
RoyB Royce silt loam, 3 to 8 percent slopes
0.2 3.1%
Subtotals for Soil Survey Area 0.2 3.1%
Totals for Area of Interest 5.1 100.0%
Map Unit Symbol Map Unit Name Acres in AOI Percent of AOI
LbtA Lansdowne silt loam, 0 to 2 percent slopes
2.6 51.9%
RoyB Royce silt loam, 2 to 6 percent slopes
2.3 45.0%
Subtotals for Soil Survey Area 4.9 96.9%
Totals for Area of Interest 5.1 100.0%
Map Unit Descriptions (Soil Map)The map units delineated on the detailed soil maps in a soil survey represent the soils or miscellaneous areas in the survey area. The map unit descriptions, along with the maps, can be used to determine the composition and properties of a unit.
A map unit delineation on a soil map represents an area dominated by one or more major kinds of soil or miscellaneous areas. A map unit is identified and named according to the taxonomic classification of the dominant soils. Within a taxonomic class there are precisely defined limits for the properties of the soils. On the landscape, however, the soils are natural phenomena, and they have the characteristic variability of all natural phenomena. Thus, the range of some observed properties may extend beyond the limits defined for a taxonomic class. Areas of soils of a single taxonomic class rarely, if ever, can be mapped without including areas of other taxonomic classes. Consequently, every map unit is made up of the soils or miscellaneous areas for which it is named and some minor components that belong to taxonomic classes other than those of the major soils.
Most minor soils have properties similar to those of the dominant soil or soils in the map unit, and thus they do not affect use and management. These are called noncontrasting, or similar, components. They may or may not be mentioned in a particular map unit description. Other minor components, however, have properties and behavioral characteristics divergent enough to affect use or to require different management. These are called contrasting, or dissimilar, components. They generally are in small areas and could not be mapped separately because of the scale used. Some small areas of strongly contrasting soils or miscellaneous areas are identified by a special symbol on the maps. If included in the database for a given area, the contrasting minor components are identified in the map unit descriptions along with some characteristics of each. A few areas of minor components may not have been observed, and consequently they are not
Custom Soil Resource Report
12

mentioned in the descriptions, especially where the pattern was so complex that it was impractical to make enough observations to identify all the soils and miscellaneous areas on the landscape.
The presence of minor components in a map unit in no way diminishes the usefulness or accuracy of the data. The objective of mapping is not to delineate pure taxonomic classes but rather to separate the landscape into landforms or landform segments that have similar use and management requirements. The delineation of such segments on the map provides sufficient information for the development of resource plans. If intensive use of small areas is planned, however, onsite investigation is needed to define and locate the soils and miscellaneous areas.
An identifying symbol precedes the map unit name in the map unit descriptions. Each description includes general facts about the unit and gives important soil properties and qualities.
Soils that have profiles that are almost alike make up a soil series. Except for differences in texture of the surface layer, all the soils of a series have major horizons that are similar in composition, thickness, and arrangement.
Soils of one series can differ in texture of the surface layer, slope, stoniness, salinity, degree of erosion, and other characteristics that affect their use. On the basis of such differences, a soil series is divided into soil phases. Most of the areas shown on the detailed soil maps are phases of soil series. The name of a soil phase commonly indicates a feature that affects use or management. For example, Alpha silt loam, 0 to 2 percent slopes, is a phase of the Alpha series.
Some map units are made up of two or more major soils or miscellaneous areas. These map units are complexes, associations, or undifferentiated groups.
A complex consists of two or more soils or miscellaneous areas in such an intricate pattern or in such small areas that they cannot be shown separately on the maps. The pattern and proportion of the soils or miscellaneous areas are somewhat similar in all areas. Alpha-Beta complex, 0 to 6 percent slopes, is an example.
An association is made up of two or more geographically associated soils or miscellaneous areas that are shown as one unit on the maps. Because of present or anticipated uses of the map units in the survey area, it was not considered practical or necessary to map the soils or miscellaneous areas separately. The pattern and relative proportion of the soils or miscellaneous areas are somewhat similar. Alpha-Beta association, 0 to 2 percent slopes, is an example.
An undifferentiated group is made up of two or more soils or miscellaneous areas that could be mapped individually but are mapped as one unit because similar interpretations can be made for use and management. The pattern and proportion of the soils or miscellaneous areas in a mapped area are not uniform. An area can be made up of only one of the major soils or miscellaneous areas, or it can be made up of all of them. Alpha and Beta soils, 0 to 2 percent slopes, is an example.
Some surveys include miscellaneous areas. Such areas have little or no soil material and support little or no vegetation. Rock outcrop is an example.
Custom Soil Resource Report
13
Middlesex County, New Jersey
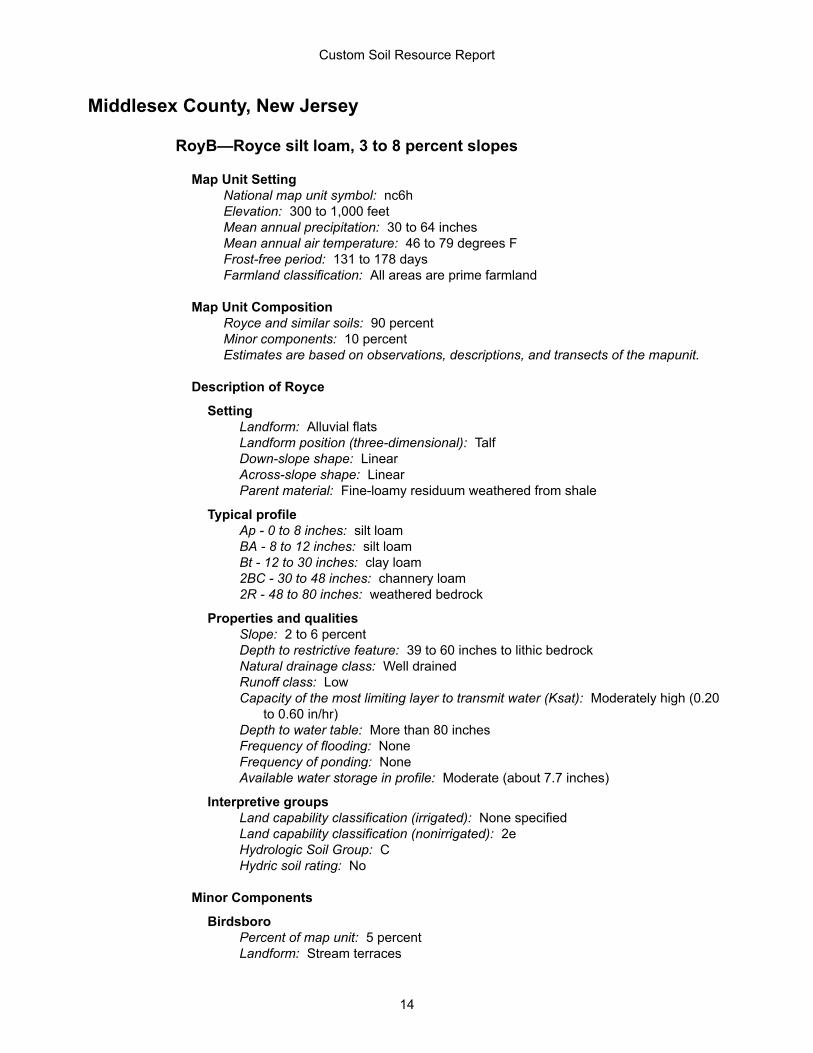
RoyB—Royce silt loam, 3 to 8 percent slopes
Map Unit SettingNational map unit symbol: nc6hElevation: 300 to 1,000 feetMean annual precipitation: 30 to 64 inchesMean annual air temperature: 46 to 79 degrees FFrost-free period: 131 to 178 daysFarmland classification: All areas are prime farmland
Map Unit CompositionRoyce and similar soils: 90 percentMinor components: 10 percentEstimates are based on observations, descriptions, and transects of the mapunit.
Description of Royce
SettingLandform: Alluvial flatsLandform position (three-dimensional): TalfDown-slope shape: LinearAcross-slope shape: LinearParent material: Fine-loamy residuum weathered from shale
Typical profileAp - 0 to 8 inches: silt loamBA - 8 to 12 inches: silt loamBt - 12 to 30 inches: clay loam2BC - 30 to 48 inches: channery loam2R - 48 to 80 inches: weathered bedrock
Properties and qualitiesSlope: 2 to 6 percentDepth to restrictive feature: 39 to 60 inches to lithic bedrockNatural drainage class: Well drainedRunoff class: LowCapacity of the most limiting layer to transmit water (Ksat): Moderately high (0.20
to 0.60 in/hr)Depth to water table: More than 80 inchesFrequency of flooding: NoneFrequency of ponding: NoneAvailable water storage in profile: Moderate (about 7.7 inches)
Interpretive groupsLand capability classification (irrigated): None specifiedLand capability classification (nonirrigated): 2eHydrologic Soil Group: CHydric soil rating: No
Minor Components
BirdsboroPercent of map unit: 5 percentLandform: Stream terraces
Custom Soil Resource Report
14
Landform position (two-dimensional): BackslopeLandform position (three-dimensional): TreadDown-slope shape: LinearAcross-slope shape: LinearHydric soil rating: No
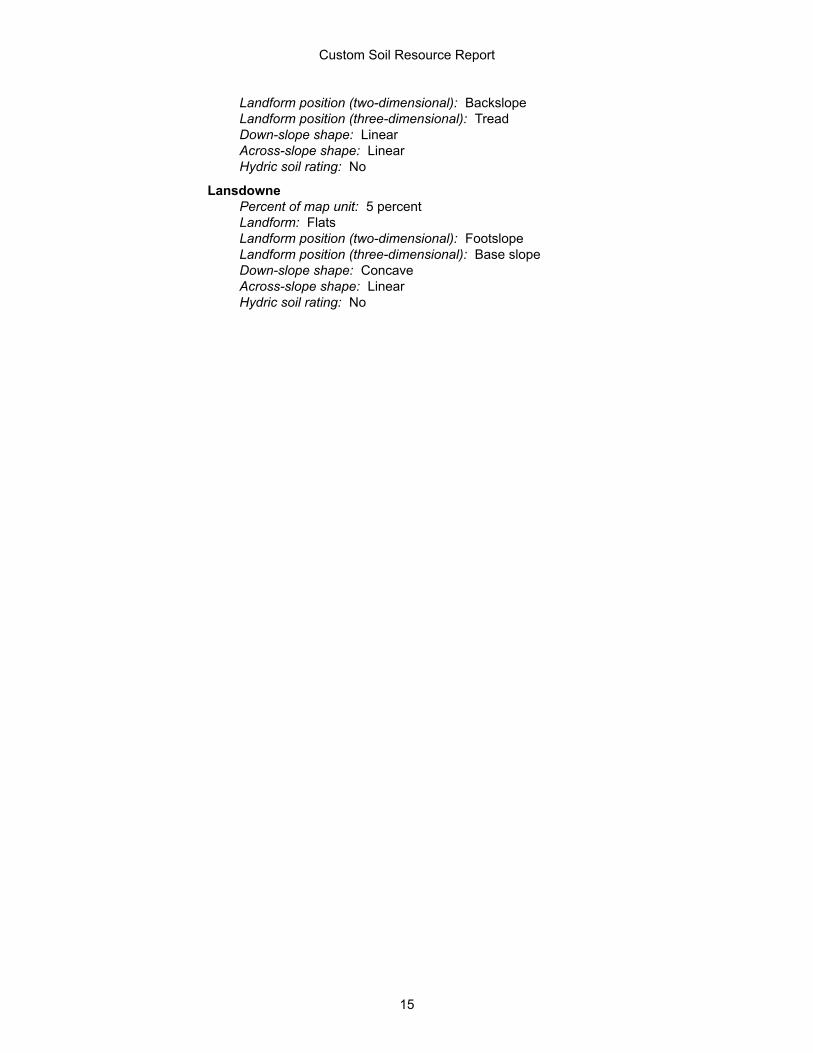
LansdownePercent of map unit: 5 percentLandform: FlatsLandform position (two-dimensional): FootslopeLandform position (three-dimensional): Base slopeDown-slope shape: ConcaveAcross-slope shape: LinearHydric soil rating: No
Custom Soil Resource Report
15
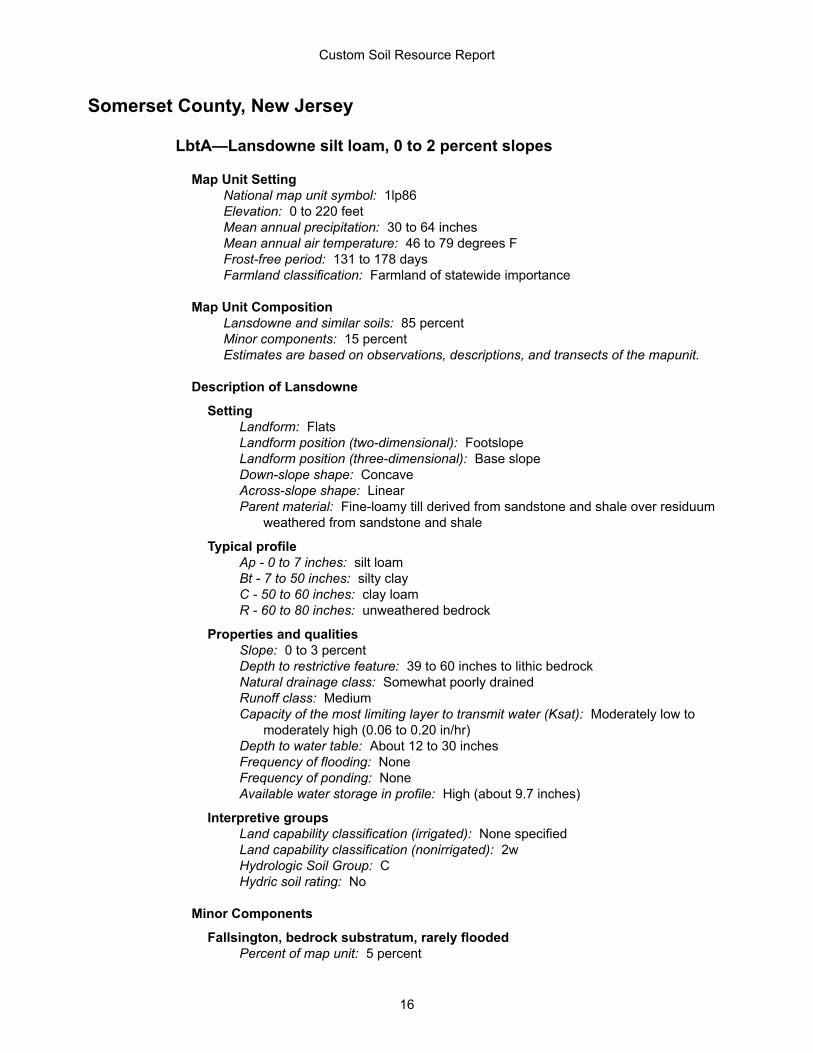
Somerset County, New Jersey
LbtA—Lansdowne silt loam, 0 to 2 percent slopes
Map Unit SettingNational map unit symbol: 1lp86Elevation: 0 to 220 feetMean annual precipitation: 30 to 64 inchesMean annual air temperature: 46 to 79 degrees FFrost-free period: 131 to 178 daysFarmland classification: Farmland of statewide importance
Map Unit CompositionLansdowne and similar soils: 85 percentMinor components: 15 percentEstimates are based on observations, descriptions, and transects of the mapunit.
Description of Lansdowne
SettingLandform: FlatsLandform position (two-dimensional): FootslopeLandform position (three-dimensional): Base slopeDown-slope shape: ConcaveAcross-slope shape: LinearParent material: Fine-loamy till derived from sandstone and shale over residuum
weathered from sandstone and shale
Typical profileAp - 0 to 7 inches: silt loamBt - 7 to 50 inches: silty clayC - 50 to 60 inches: clay loamR - 60 to 80 inches: unweathered bedrock
Properties and qualitiesSlope: 0 to 3 percentDepth to restrictive feature: 39 to 60 inches to lithic bedrockNatural drainage class: Somewhat poorly drainedRunoff class: MediumCapacity of the most limiting layer to transmit water (Ksat): Moderately low to
moderately high (0.06 to 0.20 in/hr)Depth to water table: About 12 to 30 inchesFrequency of flooding: NoneFrequency of ponding: NoneAvailable water storage in profile: High (about 9.7 inches)
Interpretive groupsLand capability classification (irrigated): None specifiedLand capability classification (nonirrigated): 2wHydrologic Soil Group: CHydric soil rating: No
Minor Components
Fallsington, bedrock substratum, rarely floodedPercent of map unit: 5 percent
Custom Soil Resource Report
16
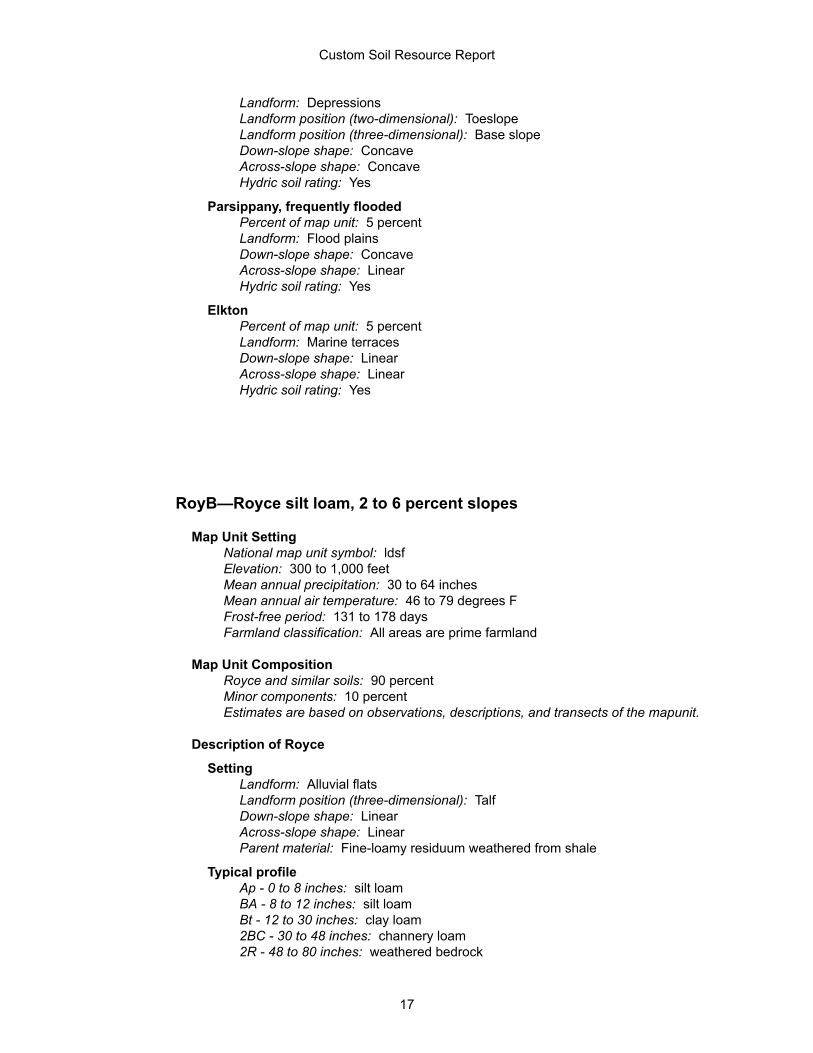
Landform: DepressionsLandform position (two-dimensional): ToeslopeLandform position (three-dimensional): Base slopeDown-slope shape: ConcaveAcross-slope shape: ConcaveHydric soil rating: Yes
Parsippany, frequently floodedPercent of map unit: 5 percentLandform: Flood plainsDown-slope shape: ConcaveAcross-slope shape: LinearHydric soil rating: Yes
ElktonPercent of map unit: 5 percentLandform: Marine terracesDown-slope shape: LinearAcross-slope shape: LinearHydric soil rating: Yes
RoyB—Royce silt loam, 2 to 6 percent slopes
Map Unit SettingNational map unit symbol: ldsfElevation: 300 to 1,000 feetMean annual precipitation: 30 to 64 inchesMean annual air temperature: 46 to 79 degrees FFrost-free period: 131 to 178 daysFarmland classification: All areas are prime farmland
Map Unit CompositionRoyce and similar soils: 90 percentMinor components: 10 percentEstimates are based on observations, descriptions, and transects of the mapunit.
Description of Royce
SettingLandform: Alluvial flatsLandform position (three-dimensional): TalfDown-slope shape: LinearAcross-slope shape: LinearParent material: Fine-loamy residuum weathered from shale
Typical profileAp - 0 to 8 inches: silt loamBA - 8 to 12 inches: silt loamBt - 12 to 30 inches: clay loam2BC - 30 to 48 inches: channery loam2R - 48 to 80 inches: weathered bedrock
Custom Soil Resource Report
17
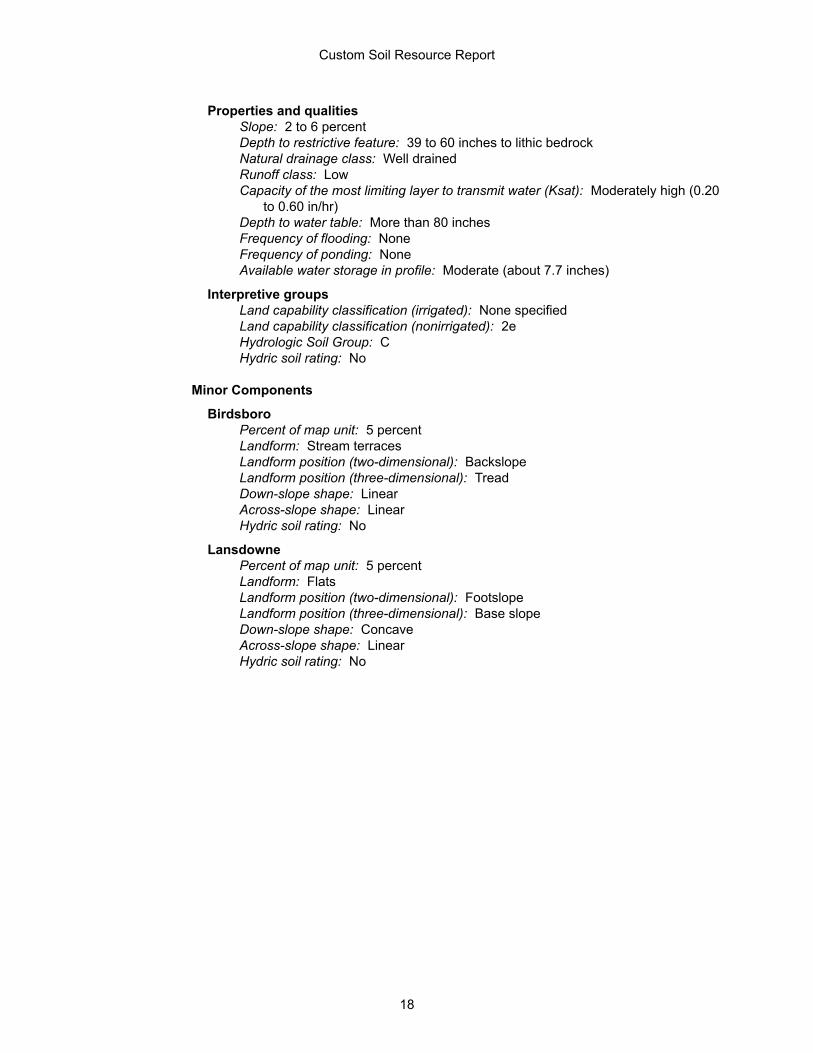
Properties and qualitiesSlope: 2 to 6 percentDepth to restrictive feature: 39 to 60 inches to lithic bedrockNatural drainage class: Well drainedRunoff class: LowCapacity of the most limiting layer to transmit water (Ksat): Moderately high (0.20
to 0.60 in/hr)Depth to water table: More than 80 inchesFrequency of flooding: NoneFrequency of ponding: NoneAvailable water storage in profile: Moderate (about 7.7 inches)
Interpretive groupsLand capability classification (irrigated): None specifiedLand capability classification (nonirrigated): 2eHydrologic Soil Group: CHydric soil rating: No
Minor Components
BirdsboroPercent of map unit: 5 percentLandform: Stream terracesLandform position (two-dimensional): BackslopeLandform position (three-dimensional): TreadDown-slope shape: LinearAcross-slope shape: LinearHydric soil rating: No
LansdownePercent of map unit: 5 percentLandform: FlatsLandform position (two-dimensional): FootslopeLandform position (three-dimensional): Base slopeDown-slope shape: ConcaveAcross-slope shape: LinearHydric soil rating: No
Custom Soil Resource Report
18
ReferencesAmerican Association of State Highway and Transportation Officials (AASHTO). 2004. Standard specifications for transportation materials and methods of sampling and testing. 24th edition.
American Society for Testing and Materials (ASTM). 2005. Standard classification of soils for engineering purposes. ASTM Standard D2487-00.
Cowardin, L.M., V. Carter, F.C. Golet, and E.T. LaRoe. 1979. Classification of wetlands and deep-water habitats of the United States. U.S. Fish and Wildlife Service FWS/OBS-79/31.
Federal Register. July 13, 1994. Changes in hydric soils of the United States.
Federal Register. September 18, 2002. Hydric soils of the United States.
Hurt, G.W., and L.M. Vasilas, editors. Version 6.0, 2006. Field indicators of hydric soils in the United States.
National Research Council. 1995. Wetlands: Characteristics and boundaries.
Soil Survey Division Staff. 1993. Soil survey manual. Soil Conservation Service. U.S. Department of Agriculture Handbook 18. http://www.nrcs.usda.gov/wps/portal/nrcs/detail/national/soils/?cid=nrcs142p2_054262
Soil Survey Staff. 1999. Soil taxonomy: A basic system of soil classification for making and interpreting soil surveys. 2nd edition. Natural Resources Conservation Service, U.S. Department of Agriculture Handbook 436. http://www.nrcs.usda.gov/wps/portal/nrcs/detail/national/soils/?cid=nrcs142p2_053577
Soil Survey Staff. 2010. Keys to soil taxonomy. 11th edition. U.S. Department of Agriculture, Natural Resources Conservation Service. http://www.nrcs.usda.gov/wps/portal/nrcs/detail/national/soils/?cid=nrcs142p2_053580
Tiner, R.W., Jr. 1985. Wetlands of Delaware. U.S. Fish and Wildlife Service and Delaware Department of Natural Resources and Environmental Control, Wetlands Section.
United States Army Corps of Engineers, Environmental Laboratory. 1987. Corps of Engineers wetlands delineation manual. Waterways Experiment Station Technical Report Y-87-1.
United States Department of Agriculture, Natural Resources Conservation Service. National forestry manual. http://www.nrcs.usda.gov/wps/portal/nrcs/detail/soils/home/?cid=nrcs142p2_053374
United States Department of Agriculture, Natural Resources Conservation Service. National range and pasture handbook. http://www.nrcs.usda.gov/wps/portal/nrcs/detail/national/landuse/rangepasture/?cid=stelprdb1043084
19

United States Department of Agriculture, Natural Resources Conservation Service. National soil survey handbook, title 430-VI. http://www.nrcs.usda.gov/wps/portal/nrcs/detail/soils/scientists/?cid=nrcs142p2_054242
United States Department of Agriculture, Natural Resources Conservation Service. 2006. Land resource regions and major land resource areas of the United States, the Caribbean, and the Pacific Basin. U.S. Department of Agriculture Handbook 296. http://www.nrcs.usda.gov/wps/portal/nrcs/detail/national/soils/?cid=nrcs142p2_053624
United States Department of Agriculture, Soil Conservation Service. 1961. Land capability classification. U.S. Department of Agriculture Handbook 210. http://www.nrcs.usda.gov/Internet/FSE_DOCUMENTS/nrcs142p2_052290.pdf
Custom Soil Resource Report
20

APPENDIX C
DESIGN CALCULATIONS & DIAGRAMS
APPENDIX C-1
HYDROCAD ROUTING DIAGRAM
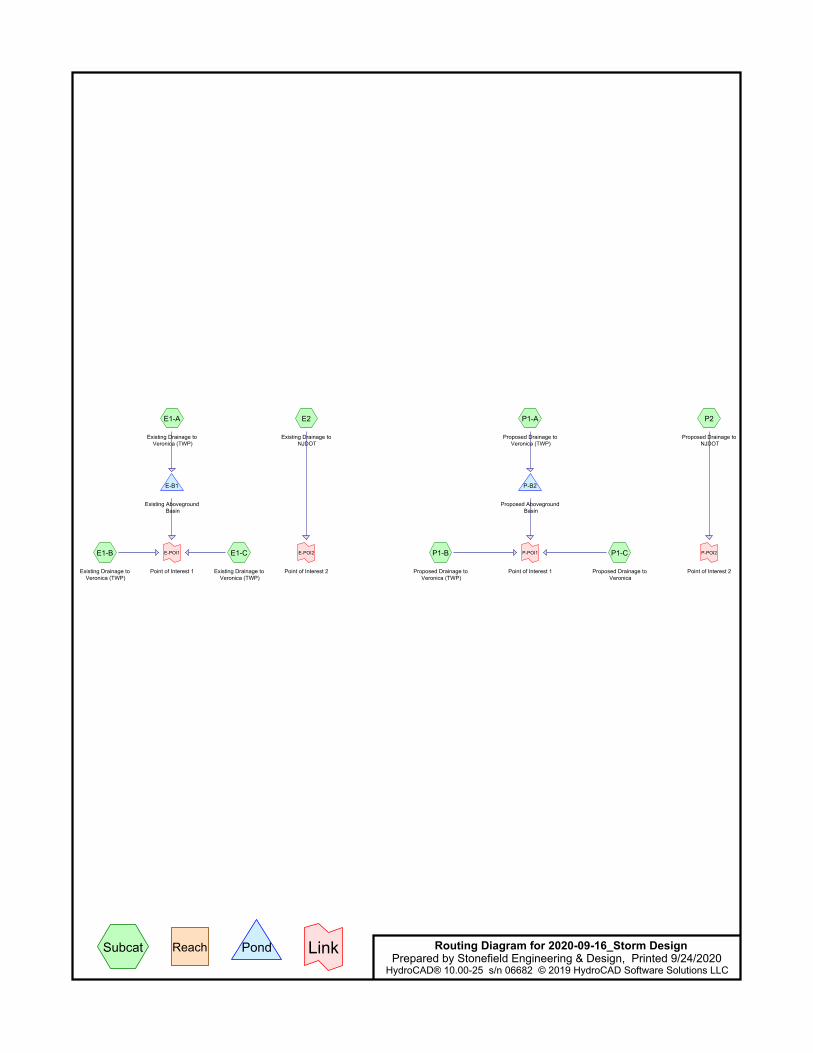
E1-A
Existing Drainage to Veronica (TWP)
E1-B
Existing Drainage to Veronica (TWP)
E1-C
Existing Drainage to Veronica (TWP)
E2
Existing Drainage to NJDOT
P1-A
Proposed Drainage to Veronica (TWP)
P1-B
Proposed Drainage to Veronica (TWP)
P1-C
Proposed Drainage to Veronica
P2
Proposed Drainage to NJDOT
E-B1
Existing Aboveground Basin
P-B2
Proposed Aboveground Basin
E-POI1
Point of Interest 1
E-POI2
Point of Interest 2
P-POI1
Point of Interest 1
P-POI2
Point of Interest 2
Routing Diagram for 2020-09-16_Storm DesignPrepared by Stonefield Engineering & Design, Printed 9/24/2020
HydroCAD® 10.00-25 s/n 06682 © 2019 HydroCAD Software Solutions LLC
Subcat Reach Pond Link
APPENDIX C-2
2-YEAR STORM EVENT HYDROGRAPHS

NOAA 24-hr C 2-YR Rainfall=3.32"2020-09-16_Storm Design Printed 9/25/2020Prepared by Stonefield Engineering & Design
Page 1HydroCAD® 10.00-25 s/n 06682 © 2019 HydroCAD Software Solutions LLC
Summary for Subcatchment E1-A: Existing Drainage to Veronica (TWP)
Runoff = 11.48 cfs @ 12.17 hrs, Volume= 41,750 cf, Depth= 2.66"
Runoff by SCS TR-20 method, UH=SCS, Split Pervious/Imperv., Time Span= 0.00-72.00 hrs, dt= 0.02 hrsNOAA 24-hr C 2-YR Rainfall=3.32"
Area (sf) CN Description* 147,459 98 Impervious
40,973 74 >75% Grass cover, Good, HSG C188,432 93 Weighted Average
40,973 74 21.74% Pervious Area147,459 98 78.26% Impervious Area
Tc Length Slope Velocity Capacity Description(min) (feet) (ft/ft) (ft/sec) (cfs)
1.4 109 0.0170 1.34 Sheet Flow, Segment A-BSmooth surfaces n= 0.011 P2= 3.32"
3.5 652 0.0030 3.12 3.83 Pipe Channel, Segment B-C15.0" Round Area= 1.2 sf Perim= 3.9' r= 0.31'n= 0.012 Concrete pipe, finished
4.9 761 Total, Increased to minimum Tc = 10.0 min
Subcatchment E1-A: Existing Drainage to Veronica (TWP)
Runoff
Hydrograph
Time (hours)727068666462605856545250484644424038363432302826242220181614121086420
Flo
w (
cfs)
12
11
10
9
8
7
6
5
4
3
2
1
0
NOAA 24-hr C2-YR Rainfall=3.32"
Runoff Area=188,432 sfRunoff Volume=41,750 cf
Runoff Depth=2.66"Flow Length=761'
Tc=10.0 minCN=74/98
11.48 cfs @ 12.17 hrs

NOAA 24-hr C 2-YR Rainfall=3.32"2020-09-16_Storm Design Printed 9/25/2020Prepared by Stonefield Engineering & Design
Page 2HydroCAD® 10.00-25 s/n 06682 © 2019 HydroCAD Software Solutions LLC
Summary for Subcatchment E1-B: Existing Drainage to Veronica (TWP)
Runoff = 0.24 cfs @ 12.18 hrs, Volume= 839 cf, Depth= 1.53"
Runoff by SCS TR-20 method, UH=SCS, Split Pervious/Imperv., Time Span= 0.00-72.00 hrs, dt= 0.02 hrsNOAA 24-hr C 2-YR Rainfall=3.32"
Area (sf) CN Description* 1,373 98 Impervious
5,214 74 >75% Grass cover, Good, HSG C6,587 79 Weighted Average5,214 74 79.16% Pervious Area1,373 98 20.84% Impervious Area
Tc Length Slope Velocity Capacity Description(min) (feet) (ft/ft) (ft/sec) (cfs)10.0 Direct Entry,
Subcatchment E1-B: Existing Drainage to Veronica (TWP)
Runoff
Hydrograph
Time (hours)727068666462605856545250484644424038363432302826242220181614121086420
Flo
w (
cfs)
0.26
0.24
0.22
0.2
0.18
0.16
0.14
0.12
0.1
0.08
0.06
0.04
0.02
0
NOAA 24-hr C2-YR Rainfall=3.32"
Runoff Area=6,587 sfRunoff Volume=839 cf
Runoff Depth=1.53"Tc=10.0 min
CN=74/98
0.24 cfs @ 12.18 hrs
NOAA 24-hr C 2-YR Rainfall=3.32"2020-09-16_Storm Design Printed 9/25/2020Prepared by Stonefield Engineering & Design
Page 3HydroCAD® 10.00-25 s/n 06682 © 2019 HydroCAD Software Solutions LLC
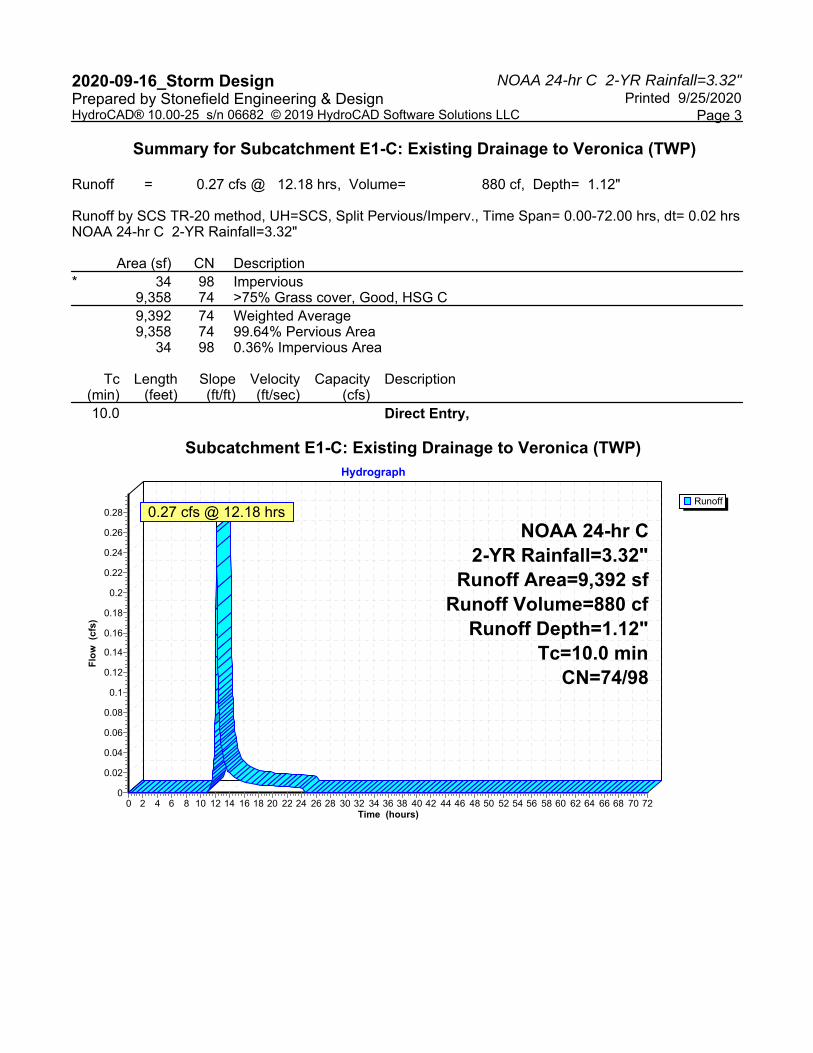
Summary for Subcatchment E1-C: Existing Drainage to Veronica (TWP)
Runoff = 0.27 cfs @ 12.18 hrs, Volume= 880 cf, Depth= 1.12"
Runoff by SCS TR-20 method, UH=SCS, Split Pervious/Imperv., Time Span= 0.00-72.00 hrs, dt= 0.02 hrsNOAA 24-hr C 2-YR Rainfall=3.32"
Area (sf) CN Description* 34 98 Impervious
9,358 74 >75% Grass cover, Good, HSG C9,392 74 Weighted Average9,358 74 99.64% Pervious Area
34 98 0.36% Impervious Area
Tc Length Slope Velocity Capacity Description(min) (feet) (ft/ft) (ft/sec) (cfs)10.0 Direct Entry,
Subcatchment E1-C: Existing Drainage to Veronica (TWP)
Runoff
Hydrograph
Time (hours)727068666462605856545250484644424038363432302826242220181614121086420
Flo
w (
cfs)
0.28
0.26
0.24
0.22
0.2
0.18
0.16
0.14
0.12
0.1
0.08
0.06
0.04
0.02
0
NOAA 24-hr C2-YR Rainfall=3.32"
Runoff Area=9,392 sfRunoff Volume=880 cf
Runoff Depth=1.12"Tc=10.0 min
CN=74/98
0.27 cfs @ 12.18 hrs

NOAA 24-hr C 2-YR Rainfall=3.32"2020-09-16_Storm Design Printed 9/25/2020Prepared by Stonefield Engineering & Design
Page 4HydroCAD® 10.00-25 s/n 06682 © 2019 HydroCAD Software Solutions LLC
Summary for Subcatchment E2: Existing Drainage to NJDOT
Runoff = 0.54 cfs @ 12.18 hrs, Volume= 1,883 cf, Depth= 1.69"
Runoff by SCS TR-20 method, UH=SCS, Split Pervious/Imperv., Time Span= 0.00-72.00 hrs, dt= 0.02 hrsNOAA 24-hr C 2-YR Rainfall=3.32"
Area (sf) CN Description* 3,872 98 Impervious
9,528 74 >75% Grass cover, Good, HSG C13,400 81 Weighted Average
9,528 74 71.10% Pervious Area3,872 98 28.90% Impervious Area
Tc Length Slope Velocity Capacity Description(min) (feet) (ft/ft) (ft/sec) (cfs)10.0 Direct Entry,
Subcatchment E2: Existing Drainage to NJDOT
Runoff
Hydrograph
Time (hours)727068666462605856545250484644424038363432302826242220181614121086420
Flo
w (
cfs)
0.6
0.55
0.5
0.45
0.4
0.35
0.3
0.25
0.2
0.15
0.1
0.05
0
NOAA 24-hr C2-YR Rainfall=3.32"
Runoff Area=13,400 sfRunoff Volume=1,883 cf
Runoff Depth=1.69"Tc=10.0 min
CN=74/98
0.54 cfs @ 12.18 hrs

NOAA 24-hr C 2-YR Rainfall=3.32"2020-09-16_Storm Design Printed 9/25/2020Prepared by Stonefield Engineering & Design
Page 5HydroCAD® 10.00-25 s/n 06682 © 2019 HydroCAD Software Solutions LLC
Summary for Subcatchment P1-A: Proposed Drainage to Veronica (TWP)
Runoff = 11.56 cfs @ 12.17 hrs, Volume= 42,132 cf, Depth= 2.76"
Runoff by SCS TR-20 method, UH=SCS, Split Pervious/Imperv., Time Span= 0.00-72.00 hrs, dt= 0.02 hrsNOAA 24-hr C 2-YR Rainfall=3.32"
Area (sf) CN Description* 152,714 98 Impervious
30,559 74 >75% Grass cover, Good, HSG C183,273 94 Weighted Average
30,559 74 16.67% Pervious Area152,714 98 83.33% Impervious Area
Tc Length Slope Velocity Capacity Description(min) (feet) (ft/ft) (ft/sec) (cfs)10.0 Direct Entry,
Subcatchment P1-A: Proposed Drainage to Veronica (TWP)
Runoff
Hydrograph
Time (hours)727068666462605856545250484644424038363432302826242220181614121086420
Flo
w (
cfs)
12
11
10
9
8
7
6
5
4
3
2
1
0
NOAA 24-hr C2-YR Rainfall=3.32"
Runoff Area=183,273 sfRunoff Volume=42,132 cf
Runoff Depth=2.76"Tc=10.0 min
CN=74/98
11.56 cfs @ 12.17 hrs

NOAA 24-hr C 2-YR Rainfall=3.32"2020-09-16_Storm Design Printed 9/25/2020Prepared by Stonefield Engineering & Design
Page 6HydroCAD® 10.00-25 s/n 06682 © 2019 HydroCAD Software Solutions LLC
Summary for Subcatchment P1-B: Proposed Drainage to Veronica (TWP)
Runoff = 0.21 cfs @ 12.18 hrs, Volume= 719 cf, Depth= 1.63"
Runoff by SCS TR-20 method, UH=SCS, Split Pervious/Imperv., Time Span= 0.00-72.00 hrs, dt= 0.02 hrsNOAA 24-hr C 2-YR Rainfall=3.32"
Area (sf) CN Description* 1,370 98 Impervious
3,939 74 >75% Grass cover, Good, HSG C5,309 80 Weighted Average3,939 74 74.19% Pervious Area1,370 98 25.81% Impervious Area
Tc Length Slope Velocity Capacity Description(min) (feet) (ft/ft) (ft/sec) (cfs)10.0 Direct Entry,
Subcatchment P1-B: Proposed Drainage to Veronica (TWP)
Runoff
Hydrograph
Time (hours)727068666462605856545250484644424038363432302826242220181614121086420
Flo
w (
cfs)
0.230.220.21
0.20.190.180.170.160.150.140.130.120.11
0.10.090.080.070.060.050.040.030.020.01
0
NOAA 24-hr C2-YR Rainfall=3.32"
Runoff Area=5,309 sfRunoff Volume=719 cf
Runoff Depth=1.63"Tc=10.0 min
CN=74/98
0.21 cfs @ 12.18 hrs

NOAA 24-hr C 2-YR Rainfall=3.32"2020-09-16_Storm Design Printed 9/25/2020Prepared by Stonefield Engineering & Design
Page 7HydroCAD® 10.00-25 s/n 06682 © 2019 HydroCAD Software Solutions LLC
Summary for Subcatchment P1-C: Proposed Drainage to Veronica
Runoff = 0.45 cfs @ 12.18 hrs, Volume= 1,495 cf, Depth= 1.12"
Runoff by SCS TR-20 method, UH=SCS, Split Pervious/Imperv., Time Span= 0.00-72.00 hrs, dt= 0.02 hrsNOAA 24-hr C 2-YR Rainfall=3.32"
Area (sf) CN Description16,052 74 >75% Grass cover, Good, HSG C16,052 74 100.00% Pervious Area
Tc Length Slope Velocity Capacity Description(min) (feet) (ft/ft) (ft/sec) (cfs)10.0 Direct Entry,
Subcatchment P1-C: Proposed Drainage to Veronica
Runoff
Hydrograph
Time (hours)727068666462605856545250484644424038363432302826242220181614121086420
Flo
w (
cfs)
0.50.480.460.440.42
0.40.380.360.340.32
0.30.280.260.240.22
0.20.180.160.140.12
0.10.080.060.040.02
0
NOAA 24-hr C2-YR Rainfall=3.32"
Runoff Area=16,052 sfRunoff Volume=1,495 cf
Runoff Depth=1.12"Tc=10.0 min
CN=74/0
0.45 cfs @ 12.18 hrs

NOAA 24-hr C 2-YR Rainfall=3.32"2020-09-16_Storm Design Printed 9/25/2020Prepared by Stonefield Engineering & Design
Page 8HydroCAD® 10.00-25 s/n 06682 © 2019 HydroCAD Software Solutions LLC
Summary for Subcatchment P2: Proposed Drainage to NJDOT
Runoff = 0.53 cfs @ 12.18 hrs, Volume= 1,851 cf, Depth= 1.69"
Runoff by SCS TR-20 method, UH=SCS, Split Pervious/Imperv., Time Span= 0.00-72.00 hrs, dt= 0.02 hrsNOAA 24-hr C 2-YR Rainfall=3.32"
Area (sf) CN Description* 3,800 98 Impervious
9,377 74 >75% Grass cover, Good, HSG C13,177 81 Weighted Average
9,377 74 71.16% Pervious Area3,800 98 28.84% Impervious Area
Tc Length Slope Velocity Capacity Description(min) (feet) (ft/ft) (ft/sec) (cfs)10.0 Direct Entry,
Subcatchment P2: Proposed Drainage to NJDOT
Runoff
Hydrograph
Time (hours)727068666462605856545250484644424038363432302826242220181614121086420
Flo
w (
cfs)
0.55
0.5
0.45
0.4
0.35
0.3
0.25
0.2
0.15
0.1
0.05
0
NOAA 24-hr C2-YR Rainfall=3.32"
Runoff Area=13,177 sfRunoff Volume=1,851 cf
Runoff Depth=1.69"Tc=10.0 min
CN=74/98
0.53 cfs @ 12.18 hrs
NOAA 24-hr C 2-YR Rainfall=3.32"2020-09-16_Storm Design Printed 9/25/2020Prepared by Stonefield Engineering & Design
Page 9HydroCAD® 10.00-25 s/n 06682 © 2019 HydroCAD Software Solutions LLC
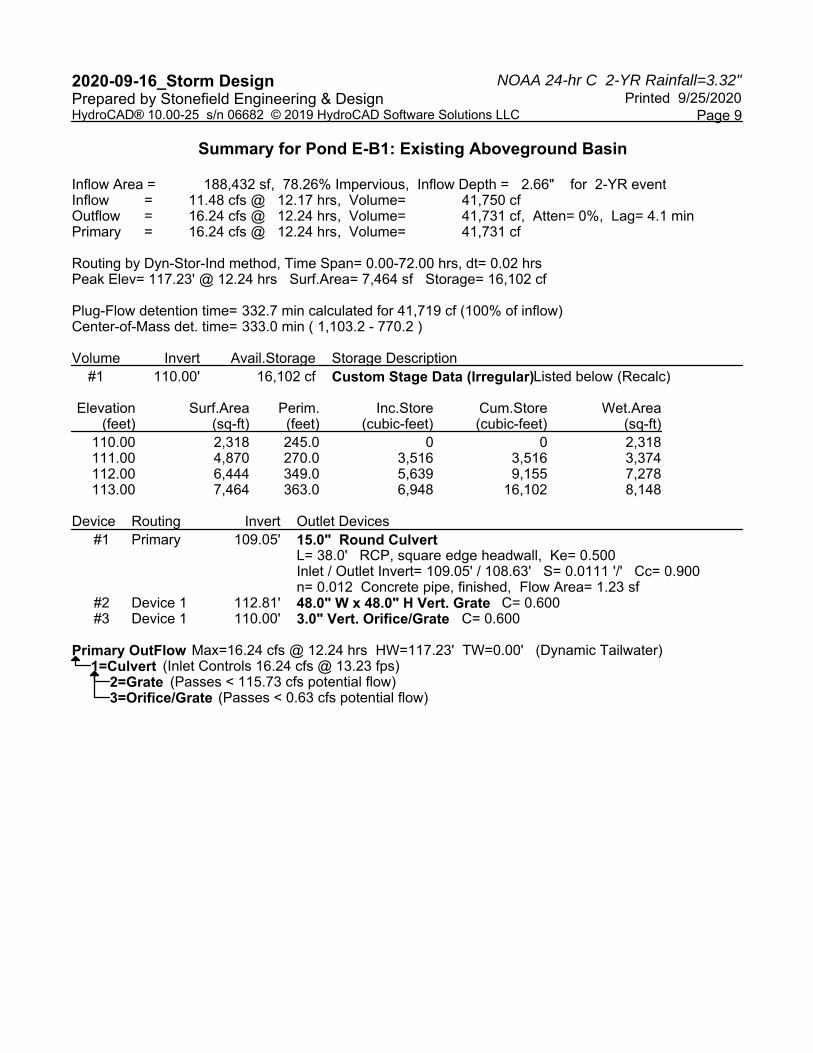
Summary for Pond E-B1: Existing Aboveground Basin
Inflow Area = 188,432 sf, 78.26% Impervious, Inflow Depth = 2.66" for 2-YR eventInflow = 11.48 cfs @ 12.17 hrs, Volume= 41,750 cfOutflow = 16.24 cfs @ 12.24 hrs, Volume= 41,731 cf, Atten= 0%, Lag= 4.1 minPrimary = 16.24 cfs @ 12.24 hrs, Volume= 41,731 cf
Routing by Dyn-Stor-Ind method, Time Span= 0.00-72.00 hrs, dt= 0.02 hrsPeak Elev= 117.23' @ 12.24 hrs Surf.Area= 7,464 sf Storage= 16,102 cf
Plug-Flow detention time= 332.7 min calculated for 41,719 cf (100% of inflow)Center-of-Mass det. time= 333.0 min ( 1,103.2 - 770.2 )
Volume Invert Avail.Storage Storage Description#1 110.00' 16,102 cf Custom Stage Data (Irregular) Listed below (Recalc)
Elevation Surf.Area Perim. Inc.Store Cum.Store Wet.Area(feet) (sq-ft) (feet) (cubic-feet) (cubic-feet) (sq-ft)
110.00 2,318 245.0 0 0 2,318111.00 4,870 270.0 3,516 3,516 3,374112.00 6,444 349.0 5,639 9,155 7,278113.00 7,464 363.0 6,948 16,102 8,148
Device Routing Invert Outlet Devices#1 Primary 109.05' 15.0" Round Culvert
L= 38.0' RCP, square edge headwall, Ke= 0.500 Inlet / Outlet Invert= 109.05' / 108.63' S= 0.0111 '/' Cc= 0.900 n= 0.012 Concrete pipe, finished, Flow Area= 1.23 sf
#2 Device 1 112.81' 48.0" W x 48.0" H Vert. Grate C= 0.600 #3 Device 1 110.00' 3.0" Vert. Orifice/Grate C= 0.600
Primary OutFlow Max=16.24 cfs @ 12.24 hrs HW=117.23' TW=0.00' (Dynamic Tailwater)1=Culvert (Inlet Controls 16.24 cfs @ 13.23 fps)
2=Grate (Passes < 115.73 cfs potential flow)3=Orifice/Grate (Passes < 0.63 cfs potential flow)

NOAA 24-hr C 2-YR Rainfall=3.32"2020-09-16_Storm Design Printed 9/25/2020Prepared by Stonefield Engineering & Design
Page 10HydroCAD® 10.00-25 s/n 06682 © 2019 HydroCAD Software Solutions LLC
Pond E-B1: Existing Aboveground Basin
InflowPrimary
Hydrograph
Time (hours)727068666462605856545250484644424038363432302826242220181614121086420
Flo
w (
cfs)
18
17
16
15
14
13
12
11
10
9
8
7
6
5
4
3
2
1
0
Inflow Area=188,432 sfPeak Elev=117.23'Storage=16,102 cf
11.48 cfs @ 12.17 hrs
16.24 cfs @ 12.24 hrs
NOAA 24-hr C 2-YR Rainfall=3.32"2020-09-16_Storm Design Printed 9/25/2020Prepared by Stonefield Engineering & Design
Page 11HydroCAD® 10.00-25 s/n 06682 © 2019 HydroCAD Software Solutions LLC
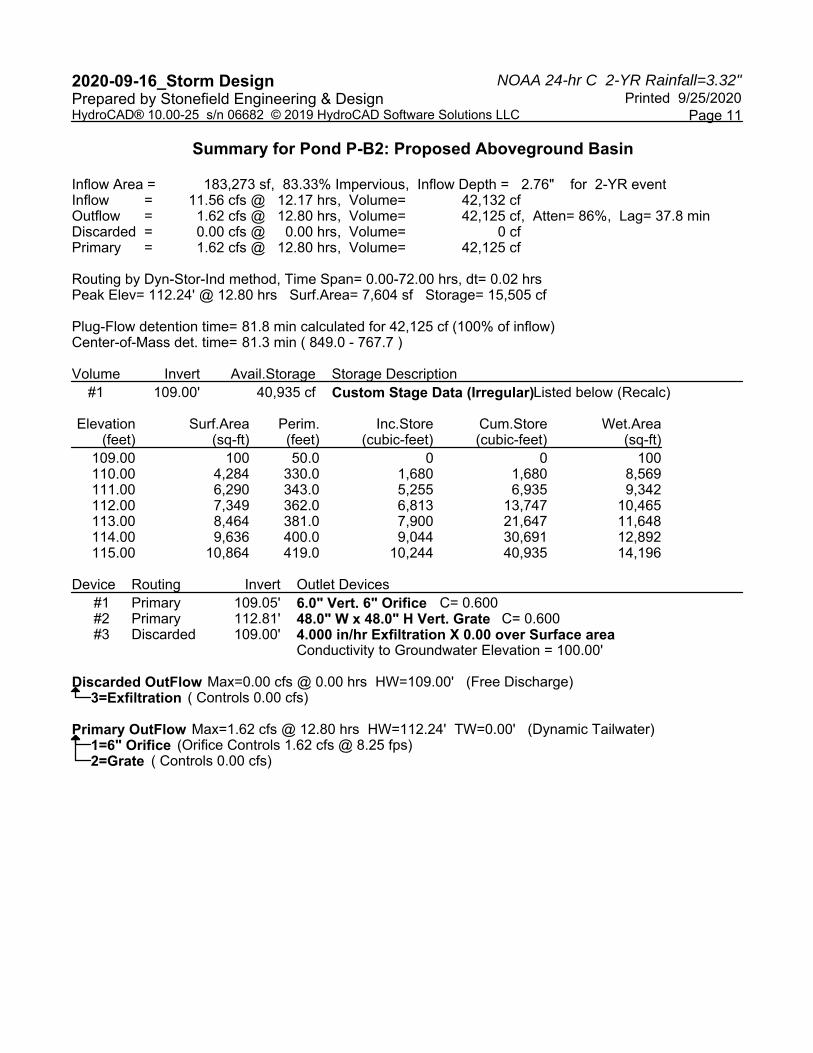
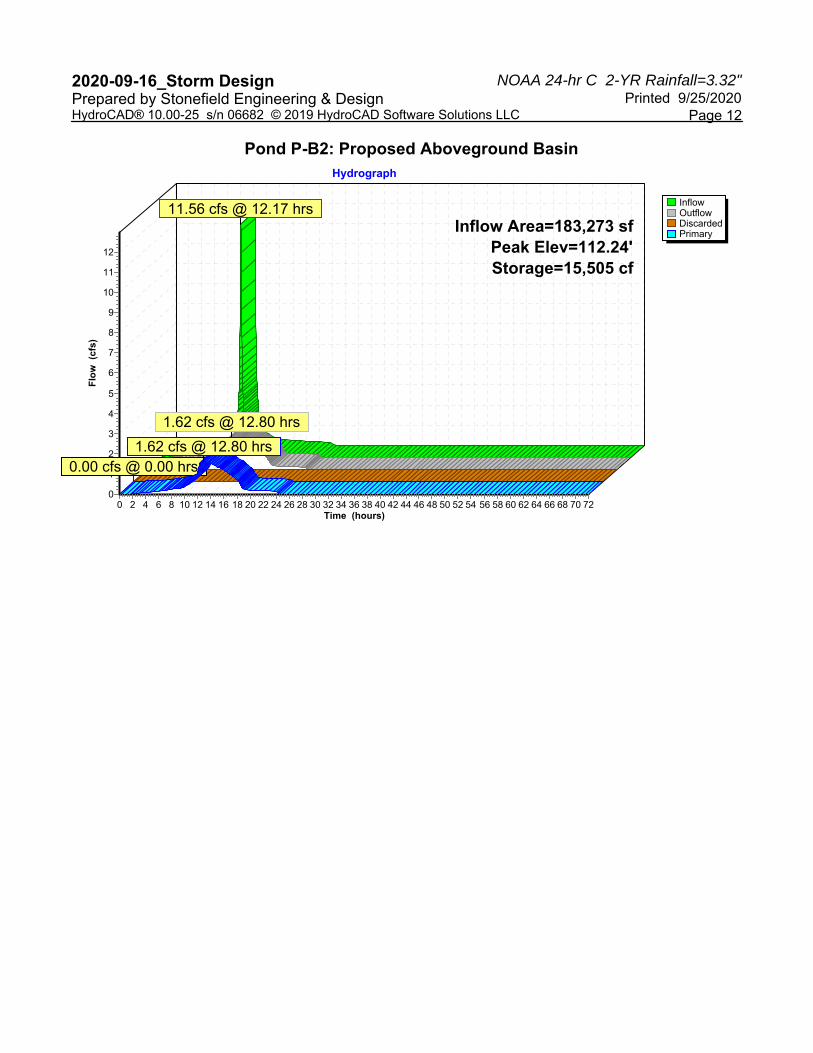
Summary for Pond P-B2: Proposed Aboveground Basin
Inflow Area = 183,273 sf, 83.33% Impervious, Inflow Depth = 2.76" for 2-YR eventInflow = 11.56 cfs @ 12.17 hrs, Volume= 42,132 cfOutflow = 1.62 cfs @ 12.80 hrs, Volume= 42,125 cf, Atten= 86%, Lag= 37.8 minDiscarded = 0.00 cfs @ 0.00 hrs, Volume= 0 cfPrimary = 1.62 cfs @ 12.80 hrs, Volume= 42,125 cf
Routing by Dyn-Stor-Ind method, Time Span= 0.00-72.00 hrs, dt= 0.02 hrsPeak Elev= 112.24' @ 12.80 hrs Surf.Area= 7,604 sf Storage= 15,505 cf
Plug-Flow detention time= 81.8 min calculated for 42,125 cf (100% of inflow)Center-of-Mass det. time= 81.3 min ( 849.0 - 767.7 )
Volume Invert Avail.Storage Storage Description#1 109.00' 40,935 cf Custom Stage Data (Irregular) Listed below (Recalc)
Elevation Surf.Area Perim. Inc.Store Cum.Store Wet.Area(feet) (sq-ft) (feet) (cubic-feet) (cubic-feet) (sq-ft)
109.00 100 50.0 0 0 100110.00 4,284 330.0 1,680 1,680 8,569111.00 6,290 343.0 5,255 6,935 9,342112.00 7,349 362.0 6,813 13,747 10,465113.00 8,464 381.0 7,900 21,647 11,648114.00 9,636 400.0 9,044 30,691 12,892115.00 10,864 419.0 10,244 40,935 14,196
Device Routing Invert Outlet Devices#1 Primary 109.05' 6.0" Vert. 6" Orifice C= 0.600 #2 Primary 112.81' 48.0" W x 48.0" H Vert. Grate C= 0.600 #3 Discarded 109.00' 4.000 in/hr Exfiltration X 0.00 over Surface area
Conductivity to Groundwater Elevation = 100.00'
Discarded OutFlow Max=0.00 cfs @ 0.00 hrs HW=109.00' (Free Discharge)3=Exfiltration ( Controls 0.00 cfs)
Primary OutFlow Max=1.62 cfs @ 12.80 hrs HW=112.24' TW=0.00' (Dynamic Tailwater)1=6" Orifice (Orifice Controls 1.62 cfs @ 8.25 fps)2=Grate ( Controls 0.00 cfs)
NOAA 24-hr C 2-YR Rainfall=3.32"2020-09-16_Storm Design Printed 9/25/2020Prepared by Stonefield Engineering & Design
Page 12HydroCAD® 10.00-25 s/n 06682 © 2019 HydroCAD Software Solutions LLC
Pond P-B2: Proposed Aboveground Basin
InflowOutflowDiscardedPrimary
Hydrograph
Time (hours)727068666462605856545250484644424038363432302826242220181614121086420
Flo
w (
cfs)
12
11
10
9
8
7
6
5
4
3
2
1
0
Inflow Area=183,273 sfPeak Elev=112.24'Storage=15,505 cf
11.56 cfs @ 12.17 hrs
1.62 cfs @ 12.80 hrs
0.00 cfs @ 0.00 hrs1.62 cfs @ 12.80 hrs
NOAA 24-hr C 2-YR Rainfall=3.32"2020-09-16_Storm Design Printed 9/25/2020Prepared by Stonefield Engineering & Design
Page 13HydroCAD® 10.00-25 s/n 06682 © 2019 HydroCAD Software Solutions LLC
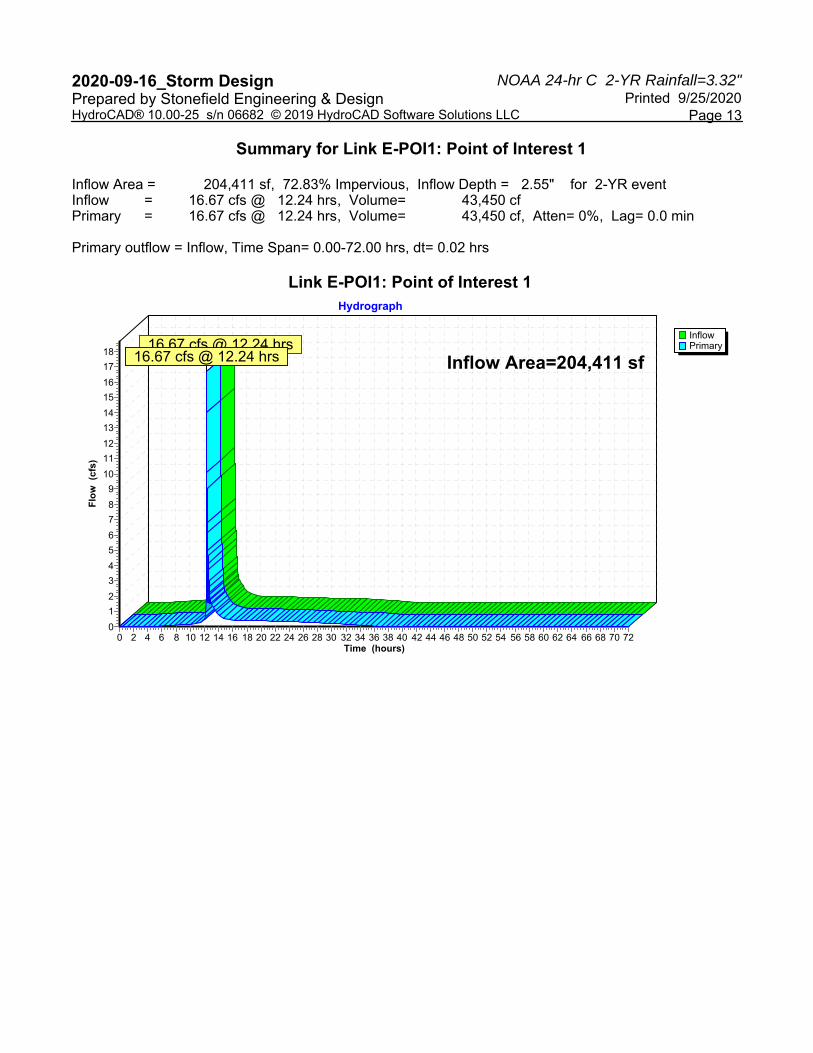
Summary for Link E-POI1: Point of Interest 1
Inflow Area = 204,411 sf, 72.83% Impervious, Inflow Depth = 2.55" for 2-YR eventInflow = 16.67 cfs @ 12.24 hrs, Volume= 43,450 cfPrimary = 16.67 cfs @ 12.24 hrs, Volume= 43,450 cf, Atten= 0%, Lag= 0.0 min
Primary outflow = Inflow, Time Span= 0.00-72.00 hrs, dt= 0.02 hrs
Link E-POI1: Point of Interest 1
InflowPrimary
Hydrograph
Time (hours)727068666462605856545250484644424038363432302826242220181614121086420
Flo
w (
cfs)
18
17
16
15
14
13
12
11
10
9
8
7
6
5
4
3
2
1
0
Inflow Area=204,411 sf16.67 cfs @ 12.24 hrs
16.67 cfs @ 12.24 hrs
NOAA 24-hr C 2-YR Rainfall=3.32"2020-09-16_Storm Design Printed 9/25/2020Prepared by Stonefield Engineering & Design
Page 14HydroCAD® 10.00-25 s/n 06682 © 2019 HydroCAD Software Solutions LLC
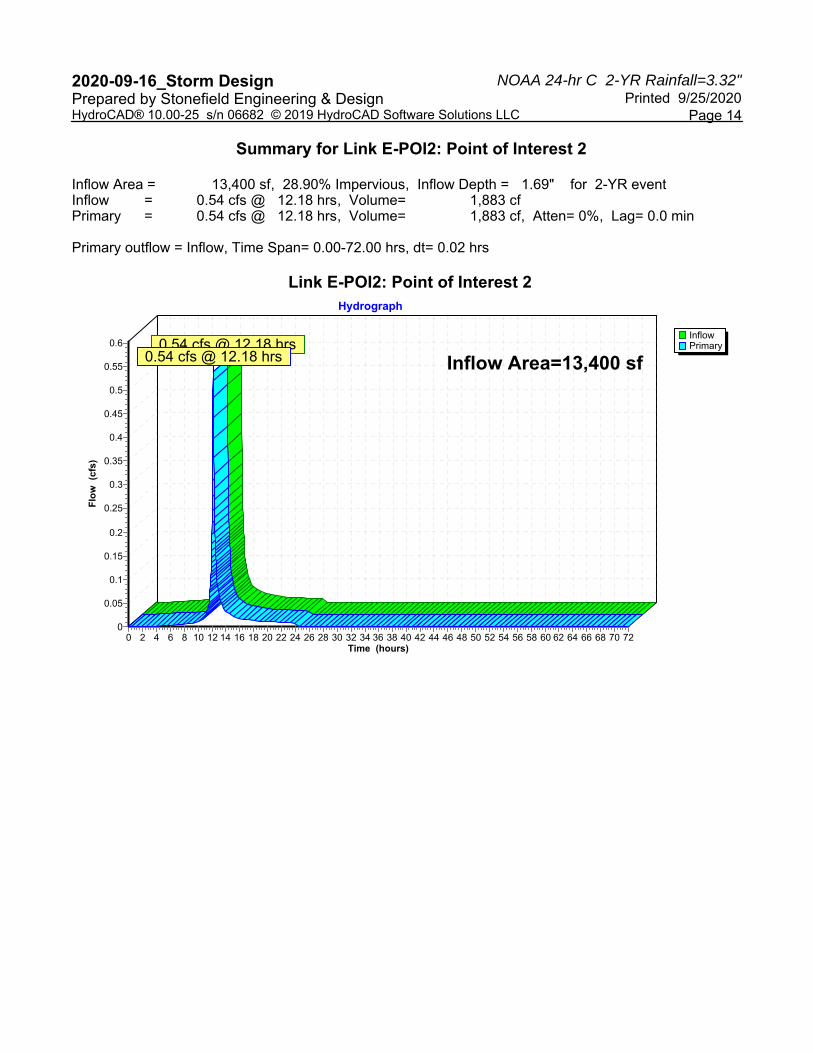
Summary for Link E-POI2: Point of Interest 2
Inflow Area = 13,400 sf, 28.90% Impervious, Inflow Depth = 1.69" for 2-YR eventInflow = 0.54 cfs @ 12.18 hrs, Volume= 1,883 cfPrimary = 0.54 cfs @ 12.18 hrs, Volume= 1,883 cf, Atten= 0%, Lag= 0.0 min
Primary outflow = Inflow, Time Span= 0.00-72.00 hrs, dt= 0.02 hrs
Link E-POI2: Point of Interest 2
InflowPrimary
Hydrograph
Time (hours)727068666462605856545250484644424038363432302826242220181614121086420
Flo
w (
cfs)
0.6
0.55
0.5
0.45
0.4
0.35
0.3
0.25
0.2
0.15
0.1
0.05
0
Inflow Area=13,400 sf0.54 cfs @ 12.18 hrs
0.54 cfs @ 12.18 hrs
NOAA 24-hr C 2-YR Rainfall=3.32"2020-09-16_Storm Design Printed 9/25/2020Prepared by Stonefield Engineering & Design
Page 15HydroCAD® 10.00-25 s/n 06682 © 2019 HydroCAD Software Solutions LLC
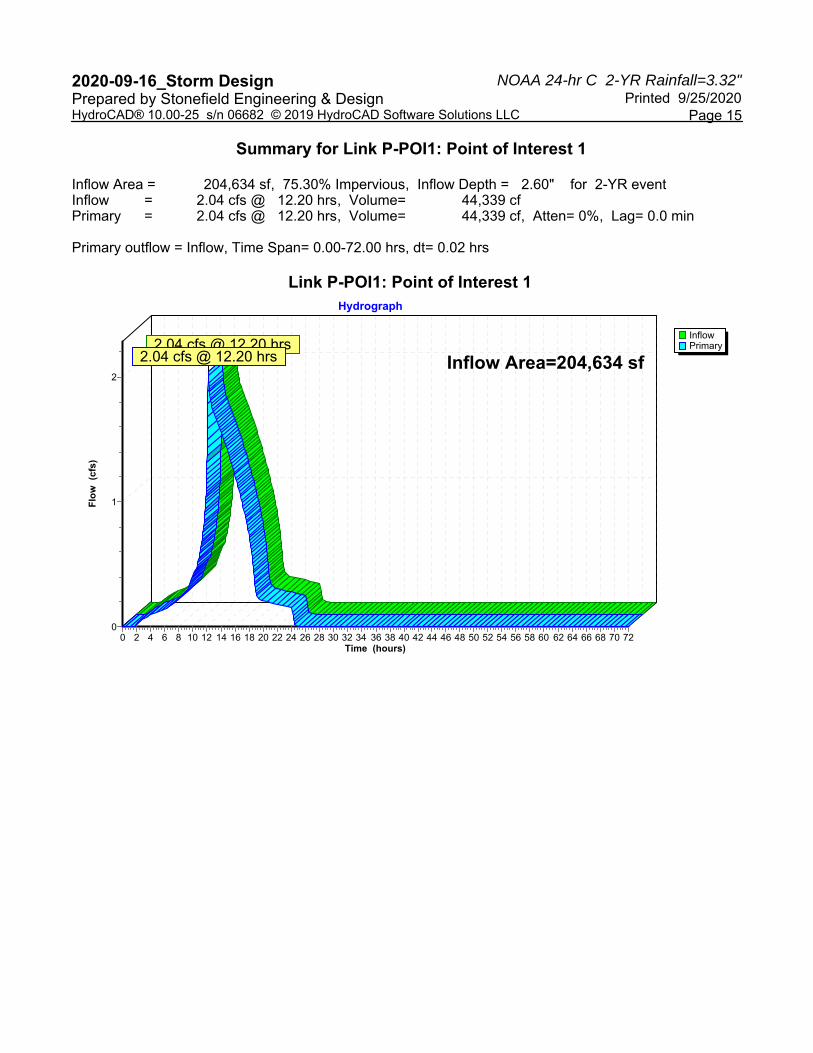
Summary for Link P-POI1: Point of Interest 1
Inflow Area = 204,634 sf, 75.30% Impervious, Inflow Depth = 2.60" for 2-YR eventInflow = 2.04 cfs @ 12.20 hrs, Volume= 44,339 cfPrimary = 2.04 cfs @ 12.20 hrs, Volume= 44,339 cf, Atten= 0%, Lag= 0.0 min
Primary outflow = Inflow, Time Span= 0.00-72.00 hrs, dt= 0.02 hrs
Link P-POI1: Point of Interest 1
InflowPrimary
Hydrograph
Time (hours)727068666462605856545250484644424038363432302826242220181614121086420
Flo
w (
cfs)
2
1
0
Inflow Area=204,634 sf2.04 cfs @ 12.20 hrs
2.04 cfs @ 12.20 hrs

NOAA 24-hr C 2-YR Rainfall=3.32"2020-09-16_Storm Design Printed 9/25/2020Prepared by Stonefield Engineering & Design
Page 16HydroCAD® 10.00-25 s/n 06682 © 2019 HydroCAD Software Solutions LLC
Summary for Link P-POI2: Point of Interest 2
Inflow Area = 13,177 sf, 28.84% Impervious, Inflow Depth = 1.69" for 2-YR eventInflow = 0.53 cfs @ 12.18 hrs, Volume= 1,851 cfPrimary = 0.53 cfs @ 12.18 hrs, Volume= 1,851 cf, Atten= 0%, Lag= 0.0 min
Primary outflow = Inflow, Time Span= 0.00-72.00 hrs, dt= 0.02 hrs
Link P-POI2: Point of Interest 2
InflowPrimary
Hydrograph
Time (hours)727068666462605856545250484644424038363432302826242220181614121086420
Flo
w (
cfs)
0.55
0.5
0.45
0.4
0.35
0.3
0.25
0.2
0.15
0.1
0.05
0
Inflow Area=13,177 sf0.53 cfs @ 12.18 hrs
0.53 cfs @ 12.18 hrs
APPENDIX C-3
10-YEAR STORM EVENT HYDROGRAPHS
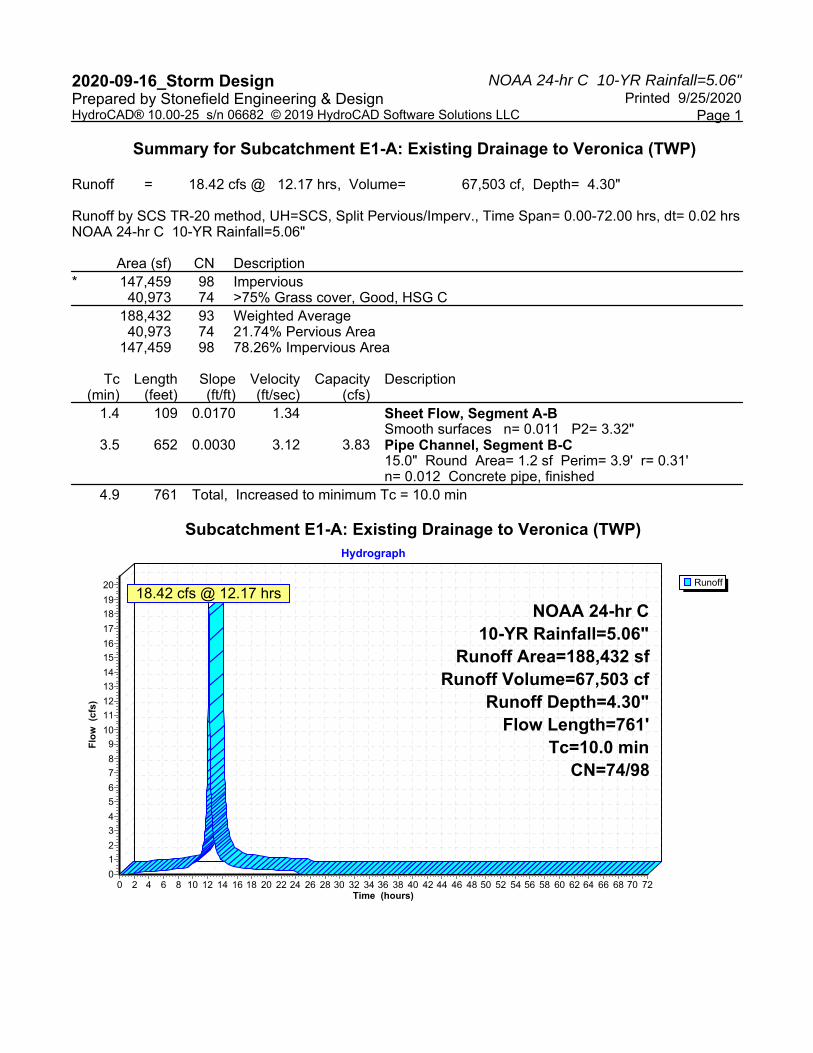
NOAA 24-hr C 10-YR Rainfall=5.06"2020-09-16_Storm Design Printed 9/25/2020Prepared by Stonefield Engineering & Design
Page 1HydroCAD® 10.00-25 s/n 06682 © 2019 HydroCAD Software Solutions LLC
Summary for Subcatchment E1-A: Existing Drainage to Veronica (TWP)
Runoff = 18.42 cfs @ 12.17 hrs, Volume= 67,503 cf, Depth= 4.30"
Runoff by SCS TR-20 method, UH=SCS, Split Pervious/Imperv., Time Span= 0.00-72.00 hrs, dt= 0.02 hrsNOAA 24-hr C 10-YR Rainfall=5.06"
Area (sf) CN Description* 147,459 98 Impervious
40,973 74 >75% Grass cover, Good, HSG C188,432 93 Weighted Average
40,973 74 21.74% Pervious Area147,459 98 78.26% Impervious Area
Tc Length Slope Velocity Capacity Description(min) (feet) (ft/ft) (ft/sec) (cfs)
1.4 109 0.0170 1.34 Sheet Flow, Segment A-BSmooth surfaces n= 0.011 P2= 3.32"
3.5 652 0.0030 3.12 3.83 Pipe Channel, Segment B-C15.0" Round Area= 1.2 sf Perim= 3.9' r= 0.31'n= 0.012 Concrete pipe, finished
4.9 761 Total, Increased to minimum Tc = 10.0 min
Subcatchment E1-A: Existing Drainage to Veronica (TWP)
Runoff
Hydrograph
Time (hours)727068666462605856545250484644424038363432302826242220181614121086420
Flo
w (
cfs)
20
19
18
17
16
15
14
13
12
11
10
9
8
7
6
5
4
3
2
1
0
NOAA 24-hr C10-YR Rainfall=5.06"
Runoff Area=188,432 sfRunoff Volume=67,503 cf
Runoff Depth=4.30"Flow Length=761'
Tc=10.0 minCN=74/98
18.42 cfs @ 12.17 hrs

NOAA 24-hr C 10-YR Rainfall=5.06"2020-09-16_Storm Design Printed 9/25/2020Prepared by Stonefield Engineering & Design
Page 2HydroCAD® 10.00-25 s/n 06682 © 2019 HydroCAD Software Solutions LLC
Summary for Subcatchment E1-B: Existing Drainage to Veronica (TWP)
Runoff = 0.47 cfs @ 12.18 hrs, Volume= 1,600 cf, Depth= 2.91"
Runoff by SCS TR-20 method, UH=SCS, Split Pervious/Imperv., Time Span= 0.00-72.00 hrs, dt= 0.02 hrsNOAA 24-hr C 10-YR Rainfall=5.06"
Area (sf) CN Description* 1,373 98 Impervious
5,214 74 >75% Grass cover, Good, HSG C6,587 79 Weighted Average5,214 74 79.16% Pervious Area1,373 98 20.84% Impervious Area
Tc Length Slope Velocity Capacity Description(min) (feet) (ft/ft) (ft/sec) (cfs)10.0 Direct Entry,
Subcatchment E1-B: Existing Drainage to Veronica (TWP)
Runoff
Hydrograph
Time (hours)727068666462605856545250484644424038363432302826242220181614121086420
Flo
w (
cfs)
0.5
0.45
0.4
0.35
0.3
0.25
0.2
0.15
0.1
0.05
0
NOAA 24-hr C10-YR Rainfall=5.06"Runoff Area=6,587 sf
Runoff Volume=1,600 cfRunoff Depth=2.91"
Tc=10.0 minCN=74/98
0.47 cfs @ 12.18 hrs
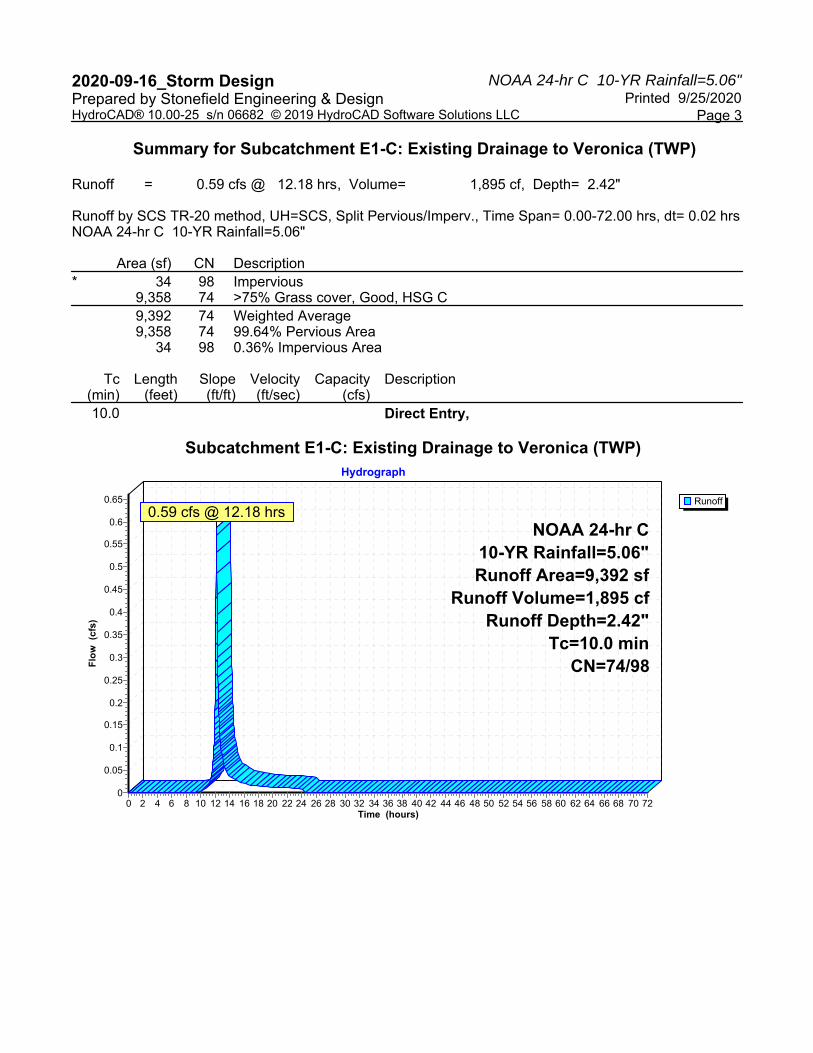
NOAA 24-hr C 10-YR Rainfall=5.06"2020-09-16_Storm Design Printed 9/25/2020Prepared by Stonefield Engineering & Design
Page 3HydroCAD® 10.00-25 s/n 06682 © 2019 HydroCAD Software Solutions LLC
Summary for Subcatchment E1-C: Existing Drainage to Veronica (TWP)
Runoff = 0.59 cfs @ 12.18 hrs, Volume= 1,895 cf, Depth= 2.42"
Runoff by SCS TR-20 method, UH=SCS, Split Pervious/Imperv., Time Span= 0.00-72.00 hrs, dt= 0.02 hrsNOAA 24-hr C 10-YR Rainfall=5.06"
Area (sf) CN Description* 34 98 Impervious
9,358 74 >75% Grass cover, Good, HSG C9,392 74 Weighted Average9,358 74 99.64% Pervious Area
34 98 0.36% Impervious Area
Tc Length Slope Velocity Capacity Description(min) (feet) (ft/ft) (ft/sec) (cfs)10.0 Direct Entry,
Subcatchment E1-C: Existing Drainage to Veronica (TWP)
Runoff
Hydrograph
Time (hours)727068666462605856545250484644424038363432302826242220181614121086420
Flo
w (
cfs)
0.65
0.6
0.55
0.5
0.45
0.4
0.35
0.3
0.25
0.2
0.15
0.1
0.05
0
NOAA 24-hr C10-YR Rainfall=5.06"Runoff Area=9,392 sf
Runoff Volume=1,895 cfRunoff Depth=2.42"
Tc=10.0 minCN=74/98
0.59 cfs @ 12.18 hrs

NOAA 24-hr C 10-YR Rainfall=5.06"2020-09-16_Storm Design Printed 9/25/2020Prepared by Stonefield Engineering & Design
Page 4HydroCAD® 10.00-25 s/n 06682 © 2019 HydroCAD Software Solutions LLC
Summary for Subcatchment E2: Existing Drainage to NJDOT
Runoff = 1.01 cfs @ 12.17 hrs, Volume= 3,472 cf, Depth= 3.11"
Runoff by SCS TR-20 method, UH=SCS, Split Pervious/Imperv., Time Span= 0.00-72.00 hrs, dt= 0.02 hrsNOAA 24-hr C 10-YR Rainfall=5.06"
Area (sf) CN Description* 3,872 98 Impervious
9,528 74 >75% Grass cover, Good, HSG C13,400 81 Weighted Average
9,528 74 71.10% Pervious Area3,872 98 28.90% Impervious Area
Tc Length Slope Velocity Capacity Description(min) (feet) (ft/ft) (ft/sec) (cfs)10.0 Direct Entry,
Subcatchment E2: Existing Drainage to NJDOT
Runoff
Hydrograph
Time (hours)727068666462605856545250484644424038363432302826242220181614121086420
Flo
w (
cfs)
1
0
NOAA 24-hr C10-YR Rainfall=5.06"
Runoff Area=13,400 sfRunoff Volume=3,472 cf
Runoff Depth=3.11"Tc=10.0 min
CN=74/98
1.01 cfs @ 12.17 hrs
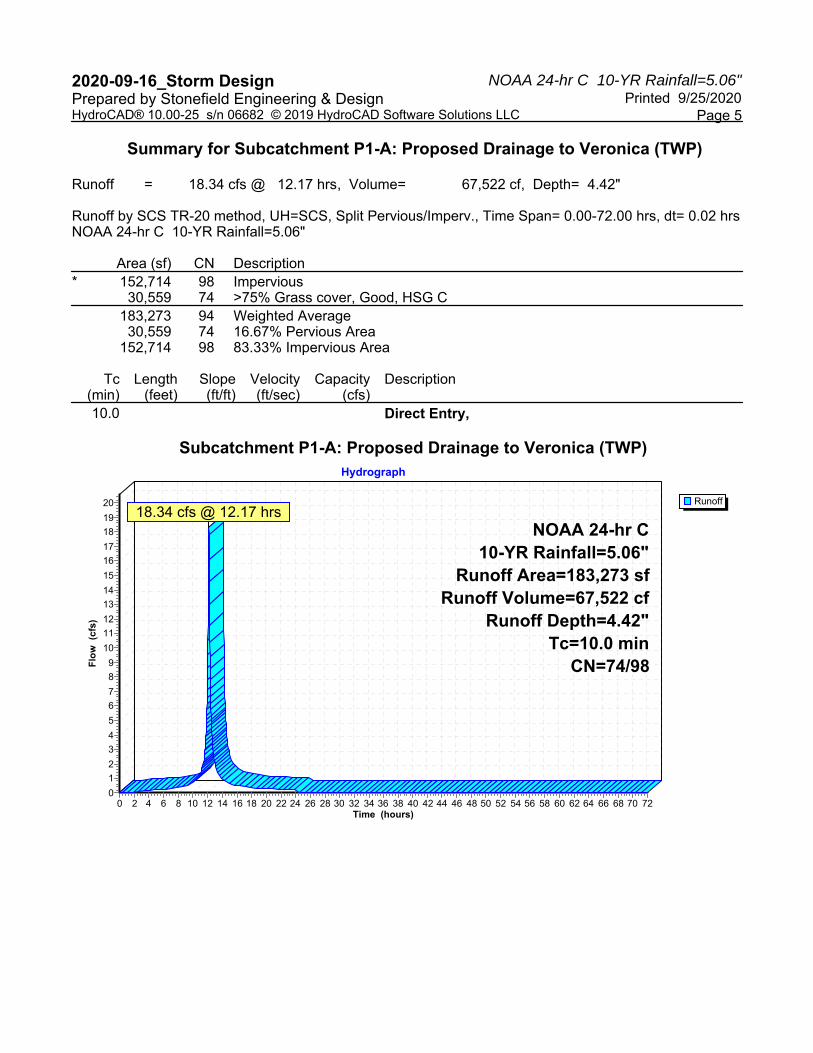
NOAA 24-hr C 10-YR Rainfall=5.06"2020-09-16_Storm Design Printed 9/25/2020Prepared by Stonefield Engineering & Design
Page 5HydroCAD® 10.00-25 s/n 06682 © 2019 HydroCAD Software Solutions LLC
Summary for Subcatchment P1-A: Proposed Drainage to Veronica (TWP)
Runoff = 18.34 cfs @ 12.17 hrs, Volume= 67,522 cf, Depth= 4.42"
Runoff by SCS TR-20 method, UH=SCS, Split Pervious/Imperv., Time Span= 0.00-72.00 hrs, dt= 0.02 hrsNOAA 24-hr C 10-YR Rainfall=5.06"
Area (sf) CN Description* 152,714 98 Impervious
30,559 74 >75% Grass cover, Good, HSG C183,273 94 Weighted Average
30,559 74 16.67% Pervious Area152,714 98 83.33% Impervious Area
Tc Length Slope Velocity Capacity Description(min) (feet) (ft/ft) (ft/sec) (cfs)10.0 Direct Entry,
Subcatchment P1-A: Proposed Drainage to Veronica (TWP)
Runoff
Hydrograph
Time (hours)727068666462605856545250484644424038363432302826242220181614121086420
Flo
w (
cfs)
20
19
18
17
16
15
14
13
12
11
10
9
8
7
6
5
4
3
2
1
0
NOAA 24-hr C10-YR Rainfall=5.06"
Runoff Area=183,273 sfRunoff Volume=67,522 cf
Runoff Depth=4.42"Tc=10.0 min
CN=74/98
18.34 cfs @ 12.17 hrs

NOAA 24-hr C 10-YR Rainfall=5.06"2020-09-16_Storm Design Printed 9/25/2020Prepared by Stonefield Engineering & Design
Page 6HydroCAD® 10.00-25 s/n 06682 © 2019 HydroCAD Software Solutions LLC
Summary for Subcatchment P1-B: Proposed Drainage to Veronica (TWP)
Runoff = 0.39 cfs @ 12.17 hrs, Volume= 1,342 cf, Depth= 3.03"
Runoff by SCS TR-20 method, UH=SCS, Split Pervious/Imperv., Time Span= 0.00-72.00 hrs, dt= 0.02 hrsNOAA 24-hr C 10-YR Rainfall=5.06"
Area (sf) CN Description* 1,370 98 Impervious
3,939 74 >75% Grass cover, Good, HSG C5,309 80 Weighted Average3,939 74 74.19% Pervious Area1,370 98 25.81% Impervious Area
Tc Length Slope Velocity Capacity Description(min) (feet) (ft/ft) (ft/sec) (cfs)10.0 Direct Entry,
Subcatchment P1-B: Proposed Drainage to Veronica (TWP)
Runoff
Hydrograph
Time (hours)727068666462605856545250484644424038363432302826242220181614121086420
Flo
w (
cfs)
0.44
0.420.4
0.380.36
0.340.32
0.30.28
0.260.24
0.220.2
0.180.16
0.140.12
0.10.08
0.060.04
0.020
NOAA 24-hr C10-YR Rainfall=5.06"Runoff Area=5,309 sf
Runoff Volume=1,342 cfRunoff Depth=3.03"
Tc=10.0 minCN=74/98
0.39 cfs @ 12.17 hrs
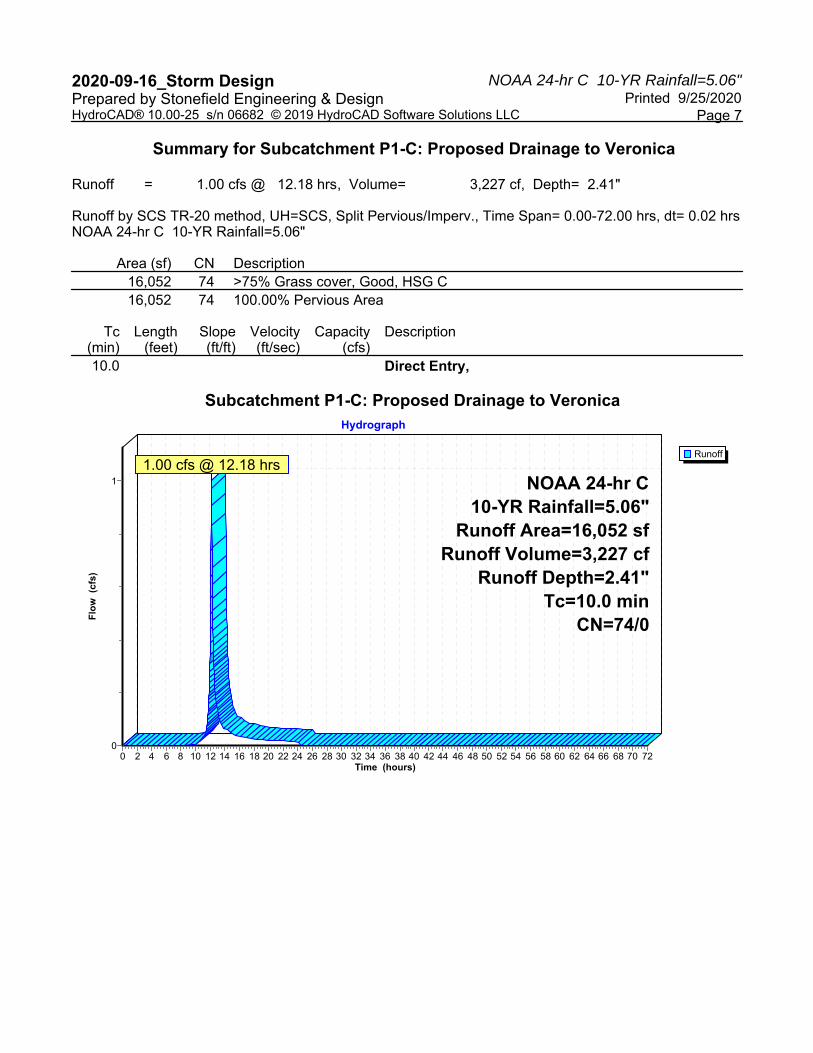
NOAA 24-hr C 10-YR Rainfall=5.06"2020-09-16_Storm Design Printed 9/25/2020Prepared by Stonefield Engineering & Design
Page 7HydroCAD® 10.00-25 s/n 06682 © 2019 HydroCAD Software Solutions LLC
Summary for Subcatchment P1-C: Proposed Drainage to Veronica
Runoff = 1.00 cfs @ 12.18 hrs, Volume= 3,227 cf, Depth= 2.41"
Runoff by SCS TR-20 method, UH=SCS, Split Pervious/Imperv., Time Span= 0.00-72.00 hrs, dt= 0.02 hrsNOAA 24-hr C 10-YR Rainfall=5.06"
Area (sf) CN Description16,052 74 >75% Grass cover, Good, HSG C16,052 74 100.00% Pervious Area
Tc Length Slope Velocity Capacity Description(min) (feet) (ft/ft) (ft/sec) (cfs)10.0 Direct Entry,
Subcatchment P1-C: Proposed Drainage to Veronica
Runoff
Hydrograph
Time (hours)727068666462605856545250484644424038363432302826242220181614121086420
Flo
w (
cfs)
1
0
NOAA 24-hr C10-YR Rainfall=5.06"
Runoff Area=16,052 sfRunoff Volume=3,227 cf
Runoff Depth=2.41"Tc=10.0 min
CN=74/0
1.00 cfs @ 12.18 hrs

NOAA 24-hr C 10-YR Rainfall=5.06"2020-09-16_Storm Design Printed 9/25/2020Prepared by Stonefield Engineering & Design
Page 8HydroCAD® 10.00-25 s/n 06682 © 2019 HydroCAD Software Solutions LLC
Summary for Subcatchment P2: Proposed Drainage to NJDOT
Runoff = 0.99 cfs @ 12.17 hrs, Volume= 3,412 cf, Depth= 3.11"
Runoff by SCS TR-20 method, UH=SCS, Split Pervious/Imperv., Time Span= 0.00-72.00 hrs, dt= 0.02 hrsNOAA 24-hr C 10-YR Rainfall=5.06"
Area (sf) CN Description* 3,800 98 Impervious
9,377 74 >75% Grass cover, Good, HSG C13,177 81 Weighted Average
9,377 74 71.16% Pervious Area3,800 98 28.84% Impervious Area
Tc Length Slope Velocity Capacity Description(min) (feet) (ft/ft) (ft/sec) (cfs)10.0 Direct Entry,
Subcatchment P2: Proposed Drainage to NJDOT
Runoff
Hydrograph
Time (hours)727068666462605856545250484644424038363432302826242220181614121086420
Flo
w (
cfs)
1
0
NOAA 24-hr C10-YR Rainfall=5.06"
Runoff Area=13,177 sfRunoff Volume=3,412 cf
Runoff Depth=3.11"Tc=10.0 min
CN=74/98
0.99 cfs @ 12.17 hrs

NOAA 24-hr C 10-YR Rainfall=5.06"2020-09-16_Storm Design Printed 9/25/2020Prepared by Stonefield Engineering & Design
Page 9HydroCAD® 10.00-25 s/n 06682 © 2019 HydroCAD Software Solutions LLC
Summary for Pond E-B1: Existing Aboveground Basin
Inflow Area = 188,432 sf, 78.26% Impervious, Inflow Depth = 4.30" for 10-YR eventInflow = 18.42 cfs @ 12.17 hrs, Volume= 67,503 cfOutflow = 21.25 cfs @ 12.18 hrs, Volume= 67,484 cf, Atten= 0%, Lag= 0.5 minPrimary = 21.25 cfs @ 12.18 hrs, Volume= 67,484 cf
Routing by Dyn-Stor-Ind method, Time Span= 0.00-72.00 hrs, dt= 0.02 hrsPeak Elev= 122.61' @ 12.18 hrs Surf.Area= 7,464 sf Storage= 16,102 cf
Plug-Flow detention time= 251.5 min calculated for 67,465 cf (100% of inflow)Center-of-Mass det. time= 251.8 min ( 1,015.3 - 763.5 )
Volume Invert Avail.Storage Storage Description#1 110.00' 16,102 cf Custom Stage Data (Irregular) Listed below (Recalc)
Elevation Surf.Area Perim. Inc.Store Cum.Store Wet.Area(feet) (sq-ft) (feet) (cubic-feet) (cubic-feet) (sq-ft)
110.00 2,318 245.0 0 0 2,318111.00 4,870 270.0 3,516 3,516 3,374112.00 6,444 349.0 5,639 9,155 7,278113.00 7,464 363.0 6,948 16,102 8,148
Device Routing Invert Outlet Devices#1 Primary 109.05' 15.0" Round Culvert
L= 38.0' RCP, square edge headwall, Ke= 0.500 Inlet / Outlet Invert= 109.05' / 108.63' S= 0.0111 '/' Cc= 0.900 n= 0.012 Concrete pipe, finished, Flow Area= 1.23 sf
#2 Device 1 112.81' 48.0" W x 48.0" H Vert. Grate C= 0.600 #3 Device 1 110.00' 3.0" Vert. Orifice/Grate C= 0.600
Primary OutFlow Max=21.09 cfs @ 12.18 hrs HW=122.42' TW=0.00' (Dynamic Tailwater)1=Culvert (Inlet Controls 21.09 cfs @ 17.19 fps)
2=Grate (Passes < 211.90 cfs potential flow)3=Orifice/Grate (Passes < 0.83 cfs potential flow)
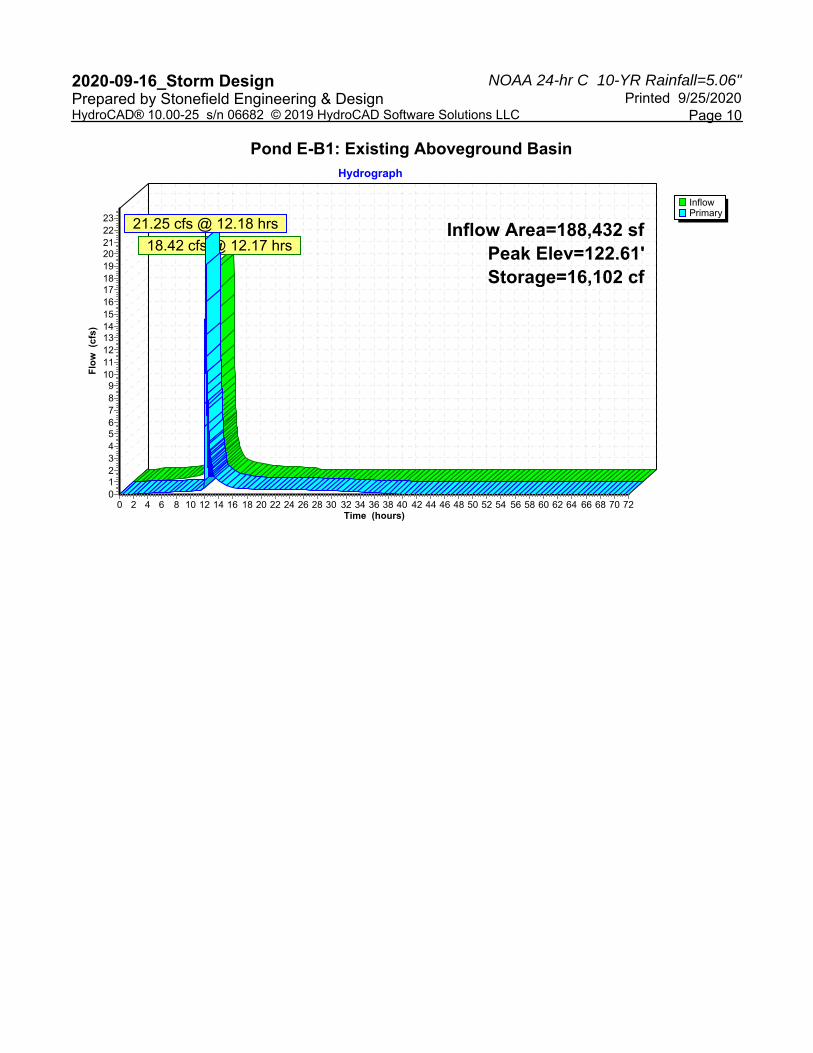
NOAA 24-hr C 10-YR Rainfall=5.06"2020-09-16_Storm Design Printed 9/25/2020Prepared by Stonefield Engineering & Design
Page 10HydroCAD® 10.00-25 s/n 06682 © 2019 HydroCAD Software Solutions LLC
Pond E-B1: Existing Aboveground Basin
InflowPrimary
Hydrograph
Time (hours)727068666462605856545250484644424038363432302826242220181614121086420
Flo
w (
cfs)
2322212019181716151413121110
9876543210
Inflow Area=188,432 sfPeak Elev=122.61'Storage=16,102 cf
18.42 cfs @ 12.17 hrs
21.25 cfs @ 12.18 hrs
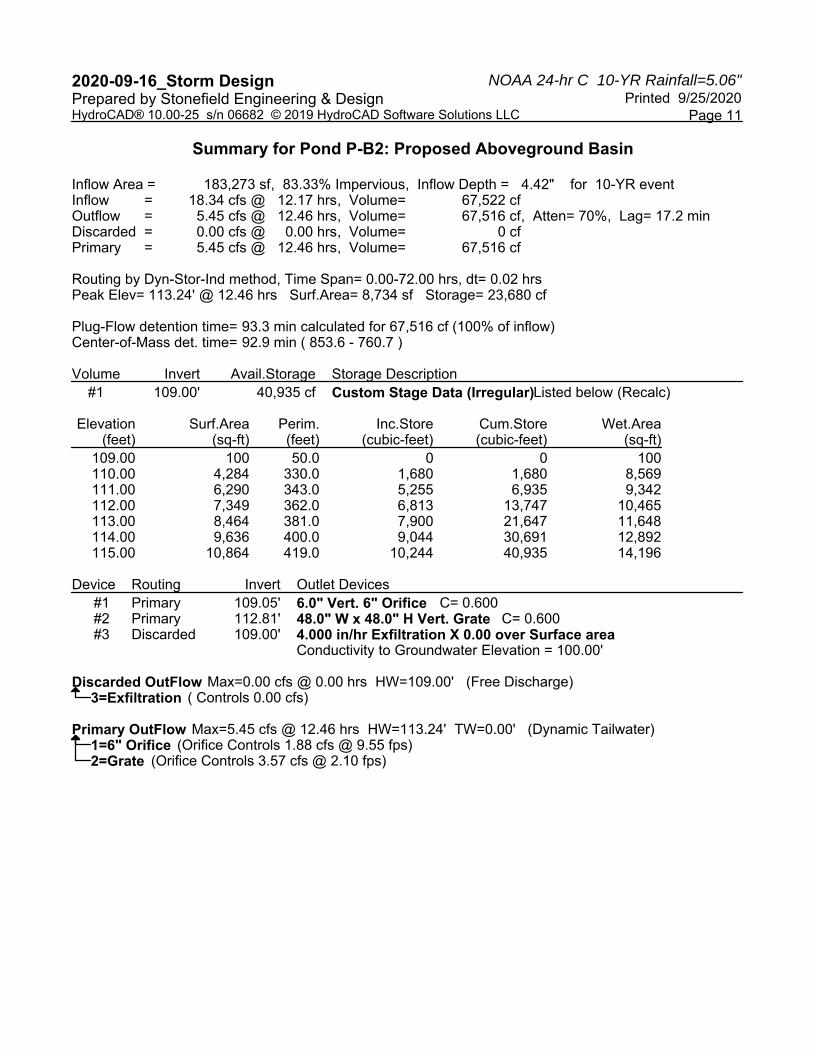
NOAA 24-hr C 10-YR Rainfall=5.06"2020-09-16_Storm Design Printed 9/25/2020Prepared by Stonefield Engineering & Design
Page 11HydroCAD® 10.00-25 s/n 06682 © 2019 HydroCAD Software Solutions LLC
Summary for Pond P-B2: Proposed Aboveground Basin
Inflow Area = 183,273 sf, 83.33% Impervious, Inflow Depth = 4.42" for 10-YR eventInflow = 18.34 cfs @ 12.17 hrs, Volume= 67,522 cfOutflow = 5.45 cfs @ 12.46 hrs, Volume= 67,516 cf, Atten= 70%, Lag= 17.2 minDiscarded = 0.00 cfs @ 0.00 hrs, Volume= 0 cfPrimary = 5.45 cfs @ 12.46 hrs, Volume= 67,516 cf
Routing by Dyn-Stor-Ind method, Time Span= 0.00-72.00 hrs, dt= 0.02 hrsPeak Elev= 113.24' @ 12.46 hrs Surf.Area= 8,734 sf Storage= 23,680 cf
Plug-Flow detention time= 93.3 min calculated for 67,516 cf (100% of inflow)Center-of-Mass det. time= 92.9 min ( 853.6 - 760.7 )
Volume Invert Avail.Storage Storage Description#1 109.00' 40,935 cf Custom Stage Data (Irregular) Listed below (Recalc)
Elevation Surf.Area Perim. Inc.Store Cum.Store Wet.Area(feet) (sq-ft) (feet) (cubic-feet) (cubic-feet) (sq-ft)
109.00 100 50.0 0 0 100110.00 4,284 330.0 1,680 1,680 8,569111.00 6,290 343.0 5,255 6,935 9,342112.00 7,349 362.0 6,813 13,747 10,465113.00 8,464 381.0 7,900 21,647 11,648114.00 9,636 400.0 9,044 30,691 12,892115.00 10,864 419.0 10,244 40,935 14,196
Device Routing Invert Outlet Devices#1 Primary 109.05' 6.0" Vert. 6" Orifice C= 0.600 #2 Primary 112.81' 48.0" W x 48.0" H Vert. Grate C= 0.600 #3 Discarded 109.00' 4.000 in/hr Exfiltration X 0.00 over Surface area
Conductivity to Groundwater Elevation = 100.00'
Discarded OutFlow Max=0.00 cfs @ 0.00 hrs HW=109.00' (Free Discharge)3=Exfiltration ( Controls 0.00 cfs)
Primary OutFlow Max=5.45 cfs @ 12.46 hrs HW=113.24' TW=0.00' (Dynamic Tailwater)1=6" Orifice (Orifice Controls 1.88 cfs @ 9.55 fps)2=Grate (Orifice Controls 3.57 cfs @ 2.10 fps)
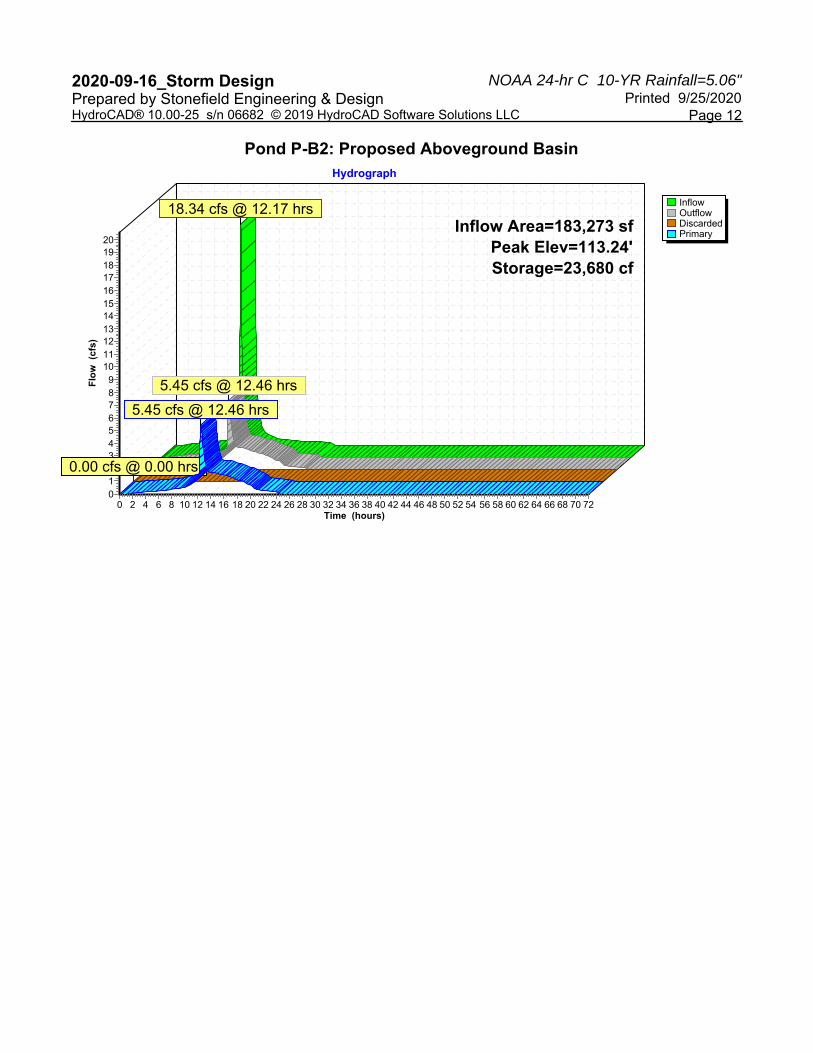
NOAA 24-hr C 10-YR Rainfall=5.06"2020-09-16_Storm Design Printed 9/25/2020Prepared by Stonefield Engineering & Design
Page 12HydroCAD® 10.00-25 s/n 06682 © 2019 HydroCAD Software Solutions LLC
Pond P-B2: Proposed Aboveground Basin
InflowOutflowDiscardedPrimary
Hydrograph
Time (hours)727068666462605856545250484644424038363432302826242220181614121086420
Flo
w (
cfs)
2019181716151413121110
9876543210
Inflow Area=183,273 sfPeak Elev=113.24'Storage=23,680 cf
18.34 cfs @ 12.17 hrs
5.45 cfs @ 12.46 hrs
0.00 cfs @ 0.00 hrs
5.45 cfs @ 12.46 hrs
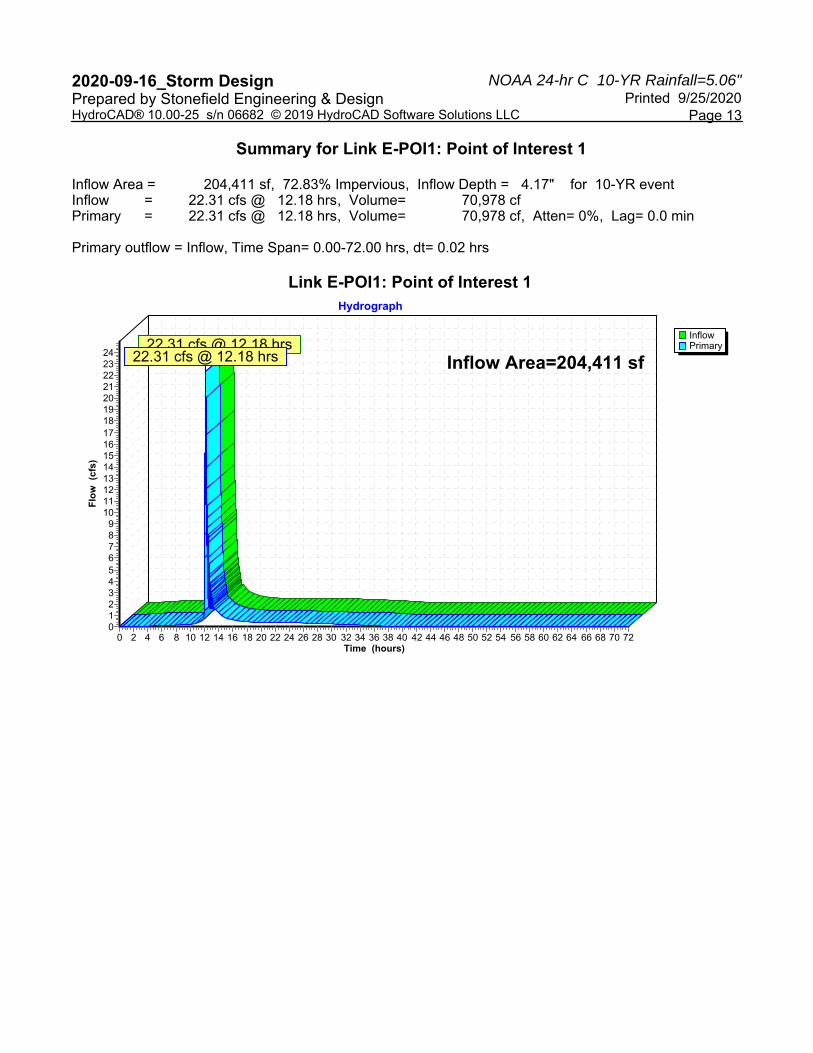
NOAA 24-hr C 10-YR Rainfall=5.06"2020-09-16_Storm Design Printed 9/25/2020Prepared by Stonefield Engineering & Design
Page 13HydroCAD® 10.00-25 s/n 06682 © 2019 HydroCAD Software Solutions LLC
Summary for Link E-POI1: Point of Interest 1
Inflow Area = 204,411 sf, 72.83% Impervious, Inflow Depth = 4.17" for 10-YR eventInflow = 22.31 cfs @ 12.18 hrs, Volume= 70,978 cfPrimary = 22.31 cfs @ 12.18 hrs, Volume= 70,978 cf, Atten= 0%, Lag= 0.0 min
Primary outflow = Inflow, Time Span= 0.00-72.00 hrs, dt= 0.02 hrs
Link E-POI1: Point of Interest 1
InflowPrimary
Hydrograph
Time (hours)727068666462605856545250484644424038363432302826242220181614121086420
Flo
w (
cfs)
242322212019181716151413121110
9876543210
Inflow Area=204,411 sf22.31 cfs @ 12.18 hrs
22.31 cfs @ 12.18 hrs
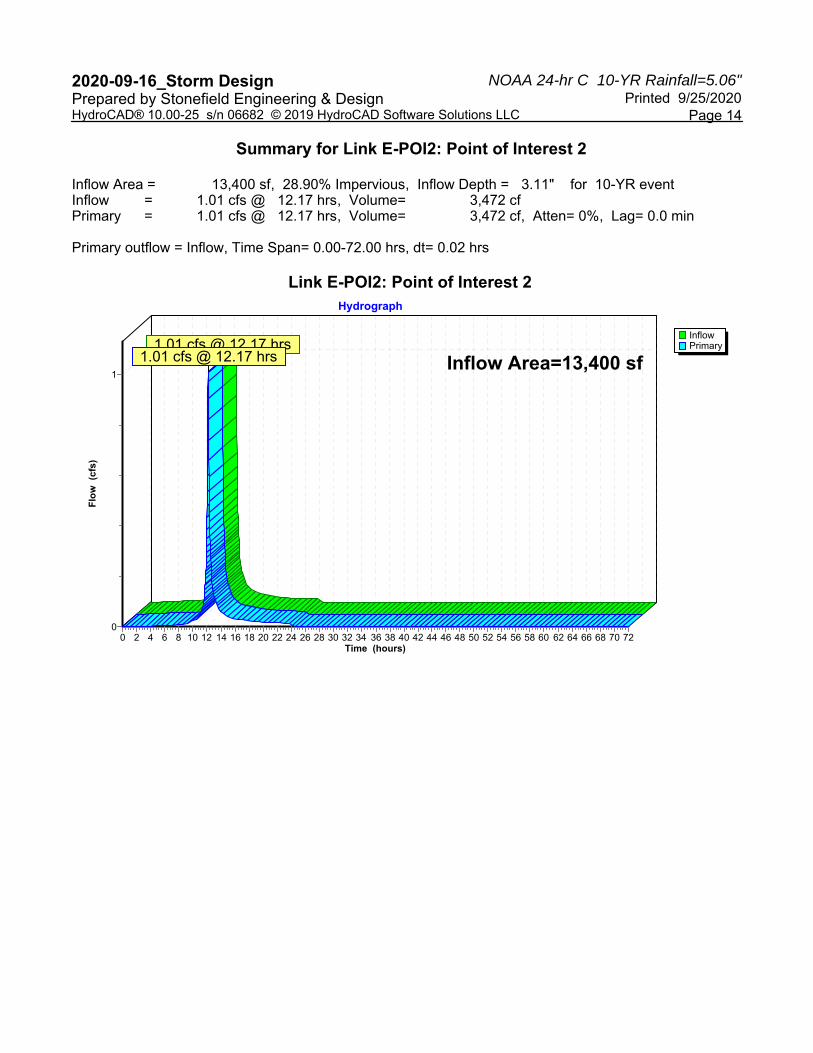
NOAA 24-hr C 10-YR Rainfall=5.06"2020-09-16_Storm Design Printed 9/25/2020Prepared by Stonefield Engineering & Design
Page 14HydroCAD® 10.00-25 s/n 06682 © 2019 HydroCAD Software Solutions LLC
Summary for Link E-POI2: Point of Interest 2
Inflow Area = 13,400 sf, 28.90% Impervious, Inflow Depth = 3.11" for 10-YR eventInflow = 1.01 cfs @ 12.17 hrs, Volume= 3,472 cfPrimary = 1.01 cfs @ 12.17 hrs, Volume= 3,472 cf, Atten= 0%, Lag= 0.0 min
Primary outflow = Inflow, Time Span= 0.00-72.00 hrs, dt= 0.02 hrs
Link E-POI2: Point of Interest 2
InflowPrimary
Hydrograph
Time (hours)727068666462605856545250484644424038363432302826242220181614121086420
Flo
w (
cfs)
1
0
Inflow Area=13,400 sf1.01 cfs @ 12.17 hrs
1.01 cfs @ 12.17 hrs
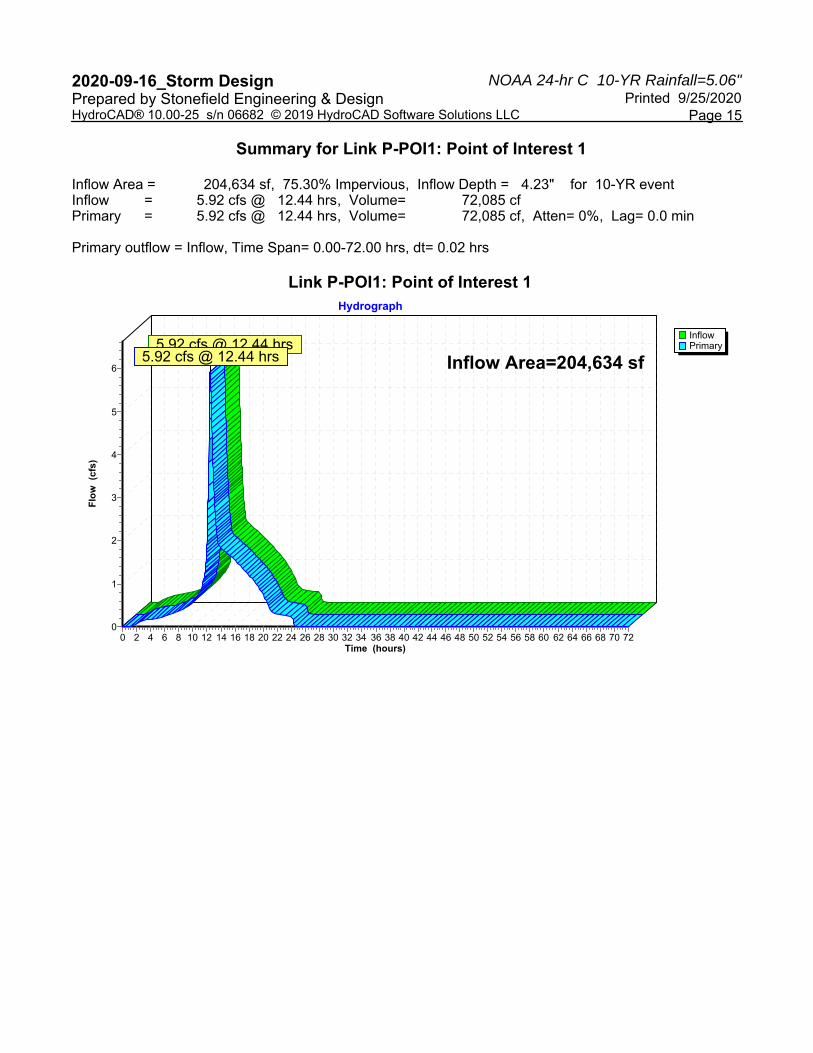
NOAA 24-hr C 10-YR Rainfall=5.06"2020-09-16_Storm Design Printed 9/25/2020Prepared by Stonefield Engineering & Design
Page 15HydroCAD® 10.00-25 s/n 06682 © 2019 HydroCAD Software Solutions LLC
Summary for Link P-POI1: Point of Interest 1
Inflow Area = 204,634 sf, 75.30% Impervious, Inflow Depth = 4.23" for 10-YR eventInflow = 5.92 cfs @ 12.44 hrs, Volume= 72,085 cfPrimary = 5.92 cfs @ 12.44 hrs, Volume= 72,085 cf, Atten= 0%, Lag= 0.0 min
Primary outflow = Inflow, Time Span= 0.00-72.00 hrs, dt= 0.02 hrs
Link P-POI1: Point of Interest 1
InflowPrimary
Hydrograph
Time (hours)727068666462605856545250484644424038363432302826242220181614121086420
Flo
w (
cfs)
6
5
4
3
2
1
0
Inflow Area=204,634 sf5.92 cfs @ 12.44 hrs
5.92 cfs @ 12.44 hrs

NOAA 24-hr C 10-YR Rainfall=5.06"2020-09-16_Storm Design Printed 9/25/2020Prepared by Stonefield Engineering & Design
Page 16HydroCAD® 10.00-25 s/n 06682 © 2019 HydroCAD Software Solutions LLC
Summary for Link P-POI2: Point of Interest 2
Inflow Area = 13,177 sf, 28.84% Impervious, Inflow Depth = 3.11" for 10-YR eventInflow = 0.99 cfs @ 12.17 hrs, Volume= 3,412 cfPrimary = 0.99 cfs @ 12.17 hrs, Volume= 3,412 cf, Atten= 0%, Lag= 0.0 min
Primary outflow = Inflow, Time Span= 0.00-72.00 hrs, dt= 0.02 hrs
Link P-POI2: Point of Interest 2
InflowPrimary
Hydrograph
Time (hours)727068666462605856545250484644424038363432302826242220181614121086420
Flo
w (
cfs)
1
0
Inflow Area=13,177 sf0.99 cfs @ 12.17 hrs
0.99 cfs @ 12.17 hrs
APPENDIX C-4
100-YEAR STORM EVENT HYDROGRAPHS

NOAA 24-hr C 100-YR Rainfall=8.49"2020-09-16_Storm Design Printed 9/25/2020Prepared by Stonefield Engineering & Design
Page 1HydroCAD® 10.00-25 s/n 06682 © 2019 HydroCAD Software Solutions LLC
Summary for Subcatchment E1-A: Existing Drainage to Veronica (TWP)
Runoff = 32.35 cfs @ 12.17 hrs, Volume= 119,699 cf, Depth= 7.62"
Runoff by SCS TR-20 method, UH=SCS, Split Pervious/Imperv., Time Span= 0.00-72.00 hrs, dt= 0.02 hrsNOAA 24-hr C 100-YR Rainfall=8.49"
Area (sf) CN Description* 147,459 98 Impervious
40,973 74 >75% Grass cover, Good, HSG C188,432 93 Weighted Average
40,973 74 21.74% Pervious Area147,459 98 78.26% Impervious Area
Tc Length Slope Velocity Capacity Description(min) (feet) (ft/ft) (ft/sec) (cfs)
1.4 109 0.0170 1.34 Sheet Flow, Segment A-BSmooth surfaces n= 0.011 P2= 3.32"
3.5 652 0.0030 3.12 3.83 Pipe Channel, Segment B-C15.0" Round Area= 1.2 sf Perim= 3.9' r= 0.31'n= 0.012 Concrete pipe, finished
4.9 761 Total, Increased to minimum Tc = 10.0 min
Subcatchment E1-A: Existing Drainage to Veronica (TWP)
Runoff
Hydrograph
Time (hours)727068666462605856545250484644424038363432302826242220181614121086420
Flo
w (
cfs)
36
34
32
30
28
26
24
22
20
18
16
14
12
10
8
6
4
2
0
NOAA 24-hr C100-YR Rainfall=8.49"
Runoff Area=188,432 sfRunoff Volume=119,699 cf
Runoff Depth=7.62"Flow Length=761'
Tc=10.0 minCN=74/98
32.35 cfs @ 12.17 hrs

NOAA 24-hr C 100-YR Rainfall=8.49"2020-09-16_Storm Design Printed 9/25/2020Prepared by Stonefield Engineering & Design
Page 2HydroCAD® 10.00-25 s/n 06682 © 2019 HydroCAD Software Solutions LLC
Summary for Subcatchment E1-B: Existing Drainage to Veronica (TWP)
Runoff = 0.97 cfs @ 12.17 hrs, Volume= 3,276 cf, Depth= 5.97"
Runoff by SCS TR-20 method, UH=SCS, Split Pervious/Imperv., Time Span= 0.00-72.00 hrs, dt= 0.02 hrsNOAA 24-hr C 100-YR Rainfall=8.49"
Area (sf) CN Description* 1,373 98 Impervious
5,214 74 >75% Grass cover, Good, HSG C6,587 79 Weighted Average5,214 74 79.16% Pervious Area1,373 98 20.84% Impervious Area
Tc Length Slope Velocity Capacity Description(min) (feet) (ft/ft) (ft/sec) (cfs)10.0 Direct Entry,
Subcatchment E1-B: Existing Drainage to Veronica (TWP)
Runoff
Hydrograph
Time (hours)727068666462605856545250484644424038363432302826242220181614121086420
Flo
w (
cfs)
1
0
NOAA 24-hr C100-YR Rainfall=8.49"Runoff Area=6,587 sf
Runoff Volume=3,276 cfRunoff Depth=5.97"
Tc=10.0 minCN=74/98
0.97 cfs @ 12.17 hrs

NOAA 24-hr C 100-YR Rainfall=8.49"2020-09-16_Storm Design Printed 9/25/2020Prepared by Stonefield Engineering & Design
Page 3HydroCAD® 10.00-25 s/n 06682 © 2019 HydroCAD Software Solutions LLC
Summary for Subcatchment E1-C: Existing Drainage to Veronica (TWP)
Runoff = 1.29 cfs @ 12.17 hrs, Volume= 4,208 cf, Depth= 5.38"
Runoff by SCS TR-20 method, UH=SCS, Split Pervious/Imperv., Time Span= 0.00-72.00 hrs, dt= 0.02 hrsNOAA 24-hr C 100-YR Rainfall=8.49"
Area (sf) CN Description* 34 98 Impervious
9,358 74 >75% Grass cover, Good, HSG C9,392 74 Weighted Average9,358 74 99.64% Pervious Area
34 98 0.36% Impervious Area
Tc Length Slope Velocity Capacity Description(min) (feet) (ft/ft) (ft/sec) (cfs)10.0 Direct Entry,
Subcatchment E1-C: Existing Drainage to Veronica (TWP)
Runoff
Hydrograph
Time (hours)727068666462605856545250484644424038363432302826242220181614121086420
Flo
w (
cfs)
1
0
NOAA 24-hr C100-YR Rainfall=8.49"Runoff Area=9,392 sf
Runoff Volume=4,208 cfRunoff Depth=5.38"
Tc=10.0 minCN=74/98
1.29 cfs @ 12.17 hrs

NOAA 24-hr C 100-YR Rainfall=8.49"2020-09-16_Storm Design Printed 9/25/2020Prepared by Stonefield Engineering & Design
Page 4HydroCAD® 10.00-25 s/n 06682 © 2019 HydroCAD Software Solutions LLC
Summary for Subcatchment E2: Existing Drainage to NJDOT
Runoff = 2.01 cfs @ 12.17 hrs, Volume= 6,923 cf, Depth= 6.20"
Runoff by SCS TR-20 method, UH=SCS, Split Pervious/Imperv., Time Span= 0.00-72.00 hrs, dt= 0.02 hrsNOAA 24-hr C 100-YR Rainfall=8.49"
Area (sf) CN Description* 3,872 98 Impervious
9,528 74 >75% Grass cover, Good, HSG C13,400 81 Weighted Average
9,528 74 71.10% Pervious Area3,872 98 28.90% Impervious Area
Tc Length Slope Velocity Capacity Description(min) (feet) (ft/ft) (ft/sec) (cfs)10.0 Direct Entry,
Subcatchment E2: Existing Drainage to NJDOT
Runoff
Hydrograph
Time (hours)727068666462605856545250484644424038363432302826242220181614121086420
Flo
w (
cfs)
2
1
0
NOAA 24-hr C100-YR Rainfall=8.49"Runoff Area=13,400 sf
Runoff Volume=6,923 cfRunoff Depth=6.20"
Tc=10.0 minCN=74/98
2.01 cfs @ 12.17 hrs

NOAA 24-hr C 100-YR Rainfall=8.49"2020-09-16_Storm Design Printed 9/25/2020Prepared by Stonefield Engineering & Design
Page 5HydroCAD® 10.00-25 s/n 06682 © 2019 HydroCAD Software Solutions LLC
Summary for Subcatchment P1-A: Proposed Drainage to Veronica (TWP)
Runoff = 31.87 cfs @ 12.17 hrs, Volume= 118,655 cf, Depth= 7.77"
Runoff by SCS TR-20 method, UH=SCS, Split Pervious/Imperv., Time Span= 0.00-72.00 hrs, dt= 0.02 hrsNOAA 24-hr C 100-YR Rainfall=8.49"
Area (sf) CN Description* 152,714 98 Impervious
30,559 74 >75% Grass cover, Good, HSG C183,273 94 Weighted Average
30,559 74 16.67% Pervious Area152,714 98 83.33% Impervious Area
Tc Length Slope Velocity Capacity Description(min) (feet) (ft/ft) (ft/sec) (cfs)10.0 Direct Entry,
Subcatchment P1-A: Proposed Drainage to Veronica (TWP)
Runoff
Hydrograph
Time (hours)727068666462605856545250484644424038363432302826242220181614121086420
Flo
w (
cfs)
34
32
30
28
26
24
22
20
18
16
14
12
10
8
6
4
2
0
NOAA 24-hr C100-YR Rainfall=8.49"
Runoff Area=183,273 sfRunoff Volume=118,655 cf
Runoff Depth=7.77"Tc=10.0 min
CN=74/98
31.87 cfs @ 12.17 hrs

NOAA 24-hr C 100-YR Rainfall=8.49"2020-09-16_Storm Design Printed 9/25/2020Prepared by Stonefield Engineering & Design
Page 6HydroCAD® 10.00-25 s/n 06682 © 2019 HydroCAD Software Solutions LLC
Summary for Subcatchment P1-B: Proposed Drainage to Veronica (TWP)
Runoff = 0.79 cfs @ 12.17 hrs, Volume= 2,703 cf, Depth= 6.11"
Runoff by SCS TR-20 method, UH=SCS, Split Pervious/Imperv., Time Span= 0.00-72.00 hrs, dt= 0.02 hrsNOAA 24-hr C 100-YR Rainfall=8.49"
Area (sf) CN Description* 1,370 98 Impervious
3,939 74 >75% Grass cover, Good, HSG C5,309 80 Weighted Average3,939 74 74.19% Pervious Area1,370 98 25.81% Impervious Area
Tc Length Slope Velocity Capacity Description(min) (feet) (ft/ft) (ft/sec) (cfs)10.0 Direct Entry,
Subcatchment P1-B: Proposed Drainage to Veronica (TWP)
Runoff
Hydrograph
Time (hours)727068666462605856545250484644424038363432302826242220181614121086420
Flo
w (
cfs)
0.85
0.8
0.75
0.7
0.65
0.6
0.55
0.5
0.45
0.4
0.35
0.3
0.25
0.2
0.15
0.1
0.05
0
NOAA 24-hr C100-YR Rainfall=8.49"Runoff Area=5,309 sf
Runoff Volume=2,703 cfRunoff Depth=6.11"
Tc=10.0 minCN=74/98
0.79 cfs @ 12.17 hrs

NOAA 24-hr C 100-YR Rainfall=8.49"2020-09-16_Storm Design Printed 9/25/2020Prepared by Stonefield Engineering & Design
Page 7HydroCAD® 10.00-25 s/n 06682 © 2019 HydroCAD Software Solutions LLC
Summary for Subcatchment P1-C: Proposed Drainage to Veronica
Runoff = 2.21 cfs @ 12.17 hrs, Volume= 7,178 cf, Depth= 5.37"
Runoff by SCS TR-20 method, UH=SCS, Split Pervious/Imperv., Time Span= 0.00-72.00 hrs, dt= 0.02 hrsNOAA 24-hr C 100-YR Rainfall=8.49"
Area (sf) CN Description16,052 74 >75% Grass cover, Good, HSG C16,052 74 100.00% Pervious Area
Tc Length Slope Velocity Capacity Description(min) (feet) (ft/ft) (ft/sec) (cfs)10.0 Direct Entry,
Subcatchment P1-C: Proposed Drainage to Veronica
Runoff
Hydrograph
Time (hours)727068666462605856545250484644424038363432302826242220181614121086420
Flo
w (
cfs)
2
1
0
NOAA 24-hr C100-YR Rainfall=8.49"Runoff Area=16,052 sf
Runoff Volume=7,178 cfRunoff Depth=5.37"
Tc=10.0 minCN=74/0
2.21 cfs @ 12.17 hrs

NOAA 24-hr C 100-YR Rainfall=8.49"2020-09-16_Storm Design Printed 9/25/2020Prepared by Stonefield Engineering & Design
Page 8HydroCAD® 10.00-25 s/n 06682 © 2019 HydroCAD Software Solutions LLC
Summary for Subcatchment P2: Proposed Drainage to NJDOT
Runoff = 1.98 cfs @ 12.17 hrs, Volume= 6,806 cf, Depth= 6.20"
Runoff by SCS TR-20 method, UH=SCS, Split Pervious/Imperv., Time Span= 0.00-72.00 hrs, dt= 0.02 hrsNOAA 24-hr C 100-YR Rainfall=8.49"
Area (sf) CN Description* 3,800 98 Impervious
9,377 74 >75% Grass cover, Good, HSG C13,177 81 Weighted Average
9,377 74 71.16% Pervious Area3,800 98 28.84% Impervious Area
Tc Length Slope Velocity Capacity Description(min) (feet) (ft/ft) (ft/sec) (cfs)10.0 Direct Entry,
Subcatchment P2: Proposed Drainage to NJDOT
Runoff
Hydrograph
Time (hours)727068666462605856545250484644424038363432302826242220181614121086420
Flo
w (
cfs)
2
1
0
NOAA 24-hr C100-YR Rainfall=8.49"Runoff Area=13,177 sf
Runoff Volume=6,806 cfRunoff Depth=6.20"
Tc=10.0 minCN=74/98
1.98 cfs @ 12.17 hrs
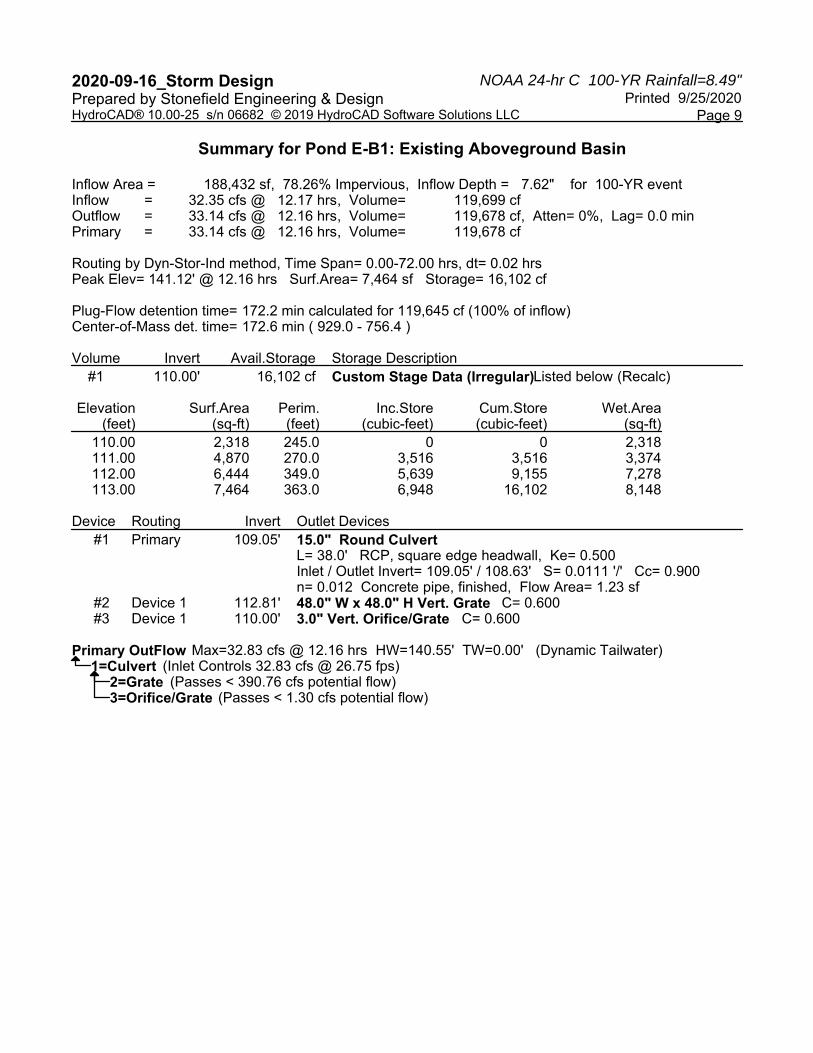
NOAA 24-hr C 100-YR Rainfall=8.49"2020-09-16_Storm Design Printed 9/25/2020Prepared by Stonefield Engineering & Design
Page 9HydroCAD® 10.00-25 s/n 06682 © 2019 HydroCAD Software Solutions LLC
Summary for Pond E-B1: Existing Aboveground Basin
Inflow Area = 188,432 sf, 78.26% Impervious, Inflow Depth = 7.62" for 100-YR eventInflow = 32.35 cfs @ 12.17 hrs, Volume= 119,699 cfOutflow = 33.14 cfs @ 12.16 hrs, Volume= 119,678 cf, Atten= 0%, Lag= 0.0 minPrimary = 33.14 cfs @ 12.16 hrs, Volume= 119,678 cf
Routing by Dyn-Stor-Ind method, Time Span= 0.00-72.00 hrs, dt= 0.02 hrsPeak Elev= 141.12' @ 12.16 hrs Surf.Area= 7,464 sf Storage= 16,102 cf
Plug-Flow detention time= 172.2 min calculated for 119,645 cf (100% of inflow)Center-of-Mass det. time= 172.6 min ( 929.0 - 756.4 )
Volume Invert Avail.Storage Storage Description#1 110.00' 16,102 cf Custom Stage Data (Irregular) Listed below (Recalc)
Elevation Surf.Area Perim. Inc.Store Cum.Store Wet.Area(feet) (sq-ft) (feet) (cubic-feet) (cubic-feet) (sq-ft)
110.00 2,318 245.0 0 0 2,318111.00 4,870 270.0 3,516 3,516 3,374112.00 6,444 349.0 5,639 9,155 7,278113.00 7,464 363.0 6,948 16,102 8,148
Device Routing Invert Outlet Devices#1 Primary 109.05' 15.0" Round Culvert
L= 38.0' RCP, square edge headwall, Ke= 0.500 Inlet / Outlet Invert= 109.05' / 108.63' S= 0.0111 '/' Cc= 0.900 n= 0.012 Concrete pipe, finished, Flow Area= 1.23 sf
#2 Device 1 112.81' 48.0" W x 48.0" H Vert. Grate C= 0.600 #3 Device 1 110.00' 3.0" Vert. Orifice/Grate C= 0.600
Primary OutFlow Max=32.83 cfs @ 12.16 hrs HW=140.55' TW=0.00' (Dynamic Tailwater)1=Culvert (Inlet Controls 32.83 cfs @ 26.75 fps)
2=Grate (Passes < 390.76 cfs potential flow)3=Orifice/Grate (Passes < 1.30 cfs potential flow)
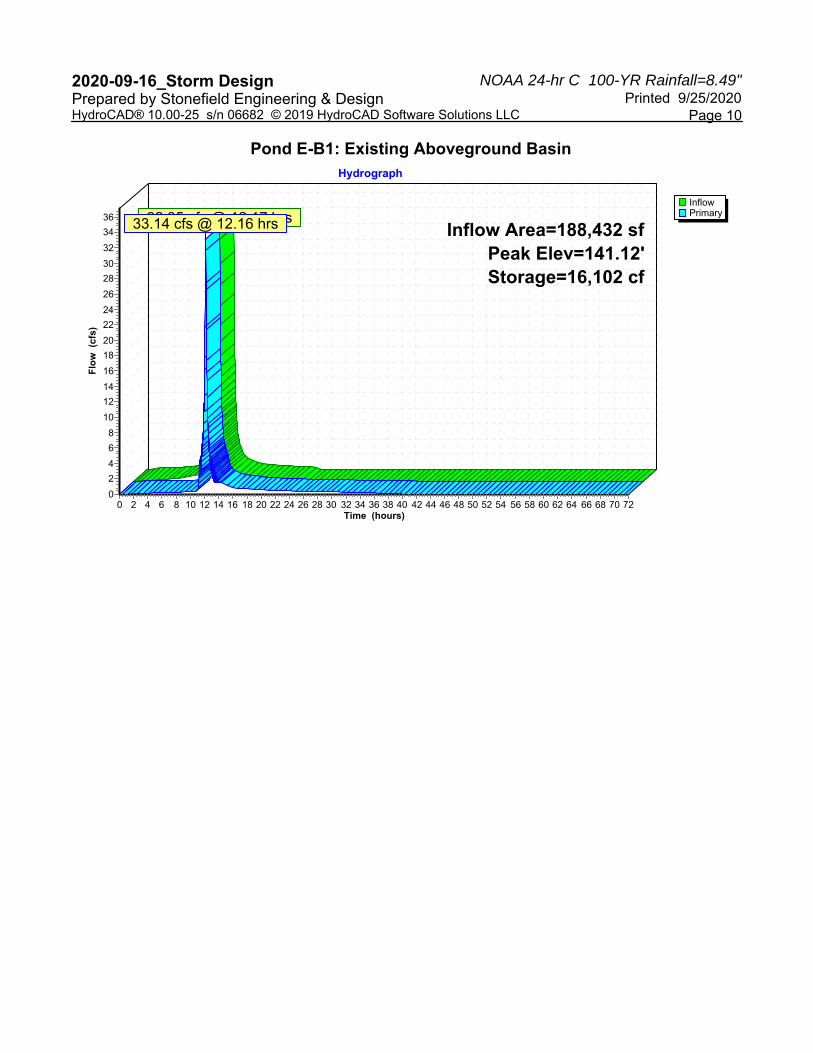
NOAA 24-hr C 100-YR Rainfall=8.49"2020-09-16_Storm Design Printed 9/25/2020Prepared by Stonefield Engineering & Design
Page 10HydroCAD® 10.00-25 s/n 06682 © 2019 HydroCAD Software Solutions LLC
Pond E-B1: Existing Aboveground Basin
InflowPrimary
Hydrograph
Time (hours)727068666462605856545250484644424038363432302826242220181614121086420
Flo
w (
cfs)
36
34
32
30
28
26
24
22
20
18
16
14
12
10
8
6
4
2
0
Inflow Area=188,432 sfPeak Elev=141.12'Storage=16,102 cf
32.35 cfs @ 12.17 hrs33.14 cfs @ 12.16 hrs

NOAA 24-hr C 100-YR Rainfall=8.49"2020-09-16_Storm Design Printed 9/25/2020Prepared by Stonefield Engineering & Design
Page 11HydroCAD® 10.00-25 s/n 06682 © 2019 HydroCAD Software Solutions LLC
Summary for Pond P-B2: Proposed Aboveground Basin
Inflow Area = 183,273 sf, 83.33% Impervious, Inflow Depth = 7.77" for 100-YR eventInflow = 31.87 cfs @ 12.17 hrs, Volume= 118,655 cfOutflow = 21.88 cfs @ 12.27 hrs, Volume= 118,649 cf, Atten= 31%, Lag= 5.7 minDiscarded = 0.00 cfs @ 0.00 hrs, Volume= 0 cfPrimary = 21.88 cfs @ 12.27 hrs, Volume= 118,649 cf
Routing by Dyn-Stor-Ind method, Time Span= 0.00-72.00 hrs, dt= 0.02 hrsPeak Elev= 114.14' @ 12.27 hrs Surf.Area= 9,809 sf Storage= 32,099 cf
Plug-Flow detention time= 78.0 min calculated for 118,616 cf (100% of inflow)Center-of-Mass det. time= 78.0 min ( 831.5 - 753.5 )
Volume Invert Avail.Storage Storage Description#1 109.00' 40,935 cf Custom Stage Data (Irregular) Listed below (Recalc)
Elevation Surf.Area Perim. Inc.Store Cum.Store Wet.Area(feet) (sq-ft) (feet) (cubic-feet) (cubic-feet) (sq-ft)
109.00 100 50.0 0 0 100110.00 4,284 330.0 1,680 1,680 8,569111.00 6,290 343.0 5,255 6,935 9,342112.00 7,349 362.0 6,813 13,747 10,465113.00 8,464 381.0 7,900 21,647 11,648114.00 9,636 400.0 9,044 30,691 12,892115.00 10,864 419.0 10,244 40,935 14,196
Device Routing Invert Outlet Devices#1 Primary 109.05' 6.0" Vert. 6" Orifice C= 0.600 #2 Primary 112.81' 48.0" W x 48.0" H Vert. Grate C= 0.600 #3 Discarded 109.00' 4.000 in/hr Exfiltration X 0.00 over Surface area
Conductivity to Groundwater Elevation = 100.00'
Discarded OutFlow Max=0.00 cfs @ 0.00 hrs HW=109.00' (Free Discharge)3=Exfiltration ( Controls 0.00 cfs)
Primary OutFlow Max=21.83 cfs @ 12.27 hrs HW=114.14' TW=0.00' (Dynamic Tailwater)1=6" Orifice (Orifice Controls 2.08 cfs @ 10.60 fps)2=Grate (Orifice Controls 19.75 cfs @ 3.71 fps)
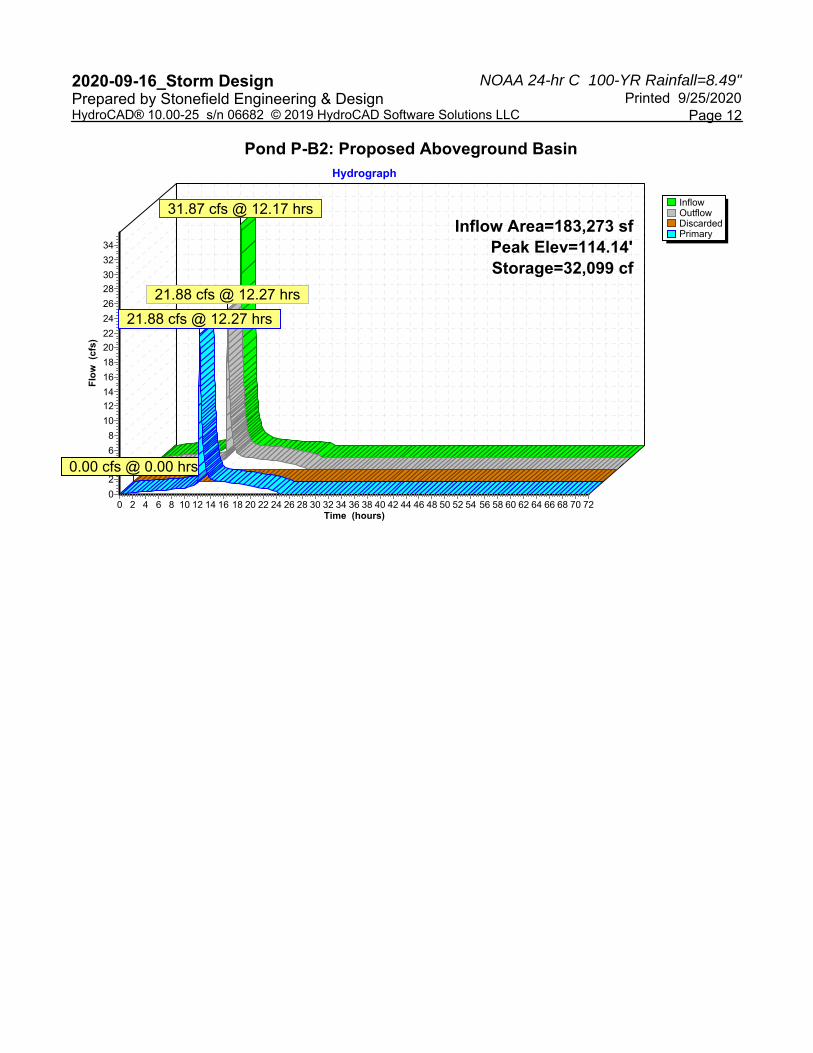
NOAA 24-hr C 100-YR Rainfall=8.49"2020-09-16_Storm Design Printed 9/25/2020Prepared by Stonefield Engineering & Design
Page 12HydroCAD® 10.00-25 s/n 06682 © 2019 HydroCAD Software Solutions LLC
Pond P-B2: Proposed Aboveground Basin
InflowOutflowDiscardedPrimary
Hydrograph
Time (hours)727068666462605856545250484644424038363432302826242220181614121086420
Flo
w (
cfs)
34
32
30
28
26
24
22
20
18
16
14
12
10
8
6
4
2
0
Inflow Area=183,273 sfPeak Elev=114.14'Storage=32,099 cf
31.87 cfs @ 12.17 hrs
21.88 cfs @ 12.27 hrs
0.00 cfs @ 0.00 hrs
21.88 cfs @ 12.27 hrs
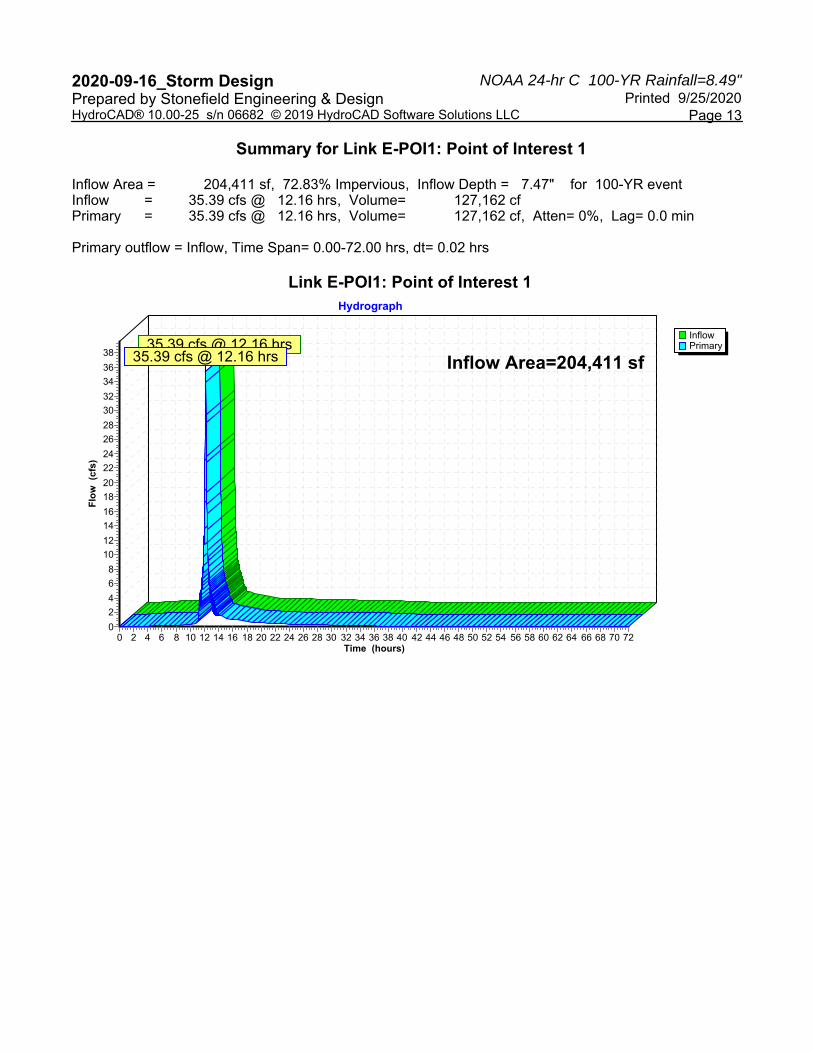
NOAA 24-hr C 100-YR Rainfall=8.49"2020-09-16_Storm Design Printed 9/25/2020Prepared by Stonefield Engineering & Design
Page 13HydroCAD® 10.00-25 s/n 06682 © 2019 HydroCAD Software Solutions LLC
Summary for Link E-POI1: Point of Interest 1
Inflow Area = 204,411 sf, 72.83% Impervious, Inflow Depth = 7.47" for 100-YR eventInflow = 35.39 cfs @ 12.16 hrs, Volume= 127,162 cfPrimary = 35.39 cfs @ 12.16 hrs, Volume= 127,162 cf, Atten= 0%, Lag= 0.0 min
Primary outflow = Inflow, Time Span= 0.00-72.00 hrs, dt= 0.02 hrs
Link E-POI1: Point of Interest 1
InflowPrimary
Hydrograph
Time (hours)727068666462605856545250484644424038363432302826242220181614121086420
Flo
w (
cfs)
38
36
34
32
30
28
26
24
22
20
18
16
14
12
10
8
6
4
2
0
Inflow Area=204,411 sf35.39 cfs @ 12.16 hrs
35.39 cfs @ 12.16 hrs

NOAA 24-hr C 100-YR Rainfall=8.49"2020-09-16_Storm Design Printed 9/25/2020Prepared by Stonefield Engineering & Design
Page 14HydroCAD® 10.00-25 s/n 06682 © 2019 HydroCAD Software Solutions LLC
Summary for Link E-POI2: Point of Interest 2
Inflow Area = 13,400 sf, 28.90% Impervious, Inflow Depth = 6.20" for 100-YR eventInflow = 2.01 cfs @ 12.17 hrs, Volume= 6,923 cfPrimary = 2.01 cfs @ 12.17 hrs, Volume= 6,923 cf, Atten= 0%, Lag= 0.0 min
Primary outflow = Inflow, Time Span= 0.00-72.00 hrs, dt= 0.02 hrs
Link E-POI2: Point of Interest 2
InflowPrimary
Hydrograph
Time (hours)727068666462605856545250484644424038363432302826242220181614121086420
Flo
w (
cfs)
2
1
0
Inflow Area=13,400 sf2.01 cfs @ 12.17 hrs
2.01 cfs @ 12.17 hrs
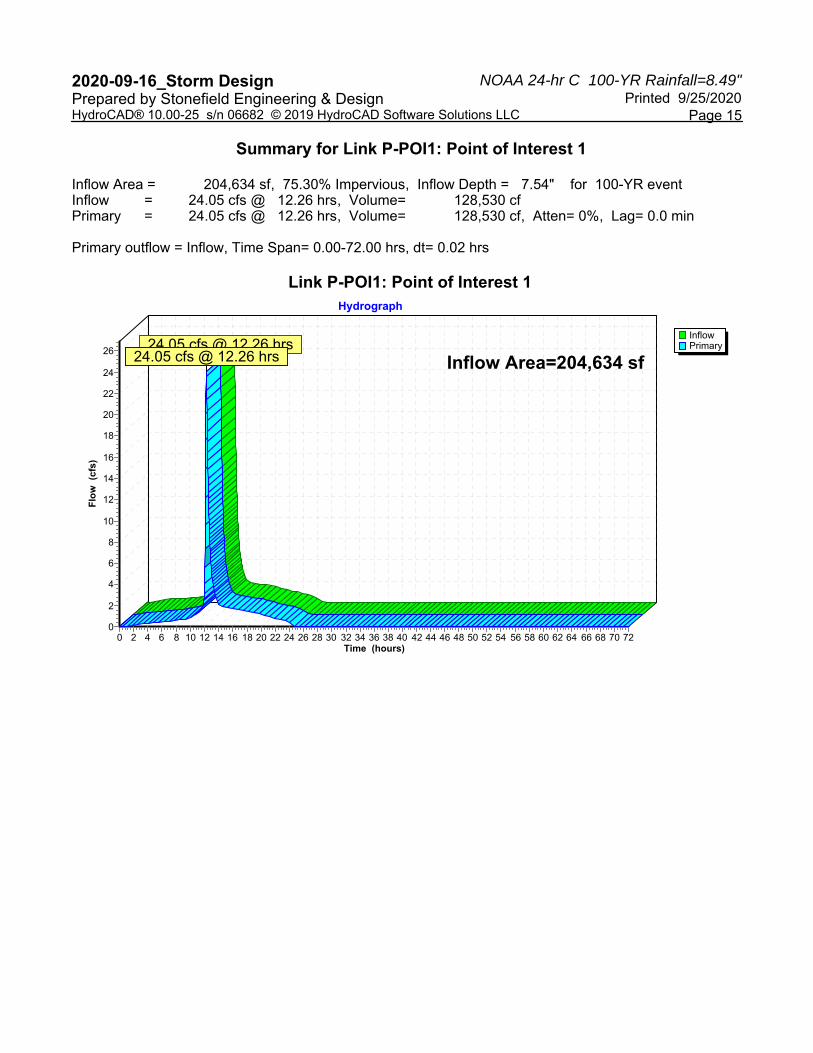
NOAA 24-hr C 100-YR Rainfall=8.49"2020-09-16_Storm Design Printed 9/25/2020Prepared by Stonefield Engineering & Design
Page 15HydroCAD® 10.00-25 s/n 06682 © 2019 HydroCAD Software Solutions LLC
Summary for Link P-POI1: Point of Interest 1
Inflow Area = 204,634 sf, 75.30% Impervious, Inflow Depth = 7.54" for 100-YR eventInflow = 24.05 cfs @ 12.26 hrs, Volume= 128,530 cfPrimary = 24.05 cfs @ 12.26 hrs, Volume= 128,530 cf, Atten= 0%, Lag= 0.0 min
Primary outflow = Inflow, Time Span= 0.00-72.00 hrs, dt= 0.02 hrs
Link P-POI1: Point of Interest 1
InflowPrimary
Hydrograph
Time (hours)727068666462605856545250484644424038363432302826242220181614121086420
Flo
w (
cfs)
26
24
22
20
18
16
14
12
10
8
6
4
2
0
Inflow Area=204,634 sf24.05 cfs @ 12.26 hrs
24.05 cfs @ 12.26 hrs
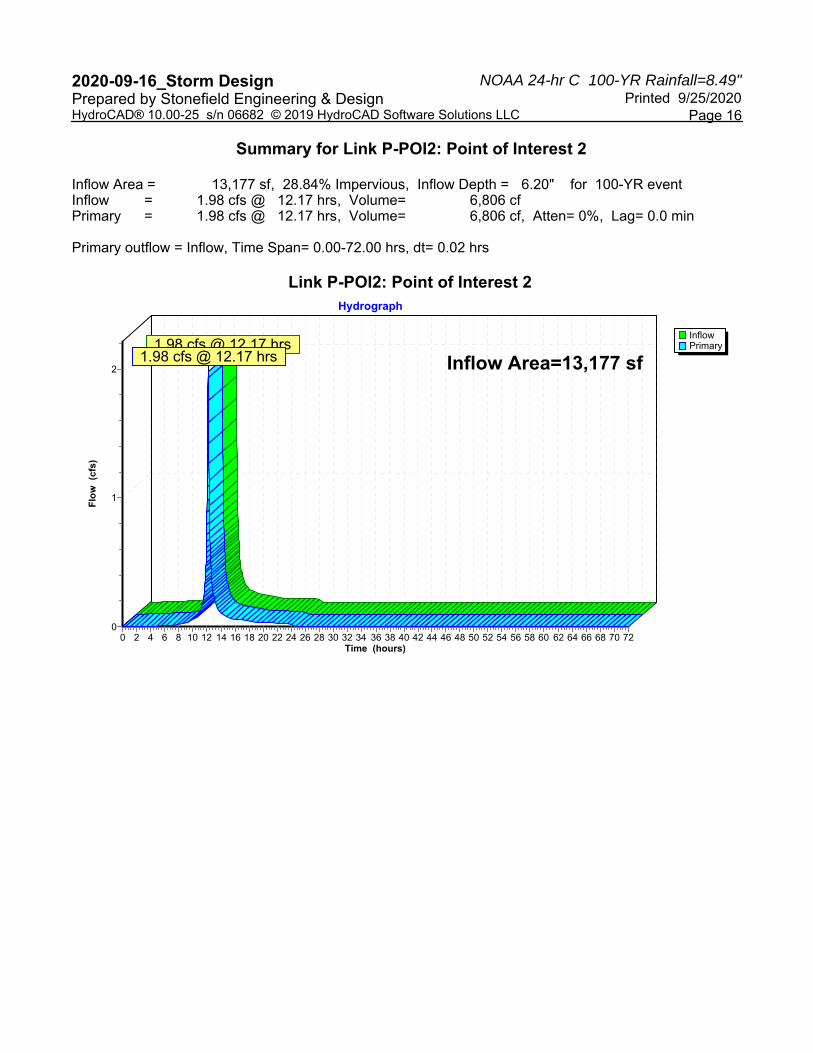
NOAA 24-hr C 100-YR Rainfall=8.49"2020-09-16_Storm Design Printed 9/25/2020Prepared by Stonefield Engineering & Design
Page 16HydroCAD® 10.00-25 s/n 06682 © 2019 HydroCAD Software Solutions LLC
Summary for Link P-POI2: Point of Interest 2
Inflow Area = 13,177 sf, 28.84% Impervious, Inflow Depth = 6.20" for 100-YR eventInflow = 1.98 cfs @ 12.17 hrs, Volume= 6,806 cfPrimary = 1.98 cfs @ 12.17 hrs, Volume= 6,806 cf, Atten= 0%, Lag= 0.0 min
Primary outflow = Inflow, Time Span= 0.00-72.00 hrs, dt= 0.02 hrs
Link P-POI2: Point of Interest 2
InflowPrimary
Hydrograph
Time (hours)727068666462605856545250484644424038363432302826242220181614121086420
Flo
w (
cfs)
2
1
0
Inflow Area=13,177 sf1.98 cfs @ 12.17 hrs
1.98 cfs @ 12.17 hrs

APPENDIX C-5
BMP DISCHARGE & STORAGE TABLES
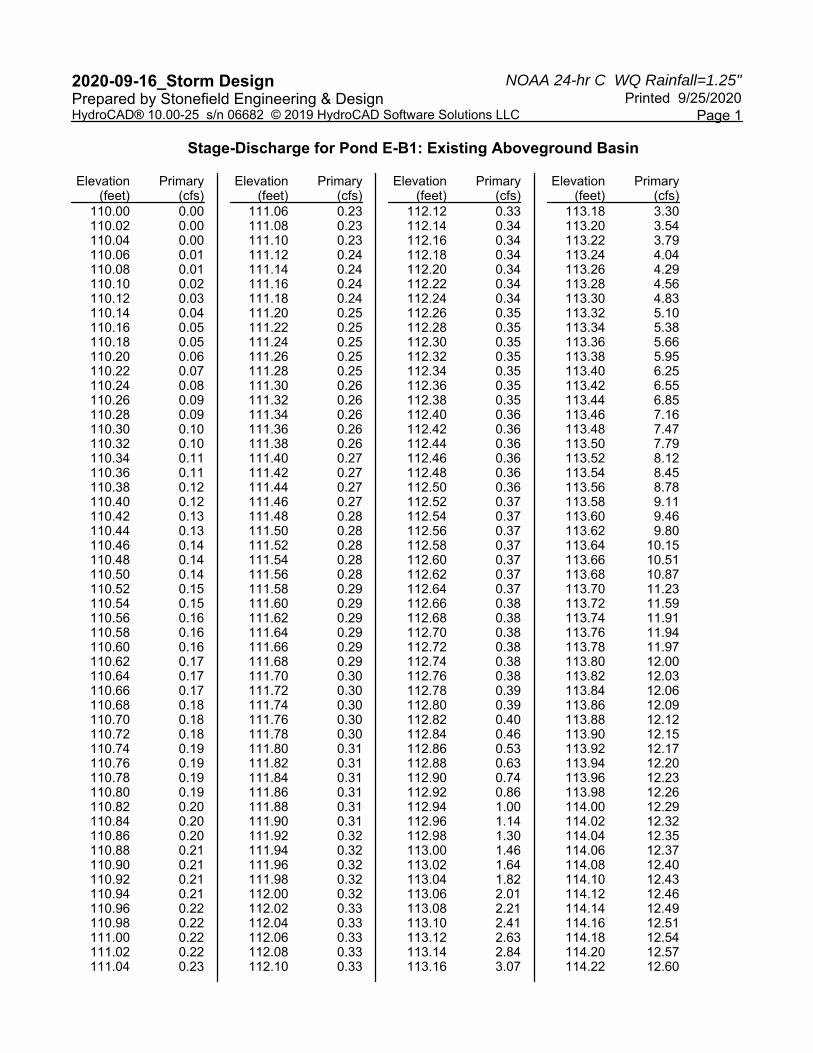
NOAA 24-hr C WQ Rainfall=1.25"2020-09-16_Storm Design Printed 9/25/2020Prepared by Stonefield Engineering & Design
Page 1HydroCAD® 10.00-25 s/n 06682 © 2019 HydroCAD Software Solutions LLC
Stage-Discharge for Pond E-B1: Existing Aboveground Basin
Elevation(feet)
Primary(cfs)
110.00 0.00110.02 0.00110.04 0.00110.06 0.01110.08 0.01110.10 0.02110.12 0.03110.14 0.04110.16 0.05110.18 0.05110.20 0.06110.22 0.07110.24 0.08110.26 0.09110.28 0.09110.30 0.10110.32 0.10110.34 0.11110.36 0.11110.38 0.12110.40 0.12110.42 0.13110.44 0.13110.46 0.14110.48 0.14110.50 0.14110.52 0.15110.54 0.15110.56 0.16110.58 0.16110.60 0.16110.62 0.17110.64 0.17110.66 0.17110.68 0.18110.70 0.18110.72 0.18110.74 0.19110.76 0.19110.78 0.19110.80 0.19110.82 0.20110.84 0.20110.86 0.20110.88 0.21110.90 0.21110.92 0.21110.94 0.21110.96 0.22110.98 0.22111.00 0.22111.02 0.22111.04 0.23
Elevation(feet)
Primary(cfs)
111.06 0.23111.08 0.23111.10 0.23111.12 0.24111.14 0.24111.16 0.24111.18 0.24111.20 0.25111.22 0.25111.24 0.25111.26 0.25111.28 0.25111.30 0.26111.32 0.26111.34 0.26111.36 0.26111.38 0.26111.40 0.27111.42 0.27111.44 0.27111.46 0.27111.48 0.28111.50 0.28111.52 0.28111.54 0.28111.56 0.28111.58 0.29111.60 0.29111.62 0.29111.64 0.29111.66 0.29111.68 0.29111.70 0.30111.72 0.30111.74 0.30111.76 0.30111.78 0.30111.80 0.31111.82 0.31111.84 0.31111.86 0.31111.88 0.31111.90 0.31111.92 0.32111.94 0.32111.96 0.32111.98 0.32112.00 0.32112.02 0.33112.04 0.33112.06 0.33112.08 0.33112.10 0.33
Elevation(feet)
Primary(cfs)
112.12 0.33112.14 0.34112.16 0.34112.18 0.34112.20 0.34112.22 0.34112.24 0.34112.26 0.35112.28 0.35112.30 0.35112.32 0.35112.34 0.35112.36 0.35112.38 0.35112.40 0.36112.42 0.36112.44 0.36112.46 0.36112.48 0.36112.50 0.36112.52 0.37112.54 0.37112.56 0.37112.58 0.37112.60 0.37112.62 0.37112.64 0.37112.66 0.38112.68 0.38112.70 0.38112.72 0.38112.74 0.38112.76 0.38112.78 0.39112.80 0.39112.82 0.40112.84 0.46112.86 0.53112.88 0.63112.90 0.74112.92 0.86112.94 1.00112.96 1.14112.98 1.30113.00 1.46113.02 1.64113.04 1.82113.06 2.01113.08 2.21113.10 2.41113.12 2.63113.14 2.84113.16 3.07
Elevation(feet)
Primary(cfs)
113.18 3.30113.20 3.54113.22 3.79113.24 4.04113.26 4.29113.28 4.56113.30 4.83113.32 5.10113.34 5.38113.36 5.66113.38 5.95113.40 6.25113.42 6.55113.44 6.85113.46 7.16113.48 7.47113.50 7.79113.52 8.12113.54 8.45113.56 8.78113.58 9.11113.60 9.46113.62 9.80113.64 10.15113.66 10.51113.68 10.87113.70 11.23113.72 11.59113.74 11.91113.76 11.94113.78 11.97113.80 12.00113.82 12.03113.84 12.06113.86 12.09113.88 12.12113.90 12.15113.92 12.17113.94 12.20113.96 12.23113.98 12.26114.00 12.29114.02 12.32114.04 12.35114.06 12.37114.08 12.40114.10 12.43114.12 12.46114.14 12.49114.16 12.51114.18 12.54114.20 12.57114.22 12.60
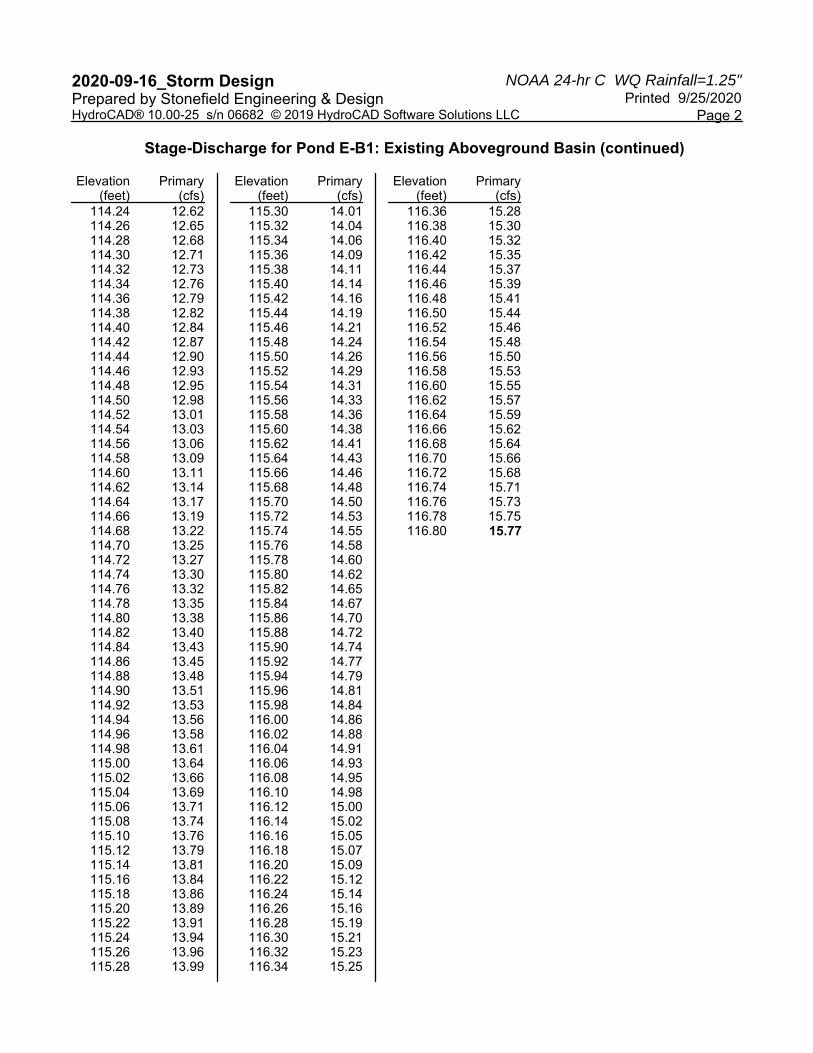
NOAA 24-hr C WQ Rainfall=1.25"2020-09-16_Storm Design Printed 9/25/2020Prepared by Stonefield Engineering & Design
Page 2HydroCAD® 10.00-25 s/n 06682 © 2019 HydroCAD Software Solutions LLC
Stage-Discharge for Pond E-B1: Existing Aboveground Basin (continued)
Elevation(feet)
Primary(cfs)
114.24 12.62114.26 12.65114.28 12.68114.30 12.71114.32 12.73114.34 12.76114.36 12.79114.38 12.82114.40 12.84114.42 12.87114.44 12.90114.46 12.93114.48 12.95114.50 12.98114.52 13.01114.54 13.03114.56 13.06114.58 13.09114.60 13.11114.62 13.14114.64 13.17114.66 13.19114.68 13.22114.70 13.25114.72 13.27114.74 13.30114.76 13.32114.78 13.35114.80 13.38114.82 13.40114.84 13.43114.86 13.45114.88 13.48114.90 13.51114.92 13.53114.94 13.56114.96 13.58114.98 13.61115.00 13.64115.02 13.66115.04 13.69115.06 13.71115.08 13.74115.10 13.76115.12 13.79115.14 13.81115.16 13.84115.18 13.86115.20 13.89115.22 13.91115.24 13.94115.26 13.96115.28 13.99
Elevation(feet)
Primary(cfs)
115.30 14.01115.32 14.04115.34 14.06115.36 14.09115.38 14.11115.40 14.14115.42 14.16115.44 14.19115.46 14.21115.48 14.24115.50 14.26115.52 14.29115.54 14.31115.56 14.33115.58 14.36115.60 14.38115.62 14.41115.64 14.43115.66 14.46115.68 14.48115.70 14.50115.72 14.53115.74 14.55115.76 14.58115.78 14.60115.80 14.62115.82 14.65115.84 14.67115.86 14.70115.88 14.72115.90 14.74115.92 14.77115.94 14.79115.96 14.81115.98 14.84116.00 14.86116.02 14.88116.04 14.91116.06 14.93116.08 14.95116.10 14.98116.12 15.00116.14 15.02116.16 15.05116.18 15.07116.20 15.09116.22 15.12116.24 15.14116.26 15.16116.28 15.19116.30 15.21116.32 15.23116.34 15.25
Elevation(feet)
Primary(cfs)
116.36 15.28116.38 15.30116.40 15.32116.42 15.35116.44 15.37116.46 15.39116.48 15.41116.50 15.44116.52 15.46116.54 15.48116.56 15.50116.58 15.53116.60 15.55116.62 15.57116.64 15.59116.66 15.62116.68 15.64116.70 15.66116.72 15.68116.74 15.71116.76 15.73116.78 15.75116.80 15.77
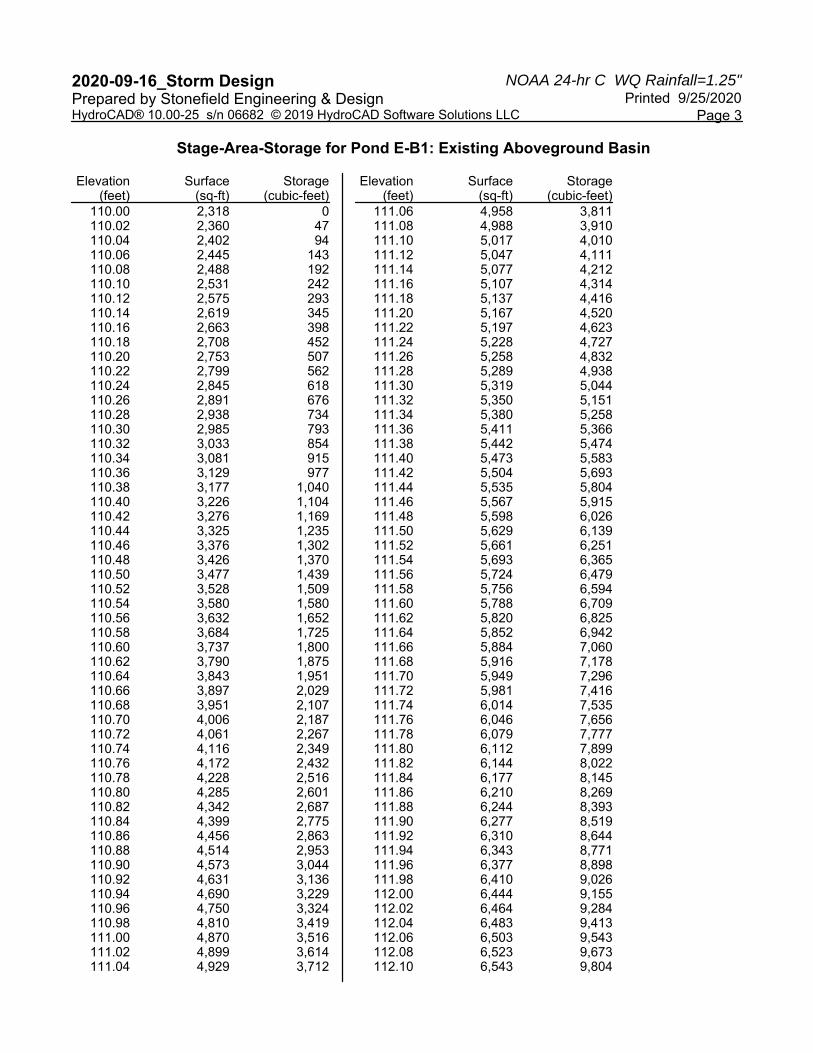
NOAA 24-hr C WQ Rainfall=1.25"2020-09-16_Storm Design Printed 9/25/2020Prepared by Stonefield Engineering & Design
Page 3HydroCAD® 10.00-25 s/n 06682 © 2019 HydroCAD Software Solutions LLC
Stage-Area-Storage for Pond E-B1: Existing Aboveground Basin
Elevation(feet)
Surface(sq-ft)
Storage(cubic-feet)
110.00 2,318 0110.02 2,360 47110.04 2,402 94110.06 2,445 143110.08 2,488 192110.10 2,531 242110.12 2,575 293110.14 2,619 345110.16 2,663 398110.18 2,708 452110.20 2,753 507110.22 2,799 562110.24 2,845 618110.26 2,891 676110.28 2,938 734110.30 2,985 793110.32 3,033 854110.34 3,081 915110.36 3,129 977110.38 3,177 1,040110.40 3,226 1,104110.42 3,276 1,169110.44 3,325 1,235110.46 3,376 1,302110.48 3,426 1,370110.50 3,477 1,439110.52 3,528 1,509110.54 3,580 1,580110.56 3,632 1,652110.58 3,684 1,725110.60 3,737 1,800110.62 3,790 1,875110.64 3,843 1,951110.66 3,897 2,029110.68 3,951 2,107110.70 4,006 2,187110.72 4,061 2,267110.74 4,116 2,349110.76 4,172 2,432110.78 4,228 2,516110.80 4,285 2,601110.82 4,342 2,687110.84 4,399 2,775110.86 4,456 2,863110.88 4,514 2,953110.90 4,573 3,044110.92 4,631 3,136110.94 4,690 3,229110.96 4,750 3,324110.98 4,810 3,419111.00 4,870 3,516111.02 4,899 3,614111.04 4,929 3,712
Elevation(feet)
Surface(sq-ft)
Storage(cubic-feet)
111.06 4,958 3,811111.08 4,988 3,910111.10 5,017 4,010111.12 5,047 4,111111.14 5,077 4,212111.16 5,107 4,314111.18 5,137 4,416111.20 5,167 4,520111.22 5,197 4,623111.24 5,228 4,727111.26 5,258 4,832111.28 5,289 4,938111.30 5,319 5,044111.32 5,350 5,151111.34 5,380 5,258111.36 5,411 5,366111.38 5,442 5,474111.40 5,473 5,583111.42 5,504 5,693111.44 5,535 5,804111.46 5,567 5,915111.48 5,598 6,026111.50 5,629 6,139111.52 5,661 6,251111.54 5,693 6,365111.56 5,724 6,479111.58 5,756 6,594111.60 5,788 6,709111.62 5,820 6,825111.64 5,852 6,942111.66 5,884 7,060111.68 5,916 7,178111.70 5,949 7,296111.72 5,981 7,416111.74 6,014 7,535111.76 6,046 7,656111.78 6,079 7,777111.80 6,112 7,899111.82 6,144 8,022111.84 6,177 8,145111.86 6,210 8,269111.88 6,244 8,393111.90 6,277 8,519111.92 6,310 8,644111.94 6,343 8,771111.96 6,377 8,898111.98 6,410 9,026112.00 6,444 9,155112.02 6,464 9,284112.04 6,483 9,413112.06 6,503 9,543112.08 6,523 9,673112.10 6,543 9,804
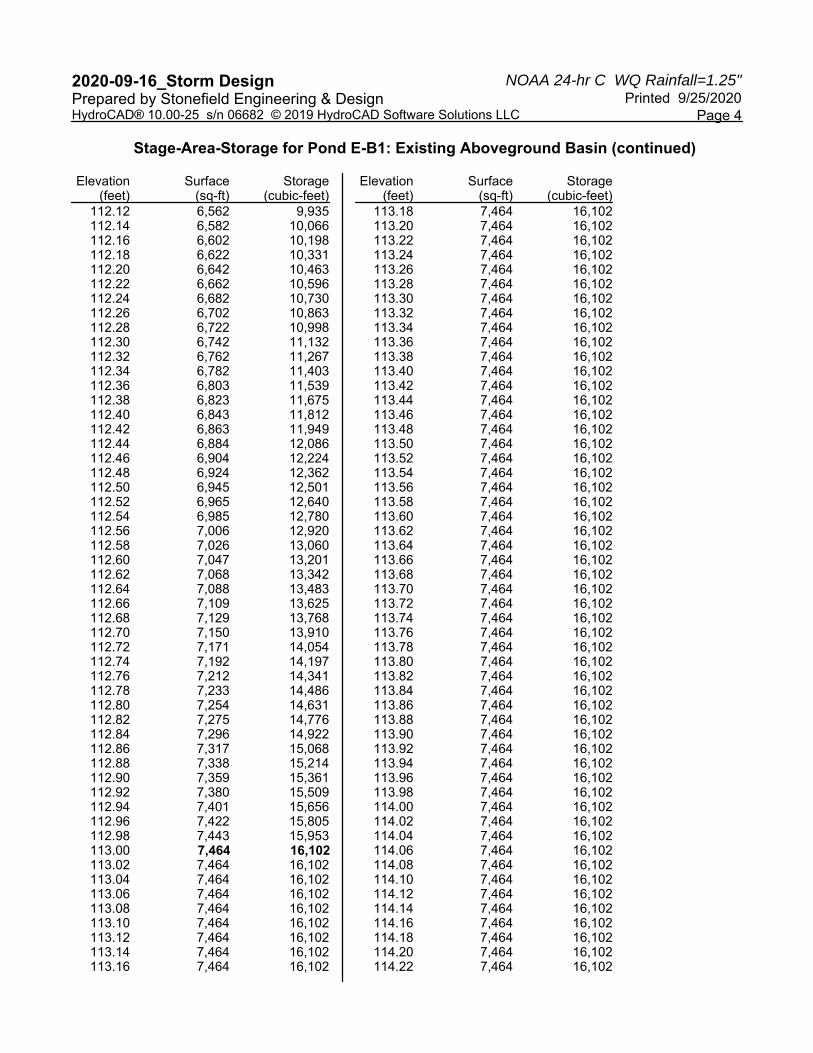
NOAA 24-hr C WQ Rainfall=1.25"2020-09-16_Storm Design Printed 9/25/2020Prepared by Stonefield Engineering & Design
Page 4HydroCAD® 10.00-25 s/n 06682 © 2019 HydroCAD Software Solutions LLC
Stage-Area-Storage for Pond E-B1: Existing Aboveground Basin (continued)
Elevation(feet)
Surface(sq-ft)
Storage(cubic-feet)
112.12 6,562 9,935112.14 6,582 10,066112.16 6,602 10,198112.18 6,622 10,331112.20 6,642 10,463112.22 6,662 10,596112.24 6,682 10,730112.26 6,702 10,863112.28 6,722 10,998112.30 6,742 11,132112.32 6,762 11,267112.34 6,782 11,403112.36 6,803 11,539112.38 6,823 11,675112.40 6,843 11,812112.42 6,863 11,949112.44 6,884 12,086112.46 6,904 12,224112.48 6,924 12,362112.50 6,945 12,501112.52 6,965 12,640112.54 6,985 12,780112.56 7,006 12,920112.58 7,026 13,060112.60 7,047 13,201112.62 7,068 13,342112.64 7,088 13,483112.66 7,109 13,625112.68 7,129 13,768112.70 7,150 13,910112.72 7,171 14,054112.74 7,192 14,197112.76 7,212 14,341112.78 7,233 14,486112.80 7,254 14,631112.82 7,275 14,776112.84 7,296 14,922112.86 7,317 15,068112.88 7,338 15,214112.90 7,359 15,361112.92 7,380 15,509112.94 7,401 15,656112.96 7,422 15,805112.98 7,443 15,953113.00 7,464 16,102113.02 7,464 16,102113.04 7,464 16,102113.06 7,464 16,102113.08 7,464 16,102113.10 7,464 16,102113.12 7,464 16,102113.14 7,464 16,102113.16 7,464 16,102
Elevation(feet)
Surface(sq-ft)
Storage(cubic-feet)
113.18 7,464 16,102113.20 7,464 16,102113.22 7,464 16,102113.24 7,464 16,102113.26 7,464 16,102113.28 7,464 16,102113.30 7,464 16,102113.32 7,464 16,102113.34 7,464 16,102113.36 7,464 16,102113.38 7,464 16,102113.40 7,464 16,102113.42 7,464 16,102113.44 7,464 16,102113.46 7,464 16,102113.48 7,464 16,102113.50 7,464 16,102113.52 7,464 16,102113.54 7,464 16,102113.56 7,464 16,102113.58 7,464 16,102113.60 7,464 16,102113.62 7,464 16,102113.64 7,464 16,102113.66 7,464 16,102113.68 7,464 16,102113.70 7,464 16,102113.72 7,464 16,102113.74 7,464 16,102113.76 7,464 16,102113.78 7,464 16,102113.80 7,464 16,102113.82 7,464 16,102113.84 7,464 16,102113.86 7,464 16,102113.88 7,464 16,102113.90 7,464 16,102113.92 7,464 16,102113.94 7,464 16,102113.96 7,464 16,102113.98 7,464 16,102114.00 7,464 16,102114.02 7,464 16,102114.04 7,464 16,102114.06 7,464 16,102114.08 7,464 16,102114.10 7,464 16,102114.12 7,464 16,102114.14 7,464 16,102114.16 7,464 16,102114.18 7,464 16,102114.20 7,464 16,102114.22 7,464 16,102
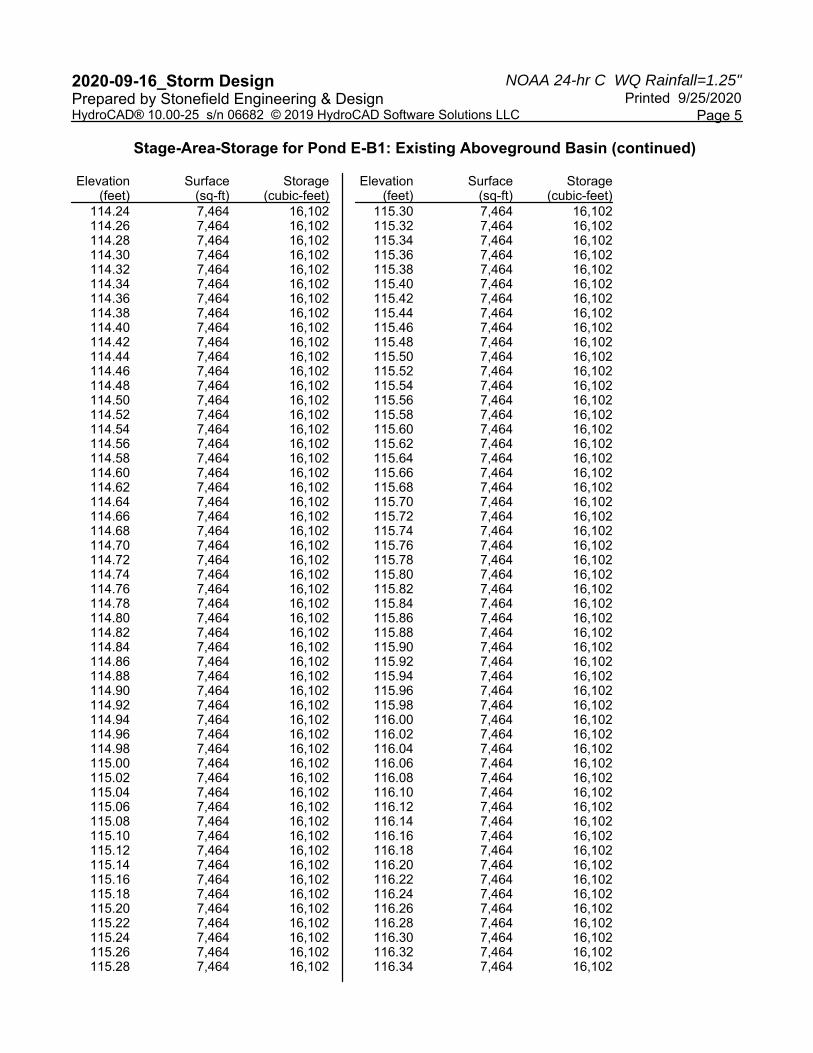
NOAA 24-hr C WQ Rainfall=1.25"2020-09-16_Storm Design Printed 9/25/2020Prepared by Stonefield Engineering & Design
Page 5HydroCAD® 10.00-25 s/n 06682 © 2019 HydroCAD Software Solutions LLC
Stage-Area-Storage for Pond E-B1: Existing Aboveground Basin (continued)
Elevation(feet)
Surface(sq-ft)
Storage(cubic-feet)
114.24 7,464 16,102114.26 7,464 16,102114.28 7,464 16,102114.30 7,464 16,102114.32 7,464 16,102114.34 7,464 16,102114.36 7,464 16,102114.38 7,464 16,102114.40 7,464 16,102114.42 7,464 16,102114.44 7,464 16,102114.46 7,464 16,102114.48 7,464 16,102114.50 7,464 16,102114.52 7,464 16,102114.54 7,464 16,102114.56 7,464 16,102114.58 7,464 16,102114.60 7,464 16,102114.62 7,464 16,102114.64 7,464 16,102114.66 7,464 16,102114.68 7,464 16,102114.70 7,464 16,102114.72 7,464 16,102114.74 7,464 16,102114.76 7,464 16,102114.78 7,464 16,102114.80 7,464 16,102114.82 7,464 16,102114.84 7,464 16,102114.86 7,464 16,102114.88 7,464 16,102114.90 7,464 16,102114.92 7,464 16,102114.94 7,464 16,102114.96 7,464 16,102114.98 7,464 16,102115.00 7,464 16,102115.02 7,464 16,102115.04 7,464 16,102115.06 7,464 16,102115.08 7,464 16,102115.10 7,464 16,102115.12 7,464 16,102115.14 7,464 16,102115.16 7,464 16,102115.18 7,464 16,102115.20 7,464 16,102115.22 7,464 16,102115.24 7,464 16,102115.26 7,464 16,102115.28 7,464 16,102
Elevation(feet)
Surface(sq-ft)
Storage(cubic-feet)
115.30 7,464 16,102115.32 7,464 16,102115.34 7,464 16,102115.36 7,464 16,102115.38 7,464 16,102115.40 7,464 16,102115.42 7,464 16,102115.44 7,464 16,102115.46 7,464 16,102115.48 7,464 16,102115.50 7,464 16,102115.52 7,464 16,102115.54 7,464 16,102115.56 7,464 16,102115.58 7,464 16,102115.60 7,464 16,102115.62 7,464 16,102115.64 7,464 16,102115.66 7,464 16,102115.68 7,464 16,102115.70 7,464 16,102115.72 7,464 16,102115.74 7,464 16,102115.76 7,464 16,102115.78 7,464 16,102115.80 7,464 16,102115.82 7,464 16,102115.84 7,464 16,102115.86 7,464 16,102115.88 7,464 16,102115.90 7,464 16,102115.92 7,464 16,102115.94 7,464 16,102115.96 7,464 16,102115.98 7,464 16,102116.00 7,464 16,102116.02 7,464 16,102116.04 7,464 16,102116.06 7,464 16,102116.08 7,464 16,102116.10 7,464 16,102116.12 7,464 16,102116.14 7,464 16,102116.16 7,464 16,102116.18 7,464 16,102116.20 7,464 16,102116.22 7,464 16,102116.24 7,464 16,102116.26 7,464 16,102116.28 7,464 16,102116.30 7,464 16,102116.32 7,464 16,102116.34 7,464 16,102
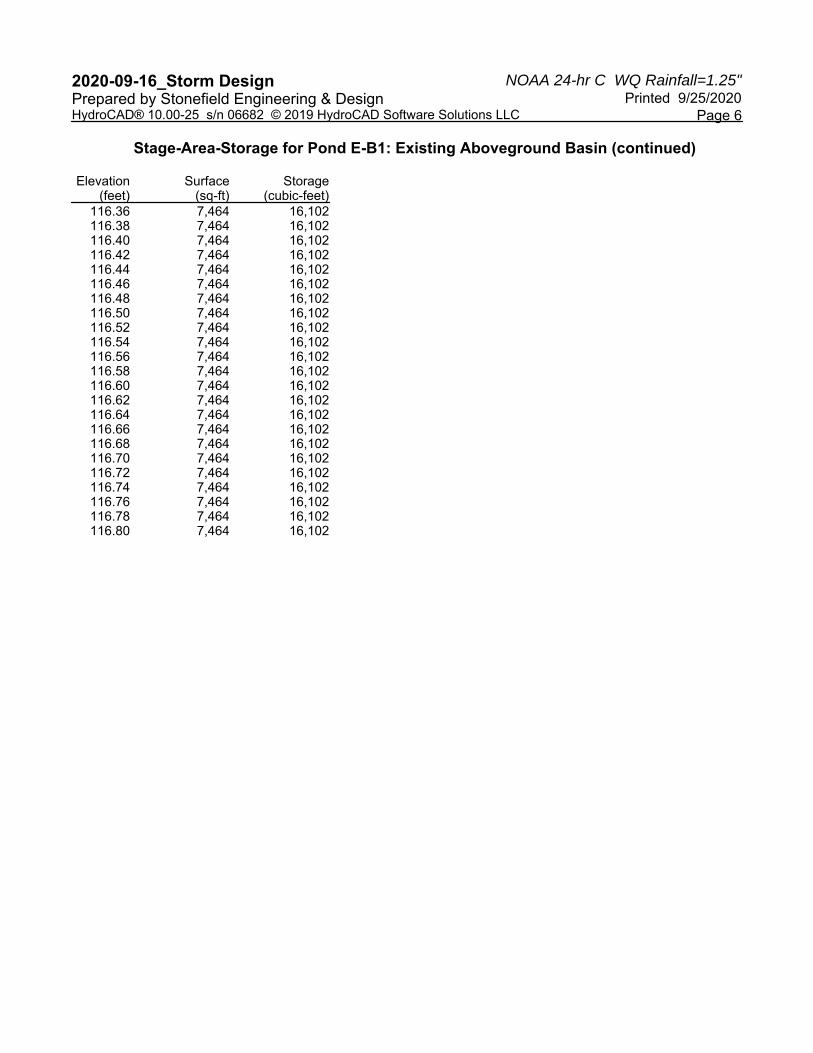
NOAA 24-hr C WQ Rainfall=1.25"2020-09-16_Storm Design Printed 9/25/2020Prepared by Stonefield Engineering & Design
Page 6HydroCAD® 10.00-25 s/n 06682 © 2019 HydroCAD Software Solutions LLC
Stage-Area-Storage for Pond E-B1: Existing Aboveground Basin (continued)
Elevation(feet)
Surface(sq-ft)
Storage(cubic-feet)
116.36 7,464 16,102116.38 7,464 16,102116.40 7,464 16,102116.42 7,464 16,102116.44 7,464 16,102116.46 7,464 16,102116.48 7,464 16,102116.50 7,464 16,102116.52 7,464 16,102116.54 7,464 16,102116.56 7,464 16,102116.58 7,464 16,102116.60 7,464 16,102116.62 7,464 16,102116.64 7,464 16,102116.66 7,464 16,102116.68 7,464 16,102116.70 7,464 16,102116.72 7,464 16,102116.74 7,464 16,102116.76 7,464 16,102116.78 7,464 16,102116.80 7,464 16,102
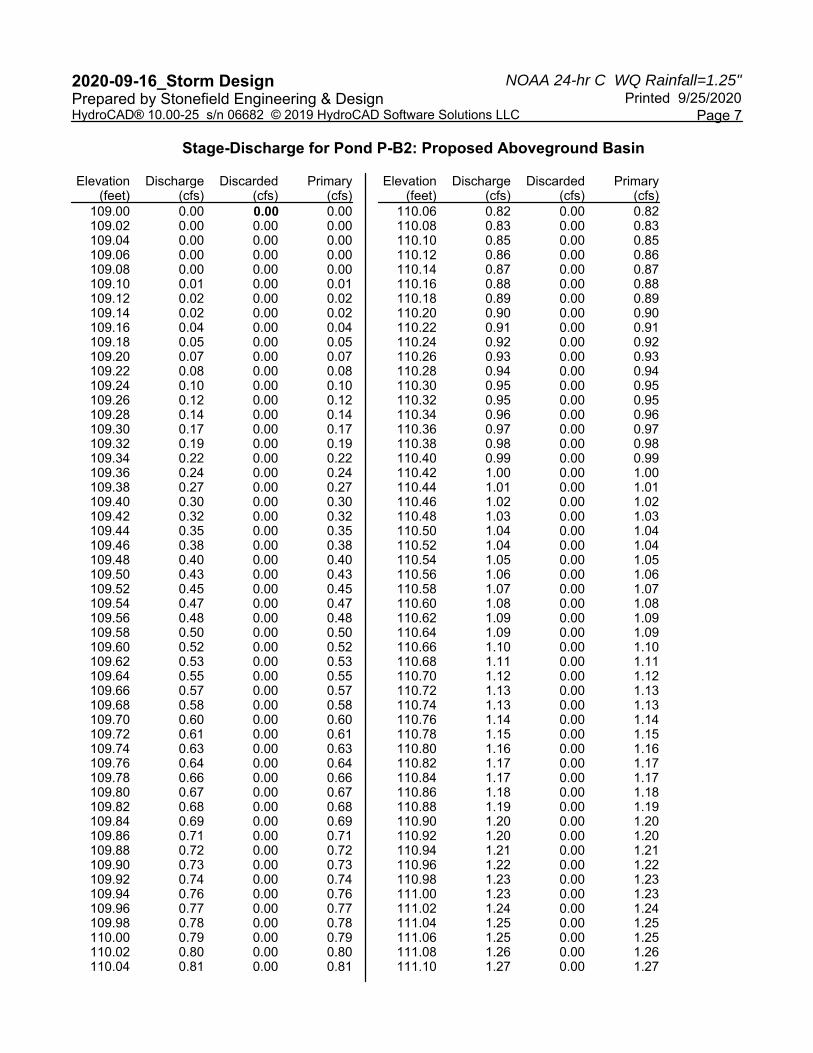
NOAA 24-hr C WQ Rainfall=1.25"2020-09-16_Storm Design Printed 9/25/2020Prepared by Stonefield Engineering & Design
Page 7HydroCAD® 10.00-25 s/n 06682 © 2019 HydroCAD Software Solutions LLC
Stage-Discharge for Pond P-B2: Proposed Aboveground Basin
Elevation(feet)
Discharge(cfs)
Discarded(cfs)
Primary(cfs)
109.00 0.00 0.00 0.00109.02 0.00 0.00 0.00109.04 0.00 0.00 0.00109.06 0.00 0.00 0.00109.08 0.00 0.00 0.00109.10 0.01 0.00 0.01109.12 0.02 0.00 0.02109.14 0.02 0.00 0.02109.16 0.04 0.00 0.04109.18 0.05 0.00 0.05109.20 0.07 0.00 0.07109.22 0.08 0.00 0.08109.24 0.10 0.00 0.10109.26 0.12 0.00 0.12109.28 0.14 0.00 0.14109.30 0.17 0.00 0.17109.32 0.19 0.00 0.19109.34 0.22 0.00 0.22109.36 0.24 0.00 0.24109.38 0.27 0.00 0.27109.40 0.30 0.00 0.30109.42 0.32 0.00 0.32109.44 0.35 0.00 0.35109.46 0.38 0.00 0.38109.48 0.40 0.00 0.40109.50 0.43 0.00 0.43109.52 0.45 0.00 0.45109.54 0.47 0.00 0.47109.56 0.48 0.00 0.48109.58 0.50 0.00 0.50109.60 0.52 0.00 0.52109.62 0.53 0.00 0.53109.64 0.55 0.00 0.55109.66 0.57 0.00 0.57109.68 0.58 0.00 0.58109.70 0.60 0.00 0.60109.72 0.61 0.00 0.61109.74 0.63 0.00 0.63109.76 0.64 0.00 0.64109.78 0.66 0.00 0.66109.80 0.67 0.00 0.67109.82 0.68 0.00 0.68109.84 0.69 0.00 0.69109.86 0.71 0.00 0.71109.88 0.72 0.00 0.72109.90 0.73 0.00 0.73109.92 0.74 0.00 0.74109.94 0.76 0.00 0.76109.96 0.77 0.00 0.77109.98 0.78 0.00 0.78110.00 0.79 0.00 0.79110.02 0.80 0.00 0.80110.04 0.81 0.00 0.81
Elevation(feet)
Discharge(cfs)
Discarded(cfs)
Primary(cfs)
110.06 0.82 0.00 0.82110.08 0.83 0.00 0.83110.10 0.85 0.00 0.85110.12 0.86 0.00 0.86110.14 0.87 0.00 0.87110.16 0.88 0.00 0.88110.18 0.89 0.00 0.89110.20 0.90 0.00 0.90110.22 0.91 0.00 0.91110.24 0.92 0.00 0.92110.26 0.93 0.00 0.93110.28 0.94 0.00 0.94110.30 0.95 0.00 0.95110.32 0.95 0.00 0.95110.34 0.96 0.00 0.96110.36 0.97 0.00 0.97110.38 0.98 0.00 0.98110.40 0.99 0.00 0.99110.42 1.00 0.00 1.00110.44 1.01 0.00 1.01110.46 1.02 0.00 1.02110.48 1.03 0.00 1.03110.50 1.04 0.00 1.04110.52 1.04 0.00 1.04110.54 1.05 0.00 1.05110.56 1.06 0.00 1.06110.58 1.07 0.00 1.07110.60 1.08 0.00 1.08110.62 1.09 0.00 1.09110.64 1.09 0.00 1.09110.66 1.10 0.00 1.10110.68 1.11 0.00 1.11110.70 1.12 0.00 1.12110.72 1.13 0.00 1.13110.74 1.13 0.00 1.13110.76 1.14 0.00 1.14110.78 1.15 0.00 1.15110.80 1.16 0.00 1.16110.82 1.17 0.00 1.17110.84 1.17 0.00 1.17110.86 1.18 0.00 1.18110.88 1.19 0.00 1.19110.90 1.20 0.00 1.20110.92 1.20 0.00 1.20110.94 1.21 0.00 1.21110.96 1.22 0.00 1.22110.98 1.23 0.00 1.23111.00 1.23 0.00 1.23111.02 1.24 0.00 1.24111.04 1.25 0.00 1.25111.06 1.25 0.00 1.25111.08 1.26 0.00 1.26111.10 1.27 0.00 1.27
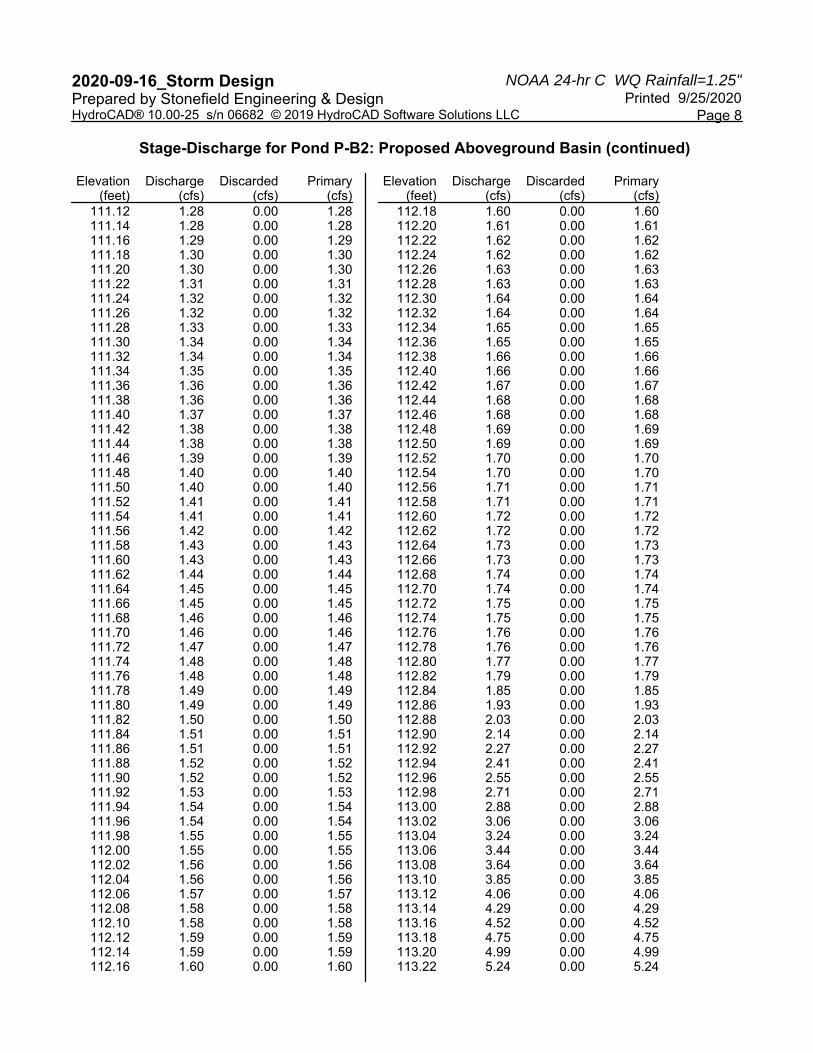
NOAA 24-hr C WQ Rainfall=1.25"2020-09-16_Storm Design Printed 9/25/2020Prepared by Stonefield Engineering & Design
Page 8HydroCAD® 10.00-25 s/n 06682 © 2019 HydroCAD Software Solutions LLC
Stage-Discharge for Pond P-B2: Proposed Aboveground Basin (continued)
Elevation(feet)
Discharge(cfs)
Discarded(cfs)
Primary(cfs)
111.12 1.28 0.00 1.28111.14 1.28 0.00 1.28111.16 1.29 0.00 1.29111.18 1.30 0.00 1.30111.20 1.30 0.00 1.30111.22 1.31 0.00 1.31111.24 1.32 0.00 1.32111.26 1.32 0.00 1.32111.28 1.33 0.00 1.33111.30 1.34 0.00 1.34111.32 1.34 0.00 1.34111.34 1.35 0.00 1.35111.36 1.36 0.00 1.36111.38 1.36 0.00 1.36111.40 1.37 0.00 1.37111.42 1.38 0.00 1.38111.44 1.38 0.00 1.38111.46 1.39 0.00 1.39111.48 1.40 0.00 1.40111.50 1.40 0.00 1.40111.52 1.41 0.00 1.41111.54 1.41 0.00 1.41111.56 1.42 0.00 1.42111.58 1.43 0.00 1.43111.60 1.43 0.00 1.43111.62 1.44 0.00 1.44111.64 1.45 0.00 1.45111.66 1.45 0.00 1.45111.68 1.46 0.00 1.46111.70 1.46 0.00 1.46111.72 1.47 0.00 1.47111.74 1.48 0.00 1.48111.76 1.48 0.00 1.48111.78 1.49 0.00 1.49111.80 1.49 0.00 1.49111.82 1.50 0.00 1.50111.84 1.51 0.00 1.51111.86 1.51 0.00 1.51111.88 1.52 0.00 1.52111.90 1.52 0.00 1.52111.92 1.53 0.00 1.53111.94 1.54 0.00 1.54111.96 1.54 0.00 1.54111.98 1.55 0.00 1.55112.00 1.55 0.00 1.55112.02 1.56 0.00 1.56112.04 1.56 0.00 1.56112.06 1.57 0.00 1.57112.08 1.58 0.00 1.58112.10 1.58 0.00 1.58112.12 1.59 0.00 1.59112.14 1.59 0.00 1.59112.16 1.60 0.00 1.60
Elevation(feet)
Discharge(cfs)
Discarded(cfs)
Primary(cfs)
112.18 1.60 0.00 1.60112.20 1.61 0.00 1.61112.22 1.62 0.00 1.62112.24 1.62 0.00 1.62112.26 1.63 0.00 1.63112.28 1.63 0.00 1.63112.30 1.64 0.00 1.64112.32 1.64 0.00 1.64112.34 1.65 0.00 1.65112.36 1.65 0.00 1.65112.38 1.66 0.00 1.66112.40 1.66 0.00 1.66112.42 1.67 0.00 1.67112.44 1.68 0.00 1.68112.46 1.68 0.00 1.68112.48 1.69 0.00 1.69112.50 1.69 0.00 1.69112.52 1.70 0.00 1.70112.54 1.70 0.00 1.70112.56 1.71 0.00 1.71112.58 1.71 0.00 1.71112.60 1.72 0.00 1.72112.62 1.72 0.00 1.72112.64 1.73 0.00 1.73112.66 1.73 0.00 1.73112.68 1.74 0.00 1.74112.70 1.74 0.00 1.74112.72 1.75 0.00 1.75112.74 1.75 0.00 1.75112.76 1.76 0.00 1.76112.78 1.76 0.00 1.76112.80 1.77 0.00 1.77112.82 1.79 0.00 1.79112.84 1.85 0.00 1.85112.86 1.93 0.00 1.93112.88 2.03 0.00 2.03112.90 2.14 0.00 2.14112.92 2.27 0.00 2.27112.94 2.41 0.00 2.41112.96 2.55 0.00 2.55112.98 2.71 0.00 2.71113.00 2.88 0.00 2.88113.02 3.06 0.00 3.06113.04 3.24 0.00 3.24113.06 3.44 0.00 3.44113.08 3.64 0.00 3.64113.10 3.85 0.00 3.85113.12 4.06 0.00 4.06113.14 4.29 0.00 4.29113.16 4.52 0.00 4.52113.18 4.75 0.00 4.75113.20 4.99 0.00 4.99113.22 5.24 0.00 5.24
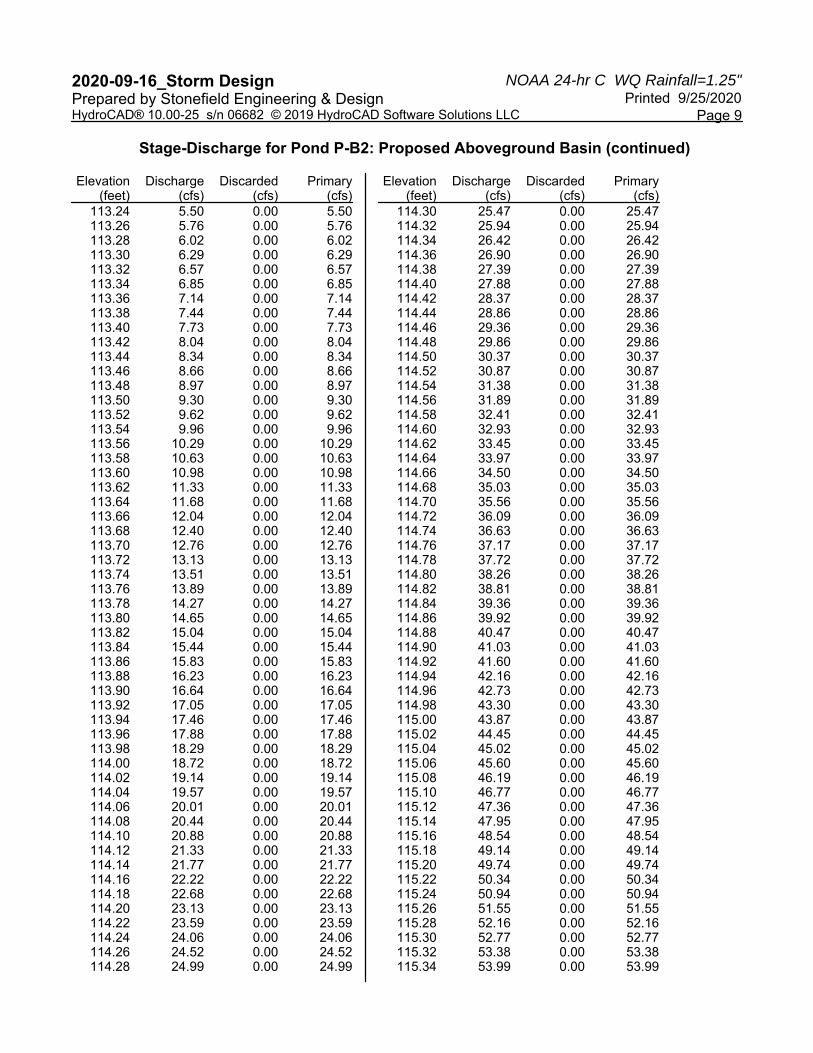
NOAA 24-hr C WQ Rainfall=1.25"2020-09-16_Storm Design Printed 9/25/2020Prepared by Stonefield Engineering & Design
Page 9HydroCAD® 10.00-25 s/n 06682 © 2019 HydroCAD Software Solutions LLC
Stage-Discharge for Pond P-B2: Proposed Aboveground Basin (continued)
Elevation(feet)
Discharge(cfs)
Discarded(cfs)
Primary(cfs)
113.24 5.50 0.00 5.50113.26 5.76 0.00 5.76113.28 6.02 0.00 6.02113.30 6.29 0.00 6.29113.32 6.57 0.00 6.57113.34 6.85 0.00 6.85113.36 7.14 0.00 7.14113.38 7.44 0.00 7.44113.40 7.73 0.00 7.73113.42 8.04 0.00 8.04113.44 8.34 0.00 8.34113.46 8.66 0.00 8.66113.48 8.97 0.00 8.97113.50 9.30 0.00 9.30113.52 9.62 0.00 9.62113.54 9.96 0.00 9.96113.56 10.29 0.00 10.29113.58 10.63 0.00 10.63113.60 10.98 0.00 10.98113.62 11.33 0.00 11.33113.64 11.68 0.00 11.68113.66 12.04 0.00 12.04113.68 12.40 0.00 12.40113.70 12.76 0.00 12.76113.72 13.13 0.00 13.13113.74 13.51 0.00 13.51113.76 13.89 0.00 13.89113.78 14.27 0.00 14.27113.80 14.65 0.00 14.65113.82 15.04 0.00 15.04113.84 15.44 0.00 15.44113.86 15.83 0.00 15.83113.88 16.23 0.00 16.23113.90 16.64 0.00 16.64113.92 17.05 0.00 17.05113.94 17.46 0.00 17.46113.96 17.88 0.00 17.88113.98 18.29 0.00 18.29114.00 18.72 0.00 18.72114.02 19.14 0.00 19.14114.04 19.57 0.00 19.57114.06 20.01 0.00 20.01114.08 20.44 0.00 20.44114.10 20.88 0.00 20.88114.12 21.33 0.00 21.33114.14 21.77 0.00 21.77114.16 22.22 0.00 22.22114.18 22.68 0.00 22.68114.20 23.13 0.00 23.13114.22 23.59 0.00 23.59114.24 24.06 0.00 24.06114.26 24.52 0.00 24.52114.28 24.99 0.00 24.99
Elevation(feet)
Discharge(cfs)
Discarded(cfs)
Primary(cfs)
114.30 25.47 0.00 25.47114.32 25.94 0.00 25.94114.34 26.42 0.00 26.42114.36 26.90 0.00 26.90114.38 27.39 0.00 27.39114.40 27.88 0.00 27.88114.42 28.37 0.00 28.37114.44 28.86 0.00 28.86114.46 29.36 0.00 29.36114.48 29.86 0.00 29.86114.50 30.37 0.00 30.37114.52 30.87 0.00 30.87114.54 31.38 0.00 31.38114.56 31.89 0.00 31.89114.58 32.41 0.00 32.41114.60 32.93 0.00 32.93114.62 33.45 0.00 33.45114.64 33.97 0.00 33.97114.66 34.50 0.00 34.50114.68 35.03 0.00 35.03114.70 35.56 0.00 35.56114.72 36.09 0.00 36.09114.74 36.63 0.00 36.63114.76 37.17 0.00 37.17114.78 37.72 0.00 37.72114.80 38.26 0.00 38.26114.82 38.81 0.00 38.81114.84 39.36 0.00 39.36114.86 39.92 0.00 39.92114.88 40.47 0.00 40.47114.90 41.03 0.00 41.03114.92 41.60 0.00 41.60114.94 42.16 0.00 42.16114.96 42.73 0.00 42.73114.98 43.30 0.00 43.30115.00 43.87 0.00 43.87115.02 44.45 0.00 44.45115.04 45.02 0.00 45.02115.06 45.60 0.00 45.60115.08 46.19 0.00 46.19115.10 46.77 0.00 46.77115.12 47.36 0.00 47.36115.14 47.95 0.00 47.95115.16 48.54 0.00 48.54115.18 49.14 0.00 49.14115.20 49.74 0.00 49.74115.22 50.34 0.00 50.34115.24 50.94 0.00 50.94115.26 51.55 0.00 51.55115.28 52.16 0.00 52.16115.30 52.77 0.00 52.77115.32 53.38 0.00 53.38115.34 53.99 0.00 53.99
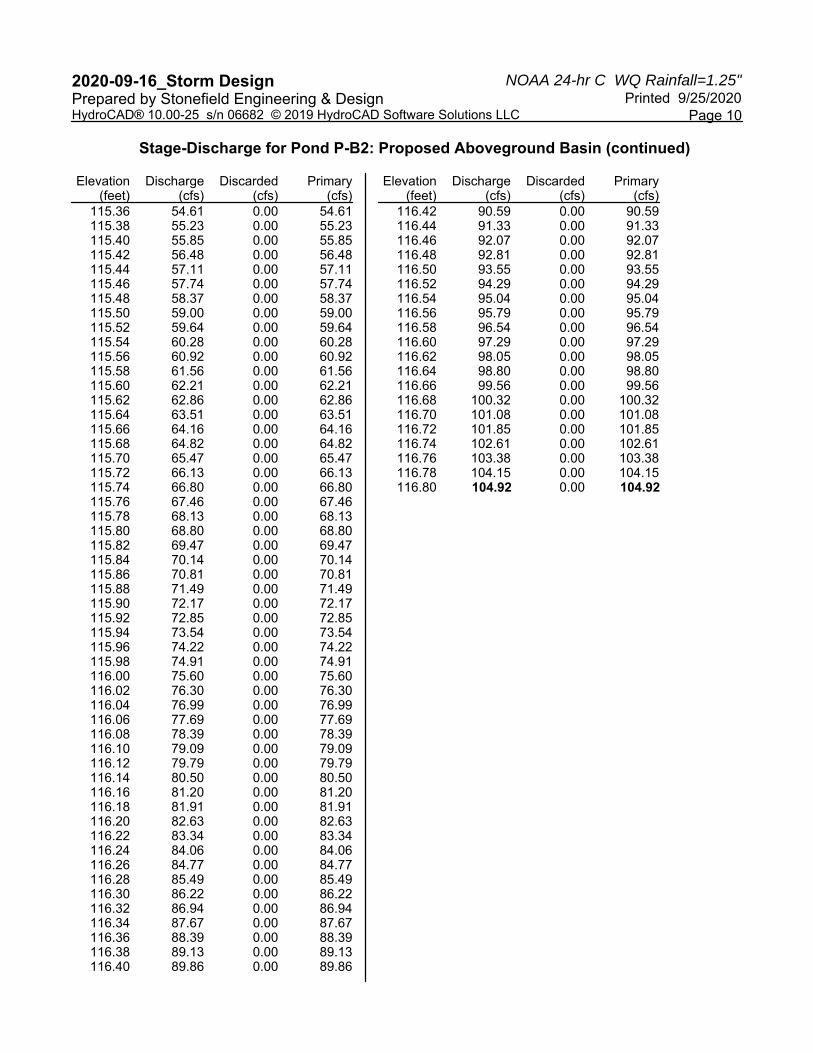
NOAA 24-hr C WQ Rainfall=1.25"2020-09-16_Storm Design Printed 9/25/2020Prepared by Stonefield Engineering & Design
Page 10HydroCAD® 10.00-25 s/n 06682 © 2019 HydroCAD Software Solutions LLC
Stage-Discharge for Pond P-B2: Proposed Aboveground Basin (continued)
Elevation(feet)
Discharge(cfs)
Discarded(cfs)
Primary(cfs)
115.36 54.61 0.00 54.61115.38 55.23 0.00 55.23115.40 55.85 0.00 55.85115.42 56.48 0.00 56.48115.44 57.11 0.00 57.11115.46 57.74 0.00 57.74115.48 58.37 0.00 58.37115.50 59.00 0.00 59.00115.52 59.64 0.00 59.64115.54 60.28 0.00 60.28115.56 60.92 0.00 60.92115.58 61.56 0.00 61.56115.60 62.21 0.00 62.21115.62 62.86 0.00 62.86115.64 63.51 0.00 63.51115.66 64.16 0.00 64.16115.68 64.82 0.00 64.82115.70 65.47 0.00 65.47115.72 66.13 0.00 66.13115.74 66.80 0.00 66.80115.76 67.46 0.00 67.46115.78 68.13 0.00 68.13115.80 68.80 0.00 68.80115.82 69.47 0.00 69.47115.84 70.14 0.00 70.14115.86 70.81 0.00 70.81115.88 71.49 0.00 71.49115.90 72.17 0.00 72.17115.92 72.85 0.00 72.85115.94 73.54 0.00 73.54115.96 74.22 0.00 74.22115.98 74.91 0.00 74.91116.00 75.60 0.00 75.60116.02 76.30 0.00 76.30116.04 76.99 0.00 76.99116.06 77.69 0.00 77.69116.08 78.39 0.00 78.39116.10 79.09 0.00 79.09116.12 79.79 0.00 79.79116.14 80.50 0.00 80.50116.16 81.20 0.00 81.20116.18 81.91 0.00 81.91116.20 82.63 0.00 82.63116.22 83.34 0.00 83.34116.24 84.06 0.00 84.06116.26 84.77 0.00 84.77116.28 85.49 0.00 85.49116.30 86.22 0.00 86.22116.32 86.94 0.00 86.94116.34 87.67 0.00 87.67116.36 88.39 0.00 88.39116.38 89.13 0.00 89.13116.40 89.86 0.00 89.86
Elevation(feet)
Discharge(cfs)
Discarded(cfs)
Primary(cfs)
116.42 90.59 0.00 90.59116.44 91.33 0.00 91.33116.46 92.07 0.00 92.07116.48 92.81 0.00 92.81116.50 93.55 0.00 93.55116.52 94.29 0.00 94.29116.54 95.04 0.00 95.04116.56 95.79 0.00 95.79116.58 96.54 0.00 96.54116.60 97.29 0.00 97.29116.62 98.05 0.00 98.05116.64 98.80 0.00 98.80116.66 99.56 0.00 99.56116.68 100.32 0.00 100.32116.70 101.08 0.00 101.08116.72 101.85 0.00 101.85116.74 102.61 0.00 102.61116.76 103.38 0.00 103.38116.78 104.15 0.00 104.15116.80 104.92 0.00 104.92
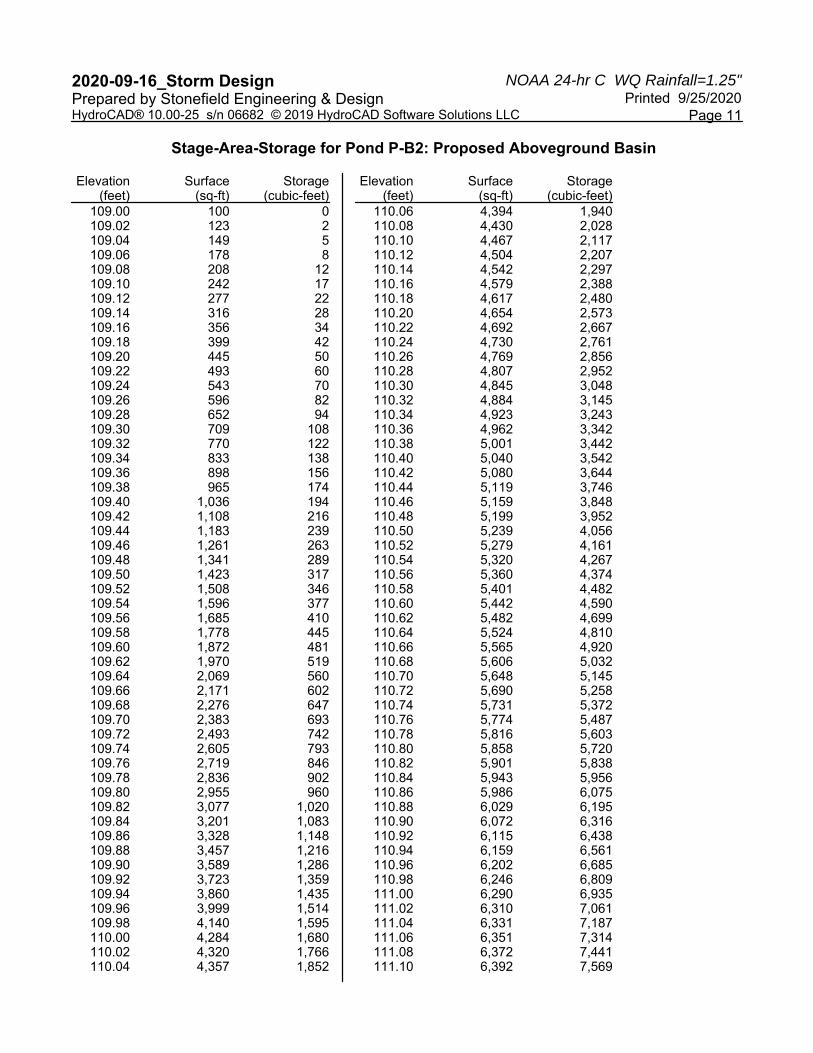
NOAA 24-hr C WQ Rainfall=1.25"2020-09-16_Storm Design Printed 9/25/2020Prepared by Stonefield Engineering & Design
Page 11HydroCAD® 10.00-25 s/n 06682 © 2019 HydroCAD Software Solutions LLC
Stage-Area-Storage for Pond P-B2: Proposed Aboveground Basin
Elevation(feet)
Surface(sq-ft)
Storage(cubic-feet)
109.00 100 0109.02 123 2109.04 149 5109.06 178 8109.08 208 12109.10 242 17109.12 277 22109.14 316 28109.16 356 34109.18 399 42109.20 445 50109.22 493 60109.24 543 70109.26 596 82109.28 652 94109.30 709 108109.32 770 122109.34 833 138109.36 898 156109.38 965 174109.40 1,036 194109.42 1,108 216109.44 1,183 239109.46 1,261 263109.48 1,341 289109.50 1,423 317109.52 1,508 346109.54 1,596 377109.56 1,685 410109.58 1,778 445109.60 1,872 481109.62 1,970 519109.64 2,069 560109.66 2,171 602109.68 2,276 647109.70 2,383 693109.72 2,493 742109.74 2,605 793109.76 2,719 846109.78 2,836 902109.80 2,955 960109.82 3,077 1,020109.84 3,201 1,083109.86 3,328 1,148109.88 3,457 1,216109.90 3,589 1,286109.92 3,723 1,359109.94 3,860 1,435109.96 3,999 1,514109.98 4,140 1,595110.00 4,284 1,680110.02 4,320 1,766110.04 4,357 1,852
Elevation(feet)
Surface(sq-ft)
Storage(cubic-feet)
110.06 4,394 1,940110.08 4,430 2,028110.10 4,467 2,117110.12 4,504 2,207110.14 4,542 2,297110.16 4,579 2,388110.18 4,617 2,480110.20 4,654 2,573110.22 4,692 2,667110.24 4,730 2,761110.26 4,769 2,856110.28 4,807 2,952110.30 4,845 3,048110.32 4,884 3,145110.34 4,923 3,243110.36 4,962 3,342110.38 5,001 3,442110.40 5,040 3,542110.42 5,080 3,644110.44 5,119 3,746110.46 5,159 3,848110.48 5,199 3,952110.50 5,239 4,056110.52 5,279 4,161110.54 5,320 4,267110.56 5,360 4,374110.58 5,401 4,482110.60 5,442 4,590110.62 5,482 4,699110.64 5,524 4,810110.66 5,565 4,920110.68 5,606 5,032110.70 5,648 5,145110.72 5,690 5,258110.74 5,731 5,372110.76 5,774 5,487110.78 5,816 5,603110.80 5,858 5,720110.82 5,901 5,838110.84 5,943 5,956110.86 5,986 6,075110.88 6,029 6,195110.90 6,072 6,316110.92 6,115 6,438110.94 6,159 6,561110.96 6,202 6,685110.98 6,246 6,809111.00 6,290 6,935111.02 6,310 7,061111.04 6,331 7,187111.06 6,351 7,314111.08 6,372 7,441111.10 6,392 7,569
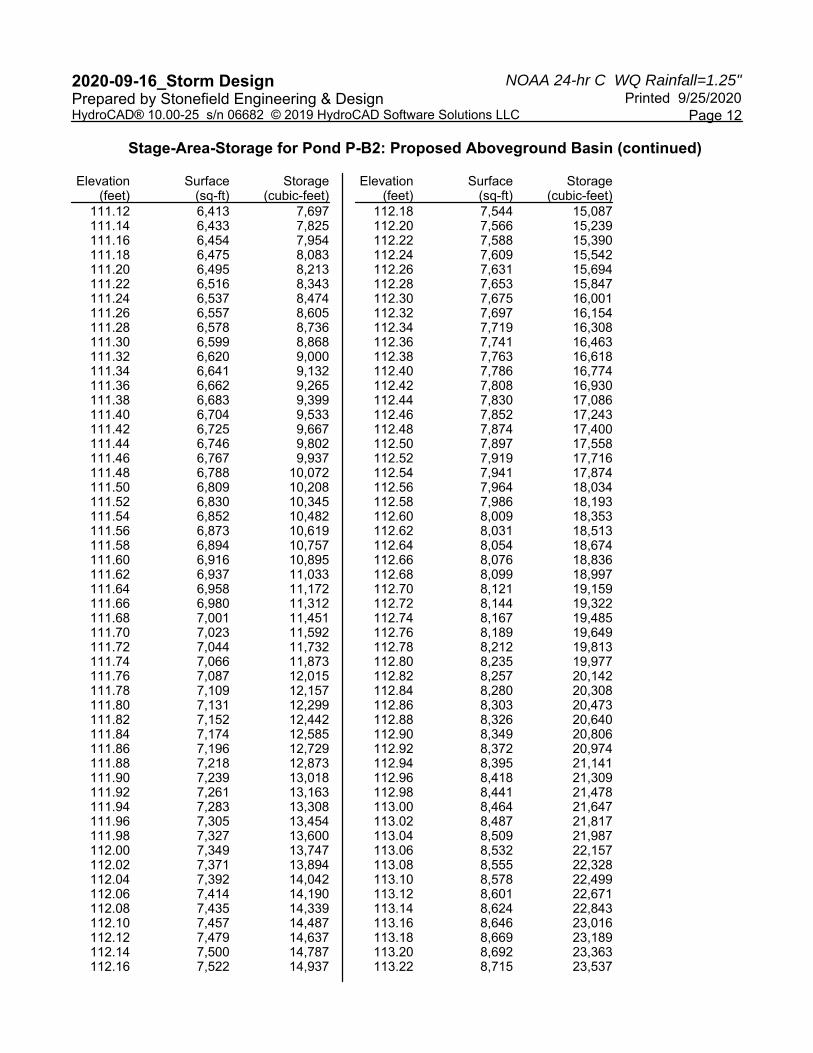
NOAA 24-hr C WQ Rainfall=1.25"2020-09-16_Storm Design Printed 9/25/2020Prepared by Stonefield Engineering & Design
Page 12HydroCAD® 10.00-25 s/n 06682 © 2019 HydroCAD Software Solutions LLC
Stage-Area-Storage for Pond P-B2: Proposed Aboveground Basin (continued)
Elevation(feet)
Surface(sq-ft)
Storage(cubic-feet)
111.12 6,413 7,697111.14 6,433 7,825111.16 6,454 7,954111.18 6,475 8,083111.20 6,495 8,213111.22 6,516 8,343111.24 6,537 8,474111.26 6,557 8,605111.28 6,578 8,736111.30 6,599 8,868111.32 6,620 9,000111.34 6,641 9,132111.36 6,662 9,265111.38 6,683 9,399111.40 6,704 9,533111.42 6,725 9,667111.44 6,746 9,802111.46 6,767 9,937111.48 6,788 10,072111.50 6,809 10,208111.52 6,830 10,345111.54 6,852 10,482111.56 6,873 10,619111.58 6,894 10,757111.60 6,916 10,895111.62 6,937 11,033111.64 6,958 11,172111.66 6,980 11,312111.68 7,001 11,451111.70 7,023 11,592111.72 7,044 11,732111.74 7,066 11,873111.76 7,087 12,015111.78 7,109 12,157111.80 7,131 12,299111.82 7,152 12,442111.84 7,174 12,585111.86 7,196 12,729111.88 7,218 12,873111.90 7,239 13,018111.92 7,261 13,163111.94 7,283 13,308111.96 7,305 13,454111.98 7,327 13,600112.00 7,349 13,747112.02 7,371 13,894112.04 7,392 14,042112.06 7,414 14,190112.08 7,435 14,339112.10 7,457 14,487112.12 7,479 14,637112.14 7,500 14,787112.16 7,522 14,937
Elevation(feet)
Surface(sq-ft)
Storage(cubic-feet)
112.18 7,544 15,087112.20 7,566 15,239112.22 7,588 15,390112.24 7,609 15,542112.26 7,631 15,694112.28 7,653 15,847112.30 7,675 16,001112.32 7,697 16,154112.34 7,719 16,308112.36 7,741 16,463112.38 7,763 16,618112.40 7,786 16,774112.42 7,808 16,930112.44 7,830 17,086112.46 7,852 17,243112.48 7,874 17,400112.50 7,897 17,558112.52 7,919 17,716112.54 7,941 17,874112.56 7,964 18,034112.58 7,986 18,193112.60 8,009 18,353112.62 8,031 18,513112.64 8,054 18,674112.66 8,076 18,836112.68 8,099 18,997112.70 8,121 19,159112.72 8,144 19,322112.74 8,167 19,485112.76 8,189 19,649112.78 8,212 19,813112.80 8,235 19,977112.82 8,257 20,142112.84 8,280 20,308112.86 8,303 20,473112.88 8,326 20,640112.90 8,349 20,806112.92 8,372 20,974112.94 8,395 21,141112.96 8,418 21,309112.98 8,441 21,478113.00 8,464 21,647113.02 8,487 21,817113.04 8,509 21,987113.06 8,532 22,157113.08 8,555 22,328113.10 8,578 22,499113.12 8,601 22,671113.14 8,624 22,843113.16 8,646 23,016113.18 8,669 23,189113.20 8,692 23,363113.22 8,715 23,537
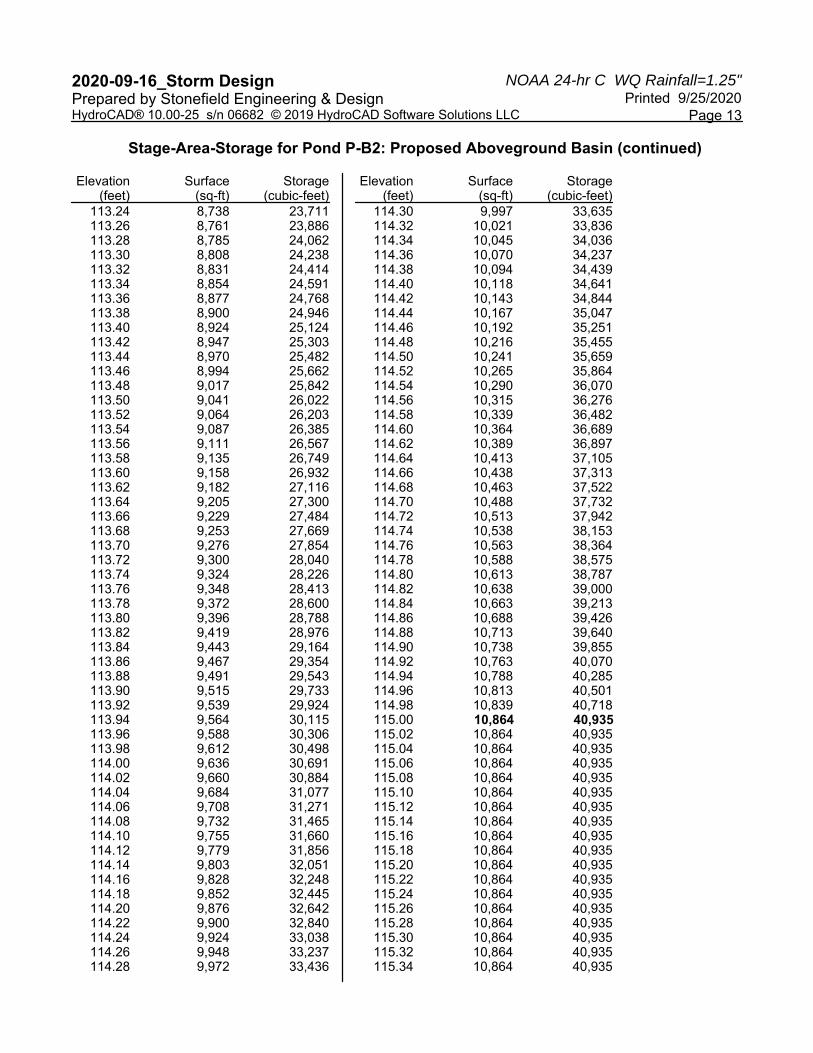
NOAA 24-hr C WQ Rainfall=1.25"2020-09-16_Storm Design Printed 9/25/2020Prepared by Stonefield Engineering & Design
Page 13HydroCAD® 10.00-25 s/n 06682 © 2019 HydroCAD Software Solutions LLC
Stage-Area-Storage for Pond P-B2: Proposed Aboveground Basin (continued)
Elevation(feet)
Surface(sq-ft)
Storage(cubic-feet)
113.24 8,738 23,711113.26 8,761 23,886113.28 8,785 24,062113.30 8,808 24,238113.32 8,831 24,414113.34 8,854 24,591113.36 8,877 24,768113.38 8,900 24,946113.40 8,924 25,124113.42 8,947 25,303113.44 8,970 25,482113.46 8,994 25,662113.48 9,017 25,842113.50 9,041 26,022113.52 9,064 26,203113.54 9,087 26,385113.56 9,111 26,567113.58 9,135 26,749113.60 9,158 26,932113.62 9,182 27,116113.64 9,205 27,300113.66 9,229 27,484113.68 9,253 27,669113.70 9,276 27,854113.72 9,300 28,040113.74 9,324 28,226113.76 9,348 28,413113.78 9,372 28,600113.80 9,396 28,788113.82 9,419 28,976113.84 9,443 29,164113.86 9,467 29,354113.88 9,491 29,543113.90 9,515 29,733113.92 9,539 29,924113.94 9,564 30,115113.96 9,588 30,306113.98 9,612 30,498114.00 9,636 30,691114.02 9,660 30,884114.04 9,684 31,077114.06 9,708 31,271114.08 9,732 31,465114.10 9,755 31,660114.12 9,779 31,856114.14 9,803 32,051114.16 9,828 32,248114.18 9,852 32,445114.20 9,876 32,642114.22 9,900 32,840114.24 9,924 33,038114.26 9,948 33,237114.28 9,972 33,436
Elevation(feet)
Surface(sq-ft)
Storage(cubic-feet)
114.30 9,997 33,635114.32 10,021 33,836114.34 10,045 34,036114.36 10,070 34,237114.38 10,094 34,439114.40 10,118 34,641114.42 10,143 34,844114.44 10,167 35,047114.46 10,192 35,251114.48 10,216 35,455114.50 10,241 35,659114.52 10,265 35,864114.54 10,290 36,070114.56 10,315 36,276114.58 10,339 36,482114.60 10,364 36,689114.62 10,389 36,897114.64 10,413 37,105114.66 10,438 37,313114.68 10,463 37,522114.70 10,488 37,732114.72 10,513 37,942114.74 10,538 38,153114.76 10,563 38,364114.78 10,588 38,575114.80 10,613 38,787114.82 10,638 39,000114.84 10,663 39,213114.86 10,688 39,426114.88 10,713 39,640114.90 10,738 39,855114.92 10,763 40,070114.94 10,788 40,285114.96 10,813 40,501114.98 10,839 40,718115.00 10,864 40,935115.02 10,864 40,935115.04 10,864 40,935115.06 10,864 40,935115.08 10,864 40,935115.10 10,864 40,935115.12 10,864 40,935115.14 10,864 40,935115.16 10,864 40,935115.18 10,864 40,935115.20 10,864 40,935115.22 10,864 40,935115.24 10,864 40,935115.26 10,864 40,935115.28 10,864 40,935115.30 10,864 40,935115.32 10,864 40,935115.34 10,864 40,935
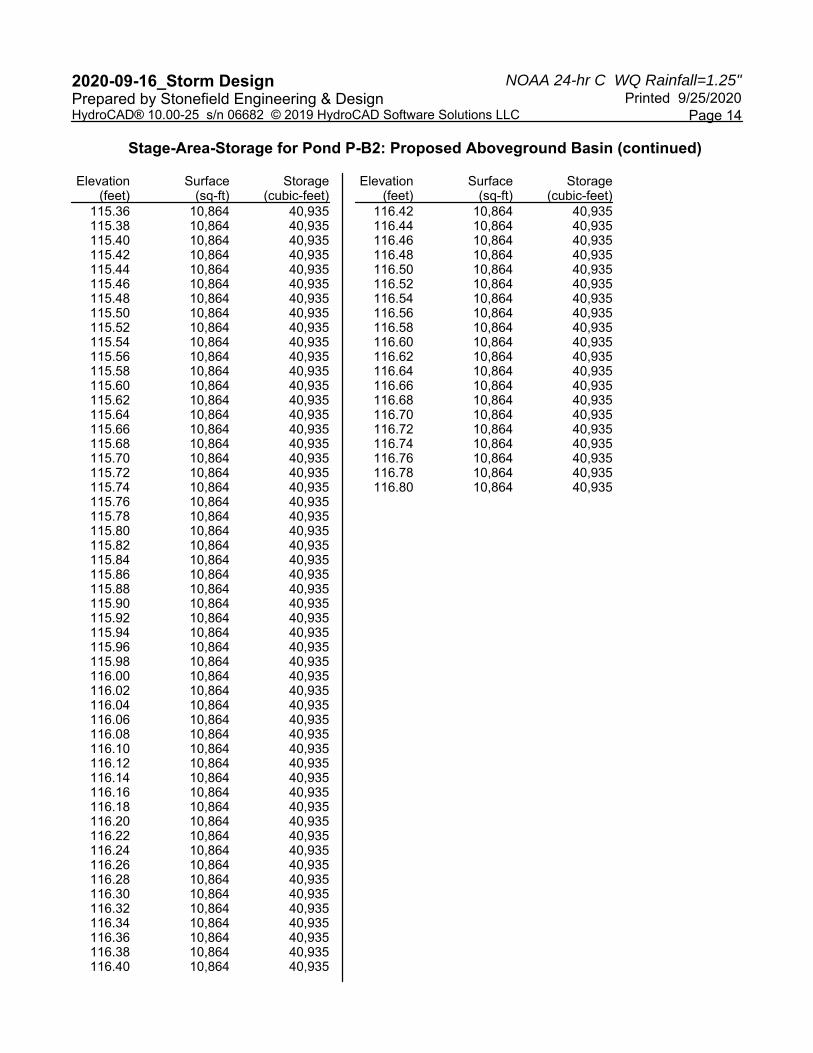
NOAA 24-hr C WQ Rainfall=1.25"2020-09-16_Storm Design Printed 9/25/2020Prepared by Stonefield Engineering & Design
Page 14HydroCAD® 10.00-25 s/n 06682 © 2019 HydroCAD Software Solutions LLC
Stage-Area-Storage for Pond P-B2: Proposed Aboveground Basin (continued)
Elevation(feet)
Surface(sq-ft)
Storage(cubic-feet)
115.36 10,864 40,935115.38 10,864 40,935115.40 10,864 40,935115.42 10,864 40,935115.44 10,864 40,935115.46 10,864 40,935115.48 10,864 40,935115.50 10,864 40,935115.52 10,864 40,935115.54 10,864 40,935115.56 10,864 40,935115.58 10,864 40,935115.60 10,864 40,935115.62 10,864 40,935115.64 10,864 40,935115.66 10,864 40,935115.68 10,864 40,935115.70 10,864 40,935115.72 10,864 40,935115.74 10,864 40,935115.76 10,864 40,935115.78 10,864 40,935115.80 10,864 40,935115.82 10,864 40,935115.84 10,864 40,935115.86 10,864 40,935115.88 10,864 40,935115.90 10,864 40,935115.92 10,864 40,935115.94 10,864 40,935115.96 10,864 40,935115.98 10,864 40,935116.00 10,864 40,935116.02 10,864 40,935116.04 10,864 40,935116.06 10,864 40,935116.08 10,864 40,935116.10 10,864 40,935116.12 10,864 40,935116.14 10,864 40,935116.16 10,864 40,935116.18 10,864 40,935116.20 10,864 40,935116.22 10,864 40,935116.24 10,864 40,935116.26 10,864 40,935116.28 10,864 40,935116.30 10,864 40,935116.32 10,864 40,935116.34 10,864 40,935116.36 10,864 40,935116.38 10,864 40,935116.40 10,864 40,935
Elevation(feet)
Surface(sq-ft)
Storage(cubic-feet)
116.42 10,864 40,935116.44 10,864 40,935116.46 10,864 40,935116.48 10,864 40,935116.50 10,864 40,935116.52 10,864 40,935116.54 10,864 40,935116.56 10,864 40,935116.58 10,864 40,935116.60 10,864 40,935116.62 10,864 40,935116.64 10,864 40,935116.66 10,864 40,935116.68 10,864 40,935116.70 10,864 40,935116.72 10,864 40,935116.74 10,864 40,935116.76 10,864 40,935116.78 10,864 40,935116.80 10,864 40,935
APPENDIX C-6
WATER QUALITY STORM EVENT
HYDROGRAPH
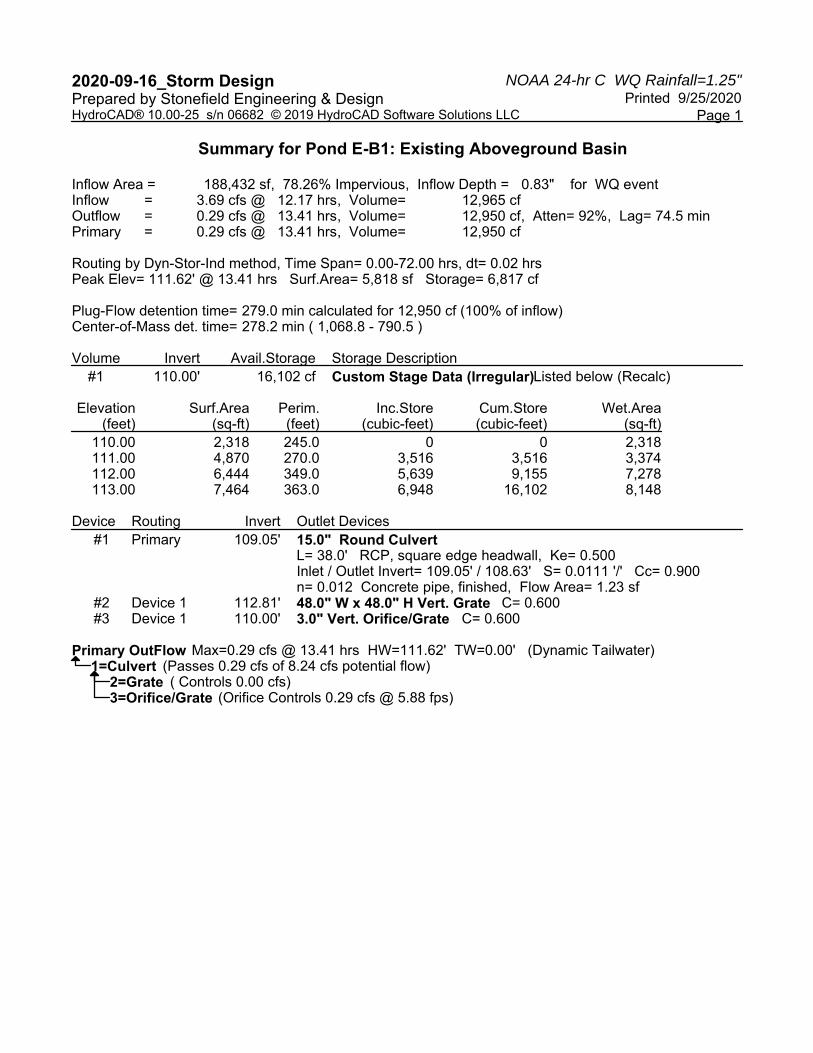
NOAA 24-hr C WQ Rainfall=1.25"2020-09-16_Storm Design Printed 9/25/2020Prepared by Stonefield Engineering & Design
Page 1HydroCAD® 10.00-25 s/n 06682 © 2019 HydroCAD Software Solutions LLC
Summary for Pond E-B1: Existing Aboveground Basin
Inflow Area = 188,432 sf, 78.26% Impervious, Inflow Depth = 0.83" for WQ eventInflow = 3.69 cfs @ 12.17 hrs, Volume= 12,965 cfOutflow = 0.29 cfs @ 13.41 hrs, Volume= 12,950 cf, Atten= 92%, Lag= 74.5 minPrimary = 0.29 cfs @ 13.41 hrs, Volume= 12,950 cf
Routing by Dyn-Stor-Ind method, Time Span= 0.00-72.00 hrs, dt= 0.02 hrsPeak Elev= 111.62' @ 13.41 hrs Surf.Area= 5,818 sf Storage= 6,817 cf
Plug-Flow detention time= 279.0 min calculated for 12,950 cf (100% of inflow)Center-of-Mass det. time= 278.2 min ( 1,068.8 - 790.5 )
Volume Invert Avail.Storage Storage Description#1 110.00' 16,102 cf Custom Stage Data (Irregular) Listed below (Recalc)
Elevation Surf.Area Perim. Inc.Store Cum.Store Wet.Area(feet) (sq-ft) (feet) (cubic-feet) (cubic-feet) (sq-ft)
110.00 2,318 245.0 0 0 2,318111.00 4,870 270.0 3,516 3,516 3,374112.00 6,444 349.0 5,639 9,155 7,278113.00 7,464 363.0 6,948 16,102 8,148
Device Routing Invert Outlet Devices#1 Primary 109.05' 15.0" Round Culvert
L= 38.0' RCP, square edge headwall, Ke= 0.500 Inlet / Outlet Invert= 109.05' / 108.63' S= 0.0111 '/' Cc= 0.900 n= 0.012 Concrete pipe, finished, Flow Area= 1.23 sf
#2 Device 1 112.81' 48.0" W x 48.0" H Vert. Grate C= 0.600 #3 Device 1 110.00' 3.0" Vert. Orifice/Grate C= 0.600
Primary OutFlow Max=0.29 cfs @ 13.41 hrs HW=111.62' TW=0.00' (Dynamic Tailwater)1=Culvert (Passes 0.29 cfs of 8.24 cfs potential flow)
2=Grate ( Controls 0.00 cfs)3=Orifice/Grate (Orifice Controls 0.29 cfs @ 5.88 fps)
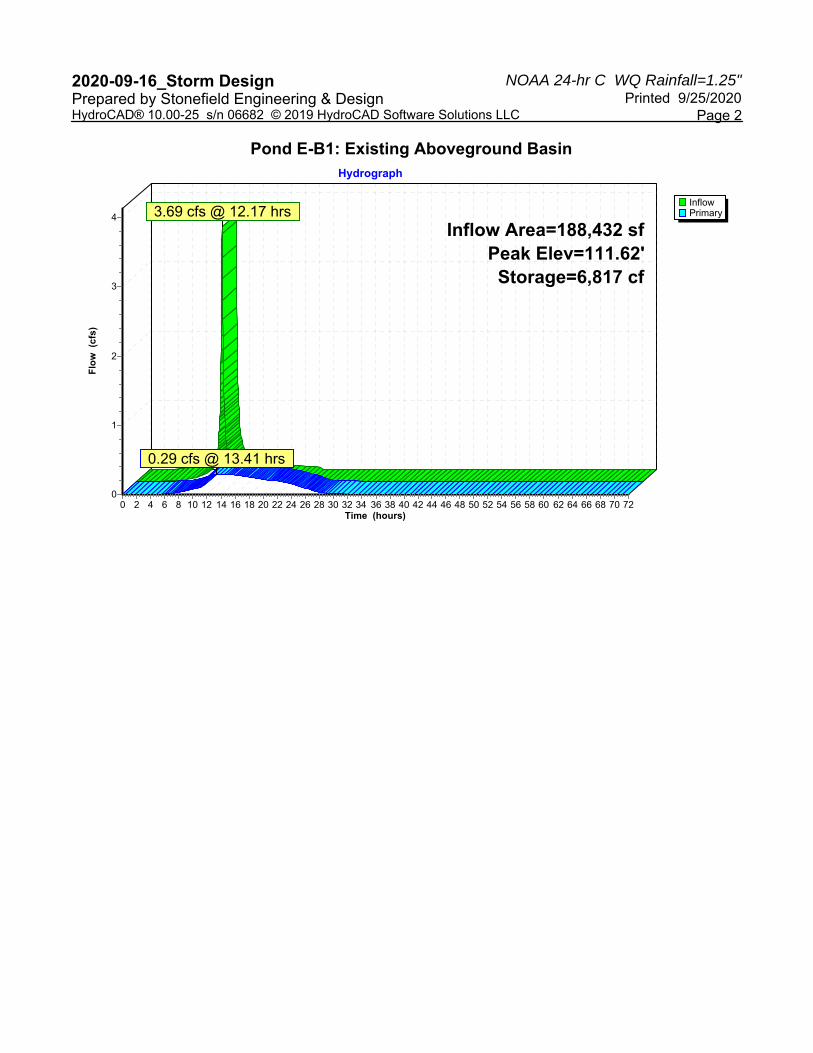
NOAA 24-hr C WQ Rainfall=1.25"2020-09-16_Storm Design Printed 9/25/2020Prepared by Stonefield Engineering & Design
Page 2HydroCAD® 10.00-25 s/n 06682 © 2019 HydroCAD Software Solutions LLC
Pond E-B1: Existing Aboveground Basin
InflowPrimary
Hydrograph
Time (hours)727068666462605856545250484644424038363432302826242220181614121086420
Flo
w (
cfs)
4
3
2
1
0
Inflow Area=188,432 sfPeak Elev=111.62'Storage=6,817 cf
3.69 cfs @ 12.17 hrs
0.29 cfs @ 13.41 hrs
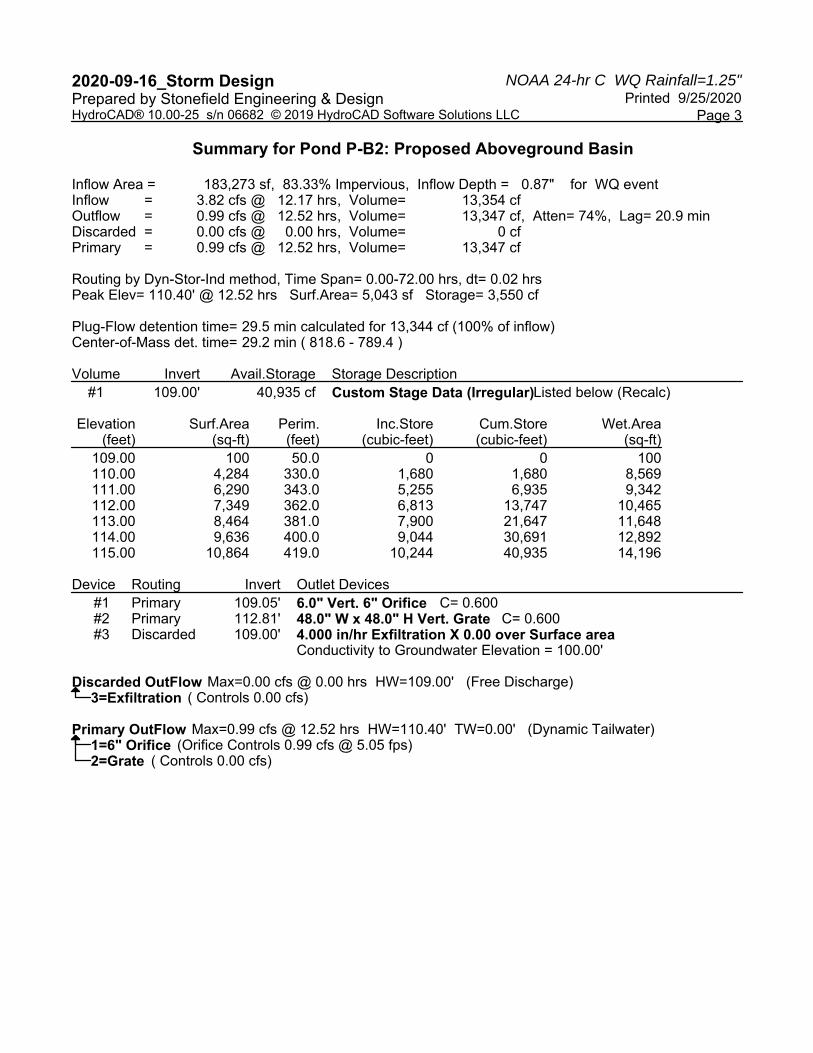
NOAA 24-hr C WQ Rainfall=1.25"2020-09-16_Storm Design Printed 9/25/2020Prepared by Stonefield Engineering & Design
Page 3HydroCAD® 10.00-25 s/n 06682 © 2019 HydroCAD Software Solutions LLC
Summary for Pond P-B2: Proposed Aboveground Basin
Inflow Area = 183,273 sf, 83.33% Impervious, Inflow Depth = 0.87" for WQ eventInflow = 3.82 cfs @ 12.17 hrs, Volume= 13,354 cfOutflow = 0.99 cfs @ 12.52 hrs, Volume= 13,347 cf, Atten= 74%, Lag= 20.9 minDiscarded = 0.00 cfs @ 0.00 hrs, Volume= 0 cfPrimary = 0.99 cfs @ 12.52 hrs, Volume= 13,347 cf
Routing by Dyn-Stor-Ind method, Time Span= 0.00-72.00 hrs, dt= 0.02 hrsPeak Elev= 110.40' @ 12.52 hrs Surf.Area= 5,043 sf Storage= 3,550 cf
Plug-Flow detention time= 29.5 min calculated for 13,344 cf (100% of inflow)Center-of-Mass det. time= 29.2 min ( 818.6 - 789.4 )
Volume Invert Avail.Storage Storage Description#1 109.00' 40,935 cf Custom Stage Data (Irregular) Listed below (Recalc)
Elevation Surf.Area Perim. Inc.Store Cum.Store Wet.Area(feet) (sq-ft) (feet) (cubic-feet) (cubic-feet) (sq-ft)
109.00 100 50.0 0 0 100110.00 4,284 330.0 1,680 1,680 8,569111.00 6,290 343.0 5,255 6,935 9,342112.00 7,349 362.0 6,813 13,747 10,465113.00 8,464 381.0 7,900 21,647 11,648114.00 9,636 400.0 9,044 30,691 12,892115.00 10,864 419.0 10,244 40,935 14,196
Device Routing Invert Outlet Devices#1 Primary 109.05' 6.0" Vert. 6" Orifice C= 0.600 #2 Primary 112.81' 48.0" W x 48.0" H Vert. Grate C= 0.600 #3 Discarded 109.00' 4.000 in/hr Exfiltration X 0.00 over Surface area
Conductivity to Groundwater Elevation = 100.00'
Discarded OutFlow Max=0.00 cfs @ 0.00 hrs HW=109.00' (Free Discharge)3=Exfiltration ( Controls 0.00 cfs)
Primary OutFlow Max=0.99 cfs @ 12.52 hrs HW=110.40' TW=0.00' (Dynamic Tailwater)1=6" Orifice (Orifice Controls 0.99 cfs @ 5.05 fps)2=Grate ( Controls 0.00 cfs)
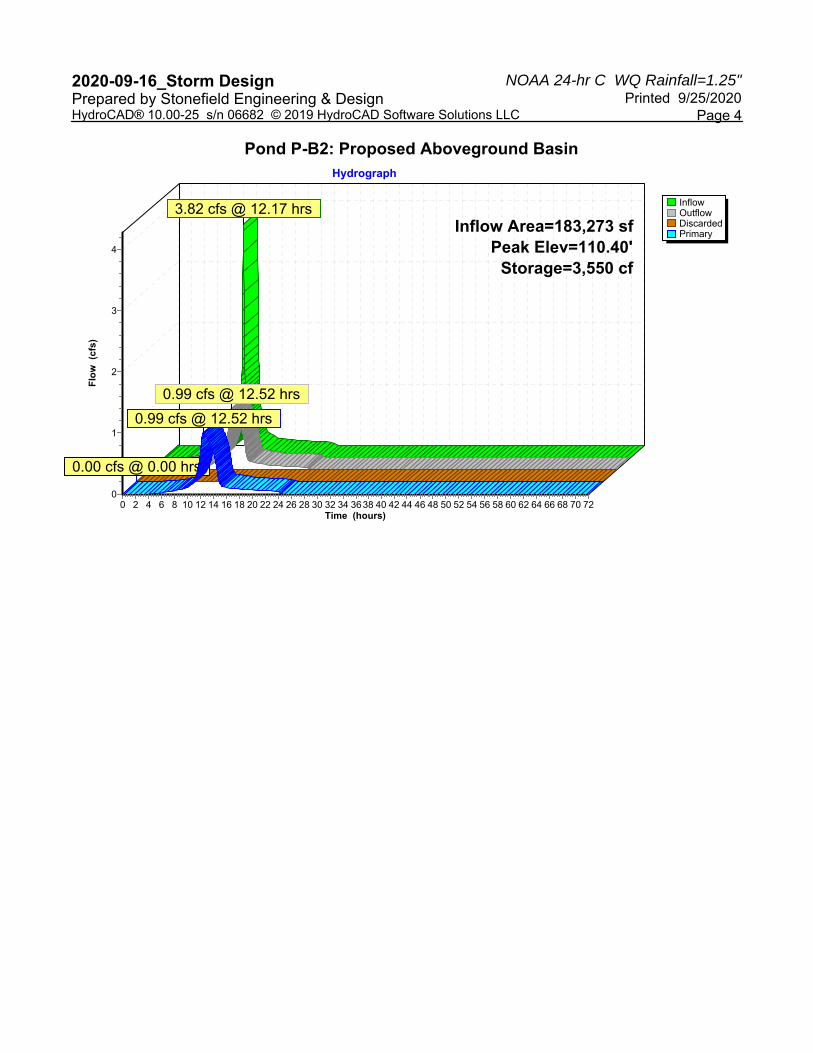
NOAA 24-hr C WQ Rainfall=1.25"2020-09-16_Storm Design Printed 9/25/2020Prepared by Stonefield Engineering & Design
Page 4HydroCAD® 10.00-25 s/n 06682 © 2019 HydroCAD Software Solutions LLC
Pond P-B2: Proposed Aboveground Basin
InflowOutflowDiscardedPrimary
Hydrograph
Time (hours)727068666462605856545250484644424038363432302826242220181614121086420
Flo
w (
cfs)
4
3
2
1
0
Inflow Area=183,273 sfPeak Elev=110.40'
Storage=3,550 cf
3.82 cfs @ 12.17 hrs
0.99 cfs @ 12.52 hrs
0.00 cfs @ 0.00 hrs
0.99 cfs @ 12.52 hrs
APPENDIX C-7
2-YEAR STORM EVENT HYDROGRAPHS
(INFILTRATION ON)

NOAA 24-hr C 2-YR Rainfall=3.32"2020-09-16_Storm Design Printed 9/25/2020Prepared by Stonefield Engineering & Design
Page 1HydroCAD® 10.00-25 s/n 06682 © 2019 HydroCAD Software Solutions LLC
Summary for Subcatchment E1-A: Existing Drainage to Veronica (TWP)
Runoff = 11.48 cfs @ 12.17 hrs, Volume= 41,750 cf, Depth= 2.66"
Runoff by SCS TR-20 method, UH=SCS, Split Pervious/Imperv., Time Span= 0.00-72.00 hrs, dt= 0.02 hrsNOAA 24-hr C 2-YR Rainfall=3.32"
Area (sf) CN Description* 147,459 98 Impervious
40,973 74 >75% Grass cover, Good, HSG C188,432 93 Weighted Average
40,973 74 21.74% Pervious Area147,459 98 78.26% Impervious Area
Tc Length Slope Velocity Capacity Description(min) (feet) (ft/ft) (ft/sec) (cfs)
1.4 109 0.0170 1.34 Sheet Flow, Segment A-BSmooth surfaces n= 0.011 P2= 3.32"
3.5 652 0.0030 3.12 3.83 Pipe Channel, Segment B-C15.0" Round Area= 1.2 sf Perim= 3.9' r= 0.31'n= 0.012 Concrete pipe, finished
4.9 761 Total, Increased to minimum Tc = 10.0 min
Subcatchment E1-A: Existing Drainage to Veronica (TWP)
Runoff
Hydrograph
Time (hours)727068666462605856545250484644424038363432302826242220181614121086420
Flo
w (
cfs)
12
11
10
9
8
7
6
5
4
3
2
1
0
NOAA 24-hr C2-YR Rainfall=3.32"
Runoff Area=188,432 sfRunoff Volume=41,750 cf
Runoff Depth=2.66"Flow Length=761'
Tc=10.0 minCN=74/98
11.48 cfs @ 12.17 hrs

NOAA 24-hr C 2-YR Rainfall=3.32"2020-09-16_Storm Design Printed 9/25/2020Prepared by Stonefield Engineering & Design
Page 2HydroCAD® 10.00-25 s/n 06682 © 2019 HydroCAD Software Solutions LLC
Summary for Subcatchment E1-B: Existing Drainage to Veronica (TWP)
Runoff = 0.24 cfs @ 12.18 hrs, Volume= 839 cf, Depth= 1.53"
Runoff by SCS TR-20 method, UH=SCS, Split Pervious/Imperv., Time Span= 0.00-72.00 hrs, dt= 0.02 hrsNOAA 24-hr C 2-YR Rainfall=3.32"
Area (sf) CN Description* 1,373 98 Impervious
5,214 74 >75% Grass cover, Good, HSG C6,587 79 Weighted Average5,214 74 79.16% Pervious Area1,373 98 20.84% Impervious Area
Tc Length Slope Velocity Capacity Description(min) (feet) (ft/ft) (ft/sec) (cfs)10.0 Direct Entry,
Subcatchment E1-B: Existing Drainage to Veronica (TWP)
Runoff
Hydrograph
Time (hours)727068666462605856545250484644424038363432302826242220181614121086420
Flo
w (
cfs)
0.26
0.24
0.22
0.2
0.18
0.16
0.14
0.12
0.1
0.08
0.06
0.04
0.02
0
NOAA 24-hr C2-YR Rainfall=3.32"
Runoff Area=6,587 sfRunoff Volume=839 cf
Runoff Depth=1.53"Tc=10.0 min
CN=74/98
0.24 cfs @ 12.18 hrs

NOAA 24-hr C 2-YR Rainfall=3.32"2020-09-16_Storm Design Printed 9/25/2020Prepared by Stonefield Engineering & Design
Page 3HydroCAD® 10.00-25 s/n 06682 © 2019 HydroCAD Software Solutions LLC
Summary for Subcatchment E1-C: Existing Drainage to Veronica (TWP)
Runoff = 0.27 cfs @ 12.18 hrs, Volume= 880 cf, Depth= 1.12"
Runoff by SCS TR-20 method, UH=SCS, Split Pervious/Imperv., Time Span= 0.00-72.00 hrs, dt= 0.02 hrsNOAA 24-hr C 2-YR Rainfall=3.32"
Area (sf) CN Description* 34 98 Impervious
9,358 74 >75% Grass cover, Good, HSG C9,392 74 Weighted Average9,358 74 99.64% Pervious Area
34 98 0.36% Impervious Area
Tc Length Slope Velocity Capacity Description(min) (feet) (ft/ft) (ft/sec) (cfs)10.0 Direct Entry,
Subcatchment E1-C: Existing Drainage to Veronica (TWP)
Runoff
Hydrograph
Time (hours)727068666462605856545250484644424038363432302826242220181614121086420
Flo
w (
cfs)
0.28
0.26
0.24
0.22
0.2
0.18
0.16
0.14
0.12
0.1
0.08
0.06
0.04
0.02
0
NOAA 24-hr C2-YR Rainfall=3.32"
Runoff Area=9,392 sfRunoff Volume=880 cf
Runoff Depth=1.12"Tc=10.0 min
CN=74/98
0.27 cfs @ 12.18 hrs
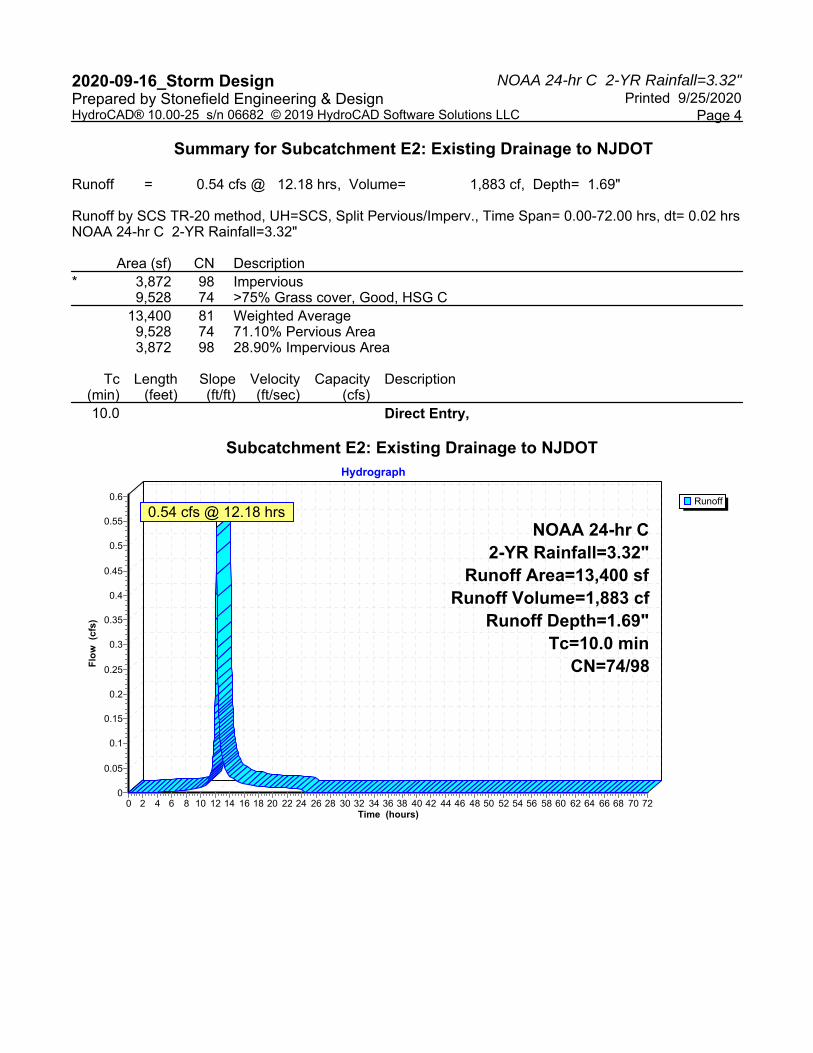
NOAA 24-hr C 2-YR Rainfall=3.32"2020-09-16_Storm Design Printed 9/25/2020Prepared by Stonefield Engineering & Design
Page 4HydroCAD® 10.00-25 s/n 06682 © 2019 HydroCAD Software Solutions LLC
Summary for Subcatchment E2: Existing Drainage to NJDOT
Runoff = 0.54 cfs @ 12.18 hrs, Volume= 1,883 cf, Depth= 1.69"
Runoff by SCS TR-20 method, UH=SCS, Split Pervious/Imperv., Time Span= 0.00-72.00 hrs, dt= 0.02 hrsNOAA 24-hr C 2-YR Rainfall=3.32"
Area (sf) CN Description* 3,872 98 Impervious
9,528 74 >75% Grass cover, Good, HSG C13,400 81 Weighted Average
9,528 74 71.10% Pervious Area3,872 98 28.90% Impervious Area
Tc Length Slope Velocity Capacity Description(min) (feet) (ft/ft) (ft/sec) (cfs)10.0 Direct Entry,
Subcatchment E2: Existing Drainage to NJDOT
Runoff
Hydrograph
Time (hours)727068666462605856545250484644424038363432302826242220181614121086420
Flo
w (
cfs)
0.6
0.55
0.5
0.45
0.4
0.35
0.3
0.25
0.2
0.15
0.1
0.05
0
NOAA 24-hr C2-YR Rainfall=3.32"
Runoff Area=13,400 sfRunoff Volume=1,883 cf
Runoff Depth=1.69"Tc=10.0 min
CN=74/98
0.54 cfs @ 12.18 hrs
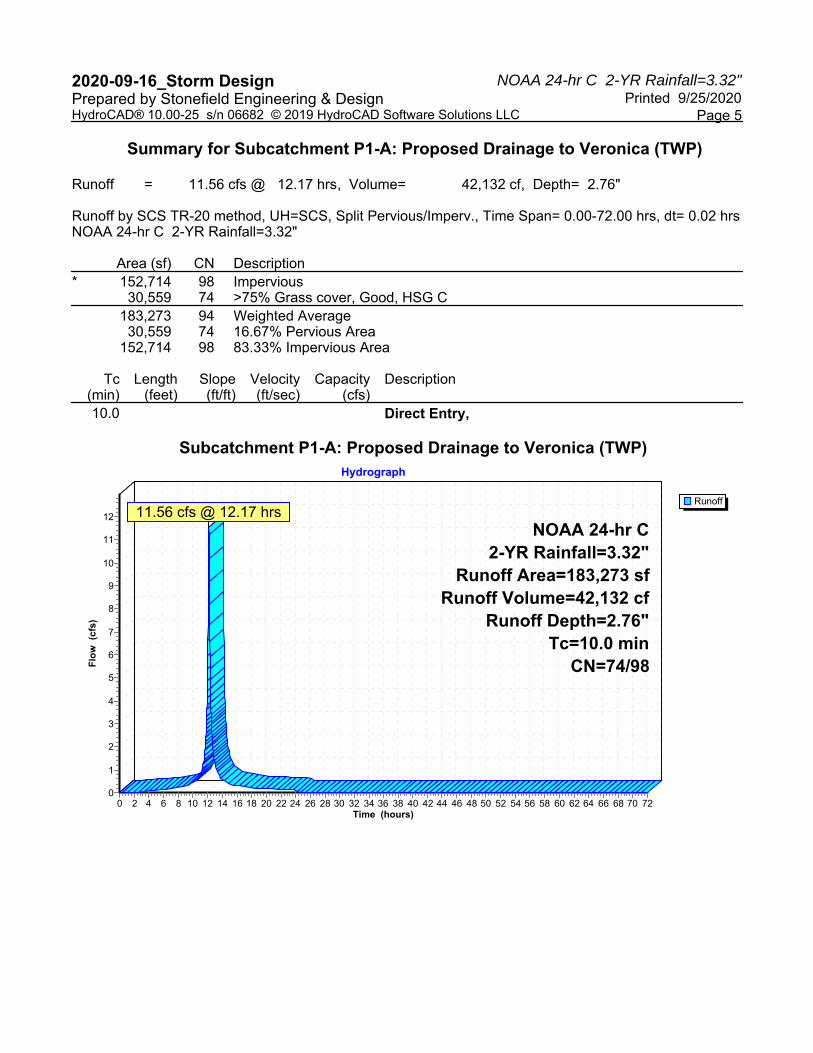
NOAA 24-hr C 2-YR Rainfall=3.32"2020-09-16_Storm Design Printed 9/25/2020Prepared by Stonefield Engineering & Design
Page 5HydroCAD® 10.00-25 s/n 06682 © 2019 HydroCAD Software Solutions LLC
Summary for Subcatchment P1-A: Proposed Drainage to Veronica (TWP)
Runoff = 11.56 cfs @ 12.17 hrs, Volume= 42,132 cf, Depth= 2.76"
Runoff by SCS TR-20 method, UH=SCS, Split Pervious/Imperv., Time Span= 0.00-72.00 hrs, dt= 0.02 hrsNOAA 24-hr C 2-YR Rainfall=3.32"
Area (sf) CN Description* 152,714 98 Impervious
30,559 74 >75% Grass cover, Good, HSG C183,273 94 Weighted Average
30,559 74 16.67% Pervious Area152,714 98 83.33% Impervious Area
Tc Length Slope Velocity Capacity Description(min) (feet) (ft/ft) (ft/sec) (cfs)10.0 Direct Entry,
Subcatchment P1-A: Proposed Drainage to Veronica (TWP)
Runoff
Hydrograph
Time (hours)727068666462605856545250484644424038363432302826242220181614121086420
Flo
w (
cfs)
12
11
10
9
8
7
6
5
4
3
2
1
0
NOAA 24-hr C2-YR Rainfall=3.32"
Runoff Area=183,273 sfRunoff Volume=42,132 cf
Runoff Depth=2.76"Tc=10.0 min
CN=74/98
11.56 cfs @ 12.17 hrs
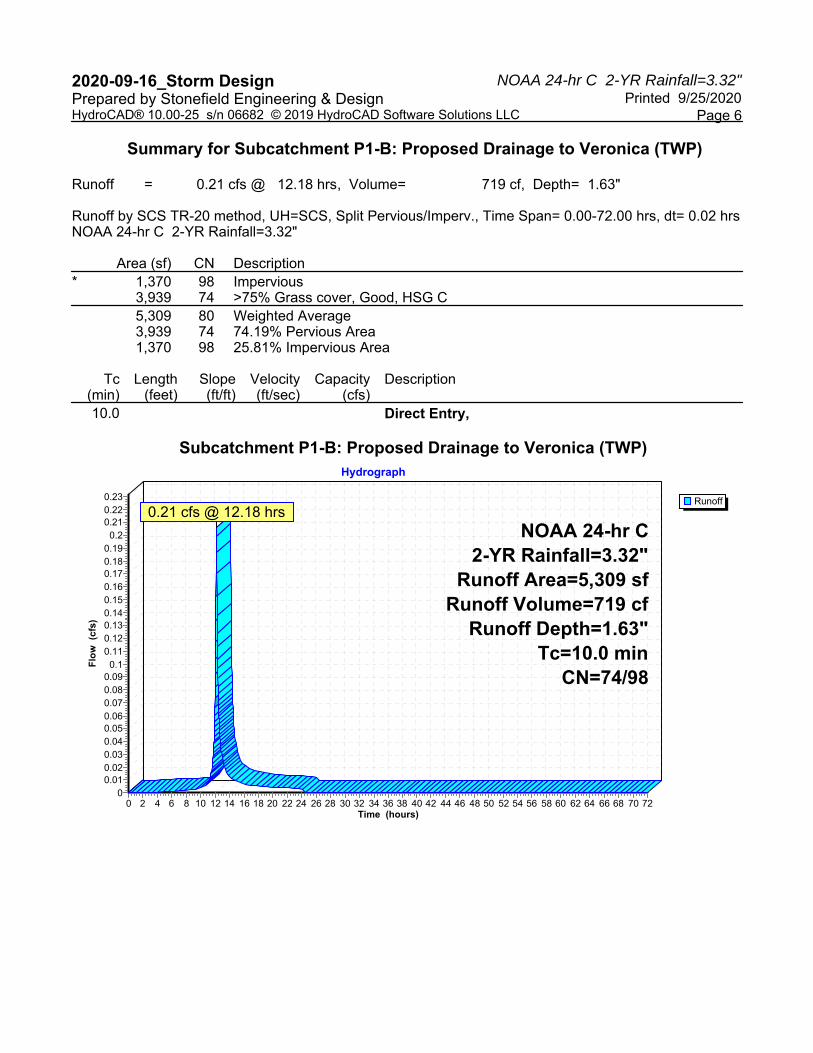
NOAA 24-hr C 2-YR Rainfall=3.32"2020-09-16_Storm Design Printed 9/25/2020Prepared by Stonefield Engineering & Design
Page 6HydroCAD® 10.00-25 s/n 06682 © 2019 HydroCAD Software Solutions LLC
Summary for Subcatchment P1-B: Proposed Drainage to Veronica (TWP)
Runoff = 0.21 cfs @ 12.18 hrs, Volume= 719 cf, Depth= 1.63"
Runoff by SCS TR-20 method, UH=SCS, Split Pervious/Imperv., Time Span= 0.00-72.00 hrs, dt= 0.02 hrsNOAA 24-hr C 2-YR Rainfall=3.32"
Area (sf) CN Description* 1,370 98 Impervious
3,939 74 >75% Grass cover, Good, HSG C5,309 80 Weighted Average3,939 74 74.19% Pervious Area1,370 98 25.81% Impervious Area
Tc Length Slope Velocity Capacity Description(min) (feet) (ft/ft) (ft/sec) (cfs)10.0 Direct Entry,
Subcatchment P1-B: Proposed Drainage to Veronica (TWP)
Runoff
Hydrograph
Time (hours)727068666462605856545250484644424038363432302826242220181614121086420
Flo
w (
cfs)
0.230.220.21
0.20.190.180.170.160.150.140.130.120.11
0.10.090.080.070.060.050.040.030.020.01
0
NOAA 24-hr C2-YR Rainfall=3.32"
Runoff Area=5,309 sfRunoff Volume=719 cf
Runoff Depth=1.63"Tc=10.0 min
CN=74/98
0.21 cfs @ 12.18 hrs
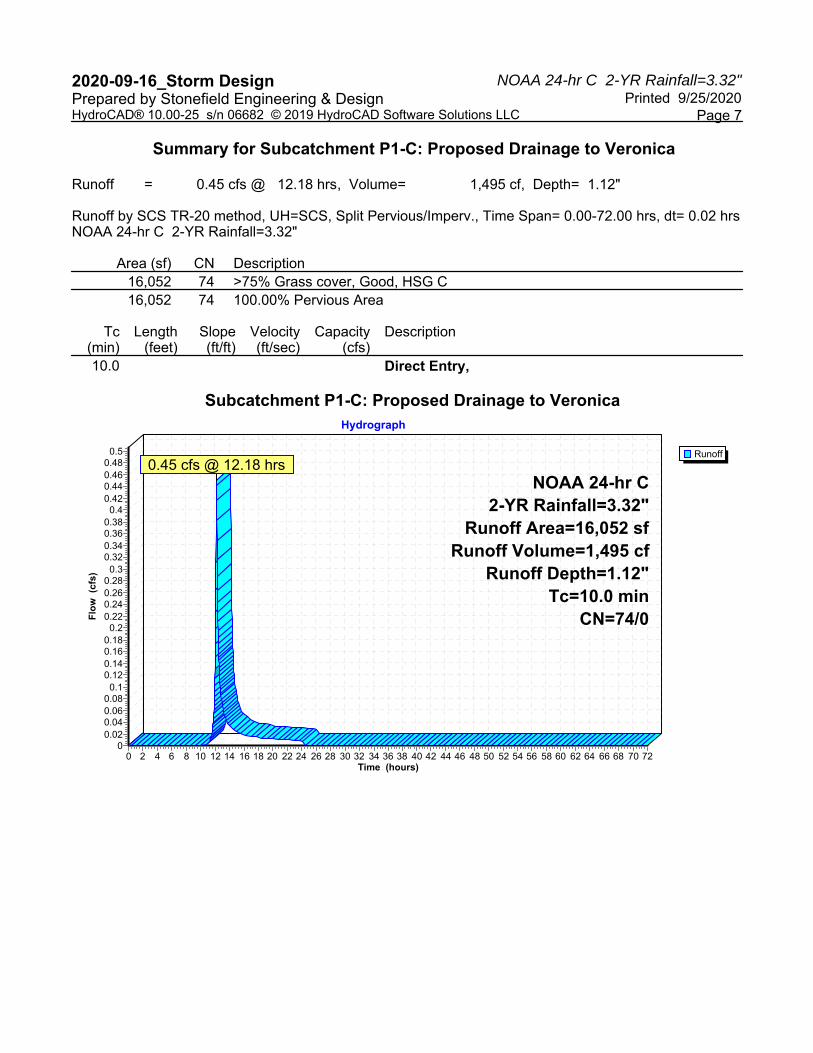
NOAA 24-hr C 2-YR Rainfall=3.32"2020-09-16_Storm Design Printed 9/25/2020Prepared by Stonefield Engineering & Design
Page 7HydroCAD® 10.00-25 s/n 06682 © 2019 HydroCAD Software Solutions LLC
Summary for Subcatchment P1-C: Proposed Drainage to Veronica
Runoff = 0.45 cfs @ 12.18 hrs, Volume= 1,495 cf, Depth= 1.12"
Runoff by SCS TR-20 method, UH=SCS, Split Pervious/Imperv., Time Span= 0.00-72.00 hrs, dt= 0.02 hrsNOAA 24-hr C 2-YR Rainfall=3.32"
Area (sf) CN Description16,052 74 >75% Grass cover, Good, HSG C16,052 74 100.00% Pervious Area
Tc Length Slope Velocity Capacity Description(min) (feet) (ft/ft) (ft/sec) (cfs)10.0 Direct Entry,
Subcatchment P1-C: Proposed Drainage to Veronica
Runoff
Hydrograph
Time (hours)727068666462605856545250484644424038363432302826242220181614121086420
Flo
w (
cfs)
0.50.480.460.440.42
0.40.380.360.340.32
0.30.280.260.240.22
0.20.180.160.140.12
0.10.080.060.040.02
0
NOAA 24-hr C2-YR Rainfall=3.32"
Runoff Area=16,052 sfRunoff Volume=1,495 cf
Runoff Depth=1.12"Tc=10.0 min
CN=74/0
0.45 cfs @ 12.18 hrs

NOAA 24-hr C 2-YR Rainfall=3.32"2020-09-16_Storm Design Printed 9/25/2020Prepared by Stonefield Engineering & Design
Page 8HydroCAD® 10.00-25 s/n 06682 © 2019 HydroCAD Software Solutions LLC
Summary for Subcatchment P2: Proposed Drainage to NJDOT
Runoff = 0.53 cfs @ 12.18 hrs, Volume= 1,851 cf, Depth= 1.69"
Runoff by SCS TR-20 method, UH=SCS, Split Pervious/Imperv., Time Span= 0.00-72.00 hrs, dt= 0.02 hrsNOAA 24-hr C 2-YR Rainfall=3.32"
Area (sf) CN Description* 3,800 98 Impervious
9,377 74 >75% Grass cover, Good, HSG C13,177 81 Weighted Average
9,377 74 71.16% Pervious Area3,800 98 28.84% Impervious Area
Tc Length Slope Velocity Capacity Description(min) (feet) (ft/ft) (ft/sec) (cfs)10.0 Direct Entry,
Subcatchment P2: Proposed Drainage to NJDOT
Runoff
Hydrograph
Time (hours)727068666462605856545250484644424038363432302826242220181614121086420
Flo
w (
cfs)
0.55
0.5
0.45
0.4
0.35
0.3
0.25
0.2
0.15
0.1
0.05
0
NOAA 24-hr C2-YR Rainfall=3.32"
Runoff Area=13,177 sfRunoff Volume=1,851 cf
Runoff Depth=1.69"Tc=10.0 min
CN=74/98
0.53 cfs @ 12.18 hrs

NOAA 24-hr C 2-YR Rainfall=3.32"2020-09-16_Storm Design Printed 9/25/2020Prepared by Stonefield Engineering & Design
Page 9HydroCAD® 10.00-25 s/n 06682 © 2019 HydroCAD Software Solutions LLC
Summary for Pond E-B1: Existing Aboveground Basin
Inflow Area = 188,432 sf, 78.26% Impervious, Inflow Depth = 2.66" for 2-YR eventInflow = 11.48 cfs @ 12.17 hrs, Volume= 41,750 cfOutflow = 16.24 cfs @ 12.24 hrs, Volume= 41,731 cf, Atten= 0%, Lag= 4.1 minPrimary = 16.24 cfs @ 12.24 hrs, Volume= 41,731 cf
Routing by Dyn-Stor-Ind method, Time Span= 0.00-72.00 hrs, dt= 0.02 hrsPeak Elev= 117.23' @ 12.24 hrs Surf.Area= 7,464 sf Storage= 16,102 cf
Plug-Flow detention time= 332.7 min calculated for 41,719 cf (100% of inflow)Center-of-Mass det. time= 333.0 min ( 1,103.2 - 770.2 )
Volume Invert Avail.Storage Storage Description#1 110.00' 16,102 cf Custom Stage Data (Irregular) Listed below (Recalc)
Elevation Surf.Area Perim. Inc.Store Cum.Store Wet.Area(feet) (sq-ft) (feet) (cubic-feet) (cubic-feet) (sq-ft)
110.00 2,318 245.0 0 0 2,318111.00 4,870 270.0 3,516 3,516 3,374112.00 6,444 349.0 5,639 9,155 7,278113.00 7,464 363.0 6,948 16,102 8,148
Device Routing Invert Outlet Devices#1 Primary 109.05' 15.0" Round Culvert
L= 38.0' RCP, square edge headwall, Ke= 0.500 Inlet / Outlet Invert= 109.05' / 108.63' S= 0.0111 '/' Cc= 0.900 n= 0.012 Concrete pipe, finished, Flow Area= 1.23 sf
#2 Device 1 112.81' 48.0" W x 48.0" H Vert. Grate C= 0.600 #3 Device 1 110.00' 3.0" Vert. Orifice/Grate C= 0.600
Primary OutFlow Max=16.24 cfs @ 12.24 hrs HW=117.23' TW=0.00' (Dynamic Tailwater)1=Culvert (Inlet Controls 16.24 cfs @ 13.23 fps)
2=Grate (Passes < 115.73 cfs potential flow)3=Orifice/Grate (Passes < 0.63 cfs potential flow)
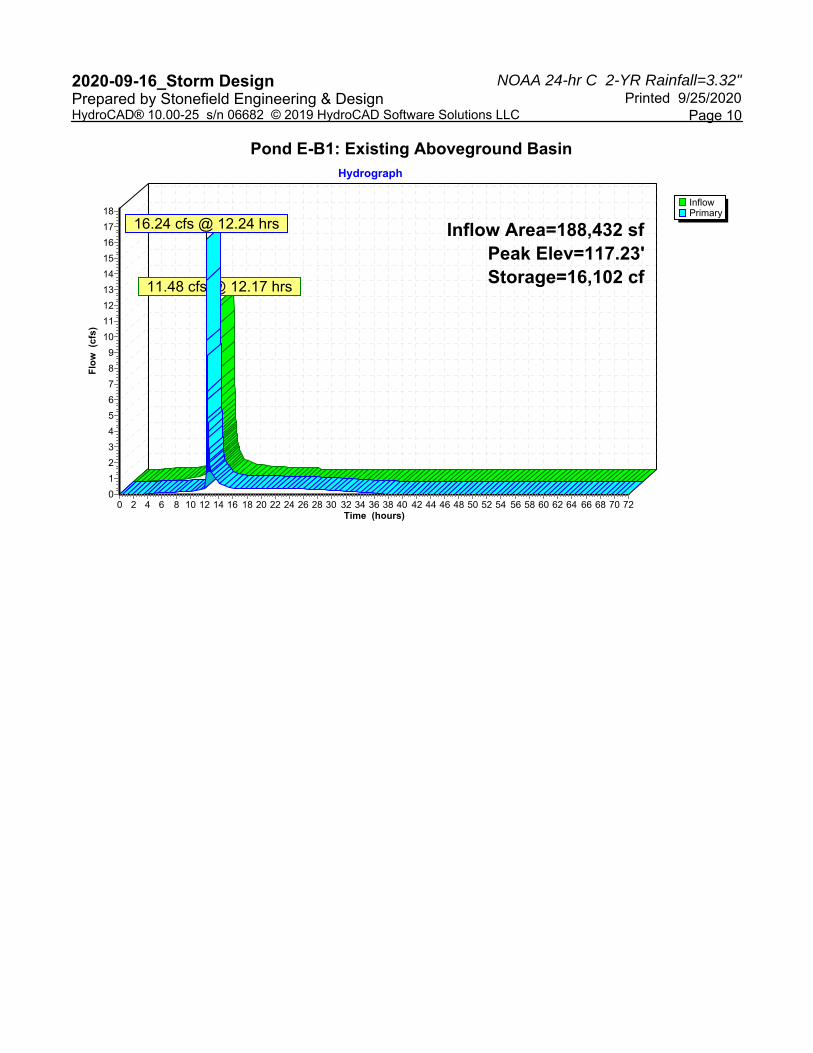
NOAA 24-hr C 2-YR Rainfall=3.32"2020-09-16_Storm Design Printed 9/25/2020Prepared by Stonefield Engineering & Design
Page 10HydroCAD® 10.00-25 s/n 06682 © 2019 HydroCAD Software Solutions LLC
Pond E-B1: Existing Aboveground Basin
InflowPrimary
Hydrograph
Time (hours)727068666462605856545250484644424038363432302826242220181614121086420
Flo
w (
cfs)
18
17
16
15
14
13
12
11
10
9
8
7
6
5
4
3
2
1
0
Inflow Area=188,432 sfPeak Elev=117.23'Storage=16,102 cf
11.48 cfs @ 12.17 hrs
16.24 cfs @ 12.24 hrs

NOAA 24-hr C 2-YR Rainfall=3.32"2020-09-16_Storm Design Printed 9/25/2020Prepared by Stonefield Engineering & Design
Page 11HydroCAD® 10.00-25 s/n 06682 © 2019 HydroCAD Software Solutions LLC
Summary for Pond P-B2: Proposed Aboveground Basin
Inflow Area = 183,273 sf, 83.33% Impervious, Inflow Depth = 2.76" for 2-YR eventInflow = 11.56 cfs @ 12.17 hrs, Volume= 42,132 cfOutflow = 2.31 cfs @ 12.63 hrs, Volume= 42,132 cf, Atten= 80%, Lag= 27.3 minDiscarded = 0.79 cfs @ 12.63 hrs, Volume= 13,609 cfPrimary = 1.52 cfs @ 12.63 hrs, Volume= 28,523 cf
Routing by Dyn-Stor-Ind method, Time Span= 0.00-72.00 hrs, dt= 0.02 hrsPeak Elev= 111.88' @ 12.63 hrs Surf.Area= 7,223 sf Storage= 12,906 cf
Plug-Flow detention time= 43.9 min calculated for 42,120 cf (100% of inflow)Center-of-Mass det. time= 43.9 min ( 811.6 - 767.7 )
Volume Invert Avail.Storage Storage Description#1 109.00' 40,935 cf Custom Stage Data (Irregular) Listed below (Recalc)
Elevation Surf.Area Perim. Inc.Store Cum.Store Wet.Area(feet) (sq-ft) (feet) (cubic-feet) (cubic-feet) (sq-ft)
109.00 100 50.0 0 0 100110.00 4,284 330.0 1,680 1,680 8,569111.00 6,290 343.0 5,255 6,935 9,342112.00 7,349 362.0 6,813 13,747 10,465113.00 8,464 381.0 7,900 21,647 11,648114.00 9,636 400.0 9,044 30,691 12,892115.00 10,864 419.0 10,244 40,935 14,196
Device Routing Invert Outlet Devices#1 Primary 109.05' 6.0" Vert. 6" Orifice C= 0.600 #2 Primary 112.81' 48.0" W x 48.0" H Vert. Grate C= 0.600 #3 Discarded 109.00' 4.000 in/hr Exfiltration over Surface area
Conductivity to Groundwater Elevation = 100.00'
Discarded OutFlow Max=0.79 cfs @ 12.63 hrs HW=111.88' (Free Discharge)3=Exfiltration ( Controls 0.79 cfs)
Primary OutFlow Max=1.52 cfs @ 12.63 hrs HW=111.88' TW=0.00' (Dynamic Tailwater)1=6" Orifice (Orifice Controls 1.52 cfs @ 7.74 fps)2=Grate ( Controls 0.00 cfs)
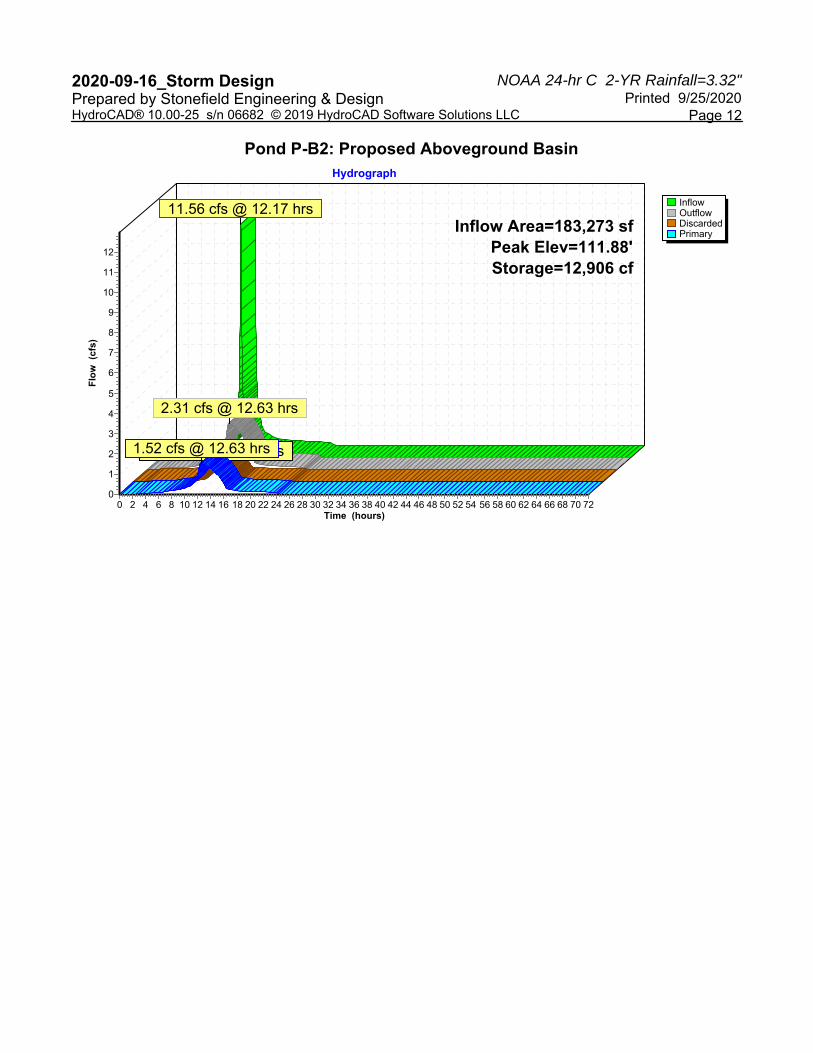
NOAA 24-hr C 2-YR Rainfall=3.32"2020-09-16_Storm Design Printed 9/25/2020Prepared by Stonefield Engineering & Design
Page 12HydroCAD® 10.00-25 s/n 06682 © 2019 HydroCAD Software Solutions LLC
Pond P-B2: Proposed Aboveground Basin
InflowOutflowDiscardedPrimary
Hydrograph
Time (hours)727068666462605856545250484644424038363432302826242220181614121086420
Flo
w (
cfs)
12
11
10
9
8
7
6
5
4
3
2
1
0
Inflow Area=183,273 sfPeak Elev=111.88'Storage=12,906 cf
11.56 cfs @ 12.17 hrs
2.31 cfs @ 12.63 hrs
0.79 cfs @ 12.63 hrs1.52 cfs @ 12.63 hrs

NOAA 24-hr C 2-YR Rainfall=3.32"2020-09-16_Storm Design Printed 9/25/2020Prepared by Stonefield Engineering & Design
Page 13HydroCAD® 10.00-25 s/n 06682 © 2019 HydroCAD Software Solutions LLC
Summary for Link E-POI1: Point of Interest 1
Inflow Area = 204,411 sf, 72.83% Impervious, Inflow Depth = 2.55" for 2-YR eventInflow = 16.67 cfs @ 12.24 hrs, Volume= 43,450 cfPrimary = 16.67 cfs @ 12.24 hrs, Volume= 43,450 cf, Atten= 0%, Lag= 0.0 min
Primary outflow = Inflow, Time Span= 0.00-72.00 hrs, dt= 0.02 hrs
Link E-POI1: Point of Interest 1
InflowPrimary
Hydrograph
Time (hours)727068666462605856545250484644424038363432302826242220181614121086420
Flo
w (
cfs)
18
17
16
15
14
13
12
11
10
9
8
7
6
5
4
3
2
1
0
Inflow Area=204,411 sf16.67 cfs @ 12.24 hrs
16.67 cfs @ 12.24 hrs

NOAA 24-hr C 2-YR Rainfall=3.32"2020-09-16_Storm Design Printed 9/25/2020Prepared by Stonefield Engineering & Design
Page 14HydroCAD® 10.00-25 s/n 06682 © 2019 HydroCAD Software Solutions LLC
Summary for Link E-POI2: Point of Interest 2
Inflow Area = 13,400 sf, 28.90% Impervious, Inflow Depth = 1.69" for 2-YR eventInflow = 0.54 cfs @ 12.18 hrs, Volume= 1,883 cfPrimary = 0.54 cfs @ 12.18 hrs, Volume= 1,883 cf, Atten= 0%, Lag= 0.0 min
Primary outflow = Inflow, Time Span= 0.00-72.00 hrs, dt= 0.02 hrs
Link E-POI2: Point of Interest 2
InflowPrimary
Hydrograph
Time (hours)727068666462605856545250484644424038363432302826242220181614121086420
Flo
w (
cfs)
0.6
0.55
0.5
0.45
0.4
0.35
0.3
0.25
0.2
0.15
0.1
0.05
0
Inflow Area=13,400 sf0.54 cfs @ 12.18 hrs
0.54 cfs @ 12.18 hrs
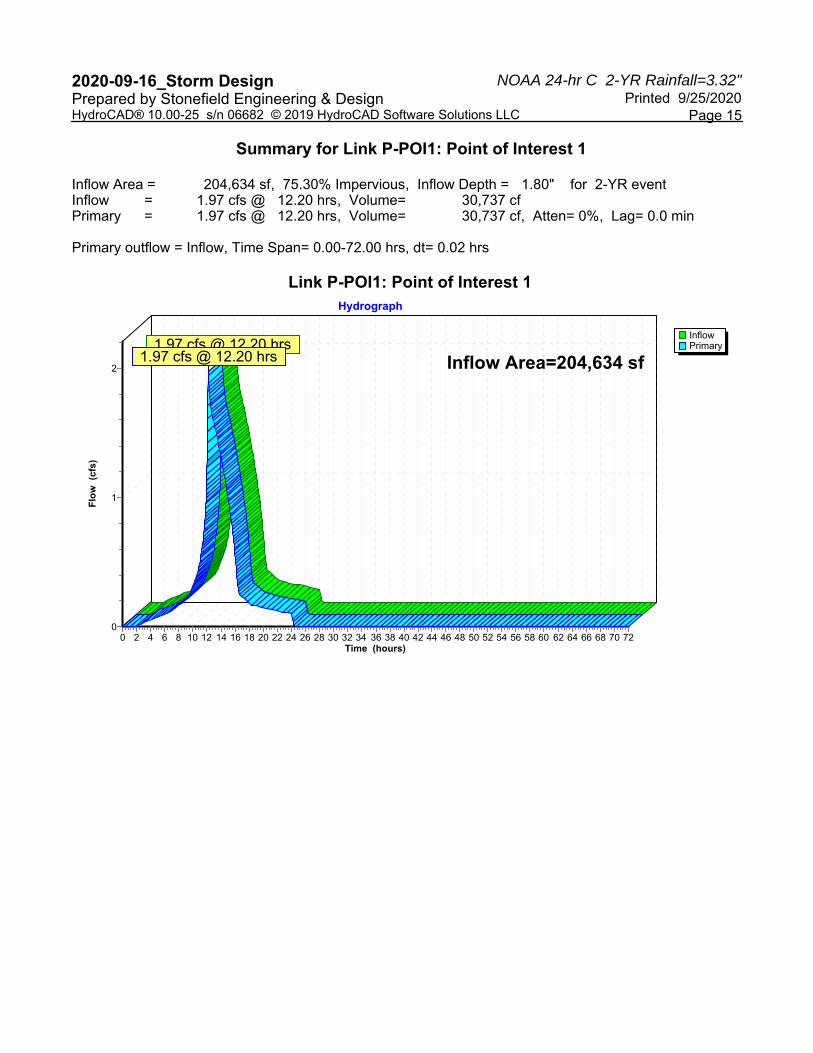
NOAA 24-hr C 2-YR Rainfall=3.32"2020-09-16_Storm Design Printed 9/25/2020Prepared by Stonefield Engineering & Design
Page 15HydroCAD® 10.00-25 s/n 06682 © 2019 HydroCAD Software Solutions LLC
Summary for Link P-POI1: Point of Interest 1
Inflow Area = 204,634 sf, 75.30% Impervious, Inflow Depth = 1.80" for 2-YR eventInflow = 1.97 cfs @ 12.20 hrs, Volume= 30,737 cfPrimary = 1.97 cfs @ 12.20 hrs, Volume= 30,737 cf, Atten= 0%, Lag= 0.0 min
Primary outflow = Inflow, Time Span= 0.00-72.00 hrs, dt= 0.02 hrs
Link P-POI1: Point of Interest 1
InflowPrimary
Hydrograph
Time (hours)727068666462605856545250484644424038363432302826242220181614121086420
Flo
w (
cfs)
2
1
0
Inflow Area=204,634 sf1.97 cfs @ 12.20 hrs
1.97 cfs @ 12.20 hrs
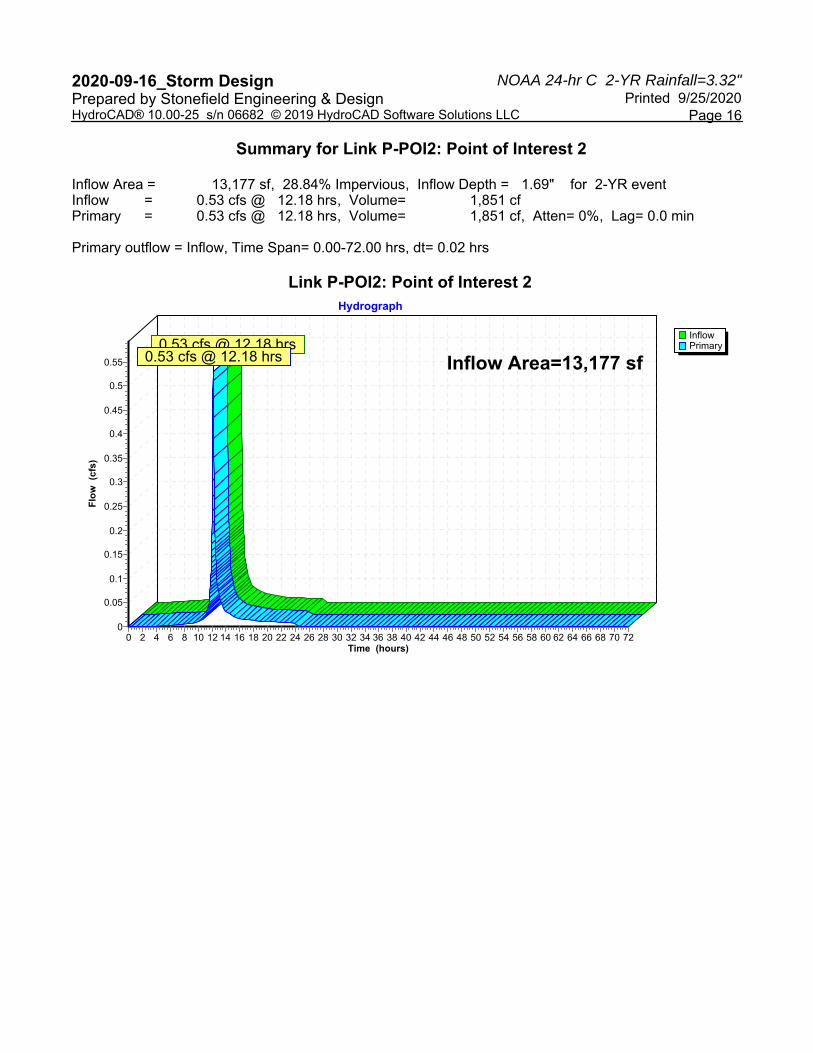
NOAA 24-hr C 2-YR Rainfall=3.32"2020-09-16_Storm Design Printed 9/25/2020Prepared by Stonefield Engineering & Design
Page 16HydroCAD® 10.00-25 s/n 06682 © 2019 HydroCAD Software Solutions LLC
Summary for Link P-POI2: Point of Interest 2
Inflow Area = 13,177 sf, 28.84% Impervious, Inflow Depth = 1.69" for 2-YR eventInflow = 0.53 cfs @ 12.18 hrs, Volume= 1,851 cfPrimary = 0.53 cfs @ 12.18 hrs, Volume= 1,851 cf, Atten= 0%, Lag= 0.0 min
Primary outflow = Inflow, Time Span= 0.00-72.00 hrs, dt= 0.02 hrs
Link P-POI2: Point of Interest 2
InflowPrimary
Hydrograph
Time (hours)727068666462605856545250484644424038363432302826242220181614121086420
Flo
w (
cfs)
0.55
0.5
0.45
0.4
0.35
0.3
0.25
0.2
0.15
0.1
0.05
0
Inflow Area=13,177 sf0.53 cfs @ 12.18 hrs
0.53 cfs @ 12.18 hrs
APPENDIX C-8
72 HOUR DRAW-DOWN TIME
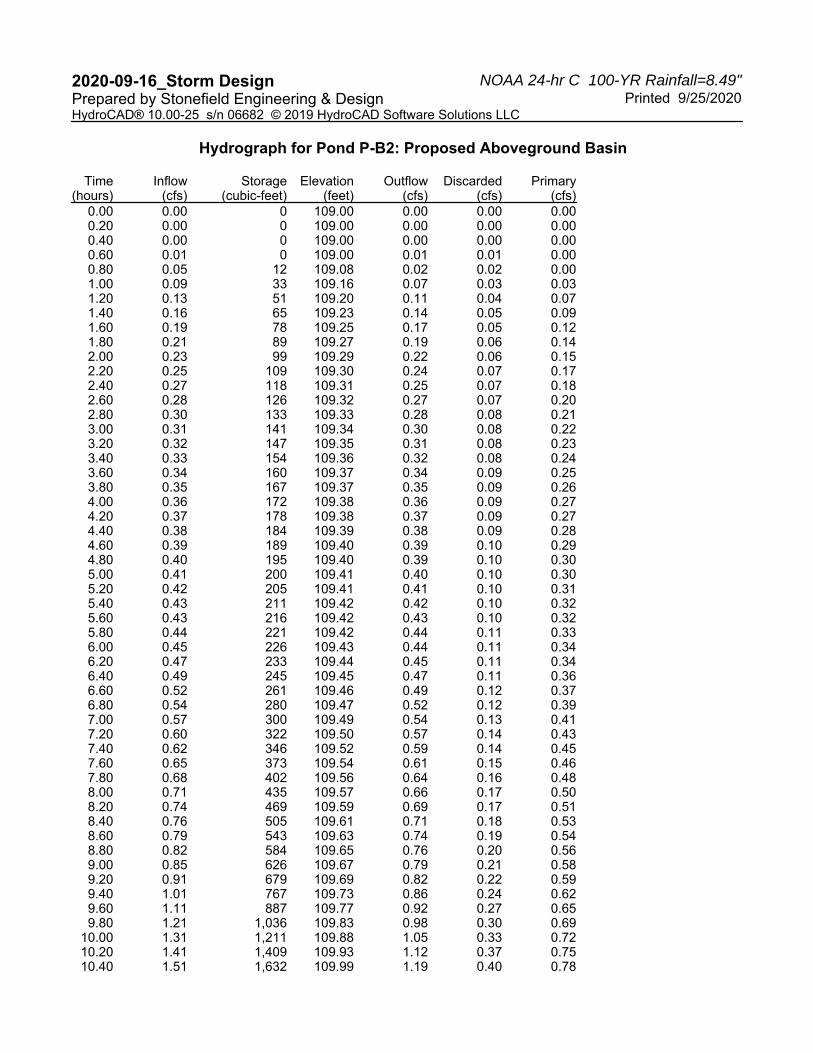
NOAA 24-hr C 100-YR Rainfall=8.49"2020-09-16_Storm Design Printed 9/25/2020Prepared by Stonefield Engineering & Design
HydroCAD® 10.00-25 s/n 06682 © 2019 HydroCAD Software Solutions LLC
Hydrograph for Pond P-B2: Proposed Aboveground Basin
Time(hours)
Inflow(cfs)
Storage(cubic-feet)
Elevation(feet)
Outflow(cfs)
Discarded(cfs)
Primary(cfs)
0.00 0.00 0 109.00 0.00 0.00 0.000.20 0.00 0 109.00 0.00 0.00 0.000.40 0.00 0 109.00 0.00 0.00 0.000.60 0.01 0 109.00 0.01 0.01 0.000.80 0.05 12 109.08 0.02 0.02 0.001.00 0.09 33 109.16 0.07 0.03 0.031.20 0.13 51 109.20 0.11 0.04 0.071.40 0.16 65 109.23 0.14 0.05 0.091.60 0.19 78 109.25 0.17 0.05 0.121.80 0.21 89 109.27 0.19 0.06 0.142.00 0.23 99 109.29 0.22 0.06 0.152.20 0.25 109 109.30 0.24 0.07 0.172.40 0.27 118 109.31 0.25 0.07 0.182.60 0.28 126 109.32 0.27 0.07 0.202.80 0.30 133 109.33 0.28 0.08 0.213.00 0.31 141 109.34 0.30 0.08 0.223.20 0.32 147 109.35 0.31 0.08 0.233.40 0.33 154 109.36 0.32 0.08 0.243.60 0.34 160 109.37 0.34 0.09 0.253.80 0.35 167 109.37 0.35 0.09 0.264.00 0.36 172 109.38 0.36 0.09 0.274.20 0.37 178 109.38 0.37 0.09 0.274.40 0.38 184 109.39 0.38 0.09 0.284.60 0.39 189 109.40 0.39 0.10 0.294.80 0.40 195 109.40 0.39 0.10 0.305.00 0.41 200 109.41 0.40 0.10 0.305.20 0.42 205 109.41 0.41 0.10 0.315.40 0.43 211 109.42 0.42 0.10 0.325.60 0.43 216 109.42 0.43 0.10 0.325.80 0.44 221 109.42 0.44 0.11 0.336.00 0.45 226 109.43 0.44 0.11 0.346.20 0.47 233 109.44 0.45 0.11 0.346.40 0.49 245 109.45 0.47 0.11 0.366.60 0.52 261 109.46 0.49 0.12 0.376.80 0.54 280 109.47 0.52 0.12 0.397.00 0.57 300 109.49 0.54 0.13 0.417.20 0.60 322 109.50 0.57 0.14 0.437.40 0.62 346 109.52 0.59 0.14 0.457.60 0.65 373 109.54 0.61 0.15 0.467.80 0.68 402 109.56 0.64 0.16 0.488.00 0.71 435 109.57 0.66 0.17 0.508.20 0.74 469 109.59 0.69 0.17 0.518.40 0.76 505 109.61 0.71 0.18 0.538.60 0.79 543 109.63 0.74 0.19 0.548.80 0.82 584 109.65 0.76 0.20 0.569.00 0.85 626 109.67 0.79 0.21 0.589.20 0.91 679 109.69 0.82 0.22 0.599.40 1.01 767 109.73 0.86 0.24 0.629.60 1.11 887 109.77 0.92 0.27 0.659.80 1.21 1,036 109.83 0.98 0.30 0.69
10.00 1.31 1,211 109.88 1.05 0.33 0.7210.20 1.41 1,409 109.93 1.12 0.37 0.7510.40 1.51 1,632 109.99 1.19 0.40 0.78
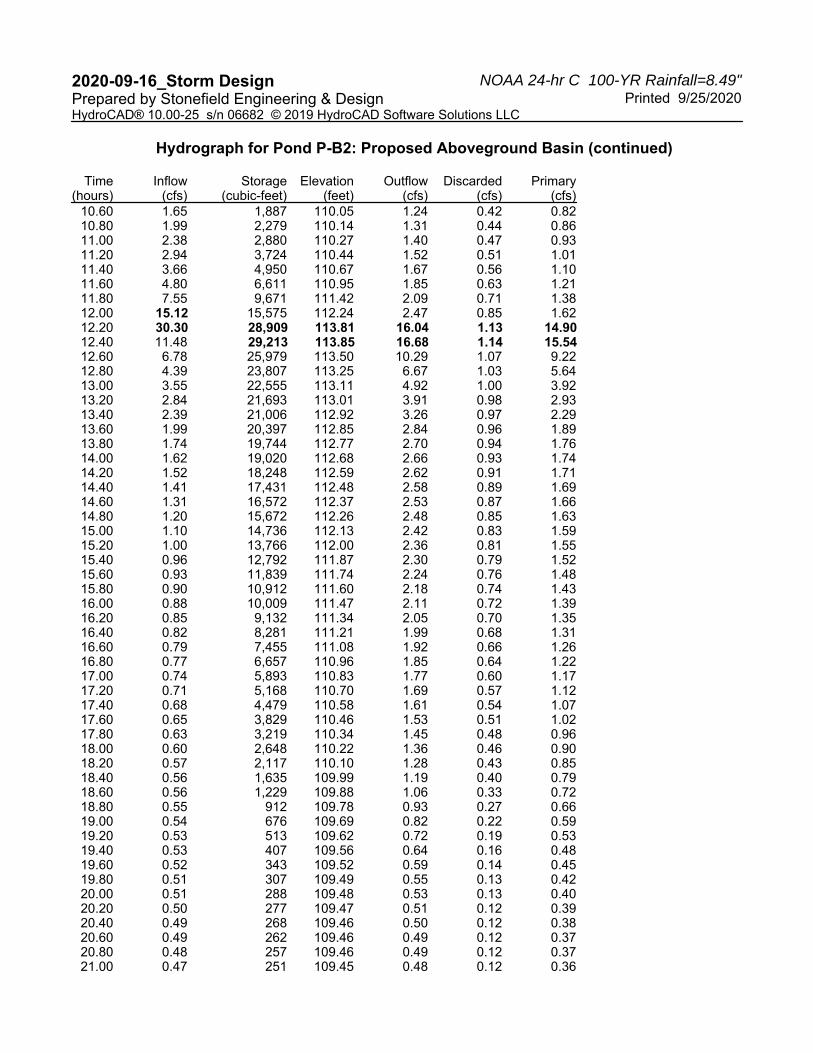
NOAA 24-hr C 100-YR Rainfall=8.49"2020-09-16_Storm Design Printed 9/25/2020Prepared by Stonefield Engineering & Design
HydroCAD® 10.00-25 s/n 06682 © 2019 HydroCAD Software Solutions LLC
Hydrograph for Pond P-B2: Proposed Aboveground Basin (continued)
Time(hours)
Inflow(cfs)
Storage(cubic-feet)
Elevation(feet)
Outflow(cfs)
Discarded(cfs)
Primary(cfs)
10.60 1.65 1,887 110.05 1.24 0.42 0.8210.80 1.99 2,279 110.14 1.31 0.44 0.8611.00 2.38 2,880 110.27 1.40 0.47 0.9311.20 2.94 3,724 110.44 1.52 0.51 1.0111.40 3.66 4,950 110.67 1.67 0.56 1.1011.60 4.80 6,611 110.95 1.85 0.63 1.2111.80 7.55 9,671 111.42 2.09 0.71 1.3812.00 15.12 15,575 112.24 2.47 0.85 1.6212.20 30.30 28,909 113.81 16.04 1.13 14.9012.40 11.48 29,213 113.85 16.68 1.14 15.5412.60 6.78 25,979 113.50 10.29 1.07 9.2212.80 4.39 23,807 113.25 6.67 1.03 5.6413.00 3.55 22,555 113.11 4.92 1.00 3.9213.20 2.84 21,693 113.01 3.91 0.98 2.9313.40 2.39 21,006 112.92 3.26 0.97 2.2913.60 1.99 20,397 112.85 2.84 0.96 1.8913.80 1.74 19,744 112.77 2.70 0.94 1.7614.00 1.62 19,020 112.68 2.66 0.93 1.7414.20 1.52 18,248 112.59 2.62 0.91 1.7114.40 1.41 17,431 112.48 2.58 0.89 1.6914.60 1.31 16,572 112.37 2.53 0.87 1.6614.80 1.20 15,672 112.26 2.48 0.85 1.6315.00 1.10 14,736 112.13 2.42 0.83 1.5915.20 1.00 13,766 112.00 2.36 0.81 1.5515.40 0.96 12,792 111.87 2.30 0.79 1.5215.60 0.93 11,839 111.74 2.24 0.76 1.4815.80 0.90 10,912 111.60 2.18 0.74 1.4316.00 0.88 10,009 111.47 2.11 0.72 1.3916.20 0.85 9,132 111.34 2.05 0.70 1.3516.40 0.82 8,281 111.21 1.99 0.68 1.3116.60 0.79 7,455 111.08 1.92 0.66 1.2616.80 0.77 6,657 110.96 1.85 0.64 1.2217.00 0.74 5,893 110.83 1.77 0.60 1.1717.20 0.71 5,168 110.70 1.69 0.57 1.1217.40 0.68 4,479 110.58 1.61 0.54 1.0717.60 0.65 3,829 110.46 1.53 0.51 1.0217.80 0.63 3,219 110.34 1.45 0.48 0.9618.00 0.60 2,648 110.22 1.36 0.46 0.9018.20 0.57 2,117 110.10 1.28 0.43 0.8518.40 0.56 1,635 109.99 1.19 0.40 0.7918.60 0.56 1,229 109.88 1.06 0.33 0.7218.80 0.55 912 109.78 0.93 0.27 0.6619.00 0.54 676 109.69 0.82 0.22 0.5919.20 0.53 513 109.62 0.72 0.19 0.5319.40 0.53 407 109.56 0.64 0.16 0.4819.60 0.52 343 109.52 0.59 0.14 0.4519.80 0.51 307 109.49 0.55 0.13 0.4220.00 0.51 288 109.48 0.53 0.13 0.4020.20 0.50 277 109.47 0.51 0.12 0.3920.40 0.49 268 109.46 0.50 0.12 0.3820.60 0.49 262 109.46 0.49 0.12 0.3720.80 0.48 257 109.46 0.49 0.12 0.3721.00 0.47 251 109.45 0.48 0.12 0.36
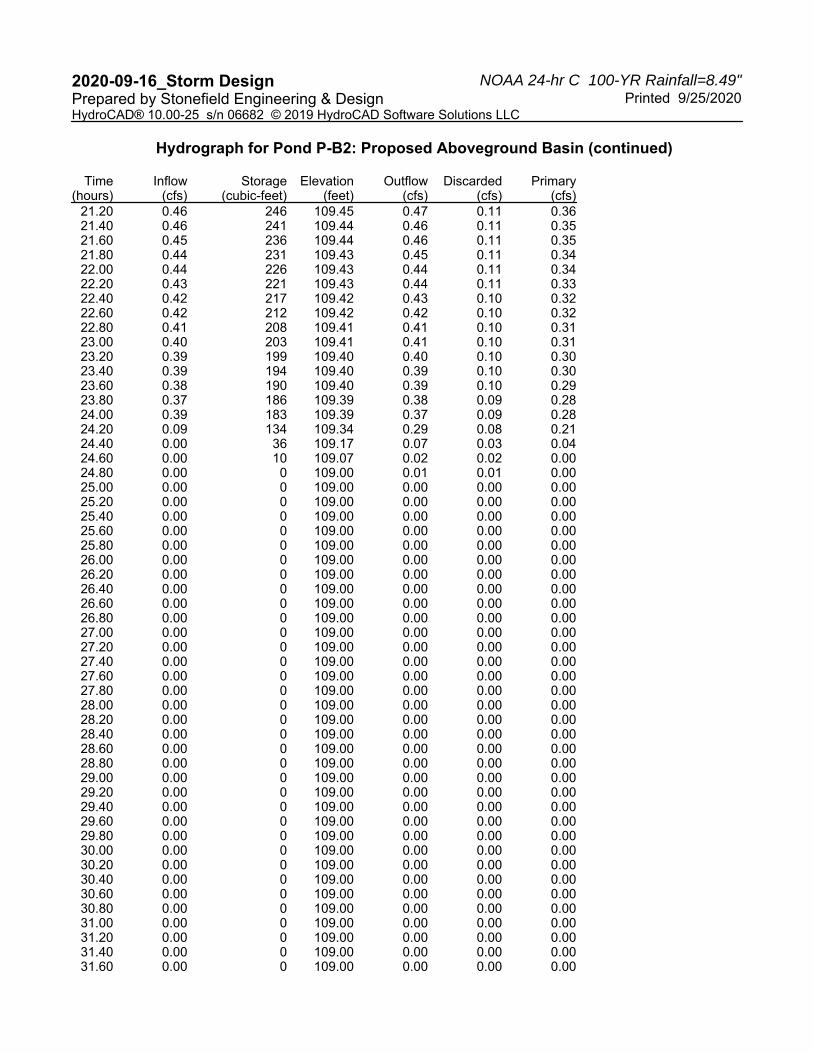
NOAA 24-hr C 100-YR Rainfall=8.49"2020-09-16_Storm Design Printed 9/25/2020Prepared by Stonefield Engineering & Design
HydroCAD® 10.00-25 s/n 06682 © 2019 HydroCAD Software Solutions LLC
Hydrograph for Pond P-B2: Proposed Aboveground Basin (continued)
Time(hours)
Inflow(cfs)
Storage(cubic-feet)
Elevation(feet)
Outflow(cfs)
Discarded(cfs)
Primary(cfs)
21.20 0.46 246 109.45 0.47 0.11 0.3621.40 0.46 241 109.44 0.46 0.11 0.3521.60 0.45 236 109.44 0.46 0.11 0.3521.80 0.44 231 109.43 0.45 0.11 0.3422.00 0.44 226 109.43 0.44 0.11 0.3422.20 0.43 221 109.43 0.44 0.11 0.3322.40 0.42 217 109.42 0.43 0.10 0.3222.60 0.42 212 109.42 0.42 0.10 0.3222.80 0.41 208 109.41 0.41 0.10 0.3123.00 0.40 203 109.41 0.41 0.10 0.3123.20 0.39 199 109.40 0.40 0.10 0.3023.40 0.39 194 109.40 0.39 0.10 0.3023.60 0.38 190 109.40 0.39 0.10 0.2923.80 0.37 186 109.39 0.38 0.09 0.2824.00 0.39 183 109.39 0.37 0.09 0.2824.20 0.09 134 109.34 0.29 0.08 0.2124.40 0.00 36 109.17 0.07 0.03 0.0424.60 0.00 10 109.07 0.02 0.02 0.0024.80 0.00 0 109.00 0.01 0.01 0.0025.00 0.00 0 109.00 0.00 0.00 0.0025.20 0.00 0 109.00 0.00 0.00 0.0025.40 0.00 0 109.00 0.00 0.00 0.0025.60 0.00 0 109.00 0.00 0.00 0.0025.80 0.00 0 109.00 0.00 0.00 0.0026.00 0.00 0 109.00 0.00 0.00 0.0026.20 0.00 0 109.00 0.00 0.00 0.0026.40 0.00 0 109.00 0.00 0.00 0.0026.60 0.00 0 109.00 0.00 0.00 0.0026.80 0.00 0 109.00 0.00 0.00 0.0027.00 0.00 0 109.00 0.00 0.00 0.0027.20 0.00 0 109.00 0.00 0.00 0.0027.40 0.00 0 109.00 0.00 0.00 0.0027.60 0.00 0 109.00 0.00 0.00 0.0027.80 0.00 0 109.00 0.00 0.00 0.0028.00 0.00 0 109.00 0.00 0.00 0.0028.20 0.00 0 109.00 0.00 0.00 0.0028.40 0.00 0 109.00 0.00 0.00 0.0028.60 0.00 0 109.00 0.00 0.00 0.0028.80 0.00 0 109.00 0.00 0.00 0.0029.00 0.00 0 109.00 0.00 0.00 0.0029.20 0.00 0 109.00 0.00 0.00 0.0029.40 0.00 0 109.00 0.00 0.00 0.0029.60 0.00 0 109.00 0.00 0.00 0.0029.80 0.00 0 109.00 0.00 0.00 0.0030.00 0.00 0 109.00 0.00 0.00 0.0030.20 0.00 0 109.00 0.00 0.00 0.0030.40 0.00 0 109.00 0.00 0.00 0.0030.60 0.00 0 109.00 0.00 0.00 0.0030.80 0.00 0 109.00 0.00 0.00 0.0031.00 0.00 0 109.00 0.00 0.00 0.0031.20 0.00 0 109.00 0.00 0.00 0.0031.40 0.00 0 109.00 0.00 0.00 0.0031.60 0.00 0 109.00 0.00 0.00 0.00
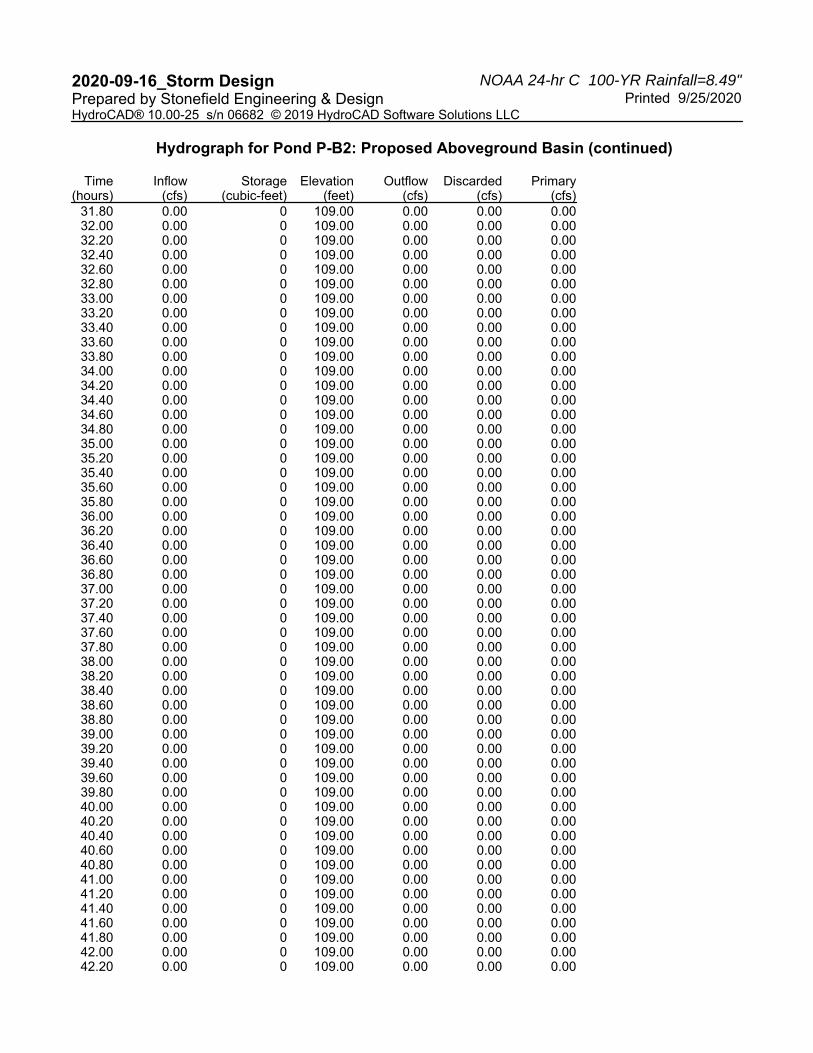
NOAA 24-hr C 100-YR Rainfall=8.49"2020-09-16_Storm Design Printed 9/25/2020Prepared by Stonefield Engineering & Design
HydroCAD® 10.00-25 s/n 06682 © 2019 HydroCAD Software Solutions LLC
Hydrograph for Pond P-B2: Proposed Aboveground Basin (continued)
Time(hours)
Inflow(cfs)
Storage(cubic-feet)
Elevation(feet)
Outflow(cfs)
Discarded(cfs)
Primary(cfs)
31.80 0.00 0 109.00 0.00 0.00 0.0032.00 0.00 0 109.00 0.00 0.00 0.0032.20 0.00 0 109.00 0.00 0.00 0.0032.40 0.00 0 109.00 0.00 0.00 0.0032.60 0.00 0 109.00 0.00 0.00 0.0032.80 0.00 0 109.00 0.00 0.00 0.0033.00 0.00 0 109.00 0.00 0.00 0.0033.20 0.00 0 109.00 0.00 0.00 0.0033.40 0.00 0 109.00 0.00 0.00 0.0033.60 0.00 0 109.00 0.00 0.00 0.0033.80 0.00 0 109.00 0.00 0.00 0.0034.00 0.00 0 109.00 0.00 0.00 0.0034.20 0.00 0 109.00 0.00 0.00 0.0034.40 0.00 0 109.00 0.00 0.00 0.0034.60 0.00 0 109.00 0.00 0.00 0.0034.80 0.00 0 109.00 0.00 0.00 0.0035.00 0.00 0 109.00 0.00 0.00 0.0035.20 0.00 0 109.00 0.00 0.00 0.0035.40 0.00 0 109.00 0.00 0.00 0.0035.60 0.00 0 109.00 0.00 0.00 0.0035.80 0.00 0 109.00 0.00 0.00 0.0036.00 0.00 0 109.00 0.00 0.00 0.0036.20 0.00 0 109.00 0.00 0.00 0.0036.40 0.00 0 109.00 0.00 0.00 0.0036.60 0.00 0 109.00 0.00 0.00 0.0036.80 0.00 0 109.00 0.00 0.00 0.0037.00 0.00 0 109.00 0.00 0.00 0.0037.20 0.00 0 109.00 0.00 0.00 0.0037.40 0.00 0 109.00 0.00 0.00 0.0037.60 0.00 0 109.00 0.00 0.00 0.0037.80 0.00 0 109.00 0.00 0.00 0.0038.00 0.00 0 109.00 0.00 0.00 0.0038.20 0.00 0 109.00 0.00 0.00 0.0038.40 0.00 0 109.00 0.00 0.00 0.0038.60 0.00 0 109.00 0.00 0.00 0.0038.80 0.00 0 109.00 0.00 0.00 0.0039.00 0.00 0 109.00 0.00 0.00 0.0039.20 0.00 0 109.00 0.00 0.00 0.0039.40 0.00 0 109.00 0.00 0.00 0.0039.60 0.00 0 109.00 0.00 0.00 0.0039.80 0.00 0 109.00 0.00 0.00 0.0040.00 0.00 0 109.00 0.00 0.00 0.0040.20 0.00 0 109.00 0.00 0.00 0.0040.40 0.00 0 109.00 0.00 0.00 0.0040.60 0.00 0 109.00 0.00 0.00 0.0040.80 0.00 0 109.00 0.00 0.00 0.0041.00 0.00 0 109.00 0.00 0.00 0.0041.20 0.00 0 109.00 0.00 0.00 0.0041.40 0.00 0 109.00 0.00 0.00 0.0041.60 0.00 0 109.00 0.00 0.00 0.0041.80 0.00 0 109.00 0.00 0.00 0.0042.00 0.00 0 109.00 0.00 0.00 0.0042.20 0.00 0 109.00 0.00 0.00 0.00

NOAA 24-hr C 100-YR Rainfall=8.49"2020-09-16_Storm Design Printed 9/25/2020Prepared by Stonefield Engineering & Design
HydroCAD® 10.00-25 s/n 06682 © 2019 HydroCAD Software Solutions LLC
Hydrograph for Pond P-B2: Proposed Aboveground Basin (continued)
Time(hours)
Inflow(cfs)
Storage(cubic-feet)
Elevation(feet)
Outflow(cfs)
Discarded(cfs)
Primary(cfs)
42.40 0.00 0 109.00 0.00 0.00 0.0042.60 0.00 0 109.00 0.00 0.00 0.0042.80 0.00 0 109.00 0.00 0.00 0.0043.00 0.00 0 109.00 0.00 0.00 0.0043.20 0.00 0 109.00 0.00 0.00 0.0043.40 0.00 0 109.00 0.00 0.00 0.0043.60 0.00 0 109.00 0.00 0.00 0.0043.80 0.00 0 109.00 0.00 0.00 0.0044.00 0.00 0 109.00 0.00 0.00 0.0044.20 0.00 0 109.00 0.00 0.00 0.0044.40 0.00 0 109.00 0.00 0.00 0.0044.60 0.00 0 109.00 0.00 0.00 0.0044.80 0.00 0 109.00 0.00 0.00 0.0045.00 0.00 0 109.00 0.00 0.00 0.0045.20 0.00 0 109.00 0.00 0.00 0.0045.40 0.00 0 109.00 0.00 0.00 0.0045.60 0.00 0 109.00 0.00 0.00 0.0045.80 0.00 0 109.00 0.00 0.00 0.0046.00 0.00 0 109.00 0.00 0.00 0.0046.20 0.00 0 109.00 0.00 0.00 0.0046.40 0.00 0 109.00 0.00 0.00 0.0046.60 0.00 0 109.00 0.00 0.00 0.0046.80 0.00 0 109.00 0.00 0.00 0.0047.00 0.00 0 109.00 0.00 0.00 0.0047.20 0.00 0 109.00 0.00 0.00 0.0047.40 0.00 0 109.00 0.00 0.00 0.0047.60 0.00 0 109.00 0.00 0.00 0.0047.80 0.00 0 109.00 0.00 0.00 0.0048.00 0.00 0 109.00 0.00 0.00 0.0048.20 0.00 0 109.00 0.00 0.00 0.0048.40 0.00 0 109.00 0.00 0.00 0.0048.60 0.00 0 109.00 0.00 0.00 0.0048.80 0.00 0 109.00 0.00 0.00 0.0049.00 0.00 0 109.00 0.00 0.00 0.0049.20 0.00 0 109.00 0.00 0.00 0.0049.40 0.00 0 109.00 0.00 0.00 0.0049.60 0.00 0 109.00 0.00 0.00 0.0049.80 0.00 0 109.00 0.00 0.00 0.0050.00 0.00 0 109.00 0.00 0.00 0.0050.20 0.00 0 109.00 0.00 0.00 0.0050.40 0.00 0 109.00 0.00 0.00 0.0050.60 0.00 0 109.00 0.00 0.00 0.0050.80 0.00 0 109.00 0.00 0.00 0.0051.00 0.00 0 109.00 0.00 0.00 0.0051.20 0.00 0 109.00 0.00 0.00 0.0051.40 0.00 0 109.00 0.00 0.00 0.0051.60 0.00 0 109.00 0.00 0.00 0.0051.80 0.00 0 109.00 0.00 0.00 0.0052.00 0.00 0 109.00 0.00 0.00 0.0052.20 0.00 0 109.00 0.00 0.00 0.0052.40 0.00 0 109.00 0.00 0.00 0.0052.60 0.00 0 109.00 0.00 0.00 0.0052.80 0.00 0 109.00 0.00 0.00 0.00
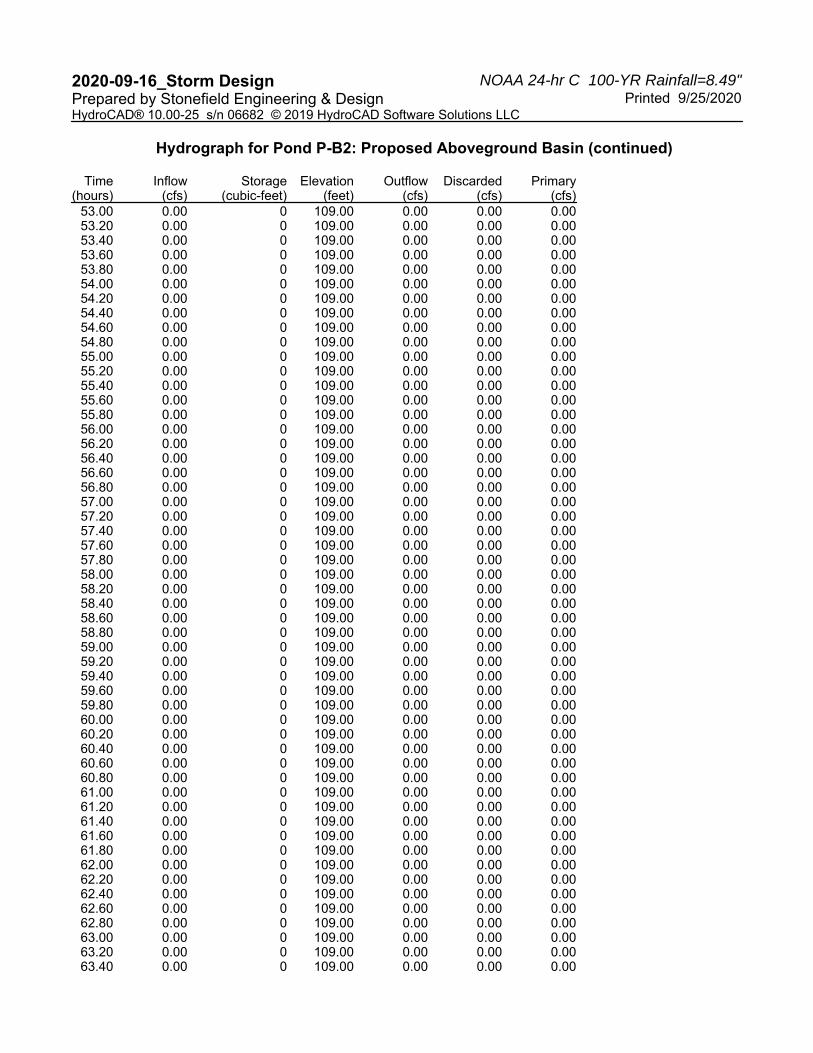
NOAA 24-hr C 100-YR Rainfall=8.49"2020-09-16_Storm Design Printed 9/25/2020Prepared by Stonefield Engineering & Design
HydroCAD® 10.00-25 s/n 06682 © 2019 HydroCAD Software Solutions LLC
Hydrograph for Pond P-B2: Proposed Aboveground Basin (continued)
Time(hours)
Inflow(cfs)
Storage(cubic-feet)
Elevation(feet)
Outflow(cfs)
Discarded(cfs)
Primary(cfs)
53.00 0.00 0 109.00 0.00 0.00 0.0053.20 0.00 0 109.00 0.00 0.00 0.0053.40 0.00 0 109.00 0.00 0.00 0.0053.60 0.00 0 109.00 0.00 0.00 0.0053.80 0.00 0 109.00 0.00 0.00 0.0054.00 0.00 0 109.00 0.00 0.00 0.0054.20 0.00 0 109.00 0.00 0.00 0.0054.40 0.00 0 109.00 0.00 0.00 0.0054.60 0.00 0 109.00 0.00 0.00 0.0054.80 0.00 0 109.00 0.00 0.00 0.0055.00 0.00 0 109.00 0.00 0.00 0.0055.20 0.00 0 109.00 0.00 0.00 0.0055.40 0.00 0 109.00 0.00 0.00 0.0055.60 0.00 0 109.00 0.00 0.00 0.0055.80 0.00 0 109.00 0.00 0.00 0.0056.00 0.00 0 109.00 0.00 0.00 0.0056.20 0.00 0 109.00 0.00 0.00 0.0056.40 0.00 0 109.00 0.00 0.00 0.0056.60 0.00 0 109.00 0.00 0.00 0.0056.80 0.00 0 109.00 0.00 0.00 0.0057.00 0.00 0 109.00 0.00 0.00 0.0057.20 0.00 0 109.00 0.00 0.00 0.0057.40 0.00 0 109.00 0.00 0.00 0.0057.60 0.00 0 109.00 0.00 0.00 0.0057.80 0.00 0 109.00 0.00 0.00 0.0058.00 0.00 0 109.00 0.00 0.00 0.0058.20 0.00 0 109.00 0.00 0.00 0.0058.40 0.00 0 109.00 0.00 0.00 0.0058.60 0.00 0 109.00 0.00 0.00 0.0058.80 0.00 0 109.00 0.00 0.00 0.0059.00 0.00 0 109.00 0.00 0.00 0.0059.20 0.00 0 109.00 0.00 0.00 0.0059.40 0.00 0 109.00 0.00 0.00 0.0059.60 0.00 0 109.00 0.00 0.00 0.0059.80 0.00 0 109.00 0.00 0.00 0.0060.00 0.00 0 109.00 0.00 0.00 0.0060.20 0.00 0 109.00 0.00 0.00 0.0060.40 0.00 0 109.00 0.00 0.00 0.0060.60 0.00 0 109.00 0.00 0.00 0.0060.80 0.00 0 109.00 0.00 0.00 0.0061.00 0.00 0 109.00 0.00 0.00 0.0061.20 0.00 0 109.00 0.00 0.00 0.0061.40 0.00 0 109.00 0.00 0.00 0.0061.60 0.00 0 109.00 0.00 0.00 0.0061.80 0.00 0 109.00 0.00 0.00 0.0062.00 0.00 0 109.00 0.00 0.00 0.0062.20 0.00 0 109.00 0.00 0.00 0.0062.40 0.00 0 109.00 0.00 0.00 0.0062.60 0.00 0 109.00 0.00 0.00 0.0062.80 0.00 0 109.00 0.00 0.00 0.0063.00 0.00 0 109.00 0.00 0.00 0.0063.20 0.00 0 109.00 0.00 0.00 0.0063.40 0.00 0 109.00 0.00 0.00 0.00
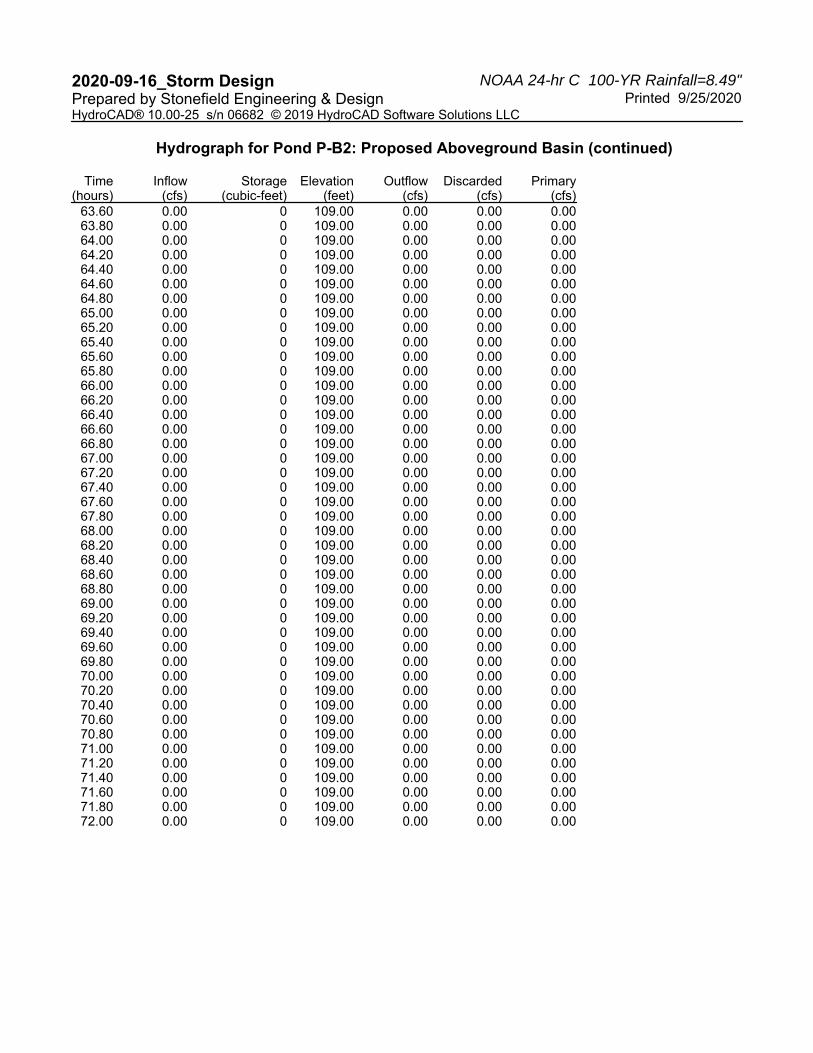
NOAA 24-hr C 100-YR Rainfall=8.49"2020-09-16_Storm Design Printed 9/25/2020Prepared by Stonefield Engineering & Design
HydroCAD® 10.00-25 s/n 06682 © 2019 HydroCAD Software Solutions LLC
Hydrograph for Pond P-B2: Proposed Aboveground Basin (continued)
Time(hours)
Inflow(cfs)
Storage(cubic-feet)
Elevation(feet)
Outflow(cfs)
Discarded(cfs)
Primary(cfs)
63.60 0.00 0 109.00 0.00 0.00 0.0063.80 0.00 0 109.00 0.00 0.00 0.0064.00 0.00 0 109.00 0.00 0.00 0.0064.20 0.00 0 109.00 0.00 0.00 0.0064.40 0.00 0 109.00 0.00 0.00 0.0064.60 0.00 0 109.00 0.00 0.00 0.0064.80 0.00 0 109.00 0.00 0.00 0.0065.00 0.00 0 109.00 0.00 0.00 0.0065.20 0.00 0 109.00 0.00 0.00 0.0065.40 0.00 0 109.00 0.00 0.00 0.0065.60 0.00 0 109.00 0.00 0.00 0.0065.80 0.00 0 109.00 0.00 0.00 0.0066.00 0.00 0 109.00 0.00 0.00 0.0066.20 0.00 0 109.00 0.00 0.00 0.0066.40 0.00 0 109.00 0.00 0.00 0.0066.60 0.00 0 109.00 0.00 0.00 0.0066.80 0.00 0 109.00 0.00 0.00 0.0067.00 0.00 0 109.00 0.00 0.00 0.0067.20 0.00 0 109.00 0.00 0.00 0.0067.40 0.00 0 109.00 0.00 0.00 0.0067.60 0.00 0 109.00 0.00 0.00 0.0067.80 0.00 0 109.00 0.00 0.00 0.0068.00 0.00 0 109.00 0.00 0.00 0.0068.20 0.00 0 109.00 0.00 0.00 0.0068.40 0.00 0 109.00 0.00 0.00 0.0068.60 0.00 0 109.00 0.00 0.00 0.0068.80 0.00 0 109.00 0.00 0.00 0.0069.00 0.00 0 109.00 0.00 0.00 0.0069.20 0.00 0 109.00 0.00 0.00 0.0069.40 0.00 0 109.00 0.00 0.00 0.0069.60 0.00 0 109.00 0.00 0.00 0.0069.80 0.00 0 109.00 0.00 0.00 0.0070.00 0.00 0 109.00 0.00 0.00 0.0070.20 0.00 0 109.00 0.00 0.00 0.0070.40 0.00 0 109.00 0.00 0.00 0.0070.60 0.00 0 109.00 0.00 0.00 0.0070.80 0.00 0 109.00 0.00 0.00 0.0071.00 0.00 0 109.00 0.00 0.00 0.0071.20 0.00 0 109.00 0.00 0.00 0.0071.40 0.00 0 109.00 0.00 0.00 0.0071.60 0.00 0 109.00 0.00 0.00 0.0071.80 0.00 0 109.00 0.00 0.00 0.0072.00 0.00 0 109.00 0.00 0.00 0.00
APPENDIX C-9
NEW JERSEY GROUNDWATER RECHARGE
SPREADSHEET
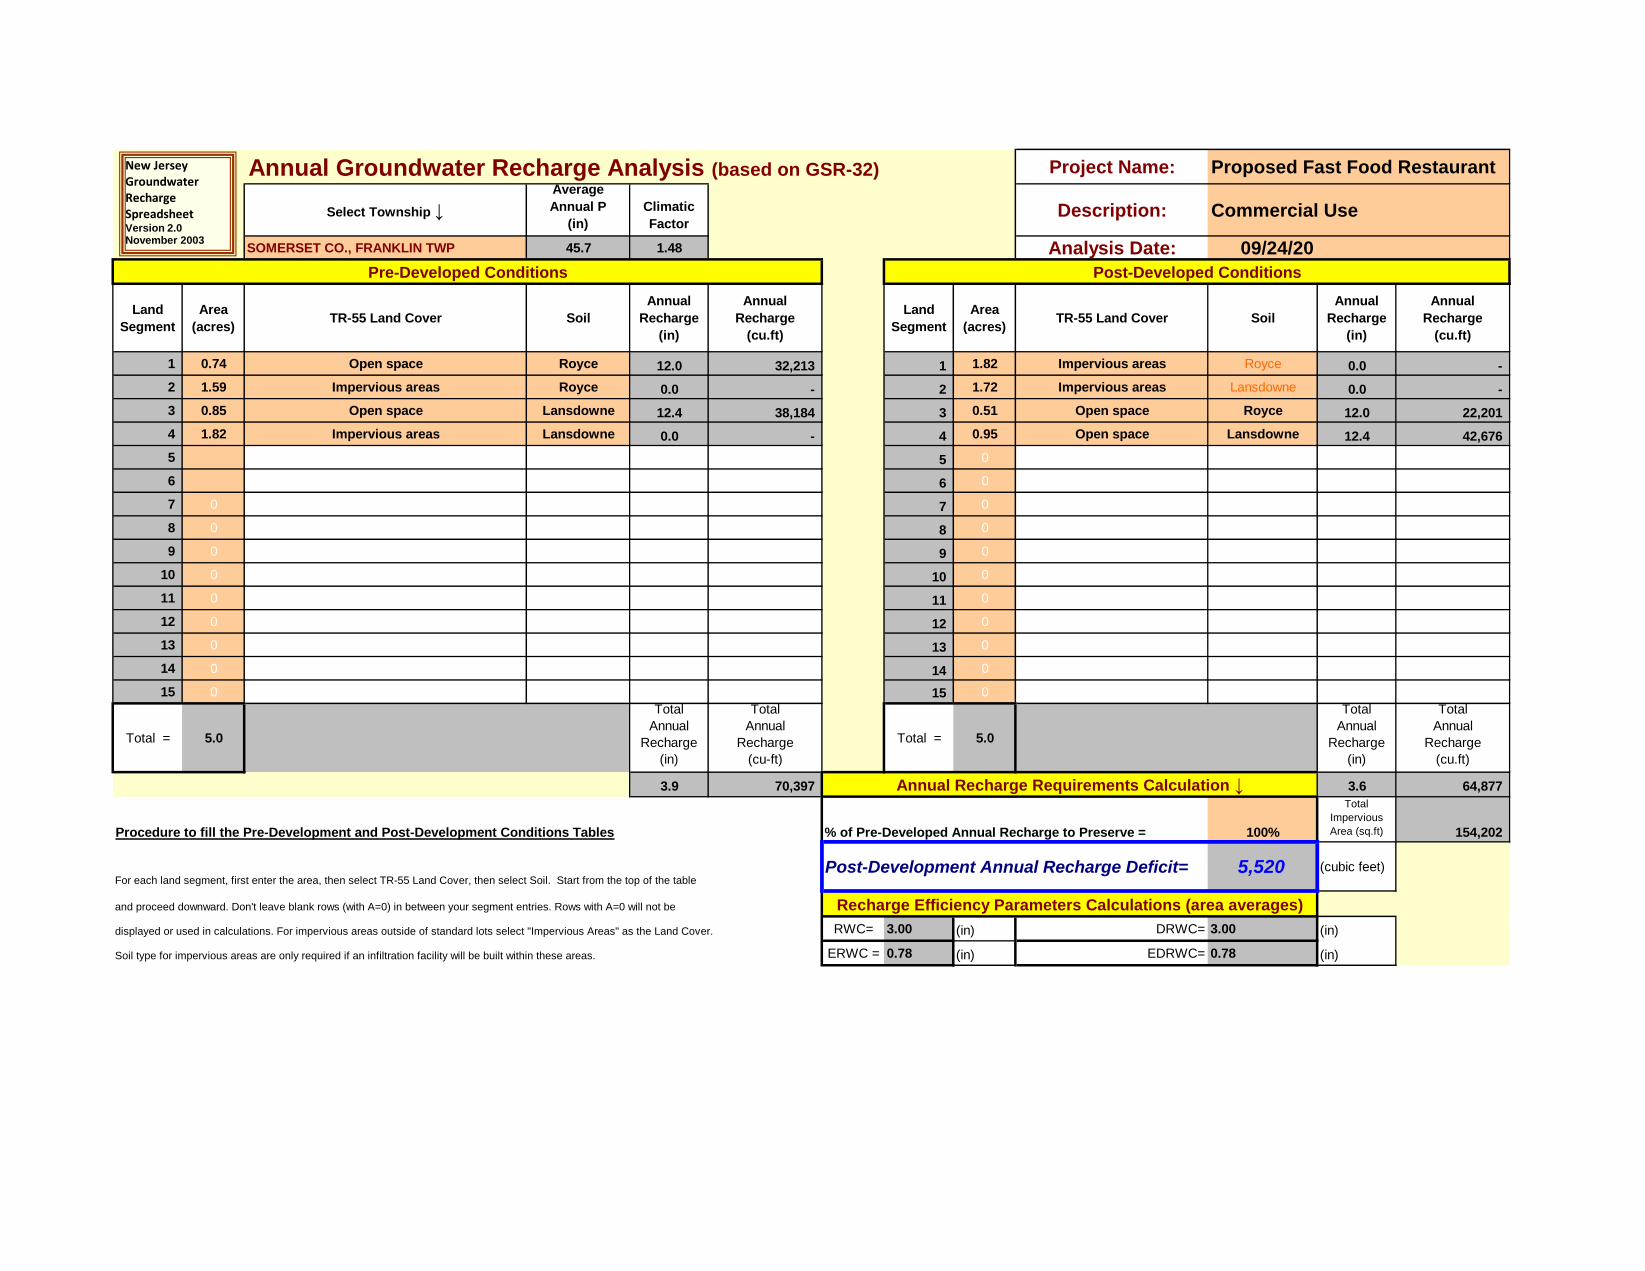
Annual Groundwater Recharge Analysis (based on GSR-32) Project Name: Proposed Fast Food Restaurant
Select Township ↓
Average
Annual P
(in)
Climatic
FactorDescription: Commercial Use
SOMERSET CO., FRANKLIN TWP 45.7 1.48 Analysis Date: 09/24/20
Land
Segment
Area
(acres)TR-55 Land Cover Soil
Annual
Recharge
(in)
Annual
Recharge
(cu.ft)
Land
Segment
Area
(acres)TR-55 Land Cover Soil
Annual
Recharge
(in)
Annual
Recharge
(cu.ft)
1 0.74 Open space Royce 12.0 32,213 1 1.82 Impervious areas Royce 0.0 -
2 1.59 Impervious areas Royce 0.0 - 2 1.72 Impervious areas Lansdowne 0.0 -
3 0.85 Open space Lansdowne 12.4 38,184 3 0.51 Open space Royce 12.0 22,201
4 1.82 Impervious areas Lansdowne 0.0 - 4 0.95 Open space Lansdowne 12.4 42,676
5 Gravel, dirt Keyport - - 5 0 brush Adelphia - -
6 Woods-grass combination Keyport - - 6 0 Brush Adelphia - -
7 0 brush Adelphia Variant - - 7 0 Brush Adelphia - -
8 0 brush Adelphia - - 8 0 Brush Adelphia Variant - -
9 0 brush Adelphia - - 9 0 Brush Adelphia - -
10 0 brush Adelphia - - 10 0 Brush Abbottstown - -
11 0 Brush Abbottstown - - 11 0 Brush Abbottstown - -
12 0 Brush Abbottstown - - 12 0 Brush Abbottstown - -
13 0 Brush Abbottstown - - 13 0 Brush Abbottstown - -
14 0 Brush Abbottstown - - 14 0 Brush Abbottstown - -
15 0 Brush Abbottstown - - 15 0 Brush Abbottstown - -
Total = 5.0
Total
Annual
Recharge
(in)
Total
Annual
Recharge
(cu-ft)
Total = 5.0
Total
Annual
Recharge
(in)
Total
Annual
Recharge
(cu.ft)
3.9 70,397 3.6 64,877
Procedure to fill the Pre-Development and Post-Development Conditions Tables % of Pre-Developed Annual Recharge to Preserve = 100%
Total
Impervious
Area (sq.ft) 154,202
For each land segment, first enter the area, then select TR-55 Land Cover, then select Soil. Start from the top of the tablePost-Development Annual Recharge Deficit= 5,520 (cubic feet)
and proceed downward. Don't leave blank rows (with A=0) in between your segment entries. Rows with A=0 will not be
displayed or used in calculations. For impervious areas outside of standard lots select "Impervious Areas" as the Land Cover. RWC= 3.00 (in) DRWC= 3.00 (in)
Soil type for impervious areas are only required if an infiltration facility will be built within these areas. ERWC = 0.78 (in) EDRWC= 0.78 (in)
Pre-Developed Conditions Post-Developed Conditions
Recharge Efficiency Parameters Calculations (area averages)
Annual Recharge Requirements Calculation ↓
New JerseyGroundwater RechargeSpreadsheetVersion 2.0November 2003
Project Name Description Analysis Date BMP or LID Type
Recharge BMP Input Parameters Root Zone Water capacity Calculated Parameters Recharge Design Parameters
Parameter Symbol Value Unit Parameter Symbol Value Unit Parameter Symbol Value Unit
BMP Area ABMP 4284.0 sq.ft
Empty Portion
of RWC under Post-D
Natural Recharge
ERWC 1.05 inInches of Runoff
to captureQdesign 0.04 in
BMP Effective Depth,
this is the design variabledBMP 1.0 in
ERWC Modified to
consider dEXCEDRWC 1.05 in
Inches of Rainfall
to capturePdesign 0.09 in
Upper level of the BMP
surface (negative if above
ground)dBMPu -22.6 in
Empty Portion
of RWC under Infilt.
BMP
RERWC 0.83 inRecharge Provided
Avg. over Imp. Area0.4 in
Depth of lower surface of
BMP, must be>=dBMPudEXC 0.0 in
Runoff Captured
Avg. over imp. Area2.3 in
Post-development Land
Segment Location of BMP ,Input Zero if Location is distributed
or undetermined
SegBMP 4 unitless
BMP Calculated Size Parameters CALCULATION CHECK MESSAGES
ABMP/Aimp Aratio 0.03 unitless Volume Balance-> OK
BMP Volume VBMP 367 cu.ft dBMP Check---> OK
Parameters from Annual Recharge Worksheet System Performance Calculated Parameters dEXC Check---> OK
Post-D Deficit Recharge
(or desired recharge
volume)
Vdef 5,520 cu.ftAnnual BMP Recharge
Volume5,520 cu.ft
BMP Location---> OK
Post-D Impervious Area
(or target Impervious Area)Aimp 154,202 sq.ft
Avg BMP Recharge
Efficiency19.0%
Represents
% Infiltration
Recharged OTHER NOTES
Root Zone Water Capacity RWC 4.06 in%Rainfall
became Runoff77.9%
% Pdesign is accurate only after BMP dimensions are updated to make rech volume= deficit volume. The portion
RWC Modified to
consider dEXCDRWC 4.06 in
%Runoff
Infiltrated6.3%
% of BMP infiltration prior to filling and the area occupied by BMP are ignored in these calculations. Results are
Climatic Factor C-factor 1.48 no units%Runoff
Recharged1.2%
% sensetive to dBMP, make sure dBMP selected is small enough for BMP to empty in less than 3 days. For land
Average Annual P Pavg 45.7 in%Rainfall
Recharged0.9%
% Segment Location of BMP if you select "impervious areas" RWC will be minimal but not zero as determined by
Recharge Requirement
over Imp. Areadr 0.4 in
the soil type and a shallow root zone for this Land Cover allowing consideration of lateral flow and other losses.
How to solve for different recharge volumes: By default the spreadsheet assigns the values of total deficit recharge volume "Vdef" and total proposed impervious area "Aimp" from the "Annual Recharge" sheet to "Vdef"
and "Aimp" on this page. This allows solution for a single BMP to handle the entire recharge requirement assuming the runoff from entire impervious area is available to the BMP.
To solve for a smaller BMP or a LID-IMP to recharge only part of the recharge requirement, set Vdef to your target value and Aimp to impervious area directly connected to your infiltration facility and then solve for ABMP or
dBMP. To go back to the default configuration clik the "Default Vdef & Aimp" button.
09/24/20Proposed Fast Food RestaurantCommercial Use Proposed Aboveground Basin
APPENDIX D
SUBSURFACE STORMWATER
INVESTIGATION RESULTS
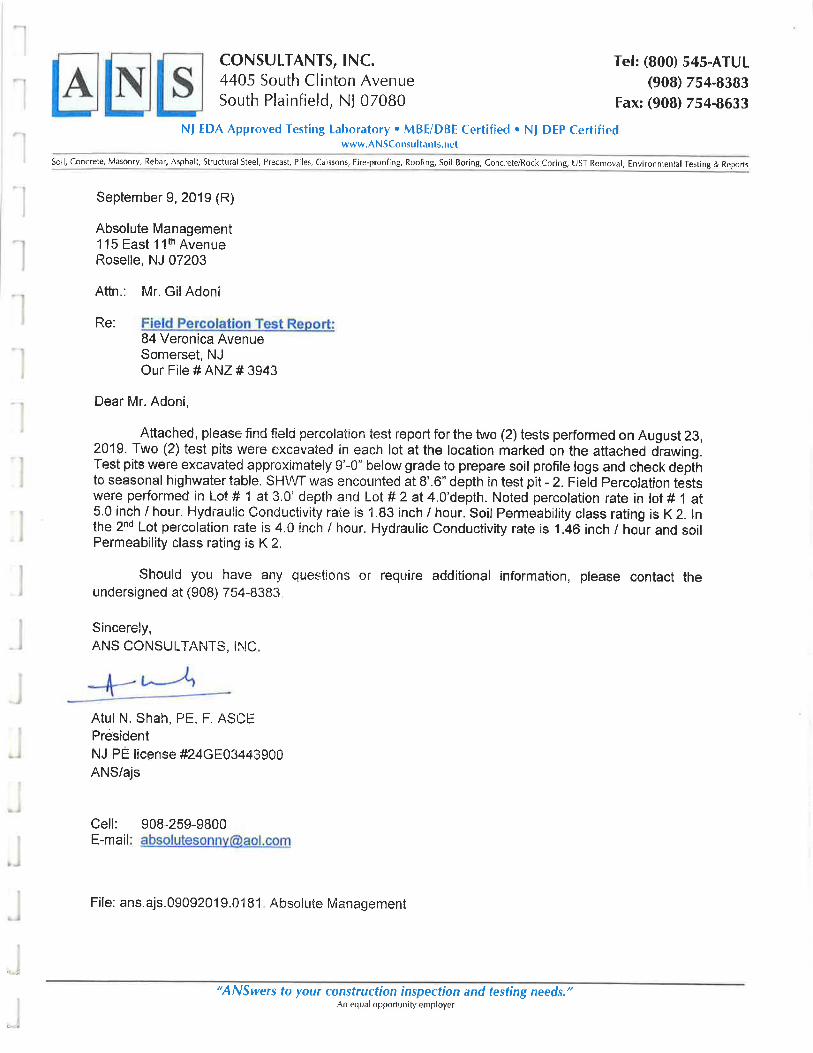
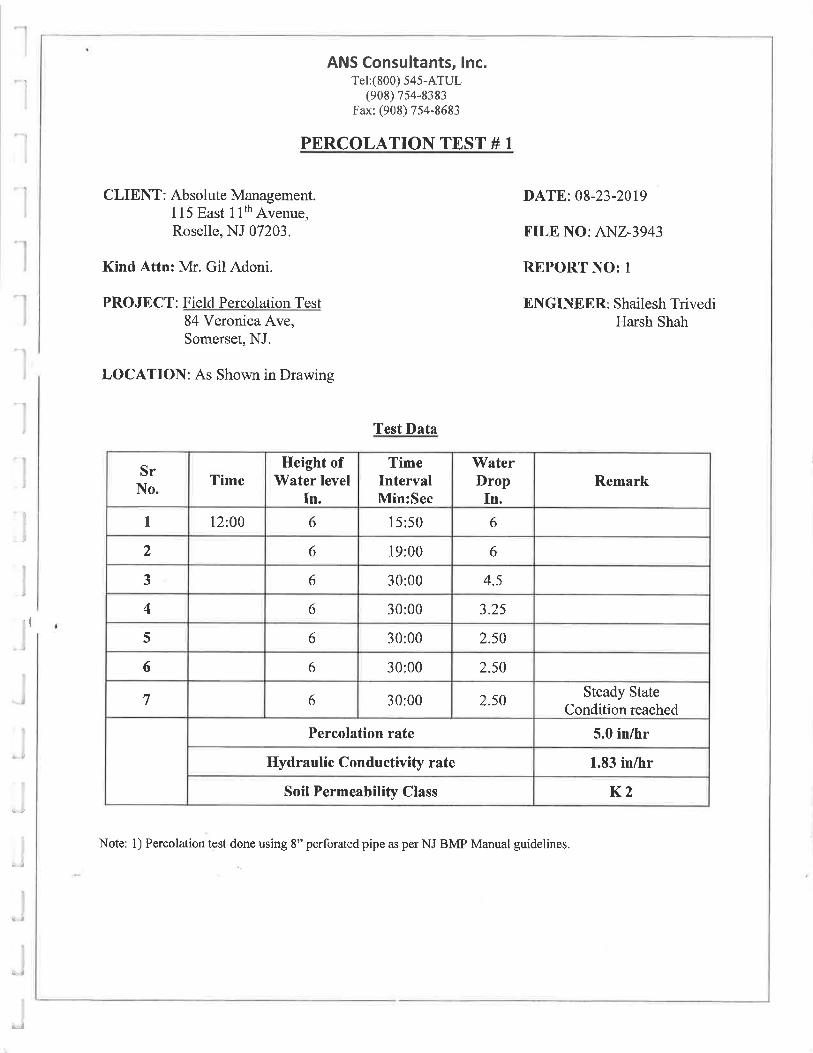
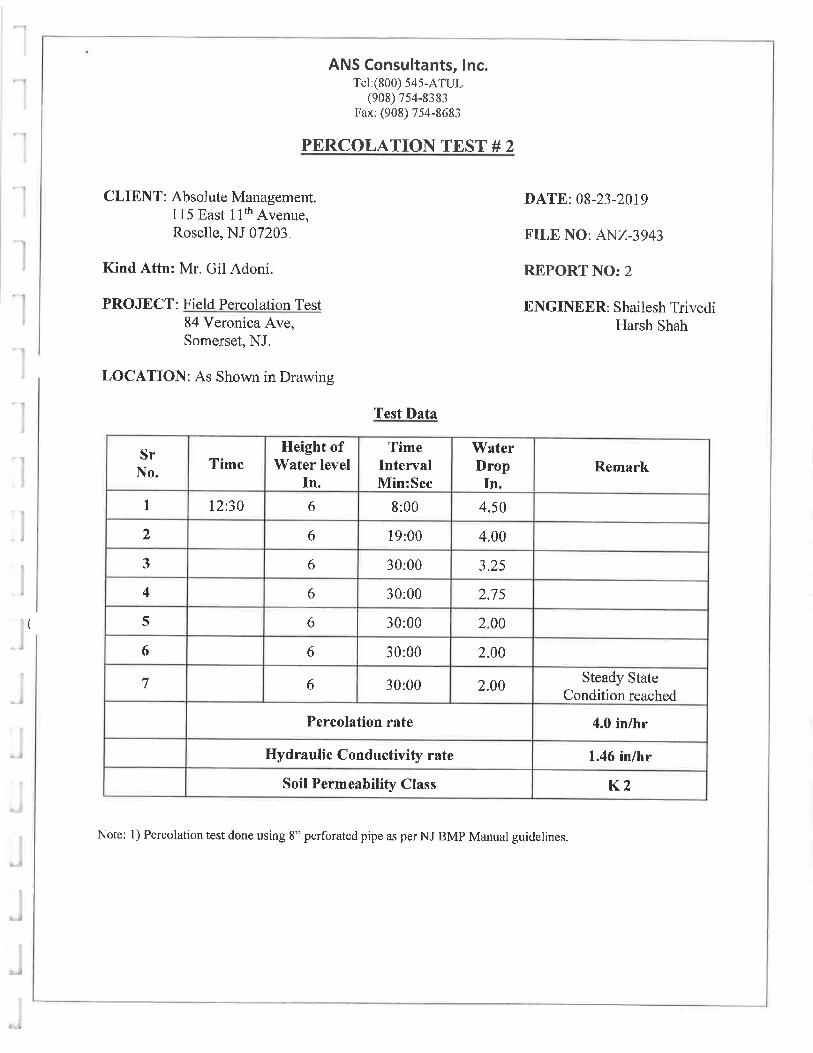
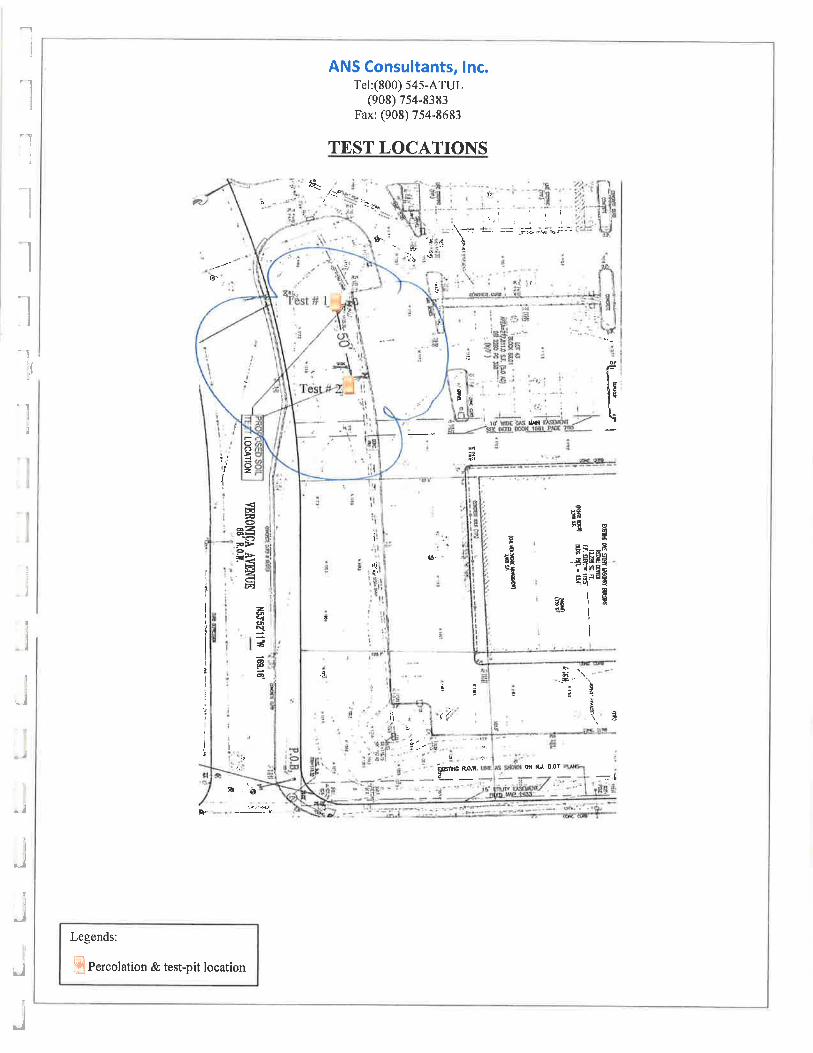
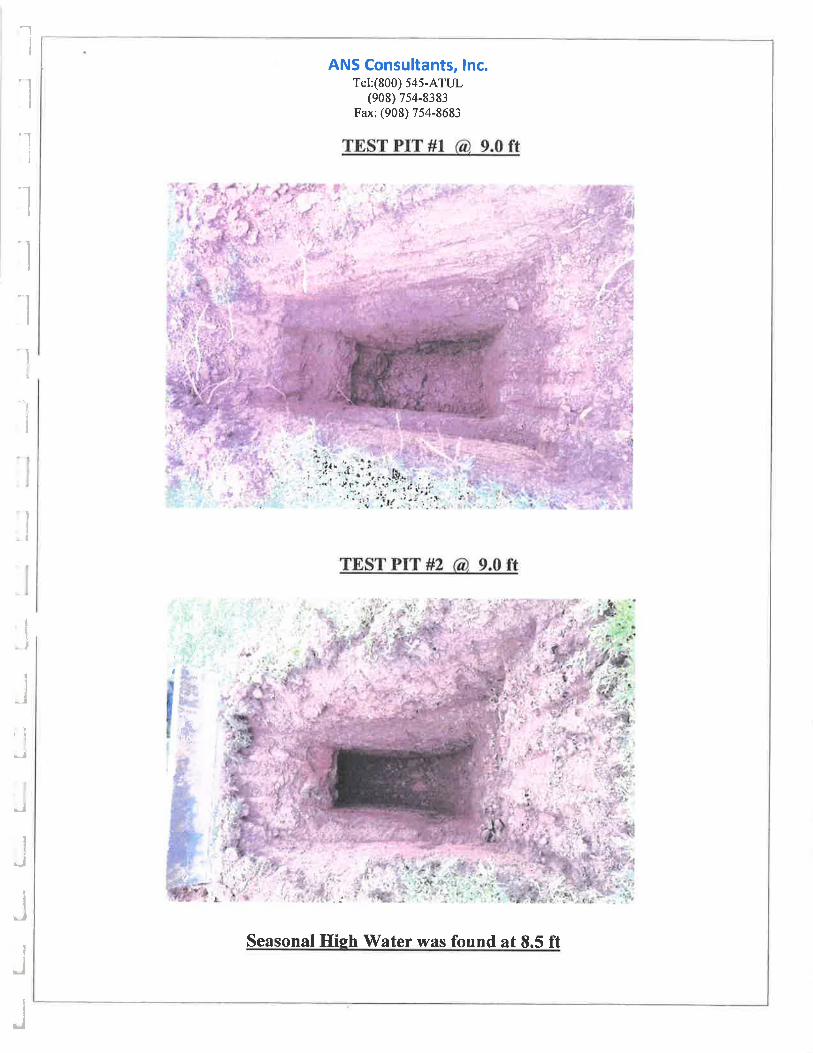
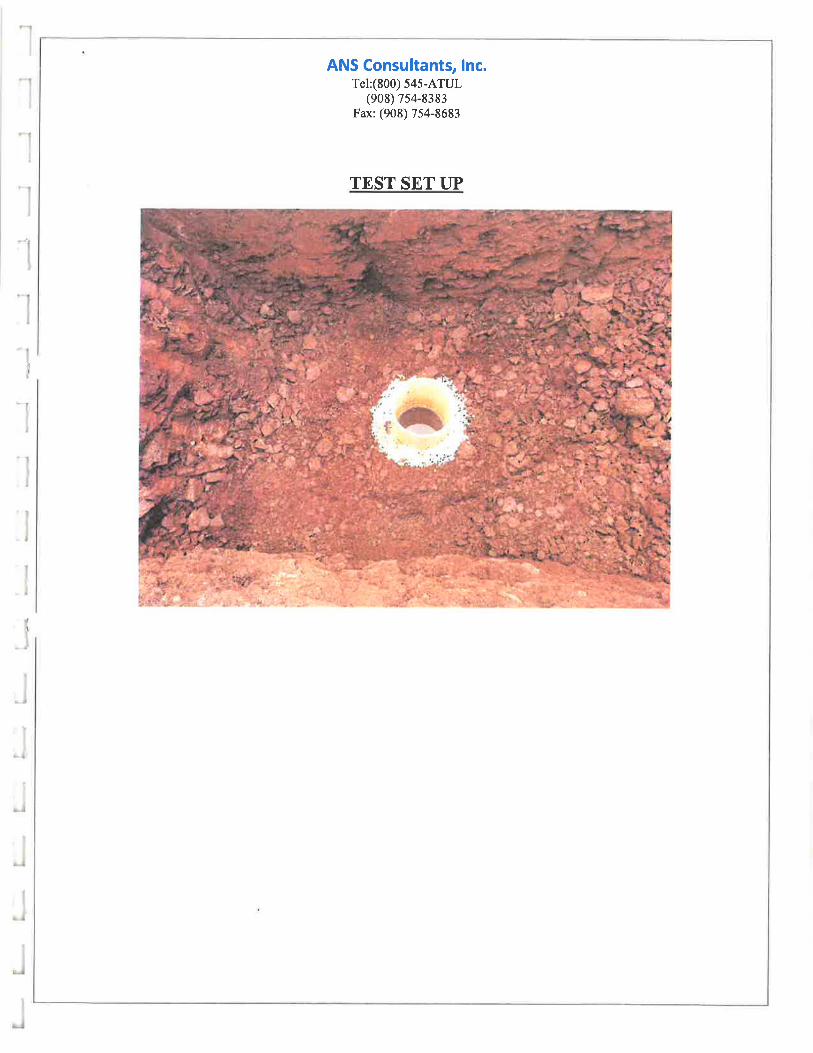
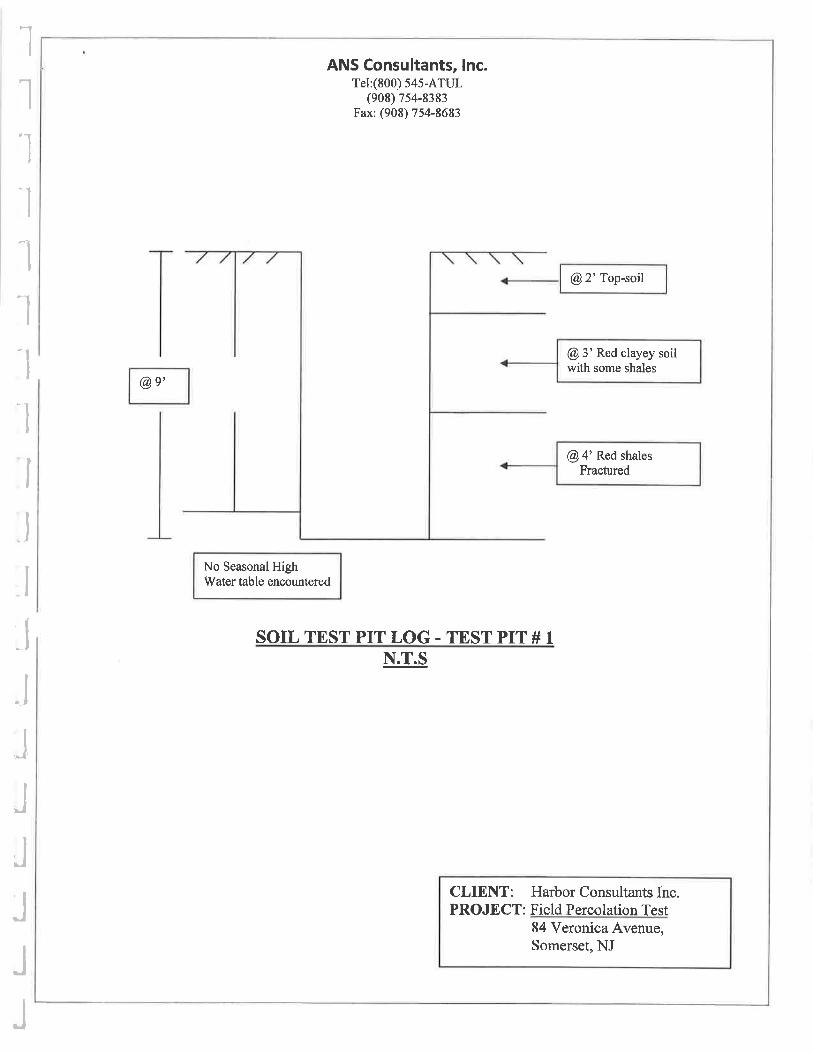
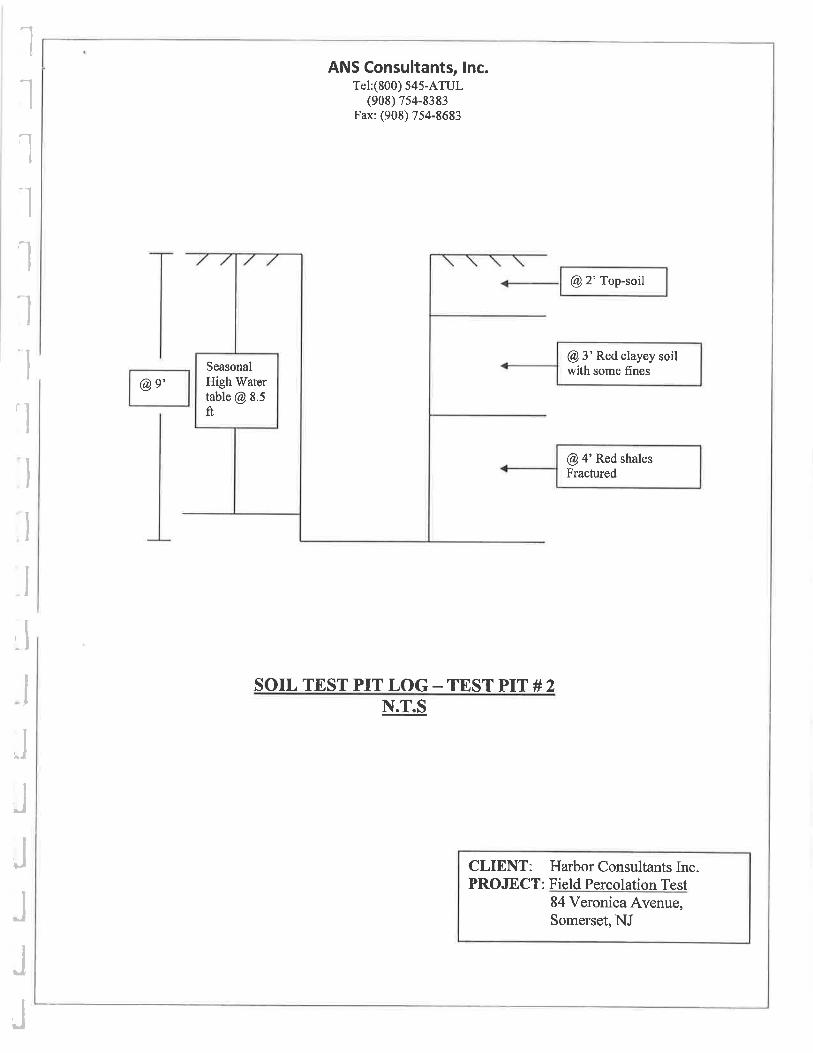
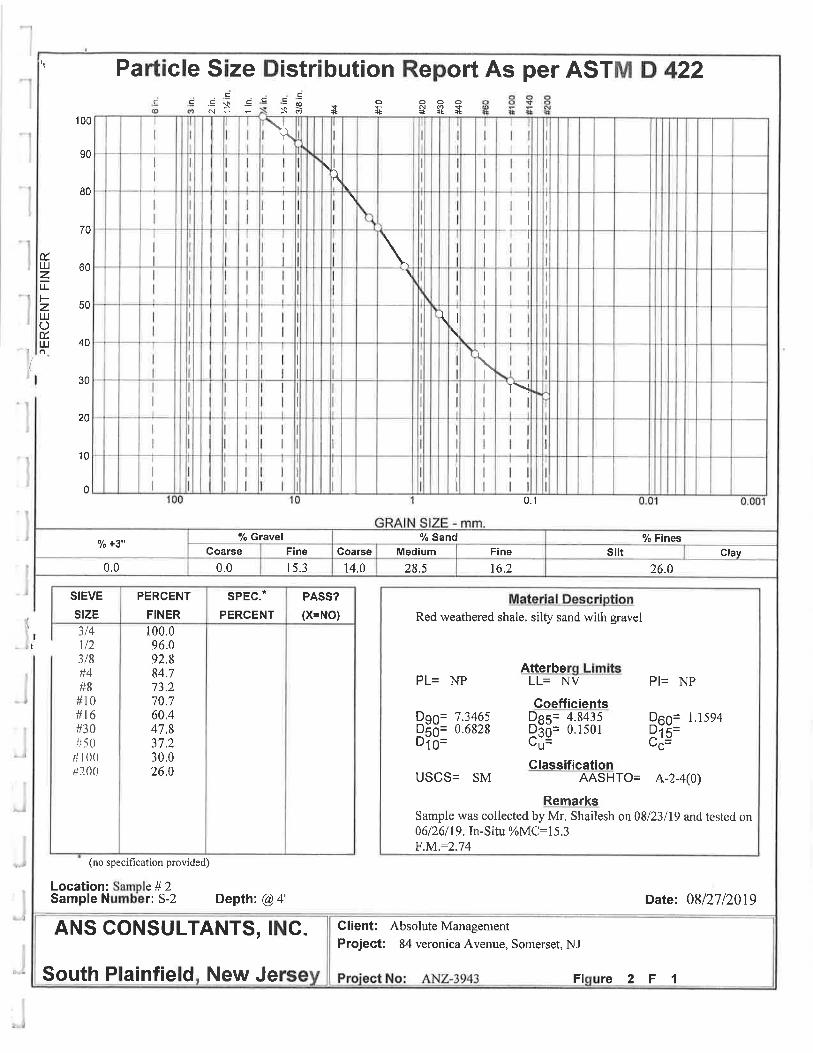
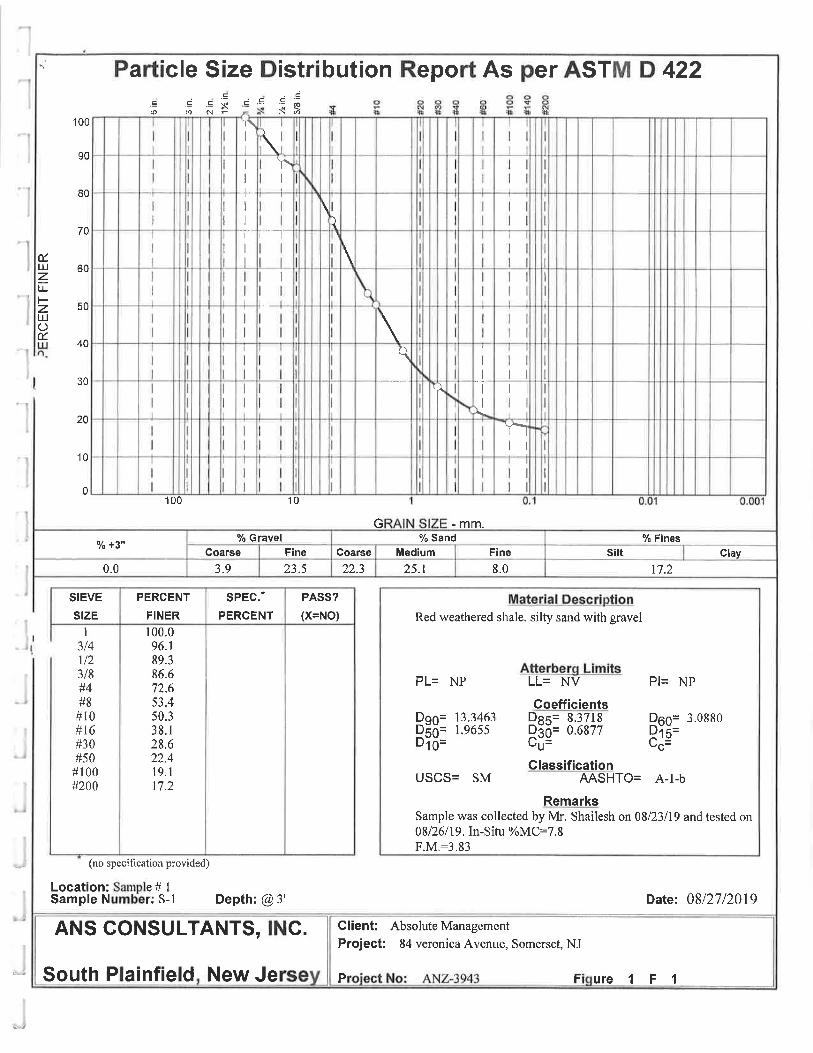
APPENDIX E
DRCC NSPS SPREADSHEET
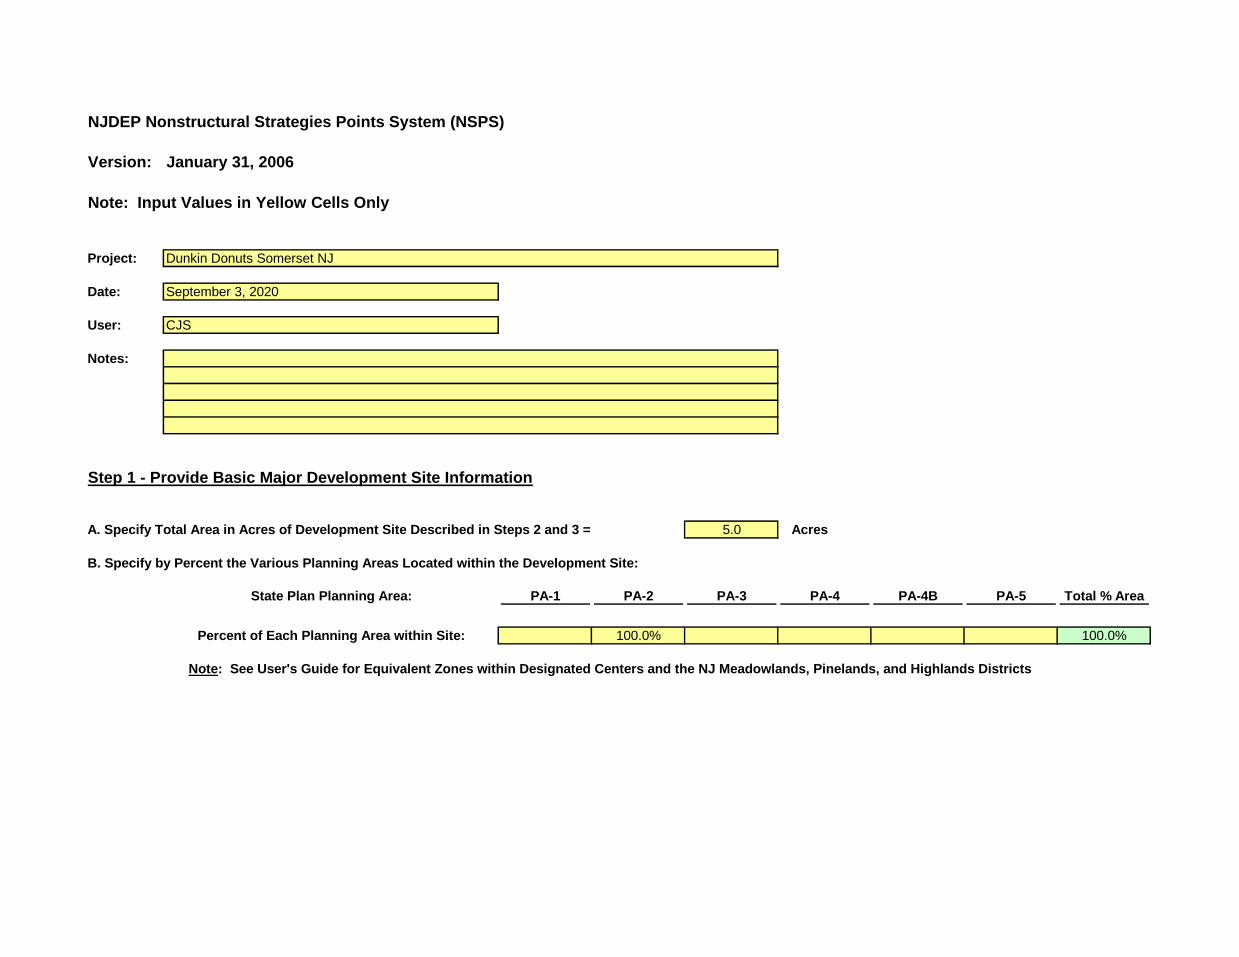
NJDEP Nonstructural Strategies Points System (NSPS)
Version: January 31, 2006
Note: Input Values in Yellow Cells Only
Project:
Date: September 3, 2020
User: CJS
Notes:
Step 1 - Provide Basic Major Development Site Information
A. Specify Total Area in Acres of Development Site Described in Steps 2 and 3 = 5.0 Acres
B. Specify by Percent the Various Planning Areas Located within the Development Site:
State Plan Planning Area: PA-1 PA-2 PA-3 PA-4 PA-4B PA-5 Total % Area
Percent of Each Planning Area within Site: 100.0% 100.0%
Note: See User's Guide for Equivalent Zones within Designated Centers and the NJ Meadowlands, Pinelands, and Highlands Districts
Dunkin Donuts Somerset NJ
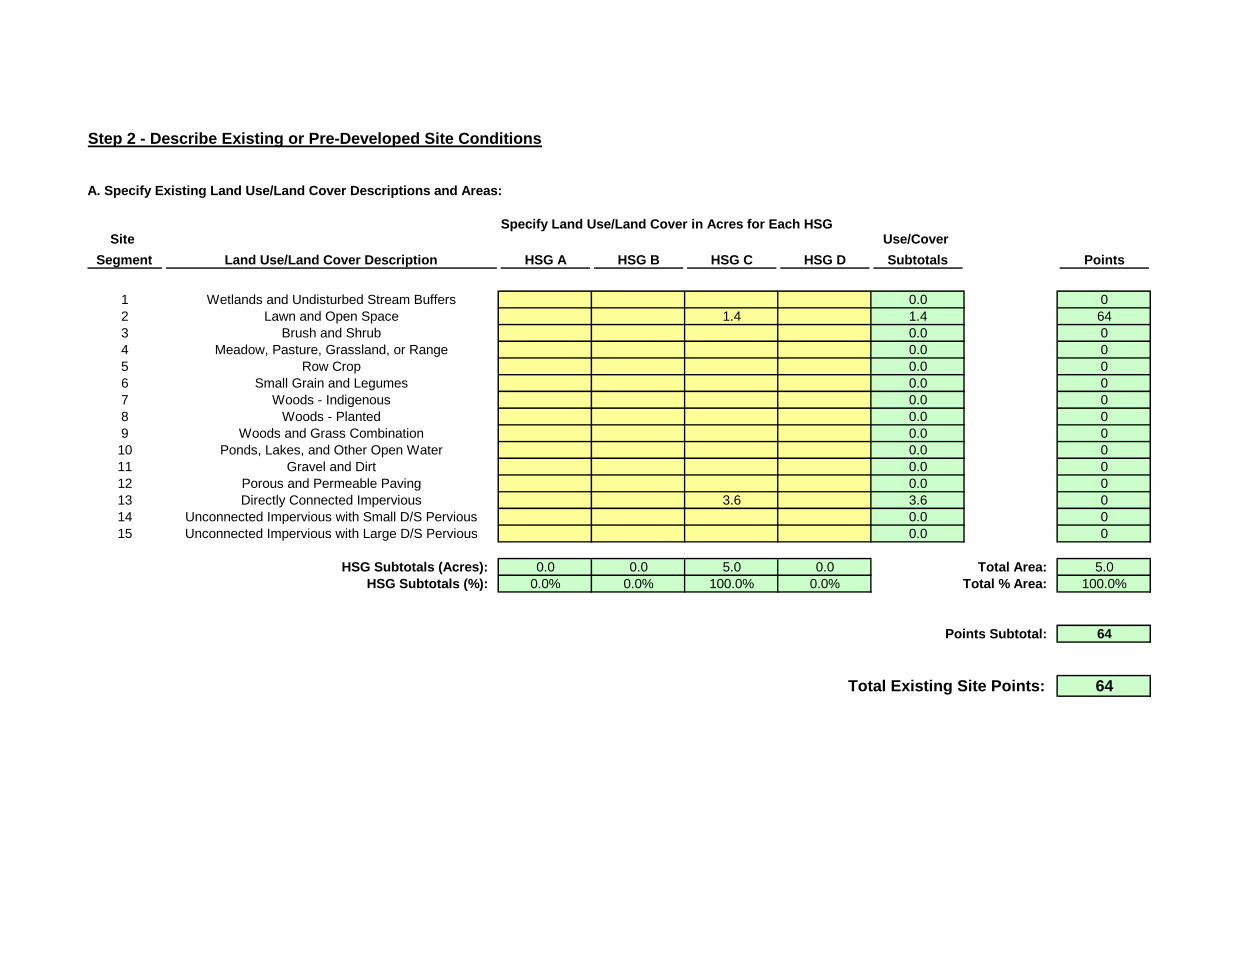
Step 2 - Describe Existing or Pre-Developed Site Conditions
A. Specify Existing Land Use/Land Cover Descriptions and Areas:
Specify Land Use/Land Cover in Acres for Each HSGSite
Segment Land Use/Land Cover Description HSG A HSG B HSG C HSG D
Use/Cover
Subtotals Points
1 Wetlands and Undisturbed Stream Buffers 0.0 0
2 Lawn and Open Space 1.4 1.4 64
3 Brush and Shrub 0.0 0
4 Meadow, Pasture, Grassland, or Range 0.0 0
5 Row Crop 0.0 0
6 Small Grain and Legumes 0.0 0
7 Woods - Indigenous 0.0 0
8 Woods - Planted 0.0 0
9 Woods and Grass Combination 0.0 0
10 Ponds, Lakes, and Other Open Water 0.0 0
11 Gravel and Dirt 0.0 0
12 Porous and Permeable Paving 0.0 0
13 Directly Connected Impervious 3.6 3.6 0
14 Unconnected Impervious with Small D/S Pervious 0.0 0
15 Unconnected Impervious with Large D/S Pervious 0.0 0
HSG Subtotals (Acres): 0.0 0.0 5.0 0.0 Total Area: 5.0
HSG Subtotals (%): 0.0% 0.0% 100.0% 0.0% Total % Area: 100.0%
Points Subtotal: 64
Total Existing Site Points: 64
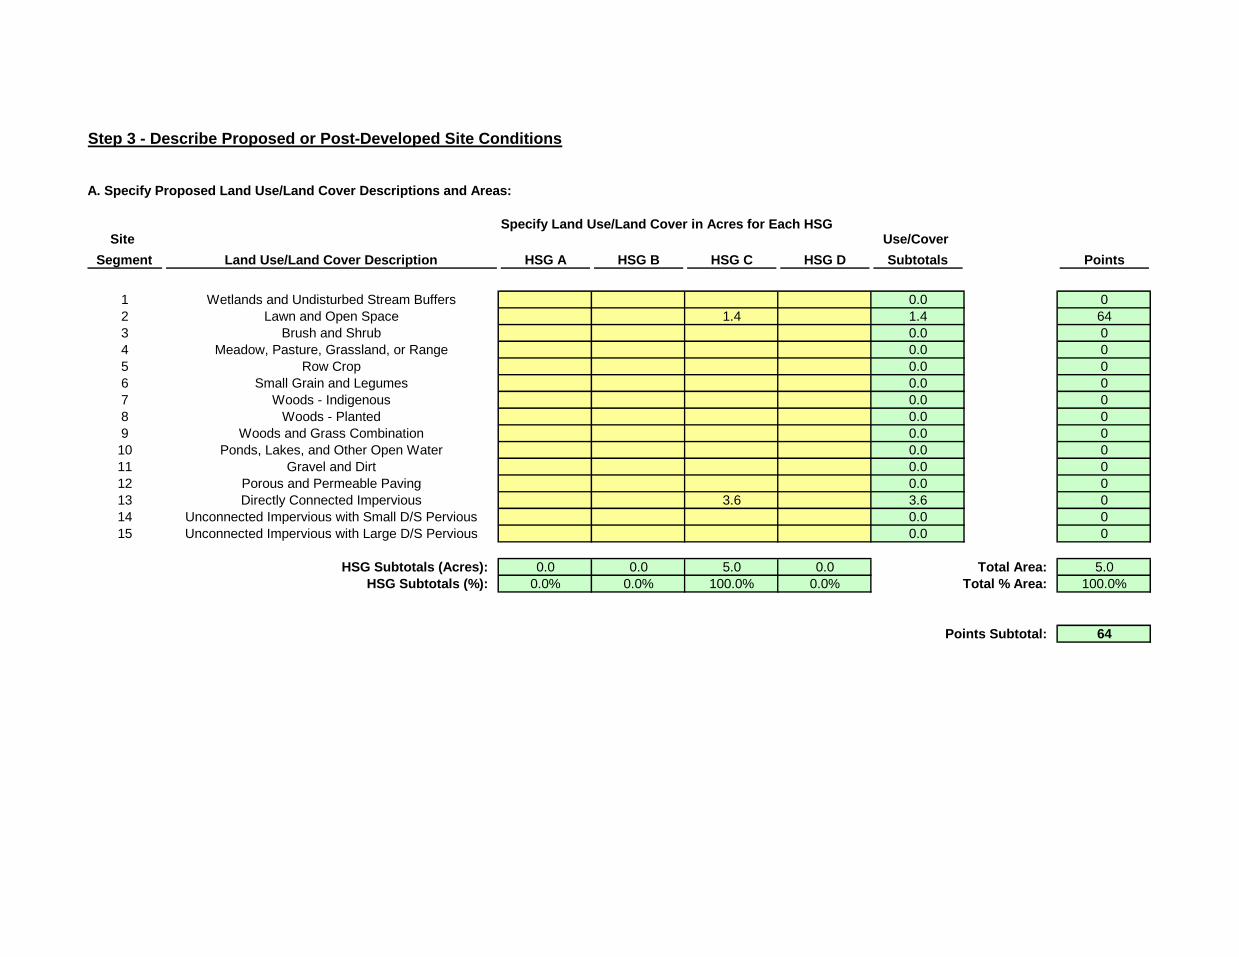
Step 3 - Describe Proposed or Post-Developed Site Conditions
A. Specify Proposed Land Use/Land Cover Descriptions and Areas:
Specify Land Use/Land Cover in Acres for Each HSGSite
Segment Land Use/Land Cover Description HSG A HSG B HSG C HSG D
Use/Cover
Subtotals Points
1 Wetlands and Undisturbed Stream Buffers 0.0 0
2 Lawn and Open Space 1.4 1.4 64
3 Brush and Shrub 0.0 0
4 Meadow, Pasture, Grassland, or Range 0.0 0
5 Row Crop 0.0 0
6 Small Grain and Legumes 0.0 0
7 Woods - Indigenous 0.0 0
8 Woods - Planted 0.0 0
9 Woods and Grass Combination 0.0 0
10 Ponds, Lakes, and Other Open Water 0.0 0
11 Gravel and Dirt 0.0 0
12 Porous and Permeable Paving 0.0 0
13 Directly Connected Impervious 3.6 3.6 0
14 Unconnected Impervious with Small D/S Pervious 0.0 0
15 Unconnected Impervious with Large D/S Pervious 0.0 0
HSG Subtotals (Acres): 0.0 0.0 5.0 0.0 Total Area: 5.0
HSG Subtotals (%): 0.0% 0.0% 100.0% 0.0% Total % Area: 100.0%
Points Subtotal: 64
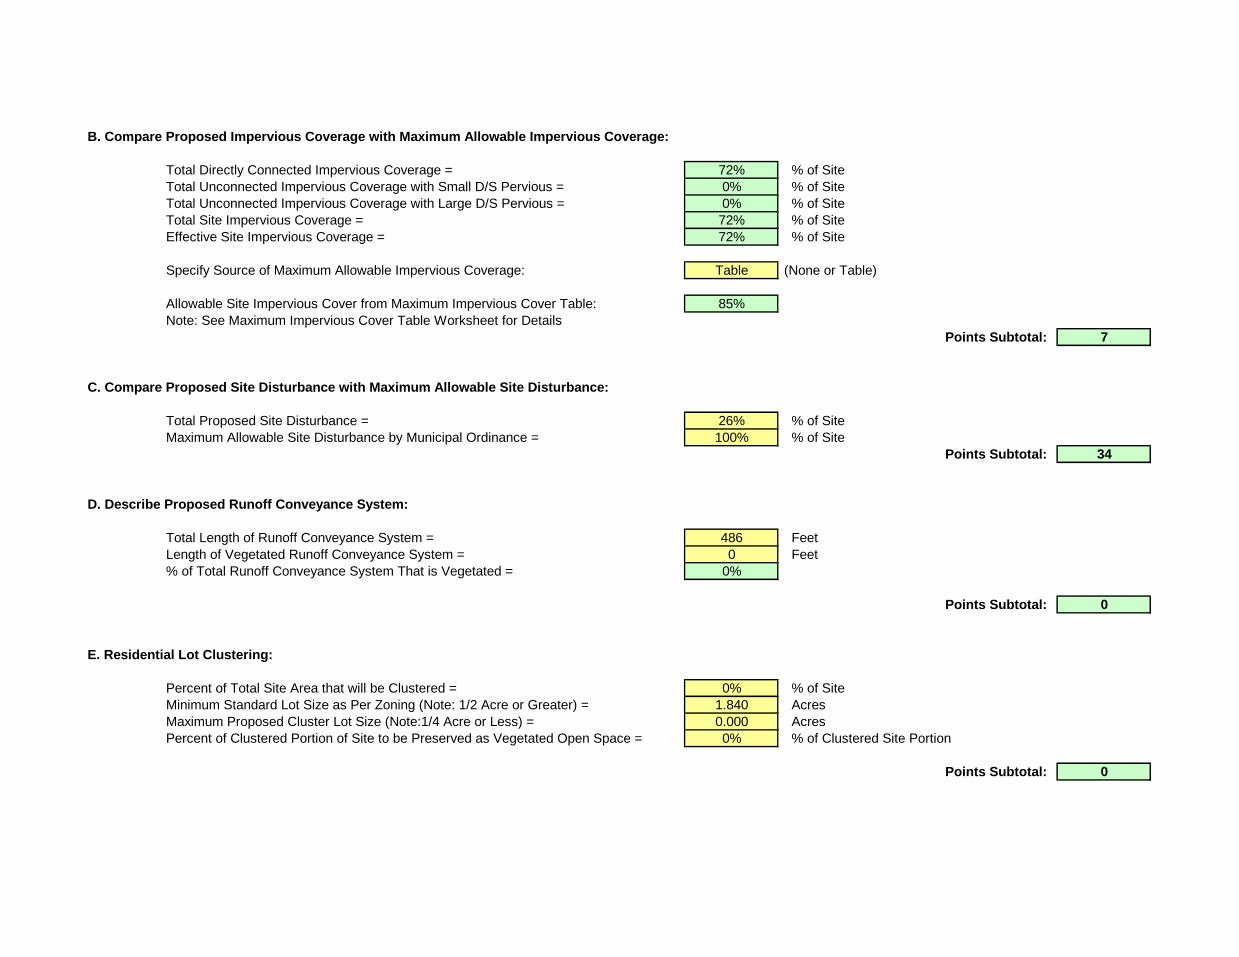
B. Compare Proposed Impervious Coverage with Maximum Allowable Impervious Coverage:
Total Directly Connected Impervious Coverage = 72% % of Site
Total Unconnected Impervious Coverage with Small D/S Pervious = 0% % of Site
Total Unconnected Impervious Coverage with Large D/S Pervious = 0% % of Site
Total Site Impervious Coverage = 72% % of Site
Effective Site Impervious Coverage = 72% % of Site
Table (None or Table)
85%
Points Subtotal: 7
C. Compare Proposed Site Disturbance with Maximum Allowable Site Disturbance:
Total Proposed Site Disturbance = 26% % of Site
Maximum Allowable Site Disturbance by Municipal Ordinance = 100% % of Site
Points Subtotal: 34
D. Describe Proposed Runoff Conveyance System:
Total Length of Runoff Conveyance System = 486 Feet
Length of Vegetated Runoff Conveyance System = 0 Feet
% of Total Runoff Conveyance System That is Vegetated = 0%
Points Subtotal: 0
E. Residential Lot Clustering:
Percent of Total Site Area that will be Clustered = 0% % of Site
Minimum Standard Lot Size as Per Zoning (Note: 1/2 Acre or Greater) = 1.840 Acres
Maximum Proposed Cluster Lot Size (Note:1/4 Acre or Less) = 0.000 Acres
Percent of Clustered Portion of Site to be Preserved as Vegetated Open Space = 0% % of Clustered Site Portion
Points Subtotal: 0
Specify Source of Maximum Allowable Impervious Coverage:
Allowable Site Impervious Cover from Maximum Impervious Cover Table:
Note: See Maximum Impervious Cover Table Worksheet for Details
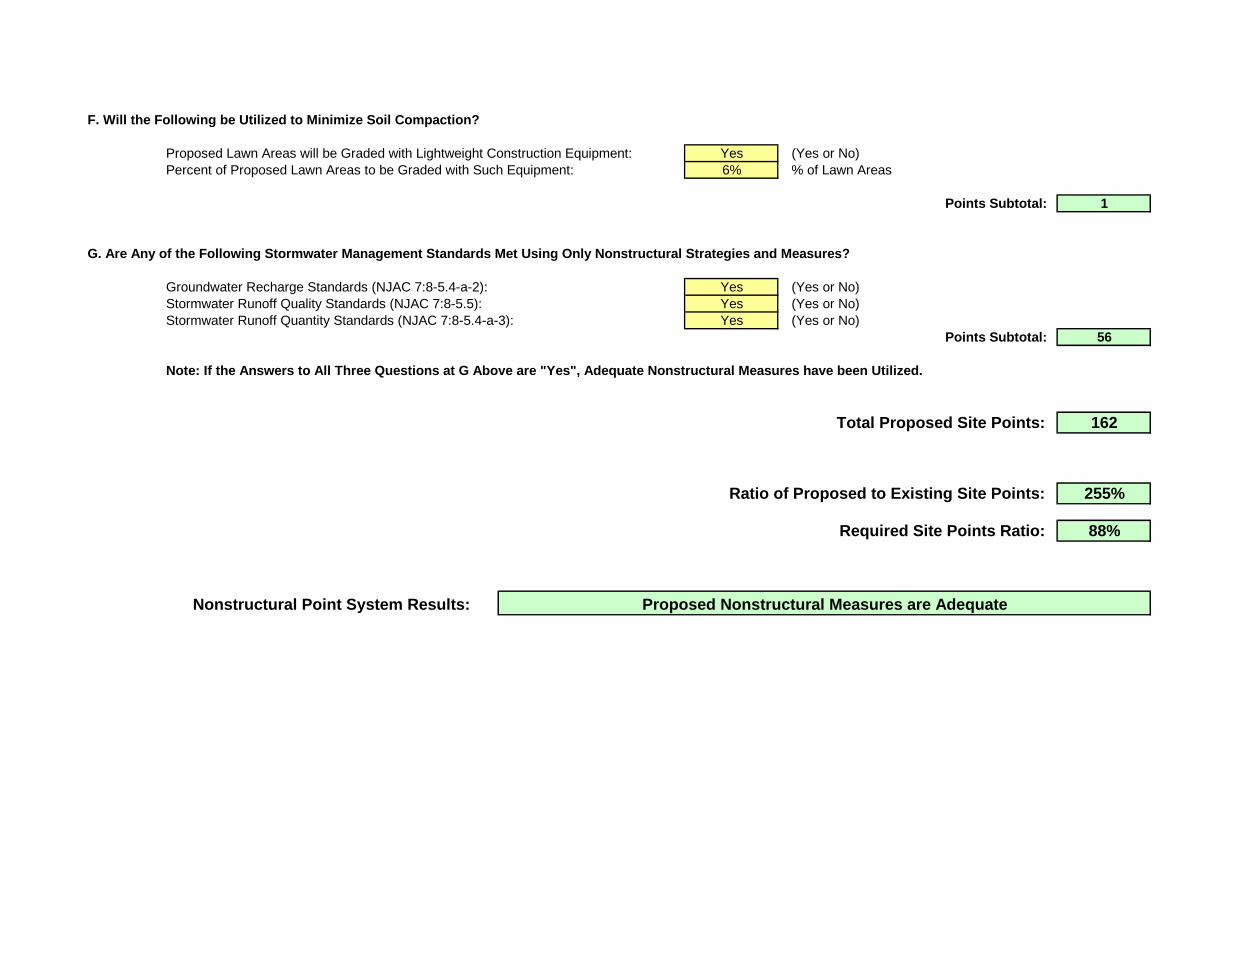
F. Will the Following be Utilized to Minimize Soil Compaction?
Proposed Lawn Areas will be Graded with Lightweight Construction Equipment: Yes (Yes or No)
Percent of Proposed Lawn Areas to be Graded with Such Equipment: 6% % of Lawn Areas
Points Subtotal: 1
G. Are Any of the Following Stormwater Management Standards Met Using Only Nonstructural Strategies and Measures?
Groundwater Recharge Standards (NJAC 7:8-5.4-a-2): Yes (Yes or No)
Stormwater Runoff Quality Standards (NJAC 7:8-5.5): Yes (Yes or No)
Stormwater Runoff Quantity Standards (NJAC 7:8-5.4-a-3): Yes (Yes or No)
Points Subtotal: 56
Note: If the Answers to All Three Questions at G Above are "Yes", Adequate Nonstructural Measures have been Utilized.
Total Proposed Site Points: 162
Ratio of Proposed to Existing Site Points: 255%
Required Site Points Ratio: 88%
Nonstructural Point System Results: Proposed Nonstructural Measures are Adequate
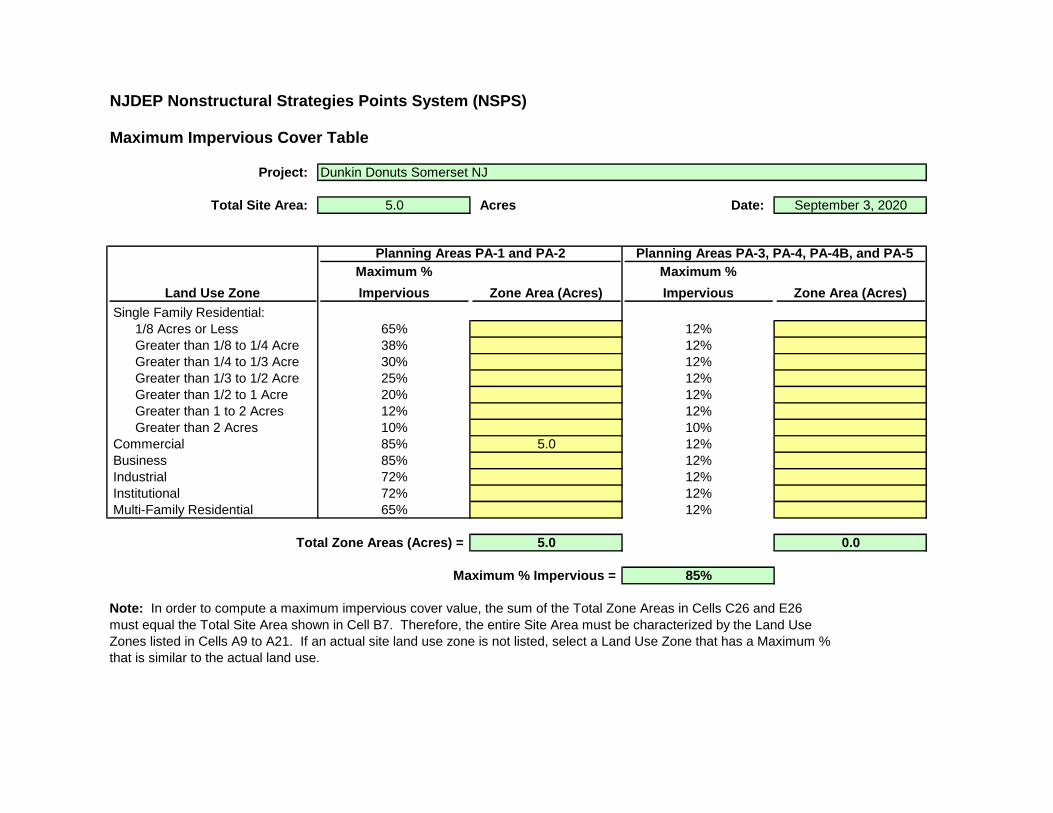
NJDEP Nonstructural Strategies Points System (NSPS)
Maximum Impervious Cover Table
Project:
Total Site Area: 5.0 Acres Date: September 3, 2020
Land Use Zone
Maximum %
Impervious Zone Area (Acres)
Maximum %
Impervious Zone Area (Acres)
Single Family Residential:
1/8 Acres or Less 65% 12%
Greater than 1/8 to 1/4 Acre 38% 12%
Greater than 1/4 to 1/3 Acre 30% 12%
Greater than 1/3 to 1/2 Acre 25% 12%
Greater than 1/2 to 1 Acre 20% 12%
Greater than 1 to 2 Acres 12% 12%
Greater than 2 Acres 10% 10%
Commercial 85% 5.0 12%
Business 85% 12%
Industrial 72% 12%
Institutional 72% 12%
Multi-Family Residential 65% 12%
Total Zone Areas (Acres) = 5.0 0.0
Maximum % Impervious = 85%
Note: In order to compute a maximum impervious cover value, the sum of the Total Zone Areas in Cells C26 and E26
must equal the Total Site Area shown in Cell B7. Therefore, the entire Site Area must be characterized by the Land Use
Zones listed in Cells A9 to A21. If an actual site land use zone is not listed, select a Land Use Zone that has a Maximum %
that is similar to the actual land use.
Planning Areas PA-1 and PA-2 Planning Areas PA-3, PA-4, PA-4B, and PA-5
Dunkin Donuts Somerset NJ
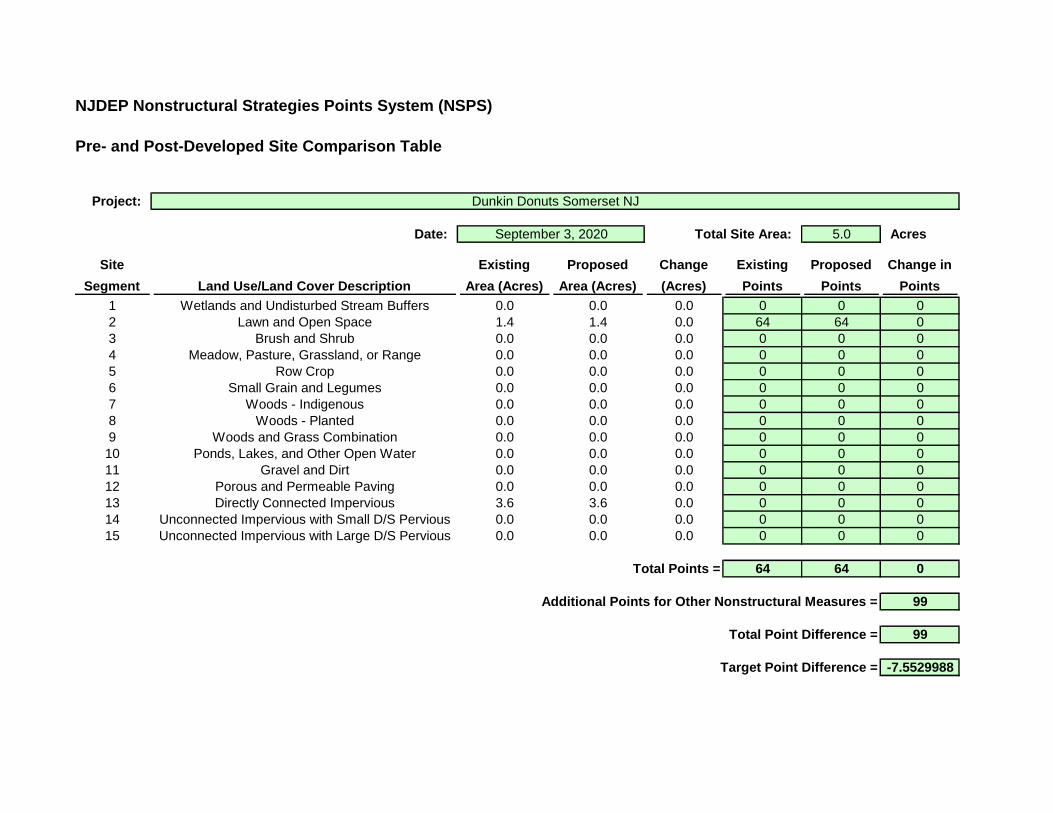
NJDEP Nonstructural Strategies Points System (NSPS)
Pre- and Post-Developed Site Comparison Table
Project:
Date: Total Site Area: 5.0 Acres
Site
Segment Land Use/Land Cover Description
Existing
Area (Acres)
Proposed
Area (Acres)
Change
(Acres)
Existing
Points
Proposed
Points
Change in
Points
1 Wetlands and Undisturbed Stream Buffers 0.0 0.0 0.0 0 0 0
2 Lawn and Open Space 1.4 1.4 0.0 64 64 0
3 Brush and Shrub 0.0 0.0 0.0 0 0 0
4 Meadow, Pasture, Grassland, or Range 0.0 0.0 0.0 0 0 0
5 Row Crop 0.0 0.0 0.0 0 0 0
6 Small Grain and Legumes 0.0 0.0 0.0 0 0 0
7 Woods - Indigenous 0.0 0.0 0.0 0 0 0
8 Woods - Planted 0.0 0.0 0.0 0 0 0
9 Woods and Grass Combination 0.0 0.0 0.0 0 0 0
10 Ponds, Lakes, and Other Open Water 0.0 0.0 0.0 0 0 0
11 Gravel and Dirt 0.0 0.0 0.0 0 0 0
12 Porous and Permeable Paving 0.0 0.0 0.0 0 0 0
13 Directly Connected Impervious 3.6 3.6 0.0 0 0 0
14 Unconnected Impervious with Small D/S Pervious 0.0 0.0 0.0 0 0 0
15 Unconnected Impervious with Large D/S Pervious 0.0 0.0 0.0 0 0 0
Total Points = 64 64 0
Additional Points for Other Nonstructural Measures = 99
Total Point Difference = 99
Target Point Difference = -7.5529988
September 3, 2020
Dunkin Donuts Somerset NJ
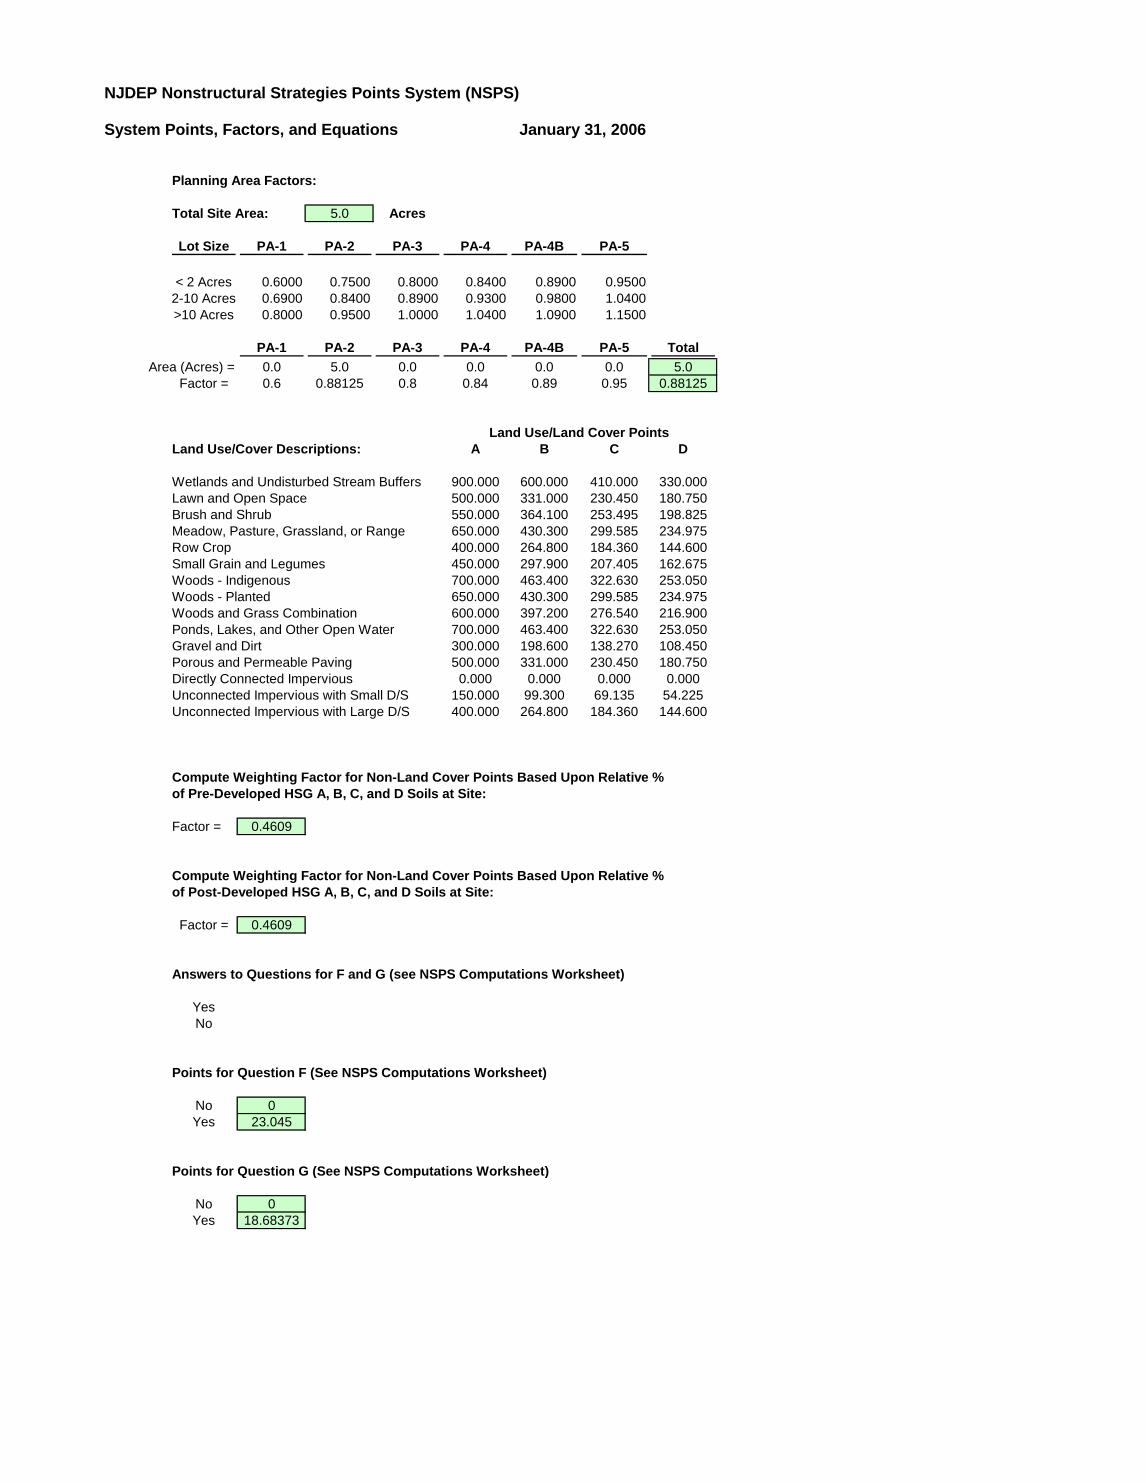
NJDEP Nonstructural Strategies Points System (NSPS)
System Points, Factors, and Equations
Planning Area Factors:
5.0 Acres
Lot Size PA-1 PA-2 PA-3 PA-4 PA-4B PA-5
< 2 Acres 0.6000 0.7500 0.8000 0.8400 0.8900 0.9500
2-10 Acres 0.6900 0.8400 0.8900 0.9300 0.9800 1.0400
>10 Acres 0.8000 0.9500 1.0000 1.0400 1.0900 1.1500
PA-1 PA-2 PA-3 PA-4 PA-4B PA-5 Total
Area (Acres) = 0.0 5.0 0.0 0.0 0.0 0.0 5.0
Factor = 0.6 0.88125 0.8 0.84 0.89 0.95 0.88125
Land Use/Cover Descriptions: A B C D
Wetlands and Undisturbed Stream Buffers 900.000 600.000 410.000 330.000
Lawn and Open Space 500.000 331.000 230.450 180.750
Brush and Shrub 550.000 364.100 253.495 198.825
Meadow, Pasture, Grassland, or Range 650.000 430.300 299.585 234.975
Row Crop 400.000 264.800 184.360 144.600
Small Grain and Legumes 450.000 297.900 207.405 162.675
Woods - Indigenous 700.000 463.400 322.630 253.050
Woods - Planted 650.000 430.300 299.585 234.975
Woods and Grass Combination 600.000 397.200 276.540 216.900
Ponds, Lakes, and Other Open Water 700.000 463.400 322.630 253.050
Gravel and Dirt 300.000 198.600 138.270 108.450
Porous and Permeable Paving 500.000 331.000 230.450 180.750
Directly Connected Impervious 0.000 0.000 0.000 0.000
Unconnected Impervious with Small D/S 150.000 99.300 69.135 54.225
Unconnected Impervious with Large D/S 400.000 264.800 184.360 144.600
Compute Weighting Factor for Non-Land Cover Points Based Upon Relative %
of Pre-Developed HSG A, B, C, and D Soils at Site:
Factor = 0.4609
Compute Weighting Factor for Non-Land Cover Points Based Upon Relative %
of Post-Developed HSG A, B, C, and D Soils at Site:
Factor = 0.4609
Answers to Questions for F and G (see NSPS Computations Worksheet)
Yes
No
Points for Question F (See NSPS Computations Worksheet)
No 0
Yes 23.045
Points for Question G (See NSPS Computations Worksheet)
No 0
Yes 18.68373
January 31, 2006
Total Site Area:
Land Use/Land Cover Points
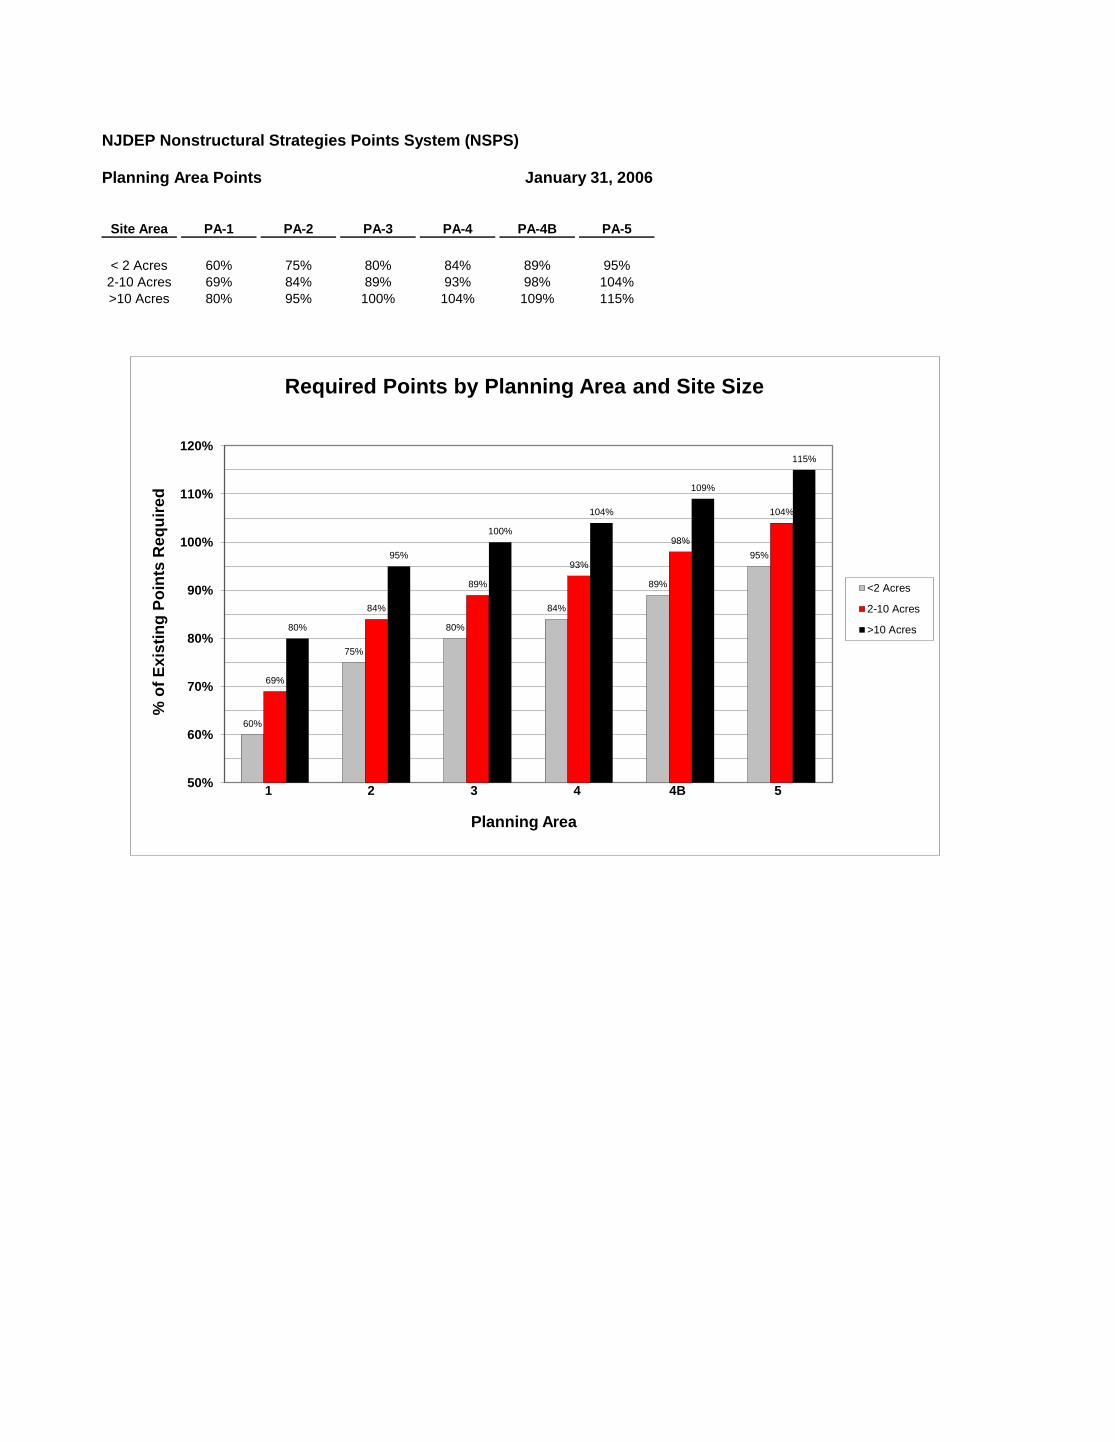
NJDEP Nonstructural Strategies Points System (NSPS)
Planning Area Points
Site Area PA-1 PA-2 PA-3 PA-4 PA-4B PA-5
< 2 Acres 60% 75% 80% 84% 89% 95%
2-10 Acres 69% 84% 89% 93% 98% 104%
>10 Acres 80% 95% 100% 104% 109% 115%
January 31, 2006
60%
75%
80%
84%
89%
95%
69%
84%
89%
93%
98%
104%
80%
95%
100%
104%
109%
115%
50%
60%
70%
80%
90%
100%
110%
120%
% o
f E
xis
tin
g P
oin
ts R
eq
uir
ed
Planning Area
Required Points by Planning Area and Site Size
<2 Acres
2-10 Acres
>10 Acres
1 2 3 4 54B
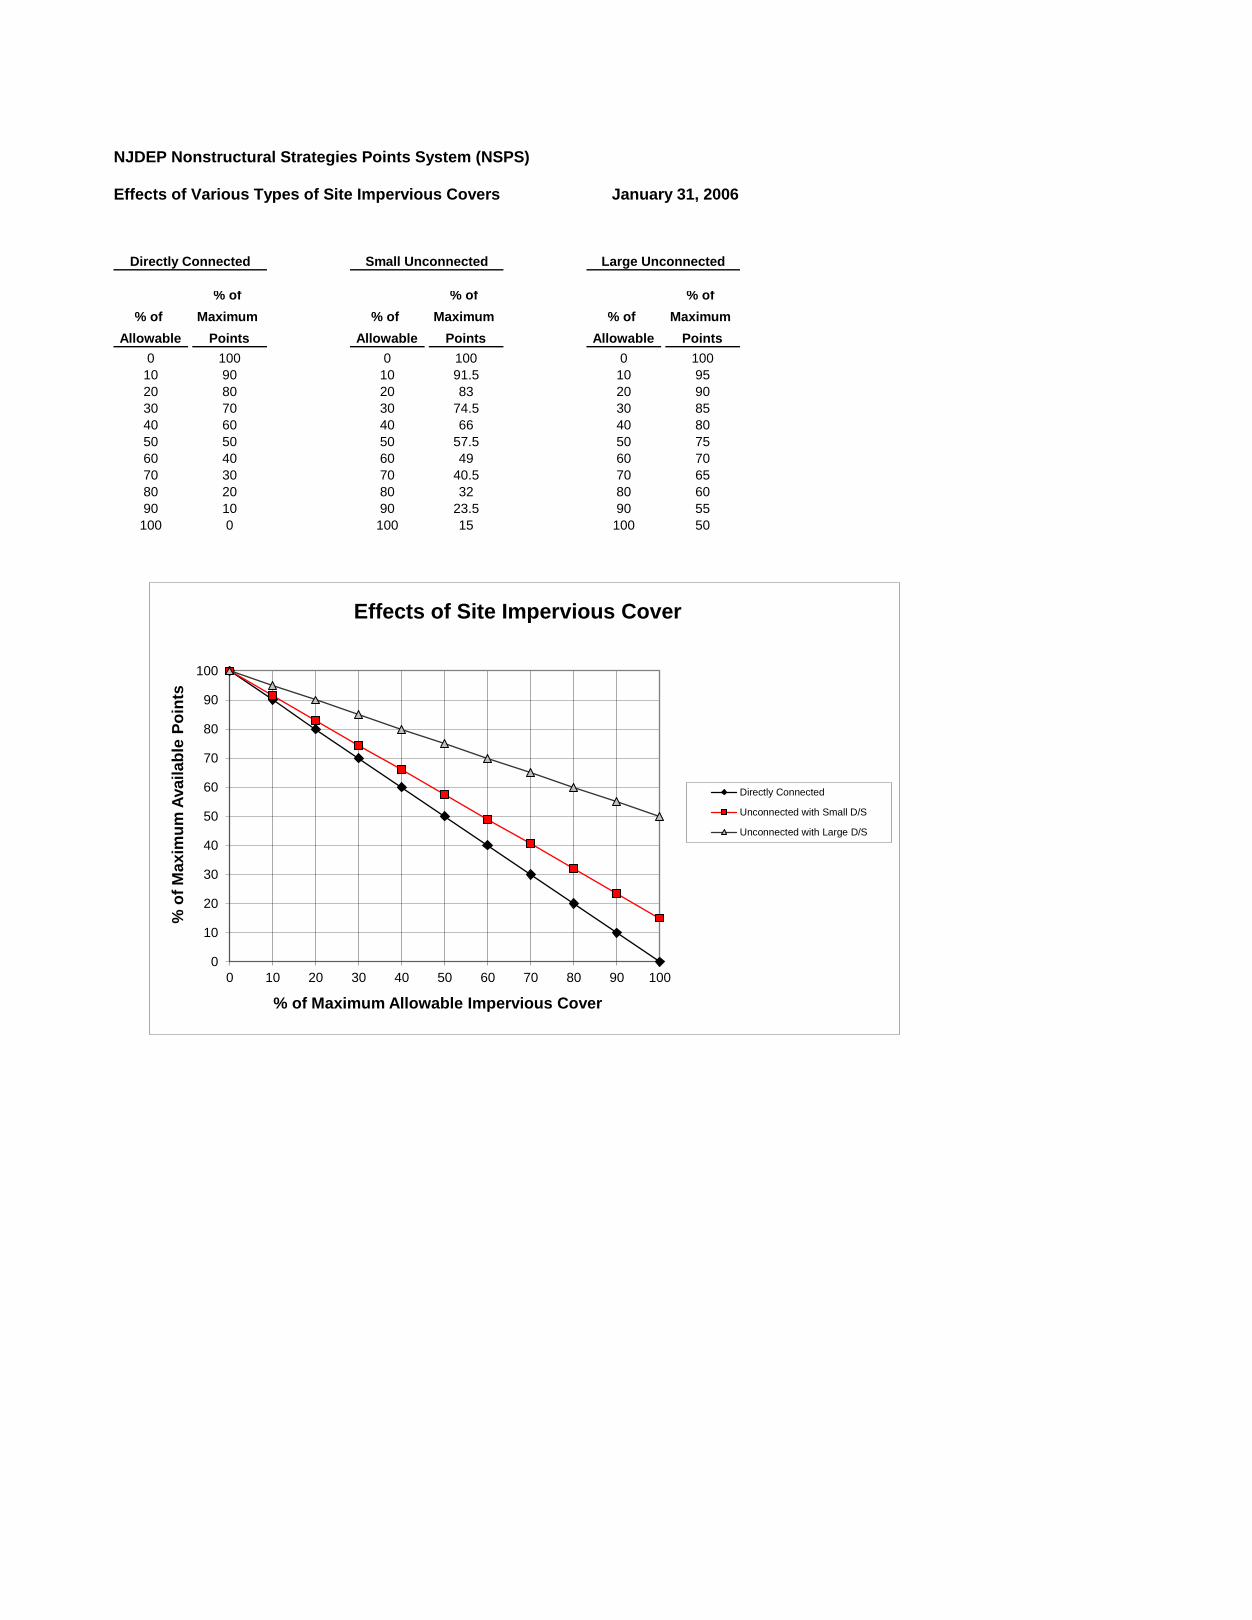
NJDEP Nonstructural Strategies Points System (NSPS)
Effects of Various Types of Site Impervious Covers
% of
Allowable
% of
Maximum
Points
% of
Allowable
% of
Maximum
Points
% of
Allowable
% of
Maximum
Points
0 100 0 100 0 100
10 90 10 91.5 10 95
20 80 20 83 20 90
30 70 30 74.5 30 85
40 60 40 66 40 80
50 50 50 57.5 50 75
60 40 60 49 60 70
70 30 70 40.5 70 65
80 20 80 32 80 60
90 10 90 23.5 90 55
100 0 100 15 100 50
Directly Connected Small Unconnected Large Unconnected
January 31, 2006
0
10
20
30
40
50
60
70
80
90
100
0 10 20 30 40 50 60 70 80 90 100
% o
f M
axim
um
Availab
le P
oin
ts
% of Maximum Allowable Impervious Cover
Effects of Site Impervious Cover
Directly Connected
Unconnected with Small D/S
Unconnected with Large D/S
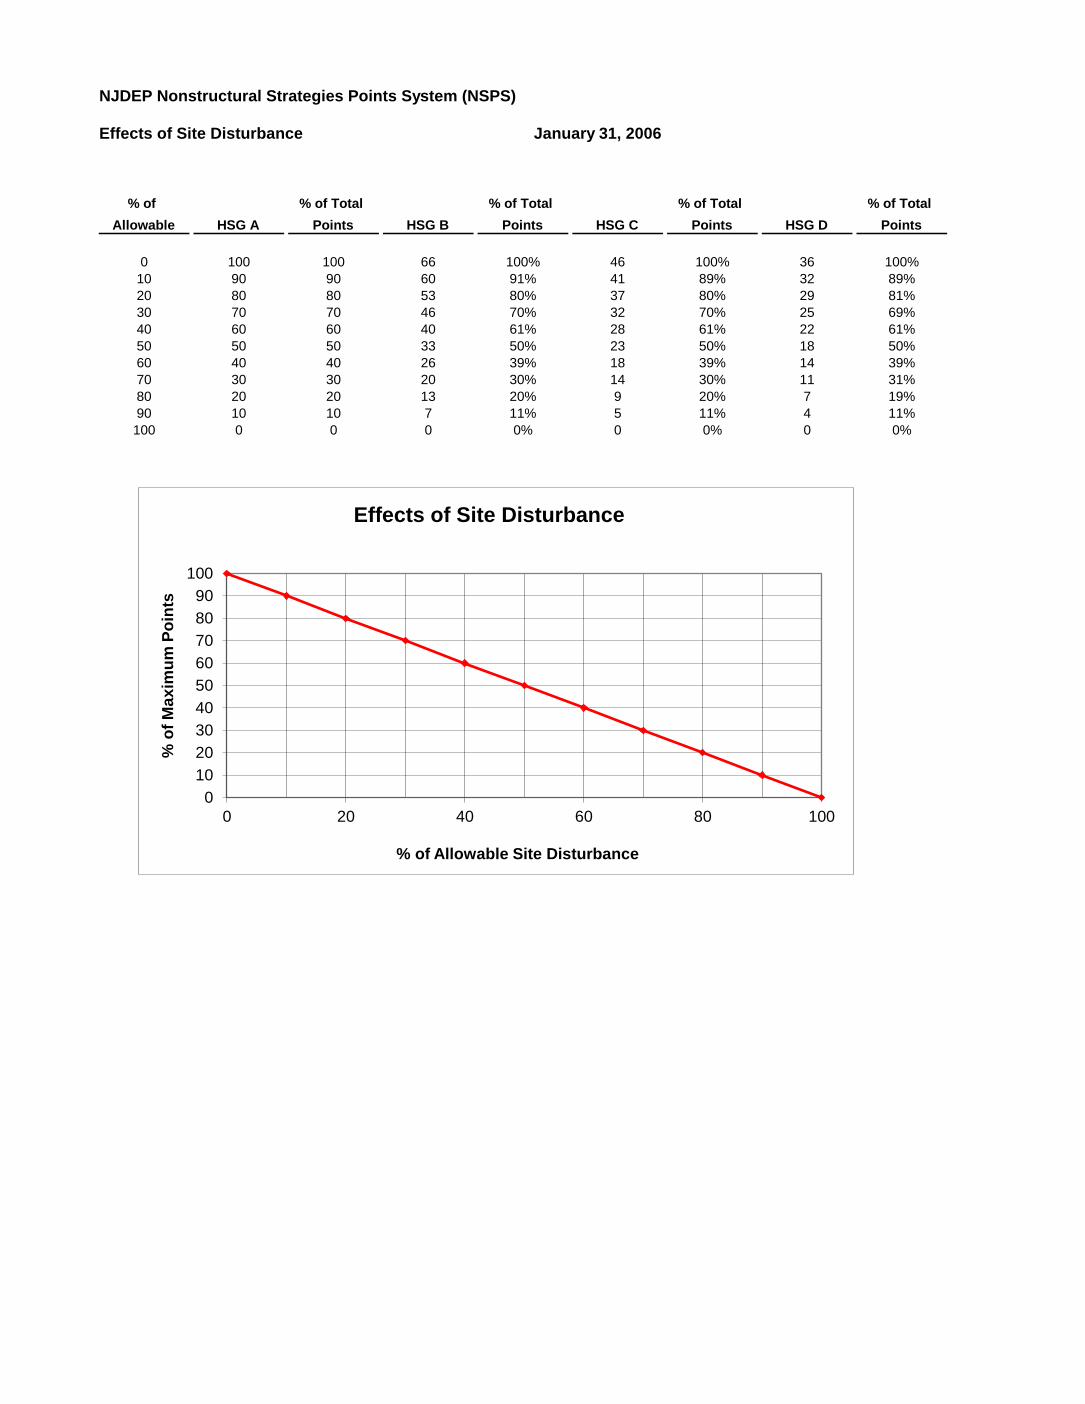
NJDEP Nonstructural Strategies Points System (NSPS)
Effects of Site Disturbance
% of
Allowable HSG A
% of Total
Points HSG B
% of Total
Points HSG C
% of Total
Points HSG D
% of Total
Points
0 100 100 66 100% 46 100% 36 100%
10 90 90 60 91% 41 89% 32 89%
20 80 80 53 80% 37 80% 29 81%
30 70 70 46 70% 32 70% 25 69%
40 60 60 40 61% 28 61% 22 61%
50 50 50 33 50% 23 50% 18 50%
60 40 40 26 39% 18 39% 14 39%
70 30 30 20 30% 14 30% 11 31%
80 20 20 13 20% 9 20% 7 19%
90 10 10 7 11% 5 11% 4 11%
100 0 0 0 0% 0 0% 0 0%
January 31, 2006
0
10
20
30
40
50
60
70
80
90
100
0 20 40 60 80 100
% o
f M
ax
imu
m P
oin
ts
% of Allowable Site Disturbance
Effects of Site Disturbance
APPENDIX F
DRAINAGE AREA MAPS
INVENTORY
EXISTING DRAINAGE AREA MAP
PROPOSED DRAINAGE AREA MAP
PROPOSED INLET DRAINAGE AREA MAP
WATER QUALITY REQUIREMENTS MAP
PROPOSED WATER QUALITY MAP
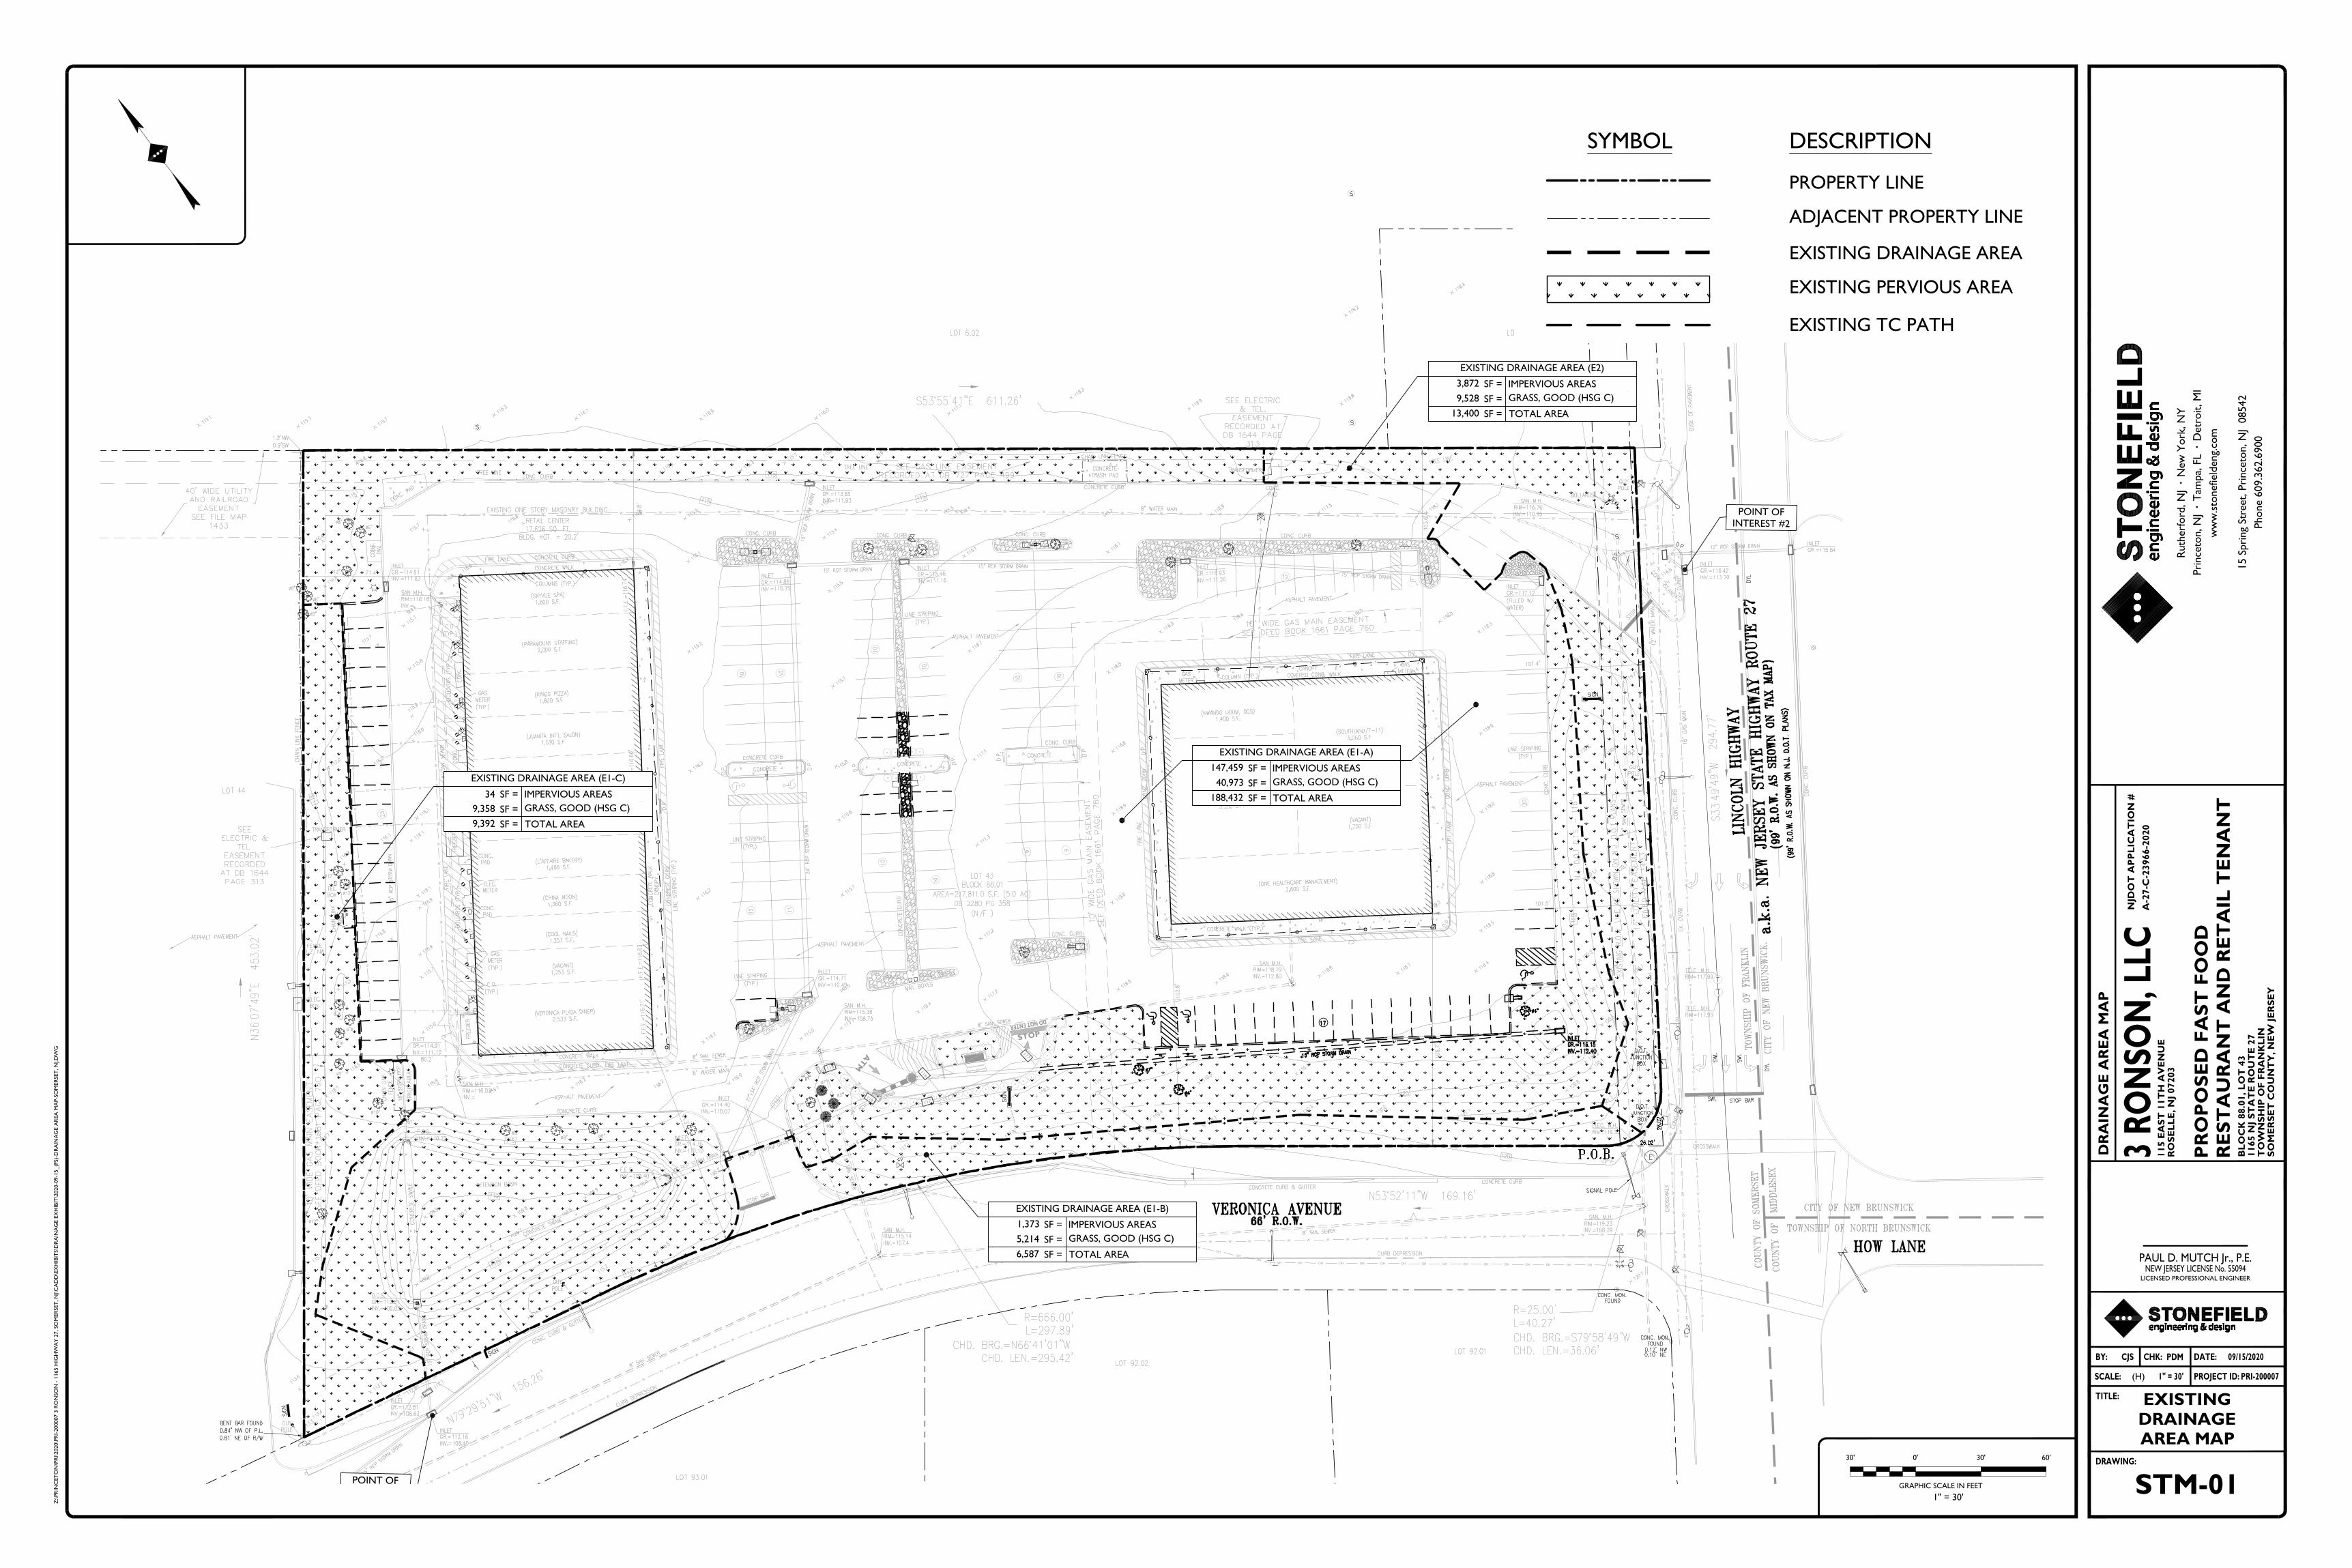
G
G
G
G
G
G
G
G
G
G
G
G
G
G
G
G
G
G
G
G
G
G
G
G
G
G
O
H
O
H
O
H
O
H
O
H
O
H
O
H
O
H
O
H
O
H
O
H
O
H
O
H
O
H
O
H
O
H
O
H
O
H
O
H
O
H
O
H
O
H
O
H
O
H
O
H
O
H
O
H
O
H
O
H
O
H
O
H
O
H
O
H
O
H
O
H
O
H
O
H
O
H
O
H
O
H
O
H
O
H
O
H
O
H
O
H
O
H
O
H
O
H
O
H
OHOH OH
OHOH
OHOH
OHOH
OH OHOH
OHOH
OH OHOH
OH
OH
OH
OH
OH
OH
OH
OH
OH
OH
OH
OH
OH
OH
OH
OH
OH
OH
OH
OH
OH
OH
OH
OH
OH
OH
OH
OH
OH
OH
OH
OH
OH
OH
OH
OH
OH
OH
OH
OH
OH
X
X
X
X
X
XX
X
X
X
X
X
X
O
H
W
XX
XX
XX
XX
XX
XX
XX
XX
X
X
X
XX
XX
XX
XX
XX
X
GGGGGG
G
G
G
G
G
G
G
G
G
G
G
G
G
G
G
G
G
G
G
G
G
G
G
G
G
G
G
W
W
W
W
W
W
W
W
W
W
W
W
W
W
W
W
W
W
W
W
W
W
W
W
W
W
W
W
W
W
W
W
W
W
W
W
W
W
W
W
W
W
W
W
W
W
W
W
WW
WW
W
WW
W
W
W
W
W
W
W
W
W
W
W
W
W
W
W
W
W
W
W
W
W
W
W
W
W
W
W
W
W
WW
WW
WW
WW
WW
WW
WW
WW
WW
WW
WW
W WW
W
WW
WW
W
WW
WW
W
WW
WW
W
WW
W
WW
WW
W
WW
WW
W
WW
WW
W
WW
W
W
W
W
W
W
W
W
W
W
W
W
W
W
W
W
W
W
W
W
W
W
W
W
W
W
W
W
W
W
W
W
W
W
W
W
W
W
W
W
W
W
W
W
W
W
W
W
W
W
W
W
W
W
W
W
W
W
W
W
W
W
W
W
W
W
W
W
W
W
W
W
W
W
W
W
W
W
W
W
W
W
W
W
W
W
W
W
W
W
W
W
W
W
G
G
G
G
G
G
G
G
G
G
G
G
G
G
G
G
G
G
G
G
G
G
G
G
G
G
G
G
G
G
G
G
G
G
G
G
G
G
G
G
G
G
G
G
G
G
G
G
G
G
STOP
DO NOT ENTER
AT
M
M
H116
MH
MH
M
H116
116
117
116
117
POINT OF
POINT OFINTEREST #2
EXISTING DRAINAGE AREA (E2)
3,872 SF = IMPERVIOUS AREAS
9,528 SF = GRASS, GOOD (HSG C)
13,400 SF = TOTAL AREA
EXISTING DRAINAGE AREA (E1-B)
1,373 SF = IMPERVIOUS AREAS
5,214 SF = GRASS, GOOD (HSG C)
6,587 SF = TOTAL AREA
EXISTING DRAINAGE AREA (E1-C)
34 SF = IMPERVIOUS AREAS
9,358 SF = GRASS, GOOD (HSG C)
9,392 SF = TOTAL AREA
EXISTING DRAINAGE AREA (E1-A)
147,459 SF = IMPERVIOUS AREAS
40,973 SF = GRASS, GOOD (HSG C)
188,432 SF = TOTAL AREA
DR
AIN
AG
E A
RE
A M
AP
CJS PDM
EXISTINGDRAINAGEAREA MAP
STM-01
1" = 30'
Z:\PR
INC
ET
ON
\PR
I\2020\P
RI-
200007 3
RO
NSO
N -
1165 H
IGH
WA
Y 2
7, SO
MER
SET
, N
J\C
AD
D\E
XH
IBIT
S\D
RA
INA
GE E
XH
IBIT
\2020-0
9-1
5_(F
S)-D
RA
INA
GE A
REA
MA
P-S
OM
ER
SET
, N
J.D
WG
TITLE:
PROJECT ID:
DRAWING:
BY: DATE:
(H)
CHK:
SCALE:
Ruth
erf
ord
, N
J ·
New
York
, N
Y
Pri
nce
ton, N
J ·
Tam
pa,
FL ·
Detr
oit, M
I
ww
w.s
tonefield
eng.
com
15 S
pri
ng
Stre
et, P
rince
ton, N
J 0
8542
Phone 6
09.3
62.6
900
PROPERTY LINE
ADJACENT PROPERTY LINE
EXISTING DRAINAGE AREA
EXISTING PERVIOUS AREA
DESCRIPTIONSYMBOL
EXISTING TC PATH
GRAPHIC SCALE IN FEET
0'
1" = 30'
30' 30' 60'
PAUL D. MUTCH Jr., P.E.NEW JERSEY LICENSE No. 55094
LICENSED PROFESSIONAL ENGINEER
09/15/2020
PRI-200007
PR
OP
OS
ED
FA
ST
FO
OD
RE
ST
AU
RA
NT
AN
D R
ET
AIL
TE
NA
NT
SO
ME
RS
ET
CO
UN
TY
, N
EW
JE
RS
EY
3 R
ON
SON
, LL
C
TO
WN
SH
IP O
F F
RA
NK
LIN
1165 N
J S
TA
TE
RO
UT
E 2
7B
LO
CK
88.0
1, L
OT
43
RO
SE
LL
E, N
J 07203
115 E
AS
T 1
1T
H A
VE
NU
E
NJD
OT
AP
PL
ICA
TIO
N #
A-2
7-C
-23966-2
020
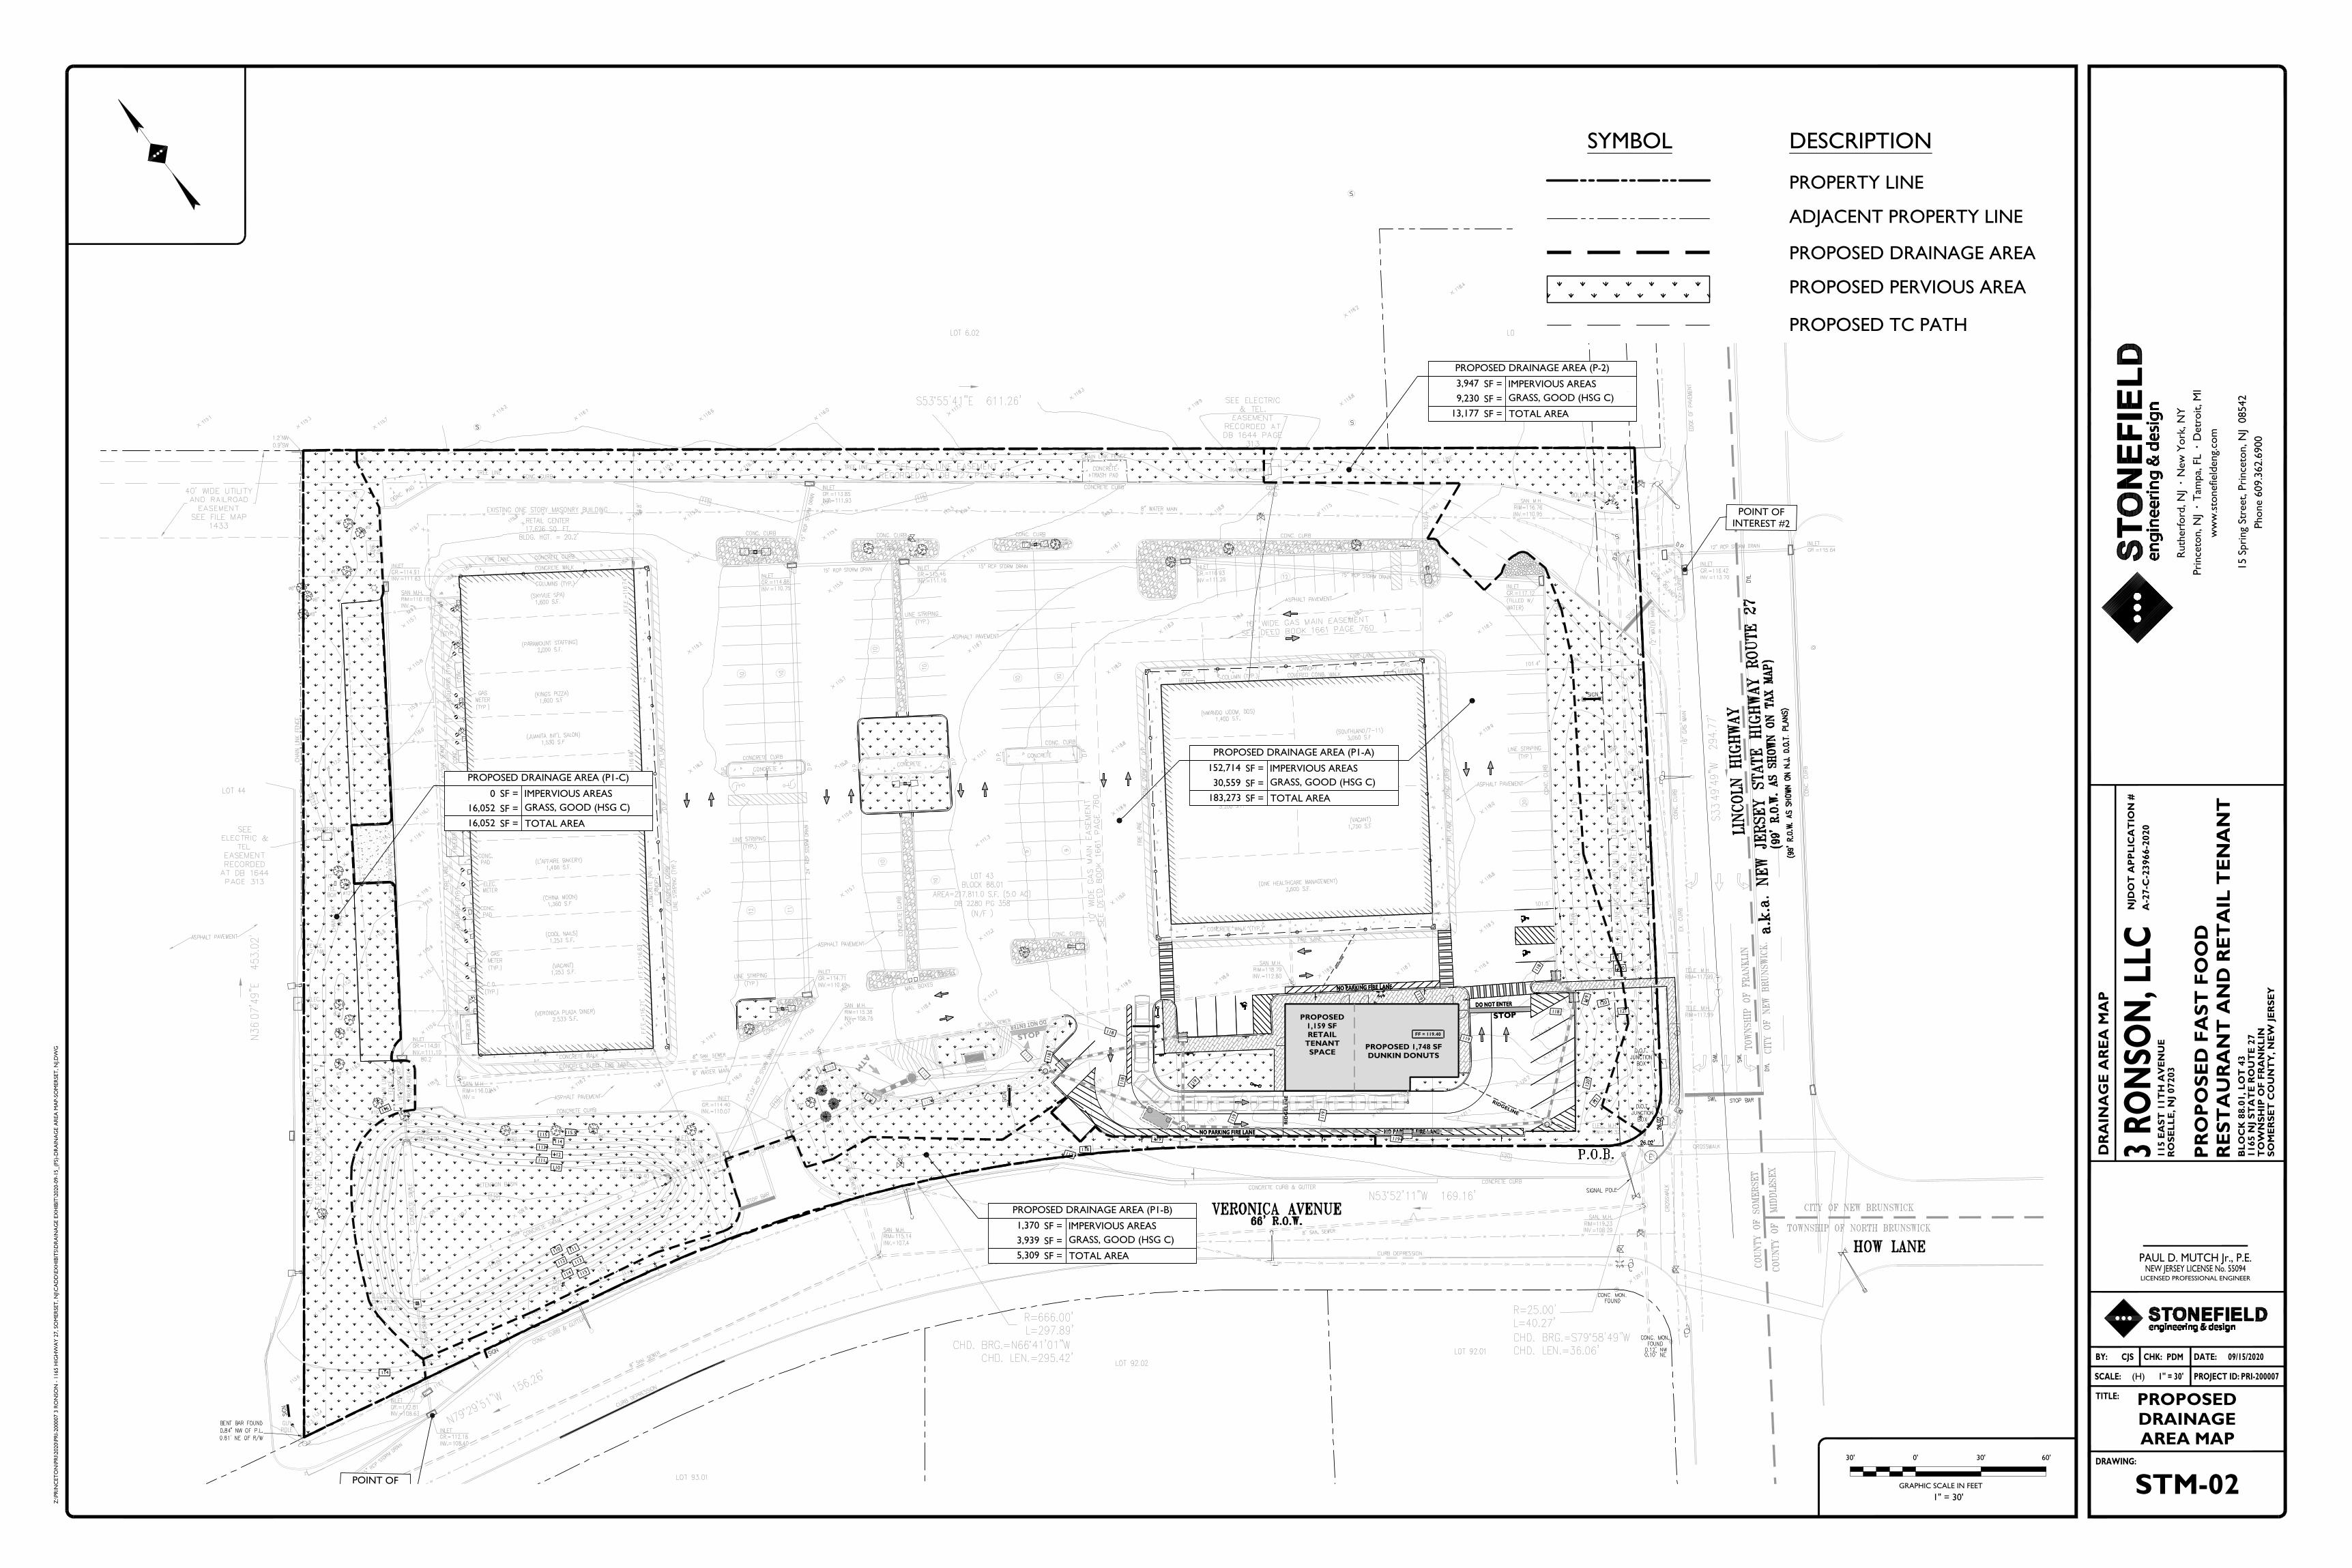
G
G
G
G
G
G
G
G
G
G
G
G
G
G
G
G
G
G
G
G
G
G
G
G
G
G
O
H
O
H
O
H
O
H
O
H
O
H
O
H
O
H
O
H
O
H
O
H
O
H
O
H
O
H
O
H
O
H
O
H
O
H
O
H
O
H
O
H
O
H
O
H
O
H
O
H
O
H
O
H
O
H
O
H
O
H
O
H
O
H
O
H
O
H
O
H
O
H
O
H
O
H
O
H
O
H
O
H
O
H
O
H
O
H
O
H
O
H
O
H
O
H
O
H
OHOH OH
OHOH
OHOH
OHOH
OH OHOH
OHOH
OH OHOH
OH
OH
OH
OH
OH
OH
OH
OH
OH
OH
OH
OH
OH
OH
OH
OH
OH
OH
OH
OH
OH
OH
OH
OH
OH
OH
OH
OH
OH
OH
OH
OH
OH
OH
OH
OH
OH
OH
OH
OH
OH
X
X
X
X
X
XX
X
X
X
X
O
H
W
XX
XX
XX
XX
XX
XX
XX
XX
X
X
X
XX
XX
XX
XX
XX
X
GGGGGG
G
G
G
G
G
G
G
G
G
G
G
G
G
G
G
G
G
G
G
G
G
G
G
G
G
G
G
W
W
W
W
W
W
W
W
W
W
W
W
W
W
W
W
W
W
W
W
W
W
W
W
W
W
W
W
W
W
W
W
W
W
W
W
W
W
W
W
W
W
W
W
W
W
W
W
WW
WW
W
WW
W
W
W
W
W
W
W
W
W
W
W
W
W
W
W
W
W
W
W
W
W
W
W
W
W
W
W
W
W
WW
WW
WW
WW
WW
WW
WW
WW
WW
WW
WW
W WW
W
WW
WW
W
WW
WW
W
WW
WW
W
WW
W
WW
WW
W
WW
WW
W
WW
WW
W
WW
W
W
W
W
W
W
W
W
W
W
W
W
W
W
W
W
W
W
W
W
W
W
W
W
W
W
W
W
W
W
W
W
W
W
W
W
W
W
W
W
W
W
W
W
W
W
W
W
W
W
W
W
W
W
W
W
W
W
W
W
W
W
W
W
W
W
W
W
W
W
W
W
W
W
W
W
W
W
W
W
W
W
W
W
W
W
W
W
W
W
W
W
W
W
G
G
G
G
G
G
G
G
G
G
G
G
G
G
G
G
G
G
G
G
G
G
G
G
G
G
G
G
G
G
G
G
G
G
G
G
G
G
G
G
G
G
G
G
G
G
G
G
G
G
STOP
DO NOT ENTER
AT
M
M
H116
NO PARKING FIRE LANE NO PARKING FIRE LANE
NO PARKING FIRE LANE
STOP
DO NOT ENTER
PROPOSED 1,748 SFDUNKIN DONUTS
PROPOSED1,159 SFRETAIL
TENANTSPACE
NO PARKING FIRE LANE NO PARKING FIRE LANE
NO PARKING FIRE LANE
STOP
DO NOT ENTER
PROPOSED 1,748 SFDUNKIN DONUTS
PROPOSED1,159 SFRETAIL
TENANTSPACE
RIDGELINE
RID
GE
LIN
E
RID
GELIN
E
MH
MH
121
120
120
121
118
118
119
120
121
119
119
119
119
119
119
119
118
118
118
118
117
FF = 119.40
MH
110 111
112 113
114 115
115
114113
112111
110
115.5
116
114
M
H
M
H
MH
MH
M
H116
116
117
116
117
POINT OF
POINT OFINTEREST #2
PROPOSED DRAINAGE AREA (P-2)
3,947 SF = IMPERVIOUS AREAS
9,230 SF = GRASS, GOOD (HSG C)
13,177 SF = TOTAL AREA
PROPOSED DRAINAGE AREA (P1-A)
152,714 SF = IMPERVIOUS AREAS
30,559 SF = GRASS, GOOD (HSG C)
183,273 SF = TOTAL AREA
PROPOSED DRAINAGE AREA (P1-B)
1,370 SF = IMPERVIOUS AREAS
3,939 SF = GRASS, GOOD (HSG C)
5,309 SF = TOTAL AREA
PROPOSED DRAINAGE AREA (P1-C)
0 SF = IMPERVIOUS AREAS
16,052 SF = GRASS, GOOD (HSG C)
16,052 SF = TOTAL AREA
DR
AIN
AG
E A
RE
A M
AP
CJS PDM 09/15/2020
PROPOSEDDRAINAGEAREA MAP
STM-02
1" = 30'
Z:\PR
INC
ET
ON
\PR
I\2020\P
RI-
200007 3
RO
NSO
N -
1165 H
IGH
WA
Y 2
7, SO
MER
SET
, N
J\C
AD
D\E
XH
IBIT
S\D
RA
INA
GE E
XH
IBIT
\2020-0
9-1
5_(F
S)-D
RA
INA
GE A
REA
MA
P-S
OM
ER
SET
, N
J.D
WG
TITLE:
PROJECT ID:
DRAWING:
BY: DATE:
PRI-200007(H)
CHK:
SCALE:
Ruth
erf
ord
, N
J ·
New
York
, N
Y
Pri
nce
ton, N
J ·
Tam
pa,
FL ·
Detr
oit, M
I
ww
w.s
tonefield
eng.
com
15 S
pri
ng
Stre
et, P
rince
ton, N
J 0
8542
Phone 6
09.3
62.6
900
PROPERTY LINE
ADJACENT PROPERTY LINE
PROPOSED DRAINAGE AREA
PROPOSED PERVIOUS AREA
DESCRIPTIONSYMBOL
PROPOSED TC PATH
GRAPHIC SCALE IN FEET
0'
1" = 30'
30' 30' 60'
PAUL D. MUTCH Jr., P.E.NEW JERSEY LICENSE No. 55094
LICENSED PROFESSIONAL ENGINEER
PR
OP
OS
ED
FA
ST
FO
OD
RE
ST
AU
RA
NT
AN
D R
ET
AIL
TE
NA
NT
SO
ME
RS
ET
CO
UN
TY
, N
EW
JE
RS
EY
3 R
ON
SON
, LL
C
TO
WN
SH
IP O
F F
RA
NK
LIN
1165 N
J S
TA
TE
RO
UT
E 2
7B
LO
CK
88.0
1, L
OT
43
RO
SE
LL
E, N
J 07203
115 E
AS
T 1
1T
H A
VE
NU
E
NJD
OT
AP
PL
ICA
TIO
N #
A-2
7-C
-23966-2
020
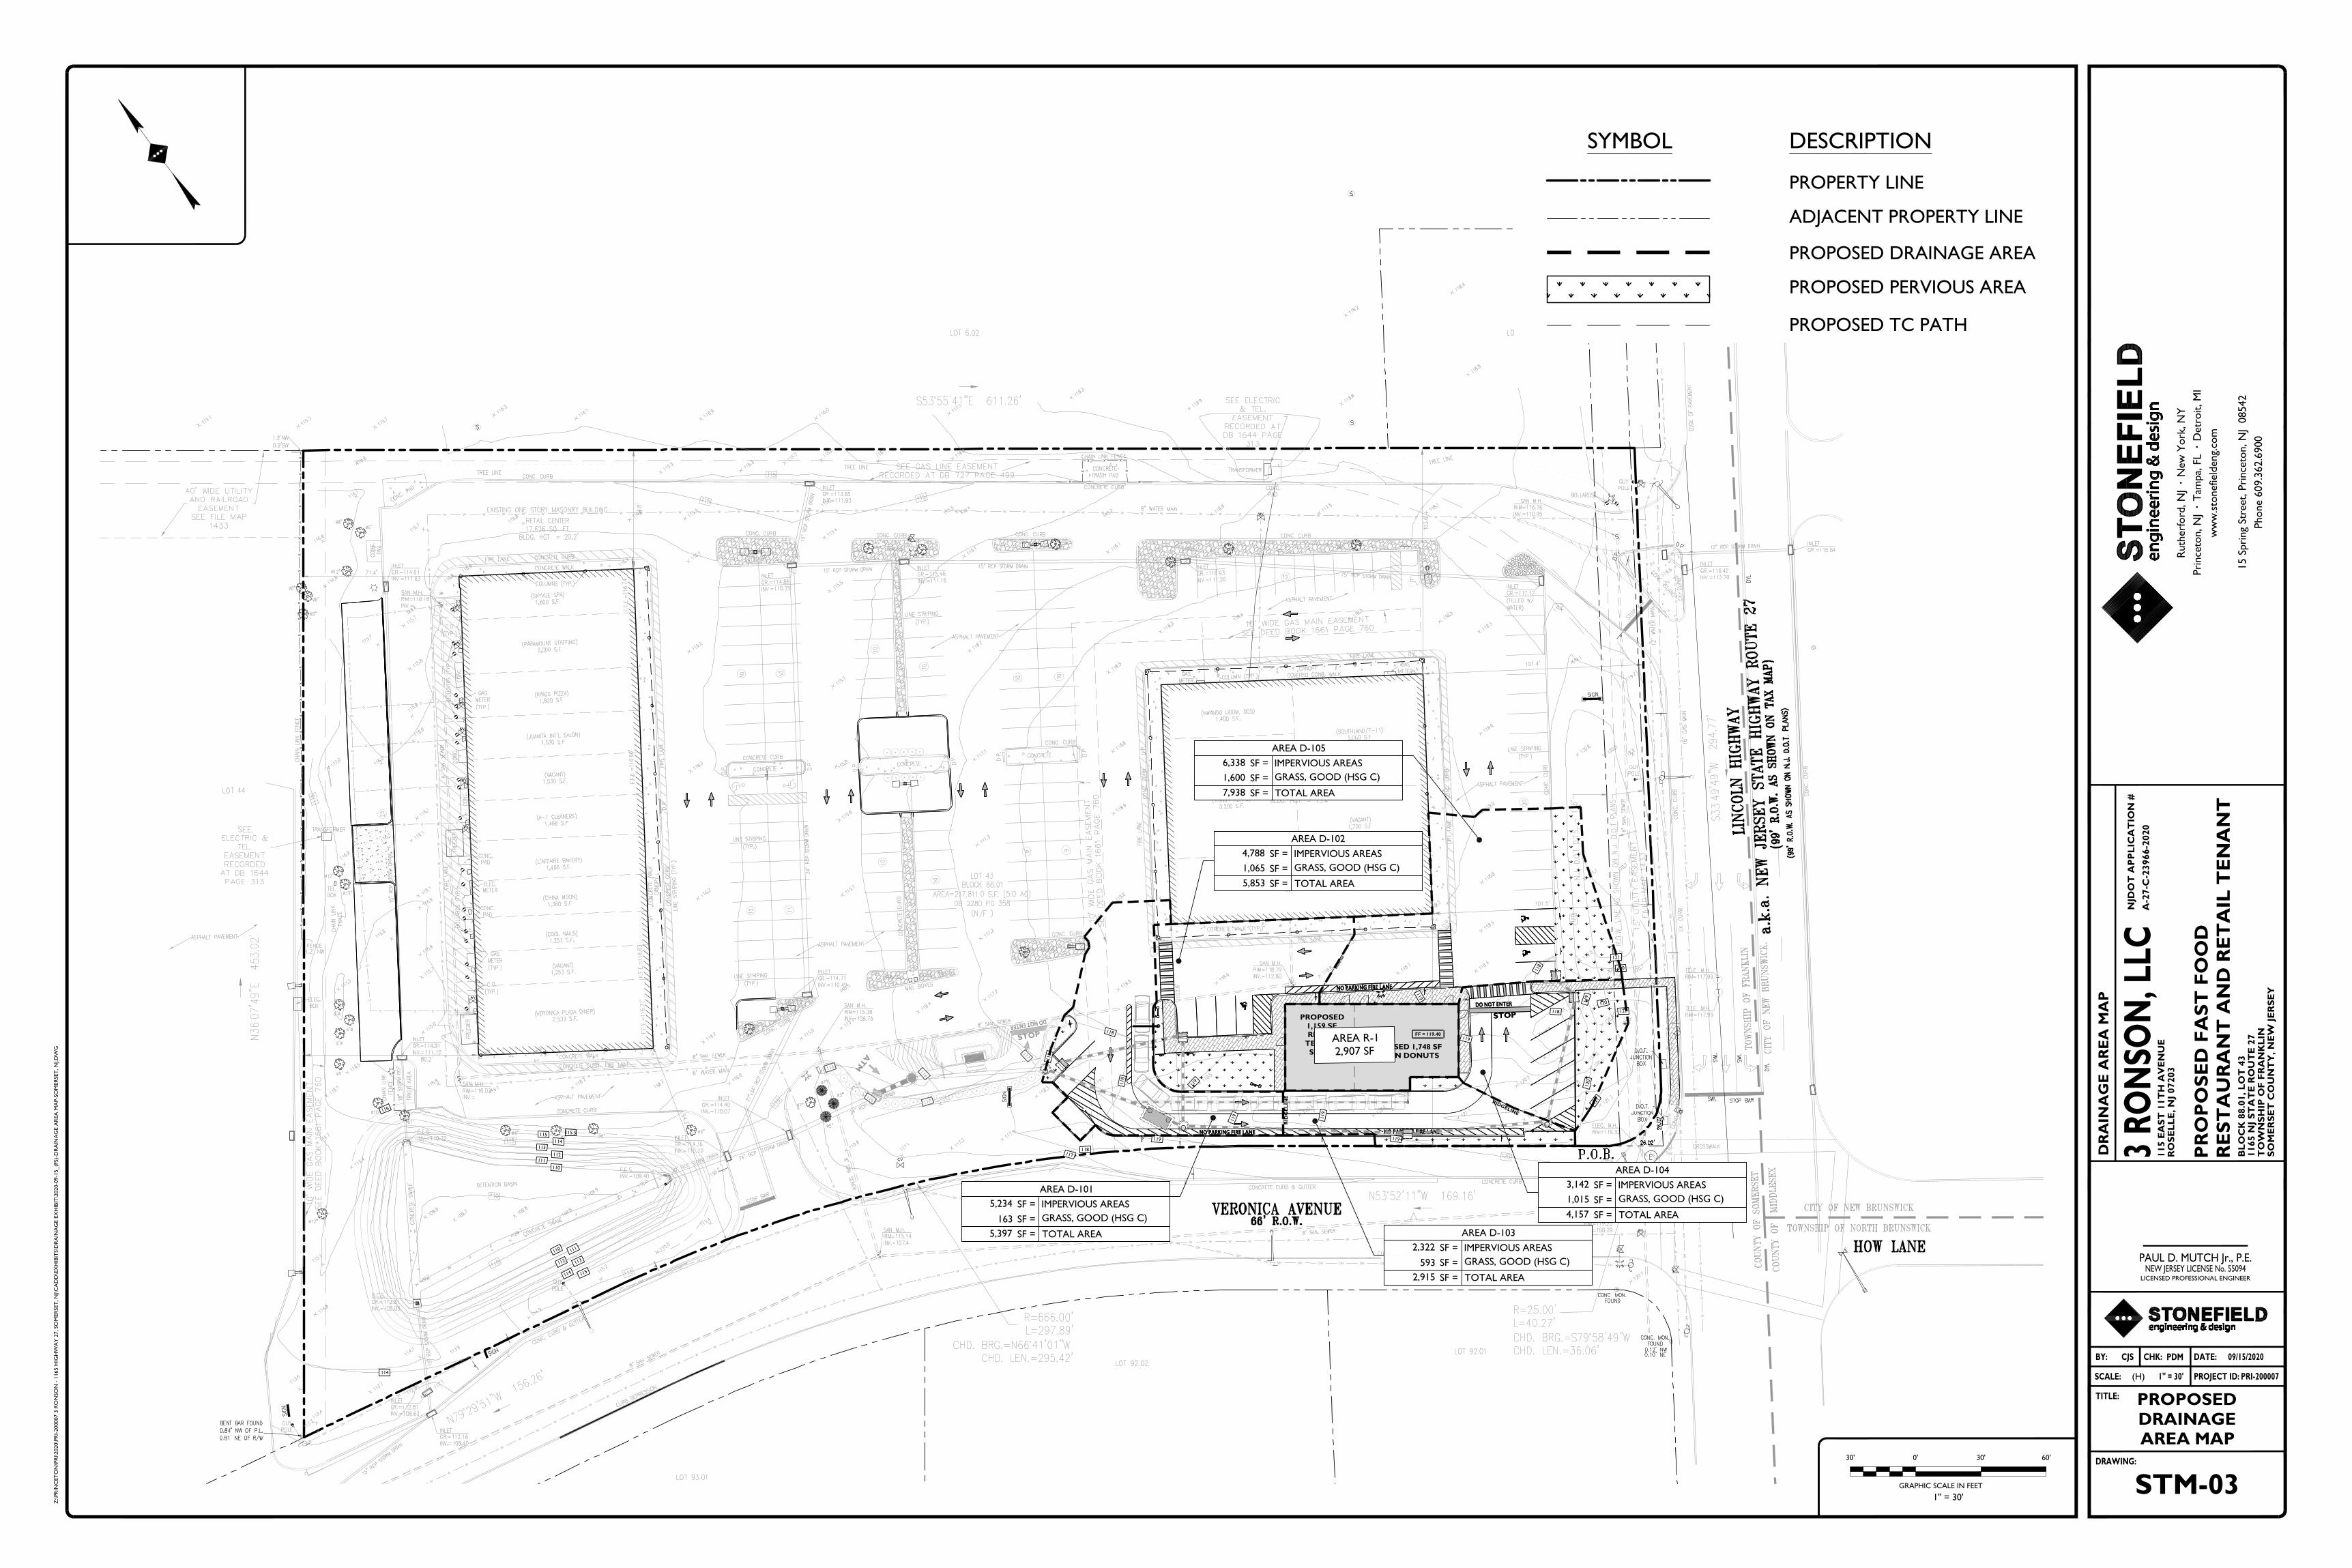
G
G
G
G
G
G
G
G
G
G
G
G
G
G
G
G
G
G
G
G
G
G
G
G
G
G
O
H
O
H
O
H
O
H
O
H
O
H
O
H
O
H
O
H
O
H
O
H
O
H
O
H
O
H
O
H
O
H
O
H
O
H
O
H
O
H
O
H
O
H
O
H
O
H
O
H
O
H
O
H
O
H
O
H
O
H
O
H
O
H
O
H
O
H
O
H
O
H
O
H
O
H
O
H
O
H
O
H
O
H
O
H
O
H
O
H
O
H
O
H
O
H
O
H
OHOH OH
OHOH
OHOH
OHOH
OH OHOH
OHOH
OH OHOH
OH
OH
OH
OH
OH
OH
OH
OH
OH
OH
OH
OH
OH
OH
OH
OH
OH
OH
OH
OH
OH
OH
OH
OH
OH
OH
OH
OH
OH
OH
OH
OH
OH
OH
OH
OH
OH
OH
OH
OH
OH
X
X
X
X
X
XX
X
X
X
X
O
H
W
XX
XX
XX
XX
XX
XX
XX
XX
X
X
X
XX
XX
XX
XX
XX
X
GGGGGG
G
G
G
G
G
G
G
G
G
G
G
G
G
G
G
G
G
G
G
G
G
G
G
G
G
G
G
W
W
W
W
W
W
W
W
W
W
W
W
W
W
W
W
W
W
W
W
W
W
W
W
W
W
W
W
W
W
W
W
W
W
W
W
W
W
W
W
W
W
W
W
W
W
W
W
WW
WW
W
WW
W
W
W
W
W
W
W
W
W
W
W
W
W
W
W
W
W
W
W
W
W
W
W
W
W
W
W
W
W
WW
WW
WW
WW
WW
WW
WW
WW
WW
WW
WW
W WW
W
WW
WW
W
WW
WW
W
WW
WW
W
WW
W
WW
WW
W
WW
WW
W
WW
WW
W
WW
W
W
W
W
W
W
W
W
W
W
W
W
W
W
W
W
W
W
W
W
W
W
W
W
W
W
W
W
W
W
W
W
W
W
W
W
W
W
W
W
W
W
W
W
W
W
W
W
W
W
W
W
W
W
W
W
W
W
W
W
W
W
W
W
W
W
W
W
W
W
W
W
W
W
W
W
W
W
W
W
W
W
W
W
W
W
W
W
W
W
W
W
W
W
G
G
G
G
G
G
G
G
G
G
G
G
G
G
G
G
G
G
G
G
G
G
G
G
G
G
G
G
G
G
G
G
G
G
G
G
G
G
G
G
G
G
G
G
G
G
G
G
G
G
STOP
DO NOT ENTER
AT
M
M
H116
NO PARKING FIRE LANE NO PARKING FIRE LANE
NO PARKING FIRE LANE
STOP
DO NOT ENTER
PROPOSED 1,748 SFDUNKIN DONUTS
PROPOSED1,159 SFRETAIL
TENANTSPACE
NO PARKING FIRE LANE NO PARKING FIRE LANE
NO PARKING FIRE LANE
STOP
DO NOT ENTER
PROPOSED 1,748 SFDUNKIN DONUTS
PROPOSED1,159 SFRETAIL
TENANTSPACE
RIDGELINE
RID
GE
LIN
E
RID
GELIN
E
MH
MH
121
120
120
121
118
118
119
120
121
119
119
119
119
119
119
119
118
118
118
118
117
FF = 119.40
MH
110 111
112 113
114 115
115
114113
112111
110
115.5
116
114
M
H
M
H
MH
MH
M
H116
116
117
116
117
AREA R-1
2,907 SF
AREA D-105
6,338 SF = IMPERVIOUS AREAS
1,600 SF = GRASS, GOOD (HSG C)
7,938 SF = TOTAL AREA
AREA D-104
3,142 SF = IMPERVIOUS AREAS
1,015 SF = GRASS, GOOD (HSG C)
4,157 SF = TOTAL AREA
AREA D-103
2,322 SF = IMPERVIOUS AREAS
593 SF = GRASS, GOOD (HSG C)
2,915 SF = TOTAL AREA
AREA D-101
5,234 SF = IMPERVIOUS AREAS
163 SF = GRASS, GOOD (HSG C)
5,397 SF = TOTAL AREA
AREA D-102
4,788 SF = IMPERVIOUS AREAS
1,065 SF = GRASS, GOOD (HSG C)
5,853 SF = TOTAL AREA
DR
AIN
AG
E A
RE
A M
AP
CJS PDM 09/15/2020
PROPOSEDDRAINAGEAREA MAP
STM-03
1" = 30'
Z:\PR
INC
ET
ON
\PR
I\2020\P
RI-
200007 3
RO
NSO
N -
1165 H
IGH
WA
Y 2
7, SO
MER
SET
, N
J\C
AD
D\E
XH
IBIT
S\D
RA
INA
GE E
XH
IBIT
\2020-0
9-1
5_(F
S)-D
RA
INA
GE A
REA
MA
P-S
OM
ER
SET
, N
J.D
WG
TITLE:
PROJECT ID:
DRAWING:
BY: DATE:
PRI-200007(H)
CHK:
SCALE:
Ruth
erf
ord
, N
J ·
New
York
, N
Y
Pri
nce
ton, N
J ·
Tam
pa,
FL ·
Detr
oit, M
I
ww
w.s
tonefield
eng.
com
15 S
pri
ng
Stre
et, P
rince
ton, N
J 0
8542
Phone 6
09.3
62.6
900
PROPERTY LINE
ADJACENT PROPERTY LINE
PROPOSED DRAINAGE AREA
PROPOSED PERVIOUS AREA
DESCRIPTIONSYMBOL
PROPOSED TC PATH
GRAPHIC SCALE IN FEET
0'
1" = 30'
30' 30' 60'
PAUL D. MUTCH Jr., P.E.NEW JERSEY LICENSE No. 55094
LICENSED PROFESSIONAL ENGINEER
PR
OP
OS
ED
FA
ST
FO
OD
RE
ST
AU
RA
NT
AN
D R
ET
AIL
TE
NA
NT
SO
ME
RS
ET
CO
UN
TY
, N
EW
JE
RS
EY
3 R
ON
SON
, LL
C
TO
WN
SH
IP O
F F
RA
NK
LIN
1165 N
J S
TA
TE
RO
UT
E 2
7B
LO
CK
88.0
1, L
OT
43
RO
SE
LL
E, N
J 07203
115 E
AS
T 1
1T
H A
VE
NU
E
NJD
OT
AP
PL
ICA
TIO
N #
A-2
7-C
-23966-2
020
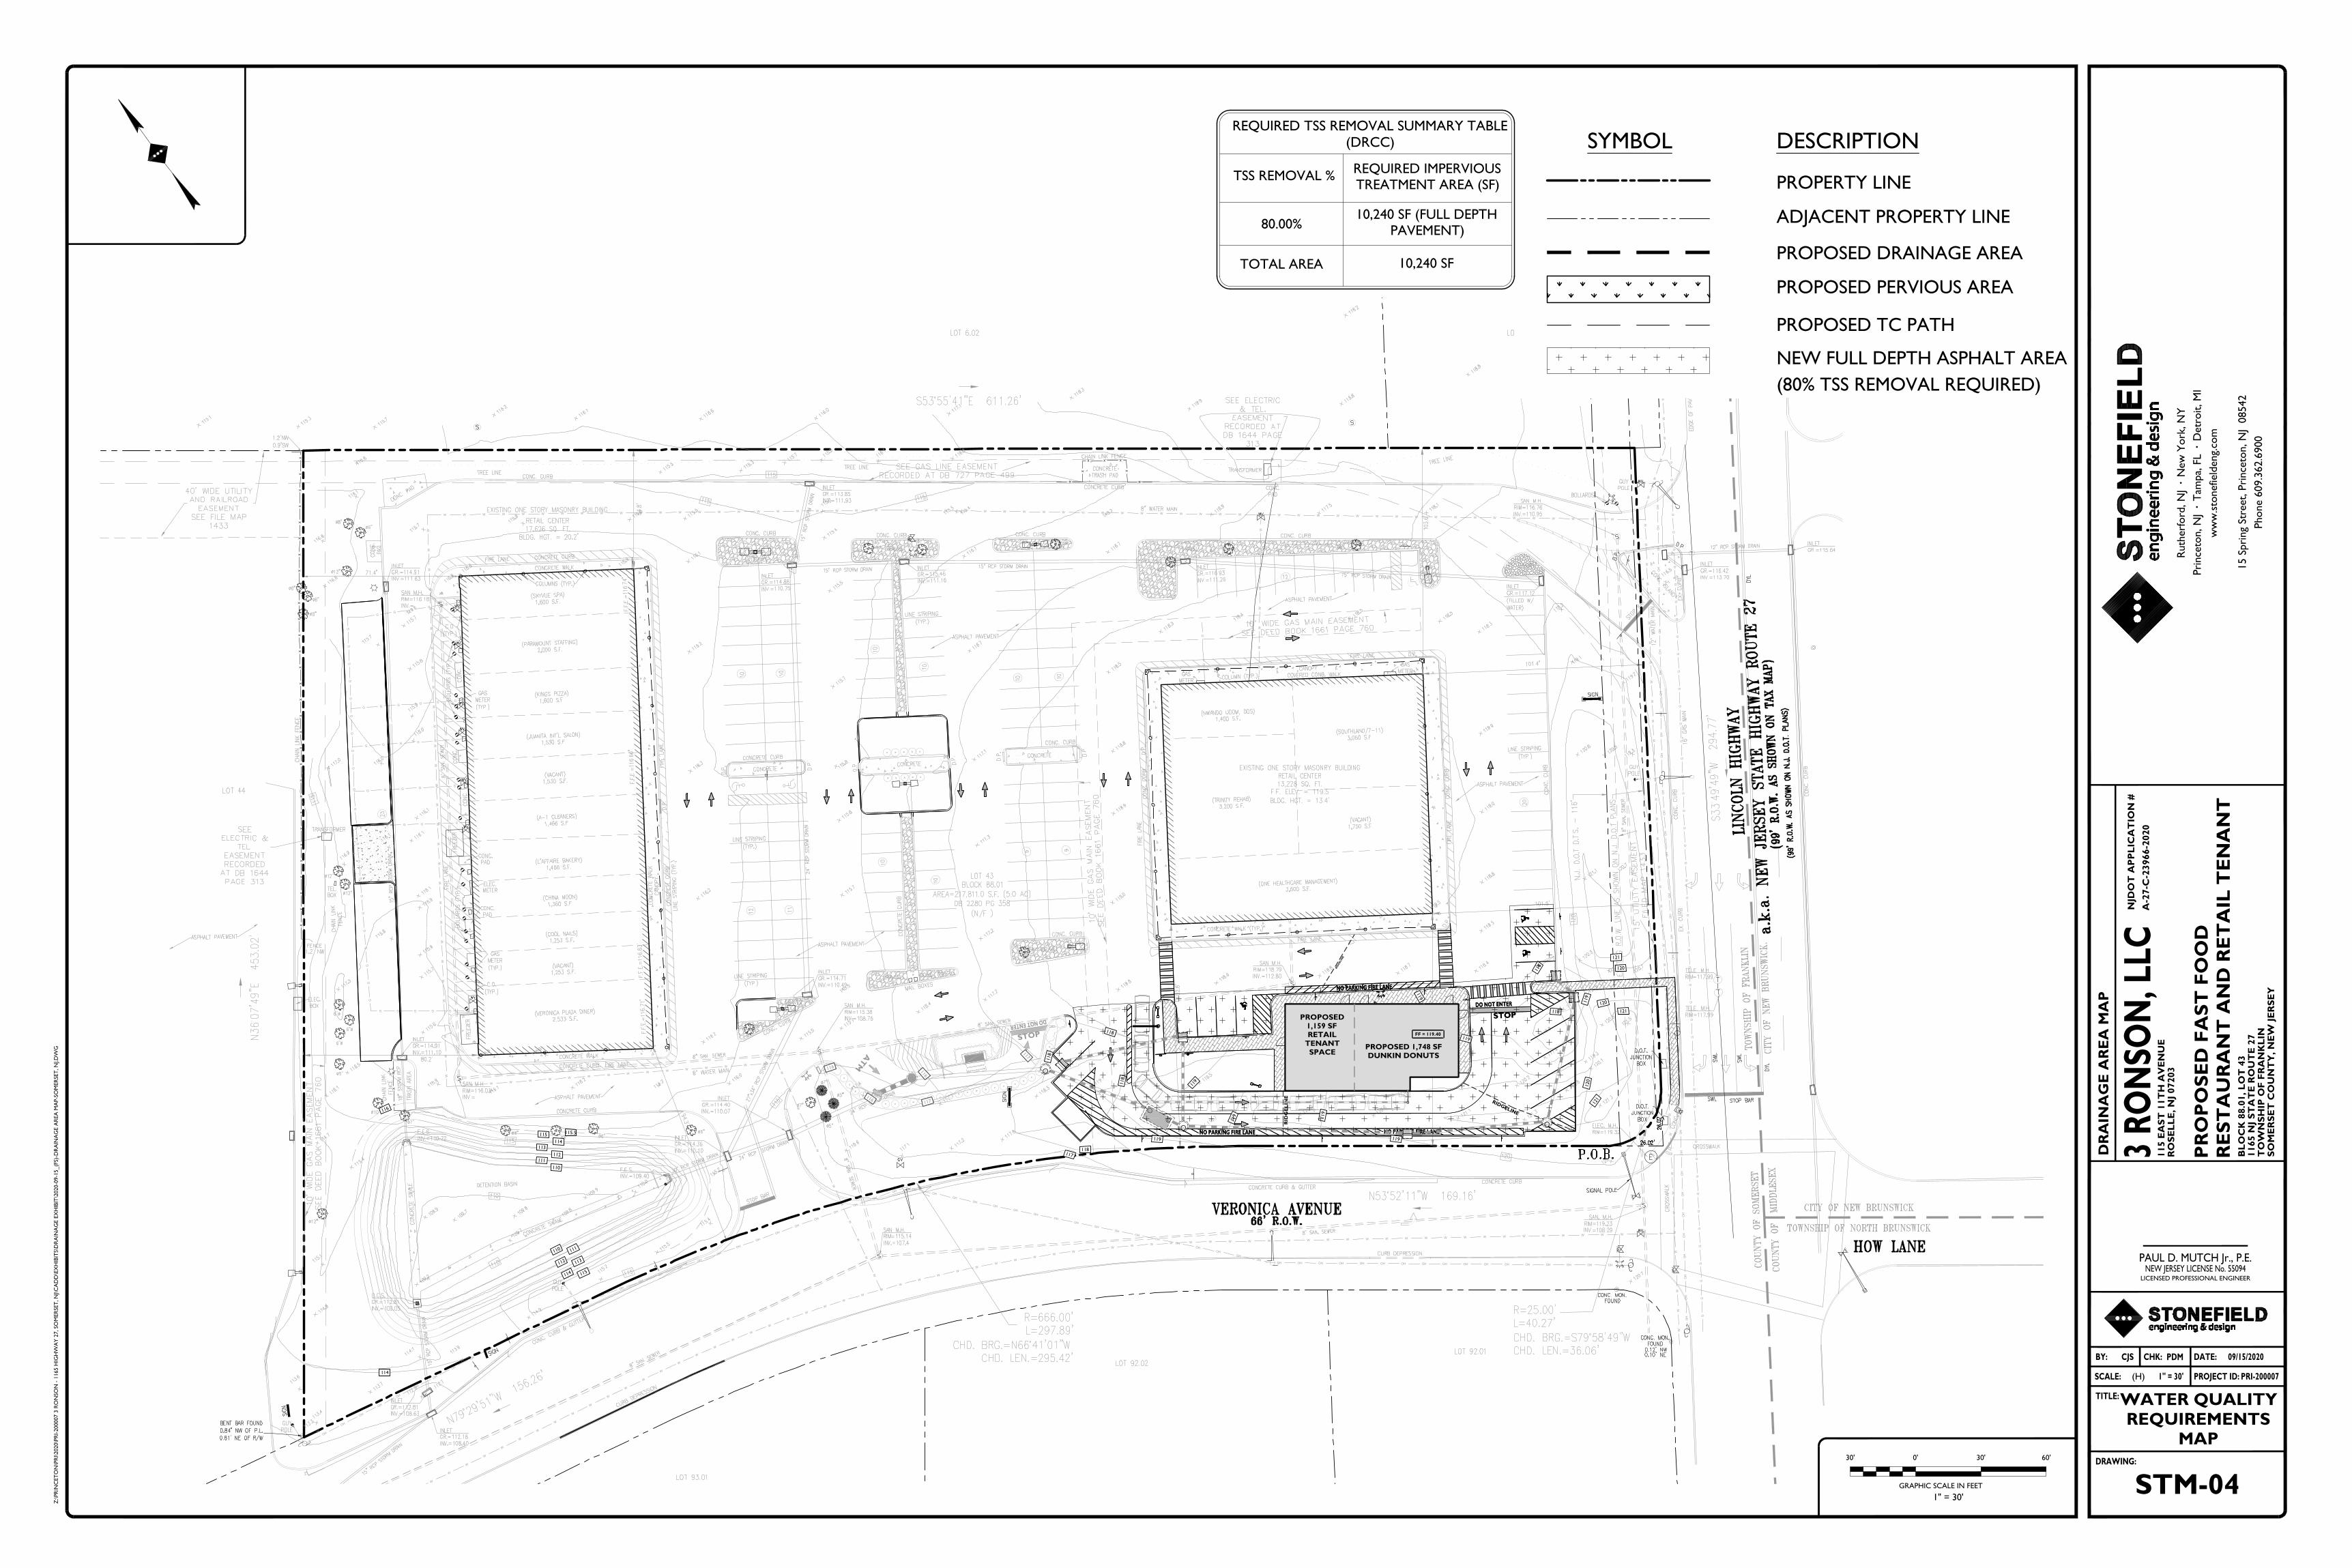
G
G
G
G
G
G
G
G
G
G
G
G
G
G
G
G
G
G
G
G
G
G
G
G
G
G
O
H
O
H
O
H
O
H
O
H
O
H
O
H
O
H
O
H
O
H
O
H
O
H
O
H
O
H
O
H
O
H
O
H
O
H
O
H
O
H
O
H
O
H
O
H
O
H
O
H
O
H
O
H
O
H
O
H
O
H
O
H
O
H
O
H
O
H
O
H
O
H
O
H
O
H
O
H
O
H
O
H
O
H
O
H
O
H
O
H
O
H
O
H
O
H
O
H
OHOH OH
OHOH
OHOH
OHOH
OH OHOH
OHOH
OH OHOH
OH
OH
OH
OH
OH
OH
OH
OH
OH
OH
OH
OH
OH
OH
OH
OH
OH
OH
OH
OH
OH
OH
OH
OH
OH
OH
OH
OH
OH
OH
OH
OH
OH
OH
OH
OH
OH
OH
OH
OH
OH
X
X
X
X
X
XX
X
X
X
X
O
H
W
XX
XX
XX
XX
XX
XX
XX
XX
X
X
X
XX
XX
XX
XX
XX
X
GGGGGG
G
G
G
G
G
G
G
G
G
G
G
G
G
G
G
G
G
G
G
G
G
G
G
G
G
G
G
W
W
W
W
W
W
W
W
W
W
W
W
W
W
W
W
W
W
W
W
W
W
W
W
W
W
W
W
W
W
W
W
W
W
W
W
W
W
W
W
W
W
W
W
W
W
W
W
WW
WW
W
WW
W
W
W
W
W
W
W
W
W
W
W
W
W
W
W
W
W
W
W
W
W
W
W
W
W
W
W
W
W
WW
WW
WW
WW
WW
WW
WW
WW
WW
WW
WW
W WW
W
WW
WW
W
WW
WW
W
WW
WW
W
WW
W
WW
WW
W
WW
WW
W
WW
WW
W
WW
W
W
W
W
W
W
W
W
W
W
W
W
W
W
W
W
W
W
W
W
W
W
W
W
W
W
W
W
W
W
W
W
W
W
W
W
W
W
W
W
W
W
W
W
W
W
W
W
W
W
W
W
W
W
W
W
W
W
W
W
W
W
W
W
W
W
W
W
W
W
W
W
W
W
W
W
W
W
W
W
W
W
W
W
W
W
W
W
W
W
W
W
W
W
G
G
G
G
G
G
G
G
G
G
G
G
G
G
G
G
G
G
G
G
G
G
G
G
G
G
G
G
G
G
G
G
G
G
G
G
G
G
G
G
G
G
G
G
G
G
G
G
G
G
STOP
DO NOT ENTER
AT
M
M
H116
NO PARKING FIRE LANE NO PARKING FIRE LANE
NO PARKING FIRE LANE
STOP
DO NOT ENTER
PROPOSED 1,748 SFDUNKIN DONUTS
PROPOSED1,159 SFRETAIL
TENANTSPACE
NO PARKING FIRE LANE NO PARKING FIRE LANE
NO PARKING FIRE LANE
STOP
DO NOT ENTER
PROPOSED 1,748 SFDUNKIN DONUTS
PROPOSED1,159 SFRETAIL
TENANTSPACE
RIDGELINE
RID
GE
LIN
E
RID
GELIN
E
MH
MH
121
120
120
121
118
118
119
120
121
119
119
119
119
119
119
119
118
118
118
118
117
FF = 119.40
MH
110 111
112 113
114 115
115
114113
112111
110
115.5
116
114
M
H
M
H
MH
MH
M
H116
116
117
116
117
DR
AIN
AG
E A
RE
A M
AP
CJS PDM 09/15/2020
WATER QUALITYREQUIREMENTS
MAP
STM-04
1" = 30'
Z:\PR
INC
ET
ON
\PR
I\2020\P
RI-
200007 3
RO
NSO
N -
1165 H
IGH
WA
Y 2
7, SO
MER
SET
, N
J\C
AD
D\E
XH
IBIT
S\D
RA
INA
GE E
XH
IBIT
\2020-0
9-1
5_(F
S)-D
RA
INA
GE A
REA
MA
P-S
OM
ER
SET
, N
J.D
WG
TITLE:
PROJECT ID:
DRAWING:
BY: DATE:
PRI-200007(H)
CHK:
SCALE:
Ruth
erf
ord
, N
J ·
New
York
, N
Y
Pri
nce
ton, N
J ·
Tam
pa,
FL ·
Detr
oit, M
I
ww
w.s
tonefield
eng.
com
15 S
pri
ng
Stre
et, P
rince
ton, N
J 0
8542
Phone 6
09.3
62.6
900
PROPERTY LINE
ADJACENT PROPERTY LINE
PROPOSED DRAINAGE AREA
PROPOSED PERVIOUS AREA
DESCRIPTIONSYMBOL
PROPOSED TC PATH
GRAPHIC SCALE IN FEET
0'
1" = 30'
30' 30' 60'
PAUL D. MUTCH Jr., P.E.NEW JERSEY LICENSE No. 55094
LICENSED PROFESSIONAL ENGINEER
TSS REMOVAL %
REQUIRED TSS REMOVAL SUMMARY TABLE(DRCC)
REQUIRED IMPERVIOUSTREATMENT AREA (SF)
80.00%
TOTAL AREA 10,240 SF
10,240 SF (FULL DEPTHPAVEMENT)
NEW FULL DEPTH ASPHALT AREA
(80% TSS REMOVAL REQUIRED)
PR
OP
OS
ED
FA
ST
FO
OD
RE
ST
AU
RA
NT
AN
D R
ET
AIL
TE
NA
NT
SO
ME
RS
ET
CO
UN
TY
, N
EW
JE
RS
EY
3 R
ON
SON
, LL
C
TO
WN
SH
IP O
F F
RA
NK
LIN
1165 N
J S
TA
TE
RO
UT
E 2
7B
LO
CK
88.0
1, L
OT
43
RO
SE
LL
E, N
J 07203
115 E
AS
T 1
1T
H A
VE
NU
E
NJD
OT
AP
PL
ICA
TIO
N #
A-2
7-C
-23966-2
020
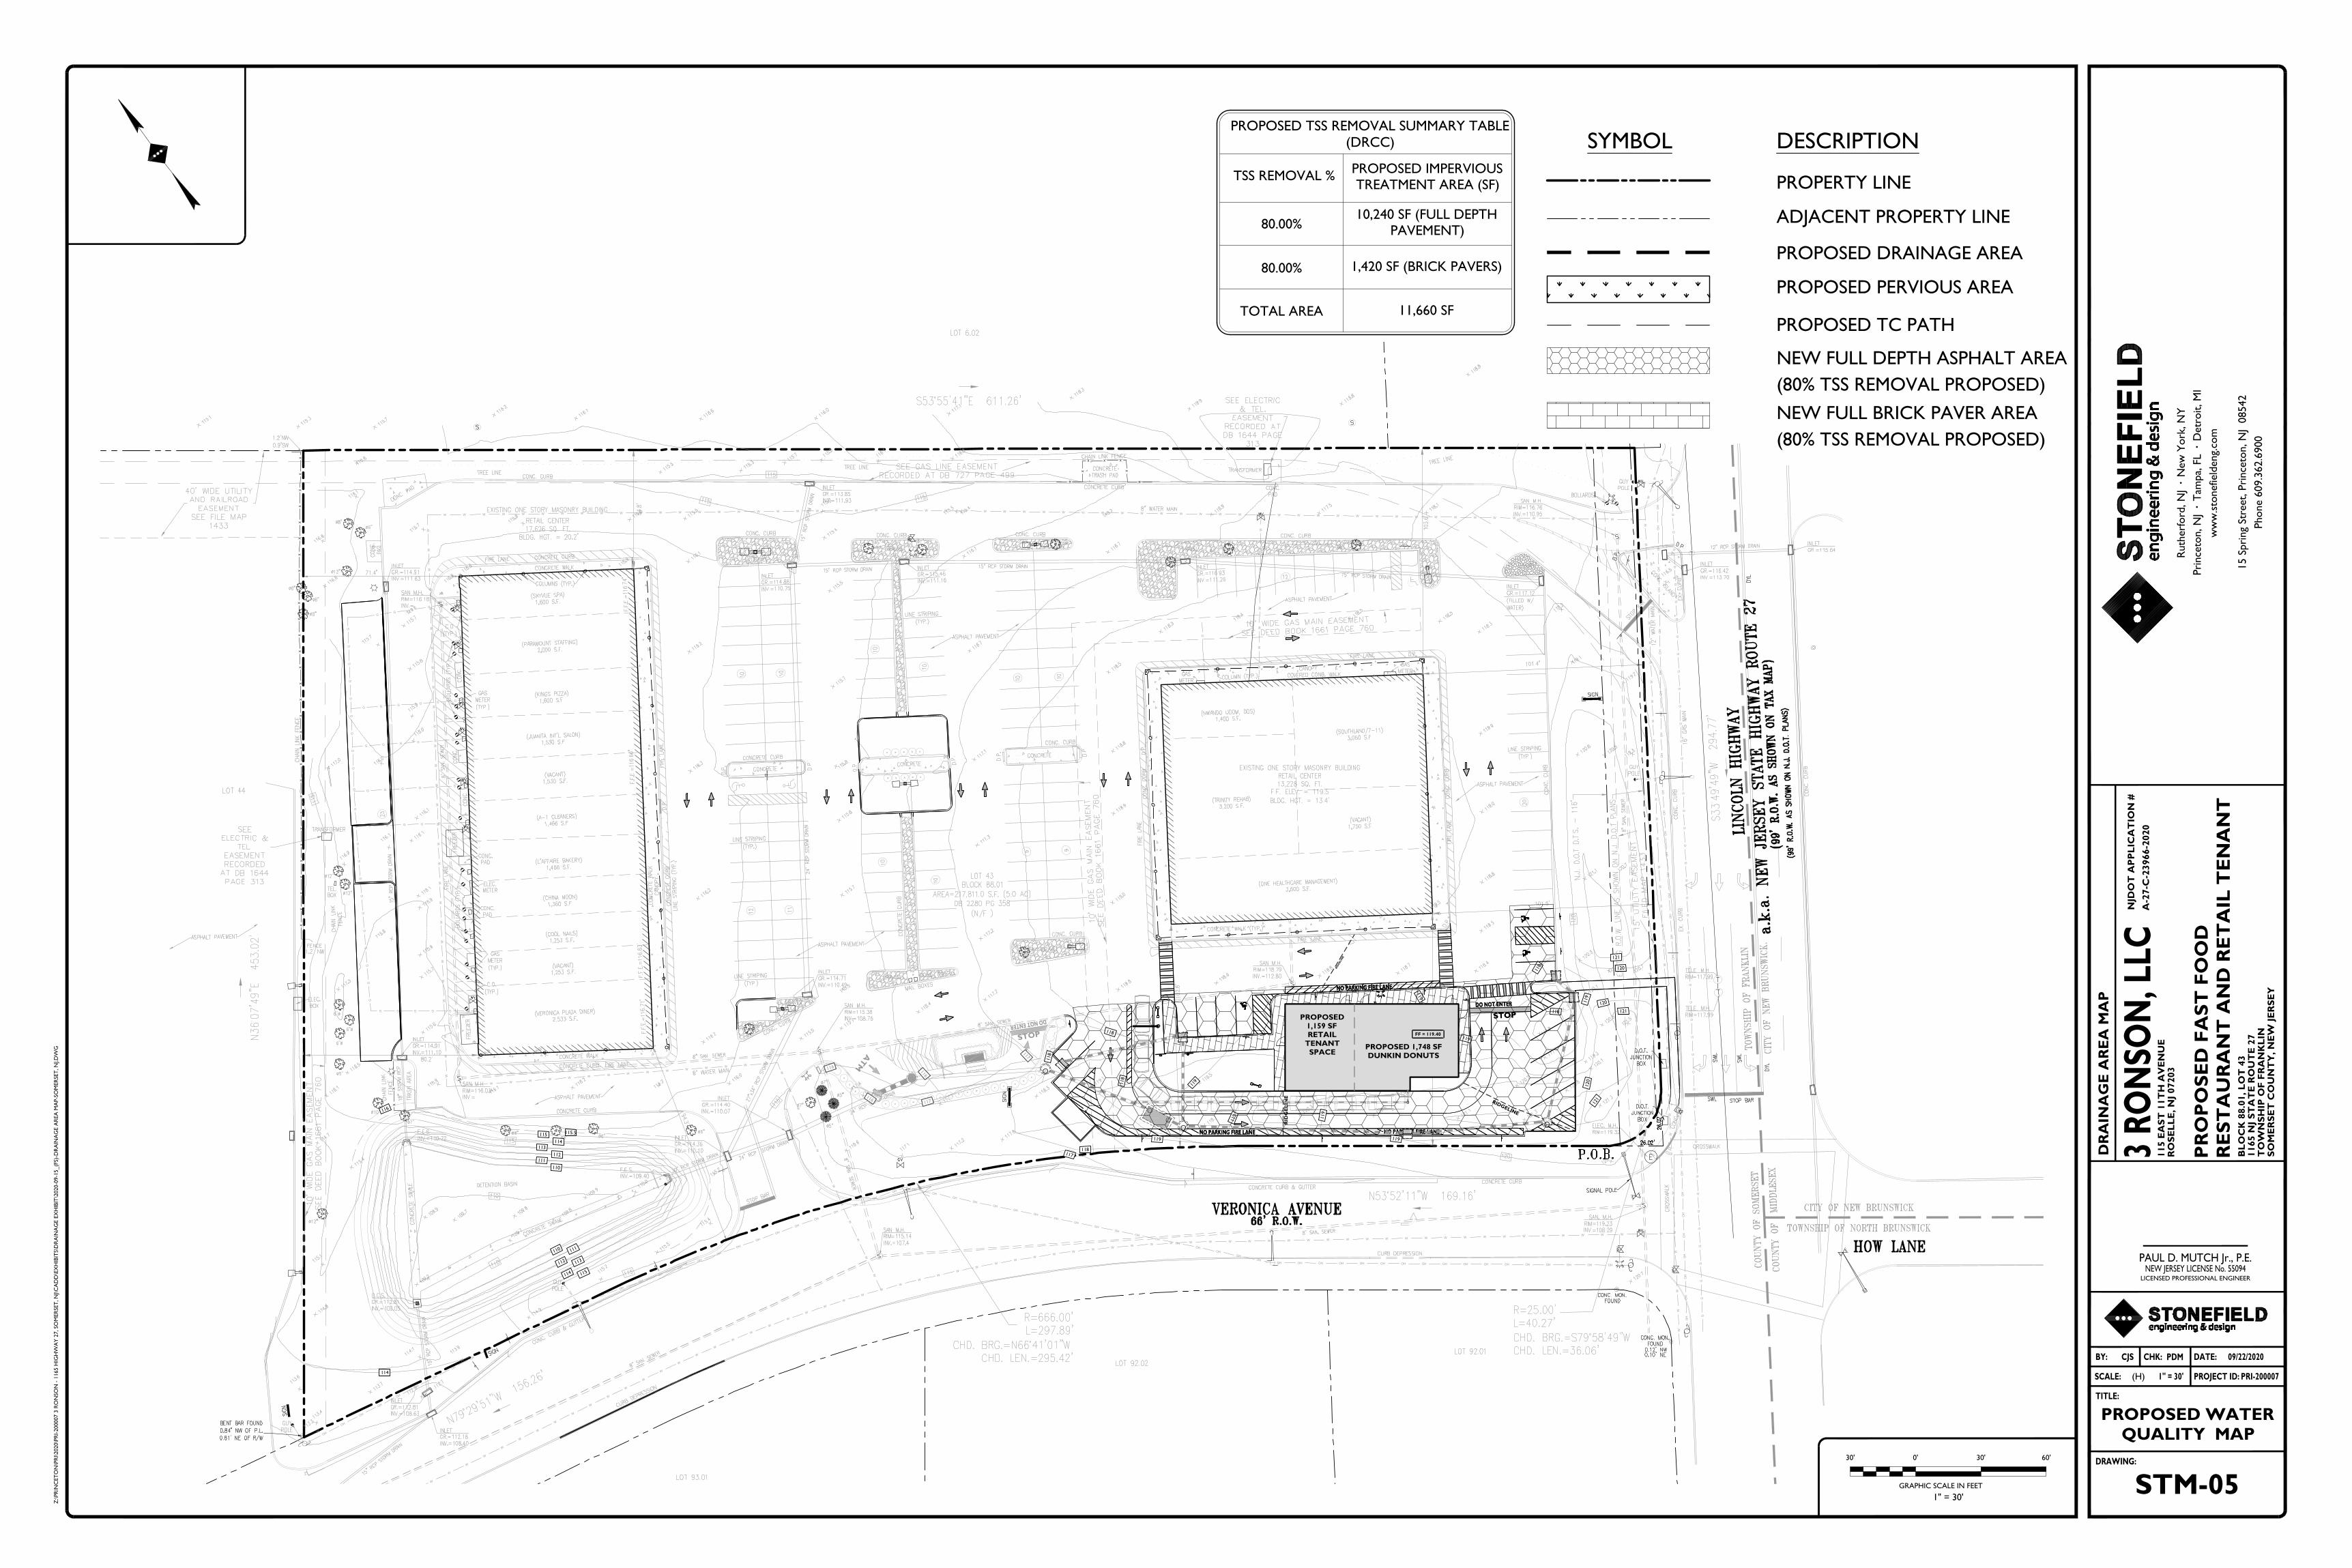
G
G
G
G
G
G
G
G
G
G
G
G
G
G
G
G
G
G
G
G
G
G
G
G
G
G
O
H
O
H
O
H
O
H
O
H
O
H
O
H
O
H
O
H
O
H
O
H
O
H
O
H
O
H
O
H
O
H
O
H
O
H
O
H
O
H
O
H
O
H
O
H
O
H
O
H
O
H
O
H
O
H
O
H
O
H
O
H
O
H
O
H
O
H
O
H
O
H
O
H
O
H
O
H
O
H
O
H
O
H
O
H
O
H
O
H
O
H
O
H
O
H
O
H
OHOH OH
OHOH
OHOH
OHOH
OH OHOH
OHOH
OH OHOH
OH
OH
OH
OH
OH
OH
OH
OH
OH
OH
OH
OH
OH
OH
OH
OH
OH
OH
OH
OH
OH
OH
OH
OH
OH
OH
OH
OH
OH
OH
OH
OH
OH
OH
OH
OH
OH
OH
OH
OH
OH
X
X
X
X
X
XX
X
X
X
X
O
H
W
XX
XX
XX
XX
XX
XX
XX
XX
X
X
X
XX
XX
XX
XX
XX
X
GGGGGG
G
G
G
G
G
G
G
G
G
G
G
G
G
G
G
G
G
G
G
G
G
G
G
G
G
G
G
W
W
W
W
W
W
W
W
W
W
W
W
W
W
W
W
W
W
W
W
W
W
W
W
W
W
W
W
W
W
W
W
W
W
W
W
W
W
W
W
W
W
W
W
W
W
W
W
WW
WW
W
WW
W
W
W
W
W
W
W
W
W
W
W
W
W
W
W
W
W
W
W
W
W
W
W
W
W
W
W
W
W
WW
WW
WW
WW
WW
WW
WW
WW
WW
WW
WW
W WW
W
WW
WW
W
WW
WW
W
WW
WW
W
WW
W
WW
WW
W
WW
WW
W
WW
WW
W
WW
W
W
W
W
W
W
W
W
W
W
W
W
W
W
W
W
W
W
W
W
W
W
W
W
W
W
W
W
W
W
W
W
W
W
W
W
W
W
W
W
W
W
W
W
W
W
W
W
W
W
W
W
W
W
W
W
W
W
W
W
W
W
W
W
W
W
W
W
W
W
W
W
W
W
W
W
W
W
W
W
W
W
W
W
W
W
W
W
W
W
W
W
W
W
G
G
G
G
G
G
G
G
G
G
G
G
G
G
G
G
G
G
G
G
G
G
G
G
G
G
G
G
G
G
G
G
G
G
G
G
G
G
G
G
G
G
G
G
G
G
G
G
G
G
STOP
DO NOT ENTER
AT
M
M
H116
NO PARKING FIRE LANE NO PARKING FIRE LANE
NO PARKING FIRE LANE
STOP
DO NOT ENTER
PROPOSED 1,748 SFDUNKIN DONUTS
PROPOSED1,159 SFRETAIL
TENANTSPACE
NO PARKING FIRE LANE NO PARKING FIRE LANE
NO PARKING FIRE LANE
STOP
DO NOT ENTER
PROPOSED 1,748 SFDUNKIN DONUTS
PROPOSED1,159 SFRETAIL
TENANTSPACE
RIDGELINE
RID
GE
LIN
E
RID
GELIN
E
MH
MH
121
120
120
121
118
118
119
120
121
119
119
119
119
119
119
119
118
118
118
118
117
FF = 119.40
MH
110 111
112 113
114 115
115
114113
112111
110
115.5
116
114
M
H
M
H
MH
MH
M
H116
116
117
116
117
DR
AIN
AG
E A
RE
A M
AP
CJS PDM 09/22/2020
PROPOSED WATERQUALITY MAP
STM-05
1" = 30'
Z:\PR
INC
ET
ON
\PR
I\2020\P
RI-
200007 3
RO
NSO
N -
1165 H
IGH
WA
Y 2
7, SO
MER
SET
, N
J\C
AD
D\E
XH
IBIT
S\D
RA
INA
GE E
XH
IBIT
\2020-0
9-1
5_(F
S)-D
RA
INA
GE A
REA
MA
P-S
OM
ER
SET
, N
J.D
WG
TITLE:
PROJECT ID:
DRAWING:
BY: DATE:
PRI-200007(H)
CHK:
SCALE:
Ruth
erf
ord
, N
J ·
New
York
, N
Y
Pri
nce
ton, N
J ·
Tam
pa,
FL ·
Detr
oit, M
I
ww
w.s
tonefield
eng.
com
15 S
pri
ng
Stre
et, P
rince
ton, N
J 0
8542
Phone 6
09.3
62.6
900
PROPERTY LINE
ADJACENT PROPERTY LINE
PROPOSED DRAINAGE AREA
PROPOSED PERVIOUS AREA
DESCRIPTIONSYMBOL
PROPOSED TC PATH
GRAPHIC SCALE IN FEET
0'
1" = 30'
30' 30' 60'
PAUL D. MUTCH Jr., P.E.NEW JERSEY LICENSE No. 55094
LICENSED PROFESSIONAL ENGINEER
TSS REMOVAL %
PROPOSED TSS REMOVAL SUMMARY TABLE(DRCC)
PROPOSED IMPERVIOUSTREATMENT AREA (SF)
80.00%
TOTAL AREA 11,660 SF
10,240 SF (FULL DEPTHPAVEMENT)
NEW FULL DEPTH ASPHALT AREA
(80% TSS REMOVAL PROPOSED)
80.00% 1,420 SF (BRICK PAVERS)
NEW FULL BRICK PAVER AREA
(80% TSS REMOVAL PROPOSED)
PR
OP
OS
ED
FA
ST
FO
OD
RE
ST
AU
RA
NT
AN
D R
ET
AIL
TE
NA
NT
SO
ME
RS
ET
CO
UN
TY
, N
EW
JE
RS
EY
3 R
ON
SON
, LL
C
TO
WN
SH
IP O
F F
RA
NK
LIN
1165 N
J S
TA
TE
RO
UT
E 2
7B
LO
CK
88.0
1, L
OT
43
RO
SE
LL
E, N
J 07203
115 E
AS
T 1
1T
H A
VE
NU
E
NJD
OT
AP
PL
ICA
TIO
N #
A-2
7-C
-23966-2
020