Rooty Hill Regional Distribution Centre - Quarterly ...
61
Aggregates Holcim (Australia) Pty Ltd Tower B, Level 8 799 Pacific Hwy Chatswood 2067 Australia ABN 87 099 732 297 Phone +61 2 9412 6600 Fax +61 2 9412 6601 www.holcim.com.au The copyright for this document and all appendices are reserved by Holcim Group Support Ltd 1/10 Rooty Hill Regional Distribution Centre - Quarterly Environmental Monitoring Summary 1 January – 31 March, 2014 1. INTRODUCTION This document provides a summary of environmental monitoring undertaken during Stage 2 construction activities at the Rooty Hill Regional Distribution Centre during the months of January – March 2014. The monitoring has been undertaken in accordance with the Project Approval consisting of: Environmental Assessment Reports and Statement of Commitments (SoCs), the Minister’s Conditions of Approval (MCoAs), and all management plans and strategies. 2. BACKGROUND Construction of the Regional Distribution Centre commenced in October 2011 with preliminary works (Stage 1) completed in March 2012. Stage 2 works commenced in January 2013. Works undertaken during the monitoring period consisted of the following: Commencing construction of radial stacker pad Construction of rail siding retaining walls and other structural works Construction of rail unloader Construction of stormwater drainage works Installation of protection slab for Jemena’s high pressure gas pipeline 3. COMPLAINTS No complaints have been received to date for the project. 4. MONITORING Monitoring undertaken during the monitoring period of January 1 – March 31 2014 consisted of attended noise, meteorological conditions, air quality, water quality , riparian health, macro- invertebrate and fish monitoring within Angus Creek. All monitoring was undertaken by a specialist consultant and all laboratory work was conducted by NATA (or equivalent) accredited testing facilities. The detailed monitoring reports are attached as appendices to this report. Table 1 provides a summary of the environmental monitoring undertaken during the monitoring period.
Transcript of Rooty Hill Regional Distribution Centre - Quarterly ...

Aggregates
Holcim (Australia) Pty Ltd
Tower B, Level 8
799 Pacific Hwy
Chatswood 2067
Australia
ABN 87 099 732 297
Phone +61 2 9412 6600
Fax +61 2 9412 6601
www.holcim.com.au
The copyright for this document and all appendices are reserved by Holcim Group Support Ltd 1/10
Rooty Hill Regional Distribution Centre - Quarterly Environmental Monitoring Summary
1 January – 31 March, 2014
1. INTRODUCTION
This document provides a summary of environmental monitoring undertaken during Stage 2 construction activities at the Rooty Hill Regional Distribution Centre during the months of January – March 2014. The monitoring has been undertaken in accordance with the Project Approval consisting of: Environmental Assessment Reports and Statement of Commitments (SoCs), the Minister’s Conditions of Approval (MCoAs), and all management plans and strategies.
2. BACKGROUND
Construction of the Regional Distribution Centre commenced in October 2011 with preliminary
works (Stage 1) completed in March 2012. Stage 2 works commenced in January 2013.
Works undertaken during the monitoring period consisted of the following:
Commencing construction of radial stacker pad
Construction of rail siding retaining walls and other structural works
Construction of rail unloader
Construction of stormwater drainage works
Installation of protection slab for Jemena’s high pressure gas pipeline
3. COMPLAINTS
No complaints have been received to date for the project.
4. MONITORING
Monitoring undertaken during the monitoring period of January 1 – March 31 2014 consisted
of attended noise, meteorological conditions, air quality, water quality , riparian health, macro-
invertebrate and fish monitoring within Angus Creek. All monitoring was undertaken by a
specialist consultant and all laboratory work was conducted by NATA (or equivalent)
accredited testing facilities. The detailed monitoring reports are attached as appendices to this
report. Table 1 provides a summary of the environmental monitoring undertaken during the
monitoring period.

The copyright for this document and all appendices are reserved by Holcim Group Support Ltd 2/10
Table 1 Summary of Quarterly Environmental Monitoring Jan – Mar 2014
Parameter Method Frequency Date Discussion/Compliance Status Actions Reference
Air quality PM10 Dust PM10 High
volume air sampler Every 6 days
January 2014 PM10 dust sampling results for January 2014 compliant with air quality limits outlined in Minister’s Condition of Approval 2.8
Continuation of existing dust management practices, targeting emission sources
Appendix A
February 2014 PM10 dust sampling results for February 2014 compliant with air quality limits outlined in Minister’s Condition of Approval 2.8
Appendix B
March 2014 PM10 dust sampling results for March 2014 compliant with air quality limits outlined in Minister’s Condition of Approval 2.8
Appendix C
Dust Deposition Dust deposition
gauges Monthly
January 2014 Dust deposition results for January 2014 compliant with air quality limits outlined in Minister’s Condition of Approval 2.8
Continuation of existing dust management practices, targeting emission sources
Appendix A
February 2014 Dust deposition results for February 2014 compliant with air quality limits outlined in Minister’s Condition of Approval 2.8
Appendix B
March 2014 Dust deposition results for March 2014 compliant with air quality limits outlined in Minister’s Condition of Approval 2.8
Appendix C
Water Quality
Water quality testing of Angus Creek at 6 monitoring locations
Quarterly February 2014
Water quality monitoring of Angus Creek was carried out on 17 February 2014 during a period of wet weather. The water quality of Angus and Eastern Creeks was poor at all sites and representative of a catchment influenced by mixed rural and urban land uses.
Water quality monitoring of Angus Creek to continue
Appendix D
Macro-Invertebrate Angus Creek
Monitoring of diversity of families SIGNAL 2
score using AUSRIVAS protocols
at 6 monitoring locations
Quarterly March 2014
Macroinvertebrate monitoring during Autumn 2014 indicates that Angus and Eastern Creeks are impaired and representative of a degraded catchment influenced by mixed rural and urban land uses, including both reference (AE6 Angus Creek upstream of RDC and AE5 Eastern Creek upstream of the confluence with Angus Creek) and impact sites. Although seasonal differences existed between Spring and Autumn, overall macroinvertebrate diversity was low and mostly consisted of taxa more tolerant to changing environmental conditions.
No action required Appendix D
Fish Monitoring (Angus Creek)
Bait trapping and sweep netting at 6
monitoring locations
Bi Annual (Spring 2013 and Autumn
2014)
March 2014
Fish monitoring during Autumn 2014 indicates that Angus and Eastern Creeks are impaired and representative of a degraded catchment influenced by mixed rural and urban land uses. The only native fish observed were short fined eels and long fined eels.
No action required Appendix D

3/10
Parameter Method Frequency Date Discussion/Compliance Status Actions Reference
Riparian Health and condition
NSW biometric vegetation condition
benchmark methodology at 6
monitoring locations
Quarterly February 2014
Vegetation across the six sampling sites ranged from low to moderate condition, showing some improvement in the condition of the riparian environment across almost all survey sites since the spring 2013 monitoring round.
The monitoring indicates that the results are consistent with previous monitoring events.
Riparian health and condition monitoring to continue.
Appendix E
Noise Attended construction noise monitoring at 5
locations Monthly
January 2014 Ambient levels compliant with noise criteria outlined in Minister’s Condition of Approval 2.3
Monthly noise monitoring to continue.
Appendix A
February 2014 Ambient levels compliant with noise criteria outlined in Minister’s Condition of Approval 2.3
Appendix B
March 2014 Ambient levels compliant with noise criteria outlined in Minister’s Condition of Approval 2.3
Appendix C
Meteorological Conditions
On site weather station
Daily
January 2014 Meteorological data recorded for January 2014. Monitoring of meteorological conditions to continue.
Appendix A
February 2014 Meteorological data recorded for February 2014. Appendix B
March 2014 Meteorological data recorded for March 2014. Appendix C
Terrestrial Ecology
Visual inspection of habitat and
vegetation conditions across site focussing on Juniper Leaved
Grevillea and Cumberland Plain
Woodland.
Quarterly February 2014
Juniper‐leaved Grevillea:
The spring survey of the southern grevillea population recorded 15 seedlings regenerating at the site, which is still lower than expected, although this increased to 28 seedlings in the southern population in summer 2014, representing a 53% increase in regeneration since the spring 2013 survey.
In the spring 2013 and summer 2014 monitoring rounds the site of the northern grevillea population of the showed signs of general ecological stress possibly due to long periods without rainfall.
Cumberland Plain Woodland:
The condition of Cumberland Plain Woodland at the RDC site varied across all 4 sampling points. Native plant species richness across all sites was considered moderate and sites of high to very high ratings for trees with hollows and fallen. Site scores generally remain consistent with the trends of previous surveys, with a slight decline at CPW3.
Quarterly monitoring will continue until such a time as bushland re
generation works commence. Appendix E

4/10
Parameter Method Frequency Date Discussion/Compliance Status Actions Reference
Traffic Visual inspections
and weekly checklists Daily January – March 2014
Daily inspections and weekly checklists undertaken by the Environmental Representative have not identified any non-compliances with the Construction Traffic Management Plan.
Monitoring to continue. N/A

The copyright for this document and all appendices are reserved by Holcim Group Support Ltd 5/10
If you have any questions or require any additional information, please contact Ibrahim
Muharrem (Holcim Environment Compliance and Community Officer) 0408 991 190 –

The copyright for this document and all appendices are reserved by Holcim Group Support Ltd 6/10
Appendix A Air Quality, Noise and Meteorology Monitoring Report January 2014

Monthly Environmental Monitoring Report
1
ROOTY HILL REGIONAL DISTRIBUTION CENTRE
Aspect Air Quality, Construction Noise and Meteorology
Date January 2014
SUMMARY
Monitoring period 1 January to 31 January
Parameters monitored in period Dust (PM10) / TSP Depositional Dust Construction Noise Local Meteorology
Exceedance summary No exceedances of PM10 or TSP dust criteria were recorded during January 2014.
No exceedances of depositional dust criteria were recorded during January 2014.
No exceedances of the construction noise management levels were recorded in January 2014.
Action required None
1. Monitoring Locations
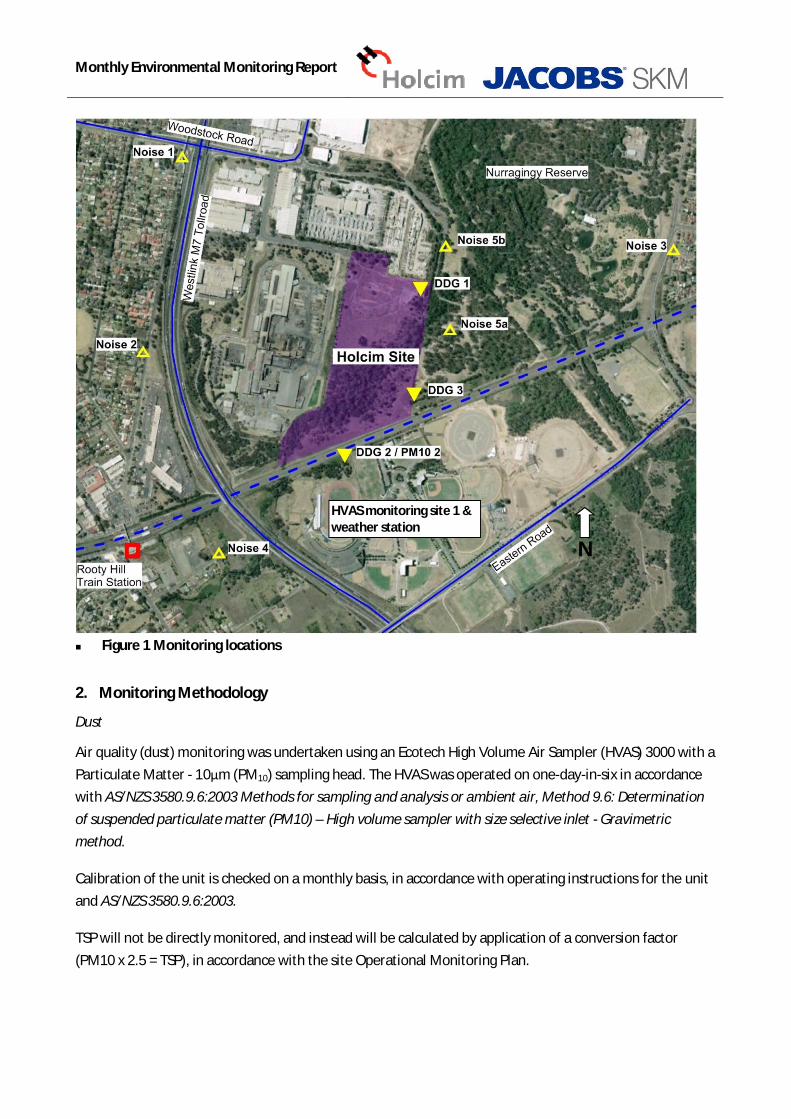
The monitoring locations at the Rooty Hill Regional Distribution Centre (RDC) for air quality, construction noise and meteorology are shown in Figure 1 and consist of:
Dust monitoring (PM10): Blacktown International Sportspark (formally Olympic Park) Dust monitoring (Depositional): Locations DDG 1 to DDG 3 Noise monitoring: Locations Noise 1 to Noise 5 Meteorology: Blacktown International Sportspark (formally Olympic Park)
Monthly Environmental Monitoring Report
Figure 1 Monitoring locations
2. Monitoring Methodology
Dust
Air quality (dust) monitoring was undertaken using an Ecotech High Volume Air Sampler (HVAS) 3000 with a Particulate Matter - 10 m (PM10) sampling head. The HVAS was operated on one-day-in-six in accordance with AS/NZS 3580.9.6:2003 Methods for sampling and analysis or ambient air, Method 9.6: Determination of suspended particulate matter (PM10) – High volume sampler with size selective inlet - Gravimetric method.
Calibration of the unit is checked on a monthly basis, in accordance with operating instructions for the unit and AS/NZS 3580.9.6:2003.
TSP will not be directly monitored, and instead will be calculated by application of a conversion factor (PM10 x 2.5 = TSP), in accordance with the site Operational Monitoring Plan.
N
HVAS monitoring site 1 & weather station

Monthly Environmental Monitoring Report
Depositional dust was monitored in accordance with AS/NZS 3580.10.1:2003 Methods for sampling and analysis of ambient air Method 10.1: Determination of particulate matter – Deposited matter – Gravimetric method.
Construction Noise
Construction noise was monitored for 15 minute attended periods in accordance with the requirements set out in the EPA (2000) Industrial Noise Policy and the DECC (2009) Interim Construction Noise Guidelines (ICNG). Monitoring was carried out using a SVAN 858 Type 1 Sound Level Meter by appropriately qualified personnel. Calibration of the unit was checked before and after each monitoring period, and the drift was below 0.5dB.
Local Meteorology
Meteorological conditions were monitored using a Davis Vantage Pro2 Plus monitoring unit. This unit was positioned in accordance with AS2923-1987 Ambient air – Guide for measurement of horizontal wind for air quality applications.
The Davis Vantage Pro2 plus meteorological station does not satisfy the accuracy requirements of AS 3580.14-2011 for wind speed and direction measurements. However, no monitoring standards are specified in the Project Approval and the accuracy of the proposed unit is considered sufficient for the purposes of construction impact management.
The integrity of the meteorological monitoring station is checked every six days.
3. Guidelines
Air Quality
Air quality (dust) criteria within the Project Conditions of Approval, specifically Statement of Commitment (SoC) 4.1 and the Construction Dust Management Plan (CDMP) mirror those in the NSW EPA document Approved methods for the modelling and assessment of air pollutants in New South Wales (DEC 2005). The air quality assessment criteria are outlined in Table 1, which apply cumulatively (that is, due to all sources of emissions and not just the contribution from the project).
Table 1 Air Quality Criteria
Pollutant Averaging period Concentration PM10 24 hours 50ug/m3
Annual 30ug/m3 TSP Annual 90ug/m3 Deposited dust Annual 4 g/m2/month*
* Depositional dust criteria contained in the NSW EPA methods specify a maximum contribution of 2g/m2/month, up to a maximum total depositional dust level of 4g/m2/month. This criterion assumes a typical existing load of 2g/m2/month, prior to the start of construction activities.
TSP will not be directly monitored, and instead will be calculated by application of a conversion factor (PM10 x 2.5 = TSP), in accordance with the site Operational Environmental Monitoring Plan.

Monthly Environmental Monitoring Report
Construction Noise
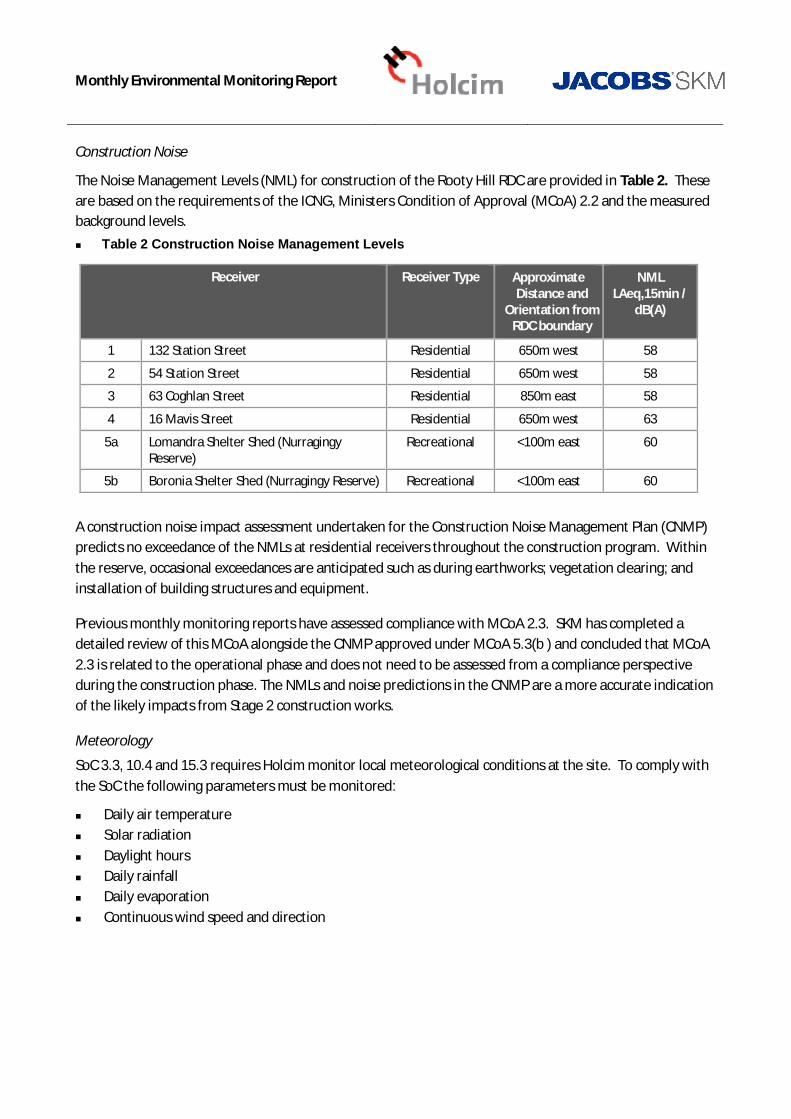
The Noise Management Levels (NML) for construction of the Rooty Hill RDC are provided in Table 2. These are based on the requirements of the ICNG, Ministers Condition of Approval (MCoA) 2.2 and the measured background levels.
Table 2 Construction Noise Management Levels
Receiver Receiver Type Approximate Distance and
Orientation from RDC boundary
NML LAeq,15min /
dB(A)
1 132 Station Street Residential 650m west 58
2 54 Station Street Residential 650m west 58
3 63 Coghlan Street Residential 850m east 58
4 16 Mavis Street Residential 650m west 63
5a Lomandra Shelter Shed (Nurragingy Reserve)
Recreational <100m east 60
5b Boronia Shelter Shed (Nurragingy Reserve) Recreational <100m east 60
A construction noise impact assessment undertaken for the Construction Noise Management Plan (CNMP) predicts no exceedance of the NMLs at residential receivers throughout the construction program. Within the reserve, occasional exceedances are anticipated such as during earthworks; vegetation clearing; and installation of building structures and equipment.
Previous monthly monitoring reports have assessed compliance with MCoA 2.3. SKM has completed a detailed review of this MCoA alongside the CNMP approved under MCoA 5.3(b ) and concluded that MCoA 2.3 is related to the operational phase and does not need to be assessed from a compliance perspective during the construction phase. The NMLs and noise predictions in the CNMP are a more accurate indication of the likely impacts from Stage 2 construction works.
Meteorology
SoC 3.3, 10.4 and 15.3 requires Holcim monitor local meteorological conditions at the site. To comply with the SoC the following parameters must be monitored:
Daily air temperature Solar radiation Daylight hours Daily rainfall Daily evaporation Continuous wind speed and direction

Monthly Environmental Monitoring Report
4. Monitoring results
Air Quality - PM10 / TSP
No exceedances of PM10 or TSP dust criteria were recorded during the month of January 2014.
Table 3 January PM10 and TSP Results
Date PM10 (ug/m3) TSP
Measured result Criteria Calculated result (PM10 x 2.5)
Criteria
6/01/2014 26.4 50 66.0 NA 12/01/2014 22.7 50 56.8 NA 18/01/2014 22.4 50 56.0 NA 24/01/2014 17.1 50 42.8 NA 30/01/2014 18.6 50 46.5 NA
Annual average (to date) 23.7 30 59.3 90
Air Quality - Depositional Dust No exceedances of depositional dust criteria were recorded during the month of January 2014.
Table 4 Depositional Dust Gauge Results January 2014
Total Insoluble Matter (g/m2/month) Goal (annual average) Location 1 2 3
27/12/2013 – 31/01/2014 1.8 2.6 1.1 N/A
Annual average 2.6 2.0** 2.3 4 g /m2/month ** Average does not include erroneous result obtained on 31/10/2013.
Construction Noise No exceedances of construction noise management levels were observed during January 2014.
The results of attended construction noise monitoring are presented in Table 5.

Monthly Environmental Monitoring Report
Table 5 Construction Noise Monitoring Results
Location Time Construction contribution LAeq LA10 LA90
NML LAeq,15min Notes
1
(132 Station St) 10:05 Inaudible 59 63 53 58
Holcim inaudible, M7 (constant 60-70), Woodstock avenue (55-65)
2
(54 Station St) 9:45 Inaudible 62 62 53 58
Holcim inaudible, M7 (constant 55-60), local traffic (65-70), birds
3
(63 Coghlan St) 9:00 Inaudible 61 62 52 58
Holcim inaudible, Knox Rd traffic (constant 55-65), birds, nearby roadworks
4
(16 Mavis St) 9:25 Inaudible 58 62 53 63
Holcim inaudible, M7 (constant 55-60), birds / insects
5a
(Lomandra Shelter Shed [Nurragingy Reserve]) 10:35 ~45 LAeq 51 53 48 60
Holcim (backhoe 50-55 for 1-2 minute period only), train, birds / insects
5b
(Boronia Shelter Shed [Nurragingy Reserve]) 10:55 Inaudible 53 53 47 60
Holcim inaudible, Hume industrial area (45-55)

Monthly Environmental Monitoring Report
Local Meteorology
A wind rose showing the proportion of direction and strength of winds throughout the reporting period is below. A complete data set, including, humidity, temperature and rainfall is provided separately.
The wind rose shows that areas to the north and north west of the site were the most likely to be impacted by construction generated dust. This area includes the industrial areas on Kellogg.

The copyright for this document and all appendices are reserved by Holcim Group Support Ltd 7/10
Appendix B Air Quality, Noise and Meteorology Monitoring Report February 2014

1
ROOTY HILL REGIONAL DISTRIBUTION CENTRE
MONTHLY ENVIRONMENTAL MONITORING REPORT
Aspect Air Quality, Construction Noise and Meteorology
Date February 2014
SUMMARY
Monitoring period 1 February to 28 February
Parameters monitored in period Dust (PM10) / TSP Depositional Dust Construction Noise Local Meteorology
Exceedance summary No exceedances of PM10 or TSP dust criteria were recorded during February 2014.
No exceedances of depositional dust criteria were recorded during February 2014.
No exceedances of the construction noise management levels were recorded in February 2014.
Action required None
1. Monitoring Locations
The monitoring locations at the Rooty Hill Regional Distribution Centre (RDC) for air quality, construction noise and meteorology are shown in Figure 1 and consist of:
Dust monitoring (PM10): Blacktown International Sportspark (formally Olympic Park) Dust monitoring (Depositional): Locations 1 to 3 Noise monitoring: Locations 2 to 5 Meteorology: Blacktown International Sportspark (formally Olympic Park)

Monthly Environmental Monitoring Report
Figure 1 Monitoring locations
2. Monitoring Methodology
Dust
Air quality (dust) monitoring was undertaken using an Ecotech High Volume Air Sampler (HVAS) 3000 with a Particulate Matter - 10 m (PM10) sampling head. The HVAS was operated on one-day-in-six in accordance with AS/NZS 3580.9.6:2003 Methods for sampling and analysis or ambient air, Method 9.6: Determination of suspended particulate matter (PM10) – High volume sampler with size selective inlet - Gravimetric method.
Calibration of the unit is checked on a monthly basis, in accordance with operating instructions for the unit and AS/NZS 3580.9.6:2003.
TSP will not be directly monitored, and instead will be calculated by application of a conversion factor (PM10 x 2.5 = TSP), in accordance with the site Operational Monitoring Plan.
N
HVAS monitoring site 1 & weather station

Monthly Environmental Monitoring Report
Depositional dust was monitored in accordance with AS/NZS 3580.10.1:2003 Methods for sampling and analysis of ambient air Method 10.1: Determination of particulate matter – Deposited matter – Gravimetric method.
Construction Noise
Construction noise was monitored for 15 minute attended periods in accordance with the requirements set out in the EPA (2000) Industrial Noise Policy and the DECC (2009) Interim Construction Noise Guidelines (ICNG). Monitoring was carried out using a SVAN 858 Type 1 Sound Level Meter by appropriately qualified personnel. Calibration of the unit was checked before and after each monitoring period, and the drift was below 0.5dB.
Local Meteorology
Meteorological conditions were monitored using a Davis Vantage Pro2 Plus monitoring unit. This unit was positioned in accordance with AS2923-1987 Ambient air – Guide for measurement of horizontal wind for air quality applications.
The Davis Vantage Pro2 plus meteorological station does not satisfy the accuracy requirements of AS 3580.14-2011 for wind speed and direction measurements. However, no monitoring standards are specified in the Project Approval and the accuracy of the proposed unit is considered sufficient for the purposes of construction impact management.
The integrity of the meteorological monitoring station is checked every six days.
3. Guidelines
Air Quality
Air quality (dust) criteria within the Project Conditions of Approval, specifically Statement of Commitment (SoC) 4.1 and the Construction Dust Management Plan (CDMP) mirror those in the NSW EPA document Approved methods for the modelling and assessment of air pollutants in New South Wales (DEC 2005). The air quality assessment criteria are outlined in Table 1, which apply cumulatively (that is, due to all sources of emissions and not just the contribution from the project).
Table 1 Air Quality Criteria
Pollutant Averaging period Concentration PM10 24 hours 50ug/m3
Annual 30ug/m3 TSP Annual 90ug/m3 Deposited dust Annual 4 g/m2/month*
* Depositional dust criteria contained in the NSW EPA methods specify a maximum contribution of 2g/m2/month, up to a maximum total depositional dust level of 4g/m2/month. This criterion assumes a typical existing load of 2g/m2/month, prior to the start of construction activities.
TSP will not be directly monitored, and instead will be calculated by application of a conversion factor (PM10 x 2.5 = TSP), in accordance with the site Operational Environmental Monitoring Plan.
Monthly Environmental Monitoring Report
Construction Noise
The Noise Management Levels (NML) for construction of the Rooty Hill RDC are provided in Table 2. These are based on the requirements of the ICNG, Ministers Condition of Approval (MCoA) 2.2 and the measured background levels.
Table 2 Construction Noise Management Levels
Receiver Receiver Type Approximate Distance and
Orientation from RDC boundary
NML LAeq,15min /
dB(A)
1 132 Station Street Residential 650m west 58
2 54 Station Street Residential 650m west 58
3 63 Coghlan Street Residential 850m east 58
4 16 Mavis Street Residential 650m west 63
5a Lomandra Shelter Shed (Nurragingy Reserve)
Recreational <100m east 60
5b Boronia Shelter Shed (Nurragingy Reserve) Recreational <100m east 60
A construction noise impact assessment undertaken for the Construction Noise Management Plan (CNMP) predicts no exceedance of the NMLs at residential receivers throughout the construction program. Within the reserve, occasional exceedances are anticipated such as during earthworks; vegetation clearing; and installation of building structures and equipment.
Previous monthly monitoring reports have assessed compliance with MCoA 2.3. SKM has completed a detailed review of this MCoA alongside the CNMP approved under MCoA 5.3(b ) and concluded that MCoA 2.3 is related to the operational phase and does not need to be assessed from a compliance perspective during the construction phase. The NMLs and noise predictions in the CNMP are a more accurate indication of the likely impacts from Stage 2 construction works.
Meteorology
SoC 3.3, 10.4 and 15.3 requires Holcim monitor local meteorological conditions at the site. To comply with the SoC the following parameters must be monitored:
Daily air temperature Solar radiation Daylight hours Daily rainfall Daily evaporation Continuous wind speed and direction

Monthly Environmental Monitoring Report
4. Monitoring results
Air Quality
PM10 / TSP
No exceedances of PM10 or TSP dust criteria were recorded during the month of February 2014.
Table 3 February PM10 and TSP Results
Date PM10 (ug/m3) TSP
Measured result Criteria Calculated result (PM10 x 2.5)
Criteria
5/02/2014 17.7 50 44.3 NA 11/02/2014 29.0 50 72.5 NA 17/02/2014 15.3 50 38.3 NA 23/02/2014 19.6 50 49.0 NA 1/03/2014 9.4 50 23.5 NA
Annual average (to date) 22.6 56.6
Depositional Dust
No exceedances of depositional dust criteria were recorded during the month of February 2014.
Table 4 Depositional Dust Gauge Results February 2014
Total Insoluble Matter (g/m2/month) Goal (annual average) Location 1 2 3
31/01/2014 – 01/03/2014 1.2 1.3 2.2 N/A
Annual average 2.6 2.0** 2.3 4 g /m2/month ** Average does not include erroneous result obtained on 31/10/2013.
Construction Noise
No exceedances of construction noise management levels were observed during February 2014.
Small scale earthworks were being carried out in the northern and southern areas of the site. Audible noise included truck movements between the two work areas, and earthmoving equipment in the south.
The results of attended construction noise monitoring are presented in Table 5.

Monthly Environmental Monitoring Report
Table 5 Construction Noise Monitoring Results
Location Start Construction contribution LAeq
LAeq LA10 LA90
NML LAeq,15
min / dB(A)
Notes
1 (132 Station St) 12.30 IA 53 58 51 58
Holcim inaudible, M7 (constant 60-70), Woodstock avenue (55-65), birds, aeroplane.
2 (54 Station St) 12.50 IA 55 57 54 58
Holcim inaudible, M7 (constant 55-60), local traffic (55 - 60), birds, residential noise.
3 (63 Coghlan St) 14.35 IA 48 60 48 58 Holcim inaudible, train, Knox Rd traffic (constant 50-65).
4 (16 Mavis St) 13.15 IA 46 56 45 63
Holcim inaudible, M7 (constant 50-60), residential noise, birds / insects, aeroplane.
5a (Lomandra Shelter Shed [Nurragingy Reserve]) 13.55 40-45 52 55 51 60
Holcim (banging 53, reverse alarms 51, engines 56), construction in reserve (65-70), birds, local traffic.
5b
(Boronia Shelter Shed [Nurragingy Reserve]) 14.10 40-45 60 67 60 60
Holcim (trucks 55, hammering 66), construction in reserve (65-70), birds.
*IA - Inaudible

Monthly Environmental Monitoring Report
Local Meteorology
A wind rose showing the proportion of direction and strength of winds throughout the reporting period is below. A complete data set, including, humidity, temperature and rainfall is provided separately.
The wind rose shows that areas to the north and north west of the site were the most likely to be impacted by construction generated dust. This area includes the industrial areas on Kellogg Road.

The copyright for this document and all appendices are reserved by Holcim Group Support Ltd 8/10
Appendix C Air Quality, Noise and Meteorology Monitoring Report March 2014

ROOTY HILL REGIONAL DISTRIBUTION CENTRE
MONTHLY ENVIRONMENTAL MONITORING REPORT
Aspect Air Quality, Construction Noise and Meteorology
Date March 2014
SUMMARY
Monitoring period 1 March to 31 March 2014
Parameters monitored in period Dust (PM10) / TSP Depositional Dust Construction Noise Local Meteorology
Exceedance summary No exceedances of PM10 or TSP dust criteria were recorded during March 2014.
No exceedances of depositional dust criteria were recorded during March 2014.
No exceedances of the construction noise management levels were recorded in March 2014.
Action required None
1. Monitoring Locations
The monitoring locations at the Rooty Hill Regional Distribution Centre (RDC) for air quality, construction noise and meteorology are shown in Figure 1 and consist of:
Dust monitoring (PM10): Blacktown International Sportspark (formally Olympic Park) Dust monitoring (Depositional): Locations 1 to 3 Noise monitoring: Locations 2 to 5 Meteorology: Blacktown International Sportspark (formally Olympic Park)

Monthly Environmental Monitoring Report
Figure 1 Monitoring locations
2. Monitoring Methodology
Dust
Air quality (dust) monitoring was undertaken using an Ecotech High Volume Air Sampler (HVAS) 3000 with a Particulate Matter - 10 m (PM10) sampling head. The HVAS was operated on one-day-in-six in accordance with AS/NZS 3580.9.6:2003 Methods for sampling and analysis or ambient air, Method 9.6: Determination of suspended particulate matter (PM10) – High volume sampler with size selective inlet - Gravimetric method. Due to a damaged filter, no results were available for the 7 March 2014.
Calibration of the unit is checked on a monthly basis, in accordance with operating instructions for the unit and AS/NZS 3580.9.6:2003.
TSP will not be directly monitored, and instead will be calculated by application of a conversion factor (PM10 x 2.5 = TSP), in accordance with the site Operational Monitoring Plan.
Depositional dust was monitored in accordance with AS/NZS 3580.10.1:2003 Methods for sampling and analysis of ambient air Method 10.1: Determination of particulate matter – Deposited matter – Gravimetric method.
N
HVAS monitoring site 1 & weather station

Monthly Environmental Monitoring Report
Construction Noise
Construction noise was monitored for 15 minute attended periods in accordance with the requirements set out in the EPA (2000) Industrial Noise Policy and the DECC (2009) Interim Construction Noise Guidelines (ICNG). Monitoring was carried out using a SVAN 858 Type 1 Sound Level Meter by appropriately qualified personnel. Calibration of the unit was checked before and after each monitoring period, and the drift was below 0.5dB.
Local Meteorology
Meteorological conditions were monitored using a Davis Vantage Pro2 Plus monitoring unit. This unit was positioned in accordance with AS2923-1987 Ambient air – Guide for measurement of horizontal wind for air quality applications.
The Davis Vantage Pro2 plus meteorological station does not satisfy the accuracy requirements of AS 3580.14-2011 for wind speed and direction measurements. However, no monitoring standards are specified in the Project Approval and the accuracy of the proposed unit is considered sufficient for the purposes of construction impact management.
The integrity of the meteorological monitoring station is checked every six days.
3. Guidelines
Air Quality
Air quality (dust) criteria within the Project Conditions of Approval, specifically Statement of Commitment (SoC) 4.1 and the Construction Dust Management Plan (CDMP) mirror those in the NSW EPA document Approved methods for the modelling and assessment of air pollutants in New South Wales (DEC 2005). The air quality assessment criteria are outlined in Table 1, which apply cumulatively (that is, due to all sources of emissions and not just the contribution from the project).
Table 1 Air Quality Criteria
Pollutant Averaging period Concentration PM10 24 hours 50ug/m3
Annual 30ug/m3 TSP Annual 90ug/m3 Deposited dust Annual 4 g/m2/month*
* Depositional dust criteria contained in the NSW EPA methods specify a maximum contribution of 2g/m2/month, up to a maximum total depositional dust level of 4g/m2/month. This criterion assumes a typical existing load of 2g/m2/month, prior to the start of construction activities.
TSP will not be directly monitored, and instead will be calculated by application of a conversion factor (PM10 x 2.5 = TSP), in accordance with the site Operational Environmental Monitoring Plan.

Monthly Environmental Monitoring Report
Construction Noise
The Noise Management Levels (NML) for construction of the Rooty Hill RDC are provided in Table 2. These are based on the requirements of the ICNG, Ministers Condition of Approval (MCoA) 2.2 and the measured background levels.
Table 2 Construction Noise Management Levels
Receiver Receiver Type Approximate Distance and
Orientation from RDC boundary
NML LAeq,15min /
dB(A)
1 132 Station Street Residential 650m west 58
2 54 Station Street Residential 650m west 58
3 63 Coghlan Street Residential 850m east 58
4 16 Mavis Street Residential 650m west 63
5a Lomandra Shelter Shed (Nurragingy Reserve)
Recreational <100m east 60
5b Boronia Shelter Shed (Nurragingy Reserve) Recreational <100m east 60
A construction noise impact assessment undertaken for the Construction Noise Management Plan (CNMP) predicts no exceedance of the NMLs at residential receivers throughout the construction program. Within the reserve, occasional exceedances are anticipated such as during earthworks; vegetation clearing; and installation of building structures and equipment.
Previous monthly monitoring reports have assessed compliance with MCoA 2.3. SKM has completed a detailed review of this MCoA alongside the CNMP approved under MCoA 5.3(b ) and concluded that MCoA 2.3 is related to the operational phase and does not need to be assessed from a compliance perspective during the construction phase. The NMLs and noise predictions in the CNMP are a more accurate indication of the likely impacts from Stage 2 construction works.
Meteorology
SoC 3.3, 10.4 and 15.3 requires Holcim monitor local meteorological conditions at the site. To comply with the SoC the following parameters must be monitored:
Daily air temperature Solar radiation Daylight hours Daily rainfall Daily evaporation Continuous wind speed and direction

Monthly Environmental Monitoring Report
4. Monitoring results
Air Quality
PM10 / TSP
No exceedances of PM10 or TSP dust criteria were recorded during the month of March 2014.
Due to a damaged filter, no results were available for the 7 March 2014.
Table 3 March PM10 and TSP Results
Date PM10 (ug/m3) TSP
Measured result Criteria Calculated result (PM10 x 2.5)
Criteria
1/03/2014 9.4 50 23.5 NA 07/03/2014 Filter damaged 12/03/2014 27.2 50 68.0 NA
17/03/2014 16.2 50 40.5 NA
24/03/2014 23.0 50 57.5 NA
28/03/2014 16.4 50 41.0 NA Annual average (to date) 22.7 55.5
Depositional Dust
No exceedances of depositional dust criteria were recorded during the month of March 2014.
Table 4 Depositional Dust Gauge Results March 2014
Total Insoluble Matter (g/m2/month) Goal (annual average) Location 1 2 3
01/03/2014 – 02/04/2014 1.9 2.4 1.5 N/A
Annual average 2.5 2.0** 2.2 4 g /m2/month ** Average does not include erroneous result obtained on 31/10/2013.
Construction Noise
No exceedances of construction noise management levels were observed during March 2014.
Small scale earthworks were being carried out in the northern and southern areas of the site during the start of the month, these escalated in scale towards the end of March. Audible noise included truck movements between the two work areas, and cranes and earthmoving equipment in the south.
The results of attended construction noise monitoring are presented in Table 5.

Monthly Environmental Monitoring Report
Table 5 Construction Noise Monitoring Results
Location Start Construction contribution
LAeq LAeq LA10 LA90
NML LAeq,15
min / dB(A)
Notes
1 (132 Station St) 9:50 IA 55 56 55 58 Holcim inaudible, M7 (constant 60-65), birds
2 (54 Station St) 10:10 IA 57 58 57 58 Holcim inaudible, M7 (constant 55-60), local traffic (55 - 65), birds
3 (63 Coghlan St) 11:00 IA 54 55 53 58 Holcim inaudible, train, Knox Rd traffic (constant 55)
4 (16 Mavis St) 11:30 IA 50 51 49 63 Holcim inaudible, M7 (constant 55-60), birds / insects, aeroplane, trains
5a (Lomandra Shelter Shed [Nurragingy Reserve]) 10:55 55 56 57 55 60
Holcim (Crane operating close to monitoring location 55-60, occasional trucks 60), birds, local traffic
5b
(Boronia Shelter Shed [Nurragingy Reserve]) 11:20 35-40 48 49 48 60
Holcim (occasional trucks 50, bucket bangs 55), birds, local traffic
*IA - Inaudible

Monthly Environmental Monitoring Report
Local Meteorology
A wind rose showing the proportion of direction and strength of winds throughout the reporting period is below. A complete data set, including, humidity, temperature and rainfall is provided separately.
The wind rose shows that areas to the north and north west of the site were the most likely to be impacted by construction generated dust. This area includes the industrial areas on Kellogg Road.

The copyright for this document and all appendices are reserved by Holcim Group Support Ltd 9/10
Appendix D Aquatic Ecology Annual Report October 2014

Rooty Hill Regional Distribution Centre
HOLCIM
Aquatic Ecology Annual Report
Revision 1
EN03250
08 Oct 2014
Document history and status
Revision Date Description By Review Approved
1 8/10/2014 Technical Review Mirella Verhoeven Technical Sarah
Douglass
Distribution of copies
Revision Issue
approved
Date issued Issued to Comments
1 Final 7 Nov 2014 Holcim

Aquatic Ecology Annual Report
i
Rooty Hill Regional Distribution Centre Environmental Compliance Monitoring and
Reporting
Project no: EN03250
Document title: Aquatic Ecology Annual Report
Document no: 1
Revision: Draft
Date: 9 October 2014
Client name: Holcim Australia
Project manager:
Author: Sarah Douglass, Mirella Verhoeven
File name: I:\ENVR\Projects\EN03250\Technical\Aquatic Ecology\Aquatic Ecology Analysis Year
2\Rooty Hill Regional Distribution Centre - Aquatic ecology annual report Rev 1.docx
Jacobs Group (Australia) Pty Limited
ABN 37 001 024 095
Level 5, 33 King William Street
Adelaide SA 5000 Australia
PO Box 8291
T +61 8 8424 3800
F +61 8 8424 3810
www.jacobs.com
COPYRIGHT: The concepts and information contained in this document are the property of Jacobs Group (Australia) Pty Limited. Use or copying
of this document in whole or in part without the written permission of Jacobs constitutes an infringement of copyright.

Aquatic Ecology Annual Report
ii
Contents
1. Background ................................................................................................................................................ 1
2. Methodology .............................................................................................................................................. 3
2.1 Water Quality .................................................................................................................................................................................. 4
2.2 Fish ................................................................................................................................................................................................. 5
2.3 Macroinvertebrates ......................................................................................................................................................................... 6
2.3.1 Field sampling ................................................................................................................................................................................. 6
2.3.2 Data Analyses ................................................................................................................................................................................. 6
3. Results and Discussion ............................................................................................................................ 9
3.1 Water Quality .................................................................................................................................................................................. 9
3.2 Fish ............................................................................................................................................................................................... 11
3.3 Macroinvertebrates ....................................................................................................................................................................... 12
3.3.1 Year 2 – Spring 2013 and Autumn 2014....................................................................................................................................... 12
3.4 Consolidated Discussion............................................................................................................................................................... 15

Aquatic Ecology Annual Report
Page 1
1. Background
Jacobs was commissioned by Holcim to undertake an aquatic ecology assessment of waterways in the vicinity
of the proposed Regional Distribution Centre (RDC) located at Kellogg Road, Rooty Hill NSW within the
Blacktown Local Government Area (LGA).
The RDC will allow Holcim to receive construction material by rail from quarries located outside of the Sydney
Basin, blend the materials to meet customer specifications and distribute these by road to the Sydney market.
The construction materials received will include single size crushed aggregate, blended crushed aggregates
and natural/manufactured sand, typically used for the manufacture of concrete and asphalt as well as a variety
of other uses in the civil and construction industries. Holcim currently supplies the bulk of these materials
through the Penrith Lakes Development Corporation (PLDC), however the resource at this site is nearly
depleted and the facility will wind down to closure by mid-2014.
The RDC site comprises 15 hectares and is bounded by the Main Western Railway Line to the south, the
Nurragingy Reserve to the East, the OneSteel Mini Mill, Humes and other industrial facilities to the north. Angus
Creek, a tributary of the Eastern Creek, flows through the southern portion of the site. The site was chosen due
to the unique access opportunities that include the Main Western Railway and M7 Motorway.
Blacktown City Council has elected to close North Parade which runs parallel to the Main Western Railway Line,
instead of relocating the existing public road through the project area. Once closed Holcim will purchase the
land occupied by North Parade to enable construction of a rail siding.
Once operational, the Rooty Hill RDC will operate 24 hours a day, seven (7) days a week and will be capable of
handling up to four (4) million tonnes of product per annum.
Stage 1 construction works for the project commenced in October 2011 and included the Angus Creek Road
Bridge, northern noise wall and a construction stage sedimentation basin. These works concluded in April 2012.
Stage 2 construction works commenced in January 2013. Stage 2 works include: construction of the rail siding;
rail aggregate unloading facility; on-ground concrete storage and the load out facility; conveyor system;
workshop; stores; site offices; truck wash down; truck refuelling; weighbridges; parking; dust control system; site
paving; connection to services; and local road upgrades in the vicinity of the project site.
The aquatic ecology assessment forms part of the compliance monitoring and reporting associated with the
construction of Stage 2. It has been undertaken in compliance with the following obligations:
Macroinvertebrates
Monitor the aquatic ecology of Angus and Eastern Creeks (MCoA 2.28A).
Undertake macroinvertebrate monitoring in Spring and Summer (SoC 7.5).
Ensure monitoring requirements identified in the EAR (SoC 15.2) are incorporated which includes
macroinvertebrate monitoring following AUSRIVAS protocols in spring and summer at Angus Creek above
and below the development site and Eastern Creek above and below the entrance to Angus Creek
Fish
Monitor aquatic ecology at four locations with Nurragingy Reserve (MCoA 2.28A (b)).
Ensure the monitoring requirements identified in the EAR (SoC 15.2) are incorporated which involves
undertaking a brief fish monitoring program, including bait trapping and sweep netting at Angus and Eastern
Creek, fyke and seine netting at Eastern Creek and consideration of electrofishing if conductivity and
turbidity improve.
Monitor for the presence of fish in Angus and Eastern Creeks as per MCoA 2.28A (b) and SoC15.2 which
requires implementation of the monitoring requirements of the EAR.

Aquatic Ecology Annual Report
Page 2
Water Quality
Monitor aquatic ecology of Angus and Eastern Creeks as outlined in the Statement of Commitments, and
expand this monitoring program to:
- Ensure that baseline data is collected, including commencement of sampling not less than six months
before commencement of construction and the use of control sites
- Include monitoring of water quality and aquatic ecology at four locations within Nurragingy Reserve
- Not include the site sampled on Eastern Creek (E01 in technical report 4 of EAR) as a monitoring site
but use at least two other locations; and
- Make provision for monitoring in relation to wet and dry periods (MCoA 2.28A)
Ensure water quality monitoring is undertaken every quarter (SoC 7.5).
Implement the environmental monitoring program for the Angus Creek Corridor aquatic ecology noted in the
CEMP (SoC 10.4 and 15.3).

Aquatic Ecology Annual Report
Page 3
2. Methodology
Water quality and aquatic ecology (fish and macroinvertebrate) sampling was conducted at six (6) sites. Four of
these were located on Angus Creek and two on Eastern Creek (Refer Figure 2.1 and Table 2.1). Surface water
quality was monitored quarterly and aquatic ecology was sampled bi-annually in autumn and spring, Table 2.2
provides details on sampling frequency.
Figure 2.1 : Monitoring Locations
Table 2.1 : Site Locations
Site Code Location Easting Northing
AE6 Angus Creek, 500m upstream RDC^ 300836.90 6261037.45
AE1 Angus Creek at upstream boundary of RDC 301056.00 6261486.00
AE2 Angus Creek at downstream boundary of RDC 301349.87 6261811.50
AE3 Angus Creek 150m downstream of RDC culvert 301414.04 6261845.01
AE4 Eastern Creek downstream of Angus Creek confluence 301492.55 6261990.88
AE5 Eastern Creek upstream of Angus Creek confluence^ 301580.40 6261910.60

Aquatic Ecology Annual Report
Page 4
Table 2.2 : Monitoring Frequency
Monitoring
Frequency
Sample Type Date Comments
Year 1 Surface Water Dry weather -7 November 2012
Wet weather- 29 January 2013
Dry weather - 26-27 March 2013
Wet weather - 3 June 2013
Aquatic Ecology Spring 2012 (8-10 October)
Autumn 2013 (25-27 March)
Year 2 Surface Water Dry Weather- 14-16 Oct 2013
Wet Weather - 17 February 2014
Dry Weather- 10-11 April 2014
Dry Weather -1 July 2014*
Only one wet weather event met
the rainfall thresholds in Year 2,
thus an additional dry weather trip
was conducted in July 2014.
Aquatic Ecology Spring 2013 (14-16 Oct 2013)
Autumn 2014 (24 March 2014, 10-11
April 2014)
Autumn 2014 sampling commenced
on the 24th of March at sites AE4 &
AE5, however significant rainfall
prevented site access to the
remaining sites, which were
sampled from 10-11 April 2014.
SKM ecologists are licensed to conduct field surveys under the National Parks and Wildlife Service Scientific
Research Permit SL100044, Fisheries Permit P06/0066.4 and the Department of Primary Industries Animal
Research Authority (09/1895).
2.1 Water Quality
Water quality sampling was undertaken both in situ and via grab samples. In situ sampling was undertaken
using a calibrated Hydrolab Quanta Water Quality Probe. The following indicators were measured:
pH (pH Units)
Turbidity (NTU)
Temperature (°C)
Dissolved Oxygen (% saturation and mg/L)
Electrical conductivity (µS/cm and ms/cm).
Three replicate readings of each indicator were taken within a 50m radius from approximately 30cm below the
surface at each site. Readings were recorded onto a field data sheet together with additional information
including: site code, site name, location and coordinates, date and time of sampling, details of team members
collecting samples, weather conditions, water surface conditions, presence of nuisance organisms, presence of
oily films, odour etc.
Grab samples were collected concurrently with In situ water monitoring at each site for analysis of total nitrogen
and total phosphorus concentrations. Sampling was conducted in accordance with the Australian/New Zealand
standards for water quality sampling (AS/NZS 5667.1:1998). Samples were collected in the appropriate bottles
and stored on ice as per the preservation techniques appropriate for analysis. Samples were then transported
to Envirolab in Chatswood for ex-situ analysis.

Aquatic Ecology Annual Report
Page 5
Water quality results have been compared to default trigger values in the ANZECC/ARMCANZ (2000) guideline
for protection of lowland river aquatic ecosystems. These trigger values are provided in Table 2.3.
Table 2.3 : ANZECC/ARMCANZ (2000) Guidelines
Water quality Indicator Default Trigger Values
Temp (°C) N/A
Turbidity (NTU) 6-50
DO (% sat) 85-110
Electrical Conductivity (µS/cm) 125-2200
TDS (g/L) N/A
pH 6.5-8.5
Total Nitrogen (mg/L) 0.5
Total Phosphorus (mg/L) 0.05
2.2 Fish
Fish surveys were conducted at the six (6) sites using passive fish sampling techniques. The variety of these
sampling methodologies increases the probability of sampling a wider range of species and size classes. A
description of the fish sampling methodologies is provided below.
Fyke nets were used to trap mobile, large bodied fish. Depending upon habitat availability between two to four
fyke nets were set for a minimum of two hours. Large single-wing fyke nets with 4m leaders were set with the
cod-end on one bank with the wing attached midstream. The cod-end of each fyke was always suspended out
of the water to avoid the mortality of captured air breathing vertebrates.
Bait traps were used to trap mobile, small bodied fish. At each site, 10 bait traps (unbaited 45 25 25 cm
traps) were set in shallow habitats for a minimum of two hours. Where possible, traps were set in stands of
emergent vegetation, areas with submerged vegetation, or snag piles, as these areas are likely to have a
greater diversity and abundance of small bodied fish.
Seine nets were not used due to the large abundance of woody snags throughout the channel, preventing the
seine net from being pulled through the water. Backpack electrofishing was also not conducted due to the
elevated conductivities within the study area and associated health hazards.
All fish captured were identified and measured to the nearest 1mm. Fork length were measured for fork-tailed
species and total length for all other fish species. Before release each fish was examined on both sides for any
injuries, diseases, parasites, or abnormalities. Eels can occur in large numbers at some sites and can be difficult
to handle, so to minimise handling stress and the risk of injury to the eels they were netted and whilst in the net
identified and examined. Eel lengths were estimated to the nearest 20mm. Any fish seen but not captured were
identified and listed as an observed individual where possible.
Total fish abundance (number of individuals), richness (number of taxa) and the ratio of native to alien fish
diversity were recorded and reported.

Aquatic Ecology Annual Report
Page 6
2.3 Macroinvertebrates
Macroinvertebrates were sampled at each of the six locations in accordance with the NSW AUSRIVAS protocol
during Spring (15th September to 15th December) and Autumn (15th March to 15
th June) sampling period.
2.3.1 Field sampling
The AUSRIVAS sampling site at each location was 100m in length. At each of the six locations
macroinvertebrates were collected from edge habitats. Edge habitats are defined as the creek bank in areas of
little or no flow, including alcoves and backwaters, with abundant leaf litter, fine sediment deposits, macrophyte
beds and overhanging bank vegetation (Turak et al. 2004). Edge samples were collected from 10m of
representative edge sub-habitats using a 0.25mm mesh size kick net to dislodge macroinvertebrates, whilst
noting physical habitat conditions of the sampled locations. Care was taken to ensure all sub-habitats within the
site were represented within the sample.
Riffle habitats were not sampled at any location due to a lack of suitable riffle habitat. Riffle habitats are defined
as areas of broken water with rapid current.
Macroinvertebrate samples were live sorted in the field for a minimum of 40 minutes. If new taxa were collected
between the 30 to 40 minute period, picking continued for an additional 10 minutes. If no new taxa were found
after the additional 10 minutes, sorting stopped. If new taxa were found, picking continued for a further 10
minutes. The maximum sorting time was 60 minutes. All picked animals were preserved in ethanol and
transferred to the laboratory for identification. Specific care was taken to ensure cryptic, fast moving or micro-
crustacean taxa were represented.
2.3.2 Data Analyses
All macroinvertebrates were identified to the family level of taxonomic resolution, with the exception of
Oligochaeta (class), Ostracoda (subclass), Acarina (order), Nematoda (Phylum) and Chironomidae (subfamily)
as per the AUSRIVAS model requirements.
The total abundance (number of individuals collected), richness (number of taxonomic groups) and EPT
richness were calculated for both seasons. EPT richness is the sum of the number of families from the orders
Ephemeroptera, Plecoptera and Trichoptera. EPT families are typically sensitive to disturbance so their
presence or absence can provide information about stream health. Values less than 1 indicate poor ecological
conditions; values between 2 and 5 indicate moderate ecological conditions and anything greater indicate good
ecological conditions.
The AUSRIVAS program uses mathematical models to compare observed macroinvertebrate taxa against a
modelled reference condition. These comparisons provide a measure of biological impairment. Predictor
variables (including physical habitat variables, latitude, longitude, altitude, slope and distance from source) are
used to model the predicted reference condition for each sampling site. Latitude, longitude, altitude, slope and
distance from source were determined from 1:25,000 topographic maps. Physical habitat variables were
qualitatively assessed or directly measured at each site during the field surveys.
The AUSRIVAS model software outputs specify the ‘Observed’ (macroinvertebrates collected during sampling)
to ‘Expected Ratios’ (macroinvertebrates which are predicted to occur in reference conditions). Both measures
relate to macroinvertebrates that have a predicted probability greater than 50% of occurring at the site if it is in
reference condition. The ‘Observed’ value is the number of these macroinvertebrate families that were actually
collected at the site. Each observed family contributes a score of 1 to the ‘Observed’ value. The ‘Expected’
value is the sum of the probabilities for all taxa that are predicted to occur at that site with a probability greater
than 50%. Families that have a 50% probability of occurring at the site contribute a score of 0.5 to the
‘Expected’ value, while families that have a 90% probability of occurrence contribute a score of 0.9. An
Observed to Expected ratio (O/E50 score) close to 1 indicates that the macroinvertebrate fauna are similar to
those of the modelled reference condition. A ratio close to zero, indicates severe impairment compared to

Aquatic Ecology Annual Report
Page 7
reference condition. Based upon these O/E50 scores, a band ranking indicating the ecological health of the river
can be assigned (Table 2.4).
Table 2.4 : AUSRIVAS OE50 upper limits and associated Band categories
OE50 upper
limit (Autumn)
OE50 upper
limit (Spring)
Band
Interpretation
- - X
More biologically
diverse than reference
sites
Possible organic enrichment or a biodiversity
hotspot as more taxa occur compared to
reference site
1.17 1.16 A Reference condition Families collected are the same or similar to
reference sites
0.81 0.83 B Significantly impaired Some taxa missing, possibly from impacts to
water quality or habitat
0.46 0.51 C Severely impaired Several taxa missing. Impacts to water quality
and/or habitat are more severe
0.11 0.19 D Extremely impaired
Few of the taxa expected at reference sites were
collected. Water quality and habitat are poor and
highly degraded
Signal 2 scores for each site were calculated using the method outlined in Chessman (2004). Signal 2 scores
sites based on the sensitivity grades of the macroinvertebrates collected, scaled from 1 to 10, where 1 are taxa
very tolerant to pollution and 10 are very sensitive. These scores are weighted by the abundance of the taxa
collected and provides and overall indication of site impairment. Sites where sensitive taxa are present are less
likely to have been affected by disturbance. Signal scores were plotted against the number of taxa collected
(richness). The biplot is divided into four quadrants (Figure 2.2), and where the data point falls is indicative of
the type of disturbance. The lines of division on the biplot are adjustable and are determined based on
knowledge of the sites and reference conditions.
Aquatic Ecology Annual Report
Page 8
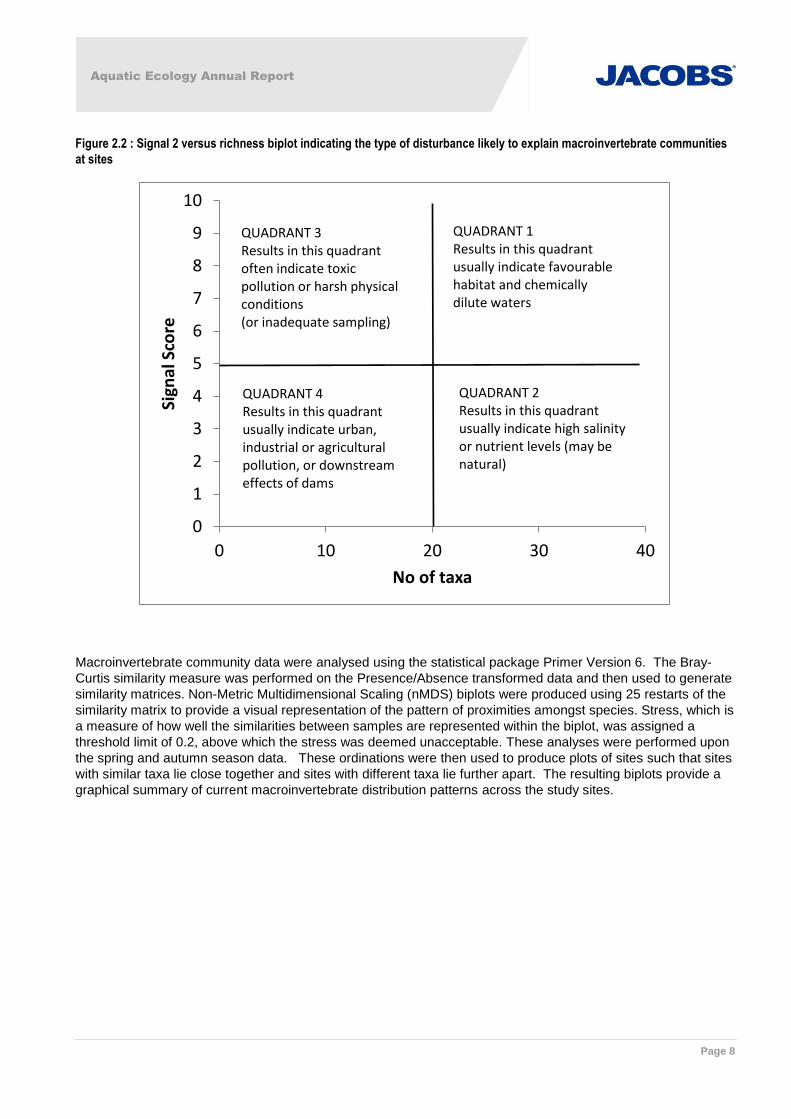
Figure 2.2 : Signal 2 versus richness biplot indicating the type of disturbance likely to explain macroinvertebrate communities
at sites
Macroinvertebrate community data were analysed using the statistical package Primer Version 6. The Bray-
Curtis similarity measure was performed on the Presence/Absence transformed data and then used to generate
similarity matrices. Non-Metric Multidimensional Scaling (nMDS) biplots were produced using 25 restarts of the
similarity matrix to provide a visual representation of the pattern of proximities amongst species. Stress, which is
a measure of how well the similarities between samples are represented within the biplot, was assigned a
threshold limit of 0.2, above which the stress was deemed unacceptable. These analyses were performed upon
the spring and autumn season data. These ordinations were then used to produce plots of sites such that sites
with similar taxa lie close together and sites with different taxa lie further apart. The resulting biplots provide a
graphical summary of current macroinvertebrate distribution patterns across the study sites.
0
1
2
3
4
5
6
7
8
9
10
0 10 20 30 40
Sign
al S
core
No of taxa
QUADRANT 3 Results in this quadrant often indicate toxic pollution or harsh physical conditions (or inadequate sampling)
QUADRANT 1 Results in this quadrant usually indicate favourable habitat and chemically dilute waters
QUADRANT 4 Results in this quadrant usually indicate urban, industrial or agricultural pollution, or downstream effects of dams
QUADRANT 2 Results in this quadrant usually indicate high salinity or nutrient levels (may be natural)

Aquatic Ecology Annual Report
Page 9
3. Results and Discussion
3.1 Water Quality
Water quality results for each site during both dry and wet weather for Year 1 and 2 are presented in Table 3.1
and Table 3.2 respectively. Shaded text indicates values exceed the ANZECC/ARMCANZ (2000) water quality
guidelines for the protection of aquatic ecosystems. The sites are displayed in a downstream order with sites
AE6, AE1, AE2 and AE3 located on Angus Creek, AE6 being the most upstream. AE5 and AE4 are on Eastern
Creek. All sites are located upstream of wastewater treatment plant discharges and are representative of mixed
rural and urban land uses.
Overall, water quality was poor across the study area. During dry weather sampling, water levels were low at all
sites with little or no flow. All sites presented oily films and odours which are a reflection of low flow. During wet
weather sampling, flow greatly increased with highly turbid waters due to the scouring of banks and the
underlying geology which was largely clay based.
During Year 2, turbidity within Angus Creek remained compliant at all sites except the upstream control site
AE6. This was largely due to local unrelated construction works which commenced at the site following the first
sampling event in Year 1. Part of the construction process was to ‘dam’ the creek at the site and release water
weekly. This resulted in a shallow stagnant and muddy pool, which at times exhibited algal growth.
The turbidity in Eastern Creek in Year 2 was elevated in dry weather compared to the previous year and
exceeded the guidelines during at both AE4 and AE5. Following wet weather, turbidity levels exceeded the
guidelines at all sites in both Angus and Eastern Creek with the exception of the upstream Eastern Creek Site
AE5. Generally, the increased turbidity during wet weather is likely due to the addition of suspended solids from
runoff and channel erosion.
Dissolved oxygen (DO) levels were low across all sites in Year 2 which was consistent with observations the
previous year. Low DO was particularly evident during dry weather when mean concentrations were often more
than half the minimum required level for protection of aquatic ecosystems. The low dissolved oxygen levels are
attributable to the stagnant low flow conditions across all sites. Following wet weather, dissolved oxygen levels
increased as a result of aeration due to increased water flow, however levels still fell below the lower guideline
limit of 85% saturation.
As in Year 1, Angus Creek has elevated electrical conductivity during dry weather, which exceeded the
recommended upper limit for the protection of aquatic ecosystems. These saline conditions are likely a result of
both the inherent low flow conditions during dry weather and the discharge of saline groundwater. Following
wet weather, increased flow provided dilution of salts and therefore conductivity levels fell within the
recommended limit of 125 to 2200µS/cm. In Eastern Creek, conductivity complied during both dry and wet
weather, and similar to Angus Creek, electrical conductivity was lower during wet weather.
pH levels increased throughout the study area in Year 2. The mean pH levels exceeded the guidelines for the
protection of lowland river aquatic ecosystems (6.5-8.5 mg/L) at AE6, AE1, AE4 and AE5. During wet weather
pH levels were generally higher due to runoff from the surrounding catchment which may contain fertilizers and
detergents that are known to increase pH. Observed pH values were elevated compared to Year 1 when
average pH fell within the guideline values.
Nutrient concentrations were elevated in both Angus and Eastern Creeks during both Year 1 and 2 with mean
total phosphorus (TP) and mean total nitrogen (TN) exceeding the recommended guidelines at all sites. In Year
, the mean T concentration was very high at the control site AE during both dry (x 9.90mg ) and wet (x
2.3mg/L) weather. TN concentrations decreased further downstream and were much lower within Eastern
Creeks. The elevated TN concentrations at AE6 are likely attributable to the local construction activities at this
site. In high concentrations these nutrients can result in the algal blooms which were evident during dry weather
at AE4, AE5 and AE6.

Aquatic Ecology Annual Report
Page 10
Table 3.1 : Year 1 Average Dry and Wet Weather Water Quality Results
Site
Dry/W
et
Te
mp
(°C
)
Tu
rb
id
ity (N
TU
)
DO
(%
sat)
Co
nd
uc
tivity
(µ
S/cm
)
TD
S (g
/L
)
pH
To
ta
l N
itroge
n
(m
g/L
)
To
ta
l
Ph
osp
ho
ru
s
(m
g/L
)
AE6 Dry 19.95 91.17 44.00 5773 3.08 7.43 1.00 0.15
Wet 17.70 225.52 77.08 724 0.36 8.37 3.45 0.10
AE1 Dry 19.99 18.12 31.47 3465 3.40 7.19 0.4 0.15
Wet 17.42 417.83 80.50 601 0.29 8.10 2.80 0.20
AE2 Dry 20.30 8.4 25.87 4137 2.18 7.28 0.4 0.15
Wet 17.79 648.33 74.63 635 0.31 8.32 2.45 0.15
AE3 Dry 19.83 10.6 31.97 4218 2.22 7.11 0.5 0.10
Wet 17.82 801.83 78.08 613 0.29 8.32 7.00 0.20
AE4 Dry 21.90 33.00 40.05 1531 0.76 6.85 3.35 0.25
Wet 17.24 608.17 70.15 548 0.26 8.20 5.75 0.30
AE5 Dry 22.04 40.60 34.02 1394 0.7 6.88 1.35 0.10
Wet 17.29 565.33 66.12 556 0.27 8.14 5.90 0.30
ANZECC/ARMCANZ Guidelines N/A 6-50 85-110 125-2200 N/A 6.5-8.5 0.5 0.05
Table 3.2 : Year 2 Average Dry and Wet Weather Water Quality Results
Site
Dry/W
et
Te
mp
(°C
)
Tu
rb
id
ity (N
TU
)
DO
(%
sat)
Co
nd
uc
tivity
(µ
S/cm
)
TD
S (g
/L
)
pH
To
ta
l N
itroge
n
(m
g/L
)
To
ta
l
Ph
osp
ho
ru
s
(m
g/L
)
AE6 Dry 14.88 106.40 41.90 2867.78 1.48 8.84 9.90 1.20
Wet 21.22 307.67 71.80 701.00 0.34 8.36 2.30 0.30
AE1 Dry 13.86 30.64 29.10 2411 1.23 8.53 5.53 0.49
Wet 20.89 231.00 68.77 527.33 0.25 8.71 1.60 0.20
AE2 Dry 15.15 40.11 35.93 2531.67 1.31 8.37 5.60 0.31
Wet 21.08 263.00 69.17 1145.67 0.56 8.42 1.40 0.10
AE3 Dry 14.67 41.47 31.33 2219.67 1.13 8.42 4.00 0.14
Wet 21.08 262.00 66.07 464.33 0.22 8.60 1.90 0.20
AE4 Dry 14.46 85.77 40.32 1111.56 0.56 8.28 1.70 0.14
Wet 21.62 62.53 52.87 417.67 0.20 8.57 1.00 0.10
AE5 Dry 14.67 100.71 40.17 1023.78 0.50 8.33 2.17 0.07
Wet 21.73 36.67 51.73 494.00 0.24 8.56 1.60 0.10
ANZECC/ARMCANZ Guidelines N/A 6-50 85-110 125-2200 N/A 6.5-8.5 0.5 0.05
Shaded cells exceed ANZECC/ARMCANZ (2000) Guidelines

Aquatic Ecology Annual Report
Page 11
3.2 Fish
Six fish taxa (and one turtle) were collected within the study area. Year 1 had a greater diversity of over the two
sampling seasons with all seven taxa observed (Table 3.3). In Year 2, the taxa diversity had greatly decreased
with only three taxa (Gambusia, Short-finned eel & long-finned eel) observed across both seasons (Table 3.4).
Year 1 total abundance (>134 individuals) was also significantly higher than Year 2 (36 individuals).
During both years the study area was dominated by the invasive species Gambusia (Gambusia holbrooki)
which was observed at least once at every site, however a much greater abundance of Gambusia was
observed in Year 1 (>128 individuals) compared to Year 2 (33 individuals). The ratio of native to alien species
was 1:21 in Year 1 and 1:11 in Year 2. A large number of juvenile Gambusia (<30mm) were collected
suggesting on-going recruitment in both Angus and Eastern Creeks. The high number of Gambusia and the low
diversity is indicative of a degraded waterway.
In Year 2, the only native fish species observed were two Short-finned Eels and one Long-finned eels. Both
species are classified as tolerant of degraded water quality and low oxygen and are able to survive out of water
for long periods by absorbing oxygen from the atmosphere through the skin as long as it remains moist or by
gulping air (Harris & Gerke 19971).
Table 3.3 : Year 1 Fish Survey Data (Spring and Autumn combined)
Common Name Scientific Name AE1 AE2 AE3 AE4 AE5 AE6
Australian Bass Macquaria novemaculeata 1
Eastern long-necked turtle Chelodina longicollis 1
Flathead gudgeon Philypnodon grandiceps 1
Gambusia Gambusia holbrooki 7 14 12 >44 5 46
Long Finned Eel Anguilla reinhardtii
Short-finned eel Anguilla australis 1
Striped gudgeon Gobiomorphus australis 1 1
Table 3.4 : Year 2 Fish Survey Data (Spring and Autumn combined)
Common Name Scientific Name AE1 AE2 AE3 AE4 AE5 AE6
Australian Bass Macquaria novemaculeata
Eastern long-necked turtle Chelodina longicollis
Flathead gudgeon Philypnodon grandiceps
Gambusia Gambusia holbrooki 22 2 9
Long Finned Eel Anguilla reinhardtii 1
Short-finned eel Anguilla australis 1 1
Striped gudgeon Gobiomorphus australis
1 Harris, JH & Gerke, PC (eds.) (1997). Fish and rivers in stress—The NSW rivers survey. NSW Fisheries Office of Conservation and the Cooperative Research Centre for Freshwater Ecology: Cronulla and Canberra. 298 pp.
Aquatic Ecology Annual Report
Page 12
3.3 Macroinvertebrates
3.3.1 Year 2 – Spring 2013 and Autumn 2014
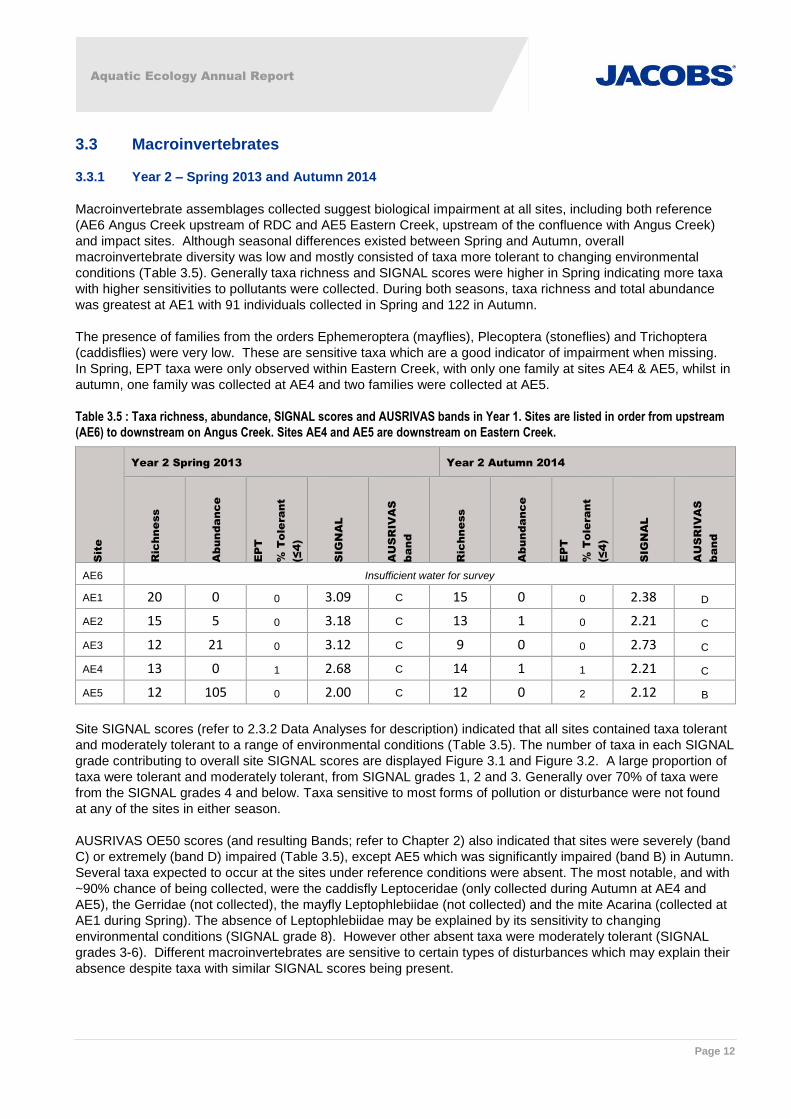
Macroinvertebrate assemblages collected suggest biological impairment at all sites, including both reference
(AE6 Angus Creek upstream of RDC and AE5 Eastern Creek, upstream of the confluence with Angus Creek)
and impact sites. Although seasonal differences existed between Spring and Autumn, overall
macroinvertebrate diversity was low and mostly consisted of taxa more tolerant to changing environmental
conditions (Table 3.5). Generally taxa richness and SIGNAL scores were higher in Spring indicating more taxa
with higher sensitivities to pollutants were collected. During both seasons, taxa richness and total abundance
was greatest at AE1 with 91 individuals collected in Spring and 122 in Autumn.
The presence of families from the orders Ephemeroptera (mayflies), Plecoptera (stoneflies) and Trichoptera
(caddisflies) were very low. These are sensitive taxa which are a good indicator of impairment when missing.
In Spring, EPT taxa were only observed within Eastern Creek, with only one family at sites AE4 & AE5, whilst in
autumn, one family was collected at AE4 and two families were collected at AE5.
Table 3.5 : Taxa richness, abundance, SIGNAL scores and AUSRIVAS bands in Year 1. Sites are listed in order from upstream
(AE6) to downstream on Angus Creek. Sites AE4 and AE5 are downstream on Eastern Creek.
Site
Year 2 Spring 2013 Year 2 Autumn 2014
Ric
hn
ess
Ab
un
da
nc
e
EP
T
% T
ole
ra
nt
(≤4)
SIG
NA
L
AU
SR
IV
AS
ban
d
Ric
hn
ess
Ab
un
da
nc
e
EP
T
% T
ole
ra
nt
(≤4)
SIG
NA
L
AU
SR
IV
AS
ban
d
AE6 Insufficient water for survey
AE1 20 0 0 3.09 C 15 0 0 2.38 D
AE2 15 5 0 3.18 C 13 1 0 2.21 C
AE3 12 21 0 3.12 C 9 0 0 2.73 C
AE4 13 0 1 2.68 C 14 1 1 2.21 C
AE5 12 105 0 2.00 C 12 0 2 2.12 B
Site SIGNAL scores (refer to 2.3.2 Data Analyses for description) indicated that all sites contained taxa tolerant
and moderately tolerant to a range of environmental conditions (Table 3.5). The number of taxa in each SIGNAL
grade contributing to overall site SIGNAL scores are displayed Figure 3.1 and Figure 3.2. A large proportion of
taxa were tolerant and moderately tolerant, from SIGNAL grades 1, 2 and 3. Generally over 70% of taxa were
from the SIGNAL grades 4 and below. Taxa sensitive to most forms of pollution or disturbance were not found
at any of the sites in either season.
AUSRIVAS OE50 scores (and resulting Bands; refer to Chapter 2) also indicated that sites were severely (band
C) or extremely (band D) impaired (Table 3.5), except AE5 which was significantly impaired (band B) in Autumn.
Several taxa expected to occur at the sites under reference conditions were absent. The most notable, and with
~90% chance of being collected, were the caddisfly Leptoceridae (only collected during Autumn at AE4 and
AE5), the Gerridae (not collected), the mayfly Leptophlebiidae (not collected) and the mite Acarina (collected at
AE1 during Spring). The absence of Leptophlebiidae may be explained by its sensitivity to changing
environmental conditions (SIGNAL grade 8). However other absent taxa were moderately tolerant (SIGNAL
grades 3-6). Different macroinvertebrates are sensitive to certain types of disturbances which may explain their
absence despite taxa with similar SIGNAL scores being present.

Aquatic Ecology Annual Report
Page 13
Figure 3.1 : Contribution of macroinvertebrate taxa to SIGNAL Scores in Year 2
Note: The stacked bars represents the number of taxa which contribute to each SIGNAL score grade, where red bars represent the
more tolerant species and yellow and green bars represent the more sensitive species. Sites are listed in order from upstream (AE6) on
Angus Creek to downstream. Sites AE4 and AE5 are downstream on Eastern Creek.
AUSRIVAS OE50 scores and the associated condition bands from 2009 to 2014 indicate an overall increasing
trend in AUSRIVAS OE50 scores from the upstream (AE6) reference site downstream along Angus Creek (AE1,
AE2 and AE3 respectively) and to Eastern Creek (AE4 and AE5). Site AE4 is downstream of the confluence
with Angus creek while AE5 is upstream of the confluence (Figure 2.1).
The data suggests that the inflow from Angus Creek may be reducing water quality at site AE4 although
localised disturbance at this site as shown by the water quality data cannot be ruled out. Inter-seasonal
variability is also quite high, with some sites fluctuating between AUSRIVAS bands D and B (e.g. Site AE6).
The best performing site is AE5 on Eastern Creek, which displayed its highest AUSRIVAS band of all sites
(band B) in Autumn 2013.
An MDS plot where sites closest to each other are most similar is displayed in (Figure 3-3). The results intricate
the macroinvertebrates communities within Eastern Creek (AE4 and AE5) are generally different to the sites on
Angus Creek throughout all years and seasons.

Aquatic Ecology Annual Report
Page 14
Figure 3.2 : Historical AUSRIVAS (OE50) Scores (Autumn 2009- Autumn 2014)
Figure 3-3 Nonmetric multidimensional scaling plot of macroinvertebrate sites in Year 1 and Two Spring and Autumn.

Aquatic Ecology Annual Report
Page 15
The 2012-13 macroinvertebrate SIGNAL scores were compared to the available data from 2009. A bi-plot of
site SIGNAL scores against the number of taxa (richness) was used to identify any temporal changes in the
sites (Figure 3-4). No consistent pattern emerged between sites and season. SIGNAL scores were relatively
consistent across all sites and were indicative of sites impacted by urban or industrial pollution (Chessman
2004).
Figure 3-4 Biplot of macroinvertebrate sites over four sampling seasons from 2009 and 2012-13.
Note: Reference sites (AE6:orange and AE5:light blue) did not plot differently to other sites.
3.4 Consolidated Discussion
Water quality, fish and macroinvertebrates all indicate that Angus and Eastern Creeks are impaired and
representative of a degraded catchment influenced by mixed rural and urban landuses. Poor water quality was
mainly due to low flows, high turbidity, low dissolved oxygen and high conductivity. Many of these parameters
were often outside the ANZECC/ARMCANZ (2000) water quality guidelines for the protection of lowland river
aquatic ecosystems. Oily films and odours were also observed. Such conditions can only sustain the most
tolerant aquatic biota. As a result, sites generally had low diversity of macroinvertebrates and fish species
of only the most tolerant taxa. Large numbers of the introduced species Gambusia were observed at all sites.
Gambusia is hardier in degraded conditions compared to most native fish species. Wet weather increased
turbidity and nutrients in the waters, primarily from runoff and continued bank erosion of the clay based
sediment.
Sites along both Angus Creek and Eastern Creek showed high nutrient concentrations and occasional algal
blooms, in particular AE6 during Year 2. Following the first sampling event, the control site (AE6) became part
of an unrelated construction facility which resulted in poor water quality that was noticeably poorer than
downstream during dry weather. Shallow, stagnant and muddy pools were observed at site AE6 following the

Aquatic Ecology Annual Report
Page 16
commencement of construction. Historically there has been a consistent trend of decreasing biological
impairment (measured through AUSRIVAS bands and OE50 scores) moving downstream from AE6 to AE4,
with the best performing site being AE5 above the confluence with Angus Creek.
Following wet weather, water quality appeared poorer at the impact sites downstream from AE6; however,
deterioration could not be directly attributed to the Holcim site. Water quality of Angus Creek shows no
noticeable deterioration downstream of the Holcim Compound (AE1) and is not reflected by a change in the fish
community or historical macroinvertebrate data. It would appear therefore that while there are significant
localised land use disturbances, the Holcim site per se is not a major contributor to poor water quality or
impaired macroinvertebrate and fish communities in these waterways.

The copyright for this document and all appendices are reserved by Holcim Group Support Ltd 10/10
Appendix E Terrestrial Ecology Monitoring Report Autumn 2014

SINCLAIR KNIGHT MERZ Page 1
ROOTY HILL REGIONAL DISTRIBUTION CENTRE
QUARTERLY ENVIRONMENTAL MONITORING REPORT
Aspect Terrestrial Ecology
Date Autumn 2014
SUMMARY
Monitoring period Autumn 2014
Parameters monitored in period
Juniper-leaved Grevillea
Riparian Health Assessment
Cumberland Plain Woodland Critically Endangered
Ecological Community
Exceedances of assessment criteria NA
Action required
Mechanical soil disturbance to assist southern grevillea
population to recover from wildfire
Re-enforcement of vegetation protection fencing along
conveyor belt corridor and northern grevillea population
1. Monitoring frequency
Monitoring is undertaken quarterly with the history of the 2012 to 2014 monitoring period shown below in
Table 1-1.
Table 1-1 Ecological monitoring periods at Rooty Hill RDC
Pre-construction (early works) Construction (Stage 2 works)
Spring 2012 9, 10 and 11 October 2012
Summer 2013 16 and 17 January 2013
Autumn 2013 25 and 26 March 2013
Winter 2013
Spring 2013 Summer 2014
24 and 25 July 2013
11 and 12 November 2013
11 and 12 February 2014
Autumn 2014 20 and 21 May 2014

Monthly Environmental Monitoring Report
SINCLAIR KNIGHT MERZ PAGE 2
2. Monitoring Locations
Monitoring locations at the Rooty Hill Regional Distribution Centre (RDC) are depicted in Figure 2-1 and
comprise:
Juniper-leaved Grevillea populations - North and South of Angus Creek
Riparian health assessment - AE1 – AE6
Cumberland Plain Woodland CEEC- Rooty Hill RDC site and Nurragingy Nature Reserve (CPW 2a,
CPW 2b, CPW 3, CPW Ref)
Figure 2-1 Monitoring locations
AE1 - Angus Creek at upstream boundary of Rooty Hill RDC (Holcim site)
AE2 -Angus Creek at downstream boundary of Rooty Hill RDC (Nurragingy Reserve)
AE3 -Angus Creek 150 m downstream of Rooty Hill RDC culvert (Nurragingy Reserve)
AE4 -Eastern Creek downstream of Angus Creek confluence (Nurragingy Reserve)
AE5 - Eastern Creek upstream of Angus Creek confluence^ (Nurragingy Reserve)
AE6 - Angus Creek, 500m upstream of the Rooty Hill RDC^
(^These sites will be adopted as control sites.)
CPW 3
CPW 2a
CPW 2b
CPW REF
1

Monthly Environmental Monitoring Report
SINCLAIR KNIGHT MERZ PAGE 3
The monitoring sites identified in Figure 2-1 have been located as identified in the Project Approval
consisting of Environmental Assessment Reports and Statement of Commitments (SoCs), the Minister’s
Conditions of Approval (MCoAs) and all management plans and strategies.
Jacobs ecologists are licensed to conduct field surveys under the National Parks and Wildlife Service
Scientific Research Permit SL100044, Fisheries Permit P06/0066.4 and the Department of Primary
Industries Animal Research Authority (09/1895).
3. Monitoring Methodology
Monitoring methods are as described in the Annual Report..
4. Guidelines
Appropriate guidelines are as described in the Annual Report.
5. Monitoring Results – Autumn 2014
5.1 Juniper-leaved Grevillea
Table 5-3 identifies the key monitoring attributes and values for each site for the autumn 2014 monitoring round.
A wildfire that swept through the southern grevillea population in early 2013 resulted in 100% loss of
individuals previously recorded from that site, including five that remained potentially viable in the autumn
2013 monitoring but by the winter monitoring round had died off completely as a result of the fire.
Regeneration of the species from any seed stored in the soil has been slower than expected (Table Table
5-1). The spring survey recorded 15 seedlings regenerating at the site, which is still lower than expected,
although this increased to 28 seedlings in the southern population in summer 2014, representing a 53%
increase in regeneration since the spring 2013 survey. The autumn survey only detected 8 individuals;
however detectability of individuals may have been hampered by thick grass regrowth. The average height
of the population in the southern site suggests good summer growth of surviving individuals (Table 5-1).
Previous research on the species suggests that plants are generally killed by fire with regeneration
occurring from soil-stored seed enhanced by heat and smoke (Makinson, 2000; Morris, 2000). A diversity of
grasses and groundcovers have recolonised the site and juvenile eucalypts and acacias have resprouted
from surviving individuals or from the soil seedbank. Active intervention is required at the site to increase
the rate of germination of the species, before the site becomes shaded out by regenerating eucalypts and
acacias, rendering the habitat unsuitable for the species. At the direction of the NSW Office of Environment
and Heritage, and as detailed in the Rooty Hill RDC Vegetation Management Plan this should take the form
of mechanical disturbance of soil at the site.

Monthly Environmental Monitoring Report
SINCLAIR KNIGHT MERZ PAGE 4
Table 5-1 Total number of Grevillea seedlings and mean height since January 2013 wildfire
Grevillea surveys post-fire Number of seedlings observed Mean height of Grevillea
seedlings (cm)
Winter 2013 5 1.2
Spring 2013 15 1.8
Summer 2014 28 3.9
Autumn 2014 8 11
Plate 5-1 – Southern Grevillea population prior to wildlife of
January 2013. Note the senescing mature individual in the
background and healthy juvenile in the foreground
Plate 5-2 Southern Grevillea population after the wildfire
of January 2013, showing burnt remains of grevilleas and
tall acacia shrubs. Summer rains have encouraged a flush
of grass and herb growth in the groundlayer
Plate 5-3 Site of the previous southern Grevillea population post-wildfire in the summer 2014 monitoring round. Grass and groundcovers have recolonised the site.
Plate 5-4 One of 15 emerging grevillea seedlings recorded post-wildfire in the summer 2014 monitoring round.
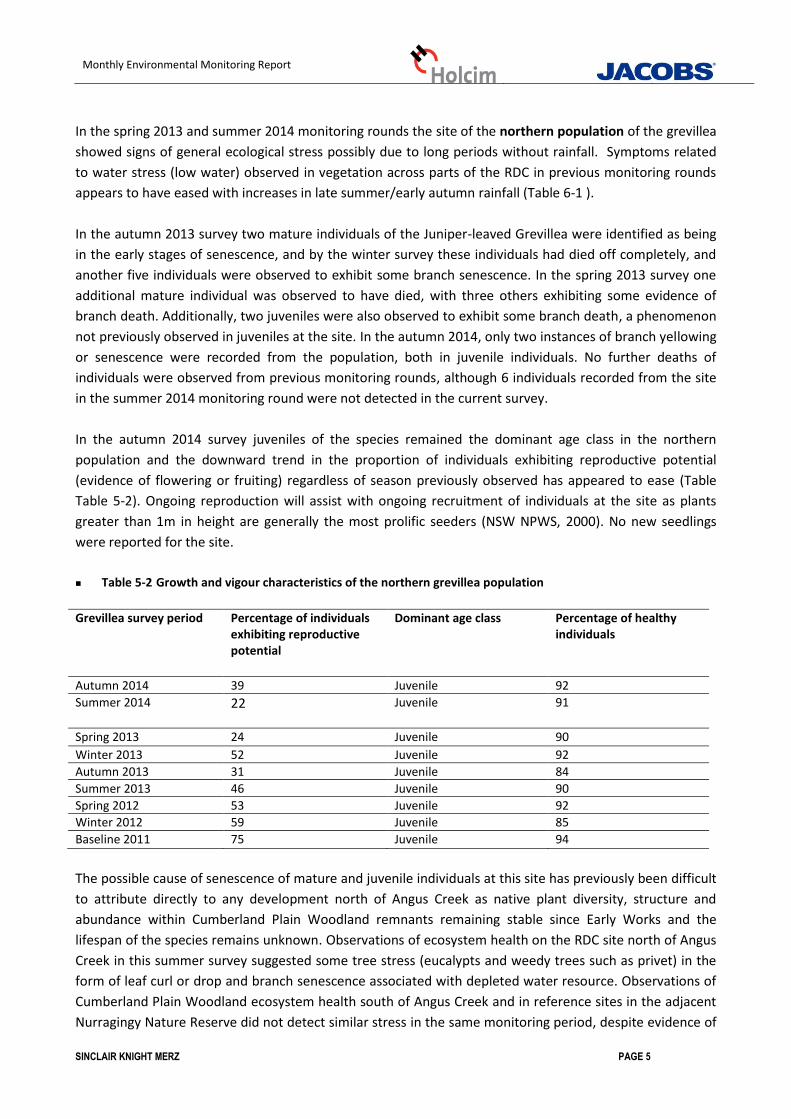
Monthly Environmental Monitoring Report
SINCLAIR KNIGHT MERZ PAGE 5
In the spring 2013 and summer 2014 monitoring rounds the site of the northern population of the grevillea
showed signs of general ecological stress possibly due to long periods without rainfall. Symptoms related
to water stress (low water) observed in vegetation across parts of the RDC in previous monitoring rounds
appears to have eased with increases in late summer/early autumn rainfall (Table 6-1 ).
In the autumn 2013 survey two mature individuals of the Juniper-leaved Grevillea were identified as being
in the early stages of senescence, and by the winter survey these individuals had died off completely, and
another five individuals were observed to exhibit some branch senescence. In the spring 2013 survey one
additional mature individual was observed to have died, with three others exhibiting some evidence of
branch death. Additionally, two juveniles were also observed to exhibit some branch death, a phenomenon
not previously observed in juveniles at the site. In the autumn 2014, only two instances of branch yellowing
or senescence were recorded from the population, both in juvenile individuals. No further deaths of
individuals were observed from previous monitoring rounds, although 6 individuals recorded from the site
in the summer 2014 monitoring round were not detected in the current survey.
In the autumn 2014 survey juveniles of the species remained the dominant age class in the northern
population and the downward trend in the proportion of individuals exhibiting reproductive potential
(evidence of flowering or fruiting) regardless of season previously observed has appeared to ease (Table
Table 5-2). Ongoing reproduction will assist with ongoing recruitment of individuals at the site as plants
greater than 1m in height are generally the most prolific seeders (NSW NPWS, 2000). No new seedlings
were reported for the site.
Table 5-2 Growth and vigour characteristics of the northern grevillea population
Grevillea survey period Percentage of individuals exhibiting reproductive potential
Dominant age class Percentage of healthy individuals
Autumn 2014 39 Juvenile 92
Summer 2014 22 Juvenile 91
Spring 2013 24 Juvenile 90
Winter 2013 52 Juvenile 92
Autumn 2013 31 Juvenile 84
Summer 2013 46 Juvenile 90
Spring 2012 53 Juvenile 92
Winter 2012 59 Juvenile 85
Baseline 2011 75 Juvenile 94
The possible cause of senescence of mature and juvenile individuals at this site has previously been difficult
to attribute directly to any development north of Angus Creek as native plant diversity, structure and
abundance within Cumberland Plain Woodland remnants remaining stable since Early Works and the
lifespan of the species remains unknown. Observations of ecosystem health on the RDC site north of Angus
Creek in this summer survey suggested some tree stress (eucalypts and weedy trees such as privet) in the
form of leaf curl or drop and branch senescence associated with depleted water resource. Observations of
Cumberland Plain Woodland ecosystem health south of Angus Creek and in reference sites in the adjacent
Nurragingy Nature Reserve did not detect similar stress in the same monitoring period, despite evidence of

Monthly Environmental Monitoring Report
SINCLAIR KNIGHT MERZ PAGE 6
attack by psyllids and subsequent recovery in eucalypts. Observations of ecological health and grevillea
growth and survival in the autumn 2014 monitoring round suggest the stress associated with reduced
water availability may have eased with moderate late summer/early autumn rainfall (Table 6-1). While it is
now plausible to consider that the combination of an extended warm and dry climatic period and
construction of detention basins immediately north of the native vegetation on the RDC site may be
contributing to a decline in ecosystem health through water stress, this will require ongoing seasonal
observations to detect any long-term trends.,
Previous monitoring reports suggested that the potential demise of the northern population as a result of
the mortality of adult individuals at the site was unlikely, based on evidence of significant reproductive
potential of juvenile individuals. The decrease in the observation of reproductive individuals in the spring
2013 and summer 2014 surveys resulted in the recommendation of intervention in the form of mechanical
disturbance to generate more individuals of the species in the northern grevillea population. Intervention
should commence if reproductive potential of juveniles falls to 10% or less of the population at the site. The
autumn 2014 survey detected an increase in the reproductive potential of juveniles at the site and ongoing
surveys will continue to monitor this trend.
Plate 5-3 The northern population of Grevillea at the Rooty Hill RDC update
Changes to the dynamics of each grevillea population are discussed in each Annual Report Ecological
Monitoring Report and summarised for the autumn 2014 monitoring round in Table 5-3.

Monthly Environmental Monitoring Report
SINCLAIR KNIGHT MERZ PAGE 7
Table 5-3 Monitoring attributes and site values for the Juniper-leaved Grevillea for the autumn 2014
monitoring round.
Juniper-leaved Grevillea monitoring autumn 2014 North of Angus Creek South of Angus Creek
(wildfire Jan 2013)
% adults flowering or fruiting 100% 0%
% juveniles flowering or fruiting 39 % 0%
% survival of adults from previous period 100% 0%
% survival of juveniles from previous period 94% 0%
% detection ^of seedlings from previous period 50% 29%*
% of population as new seedlings 0% 53 % (n=28)*
*New seedlings post January wildfire now constitutes 100% of the southern Grevillea population as all other individuals have completely died off. This population now consists of 8 post-fire seedlings. ^ A reduction in the number of seedlings observed between monitoring periods cannot be directly attributed to mortality, as detectability of seedlings is dependent upon groundcover growth at the time of survey.
5.2 Riparian site value and condition assessments
The condition benchmark for RFEF in the Hawkesbury-Nepean Catchment Management Area (CMA) is
presented in Table 5-4 together with a summary of scores and condition ratings for each monitoring
location that was able to be accessed during the autumn 2014 survey period. Vegetation across the six
sampling sites ranged from low to moderate condition, showing some improvement in the condition of the
riparian environment across almost all survey sites since the spring 2013 monitoring round, most likely as a
result of ecosystem recovery following extensive flooding in June and again in November 2013. These
rainfall events caused localised flooding, removing topsoil and associated groundcovers which are an
integral component of the condition benchmark for the riparian community being monitored, and have
subsequently begun to recover during the summer 2013 and autumn 2014 monitoring periods. Reduced
native overstorey cover continues to be observed across most sites, likely attributable to the ongoing
defoliation of eucalypts as a result of the infestation of the psyllid insect across the Cumberland Plain.
Many eucalypts are showing signs of recovery with coppicing. The broad-leaf privet, a dominant bushland
weed in the RFEF environment in the area, was observed to be suffering from leaf scorch in the summer
2013 monitoring round, with whole mature individuals having dropped their leaves. Individuals were
showing signs of recovery in the autumn 2014 monitoring round. While leaf scorch can result from a range
of physiological and environmental factors, it is likely that the species is suffering scorch as a result of
hydrological stress as a result of the warm and dry conditions that have prevailed through winter into
spring and summer. It is possible that rainfall in late summer and early autumn eased this stressor (Table 6-
1). The leaf drop by broad-leaf privet which comprises the majority understorey cover at E1 in particular
allowed for increased observation of native canopy cover not previously recorded at the site. This resulted
in an increase in score condition of the site against the condition benchmark in the summer 2013
monitoring round. In the autumn 2014 monitoring round vigorous growth of both small-leaved and large-
leaved privet (both woody weeds) was observed.

Monthly Environmental Monitoring Report
SINCLAIR KNIGHT MERZ PAGE 8
Table 5-4 Condition benchmark and monitoring site scores for RFEF Autumn 2014
Site Final Score
Condition Comment
Forest Red Gum-Rough-barked Apple grassy woodland on alluvial flats of the Cumberland Plain, Sydney Region (River-flat Eucalypt Forest TEC)
Benchmark 100 V-H RFEF communities across the region have the characteristics of the Forest Red Gum-Rough-barked Apple grassy woodland on alluvial flats of the Cumberland Plain, Sydney Region (River-flat Eucalypt Forest Threatened Ecological Community)
AE1 (Rooty Hill RDC )
73 H Vigorous regrowth of weedy privet since late summer/early autumn rainfall. Mature native canopy species (eucalypts) showing signs of full branch dieback. Limited native groundcover across the site.
AE2 62 M-H Weedy understorey and groundcovers persist at site. Ecological values remain stable.
AE3 30 M Vigorous growth of woody weeds along creek banks. Slight defoliation of native canopy eucalypt species. Ecological values remain stable.
AE4 43 M Open midstorey canopy with some semi-mature native species. Weedy groundcovers persist at the site. Sparse overstorey canopy in reasonable condition.
AE5^ 39 M Healthy native overstorey but largely devoid of mid-storey native species. Groundcovers a combination of exotic and native species.
AE6^ 38 M This site remains low in ecological value as a result of the limited native plant density and the influx of weeds, as well as significant historical and current disturbance.
5.3 Riparian Channel and Environmental Inventory
All monitoring locations were able to be measured with scores ranging from 24 – 34 out of a possible 52.
Score aggregates are presented in Table 5-5. Monitoring locations did not differ in scores compared with
those able to be monitored in the previous quarter. Despite moderate rains in late summer 2013 and early
autumn 2014, all sites maintained a reasonable stream bank structure and deep channel form with only
minor bank undercutting. Aggregations of woody debris were present at all sites, with this causing localised
damming at AE1 and AE3. These sites also scored moderately for the presence of riffle/pool sequences with
no evidence of algal blooms, although surface scum observed at AE4 may be a precursor to a bloom. Water
levels were low in both Angus and Eastern Creek compared with previous sampling periods and little to no
flow was observed at all locations.

Monthly Environmental Monitoring Report
SINCLAIR KNIGHT MERZ PAGE 9
Table 5-5 RCE score aggregates for monitoring locations
Site Value (1 – poor, 4- good)
Descriptor AE1 AE2 AE3 AE4 AE5 AE6
Land-use pattern beyond immediate riparian zone 1 1 1 1 1 1
Width of riparian strip of woody vegetation 4 3 3 3 3 2
Completeness of riparian strip of woody vegetation 2 2 1 1 1 1
Vegetation of riparian zone with 10m of channel 3 3 3 3 3 3
Stream Bank Structure 3 0 3 2 2 2
Bank undercutting 0 2 2 2 2 3
Channel Form 2 4 4 3 3 4
Riffle/pool sequence 4 3 3 2 2 2
Retention devices in stream 3 4 2 2 2 1
Channel sediment accumulations 0 0 0 3 3 0
Stream Bottom 2 2 3 2 2 0
Stream Detritus 2 4 4 3 3 2
Aquatic Vegetation 4 4 4 3 4 3
RCE Score (total) 30 32 34 28 29 24
Maximum score for RCE* 52 52 52 52 52 52
Condition Fair Fair Fair Fair Fair Fair
*This score relates to the maximum score that could be obtained under the RCE assessment if a river was in high quality condition.
5.4 Cumberland Plain Woodland Critically Endangered Ecological Community
Vegetation condition varied considerably across all four sites (refer Table 5-6). At all sites, weed
infestations persist in the groundcover predominantly as grass weeds. Native plant species richness across
all sites was considered moderate and sites of high to very high ratings for trees with hollows and fallen
logs were indicative of older remnants. Ground cover condition was directly related to density of exotic
(weed) species at the sites and where weed density was highest, condition values were lowest. There is
continuing evidence of water stress at CPW3, with the regenerative potential of overstorey species
declining at CPW 3 with sub-adult Eucalyptus amplifolia individuals variously suffering branch dieback or
complete senescence (Plate 5-4). This reduction in regeneration potential may hold stable now for a period
of time as a result of late summer/early autumn rains, which may encourage soil seed regeneration in
future growing seasons (Table 6-1). Native Blady Grass (Imperata cylindrica) and Lomandra (Lomandra
longifolia), usually robust in places at CPW3 have previously browned off with some individuals observed to
be recovering in the autumn 2014 monitoring round. Broad-leaf privet, a weedy shrub that is present at the
site, appears to be recovering from leaf-drop. Evidence of eucalypts previously suffering from psyllid
defoliation continue to show signs of rehabilitation via coppicing at CPW 2a and 2b. Site scores generally
remain consistent with the trends of previous surveys, with a slight decline at CPW3.

Monthly Environmental Monitoring Report
SINCLAIR KNIGHT MERZ PAGE 10
Table 5-6 Monitoring of site conditions at four Cumberland Plain Woodland Sites for spring 2013
Site Final Score Condition Comment
Benchmark 100 V-H Grey Box - Forest Red Gum grassy woodland on flats of the Cumberland Plain, Sydney Basin (CPW TEC)
CPW REF 1 50 M-H
Canopy more open than previous surveys, with only limited evidence of psyllid attack. Epicormic growth observed on individual trees previously defoliated by psyllids (mostly Grey Box). Thick understorey of Bursaria. Healthy
CPW2a (Rooty Hill RDC 48 M-H
Individuals affected by psyllid attack showing signs of recovery with epicormic growth in upper branches. Some branch senescence on juvenile eucalypts but not as severe as at CPW 3.
CPW2b(Rooty Hill RDC) 50 M-H
Individuals affected by psyllid attack showing signs of recovery with epicormic growth in upper branches. Some branch senescence on juvenile eucalypts but not as severe as at CPW 3.
CPW 3 (Rooty Hill RDC) 68 H
Plants at this site showing signs of recovery from water stress. Vigorous regrowth observed in weedy privet. Juvenile eucalypts showing branch dieback or complete senescence with no evidence of coppicing. Some native groundcovers recovering from water stress.
Plate 5-4 Branch senescence in eucalypts in Cumberland Plain Woodland critically endangered ecological community at CPW 3 on the RDC site.
6. Environmental stress and ecological values
The ecological monitoring of riparian health, Cumberland Plain Woodland endangered ecological
communities and threatened grevillea populations at the Holcim RDC site and adjacent control sites has
identified signs of ecological stress in the last twelve months. Biobanking assessments for the riparian
environments (River Flat Eucalypt Forest endangered ecological communities) and the Cumberland Plain
Woodland endangered ecological community incorporate value assessments of native canopy cover, which
has decreased significantly in the last twelve months as a result of psyllid insect infestation across the
Cumberland Plain which has resulted in the defoliation of key eucalypts within the community. This is likely

Monthly Environmental Monitoring Report
SINCLAIR KNIGHT MERZ PAGE 11
to have contributed to a trending decline in values at both RDC and control sites for some monitoring
periods. It is evident that the general decline in health is present at the control sites as well as impact sites.
The reason for the decline is not completely known at this stage and may be related to stochastic events, in
particular climatic conditions and psyllid insect infestation, with these events potentially confounded by
change in local hydrology.
Indeed average (mean) rainfall for the last twelve months is well below historic averages (Table 6-1) and
woody weeds and eucalypts at the site have shown signs of hydrological stress which may be related to a
lack of rainfall. Woody weeds showed recovery from this stress in the autumn 2014 monitoring round,
however there have been permanent losses of juvenile eucalypts from Cumberland Plain Woodland
monitoring sites within the RDC site, suggesting that the hydrological stress has caused damage to the
recruitment capacity of these sites until such a time as younger regenerating individuals reach reproductive
maturity. The magnitude of hydrological stress identified on the RDC site has not been observed at the
control monitoring sites and it is possible that RDC works may have resulted in a net loss of groundwater or
surface water flows to the vegetation communities, which has had an impact. This localised stress may be
as a result of the installation of retention basins in the RDC development footprint immediately north of
the protected vegetation, which has restricted overland flow of rainfall to the woodland. Despite variability
in the condition of Cumberland Plain Woodland at the RDC site, resilience remains moderately good across
all sites and equivalent to (and in some cases better than) the control site in the adjacent Nurragingy
Reserve. Weed infestations persist across all sites including the control site, outcompeting native
vegetation particularly in the groundcovers and lessening the condition of each site. The ongoing
monitoring of these communities will document the ecological recovery potential of the RDC site.
Table 6-1 Mean monthly rainfall and temperatures for the 2013 – 14 monitoring round and
historical mean monthly rainfall and temperatures
0
20
40
60
80
100
120
140
Rai
nfa
ll (m
m)
an
d t
em
p (
°C)
Dec 2013 - May - 2014
Mean historic max. temp (°C)1997 - 2013
Mean monthly max. temp (°C)Jun 13 - May 14
Mean historic rainfall (mm)1997 - 2013
Mean monthly rainfall Jun 13 -May 14