root, - Plant Physiology · Inthe course of aninvestigation dealing withthe waterrelations of root...
7
CRYOSCOPY OF SMALL AMOUNTS OF EXPRESSED TISSUE SAP H. B. CURRIER (WITH FOUR FIGURES) In the course of an investigation dealing with the water relations of root cells of red beet (Beta vulgaris), it was necessary to devise a method whereby osmotic pressure values of 0.5 to 1 ml. of sap, expressed from small blocks of tissue, could be obtained. The cryoscopic apparatus and procedure described in this paper are simple, and permit up to 6 determinations in an hour. Sap expression Tissue cylinders 2.8 cm. long and 0.9 cm. in diameter were removed fronm roots by means of a cork borer and placed in small vials just large enough to accommodate them. A stopper was inserted, sealed with paraffin, and the vial placed in a freezing environment. The temperature required for rapid and complete freezing is dependent on the kind of tissue. For beet root, - 15° C. was found sufficient; for other plants, conifer needles for example (5), the temperatures of liquid air or solid carbon dioxide are necessary. Expression of sap was accomplished by the use of the small press cylinder shown in figure 1, in connection with a hydraulic press equipped with a gauge calibrated in pounds per square inch. The press cylinder outfit was pre- cision made and was, with some modification and reduction in size, patterned after that designed by BROYER and FURNSTAL (1). It was composed of Monel metal with exception of the piston (A), which was of stainless steel. The cylinder (B) had an inside diameter of 1 inch. In pressing a tissue sample, a pad of 8 thicknesses of cheesecloth was placed on top of disc (C). The frozen tissue was removed from the small vial, wrapped in an 11 x 11 cm. square of cheesecloth, and quickly inserted into the press cylinder. Pressure was slowly increased to 10,000 to 11,000 pounds per square inch. This was shown on the pressure gauge as 2840 to 3120 pounds per square inch, since the ratio of end surface of the press 17.8 sq. cm. =35.Cleto cylinder piston and the hydraulic piston was 505 = 3.53. Collection - of the approximately 1 ml. of sap consumed 3 to 4 minutes. The time in- volved and the heat capacity of the metal were such that the tissue was com- pletely thawed by the time pressure was applied. Freezing point determination The cryoscopic apparatus is illustrated in figure 2. The container is a half-gallon thermos jug, with glass wool insulation (H) packed between an external metal covering and an inner vessel of earthenware. Replacing the lid and screw cap is a top (D) composed of Masonite, with holes drilled to receive a heavy wire stirrer (A), an ordinary thermometer (B) readingfo to 544 www.plantphysiol.org on July 19, 2018 - Published by Downloaded from Copyright © 1944 American Society of Plant Biologists. All rights reserved.
Transcript of root, - Plant Physiology · Inthe course of aninvestigation dealing withthe waterrelations of root...
CRYOSCOPY OF SMALL AMOUNTS OF EXPRESSED TISSUE SAP
H. B. CURRIER
(WITH FOUR FIGURES)
In the course of an investigation dealing with the water relations of rootcells of red beet (Beta vulgaris), it was necessary to devise a method wherebyosmotic pressure values of 0.5 to 1 ml. of sap, expressed from small blocks oftissue, could be obtained. The cryoscopic apparatus and procedure describedin this paper are simple, and permit up to 6 determinations in an hour.
Sap expressionTissue cylinders 2.8 cm. long and 0.9 cm. in diameter were removed fronm
roots by means of a cork borer and placed in small vials just large enoughto accommodate them. A stopper was inserted, sealed with paraffin, and thevial placed in a freezing environment. The temperature required for rapidand complete freezing is dependent on the kind of tissue. For beet root,- 15° C. was found sufficient; for other plants, conifer needles for example(5), the temperatures of liquid air or solid carbon dioxide are necessary.
Expression of sap was accomplished by the use of the small press cylindershown in figure 1, in connection with a hydraulic press equipped with a gaugecalibrated in pounds per square inch. The press cylinder outfit was pre-cision made and was, with some modification and reduction in size, patternedafter that designed by BROYER and FURNSTAL (1). It was composed ofMonel metal with exception of the piston (A), which was of stainless steel.The cylinder (B) had an inside diameter of 1 inch.
In pressing a tissue sample, a pad of 8 thicknesses of cheesecloth wasplaced on top of disc (C). The frozen tissue was removed from the smallvial, wrapped in an 11 x 11 cm. square of cheesecloth, and quickly insertedinto the press cylinder. Pressure was slowly increased to 10,000 to 11,000pounds per square inch. This was shown on the pressure gauge as 2840 to3120 pounds per square inch, since the ratio of end surface of the press
17.8 sq. cm. =35.Cletocylinder piston and the hydraulic piston was 505 = 3.53. Collection
- of the approximately 1 ml. of sap consumed 3 to 4 minutes. The time in-volved and the heat capacity of the metal were such that the tissue was com-pletely thawed by the time pressure was applied.
Freezing point determination
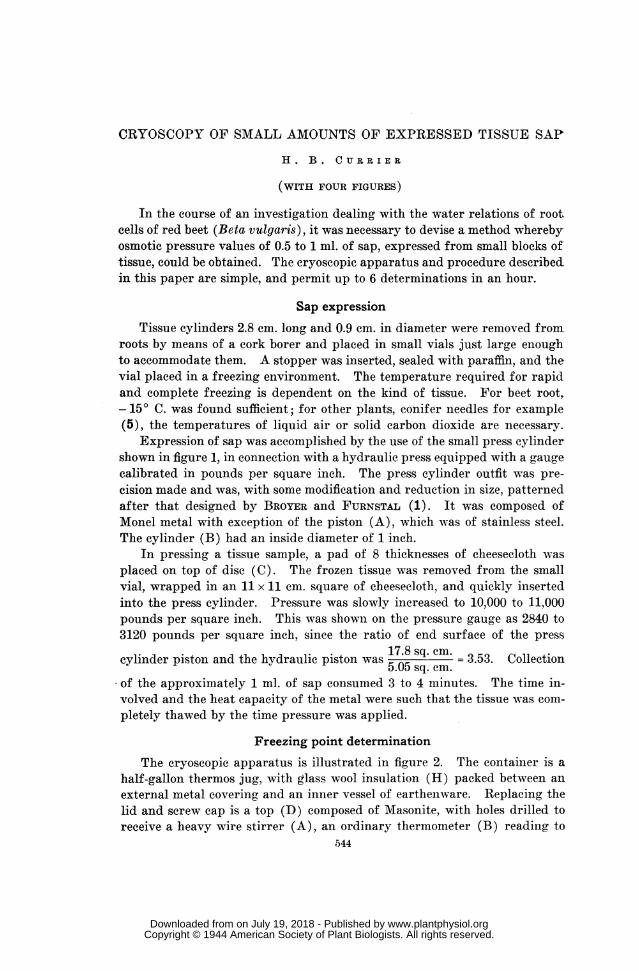
The cryoscopic apparatus is illustrated in figure 2. The container is ahalf-gallon thermos jug, with glass wool insulation (H) packed between anexternal metal covering and an inner vessel of earthenware. Replacing thelid and screw cap is a top (D) composed of Masonite, with holes drilled toreceive a heavy wire stirrer (A), an ordinary thermometer (B) readingfo to
544
www.plantphysiol.orgon July 19, 2018 - Published by Downloaded from Copyright © 1944 American Society of Plant Biologists. All rights reserved.

CURRIER: CRYOSCOPY OF EXPRESSED SAP
- 200 C. to indicate bath temperature, a glass air jacket (K), and a smallglass tube (J) in which a water-filled glass capillary (G) can be frozen.Within the air jacket a sample tube (I) is held in place by a cork fitted with
*00
o 0
View of Disc C
I a a cm
o a 4- ---- 1-
0 2- 41 4w 1? '4*
FIG. 1. Press cyliader outfit used to express small amounts of sap from plant tissue.Part 1, diagram; part 2, photograph of parts.
holes to accommodate the freezing point thermometer (C), a fine wire stirrer(E) tipped with rubber, and a small hole (F) through which the glass capil-larv could be inserted into the test solution.
-
5-45
-aim
.-Agw..'. .-%
AML
www.plantphysiol.orgon July 19, 2018 - Published by Downloaded from Copyright © 1944 American Society of Plant Biologists. All rights reserved.
PLANT PHYSIOLOGY
Pq
C,
-
C,
Cd
4_
0
Cd
0-4
P4
_ c
ce
Pq
_ t
r-.
C,
CC
fri$04
4-q-4_
_%
\V -'7
AS, .H
V
-W°V
OC,
V
546
www.plantphysiol.orgon July 19, 2018 - Published by Downloaded from Copyright © 1944 American Society of Plant Biologists. All rights reserved.

CURRIER: CRYOSCOPY OF EXPRESSED SAP
The freezing point thermometer was specially made, and obtained fromBraun-Knecht-Heimann Co., San Francisco, Calif. Specifications called foran instrument of the Anchutz type, reading from + 1 to - 3.5° C., calibratedin fiftieths of a degree, and having a very small bulb (0.5 cm. in diameter and1.0 cm. in length).
For the determination, the container is filled with an ice-salt mixture atapproximately - 100 C. A dropping pipette serves to introduce 0.7 ml. ofsap into the sample tube, after which the small thermometer is placed inposition so that the bulb is completely immersed. The sample tube is thenplaced. in an ice-water bath in a smaller double-walled vessel until the ther-mometer registers about + 0.50 C. Then, after excess water has been care-fully removed, it is transferred to the air jacket of the cryoscope. Thisoperation saves considerable time when a large number of determinationsare being made. As the mercury nears -2° C. stirring of the solution isbegun with an up and down motion of the left hand, repeated about 3 timesper second. When the thermometer reads - 2° C., crystallization is inducedby momentarily inserting the tip of the ice-filled glass capillary into thesolution through the small hole (F). The mercury immediately rises to amaximum and remains for a minute or so, then drops slowly. Stirring iscontinued until the plateau in the freezing curve is reached. The highesttemperature is recorded as the observed depression (ZXobs.). A small mag-nifier aids in reading the thermometer.
Standardization of apparatus
Because readings of any cryoscopic apparatus of the type described aboveare subject to errors caused by (1) supercooling of the solution, and (2)
3.0
.0
0.Q2 0.4 0.6 0.8 1.0MOLAR SUCROSE CONCENTRATION
FIG. 3. Freezing point depression (A) of sucrose solutions. The two lines indicatedifferences between observed (obs.) and correct (corr.) values.
547
www.plantphysiol.orgon July 19, 2018 - Published by Downloaded from Copyright © 1944 American Society of Plant Biologists. All rights reserved.

PLANT PHYSIOLOGY
absorption of heat by the system during freezing, the equipment must bestandardized. For this purpose weight molar sucrose solutions of variousconcentrations were prepared, using reagent grade sugar and water whichhad been previously boiled to remove air.
The observed freezing points were compared with accepted cryoscopicallydetermined values found in the International Critical Tables (3) by meansof the graph shown as figure 3. The discrepancies varied from 0.02° C. fora 0.1 molar to 0.110 C. for a 1.0 molar solution. By referring the observed Ato this graph the corrected A could be read off directly to 0.01°.
+1.0v - - - - - - - -
0 10 MINUTES 20 30
FIG. 4. Freezing curve obtained by means of the apparatus shown in figure 2, using0.7 ml. of beetroot sap.
Although the discrepancies between the true and observed values seemlarge, the extremely consistent results proved the accuracy of the measure-ments. A suitable and convenient correction for the effect of supercoolingin giving A values which are too great has been suggested by HARRIS andGORTNER (2), and is commonly used. An approximate correction for heatcapacity effects can also be calculated if, (1) the weight and heat capacityof glass and stirrer in contact with the solution, (2) volunme of solution, (3)temperature at which freezing begins, (4) temperature of bath, and (5) ob-served freezing point, are known.
548
www.plantphysiol.orgon July 19, 2018 - Published by Downloaded from Copyright © 1944 American Society of Plant Biologists. All rights reserved.

CURRIER: CRYOSCOPY OF EXPRESSED SAP
In the present procedure separate corrections for these errors are unnec-essary, since by accurately calibrating the apparatus and using exactly thesame technique each time, one needs only to refer the observed value to thegraph to obtain the corrected value. The increasing discrepancy betweenlAobs. and Acorr., as the solution becomes more concentrated, is not due tosupercooling effects, as this correction, when calculated by HARRIS andGORTNER'S formula, remains at about 0.010 C. for all concentrations (about0.0050 for 0.1 M). The probable explanation is that with increasingly con-centrated solutions a greater amount of heat is lost to the system, due toslower crystallization and the longer time required to reach the apparentfreezing point. Against WALTER'S (6) recommendation that the amount ofsupercooling be always 1.50 C., there is a distinct advantage in initiatingthe freezing at a definite point, since with an unknown solution no prelimi-nary trial is necessary in order to determine where freezing must begin to beexactly 1.50 below the freezing point.
As proof of the validity of correcting observed freezing point values asdescribed, freezing curves, such as that shown in figure 4, were constructedas recommended by MAIR, GLASGOW and ROSSINI (4). Extrapolation of thepart of the curve where thermodynamic equilibrium exists between the solidand liquid phases of the system, back to the initial downward part of thecurve, gives a close approximation of the true freezing point. These authorspoint out that in a strict sense the true freezing point is slightly higher thanthis, but have mathematically proved that the difference is insignificantwhen the amount of undercooling is small in comparison with the head oftemperature (difference between temperature of the freezing bath and thatof the test solution). A\Tith a head of temperature of 10° to 15° C. this errorwas found to be unimportant in the determinations made by the methoddescribed above. True freezing points of both sucrose solutions and beetjuice obtained by plotting freezing curves agree with those corrected bymeans of the calibration curve (fig. 3).
While the method of calibration employed is probably applicable to allplant juices approximating beet sap in composition and freezing behavior,it may not be suitable for highly colloidal solutions, where ice formationoccurs more slowly. Wrhere doubt exists freezing curves will indicatewhether or not the method can be used.
This work was carried out while the writer was associated with theDivision of Botany, University of California, Davis, California. Gratefulacknowledgement is made to Dr. A. S. CRAFTS for helpful suggestions, and toMrs. DOROTHY HARTMANN for preparing the drawings.
BASIC VEGETABLE PRODUCTS CO.VACAVILLE, CALIFORNIA
LITERATURE CITED1. BROYER, T. C., and FURNSTAL, A. H. A press for the recovery of fluids
from plant tissues. Plant Physiol. 16: 419-421. 1941.
549
www.plantphysiol.orgon July 19, 2018 - Published by Downloaded from Copyright © 1944 American Society of Plant Biologists. All rights reserved.
550 PLANT PHYSIOLOGY
2. HARRIS, J. A., and GORTNER, R. A. Notes on the calculation of theosmotic pressure of expressed vegetable saps from the depressionof the freezing point, with a table for the values of P for A = 0.0010to 2.9990. Amer. Jour. Bot. 1: 75-78. 1914.
3. International critical tables, vol. 4, page 263. 1933.4. MAIR, B. J., GLASGOW, A. R., and ROSSINI, F. D. Determination of freez-
ing points and amounts of impurities in hydrocarbons from freez-ing and melting curves. Jour. Res. 26: 591-620. 1941.
5. MEYER, B. S. Some critical comments on the methods employed in theexpression of leaf saps. Plant Physiol. 4: 103-112. 1929.
6. WALTER, H. Die Hydratur der Pflanze. Jena, 1931.
www.plantphysiol.orgon July 19, 2018 - Published by Downloaded from Copyright © 1944 American Society of Plant Biologists. All rights reserved.