David Roodman Research Fellow Commitment to Development Index.

Roodman microfinance book. Chapter 6. DRAFT. Not for citation or circulation. 3/1/2011
1
…what vast amount of misery, ruin, loss, privations, [people’s banks] have either averted or removed, penetrating, wherever they have once gained a footing, into the smallest hovel, and bringing to its beggared occupant employment and the weapons wherewith to start afresh in the battle of life, it would tax the powers of even experienced economists to tell. —Henry Wolff, 18961 Control groups in theory correct for the attribution problem by comparing people exposed to the same set of conditions and possible choices. However, control-group design is tricky, and skeptics hover like vultures to pounce on any weakness.— Elisabeth Rhyne, 20012
[Some practitioners who work daily with appreciative customers roll their eyes at the researchers who
insist we cannot be sure if microfinance reduces poverty on average. But pursuit of empirical truth is
what researchers are trained for, and just as they should hesitate to tell practitioners how to do their jobs,
practitioners should acknowledge researchers’ competence in measuring microfinance’s social return.]
I spent a few days of January 2008 in Cairo. My superficial purpose was to speak at a United Nations
conference whose premise I neither quite understood nor tried very hard to understand. It took place on
the edge of the Nile, in a high-rise hotel with burly security guards and a clientele of Saudis who came
to pursue pastimes more effectively prohibited in Riyadh.
Outside the conference hall, I devoted most of my waking hours to two different and oddly
contradictory activities. On a laptop computer in the hotel room, I worked to reconstruct and scrutinize
the statistical analysis in what was then the most sophisticated and influential study of the impacts of
microcredit on borrowers, Mohammad Yunus indirectly cited as showing that 5 percent of Bangladeshi
microcredit borrowers climb out of poverty each year.3 I made progress on the analysis and became
more confident that the study was not sturdy. By extension, I came to doubt other, less-sophisticated
analyses of the impact of microcredit. I also took time to visit a fast-growing microlender called the
Lead Foundation. Happily, it was Wednesday when I went, loan disbursement day at a busy Lead
branch in the poor district of Shubra. The branch was an office suite, not a dedicated building, and there,
1 Wolff (1896), 4. 2 Rhyne (2001), 188. 3 See the interview in 2007 on the PBS show “NOW,” at pbs.org/now/enterprisingideas/Muhammad-Yunus.html. The figure comes from Khandker (1998), 56, which extrapolates from Pitt and Khandker (1998).

Roodman microfinance book. Chapter 6. DRAFT. Not for citation or circulation. 3/1/2011
2
hundreds of hijab-clad women and their children were jammed into the lobby, back into the hallways,
and down the stairwells, all waiting to get new loans. Most had just repaid smaller ones. My guide, who
told me to call him George, ushered two borrowing groups, five women each, into the branch director’s
office to converse with me. Through his translation, I learned that every woman would use the credit to
finance informal retail. In one group, Rasha and her sister Hala sold clothes and makeup, respectively;
their cousin Doaa traded in women’s accessories and scarves while their aunt Samoh peddled clothing
too; and their neighbor in the same building, Anayat, sold bed sheets.[ck name order]. They sold to each
other and to women in their social network. Since the women spoke in the presence of bank employees,
I took their stories with grains of salt. But whatever they did with the credit, they clearly wanted it.
I reflected on the absurdity of my situation. Should I tell these women who seemed to be seizing
the option to thread the gauntlets of their lives that on a computer back in my hotel room, I had just
determined that the loans might not be so good for them after all? Of course not. Unless I had
compelling evidence that the credit was dangerous, who was I to second-guess them? It was not as if
they were buying cigarettes.
But I realized that I did have some standing to question what I saw. The U.S. government’s
Agency for International Development (USAID) funded Lead. That entitled me as a taxpayer to ask
whether my money was helping these women—and if so, how much. Was it lifting them out of poverty?
Or was it “merely” making their lives a little easier? In that case, would it be better spent building
schools or roads? The Lead Foundation must be doing something right to attract such throngs—exactly
what, the next chapter seeks to illuminate. But clear statistical evidence of the impact of programs like
Lead’s would make an even stronger case for funding. That is what this chapter looks for.
A tour of the websites of American microfinance groups in the spring of 2009 revealed seeming
confidence on the question of evidence. FINCA had launched a “historic campaign to create 100,000

Roodman microfinance book. Chapter 6. DRAFT. Not for citation or circulation. 3/1/2011
3
Village Banks and lift millions out of poverty by 2010.” The Microcredit Summit Campaign aimed to
“help 100 million families rise above the…$1 per day threshold by 2015.” Opportunity International
stated simply, “Microfinance: A Solution to Global Poverty.” Not to be outdone, Acción International
invited you to visit lendtoendpoverty.org and petition the “World’s Economic Leaders to Make
Microfinance a Focus.”4
Do these claims stand up? Common sense says that the effects of microfinance vary. If you lend
three of your friends $1,000 each, they will do different things with the money and achieve different
outcomes by luck or skill. One might pay heating bills. The other two might start catering businesses,
one to succeed, one to fail. Credit is leverage. Just as loans from banks let hedge funds make bigger bets
than they could with their capital alone, microcredit lets borrowers gain more and lose more than they
otherwise could. Among the millions of borrowers, microcredit no doubt lifts many families out of
poverty even as it leaves others worse off. Less obvious are the average effects on such as things as
household income and enrollment of children in school. Easily a hundred studies have attempted to
measure average effects.5 Yet in the face of all that data collection, number crunching, and report-
writing, a recent World Bank review concluded that “the evidence…of favorable impacts from direct
access of the poor to credit is not especially strong.”6 I agree. This chapter explains why.
Ways to see the world Implicit in the messages on those websites is an archetypal story. A woman takes a loan, invests in a
small-scale economic activity, makes a profit, repays the loan, borrows more to expand the business,
invests in her children, and gains power within family and community. This general story is given life
through concrete instances. These specific stories have power—perhaps too much, because readers with
4 kiva.org; villagebanking.org/site/c.erKPI2PCIoE/b.2589455/k.5C65/ABOUT_FINCA_International.htm; microcreditsummit.org; opportunity.org/Page.aspx?pid=193; lendtoendpoverty.org; all viewed March 4, 2009. 5 Morduch and Haley (2002). 6 Demirgüç-Kunt, Beck, and Honohan (2008), 99.

Roodman microfinance book. Chapter 6. DRAFT. Not for citation or circulation. 3/1/2011
4
little exposure to the diversity of microfinance and the complexity of clients’ lives have little basis on
which to question them. Consider the potential complications. As a general matter in microfinance, the
client might be a man, or the service might be savings, insurance, or money transfer. But let us stipulate
a loan to a woman. She might invest in a calf and the calf might die. Or she might invest in vegetable
trading, depressing market prices for vegetables and reducing other women’s earnings. She might
substitute the loan for credit from a moneylender, cutting her interest payments, but not immediately
augmenting her capital. She might not invest, as we saw in chapter 2, but instead buy rice. She might be
empowered by the loan, gaining a measure of freedom from family and patron-client social
arrangements that outsiders judge as sexist and exploitative. Or the loan might play into those
arrangements: the woman might “pipeline” the loan, handing the cash to her husband. The mutual
dependence of joint liability might unify the women into a local political force or oppress them with
peer pressure. Some of these outcomes would be unfortunate; others would not fit the archetypal story
but would be good in their own way. Now consider that among 50 borrowers within a single slum or
village, all these things could happen. Over time, many of them could happen to the same person.
The effects of microfinance defy encapsulation in three ways. (See Table 1.) First, the details of
people’s lives are hard to observe. One can live in a village for a year or dispatch surveyors door to door,
but the information gleaned will never be complete nor completely accurate. Second, we cannot know
what the lives of microfinance users would have been like without the microfinance: we cannot
construct the counterfactual against which to compare observed reality. Third, even if we had perfect
information about the world as it is and as it would have been, the complexity of the observed effects—
different for each person—would exceed the grasp of the human mind. In practice, then, research is
about using incomplete data (about the world as it is) and untestable assumptions (about the world as it
would have been) to make simplistic generalizations (about variegated experiences). That does not make

Roodman microfinance book. Chapter 6. DRAFT. Not for citation or circulation. 3/1/2011
5
social science hopeless, but it does force choices in performing it. As in social science generally,
researchers have studied the impacts of microfinance with several methods, which press against the
various impediments to encapsulation more or less well.
Table 1. Three Impediments to Understanding Impacts 1. Measuring reality as it is 2. Measuring reality as it would be without microfinance 3. Distilling the complex variety of differences between 1. and 2.
Qualitative research involves observing, speaking with, even living with, a few dozen or hundred
people in order to grasp the complexities of a phenomenon of interest. We all do qualitative research to
understand and navigate the neighborhoods in which we live, the offices in which we work. Qualitative
research exploits this innate human capacity. Its strength is addressing the first impediment above, in
building depth of understanding of the world as it is. Done well, it penetrates the sheen of half-truths
“subjects” may serve up to passing observers. Its weaknesses are narrowness and subjectivity. Two
researchers living in two different villages—or even the same village—might perceive different realities,
leaving it unclear how to generalize from one or two specks on the globe. “As the inclusion of the
observer within the observed scene becomes more intense,” Margaret Mead wrote, “the observations
becomes unique.”7
Somewhat confusingly, qualitative researchers often collect quantitative data: numbers. And
because these quantitative data can be so carefully observed, they can be of high quality. This brings us
to the major approach to research, the quantitative, in which numerical data are collected on a set of
“observational units” (people, families, villages, countries), and then avowedly dispassionate,
mathematical methods are used to extract signals from the noise of local happenstance. Because the
question that drives this chapter is about the measured, average impact of microfinance, we will focus
here on quantitative research. The next chapter draws more on qualitative work.
7 Quoted in Rahman (1999b), 28.

Roodman microfinance book. Chapter 6. DRAFT. Not for citation or circulation. 3/1/2011
6
Researchers collecting quantitative data face a trade-off between depth and breadth. Expanding
data sets by talking to more people reduces vulnerability to distortion by a few quirky instances: Bill
Gates popping up in a sample of Americans would throw averages much less if he were one among a
thousand instead of one among ten. By using larger, more representative samples, quantitative studies
can respond better to the third impediment to research listed above, the difficulty of generalization. The
cost, usually, is a shallower understanding of individuals studied. Individual data points in qualitative
work can more sharply observed but of less certain representativeness.
Most quantitative microfinance impact analysis is done on data from door-to-door surveys of
households or tiny businesses. At each doorstep, a surveyor pulls out a sheaf of blank questionnaires and
begins to rattle off questions. The surveys that generated the data I studied in my Cairo hotel room
included some 400 questions, many of them detailed and intrusive.8 Are you married? How much do
you earn? Which of your relatives own at least half an acre of land? Are you in debt to money lenders? I
can only guess how a poor Bangladeshi woman, perhaps illiterate, perhaps interrupted in her long
gauntlet of daily chores, would greet such a peculiar visitor. Out of pride or fear, she might hide
embarrassments or tell the surveyor what she thinks the surveyor wants to hear. Debt in particular
carries shame. Yale economist Dean Karlan and Dartmouth economist Jonathan Zinman wrote a paper
called “Lying about Borrowing,” in which they reported that half of South Africans who had recently
taken a high-interest, short-term loan omitted to mention that to surveyors.9 Such distortions, often
hidden from the econometricians who analyze the data, make data collection an underappreciated art. A
researcher for BRAC, a major microcreditor in Bangladesh, learned a technique from her colleagues for
determining whether a respondent borrows from more than one microcredit group. Since many adults
answer “no” regardless of the truth—belonging to more than one group is frowned upon—the researcher
8 ow.ly/BSrE. 9 Karlan and Zinman (2008a).

Roodman microfinance book. Chapter 6. DRAFT. Not for citation or circulation. 3/1/2011
7
was told to ask the children: “Does your mommy go to the Grameen meetings too?” The little ones give
extra meaning to the technical term for a survey respondent: “informant.”10
But not all survey data is so artfully gathered. Journalist Helen Todd and her husband David
Gibbons, introduced in chapter 2, have provided an example by way of comparison with qualitative data
collection. They closely followed the lives of 62 women in two villages of Bangladesh in 1992. At the
end of the year, they used their detailed knowledge to classify the women according to clout wielded in
household financial decisions. “Managing directors” dominated financial decision making. “Bankers”
and “partners” made decisions jointly with their husbands—“bankers” with the upper hand, and
“partners” in a more equal relationship. “Cashbox” women were responsible for holding money in the
home, but handed it to their husbands or other relatives on request. “Cashbox plus” women had some
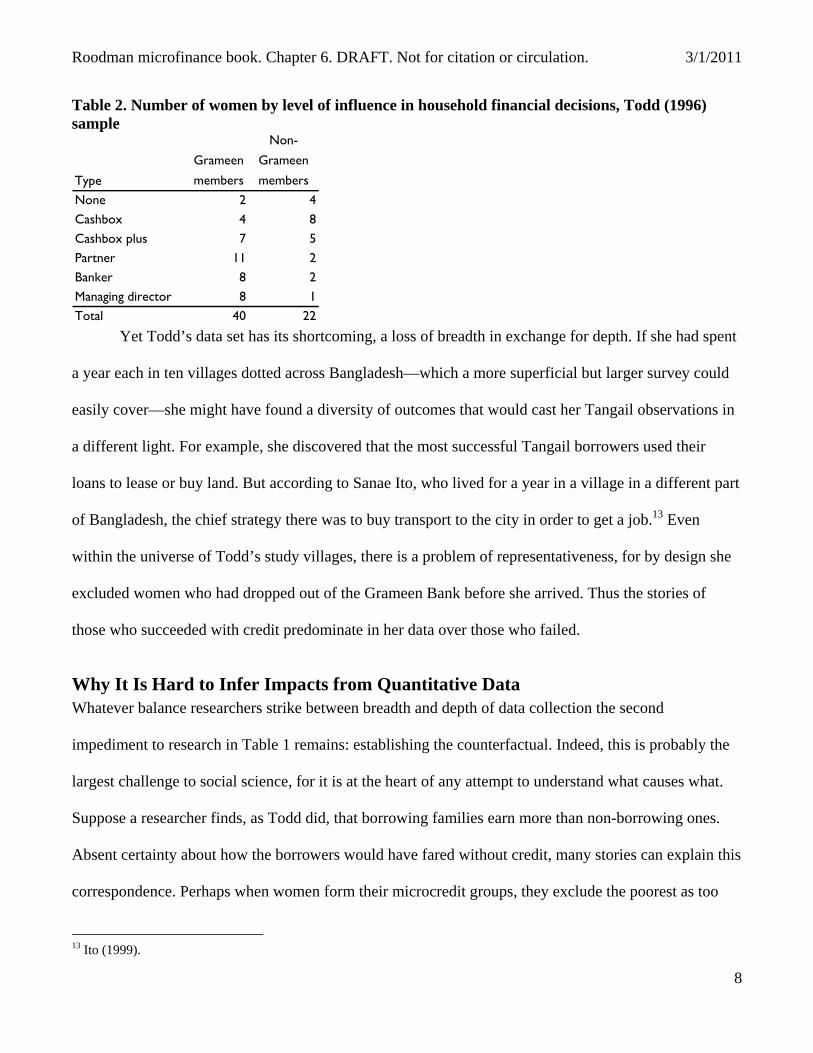
small say in domestic spending decisions. (See Table 2.)11 Fully 27 of the 40 Grameen Bank members
had at least made Partner, while only five of the 22 non-members had. Todd interpreted this correlation
between Grameen borrowing and power within the household as a sign of causation from the credit to
the empowerment. And tracking the women’s lives and collecting their stories for a year positioned her
well to judge. Back at the start of the year, Todd, Gibbons, and the rest of the research team had
surveyed the same women in a more conventional fashion. They asked each woman such questions as
whether she had an equal say in decisions about purchase of land and schooling of children, then
recorded the answers on a form with tick marks. “Looking back at them a year later, the ticks bore only
limited relation to the reality we had come to know. If they had any usefulness it was to demonstrate a
cultural idea—the way our respondent felt families ought to behave, rather than the way they actually
did.”12
10 Mehnaz Rabbani, BRAC, Dhaka, March 4, 2008. 11 Todd (1996), 86–89. 12 Ibid., 87. Emphasis in the original.
Roodman microfinance book. Chapter 6. DRAFT. Not for citation or circulation. 3/1/2011
8
Table 2. Number of women by level of influence in household financial decisions, Todd (1996) sample
Type
Grameen
members
Non-
Grameen
members
None 2 4
Cashbox 4 8
Cashbox plus 7 5
Partner 11 2
Banker 8 2
Managing director 8 1
Total 40 22 Yet Todd’s data set has its shortcoming, a loss of breadth in exchange for depth. If she had spent
a year each in ten villages dotted across Bangladesh—which a more superficial but larger survey could
easily cover—she might have found a diversity of outcomes that would cast her Tangail observations in
a different light. For example, she discovered that the most successful Tangail borrowers used their
loans to lease or buy land. But according to Sanae Ito, who lived for a year in a village in a different part
of Bangladesh, the chief strategy there was to buy transport to the city in order to get a job.13 Even
within the universe of Todd’s study villages, there is a problem of representativeness, for by design she
excluded women who had dropped out of the Grameen Bank before she arrived. Thus the stories of
those who succeeded with credit predominate in her data over those who failed.
Why It Is Hard to Infer Impacts from Quantitative Data Whatever balance researchers strike between breadth and depth of data collection the second
impediment to research in Table 1 remains: establishing the counterfactual. Indeed, this is probably the
largest challenge to social science, for it is at the heart of any attempt to understand what causes what.
Suppose a researcher finds, as Todd did, that borrowing families earn more than non-borrowing ones.
Absent certainty about how the borrowers would have fared without credit, many stories can explain this
correspondence. Perhaps when women form their microcredit groups, they exclude the poorest as too
13 Ito (1999).

Roodman microfinance book. Chapter 6. DRAFT. Not for citation or circulation. 3/1/2011
9
risky—or the poorest exclude themselves—making borrowers richer on average. In fact, Todd and Ito
both saw this happen.14 From the point of view of impact measurement, such influence of affluence on
borrowing constitutes “reverse causality.” Then there is the risk of “selection bias,” as in Todd’s book:
people who succeed financially are more likely to stick to the borrowing-repayment cycle while those
who struggle may fall off the researcher’s radar. Then too, microfinance organizations may operate only
in places of relative affluence—or, out of a commitment to mission, relative poverty. This “endogenous
program placement” could create a misleadingly positive or negative correlation between poverty and
microfinance. More generally, there is the problem of “omitted variables,” factors left out of an analysis
that are simultaneously influencing both borrowing and income. For example, suppose that a woman’s
hidden entrepreneurial talent simultaneously makes her more apt to borrow, that the borrowing has no
effect on her welfare, and yet that because of her talent she climbs out of poverty. That would make it
look like borrowing helped her even when it did not—and even if she says it did. Unmeasured, her talent
would be omitted from the statistical analysis. All these scenarios compete with the scientific hypotheses
that credit is making borrowers better off. So when you read conclusions like this one, you should be
skeptical:
Participation [in the Bank Rakyat Indonesia credit program] is associated with both increased employment for hired workers in borrower enterprises and increased incomes for borrower families who were below the poverty line. For 1986,…15.1%...fell below the poverty line….After an average three years of programme participation, however, only 4.17% of…borrowers are still below the poverty line. [I]t appears that an estimated 186,000 participating families have moved out of the seriously poor category.
That study was co-authored in 1990 by one Ann Dunham Sutoro, better known as Obama’s mama.15
Quantitative researchers have developed techniques to rule out such alternative stories, to attack
what they call “endogeneity.” Most of the techniques work worse in practice than in theory—and
14 Todd (1996), 171–74; Ito (1999), ch. 6. 15 Sutoro and Haryanto (1990), quoted in Mosley (1996), 59.

Roodman microfinance book. Chapter 6. DRAFT. Not for citation or circulation. 3/1/2011
10
sometimes worse than the researchers using them realize.16 In the late-1990s, for instance, the Assessing
the Impact of Microfinance Services (AIMS) project of USAID recommended comparing “old”
borrowers (ones in a program for a few years) to new ones, on the idea new borrowers are representative
of what the old ones would be if they had not borrowed, in such terms as income, spending, and family
size. Dean Karlan pointed out several dangers in this approach. Old borrowers might differ
systematically from new ones: perhaps they are the pioneering risk-takers, while the new ones are more
cautious. And the passage of time may weed out the unsuccessful clients, as in Todd’s sample.17 (To be
fair, USAID saw its approach as rough and ready—imperfect, but practical for microfinance groups to
incorporate into their normal operations.) In academia, the fear of endogeneity has tended to lead to
increasingly complicated techniques, meant to purge its many forms. For example, in one study, Mark
Pitt of Brown University and Shahidur Khandker of the World Bank deployed what they called
“Weighted Exogenous Sampling Maximum Likelihood–Limited Information Maximum Likelihood–
Fixed Effects,” which is at least as complicated and ingenious as it sounds.18
Such analytical techniques, typically packaged into bits of software, amplify some long-standing
dangers in econometrics, which is the application of statistics to the social sciences. One of these is the
black box problem. Among the simplest statistical techniques is Ordinary Least Squares (OLS), which
can be visualized as finding the line that best fits a set of data points on a scatter plot of, for example,
household income versus microcredit borrowing. The slope of this “regression” line—uphill, downhill,
or flat—indicates whether the overall relationship between the two variables is positive, negative, or
nonexistent. In fact, even this staple of undergraduate textbooks is complicated enough that it is hard to
perform by hand. Computers make it easy. But in the process of hiding the complexity of the analysis
they also hide the complexity of that which is analyzed. Figure 1, based on a classic paper by Francis
16 Roodman (2007, 2009); Roodman and Morduch (2009). 17 Karlan (2001). 18 Pitt and Khandker (1998); Roodman (2009b).

Roodman microfinance book. Chapter 6. DRAFT. Not for citation or circulation. 3/1/2011
11
John Anscombe, illustrates.19 Each of the four scatter plots shows a hypothetical set of 11 observations
on two variables, one on the horizontal axis, one the vertical. Imagine them as total microcredit
borrowing and household income for 11 families. Each plot implies a different kind of relationship
between the two variables. Yet all four yield exactly the same numerical results if plugged into a
computer program that does OLS. In particular, they all have the same best-fit line. A researcher who
merely looked at the numerical output such programs usually generated could easily miss the real story.
The potential for mistaken conclusions multiplies with more complicated techniques because they are
harder to check with graphs like these.
Figure 1. Four realities, one best-fit line
5
10
15
10 20
5
10
15
5 10 15 20
5
10
15
5 10 15 20
5
10
15
5 10 15 20
Source: Anscombe (1973).
19 Anscombe (1973).

Roodman microfinance book. Chapter 6. DRAFT. Not for citation or circulation. 3/1/2011
12
And just as methodological sophistication can obscure patterns in the underlying data, it can
obscure crucial assumptions, giving the work a false appearance of objectivity in the eyes of non-experts.
One popular technique for assessing what is causing a correlation is the use of “instrumental variables.”
For example, and simplifying somewhat, Pitt and Khandker, mentioned earlier, posit the following
causal chain in Bangladesh in the 1990s:
Landholdings Microcredit borrowing Household welfare
In other words, how much land a family owns influences how much it borrows—families owning
amounts above certain thresholds were formally barred from borrowing—and how much a family
borrows influences how well it does on such measures as total spending per week. Roughly speaking,
Pitt and Khandker’s key assumption is that no causal arrow runs directly from landholdings on the left to
welfare on the right: landholdings affect welfare only through borrowing.20 Thus if the two things on the
ends of the diagram appear correlated, moving up and down in counterpoint, then both the intervening
arrows shown must be at work. In particular, borrowing must be affecting welfare. Here landholdings
“instruments” borrowing; and having that arrow between the two, on the left, lets us study the arrow of
greatest interest, on the right.
Notice the reasoning here. We assume:
A. Landholding affects household well-being only through microcredit.
That plus data—an observed correlation between landholdings and welfare—leads to:
B. Microcredit affects welfare.
All reasoning proceeds this way: you have to assume something to conclude something. Most social
scientists, like Pitt and Khandker, make clear what they assume in order to conclude what they conclude.
Yet they often deemphasize the assumptions in abstracts and introductions, enough that the assumptions
20 More correctly—and fairer to Pitt and Khandker—they assume landholdings only affect welfare through microcredit or through other variables controlled for, such as the education of the head of household.

Roodman microfinance book. Chapter 6. DRAFT. Not for citation or circulation. 3/1/2011
13
escape the notice of those without the same mathematical expertise. This is unfortunate, for some who
lack the technical expertise are well qualified to judge the validity of the assumptions, if only they could
perceive them.
Implicitly or otherwise, social scientists evaluating microcredit chide the “believers,”—those
with fervent, even religious, confidence that microcredit helps the poor. “You can’t just make the leap of
faith,” the researchers say. “You have to look at the evidence.” It turns out that social scientists take
their own leaps of faith. And it is not always obvious that the assumptions they make are more credible
than those of the “believers.” A researcher assumes that landholdings affect welfare only through
microcredit. A believer believes microcredit affects welfare. How different are social scientists from the
practitioners who do microfinance every day, who also must forge ahead with little strong evidence on
the effects of microfinance, and who also probably allow their own biases to creep into how they
interpret that evidence? The scientists do better only to the extent that the assumptions they make are
more obviously true than the ones the believers make, which is to say, the assumptions the scientists test.
A final danger amplified by technical sophistication is data mining, which is the process of
sifting for certain conclusions, consciously or unconsciously. A statistical analysis (a “regression”) can
be run in a vast number of ways—varying the technique, which data points are included, which variables
are controlled for, and so on. The laws of chance say that even if variables of interest are statistically
unrelated, some ways of running the analysis will produce evidence of an improbable degree of
correlation: even a fair coin sometimes comes up heads five times in a row. Every step in the research
process tends to favor the selection of those regressions that show significant results, meaning those that
are superficially difficult to ascribe to chance. A researcher who has just labored to assemble a data set
on microcredit use among 2,000 households in Mexico, or to build a complicated mathematical model of
how microcredit boosts profits, will feel a strong temptation to zero in on the preliminary regressions

Roodman microfinance book. Chapter 6. DRAFT. Not for citation or circulation. 3/1/2011
14
that show microcredit to be important. Sometimes it is called “specification search” or “letting the data
decide.” Researchers may challenge their own results obtained this way with less fervor than they
ought.21 Research assistants may do all these things unbeknownst to their supervisors. Then, tight for
time, a researcher may be more likely to write up the projects with apparently strong correlations,
deferring others with the best of intentions. And if two researchers with the highest standards study the
same topic in somewhat different ways, the one finding the significant result is more likely to win
publication in a prestigious journal.22 Meanwhile, there is less career reward for spending time, as I have
done, replicating and checking the work of others.23 UCLA economist Edward Leamer characterized the
situation this way in his call to “take the con out of econometrics”:
The econometric art as it is practiced at the computer terminal involves fitting many, perhaps thousands, of statistical models. One or several that the researcher finds pleasing are selected for reporting purposes. This search for a model is often well intentioned, but there can be no doubt that such a specification search invalidates the traditional theories of inference….[A]ll the concepts of traditional theory…utterly lose their meaning by the time an applied researcher pulls from the bramble of computer output the one thorn of a model he likes best, the one he chooses to portray as a rose. … This is a sad and decidedly unscientific state of affairs we find ourselves in. Hardly anyone takes data analyses seriously. Or perhaps more accurately, hardly anyone takes anyone else’s data analyses seriously. Like elaborately plumed birds who have long since lost the ability to procreate but not the desire, we preen and strut and display our t-values.24
Readers of research filter too. Displaying a commitment to scientific evaluation unusual for a
microfinance group, ten years ago Freedom from Hunger carefully studied its “credit with education”
approach (see chapter 4) in Bolivia and Ghana. In Bolivia, the combination package apparently
increased what the researchers termed intermediate indicators, such as breastfeeding. But with regard to
the program’s ultimate goals, “the evaluation research provide[d] little direct evidence of improved
household food security and better nutritional status for children of mothers participating in the
21 Lovell (1983). 22 Sterling (1959); Feige (1975); Denton (1985). 23 Tullock (1959); Daniel S. Hamermesh, “Replication in Economics,” Working Paper 13026, National Bureau of Economic Research, Cambridge, MA, April 2007. 24 Leamer (1983). t-values measure statistical significance.

Roodman microfinance book. Chapter 6. DRAFT. Not for citation or circulation. 3/1/2011
15
program,” as measured by such indicators as body weight.25 Yet a nine-page review of the literature on
the impacts of microfinance published by the Consultative Group to Assist the Poor cites only positive
results from the Bolivia report, not mentioning the lack of strong evidence in this paper that Freedom
from Hunger had reduced hunger.26
The Promise of Randomized Research The most credible approach to constructing the counterfactual lies in not merely observing reality but
manipulating it. In the physical sciences, one can perform a classical controlled experiment with as few
as two observational units—observing whether black paper heats up faster in the sun than white paper—
because those units can be made identical except in the characteristic of interest. But people are not so
uniform or malleable, so experiments in the social sciences, like tests of new drugs, need larger samples
and a dose of randomness. If an experimenter chooses 1,000 people in a slum, offers microcredit to a
random 500 among them, then finds systematic differences between the two groups a year later, about
the only explanation short of the supernatural for the divergence is that the loans caused it. No two
individuals in this “randomized controlled trial” (RCT) were identical when it began, but the two groups
were probably statistically indistinguishable, having the same average income, type of roof,
entrepreneurial talent, etc. In effect, those not offered microcredit (the control group) are the
counterfactual for those offered (the treatment group). Put another way, the computerized random
number generator used to decide who gets the microcredit is an excellent “instrument” for credit:
Random number generator Microcredit borrowing Household welfare
It is very easy to believe that the random number generator on the left only affects household welfare
through microcredit; so if the two things on the ends prove statistically related, that makes a strong case
for microcredit causing changes in welfare. RCTs also have the virtue of mathematical simplicity, which
25 MkNelly and Dunford (1999), 92. 26 Littlefield, Morduch, and Hashemi (2003).

Roodman microfinance book. Chapter 6. DRAFT. Not for citation or circulation. 3/1/2011
16
drastically restricts the scope for black box confusion and data mining. Analysis can consist of little
more than comparing average outcomes between the treatment and control groups, either across the
whole sample or within subgroups such as children under ten or households headed by women.
For all these reasons, RCTs are the gold standard in medical research. A story illustrates. By the
late 1990s, half of postmenopausal women in America were—on the advice of doctors—taking artificial
hormones to replace the natural ones dwindling in their bloodstreams.27 Doctors drew confidence in
their prescriptions from non-experimental “cohort studies” that tracked thousands of women over time
and found that women who took artificial hormones had less heart disease. But beginning in 1991 the
U.S. government funded a major RCT-based research program called the Women's Health Initiative
(WHI), which performed randomized trials of, among other things, the estrogen-progestin combination
on women who still had their uterus. So harmful did the hormones prove in that trial that the WHI halted
it early. Women taking replacement hormones suffered more heart disease, as well as more strokes and
invasive breast cancers. (Death rates within the study period, however, were not higher.)28
The contradiction with the older cohort study results mystified experts.29 Perhaps women who
responsibly reduced their risk of heart disease by eating well and not smoking were also more apt to
follow the latest medical thinking by starting hormone replacement therapy, thus making it appear that
the drugs reduced heart disease. After the RCT results were published, drug companies promoted the
drugs much less and doctors prescribed them much less.30 Breast cancer incidence fell too, from 376
new cases per 100,000 among women 50 or older in 2002 to 342 the next year.31 That the WHI caused
the drop is not certain. However, a newer study tracks how fast heart disease, strokes, and cancer
declined among WHI subjects who were taken off hormones after the original study was halted.
27 Majumdar, Almasi, and Stafford (2004), 1987. 28 Writing Group for the Women’s Health Initiative Investigators (2002). 29 Kolata (2003). 30 Majumdar, Almasi, and Stafford (2004). 31 Horner et al. (2009).

Roodman microfinance book. Chapter 6. DRAFT. Not for citation or circulation. 3/1/2011
17
Working backwards, it estimates that hormone replacement therapy caused 200,000 extra breast cancer
cases between 1992 and 2002 in the United States.32 Non-randomized studies caused cancer.
Figure 2. New breast cancer cases per 100,000 among U.S. women 50 and older, 1975–2006
Seemingly, RCTs also ought to be the gold standard when it comes to deciding which social
programs are safe to inject into the lives of poor people. In fact, RCTs are hot in development economics
these days, the ticket to tenure at elite universities for young stars who study everything from the effect
of giving children de-worming medicine on their school grades to whether microfinance increases
microenterprise profits.33 Given the weaknesses of non-experimental evaluation, the rapid rise of the
32 Chlebowski et al. (2009). The study finds that another theory, declining rates of mammogram use, cannot explain why the number of cancer cases fell so much. 33 Altman (2002).

Roodman microfinance book. Chapter 6. DRAFT. Not for citation or circulation. 3/1/2011
18
“randomistas” seems fundamentally warranted. Yet it also bears the marks of a fad, so it bears a critical
look.
Indeed one of those marks is a brewing backlash. Recently, respected economists Angus Deaton,
Martin Ravallion, and Nobelist James Heckman have asked tough questions.34 One challenge they pose
is perhaps academic: Are RCT researchers doing science if they treat people and households as black
boxes—things to be experimented on and observed—without modeling or studying what goes on inside?
Medical researchers confronted this question decades ago, and reached a consensus that useful science
runs along a spectrum from “pragmatic” studies that tell us the real-world harm and good done by a
treatment, to “explanatory” ones that help us understand the mechanisms that link cause to effect.35 To
apply that perspective to microfinance, it is worthwhile and practical to study both the bottom-line
question of whether financial services make people better off and intermediate questions such as
whether the key is higher business profits or smoother spending. At any rate, the same debate applies to
non-experimental studies too.
A problem more inherent to experimentation is that randomized trials are by construction special
circumstances. Running an experiment requires the cooperation of microfinance providers, many of
which view manipulation of their offerings as administratively burdensome or immoral. Arbitrarily
offering a service to some people goes against their professional grain. “A bank for the poor such as
Grameen would find it hard to justify giving credit randomly to a group of poor people and declining
credit to others for methodological convenience,” explain Asif Dowla and Dipal Barua, two men
associated with Grameen since its earliest days. 36 The randomistas could argue that it is immoral not to
scientifically test a potentially harmful social program on the small number of people before unleashing
34 Deaton (2009); Ravallion (2009); Heckman and Urzua (2009). 35 Schwartz and Lellouch (1967). 36 Dowla and Barua (2006), 34. Dowla studied under Yunus and served as the Grameen project’s accountant. Barua founded Grameen with Yunus and was its Deputy Managing Director until 2009.

Roodman microfinance book. Chapter 6. DRAFT. Not for citation or circulation. 3/1/2011
19
it on the general population, just as for drugs. But they cannot experiment without the practitioners, so
they search for clever ways to randomize without withholding services. Karlan and Zinman, the ones
who later wrote “Lying about Borrowing,” persuaded lenders in South African and the Philippines to
randomly “unreject” some people who had applied for loans (more below).37 No one was randomly
rejected. Researchers at MIT worked with the Indian microfinance group Spandana to randomize which
neighborhoods got microcredit first as it expanded across the city of Hyderabad.
Such ingenious opportunism comes at some cost in representativeness. Since most microfinance
groups do not allow researchers to interfere with their decision-making, those that do may be atypical in
many ways. Meanwhile, out of commercial and ethical motives, Spandana did not withhold credit from
any part of Hyderabad for much longer than a year. That makes it hard to study the long-term impacts of
their microcredit: five years down the road differences between families who have borrowed for four
years and ones who have borrowed for five will be subtle. Then too, any evaluation applies at once to an
intervention and an intervener. Two microcreditors can implement the same curriculum quite differently.
Perhaps Spandana won’t get the kinks out of its Hyderabad operation until after the researchers have
finished evaluating them. Accepting that microcredit helps some more than others, the overall effect
depends as much on the creditor’s ability to select those it will help as it does on the potential effects on
each borrower. Also, as we saw in chapter 5, microcredit tends to start out with small loans to test
borrowers’ reliability. The steady ramp-up too may occur after researchers leave. Finally, some contexts
resist experimental evaluation altogether. In Bangladesh, most people already have access to
microfinance, making it impossible to construct a control group. In the very Mecca of microcredit, the
benefits cannot be rigorously demonstrated.
All these caveats go to show that even the gold standard has its blemishes. Every approach to
knowledge in the social sciences—qualitative or quantitative, experimental or otherwise—is deeply 37 Karlan and Zinman ([forthcoming]).

Roodman microfinance book. Chapter 6. DRAFT. Not for citation or circulation. 3/1/2011
20
compromised. Each has particular strengths, and so, in general, each probably deserves a place in the
evaluator’s portfolio. That said, my own examination of the research, including the work I did at that
Cairo hotel, leads me to be most critical of the type of study that has historically garnered the most
attention, namely, the quantitative, non-experimental kind.
Evaluating the evaluations Researchers and evaluators have performed hundreds of microfinance impact studies over the last 20-
odd years.38 There is no shortage of statistical “evidence.” However, if we apply quality filters to this
literature—Does a study include a credibly representative control group? Does it control for third factors
that may simultaneously affect credit and household welfare? Does it use credible instruments to purge
reverse causality?—the literature shrinks drastically. Why has so much study yielded so little
knowledge? The problem is not simply that researchers are careless, though they may feel pressure to
cut corners and publicize only favorable conclusions. The main problem is that already described, that
proving causation in social systems, not merely correlation, is hard. A literature summary published in
2007 speaks of only two pairs of studies, the first pair by Brett Coleman, formerly at the Asian
Development Bank, and the second pair, mentioned already, by Pitt and Khandker.39 The review in the
2005 textbook Economics of Microfinance casts the net only slightly wider, incorporating three studies
from the AIMS project (also mentioned before)—and those mainly to illustrate the difficulties of
measuring impact.40 To head off the appearance that I am biasing my own account by dwelling on
studies with problems, I will follow these precedents, adding only the randomized trials that have
recently become public.
38 Morduch and Haley (2002). 39 Meyer (2007). 40 Armendáriz de Aghion and Morduch (2005). ch. 8.
Roodman microfinance book. Chapter 6. DRAFT. Not for citation or circulation. 3/1/2011
21
Coleman’s studies of village banks in Northeast Thailand in 1995–96 Microfinance first caught the attention of Brett Coleman in the early 1990s, while he worked in Burkina
Faso for Catholic Relief Services (CRS). In 1992, he designed CRS’s first microfinance project in
Burkina Faso. He then returned to academia—to complete a Ph.D. in economics at Berkeley—and
decided to build his thesis around microfinance. Noting that microcredit repayment rates are typically
close to perfect, but assuming that many members have trouble making every payment, he wanted to
study how villagers responded to members in difficulty. Did they informally insure each other? Lend
each other money on the side? Intensify the peer pressure? But he also began to think about the bottom-
line question of impact. One day while sitting in a Berkeley coffee shop he hit upon a clever new way to
attack the question. After discussions, CRS and Coleman agreed to apply his method to a project run by
two CRS-backed non-governmental organizations (NGOs) doing village banking in Thailand (see
chapter 4). Normally, the NGOs visited villages slated for expansion a few weeks beforehand to explain
the program and help residents organize themselves into the groups that would become the village banks.
Then they made the first loans. But at Coleman’s request, the NGOs inserted a one-year delay for a
handful of villages: their village banks were organized in early 1995 but did not begin banking until
1996.
In most group microfinance programs, people get loans as soon as they form their groups. So if
an evaluator comes by a year later and discovers that borrowers are doing better on average than their
neighbors who avoided the groups (or were excluded), he can’t tell whether the credit deserves the
credit—or the borrowers were just better-off in the first place. But during the one-year delay, Coleman
could track the lives of the newly self-selected members, as well as their non-joining neighbors, and do
the same in villages with older, active banks. If village bank families gained more on their non-member
neighbors in villages where the credit was flowing than in villages where it wasn’t, that would suggest
that credit helps.

Roodman microfinance book. Chapter 6. DRAFT. Not for citation or circulation. 3/1/2011
22
Coleman found that CRS’s village banking was not operating as intended in Thailand.41
Households in the village banks were richer than non-members even before receiving support from the
village banks, with twice the average landholdings. “None of the villagers interviewed identified the
village bank as a program that targeted the poor….Frequently, the village chief’s wife was the village
bank president or held another influential committee position, and other wealthy leading women in the
village also usually became committee members.”42 And it was such influential members who took out
the largest loans, often under several different names. Coleman could detect no impact of borrowing on
the rank-and-file members, perhaps because their loans were so small. Those with longer tenure as
committee members, however, expanding holdings of non-land assets such as livestock; saved more;
and spent more on educating their boys. The women in the households earned more from and spent more
on small business activities—and engaged more in moneylending.43
The good news in Coleman’s study is that credit appears to have helped people. The bad news is
that they were hardly the “poorest of the poor” CRS had targeted.
Pitt and Khandker’s studies of solidarity group microcredit in Bangladesh in the 1990s Mark Pitt and Shahidur Khandker captained what long stood as the most ambitious effort to measure the
impacts of microcredit on borrowers. In 1991 and 1992, the World Bank funded the Bangladesh Institute
for Development Studies (BIDS) to field a team of surveyors in 87 randomly chosen villages and city
neighborhoods in Bangladesh. The Grameen Bank operated in some of the villages, BRAC in others,
and the official Bangladesh Rural Development Board in still others. Some villages had no microcredit
program. Some of the solidarity groups were all-male and more were all-female. None was mixed. The
sample included households that were participating in the programs; ones that had not joined even
though they were formally eligible, by virtue of owning less than half an acre; and richer households that
41 Coleman (2006) refines the analysis in Coleman (1999). 42 Coleman (2006), 1619. 43 Ibid., 1635–38.

Roodman microfinance book. Chapter 6. DRAFT. Not for citation or circulation. 3/1/2011
23
had also not joined.44 The surveyors visited these households after each of the three main rice seasons—
Aman (December–January), Boro (April–May), and Aus (July–August), asking up to 400 questions at
each stop.
The first published study of the data was a tour de force of economic reasoning and econometric
analysis, and it won publication in the prestigious Journal of Political Economy. Pitt and Khandker
found that “annual household consumption expenditure increases 18 taka for every 100 additional taka
borrowed by women… compared with 11 taka for men.” This conclusion reinforced two increasingly
popular beliefs about microfinance: that it reliably reduced poverty, and that it especially did so when
given to women. In a book, Khandker extrapolated from these results to estimate that the Grameen Bank
was lifting five percent of its borrowers out of poverty each year, which is the figure Yunus has cited.45
Pitt and Khandker also found that lending to women made them less likely to use contraception and
more likely to send their boys to school. And lending to women, less so lending to men, reduced how
much men in the household worked. Microcredit had no discernable effect on the work hours and non-
land assets of women, nor on the enrollment of girls in school.46
A pair of suppositions in the study set it apart from most that came before. The first was that the
rule barring those with more than half an acre of land created an artificial cut-off in the availability of
microcredit. Households just under the line and households just over probably had similar economic
prospects, yet officially one kind could get credit while the other could not. The comparison between
them, as between Coleman’s two groups, could reveal the effects of microcredit.47 Second, the authors
assumed that the historical factors that determined the gender of each credit group in the study (some
44 Households with non-land assets worth less than an acre of land were eligible too. 45 Khandker (1998), 56; Yunus interview op. cit. 3. 46 Pitt and Khandker (1998); Pitt et al. (1999). 47 A more precise description is: Pitt and Khandker used a fuzzy regression discontinuity design with uniform kernels over the whole sample.

Roodman microfinance book. Chapter 6. DRAFT. Not for citation or circulation. 3/1/2011
24
were all men, some all women) did not correlate with the outcomes of interest.48 Accepting this, the
authors could interpret any correlation between gender and the estimated impact as indicating causality
from gender to outcome. With these two assumptions, Pitt and Khandker exploited elements of
arbitrariness and randomness they claimed were present in the data in order to perform the next-best
thing to a randomized trial: a “quasi-experiment.”
Not long after Pitt and Khandker circulated their findings, a young economist named Jonathan
Morduch obtained and reanalyzed their data. He had already published a detailed analysis of the cost of
subsidies for the Grameen Bank, such as from the Ford Foundation and the government of Japan.49 Now
he wanted to compare that cost to the benefits for poor people. In a back-of-the-envelope pursuit of a
grand total, he performed a variant of the Pitt and Khandker analysis that was much simpler and did not
break out the impact by gender. To his surprise, the answer he obtained was, if anything, negative: credit
seemed to do harm. Morduch investigated further and ended up questioning some of Pitt and Khandker’s
key assumptions. For example, 203 of the 905 households in the 1991–92 sample that owned more than
0.5 acres used microcredit even though they were formally ineligible. They owned 1.5 acres on
average.50 Evidently, credit officers were pragmatically bending the eligibility rule to extend credit to
borrowers who seemed reliable and who were poor by global standards. So there was no obvious cut-off
in credit availability at the half-acre mark the way Pitt and Khandker had implied. As is common in such
debates, Morduch did not question the correlations that Pitt and Khandker had found as much as he did
their interpretation as proof of microcredit’s impacts. Morduch then offered some findings of his own,
albeit ones predicated on some of the assumptions he had just challenged: microcredit was helping
48 More accurately, credit group gender was assumed exogenous after controlling for various village, household, and individual characteristics. 49 Morduch (1999). 50 Figures from Roodman and Morduch (2009).

Roodman microfinance book. Chapter 6. DRAFT. Not for citation or circulation. 3/1/2011
25
families smooth their spending from season to season, assuring, for example, that they had enough to eat
more of the time.51
Within months Pitt fired off a point-by-point retort. In general, he argued that the assumptions
Morduch questioned either did not need to hold as exactly as Morduch implied; or Pitt demonstrated that
if the assumptions were relaxed, the original results held up.52 This public debate became a sort of
inconclusive trial: it lacked a judge and jury but had a big audience. The statistical arguments were
beyond the ken of most people interested in microfinance. And not even the litigants could fully explain
what was going on because each used his own methods and did not, or could not, reconcile his results
with the other’s. Both their papers could be scrounged up on the web, but neither was submitted to the
verdict of a peer-reviewed journal.
As the American academics sparred to a murky draw in 1999, on the other side of the world the
BIDS fielded a new team to travel across the provinces and resurvey all the 1,798 households last visited
in 1992. The surveyors found 1,638; of these, 237 had split into two or more new households as sons
were married off or once-cohabitating siblings built new houses for their expanding broods. For
econometricians, tracking the same people over time creates tantalizing new analytical possibilities. In
the case at hand, it allowed Khandker, writing on his own, to study how changes in microcredit use over
the 1990s affected changes in household spending over the same years. To appreciate the significance of
this tack, remember that hypothetical woman who was my example for omitted variable bias: her
aptitude for entrepreneurship simultaneously increases her borrowing and her income, creating a false
appearance that the first caused the second. Suppose that she was in Khandker’s data and that her
entrepreneurial talent affected her borrowing decisions and her family’s welfare equally at both ends of
the 1990s. Then when Khandker looked at changes in borrowing and welfare, the hidden talent would
51 Morduch (1998). 52 Pitt (1999).

Roodman microfinance book. Chapter 6. DRAFT. Not for citation or circulation. 3/1/2011
26
literally make no difference, just as the change from 100+10 to 100+20 is the same as the change from
10 to 20. By looking at changes, Khandker eliminated bias from omitted factors whose effects on
borrowing and welfare are fixed over time. They at least could not explain any positive connection he
found between borrowing and economic success.53 This is why a literature survey commissioned by the
U.S.-based Grameen Foundation judged that “Khandker’s 2005 paper may…be the most reliable impact
evaluation of a microfinance program to date.”54 The president of Freedom from Hunger described the
paper as the “one major study of microfinance impact on poverty that stands out.”55
Khandker’s results from the lengthened data set roughly lined up with Pitt and Khandker’s
earlier ones. Each 100 taka lent to a woman appeared to raise annual household spending by 15 taka,
instead of 18 before, while lending it to man appeared to have no effect, instead of 11 taka before.56
But of course omitted factors whose impacts did vary over time could still lurk in the data. After
all, why would propensity for entrepreneurship have constant effects in a changing country? Grameen
Phone, for example, arrived on the scene in the late 1990s, creating a radical new business opportunity:
“phone ladies” could buy a mobile phone with Grameen Bank credit, then rent it out like a payphone.
On balance, while Khandker’s study was strong by the standards of the literature, doubts could still be
raised about its conclusions.
This was the confusing state of the quantitative literature on the impacts of microfinance when I
encountered it in 2007. A pair of studies from Bangladesh led the pack. They were widely cited, but also
prominently criticized, with no clear resolution of the disputes. From my previous work on the effect of
foreign aid on economic growth in receiving countries, I had learned not to trust an econometric study
53 Khandker (2005). 54 Goldberg (2005), 19. 55 Dunford (2006), 8. 56 [cite—Khandker paper or book?]

Roodman microfinance book. Chapter 6. DRAFT. Not for citation or circulation. 3/1/2011
27
until I had replicated and scrutinized on my own computer (unless it was randomized).57 In order to
make an informed judgment, I felt compelled to approach the leading microfinance studies in the same
way. So I embarked on a project to obtain the raw data, replicate the data set used in the famous analyses,
program a computer to implement Pitt and Khandker’s sophisticated methods, rerun the analyses of Pitt,
Khandker, and Morduch, and check them for problems that might weaken the apparent correlations or
the interpretations placed upon them. In particular, I aimed to resolve the confusing stalemate between
Morduch and Pitt over the findings that Yunus, among others, indirectly cited. For a while, I followed in
Morduch’s footsteps. But I trod fresher ground too, writing a computer program that enabled other
people to apply the techniques Mark Pitt had pioneered.58 Ultimately, I joined with Morduch in refining
the new analysis, integrating it with his earlier work, and writing up the results.59
Taking to heart Anscombe’s admonishment to explore information through graphs, we started by
making pictures of the Pitt and Khandker data. Figure 3, below, shows the relationship between the two
variables of greatest interest, spending per person member in 1991–92 and total microcredit borrowing
over the previous 5–6 years. Each of the nearly 1,800 households appears three times since each was
surveyed in three seasons.60 Households that did not borrow are spread along the bottom of the plot. The
data are roughly centered around the “dollar-a-day” poverty line. To the naked eye, household spending
and borrowing seem unrelated here.
57 Roodman (2007). 58 Roodman (2009b). The program is “cmp” and is freely available. It runs in Stata, a commercial statistical package. 59 Roodman and Morduch (2009). 60 If a household borrowed $100, repaid it over a year, then borrowed $200, this is counted in the credit variable as $300 of cumulative borrowing. All figures are converted to taka of 1992, adjusting for inflation, then to dollars using the purchasing-power parity rate of 10.2 taka/dollar.

Roodman microfinance book. Chapter 6. DRAFT. Not for citation or circulation. 3/1/2011
28
Figure 3. Microcredit borrowing versus household spending in Pitt and Khandker data set, 1991–92
100
200
500
1,0
002
,000
5,0
00B
orr
owin
g si
nce
De
cem
ber
19
86 (
$)
0.3 0.5 1 2 3 5 10Spending per household member, 1991-92 ($/day)
To ferret signals out of this noise, we erase the data points and graph how average borrowing by
women and, separately, men vary as one scans from left to right. We also draw best-fit lines for each sex.
(See Figure 4.) Now patterns manifest. First, the credit-consumption relationship differs by gender. For
women, it is hill-shaped. While this graph proves nothing about causation, the most natural explanation
is that the poorest are excluded or self-excluded from microcredit, as in Northeast Thailand, while, in
Bangladesh at least, the richest tend not to bother with it. This matches what Habibah, the powerful
captain of a center of some 30 Grameen borrowers, told Helen Todd about how she selects new
members: “They should not be [too] landed, but they should own some land—some house land and
some vegetable land. They should not be extremely poor.” Notice that from the point of view of

Roodman microfinance book. Chapter 6. DRAFT. Not for citation or circulation. 3/1/2011
29
evaluating the impact of microfinance, Habibah’s system constitutes reverse causation, from wealth
level to borrowing.61
These patterns do not seem to follow straight lines. But statisticians often effectively fit lines to
data, so Figure 4 does too. Since the contour for men’s borrowing also tends toward an inverted “U,” but
with borrowing picking up at the high end, the best-fit line for men is nearly flat. For female borrowing,
it’s not obvious a priori what line would fit that hill best. According to standard statistical methods
(OLS, as used in Figure 1), the best-fit line turns out to slope downward, indicating that on average over
the entire sample, in richer households women borrow less—or to turn that around, households whose
women borrow less are less poor.
Figure 4. Microcredit borrowing versus household spending in Pitt and Khandker data set, 1991–92: smoothed moving averages and best-fit lines
Women
Men
100
110
120
130
140
150
Bo
rrow
ing
sin
ce D
ece
mb
er 1
986
($
)
0.3 0.5 1 2 3 5 10Spending per household member, 1991-92 ($/day)
61 Todd (1996), 173. Rutherford (2009), 110, documents the same selection at ASA, another Bangladeshi lender.

Roodman microfinance book. Chapter 6. DRAFT. Not for citation or circulation. 3/1/2011
30
The next graph (Figure 5) is constructed similarly, except that the data are first processed in a
way that parallels Pitt and Khandker’s methods, which are meant to remove the reverse causation, as
well as control for factors such as the age and education of the household head, which might otherwise
cause omitted variable bias. I have left the axes unnumbered because the processing puts the quantities
of interest onto scales with little intuitive meaning. In Pitt and Khandker’s framework, Figure 5 should
reveal impacts of microcredit. Theoretically, the slopes of the new best-fit lines correspond directly to
Pitt and Khandker’s headline result that “annual household consumption expenditure increases 18 taka
for every 100 additional taka borrowed by women… compared with 11 taka for men.” Yet our analysis
directly contradicts theirs: especially for women, and just as in Figure 4, as borrowing goes down,
household spending goes up.

Roodman microfinance book. Chapter 6. DRAFT. Not for citation or circulation. 3/1/2011
31
Figure 5. Microcredit borrowing versus household spending in Pitt and Khandker data set, 1991–92, instrumenting and controlling all for covariates: smoothed moving averages and best-fit lines
Men
Women
Bo
rrow
ing
sin
ce D
ece
mb
er 1
986
Spending per household member, 1991-92
This contradiction poses a mystery, which we have not resolved. In our paper, Morduch and I
report on several checks that build confidence in our results.62 Our findings raise an unexpected
question: did microcredit hurt Bangladeshi families on average? We doubt the data prove that. Rather,
statistical tests in our paper suggest that Pitt and Khandker’s attack on reverse causation—their asserted
quasi-experiment—did not work. Thus the same factors probably drive the negative credit-welfare
relationship in Figure 5 as in Figure 4: in less-poor households, women especially took less microcredit.
In sum, we question both the sign and the direction of causation in the headline results of Pitt and
62 Among these: we ran the same estimation program on a data set provided by Mark Pitt. My program is also capable of exactly imitating a dozen routines written by the Stata Corporation (Roodman 2009). And it works properly on a simulated data set constructed by a program (‘sim7.do”) in Pitt’s (1999) reply to Morduch.

Roodman microfinance book. Chapter 6. DRAFT. Not for citation or circulation. 3/1/2011
32
Khandker’s influential study. And we doubt their other results, such as the microcredit reduces use of
contraceptives, for the same reason.
We go on to replicate Morduch’s 1999 paper and Khandker’s 2005 one. Morduch’s finding of a
mildly negative relationship between borrowing and household spending of course matches our new
results.63 His discovery that microcredit also correlated with the seasonal volatility of household
spending, reducing it, turns out to rest on a more dubious foundation, as Morduch himself noted.64 As
for Khankder’s study of the data set expanded to cover 1999, it proved easier to reproduce, at least in
general contours. Households in which women increased their borrowing over the 1990s were also
spending more per person by the end of the decade. Khandker’s focus on changes in borrowing and
spending over the 1990s did rule out omitted variable bias—if the omitted variables had constant effecs
over the 1990s, as explained above. But that is a big “if.” As with our replication of Pitt and Khandker,
we perform a technical test—one more common today than a decade ago—that strongly suggested that
the key assumption does not hold. Khankder’s method had not in fact ruled out stories competing with
the microcredit-raising-spending story. Increasing wealth may have led people to borrow more.
This review of non-experimental studies leaves little evidence standing that microcredit helps the
poor. Because families and villages are so complex—everything in them affects everything else—it is
extremely difficult for non-experimental quantitative studies to tease apart cause and effect. Notably,
Coleman’s study is experimental (though not randomized) in that he worked with CRS to subtly
manipulate the credit programs he studied, introducing that one-year delay. This conclusion throws into
sharp relief the potential value of the new generation of experimental tests of microfinance.
63 Morduch (1999) aggregates borrowing across genders. From the point of view of the new study (Roodman and Morduch 2009), this blends the strong negative sign for female borrowing and the essentially zero coefficient for male borrowing. 64 But as we saw in chapter 2, it is not a stretch to conclude from talking to poor people that many do just that, whatever the average effect.

Roodman microfinance book. Chapter 6. DRAFT. Not for citation or circulation. 3/1/2011
33
RCTs to the Rescue? Somewhat tongue-in-cheek, the late sociologist Peter Rossi once enunciated “The Iron Law of
Evaluation and Other Metallic Rules.” His Iron Law says that on average the measured impact of a
large-scale social program is zero. His Stainless Steel Law warns that “the better designed the impact
assessment of a social program, the more likely is the resulting estimate of net impact to be zero.” Rossi
conceded that “The ‘iron’ in the Iron Law has shown itself to be somewhat spongy”—some programs
have been clearly shown to work—but:
The Stainless Steel Law appears to be more likely to hold up….This is because the fiercest competition as an explanation for the seeming success of any program—especially human services programs—ordinarily is either self or administrator-selection of clients. In other words, if one finds that a program appears to be effective, the most likely alternative explanation to judging the program as the cause of that success is that the persons attracted to that program were likely to get better on their own or that the administrators of that program chose those who were already on the road to recovery as clients. As the better research designs—particularly randomized experiments—eliminate that competition, the less likely is a program to show any positive net effect.65
Summarizing a career’s worth of social program evaluation, Rossi’s laws are food for thought as we turn
to RCTs for enlightenment about the effects of microfinance. If the Stainless Steel Law holds up, the
RCTs will show smaller effects than the older non-randomized studies.
If one defines “microfinance” broadly then the first microfinance RCT took place in South
Africa. There, in 2005, Dean Karlan and Jonathan Zinman of Innovations for Poverty Action (IPA)
worked with a “cash lender,” not unlike a payday lender in the United States, to randomly “unreject”
some applicants. The company made individual loans, typically at 11.75 percent interest per month for
four months. In the first instance a computerized credit scoring system screened loan applications by
taking into account such factors as the borrower’s income and repayment history. Branch employees,
however, could override the computer’s credit scoring. To perform the experiment, the company agreed
to tweak the computer program to randomly “unreject” some applicants who fell just below the usual
approval threshold. They turned out to have incomes of about $6.50/day/household member. That the
65 Rossi (1987).

Roodman microfinance book. Chapter 6. DRAFT. Not for citation or circulation. 3/1/2011
34
Karlan and Zinman studies stray so far from the $1–2/day poor we usually imagine as the target for
microcredit is not a flaw, but it generates a caution for interpretation. And it reflects a limitation of
randomized credit scoring: scoring entails too much time-consuming data collection to be economical
when making the littlest loans to the poorest people.
After setting their RCT top to spinning, Karlan and Zinman dispatched surveyors to the homes of
accepted and rejected applicants alike. Applications did not all at happen at the same time, nor did
survey visits, so the space between the two events ranged between 6 and 12 months. To prevent
borrowers from tilting their answers, the surveyors did not reveal their connection to the lender—indeed
could not, for they were unaware of it themselves.66
The data revealed that applicants unrejected by the computers were 10 percentage points more
likely to have a job than rejected ones with similar credit scores, 7 points less likely to fall below the
poverty line, and 6 points less likely to report that someone in the household had gone to bed hungry in
the last month.67 Although the exact mechanisms by which credit improved well-being are unclear,
stories from borrowers suggest that the key lay in helping people get and hold jobs. They might use the
loans to buy required uniforms, or sample kits for sales work, or fix or buy a vehicle to get to work.68 In
a separate study, Karlan and Zinman joined Lia Fernald, Rita Hamad, and Emily Ozer to study
psychological effects of borrowing using a battery of mental health assessment survey questions.
Borrowers, especially men, appeared more stressed and depressed than non-borrowers.69 Seemingly,
66 Karlan and Zinman ([forthcoming]). $6.50 figure is based on monthly household income of 4,389 rand for applicants with a 50% chance of being unrejected, an average 5.6 people per household, and a purchasing power parity (PPP) conversion factor of 3.87 rand/dollar for 2005. 67 Ibid. 68 Dean Karlan, Yale University, e-mail to author, July 23, 2009. 69 Fernald et al. (2008).

Roodman microfinance book. Chapter 6. DRAFT. Not for citation or circulation. 3/1/2011
35
holding down a job and paying off a loan impose a psychological burden even as they boost economic
well-being.70
In showing these benefits, have Karlan and Zinman defied Rossi’s Laws? Technically, no. Rossi
wrote about social programs, interventions funded by governments or charities for the public good. But
the South African company lent for profit. Still, the study does show how small loans can help the poor.
The more important caveat is that the study subjects lived well above standard poverty lines of $1 and
$2/day and the stories of their successes with credit revolve around employment, not entrepreneurship,
contradicting the popular image of microfinance. As we saw in chapter 2, a job is a distant dream for
most of the world’s poor.
Just as this book was being written, more than 30 years after the birth of modern microcredit, the
first results are emerging from randomized tests of what is more usually thought of as microfinance
(small-scale, socially motivated, yet businesslike financial services for the self-employed). 2009 in fact
turned out to be a milestone year, with the appearance of two studies of microcredit and one of
microsavings. So far the conclusions about microcredit do conform to Rossi’s Laws.
Karlan and Zinman reprised their South Africa study in the Philippine capital of Manila with
First Macro Bank, which makes individual microloans. Here, the typical borrower was a family with a
sari-sari store—a corner store that sells cigarettes, basic foodstuffs, and other items. To merit
consideration for a loan, thus inclusion in the study, applicants had to be “18–60 years old; in business
for at least one year; in residence for at least one year if owner or at least three years if renter; and [have
a] daily income of at least 750 pesos [$34].” Since the subjects were already in business, the study could
not check whether credit helps people become entrepreneurs. Also, the income floor put the study
population well above the Philippine average. Per household member (including children), the average
70 Probably some borrowers exhibited the psychological symptoms more than others, however. The ones who felt more stress may not be the ones who retained employment thanks to the credit, in which case stress and employment might not be linked.

Roodman microfinance book. Chapter 6. DRAFT. Not for citation or circulation. 3/1/2011
36
income in the study worked out to $8/day.71 An impressive 62% of borderline applicants, whom the
computer allowed an 80% chance of “unrejection,” and who dominate the study, had some college
education, which is a higher than in the United States!72
After follow-up periods ranging from 11 to 22 months, the survey teams ultimately tracked down
about 70% of those rejected and those accepted. They asked many questions, observed the quality of
borrowers’ houses, and even administered psychological tests. Unlike in South Africa, almost none of
the dozens of indicators of well-being collected appeared affected by access to the credit. The most that
can be said is that the access led entrepreneurs to borrow more from formal institutions such as First
Macro Bank (unsurprisingly); cut back on employees, house renovation, and perhaps health insurance
(perhaps a sign of belt-tightening at the time of a big investment partly financed by a new loan); express
more trust more in their neighbors (after experiencing that the bank is there to help); and borrow more
easily from family and friends (having won the bank’s seal of approval). These effects tended to be
stronger for higher-income households.73
The other randomized study of microcredit, by Abhijit Banerjee, Esther Duflo, Rachel
Glennerster, and Cynthia Kinnan of the Abdul Latif Jameel Poverty Action Lab (J-PAL) at MIT, reaches
people usually thought of as targets for microfinance. Through the India-based Centre for Micro Finance,
the MIT economists worked with the microfinance group Spandana to randomize the roll-out of its
operations in Hyderabad, India’s fifth-largest city. Spandana chose 104 areas of the city to expand into,
and then, in 2006 and 2007, started lending in a randomly chosen 52 of the 104. A year later, surveyors
visited more than 6,000 households in all 104 districts, restricting their visits to families that seemed
71 Karlan and Zinman (2009). Figures of $34 and $8 use a 2006 PPP conversion factor of 22.18 pesos/dollar, the latter also using a mean monthly household income per capita of 5,301 pesos. 72 Ibid.; U.S. Census Bureau, “Educational Attainment in the United States: 2008,” Table 2. Educational Attainment of the Population 25 Years and Over, by Selected Characteristics: 2008 (both sexes), ow.ly/DRgT. 73 Karlan and Zinman (2009). For more discussion, see my blog post “The Other Shoe Drops: 2nd Randomized Microcredit Study,” ow.ly/DRuL.

Roodman microfinance book. Chapter 6. DRAFT. Not for citation or circulation. 3/1/2011
37
more likely to borrow: ones that had lived in the area at least three years and had at least one working-
age woman. Respondents lived on $2/day on average.74 27.0% of households in Spandana-served areas
reported taking microcredit, two-thirds of them from Spandana. In control areas, 18.7% took microcredit.
That rather modest difference was the basis for assessing the impact of increasing use of microcredit.75
The researchers found no certain effects on most bottom-line indicators: total household
spending/person; household businesses owned/person; whether women have say in household spending
decisions; health spending/person; children’s major illnesses; school enrollment; and school spending.
But households in Spandana areas were 1.7% more likely to have opened a business in the last year; as a
fraction of those who actually borrowed, the number opening businesses might be closer to 5%. And
households with more propensity to open their first business—as indicated by having more land, more
working-age or literate women, and of course no business—were indeed more likely to do so if they
were in a Spandana area. Such households also spent more on “durables” such as sewing machines and
cut back on “temptation goods” such as snacks and cigarettes. Meanwhile, existing business owners
increased profits.76
If microcredit led to more businesses and more profits, why didn’t household incomes rise? The
survey data do not allow a definitive answer. One reason may be that people who invested more money
and time in their own businesses worked less, and earned less, outside the home. Perhaps Another is that
only about a third owned a business, so once their gains waned once averaged over the whole sample.
The welfare of non–business owners may even have declined, as they borrowed in part to pay for
temptation goods. Perhaps a year was too short to wait to witness the full effects of credit.
74 $2 figure based on a sample-average household consumption per capita of 981 rupees, and a 2006 PPP conversion factor of 15.06 rupees/dollar. 75 Banerjee et al. (2009). 76 For more discussion, see my blog post “First Randomized Trial of Microcredit,” ow.ly/DStV.

Roodman microfinance book. Chapter 6. DRAFT. Not for citation or circulation. 3/1/2011
38
The brightest spot in recent microfinance impact research has also been the least heralded—a
trial of savings undertaken by two economists just finishing their dissertations. In the rural market town
of Bumala on the road between Nairobi and Kampala, Pascaline Dupas and Jonathan Robinson worked
with a local “village bank” to offer free savings accounts to randomly selected “market vendors, bicycle
taxi drivers, hawkers, barbers, carpenters, and other artisans,” in other words, existing
microentrepreneurs. The accounts paid no interest and in fact charged for withdrawals, which may have
been a good thing for people looking for discipline to help them save. (The village bank here is a
Financial Services Association, a type of institution in Kenya that resembles the 19th century “village
banks” more than the ones devised by John Hatch in that members buy shares. See chapters 3 and 4.)
Uniquely, the research team followed up with the subjects not once, through the usual door-to-door
survey, but daily over several months, through logbooks not unlike the financial diaries at the heart of
Portfolios of the Poor.
Of the 122 people offered an account, about 67 opened one and actually used it, of which only 54
made more than one deposit in six months. A relatively small group, mainly female, made most of the
deposits and withdrawals. That’s a cohort in which to study impacts, yet the authors find significant
differences. Women invested more in their businesses and increased personal spending within 6 months.
The savings accounts appeared to help them accumulate money for major purchases for their businesses,
such as stock for their stores. That may have increased profits. The pattern did not hold for men. It is
unclear whether the accounts helped primarily by giving women more control over their own impulses
to spend rather than saving to invest, or by giving them a way to deflect family requests for money.
Especially if the latter, the women’s gains may have come at the expense of relatives outside the study
group.

Roodman microfinance book. Chapter 6. DRAFT. Not for citation or circulation. 3/1/2011
39
The new generation of randomized studies marks a big break with the past and holds real
promise for getting to bottom-line questions of impact. Yet each RCT makes only a incremental
contribution to knowledge. It tells us a bit about what happened to particular groups of people at
particular places and times. A good way to put such a study in perspective is to state its findings tightly.
Take the Hyderabad study as example: In 2007–08, one year after Spandana began operating in some
areas of Hyderabad, among households that had lived in their area for at least three years and had at least
one working-age woman, those in Spandana areas saw no changes in empowerment, health, education,
and total spending, on average, that were so large as to defy attribution to pure chance, compared to
those in areas Spandana would soon expand into. The hope is that as more microfinance RCTs are done
in other contexts, we will gain a richer sense of the impacts. Still, RCTs have inherent limitations. In
Hyderabad, for example, Spandana is now free to expand into the half of the city it avoided before,
which makes studying long-term impacts difficult. Five years from now, researchers will not be able to
benchmark people who had access to Spandana microcredit for five years against people who had none.
Rather, we will only be able to benchmark against people who had microcredit for four years. If
anything, contrasts will wane
Conclusion I draw two main lessons from this tour of the evidence. First, poor people are diverse, and so are the
impacts of microcredit upon them. Thus, microcredit undoubtedly helps many people. A distinction that
appears particularly important in the latest results is between entrepreneurs, who are a minority, and
everyone else. More controversially, I conclude that there is no convincing evidence beyond the
widespread impression that microcredit raises incomes on average. That Holy Grail, though many have
sought it and many have thought it found, still eludes us. It is entirely possible that for a majority of
microfinance users do not invest in microenterprises, but instead use the loans to smooth spending on

Roodman microfinance book. Chapter 6. DRAFT. Not for citation or circulation. 3/1/2011
40
necessities, as we saw in chapter 2. That would show up as lower spending (net of interest payments)—
and getting to eat every day. So far, the randomized studies have not checked this possibility.
The ambiguity about average impact arises from an opaque mixture of four factors: 1) different
people use microfinance different ways; 2) credit in particular must make some borrowers’ lives worse
and leave others little changed, and those effects weigh into averages; 3) families, villages, and
neighborhoods are complex webs of causal relationships, which are hard to disentangle, except with
RCTs; 4) average effects depend as much on the ability of microfinance institutions to select those most
likely to use finance well as it does on the spectrum of potential effects on different kinds of borrowers.
These complexities no doubt obscure the real impact of microfinance; yet their significance
should not be exaggerated. The benefit of cash lending in South Africa shines through in Karlan and
Zinman’s data for not-so-poor people who hold jobs. Were the average benefits of microcredit for
poorer people without much access to steady employment as clear-cut, they too should shine through in
RCTs. Until that happens, prudence calls for skepticism of any claims about the systematic
transformative power of microfinance. And until researchers understand better how many are made
worse off by microcredit, we cannot be sanguine about the ethics of the intervention. Suppose
microcredit lifts 90 percent of borrowers just above the poverty line and consigns the rest to a spiral of
indebtedness and destitution. Is that a reasonable trade-off, or a bargain with the devil?
All of which brings me back to my encounter with those women in the Shubra district of Cairo.
Should I have told them they were making a mistake, risking their good names on an unproven
intervention? Can 50 million microcredit borrowers around the world all be wrong? I think not. Absent
strong evidence of harm, it would be the height of arrogance to question their judgment. On the other
hand, absent strong evidence of benefit, it is reasonable to ask whether an intervention carried out with
my money, in my name, is actually helping.

Roodman microfinance book. Chapter 6. DRAFT. Not for citation or circulation. 3/1/2011
41
Think of the paradox this way. In the last decade, the mobile phone has spread like wildfire in
most poor nations, including the Democratic Republic of Congo (DRC), a vast and war-torn nation with
shards of government. Few doubt that this is a good thing. Scarce are the skeptics who demand RCTs to
prove that mobile telephony helps the poor. Clearly, interconnection adds new possibilities to life. And
the triumphs of Grameen Phone in Bangladesh and Celtel in the heart of Africa are properly sources of
indigenous pride. By demonstrating corporate excellence in nations long seen as economic basket cases,
they inspire imitators in other lines of business. Indeed, most of the countries that are today rich got that
way thanks to just such business successes, repeated a thousand times over. But another Western import
has also overspread the developing world: cigarettes. Few doubt that this is a bad thing. The scientific
evidence on the dangers of smoking should trump any attempt to cast the global tobacco addiction as a
welcome triumph for consumer autonomy of entrepreneurship. So is microfinance, or microcredit in
particular, more like cell phones or cigarettes?
Cell phones, almost certainly. Though the dangers of debt are indisputable, researchers have
produced no solid evidence that microcredit systematically does harm. Savings, insurance, and money
transfers seem even more benign. But if microfinance is the monetary equivalent of the mobile phone,
does it deserve permanent charitable support through grants, cheap loans, and unusually patient equity
investment? To turn that around, should Mo Ibrahim win a Nobel Peace Prize for founding Celtel, as
Yunus did for founding Grameen? Should Kiva.org broker airtime minutes as well as credit?
Unless or until randomized microfinance trials show strong average benefits, the most
convincing case that can be made for charitably supporting microfinance must rest on grounds less
compelling than hard and evidence of impact—but also more honest. The next two chapters explore two
major themes in this vein, both hinted at in the mobile phone metaphor: the extent to which financial

Roodman microfinance book. Chapter 6. DRAFT. Not for citation or circulation. 3/1/2011
42
services give poor people more options and agency, and the extent to which microfinance has
contributed to the commercial fabric of nations.