Romanian Logistics 2013-11-12 - Econet Romania · Romanian Logistics “Facts, Figures and...
45
Romanian Logistics “Facts, Figures and Reality” Bucharest, November 12 th 2013 ROMEO DUMITRU – Vice-President ARILOG (Romanian Logistics Association)
Transcript of Romanian Logistics 2013-11-12 - Econet Romania · Romanian Logistics “Facts, Figures and...

Romanian Logistics
“Facts, Figures and Reality”Bucharest, November 12th 2013
ROMEO DUMITRU – Vice-President ARILOG
(Romanian Logistics Association)

Next destination
ROMANIA

ROMANIA ROMANIA -- locationlocation
FIGURES

ROMANIA ROMANIA -- GeographyGeography
FIGURES
Official name : ROMANIACapital : BUCHARESTSurface area : 238 391 sq km
land: 230 340 sq kmwater: 7 160 sq km
Population : 22+ mil. PeopleTime : GMT + 2hLocal currency : LEU (pl. = LEI ; symbol : RON)GDP : 9687+ Euro/capita (2012 est.)
ROMANIA ROMANIA -- StatisticsStatistics

ROMANIA ROMANIA -- StatisticsStatistics

Import volume: $78.85 billion USD (2012)
Import commodities: machinery and equipment, fuels and minerals,chemicals, textile and products, basic metals, agricultural products Import countries: Germany 16.7%, Italy 11.6%, Hungary 8.7%, France 5.9%, China 5.5%, Rusia 4.4%, Austria 4.1% (2010)
ROMANIA ROMANIA -- the second market from CEE, after Polandthe second market from CEE, after Poland
Export volumes: $67.42 billion USD (2012)
Export commodities: textiles and footwear, metals and metal products, machinery and equipment, minerals and fuels, chemicals, agricultural products Export countries: Germany 18.9%, Italy 13%, France 7.6%, Turkey 6.2%, Hungary 5.7%, UK 3.6% (2010)
FIGURES

Next destinationROAD TRANSPORT

Romania – Transport Future Motorways
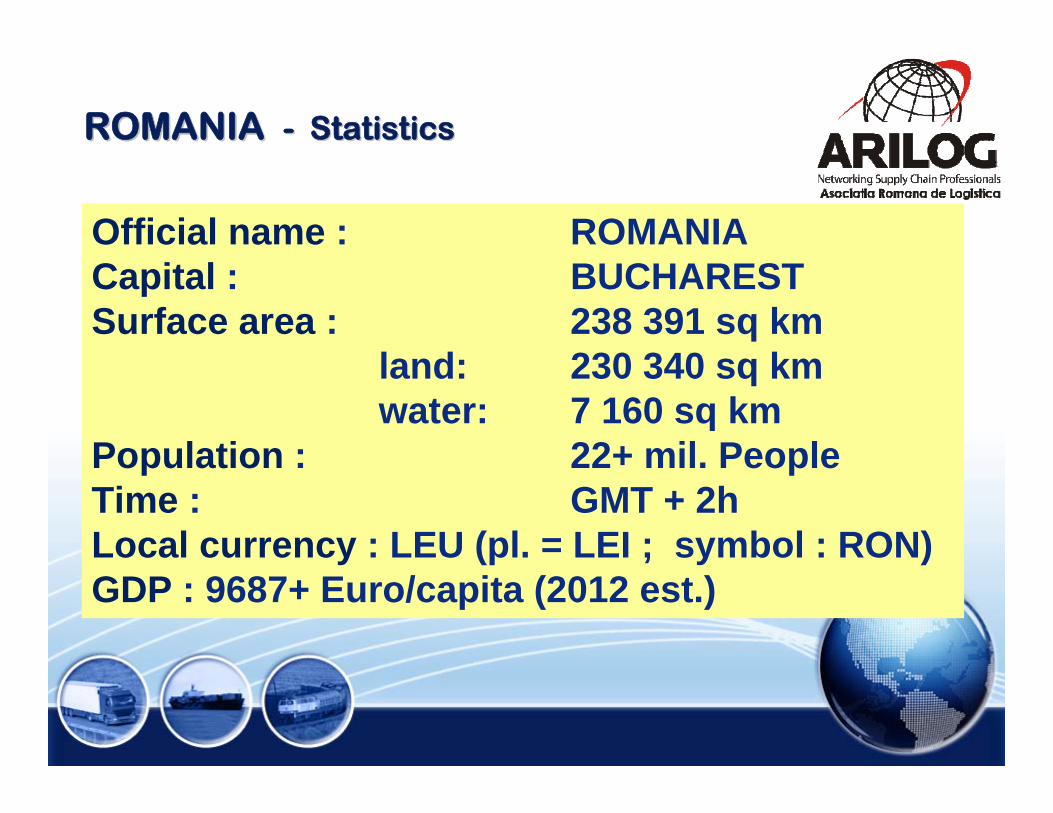
Source : Romanian Ministry of Transportation
Romania Romania –– Transport Future MotorwaysTransport Future Motorways
DREAMS
Romania – Transport Future Motorways
Source : Romanian Ministry of Transportation
Romania Romania –– Roads structureRoads structure
DREAMS

FACTS
Romania Romania –– Road transport parametersRoad transport parameters
Carriers’ average COSTS in International traffic :0.87… 0.93 euro/km – breakeven tariff for average
run of 10 000 km/month!
cca 40 km/h – trucks’ average commercial speed
Carriers’ average COSTS in National traffic :0.76 … 0.79 euro/km – breakeven tariff for average
run of 8 000 km/month!
Around 200 000 cargo trucks with authorized weight over 3.5 to

FACTS
Romania Romania –– Road transport utility linksRoad transport utility links
• The Romanian Road Transport authority (ARR) :
http://www.arr.ro
• The Romanian Road Vehicles Registry Office (RAR) :
http://www.rarom.ro
• The Road Carriers Guild (UNTRR) :
http://www.untrr.ro

FACTS
CRYSIS AS CATALYST INTO RESTRUCTURING PROCESS
• The crisis helped the industry to became more sustainable • The transport operators optimized their fleets (read “reducing”)• Many companies who have their own fleet but their core business is not transportation are selling them and outsourced the transport activity. • The small transport operators are creating the clusters or professionals groups in order to offer specialized and complex solutions for clients (forced for surviving).
•A part of vehicles were sent back to the leasing companies.

BAD REALITIES
REALITY
“JALOPY PROGRAM” –renewing the old auto park
Infrastructure “quality”

BAD REALITIES
REALITY
City after a winter war National roads after a winter war
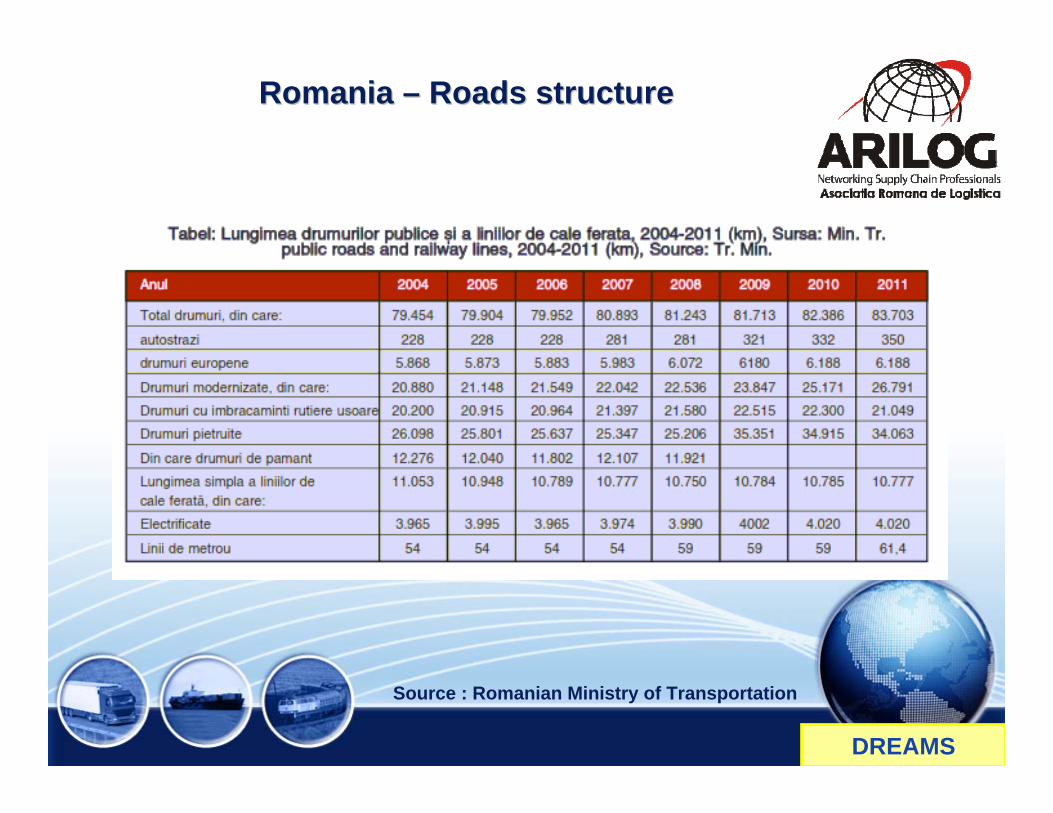
BAD REALITIES
REALITY
City under snow National road under snow

BAD REALITIES
REALITY
Congestion in traffic Theft from vehicles
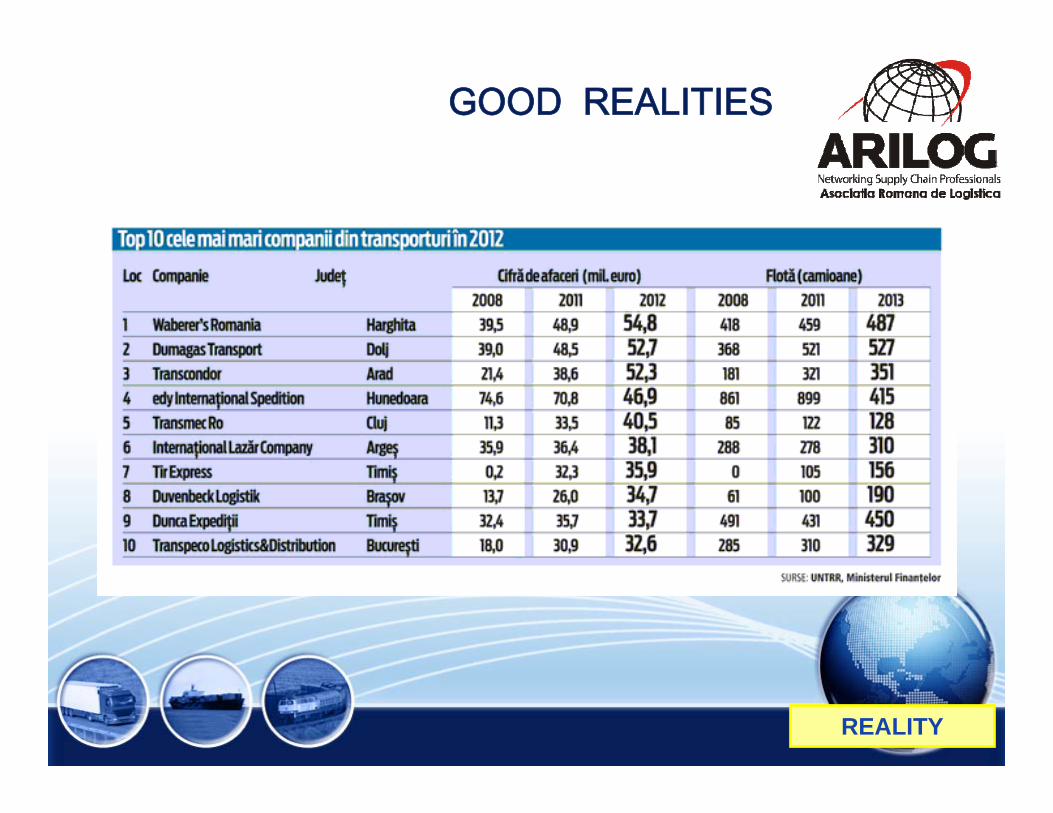
GOOD REALITIES
REALITY

International Lazar Company - “European Transport Company of the Year 2010"
The prize "European Transport Company of the Year 2010" has been awarded on February 11th, 2010 in Bruxelles , within the framework of a ceremony that got together more than 1200 people, representatives of the haulers, of the transport industry and of the specialized press from the whole Europe. Being in the competition with another 5 finalists from Germany, Sweden, United Kingdom, Belgium and Netherlands, International Lazar Company has obtained a 3rd honorable award, after the representatives of United Kingdom and Belgium.
REALITY

Next destinationRAILWAY TRANSPORT

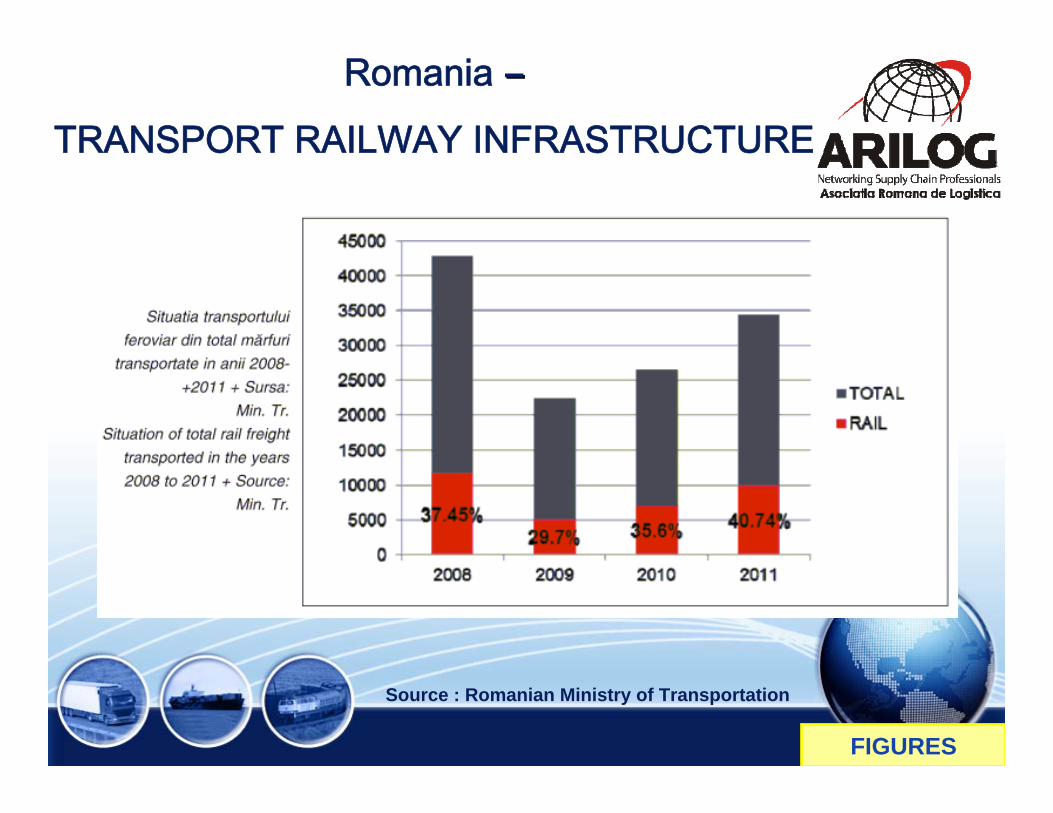
Romania – Transport Railway Infrastructure
Source : Romanian Ministry of Transportation
Romania ––
TRANSPORT RAILWAY INFRASTRUCTURE
Length: 10.821km
Unused:
3300km
Rented:
911km
FIGURES

Romania – Transport Railway Infrastructure
Source : Romanian Ministry of Transportation
Romania ––
TRANSPORT RAILWAY INFRASTRUCTURE
FIGURES
Romania – Transport Railway Infrastructure
Source : Romanian Ministry of Transportation
Romania ––
TRANSPORT RAILWAY INFRASTRUCTURE
FIGURES

BAD REALITY
REALITY
INCIDENTS OLD AN POOR INFRASRUCTURE

GOOD REALITY
MODERNIZED TRAINS MODERNIZED TRAIN STATIONS
REALITY

WARNING! RAILWAY CRISIS
• Antiquated structure with “0” Investments
• The Railway transport function is “shifting” towards the road transportation
• More and more traditional railway customers cease to use this transportation mode
• The prices offered by foreign companies became more attractive
• Nothing is changed in Transportation Ministry budget
REALITY
GOOD NEWS : CFR MARFA (state owned Cargo Railway Company) is for sale !

Next destination
CONSTANTA PORTCONSTANTA PORT

CONSTANTA PORT - Vital node within the international logistic transport chain
Direct transport services between far east and the Black Sea
Possibility for direct transshipment into river ships
Opportunity to finance infrastructure development projects through European funds
Intermodal connections towards the hinterland (road, rail, iwt, air)
The free “zone regime” of Constanta Port, stimulating the transit traffic towards the hinterland
FACTS
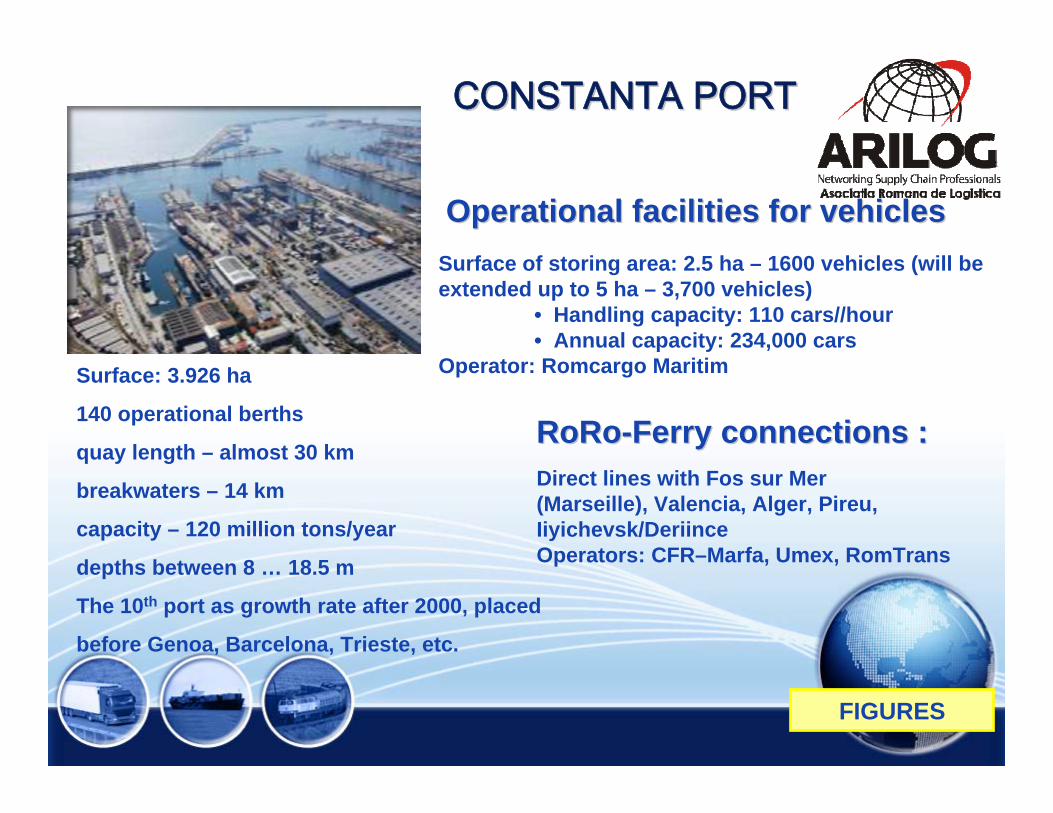
Surface: 3.926 ha
140 operational berths
quay length – almost 30 km
breakwaters – 14 km
capacity – 120 million tons/year
depths between 8 … 18.5 m
The 10th port as growth rate after 2000, placed
before Genoa, Barcelona, Trieste, etc.
Surface of storing area: 2.5 ha – 1600 vehicles (will be extended up to 5 ha – 3,700 vehicles)
• Handling capacity: 110 cars//hour• Annual capacity: 234,000 cars
Operator: Romcargo Maritim
Operational facilitiesOperational facilities for vehicles for vehicles
Direct lines with Fos sur Mer(Marseille), Valencia, Alger, Pireu,Iiyichevsk/DeriinceOperators: CFR–Marfa, Umex, RomTrans
RoRoRoRo--Ferry connections :Ferry connections :
CONSTANTA PORTCONSTANTA PORT
FIGURES

CONSTANTA PORT TRAFFIC
FIGURES

THE BARGE TERMINAL
First stage of the project was finalized in May 2008
Project objectives:Streamline the navigation in the river-maritime sector of the port
Improve IWT infrastructure in the Port of Constanta
Provide prosper conditions for barges convoys to call and be assembled
Quay for barges:1,200m with 7 m depth
Quay for tugs and pushers: 300 m with 5 m depth
Total value of the project:22.5 mil. Euro Financed through a non-sovereign loan from EBRD (67%) and own resources (33%)
CONSTANTA PORT - Development Projects
FACTS

Such a strategy will strengthen the cooperation between the DanuSuch a strategy will strengthen the cooperation between the Danube riparian be riparian countries / Romania is a vital transport node in the Southcountries / Romania is a vital transport node in the South--Eastern part of Eastern part of Europe. Europe.
FACTS
Romania promotes its
STRATEGY FOR THE DANUBEInland waterways transport
The European Commission has now the mandate to elaborate the future strategy for the Danube region

GalaGalattiiBrBraailailaTulceaTulceaCalarasiCalarasiOltenitaOltenitaGiurgiuGiurgiu
The Romanian sector The Romanian sector of the Danube of the Danube -- PortsPorts
The Danube The Danube –– Black Black Sea CanalSea Canal
The Poarta Alba The Poarta Alba ––Midia Navodari Midia Navodari CanalCanal
LengthLength 64.4 km64.4 km 32.5 km32.5 km
Maximum allowed Maximum allowed draughtdraught
5.5 m5.5 m 4.5 m4.5 m
Twin locksTwin locks 2 (Agigea and 2 (Agigea and Cernavoda)Cernavoda)
2 (Ovidiu and 2 (Ovidiu and Navodari)Navodari)
Maximum allowed Maximum allowed convoysconvoys
18.000 to18.000 to 3.000 to3.000 to
Maritime and inland Maritime and inland vesselsvessels
5.000 tdw5.000 tdw 2.000 tdw2.000 tdw
FACTS

Next destination
Warehousing Industry

Romania – Warehousing Industry
No accurate statistics in regards to turnover;No accurate statistics in regards to turnover; ““AA”” Class warehouses : 1.4 + million sqmClass warehouses : 1.4 + million sqm 890 000 sqm located in Bucharest area890 000 sqm located in Bucharest area 10 10 –– 15 % vacancy rate15 % vacancy rate 3.2 3.2 -- 4 Eur/ sqm rent for 2 500 4 Eur/ sqm rent for 2 500 -- 10 000 sqm10 000 sqm
(even lower for areas as Arad, Oradea, Timisoara (even lower for areas as Arad, Oradea, Timisoara etc.)etc.) lower prices for higher surfaces or locations farer lower prices for higher surfaces or locations farer from big citiesfrom big cities service charge : 0.70 service charge : 0.70 -- 0.95 Eur/sqm0.95 Eur/sqm contract duration : 3 contract duration : 3 -- 5 years5 years FIGURES
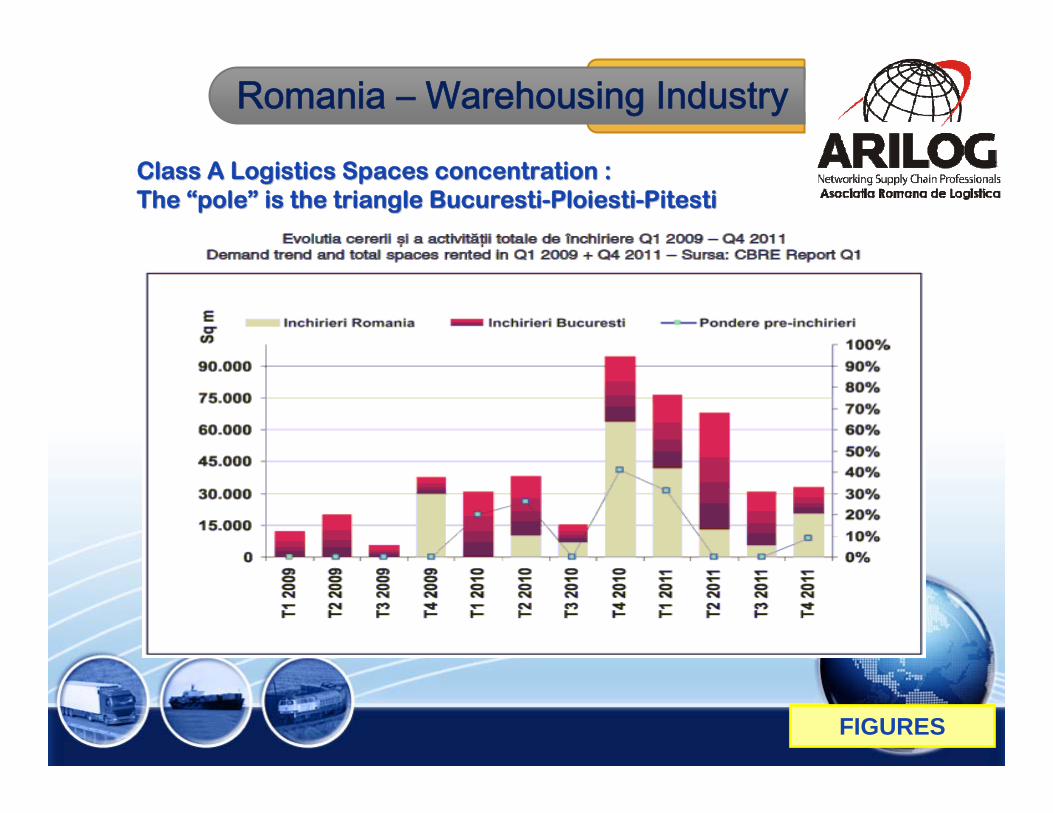
Class A Logistics Class A Logistics Spaces concentration :Spaces concentration :The The ““polepole”” is the triangle Bucurestiis the triangle Bucuresti--PloiestiPloiesti--Pitesti Pitesti
FIGURES
Romania – Warehousing Industry

Class A Logistics Class A Logistics Spaces concentration :Spaces concentration :Renting tariff structureRenting tariff structure
FIGURES
Romania – Warehousing Industry
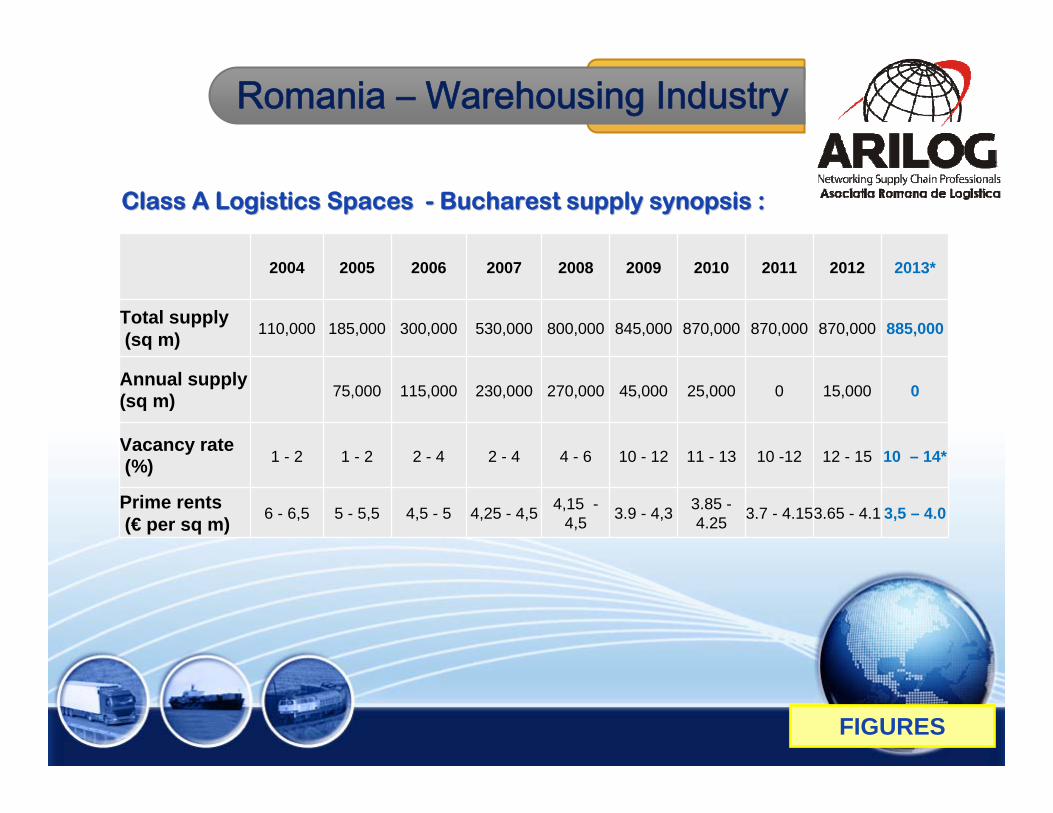
Class A Logistics Class A Logistics Spaces Spaces -- Bucharest supply synopsis :Bucharest supply synopsis :
FIGURES
Romania – Warehousing Industry
2004 2005 2006 2007 2008 2009 2010 2011 2012 2013*
Total supply(sq m) 110,000 185,000 300,000 530,000 800,000 845,000 870,000 870,000 870,000 885,000
Annual supply (sq m) 75,000 115,000 230,000 270,000 45,000 25,000 0 15,000 0
Vacancy rate(%) 1 - 2 1 - 2 2 - 4 2 - 4 4 - 6 10 - 12 11 - 13 10 -12 12 - 15 10 – 14*
Prime rents(€ per sq m) 6 - 6,5 5 - 5,5 4,5 - 5 4,25 - 4,5 4,15 -
4,5 3.9 - 4,3 3.85 -4.25 3.7 - 4.153.65 - 4.1 3,5 – 4.0

Class A Logistics Class A Logistics Spaces Spaces -- Ploiesti supply synopsis :Ploiesti supply synopsis :
FIGURES
Romania – Warehousing Industry
2008 2009 2010 2011 2012 2013*
Total supply (sq m)
25.000 51.000 81.000 116.000 131.000 146.000
Annual supply (sq m)
26.000 30.000 35.000 20.000 15.000 10.000
Vacancy rate (%)
3% 3 - 5% 17% 15% 14% 12%
Prime rents(€ per sq m)
4 - 4,5 3,9 - 4.3 3,8 - 4,15 3,6 - 4,0 3,5- 3,9 3,4 - 3,8

REALITY
Romania – Warehousing Industry
Strong points of Romanian logistics :
• Almost all major European logistics providers have subsidiaries/branches• Modern management driven• State of the art warehousing structure• “Seasoned”(within a harsh logistics environment) and more and more professionalized personnel (we have more and more ELA certified (Junior and Senior Level) SC&Logistics Managers
FACTS
Romania – Warehousing Industry

Romania Distribution Concepts
Due to geographical specifics, most of the companies have chosen the 2 warehouses concept :
- one in Transylvania (Center, W or NW of Romania)
- one in South of Romania
Single warehouse => between 8% and 20% higher distribution costs (depending on warehouse location)
FACTS

LAST STOPQ&A

FACTS
Romania Romania –– ““Hot potatoesHot potatoes””
Corruption in Romania ?
Predictability ?
Taxing ?
YOUR concerns ?
ENDE
Vielen Dank für Ihre Aufmerksamkeit !