Report No: AUS5495 Romania Component C3 of Romania Climate ...
Upload
rigel-craneCategory
view
21download
0description

NATIONAL BANK OF ROMANIANATIONAL BANK OF ROMANIANATIONAL BANK OF ROMANIANATIONAL BANK OF ROMANIA

I. Recent Macroeconomic Developments
Looking Back at 1999
• Economic growth: -1.2%
• Inflation rate: 54.8% (December/December)
• Fiscal deficit: 1.8% of GDP (but quasifiscal deficit larger)
• Current account deficit: 4.0% of GDP
2000-2003:Sustainable Disinflation and Growth
• Gradual disinflation
• Robust economic growth
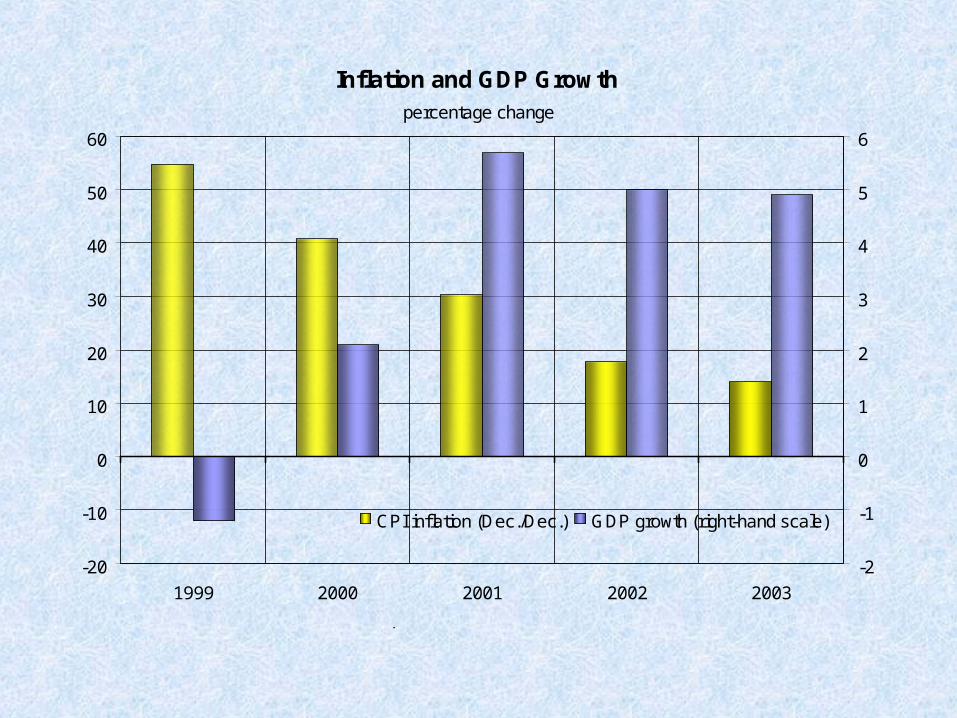
Inflation and GDP Growth
-20
-10
0
10
20
30
40
50
60
1999 2000 2001 2002 2003
percentage change
-2
-1
0
1
2
3
4
5
6
CPI inflation (Dec./Dec.) GDP growth (right-hand scale)
Source: National Institute of Statistics, National Bank of Romania
2000-2003:Sustainable Disinflation and Growth
• Gradual disinflation
• Robust economic growth
• Significant, but sustainable, current account deficits
• Moderate fiscal deficits and low public debt

Fiscal* and Current Account Deficits
0
1
2
3
4
5
6
7
8
1998 1999 2000 2001 2002 2003
Source: Ministry of Public Finance, National Institute of Statistics
fiscal current account
*) adjusted to IMF methodology
percent of GDP
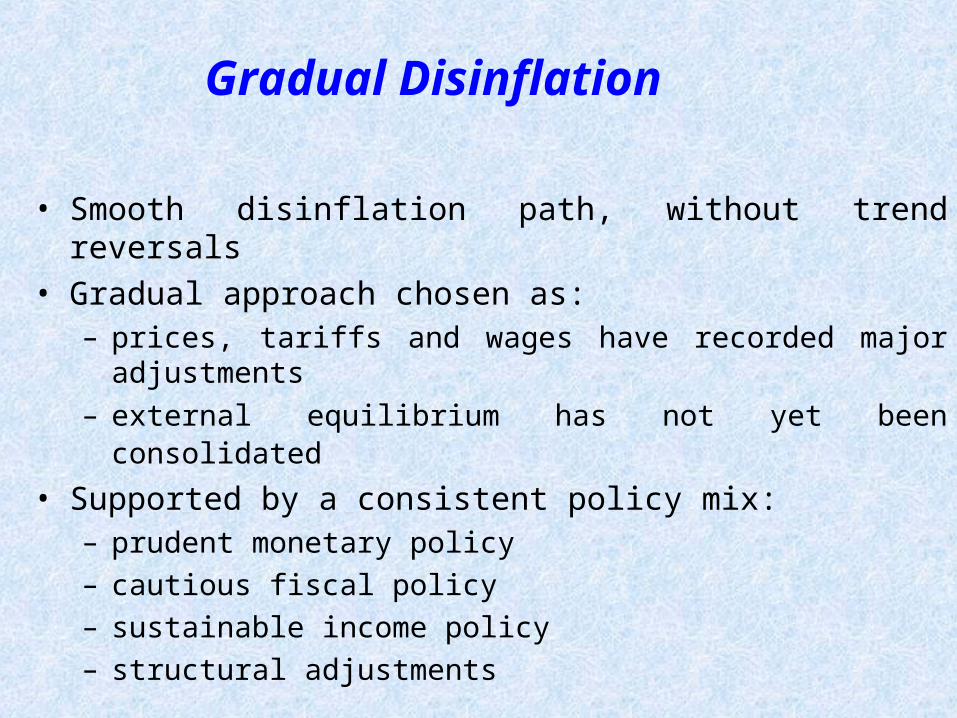
Gradual Disinflation
• Smooth disinflation path, without trend reversals
• Gradual approach chosen as:– prices, tariffs and wages have recorded major adjustments
– external equilibrium has not yet been consolidated
• Supported by a consistent policy mix:– prudent monetary policy
– cautious fiscal policy
– sustainable income policy
– structural adjustments

Robust Economic Growth
• Higher GDP growth rates than in most CEE countries
• Driven initially by external demand and afterwards by domestic demand (on the back of rising wages and loans)
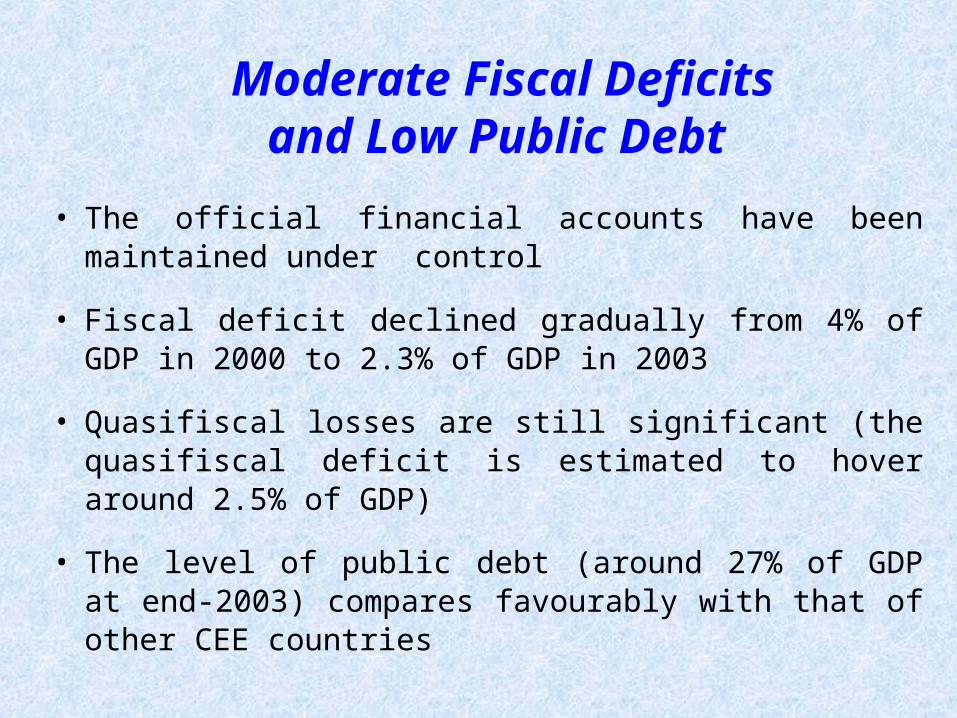
Moderate Fiscal Deficitsand Low Public Debt
• The official financial accounts have been maintained under control
• Fiscal deficit declined gradually from 4% of GDP in 2000 to 2.3% of GDP in 2003
• Quasifiscal losses are still significant (the quasifiscal deficit is estimated to hover around 2.5% of GDP)
• The level of public debt (around 27% of GDP at end-2003) compares favourably with that of other CEE countries
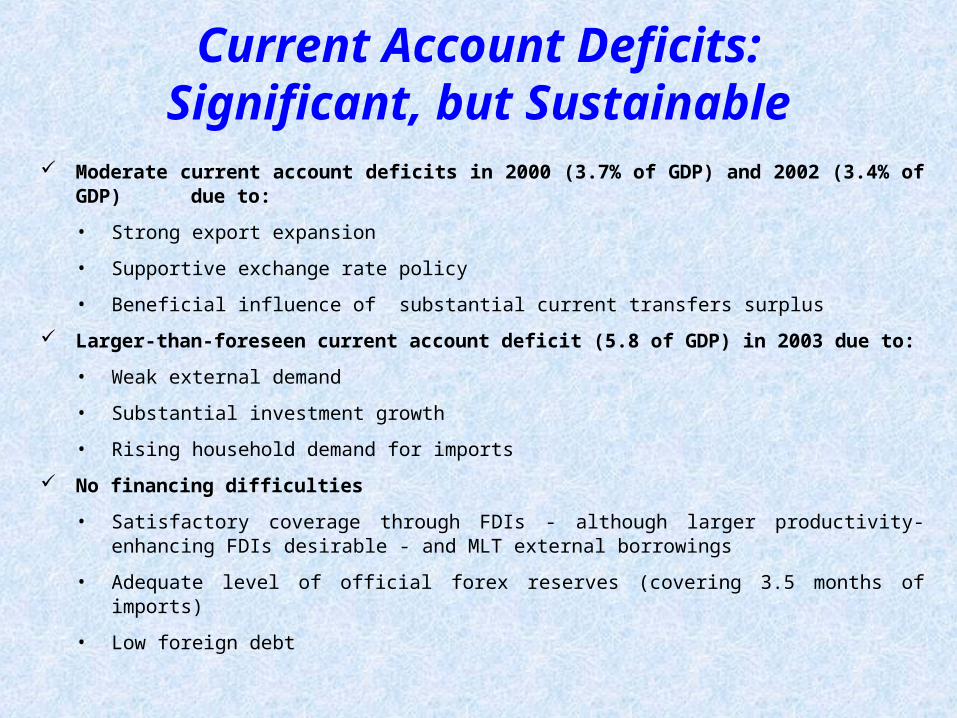
Current Account Deficits:Significant, but Sustainable
Moderate current account deficits in 2000 (3.7% of GDP) and 2002 (3.4% of GDP) due to:
• Strong export expansion
• Supportive exchange rate policy
• Beneficial influence of substantial current transfers surplus
Larger-than-foreseen current account deficit (5.8 of GDP) in 2003 due to:
• Weak external demand
• Substantial investment growth
• Rising household demand for imports
No financing difficulties
• Satisfactory coverage through FDIs - although larger productivity-enhancing FDIs desirable - and MLT external borrowings
• Adequate level of official forex reserves (covering 3.5 months of imports)
• Low foreign debt

Current Account and Foreign Direct Investment2003
-10
-8
-6
-4
-2
0
2
4
6
8
Bulgaria Czech Republic
Hungary Poland Romania Slovakia
percent of GDP
current account deficit/GDP foreign direct investment (net)/GDP
Note: GDP forecast for Hungary and Poland
Source: Websites of central banks, EBRD - Transition Report 2003

Saving and Investment Ratios
9.7
13.814.8
16.7
18.217.7
18.9
20.7
22.5
11.2
17.8
21.3
8
10
12
14
16
18
20
22
24
1998 1999 2000 2001 2002 2003
Source: National Institute of Statistics, NBR calculations
8
10
12
14
16
18
20
22
24saving ratio investment ratio
percent of GDP

Gross Official Reserves
0
1,000
2,000
3,000
4,000
5,000
6,000
7,000
8,000
9,000
1999 2000 2001 2002 2003 2004(6 May)
Source: National Bank of Romania
0
1,000
2,000
3,000
4,000
5,000
6,000
7,000
8,000
9,000
gold NBR foreign-exchange reserves
EUR million
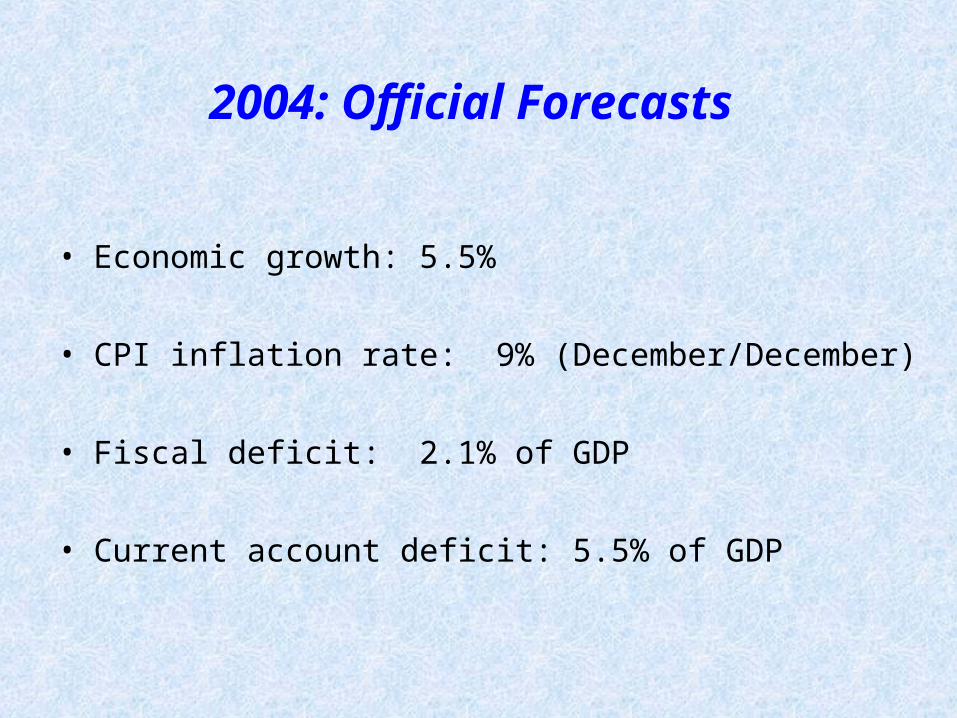
2004: Official Forecasts
• Economic growth: 5.5%
• CPI inflation rate: 9% (December/December)
• Fiscal deficit: 2.1% of GDP
• Current account deficit: 5.5% of GDP

II. Monetary Policy Coordinates
Major Guidelines
• Single-digit inflation rates in 2004 and in the years to come
• Interest rate policy: firm and transparent
• Exchange rate policy: managed floating regime preserved
• Inflation targeting: introduction envisaged for 2005
• Expected timing of euro-area entry: 5-6 years after EU accession

Inflation Rate
54.8
40.7
30.3
17.8
14.1
9.07.0
4.0
1999 2000 2001 2002 2003 2004 2005 2006
Source: National Institute of Statistics, Economic Pre-Accession Programme
CPI; Dec./Dec.
target, 2004 - 2006

Interest rate policy
• The current policy rate is high enough to encourage savings and to smooth credit expansion
• Gradual downward adjustment of the policy rate is envisaged once the disinflation trend has been confirmed
• Interest rate policy gains in transparency

Inflation Rate and Interest Rates
5
15
25
35
45
55Ja
n.0
1
Jul.0
1
Jan
.02
Jul.0
2
Jan
.03
Jul.0
3
Jan
.04
Source: National Institute of Statistics, National Bank of Romania
percent
inflation rate (percentage change againstsame year-earlier period)NBR interest rate on sterilisation operations(percent p.a.)average yield on 3M T-bills (percent p.a.)
NBR's policy rate increased to 21.25% on November 20, 2003.
5
15
25
35
45
55
Jan
.01
Jul.0
1
Jan
.02
Jul.0
2
Jan
.03
Jul.0
3
Jan
.04
percent
inflation rate (percentage change againstsame year-earlier period)average interest rate on ROL loans of non-gov't, non-bank clients (percent p.a.)
deposit rate (time deposits; percent p.a.)

Financial Intermediation and Remonetisation of the Economy
28.930.2
31.6 32.6
9.3 10.111.8
16.0
24.7 24.423.0 23.2
0
5
10
15
20
25
30
35
40
45
2000 2001 2002 2003
Source: National Institute of Statistics, National Bank of Romania
bank assets non-government credit M2
end of period, share of GDP
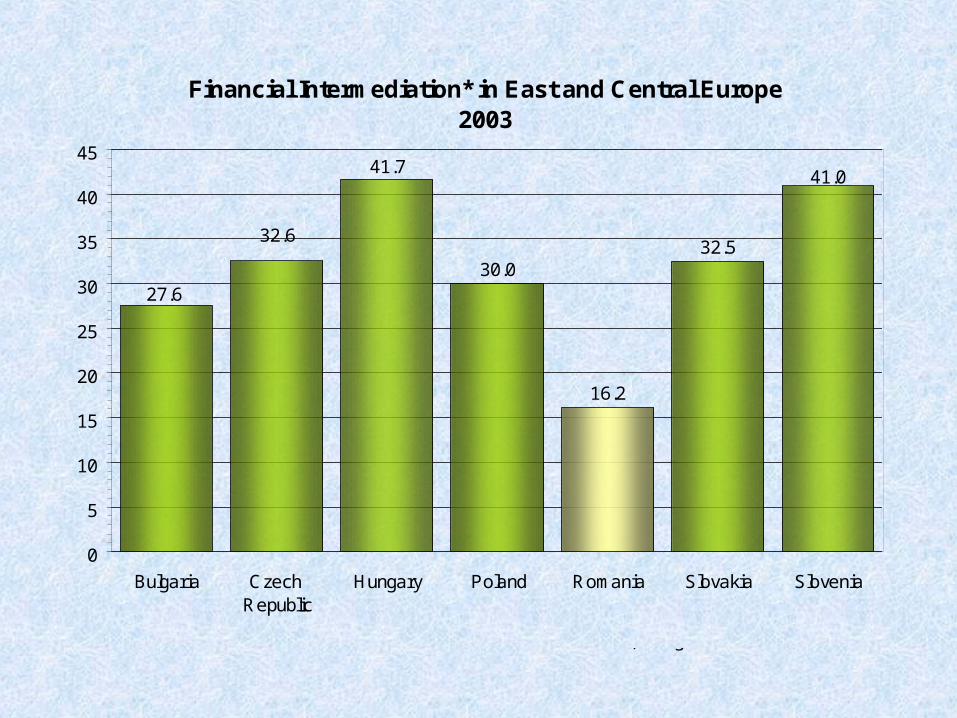
Financial Intermediation* in East and Central Europe2003
30.0
16.2
32.5
27.6
41.041.7
32.6
0
5
10
15
20
25
30
35
40
45
Bulgaria Czech Republic
Hungary Poland Romania Slovakia Slovenia
Source: Websites of national statistics institutions and central banks. *) non-government credit/GDP

Exchange rate policy
• The managed floating regime avoids excessive rate fluctuations
• Central bank foreign interventions tend to be less frequent and ample
• Euro link gets tighter – the current composition of the currency basket is EUR 75% - USD 25%
• The preferred range of real exchange rate appreciation (2-4 percent) supports disinflation without endangering external competitiveness
• The real appreciation generated by the Balassa-Samuelson effect is not counteracted through exchange rate policy

Average Real Exchange Rate of the ROL Against the Currency Basket
0
1
2
3
4
5
6
7
2001 2002 2003 2004
0
1
2
3
4
5
6
7
Source: National Bank of Romania, National Institute of Statistics (NBR calculations)
achieved
indicativerange
percentage change versus a year ago
achieved4 months
Inflation targeting
• The monetary policy regime switch envisaged for 2005 (after enhancing central bank credibility and inflation forecast capability)
• Increased transparency and accountability: Inflation Reports already published (semiannual frequency)
• Monetary policy firmly committed to pursue the inflation targets and relieved of supporting conflicting macroeconomic objectives
• Higher exchange rate flexibility (decreasing role of exchange rate as BoP adjustor)
• Harmonization of monetary and fiscal policies (fiscal dominance on the wane)
• Sound banking sector (but not yet fully-fledged financial system)
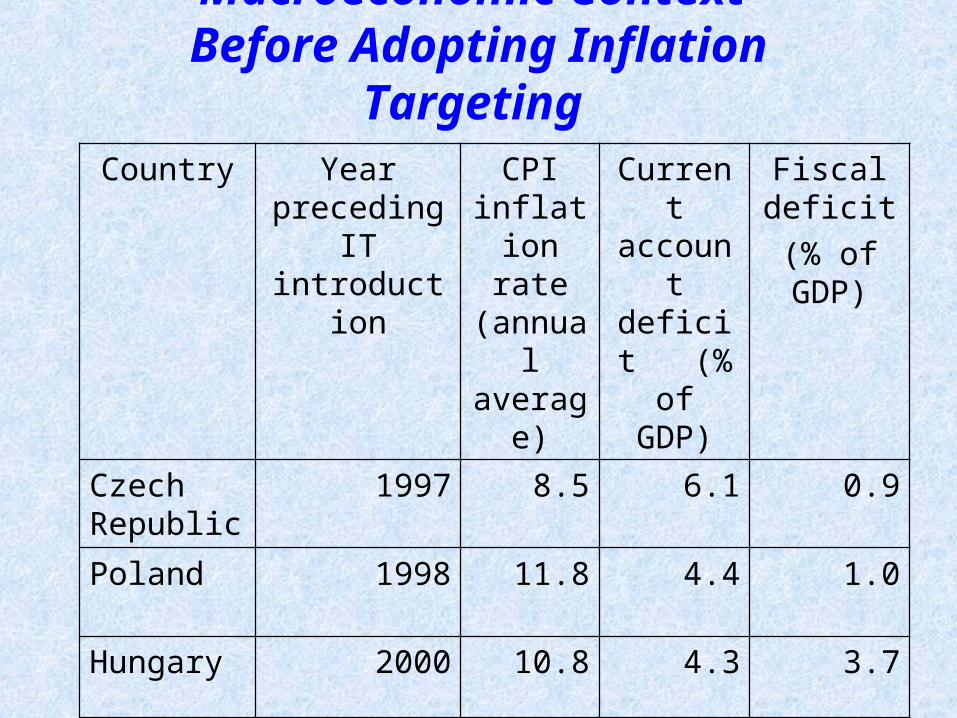
Macroeconomic Context Before Adopting Inflation Targeting Country Year
preceding IT introduction
CPI inflation
rate (annual average)
Current account deficit (% of GDP)
Fiscal deficit
(% of GDP)
Czech Republic
1997 8.5 6.1 0.9
Poland 1998 11.8 4.4 1.0
Hungary 2000 10.8 4.3 3.7
Romania (forecasts)
2004 9.0 5.5 2.1

The road towards euro-area
• Sped-up nominal convergence, but without hurting the process of real convergence
2000 2001 2002 2003e 2000 2001 2002 2003e
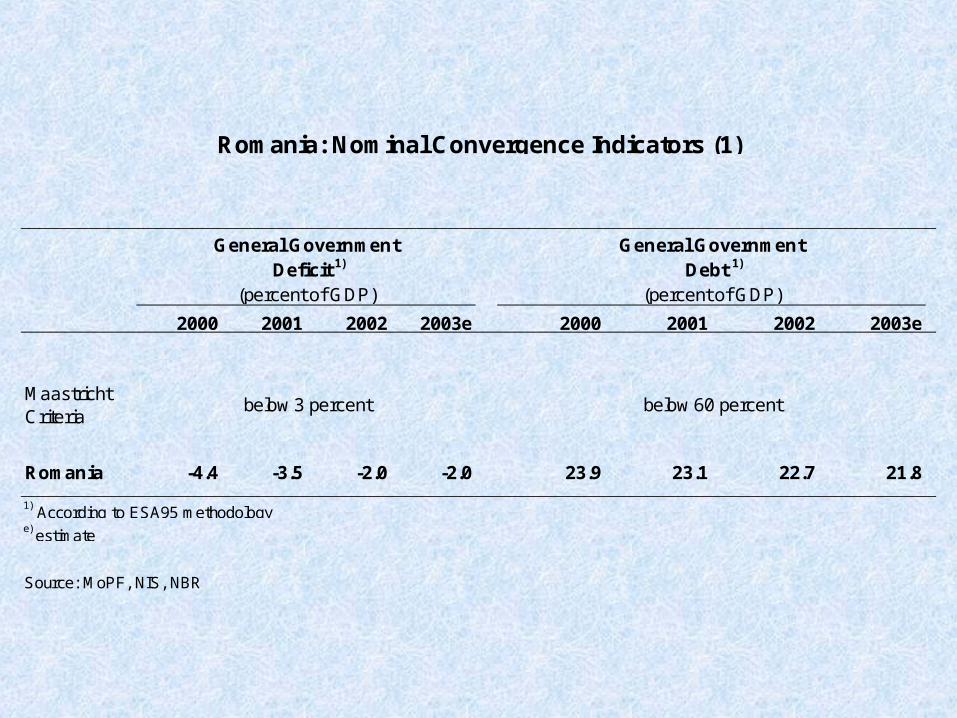
Maastricht Criteria
Romania -4.4 -3.5 -2.0 -2.0 23.9 23.1 22.7 21.8
1) According to ESA95 methodologye) estimate
Source: MoPF, NIS, NBR
Romania: Nominal Convergence Indicators (1)
General Government
(percent of GDP)
General Government
(percent of GDP) Debt 1) Deficit 1)
below 3 percent below 60 percent

2000 2001 2002 2003 2000 2001 2002 2003 2000 2001 2002 2003
Maastricht Criteria
Romania 45.7 34.5 22.5 15.3 x x x x -18.3 -23.3 -16.7 -16.8
x = data not released
Source: NBR
(average)
<1.5 pp above the best performing three EU members
Romania: Nominal Convergence Indicators (2)
Exchange Rate (vs. euro)
(annual percentage change)
Long-term Interest Rates
(percent per annum)
Inflation rate
<2 pp above the best performing three EU members
+ / -15 percent
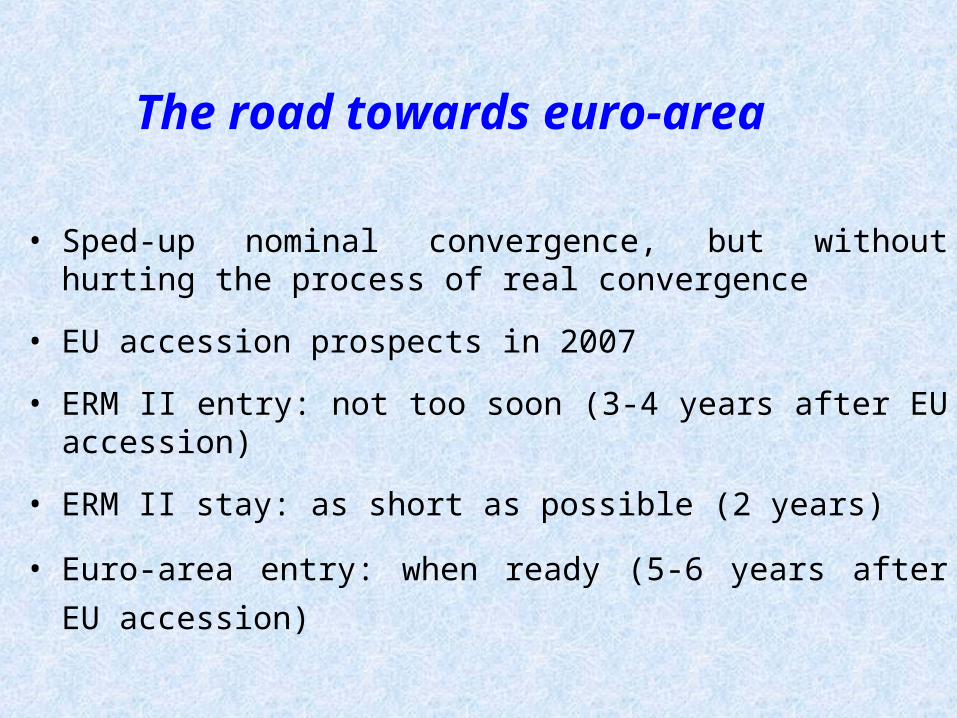
The road towards euro-area
• Sped-up nominal convergence, but without hurting the process of real convergence
• EU accession prospects in 2007
• ERM II entry: not too soon (3-4 years after EU accession)
• ERM II stay: as short as possible (2 years)
• Euro-area entry: when ready (5-6 years after EU accession)


![9TH WUKF EUROPEAN CHAMPIONSHIPS FOR ALL AGES [ 76 ]...(1183) naznean razvan frkwukf- romania ( romania) (1068) iorgulescu stefan frkwukf- romania ( romania) (1378) urs luciamn andrei](https://static.fdocuments.us/doc/165x107/6113116fc105242fef77af65/9th-wukf-european-championships-for-all-ages-76-1183-naznean-razvan-frkwukf-.jpg)