
Roman Orlik, IATA draft... · · 2017-11-22AIRLINE INDUSTRY: GLOBAL AND REGIONAL VIEW Roman...
25
ECONOMIC PERFORMANCE OF THE AIRLINE INDUSTRY: GLOBAL AND REGIONAL VIEW Roman Orlik, IATA November 17 INAIR 2017 Prague 1
-
Upload
nguyenduong -
Category
Documents
-
view
223 -
download
3
Transcript of Roman Orlik, IATA draft... · · 2017-11-22AIRLINE INDUSTRY: GLOBAL AND REGIONAL VIEW Roman...

ECONOMIC PERFORMANCE OF THE AIRLINE INDUSTRY: GLOBAL AND
REGIONAL VIEW
Roman Orlik, IATA
November 17INAIR 2017 Prague 1
IATA 20 year passenger forecast:
7,200,000,000
November 17INAIR 2017 Prague 2

Aviation’s center of gravity is shifting eastwards
November 17INAIR 2017 Prague 3
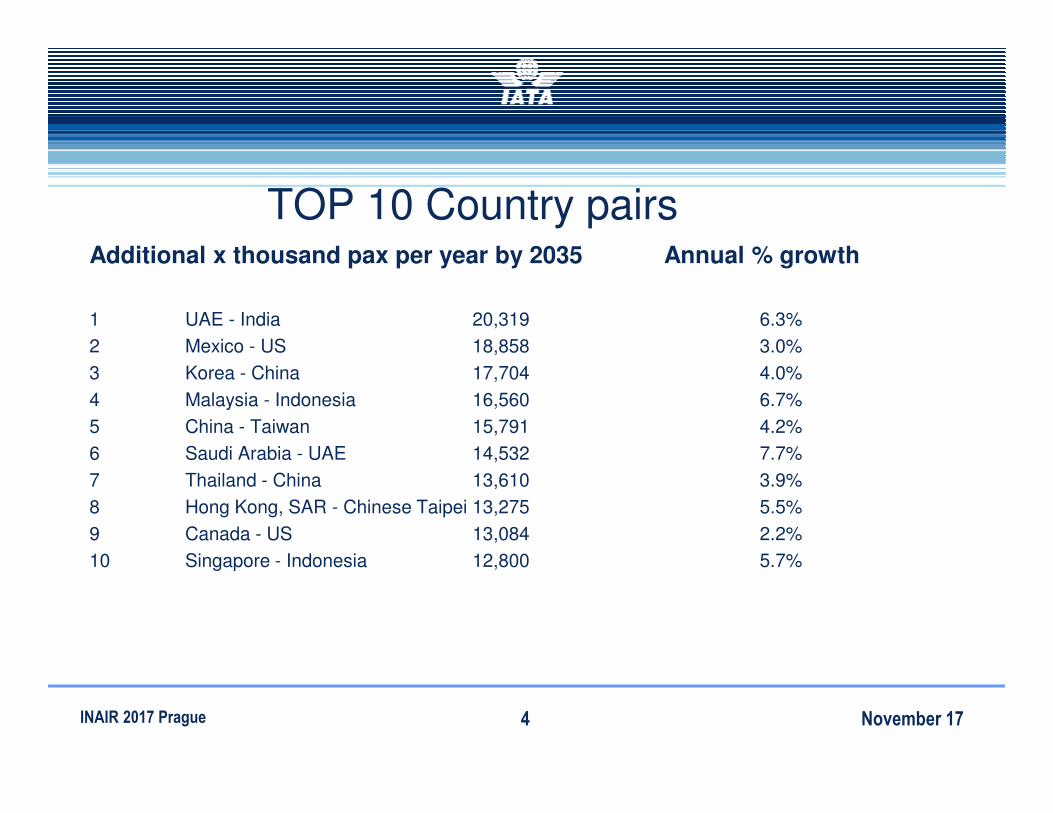
TOP 10 Country pairs Additional x thousand pax per year by 2035 Annual % growth
1 UAE - India 20,319 6.3%
2 Mexico - US 18,858 3.0%
3 Korea - China 17,704 4.0%
4 Malaysia - Indonesia 16,560 6.7%
5 China - Taiwan 15,791 4.2%
6 Saudi Arabia - UAE 14,532 7.7%
7 Thailand - China 13,610 3.9%
8 Hong Kong, SAR - Chinese Taipei 13,275 5.5%
9 Canada - US 13,084 2.2%
10 Singapore - Indonesia 12,800 5.7%
November 17INAIR 2017 Prague 4

Long-run outlook for air passenger demand
November 17INAIR 2017 Prague 5

Air passengers volumes ( RPK)
November 17INAIR 2017 Prague 6
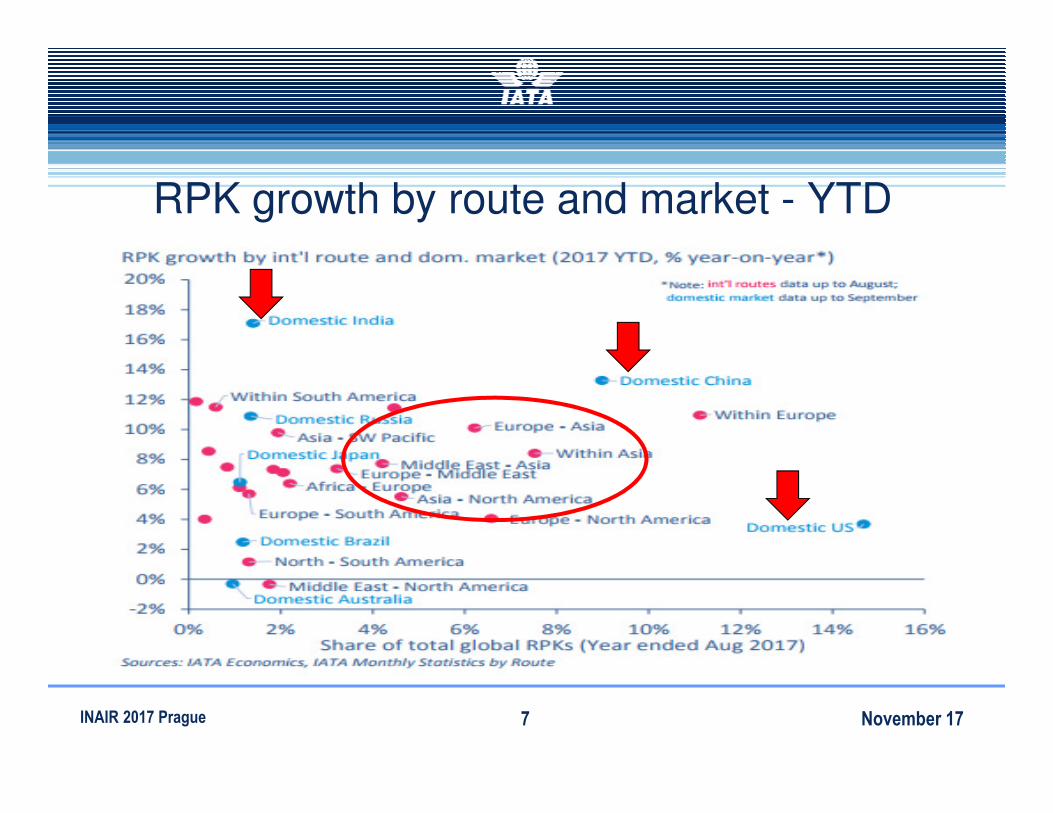
RPK growth by route and market - YTD
November 17INAIR 2017 Prague 7

The changing face of air pax demand
November 17INAIR 2017 Prague 8
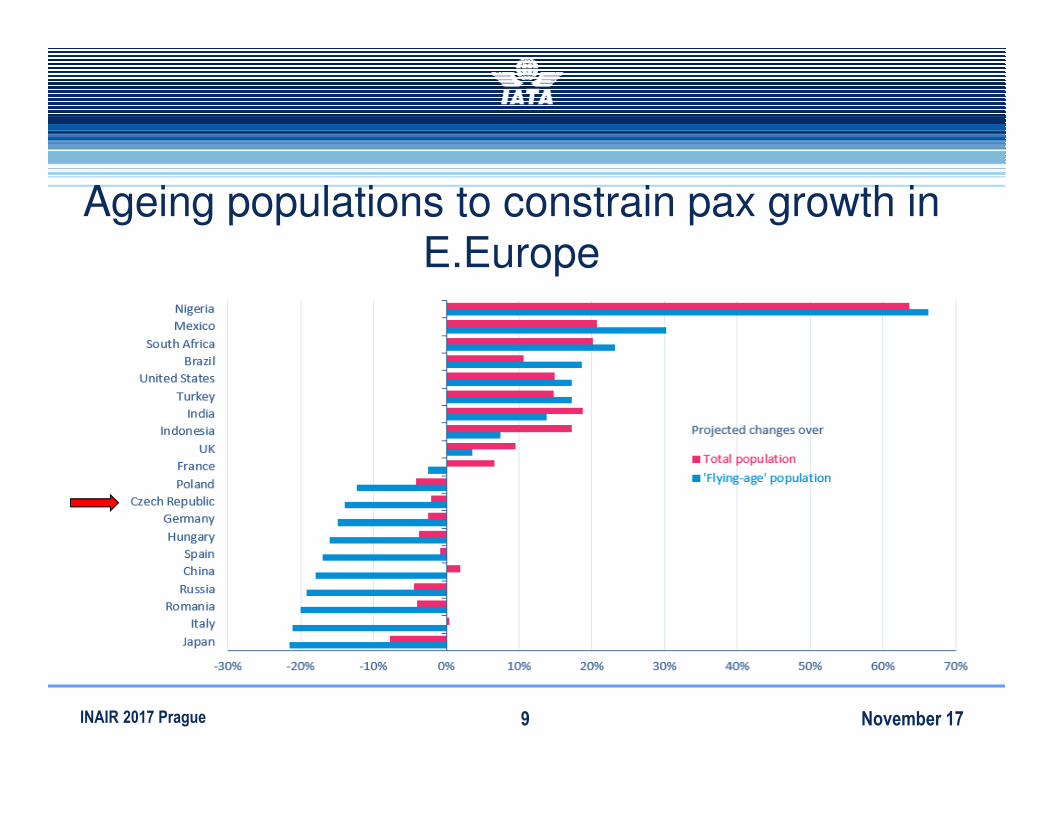
Ageing populations to constrain pax growth in E.Europe
November 17INAIR 2017 Prague 9
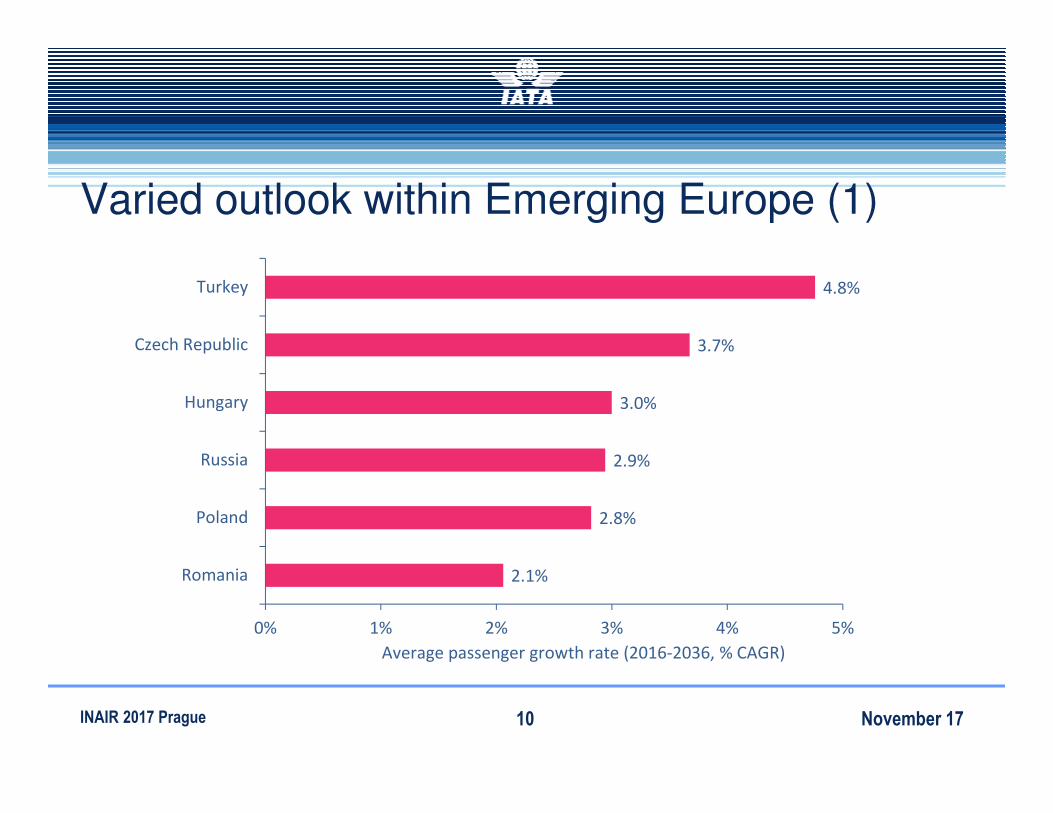
Varied outlook within Emerging Europe (1)
November 17INAIR 2017 Prague 10
4.8%
3.7%
3.0%
2.9%
2.8%
2.1%
0% 1% 2% 3% 4% 5%
Turkey
Czech Republic
Hungary
Russia
Poland
Romania
Average passenger growth rate (2016-2036, % CAGR)
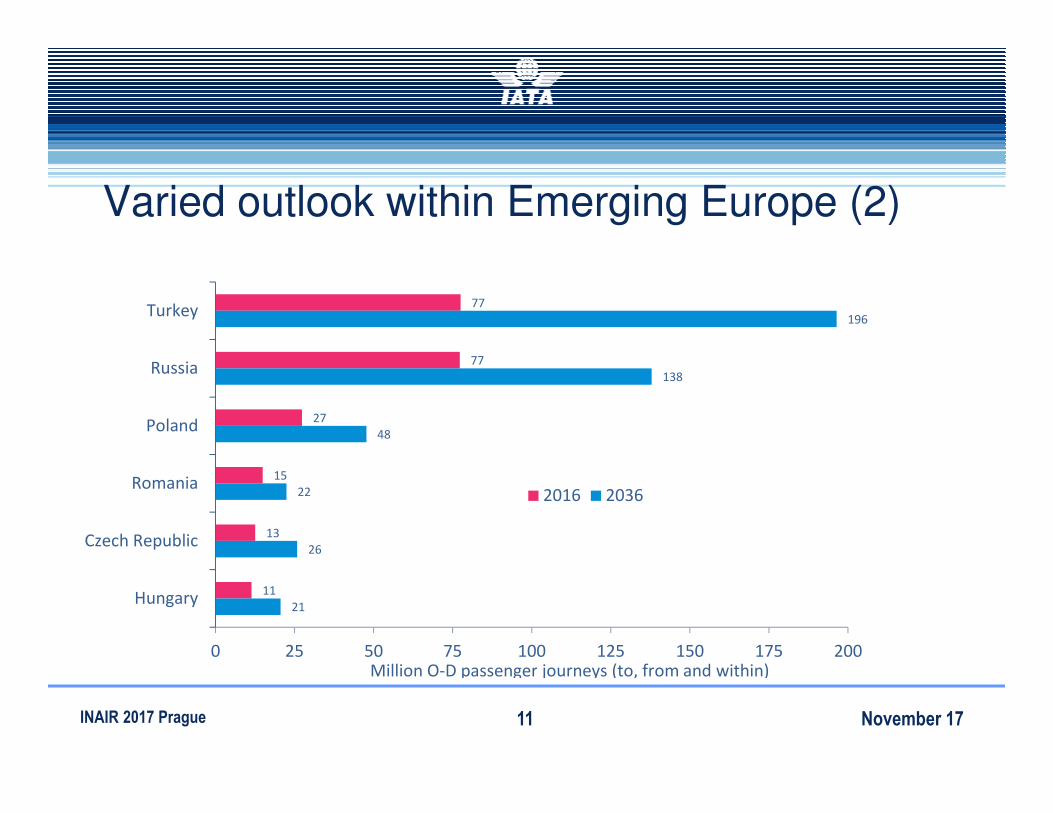
Varied outlook within Emerging Europe (2)
November 17INAIR 2017 Prague 11
77
77
27
15
13
11
196
138
48
22
26
21
0 25 50 75 100 125 150 175 200
Turkey
Russia
Poland
Romania
Czech Republic
Hungary
2016 2036
Million O-D passenger journeys (to, from and within)

Aviation impact on economy� Direct: the output and employment of the firms in the aviation sector.
� Indirect: the output and employment supported through the aviation sector‟s Czech based supply
� Induced: employment and output supported by the spending of those directly or indirectly employed in the aviation sector
� Catalytic: spillover benefits associated with the aviation sector.
Connectivity as the key factor to economic performance
November 17INAIR 2017 Prague 12

Airport issues
November 17INAIR 2017 Prague 13
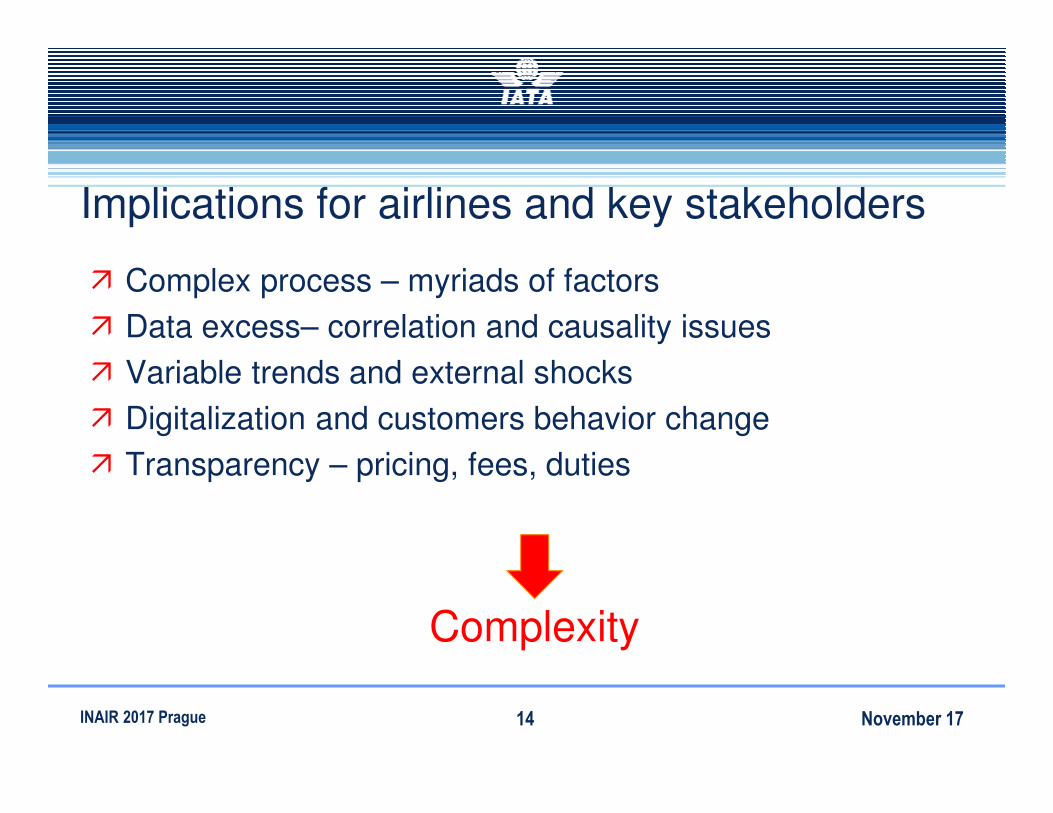
Implications for airlines and key stakeholders
� Complex process – myriads of factors
� Data excess– correlation and causality issues
� Variable trends and external shocks
� Digitalization and customers behavior change
� Transparency – pricing, fees, duties
Complexity
November 17INAIR 2017 Prague 14

Areas revenue management must consider
� Data collection and analysis
� Protection, forecast and optimization process
� KPI set up and forecast validation ( SLF on highest levels: above 80% except Africa)
� Revenue management vs commercial view paradigm– Human machines
� Market segmentation
� Distribution channels efficiency
November 17INAIR 2017 Prague 15
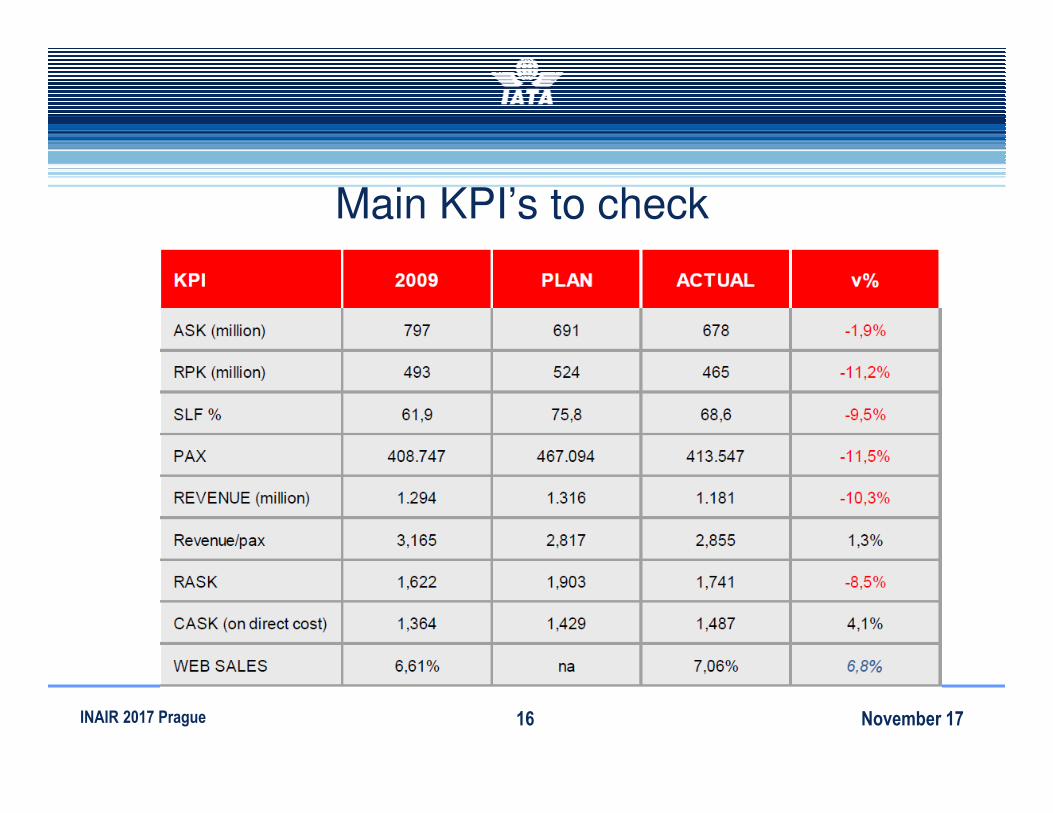
Main KPI’s to check
November 17INAIR 2017 Prague 16

Example: RASK analysis on PRG-MAD
November 17INAIR 2017 Prague 17
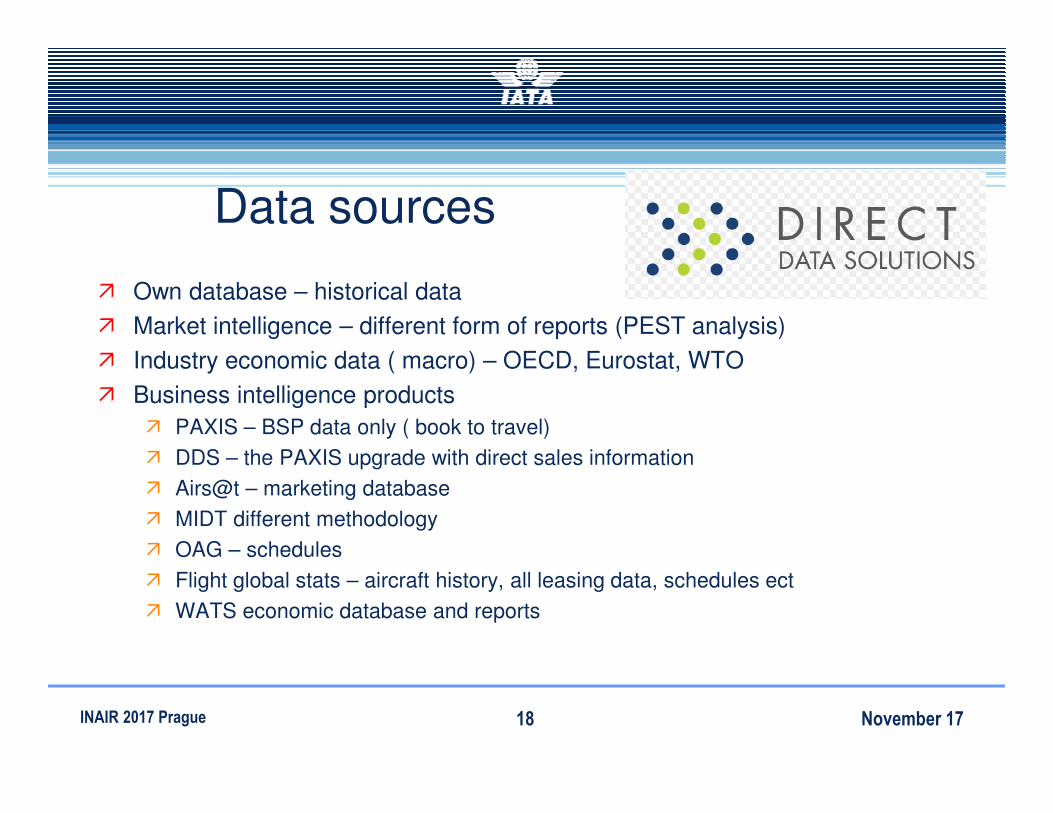
Data sources
� Own database – historical data
� Market intelligence – different form of reports (PEST analysis)
� Industry economic data ( macro) – OECD, Eurostat, WTO
� Business intelligence products
� PAXIS – BSP data only ( book to travel)
� DDS – the PAXIS upgrade with direct sales information
� Airs@t – marketing database
� MIDT different methodology
� OAG – schedules
� Flight global stats – aircraft history, all leasing data, schedules ect
� WATS economic database and reports
November 17INAIR 2017 Prague 18
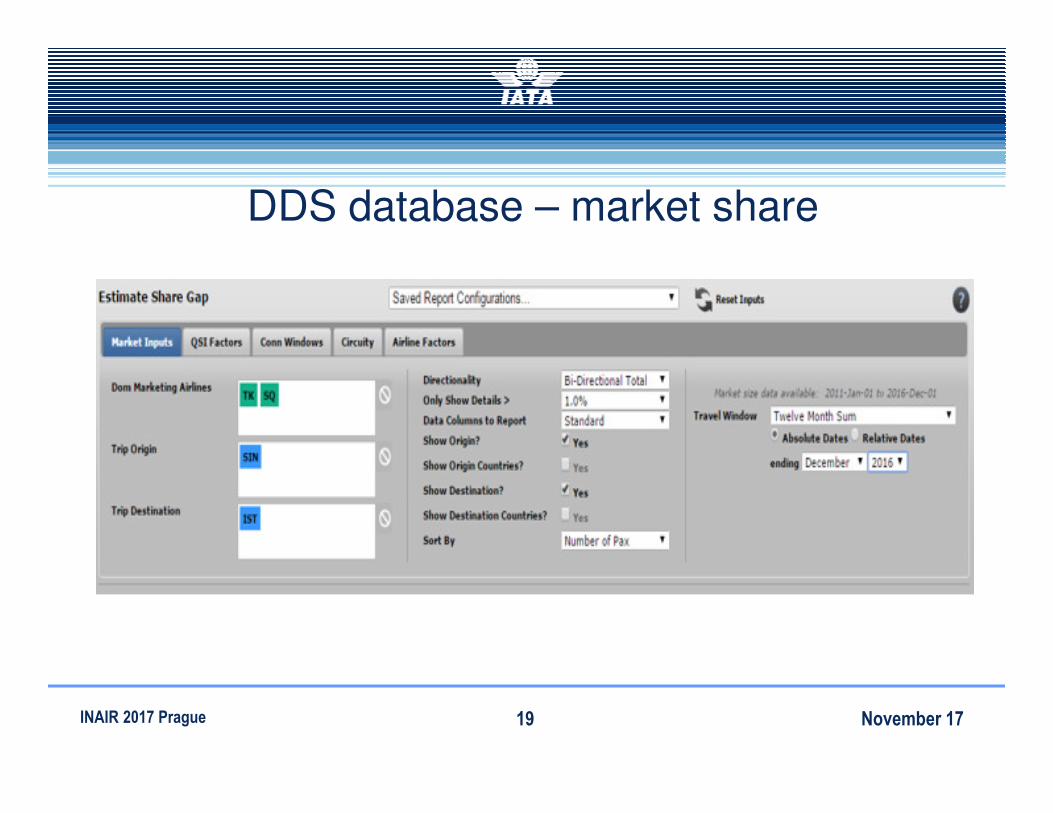
DDS database – market share
November 17INAIR 2017 Prague 19

Revenue and Traffic Analysis
November 17INAIR 2017 Prague 20

Sales curve – days to departure
November 17INAIR 2017 Prague 21
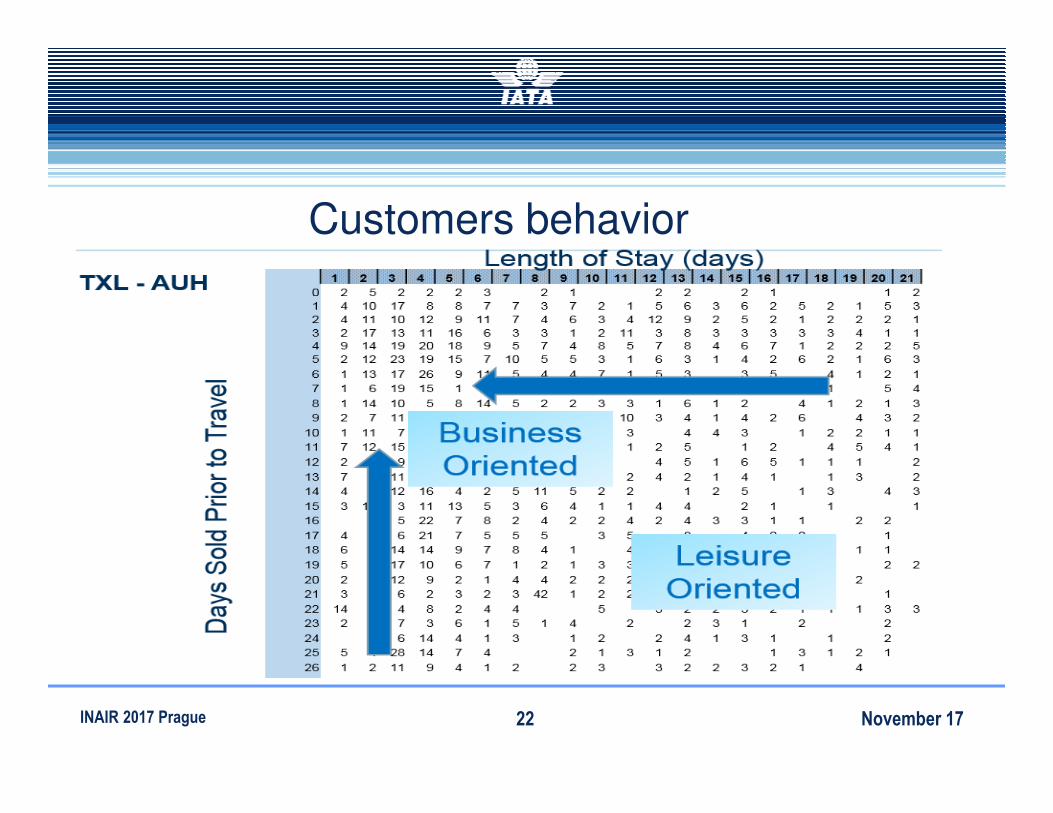
Customers behavior
November 17INAIR 2017 Prague 22
Customers – what they want and how to keep them loyal
� Ticket price – 45% weight in Africa, 30% in Asia, where schedule seems
to be more important
� No surprise that for 46% leisure pax the price is critical compared to
28% for C-class pax, who, naturally, prefer the schedule and
punctuality.
� Gender split: price - ( 43% women vs 34% men), schedule ( women
13% vs 17% men)
� Airs@t respondents age: the older pax are the less price sensitive ( 47%
for 18-24 years old vs 30% 55-64 category) and more comfort
demanding they appear to be ( 13% vs 24% ).
� And what is the least important?.
November 17INAIR 2017 Prague 23

Technology adoption and innovations� Self service - Booking process & NDC
� Fast travel program
� Baggage RFID – full control of your baggage
� Big data – pros&cons
� Mobile services
� Biometrics
� Face recognition
� Flight updates
� Digital concierge
November 17INAIR 2017 Prague 24