Rolling Up Canadian ESL - June 26, 2013 - Loyalist Group
22
Copyright © 2012 Center for Farm Financial Management, University of Minnesota Bob Craven University of Minnesota rcraven@umn Shortcuts to Accrual Dale Nordquist Center for Farm Financial Management [email protected] 612-625-6760 Copyright © 2012 Center for Farm Financial Management, University of Minnesota Tools for Credit Analysis • In a perfect world – Financial Soundness • Balance sheets with cost and market values – Financial Performance • Accrual income statement 1
Transcript of Rolling Up Canadian ESL - June 26, 2013 - Loyalist Group

Copyright © 2012 Center for Farm Financial Management, University of Minnesota
Bob Craven
University of Minnesota
rcraven@umn
Shortcuts to Accrual
Dale NordquistCenter for Farm Financial [email protected]
Copyright © 2012 Center for Farm Financial Management, University of Minnesota
Tools for Credit Analysis
• In a perfect world– Financial Soundness
• Balance sheets with cost and market values
– Financial Performance• Accrual income statement
1

Copyright © 2012 Center for Farm Financial Management, University of Minnesota
Tools for Credit Analysis
• In the real world– Financial Soundness
• Market value balance sheets
– Financial Performance• Schedule F tax statement
– How can we measure financial performance in the real world?
Copyright © 2012 Center for Farm Financial Management, University of Minnesota
Tax Forms/Income Statement
• Balance sheets
• Schedule F database
2

Copyright © 2012 Center for Farm Financial Management, University of Minnesota
Balance Sheets
• Problems with Ag Balance Sheets
– Market valuation
– Whenever…
Copyright © 2012 Center for Farm Financial Management, University of Minnesota
Income Statement
• Problems with Schedule F
– Cash based
– Tax rules that distort income
– Fast depreciation
3

Copyright © 2012 Center for Farm Financial Management, University of Minnesota
Balance Sheet
• A snapshot of the assets and liabilities of a business at specific point in time– Assets
• Everything owned or payable to the business
– Liabilities• All obligations owed
– Owners Equity/Net Worth• Total assets minus
total liabilities
Copyright © 2012 Center for Farm Financial Management, University of Minnesota
Balance Sheet Analysis
• Current position
• Financial structure
• Total solvency
• Net worth change
4

Copyright © 2012 Center for Farm Financial Management, University of Minnesota
Balance Sheets
• Market value balance sheets provide:– Solvency– Collateral analysis– Loan to value
• What’s missing?– Reliable measure of performance– Earned net worth change
Balance Sheet ChallengeAsset Valuation
• Market Valuation– Capital assets valued at
estimated fair market value
• Cost Valuation– Capital assets valued at
depreciated value
5

Balance Sheet ChallengeAsset Valuation
• Market Valuation– Market estimates supplied
by borrower
• Cost Valuation– Base values used for
credit analysis
Copyright © 2012 Center for Farm Financial Management, University of Minnesota
Cost or Base Value Balance Sheets
Net worth change=
Change in retained earnings=
Earned net worth change
6

Copyright © 2012 Center for Farm Financial Management, University of Minnesota
Copy Market Values to Cost
Copyright © 2012 Center for Farm Financial Management, University of Minnesota
Income Statement
• Problems with Schedule F
– Cash based
– Tax rules that distort income
– Fast depreciation
7

Copyright © 2012 Center for Farm Financial Management, University of Minnesota
Sch F vs. Accrual Net Income% difference for years averaged
Years Averaged All farms 20-40% in debt >40% in debt
2002-04 67% 56% 60%
2003-05 41% 56% 61%
2004-06 63% 57% 63%
5-Year
2002-06 66% 55% 60%
Source: Barnard, F. L., Ellinger, P. N., & Wilson, C. (2010). Measurement Issues in Assessing Profitability through Cash Tax Returns. Journal of American Society of Farm Managers and Rural Appraisers, 2010(1), 207-217.
Copyright © 2012 Center for Farm Financial Management, University of Minnesota
Accrual Adjusted Income Statement
Jones Farm
Gross income $500,000
Cash expenses -450,000
Net cash income 50,000
Inventory change +100,000
Depreciation -40,000
Net farm income 110,000
Smith Farm
Gross income $500,000
Cash expenses -450,000
Net cash income 50,000
Inventory change -100,000
Depreciation -40,000
Net farm income -90,000
8

Copyright © 2012 Center for Farm Financial Management, University of Minnesota
Accrual Adjusted Income Statement
BeginningBalanceSheet
FarmRecords
EndingBalanceSheet
Copyright © 2012 Center for Farm Financial Management, University of Minnesota
• Reflects the value of everything produced during the year
• Reflects the cost incurred to produce it
Accrual Adjusted Income Statement
9

FINPACK Financial Analysis Tools
Copyright © 2012 Center for Farm Financial Management, University of Minnesota
FINAN vs. Schedule F Accrual Analysis
• What do you lose if you choose Schd F – Income sources
– Prices received
– Crop yields
– Livestock efficiencies
– Potentially some accuracy
20 data points
10

Copyright © 2012 Center for Farm Financial Management, University of Minnesota
Copyright © 2012 Center for Farm Financial Management, University of Minnesota
• A cruel thing happened on the way to the Farm Financial Standards
• 16 of the 21 measures require accrual Net Farm Income
Accrual Adjusted Income Statement
11

Copyright © 2012 Center for Farm Financial Management, University of Minnesota
• Can you accurately evaluate debt coverage with cash based information?
Accrual Adjusted Income Statement
Copyright © 2012 Center for Farm Financial Management, University of Minnesota
• Accrual vs. cash based debt coverage
– Last 5 years, accrual has been better generally been better than cash
– 2013 – will the chickens come home to roost
Accrual Adjusted Income Statement
12

• Requires fiscal year end balance sheets– Minimize within year
cyclical changes
– Measure net worth
change over a set time-frame
– Ability to measure
profitability
– Accounting discipline
Accrual Adjusted Income Statement
Copyright © 2012 Center for Farm Financial Management, University of Minnesota
How can we help you get fiscal year end balance sheets?
• FINPACK Lite
• Personal version of FINPACK $149
(.01468% of average gross farm income)
• Import from FBM
• Send out the Balance Sheet Worksheet
13
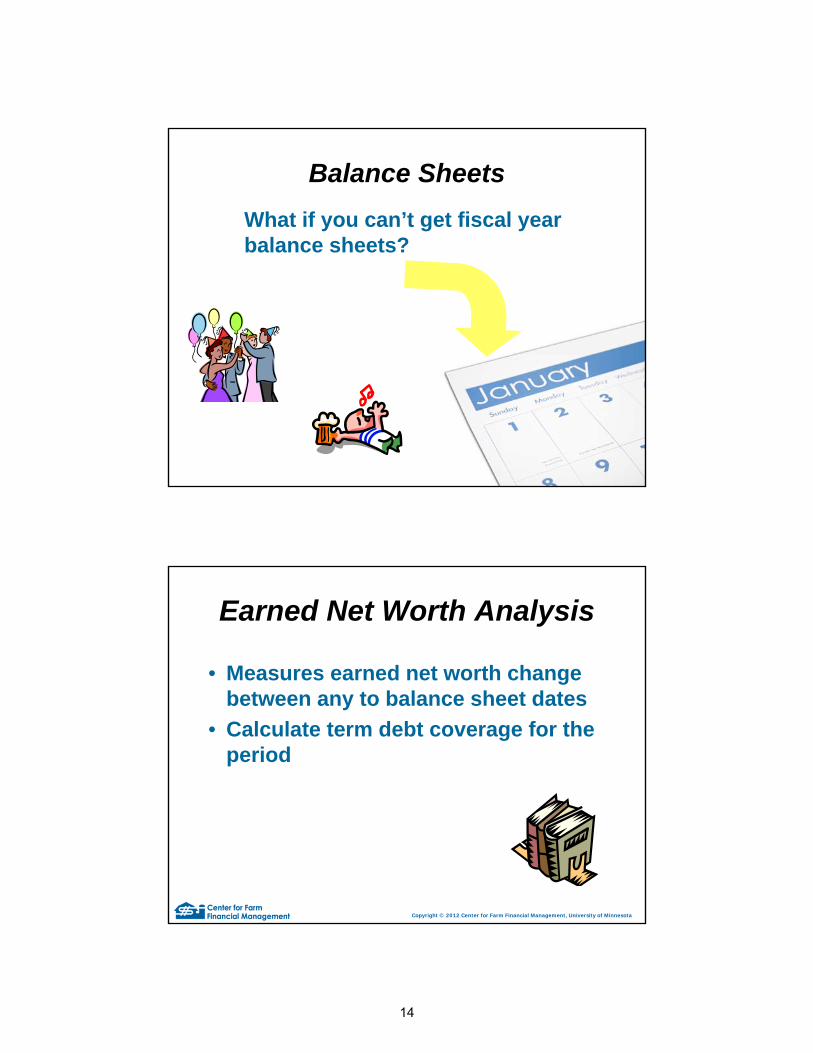
Balance Sheets
What if you can’t get fiscal year balance sheets?
Copyright © 2012 Center for Farm Financial Management, University of Minnesota
• Measures earned net worth change between any to balance sheet dates
• Calculate term debt coverage for the period
Earned Net Worth Analysis
14

Copyright © 2012 Center for Farm Financial Management, University of Minnesota
Statement of Owner’s Equity
Commercial BusinessBeginning shareholder’s equity
+ Net income after taxes (income statement)
- Dividends
= Ending shareholder’s equity
Retained earnings = Earned net worth change
Copyright © 2012 Center for Farm Financial Management, University of Minnesota
Farm BusinessBeginning net worth
+ Net farm income (accrual)
+ Non-farm income
- Owner withdrawals/family living
- Income taxes
+/- Valuation changes
= Ending net worth
Statement of Owner’s Equity
Retained earnings = Earned net worth change
15

Copyright © 2012 Center for Farm Financial Management, University of Minnesota
Farm BusinessEnding net worth
- Beginning net worth
= Net worth change
Earned Net Worth Change
Copyright © 2012 Center for Farm Financial Management, University of Minnesota
Farm BusinessEnding net worth
- Beginning net worth
= Net worth change
- Valuation changes
= Earned net worth change
Earned Net Worth Change
Net farm income
+ Non-farm income
- Owner withdrawals (family living)
- Income taxes
16

Copyright © 2012 Center for Farm Financial Management, University of Minnesota
• Not just land
• Machinery and buildings – if depreciation isn’t realistic, valuation changes creep in
• Use of inconsistent depreciation methods may distort the signals
Valuation Changes
Copyright © 2012 Center for Farm Financial Management, University of Minnesota
Depreciation Is Real
Southern Minnesota Crop Farms 2003 - 2012
Mach & building purchases $84,577
Mach & building sales 6,533
Net purchases $78,054
Source: FINBIN (www.finbin.umn.edu)
17
Copyright © 2012 Center for Farm Financial Management, University of Minnesota
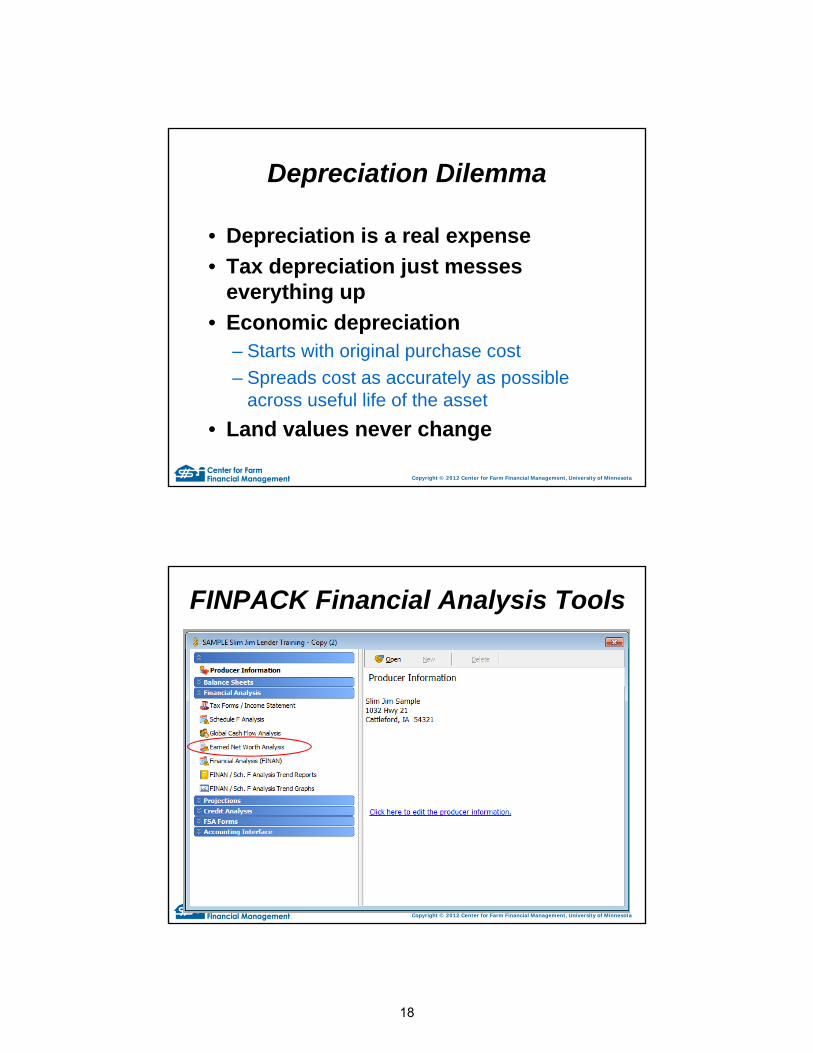
Depreciation Dilemma
• Depreciation is a real expense
• Tax depreciation just messes everything up
• Economic depreciation– Starts with original purchase cost
– Spreads cost as accurately as possible across useful life of the asset
• Land values never change
Copyright © 2012 Center for Farm Financial Management, University of Minnesota
FINPACK Financial Analysis Tools
18

11 data entry points
Copyright © 2012 Center for Farm Financial Management, University of Minnesota
19

Copyright © 2012 Center for Farm Financial Management, University of Minnesota
Copyright © 2012 Center for Farm Financial Management, University of Minnesota
20

Copyright © 2012 Center for Farm Financial Management, University of Minnesota
Term Debt Coverage Ratio
Net farm income (accrual)
+ Non-farm income
- Owner withdrawals/family living
- Income taxes
+ Depreciation
+ Interest on term debt
= Capital debt repayment capacity
÷ Scheduled term debt payments
= Earned net worth change
Copyright © 2012 Center for Farm Financial Management, University of Minnesota
Debt Coverage in ENWA
Earned net worth change
+ Depreciation
+ Interest on term debt
= Capital debt repayment capacity
÷ Scheduled term debt payments
21

Copyright © 2012 Center for Farm Financial Management, University of Minnesota
Shortcuts to Accrual
• Can you get fiscal year end balance sheets?– Yes
• Accrual financial analysis
• Scheduled F Accrual Analysis
• FINAN
– No• Earned Net Worth Analysis
22