ROLE OF THE NEUROTROPHIC FACTOR RECEPTOR IN...
134
Universidade de Lisboa Faculdade de Medicina de Lisboa ROLE OF THE NEUROTROPHIC FACTOR RECEPTOR RET IN HAEMATOPOIESIS Diogo da Fonseca Pereira Tese Orientada pelo Doutor Henrique Veiga Fernandes Doutoramento em Ciências Biomédicas Especialidade Imunologia
-
Upload
truongthuy -
Category
Documents
-
view
213 -
download
0
Transcript of ROLE OF THE NEUROTROPHIC FACTOR RECEPTOR IN...

Universidade de Lisboa
Faculdade de Medicina de Lisboa
ROLE OF THE NEUROTROPHIC FACTOR RECEPTOR RET
IN HAEMATOPOIESIS
Diogo da Fonseca Pereira
Tese Orientada pelo Doutor Henrique Veiga Fernandes
Doutoramento em Ciências Biomédicas
Especialidade Imunologia

Todas as afirmações efectuadas no presente documento são
da exclusiva responsabilidade do seu autor, não cabendo
qualquer responsabilidade à Faculdade de Medicina de Lisboa
pelos conteúdos nele apresentados.
A impressão desta dissertação foi aprovada pelo Conselho
Cientifico da Faculdade de Medicina de Lisboa em reunião de
22 de Janeiro de 2013

i
TABLE OF CONTENTS
AGRADECIMENTOS iii
FIGURE INDEX v
Introduction v
The neurotrophic factor receptor RET drives haematopoietic
stem cell survival and function v
RET signalling is dispensable for thymic T cell development vi
RESUMO 1
SUMMARY 5
INTRODUCTION 7
THE HAEMATOPOIETIC SYSTEM 7
HAEMATOPOIETIC ORGANS 9
Primary lymphoid organs 9
Secondary lymphoid organs 9
HAEMATOPOIESIS 11
Haematopoietic stem cell – from embryonic life to adulthood 11
Haematopoietic stem cell – characterization and function 14
Haematopoietic stem cell – molecular regulation 20
Haematopoietic lineage development and commitment 23
Specific microenvironments – haematopoietic stem cell niches 25
T CELL DEVELOPMENT 29
Early immature progenitors in the thymus 29
T cell lineages – αβ and γδ fate choice 30
αβ T cell populations – CD4 and CD8 T cells 32
RET TYROSINE KINASE RECEPTOR 34
GDNF family ligands 35

ii
RET signalling axes 38
Deregulation of RET signalling 38
Role of RET in the haematopoietic system 40
AIMS OF THIS THESIS 43
THE NEUROTROPHIC FACTOR RECEPTOR RET DRIVES
HAEMATOPOIETIC STEM CELL SURVIVAL AND FUNCTION 45
ABSTRACT 45
METHODS 46
RESULTS 50
DISCUSSION 58
SUPPLEMENTARY FIGURES 60
RET/GFRΑ SIGNALS ARE DISPENSABLE FOR THYMIC T
CELL DEVELOPMENT IN VIVO 69
ABSTRACT 69
METHODS 70
RESULTS 72
DISCUSSION 80
SUPPLEMENTARY FIGURES 82
GENERAL DISCUSSION 87
REFERENCES 95

iii
Agradecimentos
Apesar de apresentar esta tese em inglês, sinto que há coisas só conseguem ser
ditas na nossa língua materna. No decorrer da minha formação académica, que
culmina nestes últimos quatro anos de Doutoramento, tenho muito a agradecer às
diversas pessoas que conheci e que contribuíram para o meu crescimento enquanto
cientista e pessoa.
Em primeiro lugar quero agradecer ao Henrique Veiga Fernandes, meu orientador,
por me ter aceitado para Doutoramento depois de uma entrevista por telefone a meio
da hora de almoço. Agradeço todo o apoio e tudo o que me ensinou, por me estimular
a pensar, mas também por toda a exigência e profissionalismo que coloca em tudo o
que faz. Tem sido uma experiência única, desde montar um laboratório até à criação
das figuras, sem esquecer claro as longas reuniões a planear experiências ainda mais
longas.
Ao Afonso Almeida, tutor das primeiras experiências, colega e amigo, devo muito
do que aprendi. Agradeço-lhe também tanto as discussões científicas como o seu
refinado humor, ambos essenciais para manter um espírito aguçado.
À Mariana Campos, por ter começado este projecto comigo, por se ter tornado uma
amiga, e pelas longas horas de aprendizagem em conjunto em frente ao citómetro.
Um agradecimento muito especial à Sílvia Madeira, aluna de mestrado, colega,
amiga e confidente. Agradeço-lhe toda a dedicação a este projecto e por comigo
formar o haematopoiesis group dentro da Unidade de Imunobiologia. Obrigado por
contrabalançares o meu feitio com o teu, fazemos um “casal” imbatível.
À Inês Barbosa, agradeço a amizade, as clonagens e produções virais, e
especialmente o desespero que passou com as culturas em metilcelulose. Agradeço
também a eterna alegria, e por dinamizar ao fim da tarde o momento YouTube, agora
quase perdido, no qual relembrei desenhos animados de infância à muito esquecidos.
À Rita Domingues, também pelas suas clonagens e produções virais, mas
especialmente pelas suas “ritices”, que nos alegram e causam muitas gargalhadas.
A todos os colegas da Unidade de Imunobiologia, passados e presentes, que
tornaram o laboratório num sítio agradável para trabalhar: à Francisca Almeida, Lara

iv
Santos, Cidália Gomes, Gonçalo Ramos, Manuela Ferreira, Hélder Ribeiro, Sales
Ibiza, Carlos Almeida; Bethania Cassani.
Agradeço a todos os membros da UNIMOL e da UNICEL por tornarem o nosso
corredor de imunologia um lugar interessante e divertido. Em especial agradeço à
Julie Ribot pelas discussões científicas, à Telma Lança pela amizade, e à Ana de
Barros, Ana Pena e Ana Água Doce pelas parvoíces do final do dia.
Aos membros da Unidade de Citometria de Fluxo, Maria Soares, Ana Luísa
Caetano, Isabel Pinto e Ana Vieira, pelas longas horas de sorting e pela
disponibilidade sempre demonstrada. A todos os membros, passados e presentes, do
Biotério, por tratarem dos meus ratinhos.
Agradeço os membros do meu comité de tese, Doutora Ana Espada Sousa, Doutor
Bruno Silva Santos e Doutor João Barata pelo apoio e críticas construtivas. Agradeço
também à Inês Crisóstomo, coordenadora do programa Doutoral, pela amizade e
disponibilidade sempre demonstrada.
Fora do Instituto de Medicina Molecular, quero agradecer ao Professor Rogério
Tenreiro, cujas palavras na altura certa me levaram a decidir arriscar um
Doutoramento.
Aos meus amigos, da Faculdade e mais antigos, pelas muitas experiências
partilhadas, que ajudaram a fazer de mim o que sou hoje.
À minha família, por tudo e mais. Agradeço ao meu pai, entre tantas coisas, pelo
seu irritantemente profundo conhecimento de tudo e mais alguma coisa, e com quem
aprendi que é possível ler meia dúzia de livros por semana. À minha mãe por toda a
dedicação, muitas vezes não valorizada o suficiente, e por ser o pilar da minha família.
Aos meus irmãos, Beatriz e Henrique, pelas brincadeiras e cumplicidade. Aos meus
avós.
Por fim, um agradecimento especial ao Jorge, por durante todo este tempo cuidar
de mim melhor do que eu seria capaz, e à Amélia, por rapidamente se ter tornado
insubstituível e por me alegrar no final de um longo dia de trabalho.

v
Figure Index
Introduction
Figure 1. Embryonic haematopoietic development 13
Figure 2. Critical signals for HSC maintenance 19
Figure 3. Lineage commitment of haematopoietic stem cells 24
Figure 4. Bone marrow haematopoietic stem cell niches 27
Figure 5. T cell developmental stages 31
Figure 6. GDNF family ligands (GFLs) signalling through RET receptor 37
The neurotrophic factor receptor RET drives haematopoietic stem cell
survival and function
Figure 1. Ret deficiency leads to reduced HSCs 51
Figure 2. Ret-/- LSKs have poor in vivo reconstitution potential 53
Figure 3. RET induces Bcl2/Bcl2l1 downstream of p38/MAP and CREB
activation 54
Figure 4. Triggering of RET signalling improves transplantation activity 56
Figure 5. Neuronal growth factors regulate HSC response to physiological
demand 58
Figure S1. Ret expression in haematopoietic progenitors 60
Figure S2. Ret ligands are expressed in foetal and adult haematopoietic stem
cell environment 61
Figure S3. Long-term reconstituting LSK cell numbers are affected by Ret
deficiency 62
Figure S4. Generation of Ret conditional knockout mice and analysis of BM
haematopoietic stem cells 63

vi
Figure S5. Ret deficient LSKs have reduced fitness at different transplantation
ratios and Ret expression increases after LSK transplantation 64
Figure S6. RET signalling results in increased survival and CREB
phosphorylation 65
Figure S7. Analysis of RetMEN2B LSK differentiation and transplantation
potential 66
Figure S8. Gfra deficient embryos have normal LSK cell numbers 67
RET signalling is dispensable for thymic T cell development
Figure 1. RET signalling molecules are express in embryonic thymus 73
Figure 2. RET or co-receptor signals are not required in embryonic thymic
development 74
Figure 3. Ret and co-receptors are expressed in adult thymocytes 75
Figure 4. RET-mediated signals are dispensable in normal T cell development 76
Figure 5. Ret gain-of-function mutations do not affect thymopoiesis 78
Figure 6. RET signalling is dispensable for thymic reconstitution and
thymocyte fitness 79
Figure S1. Ret and co-receptor deficiency does not affect embryonic thymic
development 82
Figure S2. hCd2-iCre is active in thymocytes from DN1 developmental stage 83
Figure S3. Conditional ablation of Ret does not impact thymocyte numbers 84
Figure S4. RetMEN2B gain-of-function mutation does not affect adult thymic
development 85
1
RESUMO
O sistema hematopoiético, que inclui as células do sistema imunitário, é altamente
complexo e dinâmico, e como tal, está sujeito a uma regulação apertada. Assim, o
estudo dos mecanismos moleculares responsáveis pelo desenvolvimento de células
hematopoiéticas é essencial para compreender a forma como este sistema funciona
de modo a manter o equilíbrio entre o número de células necessárias em homeostasia
e uma rápida resposta em situações de desequilíbrio.
A tirosina cinase RET é o receptor para os factores neurotróficos da família do
GDNF (glial cell line-derived neurotrophic factor) (GDNF family ligands – GFLs) e tem
uma função crucial no desenvolvimento e manutenção do sistema nervoso, no
desenvolvimento embrionário do rim e na espermatogénese. Curiosamente, a
expressão de Ret já foi detectada em várias populações de células hematopoiéticas e
em órgãos linfoides primários como o fígado fetal, a medula óssea e o timo. Para
além disso, foi também demonstrado um papel crucial da sinalização por RET em
células hematopoiéticas envolvidas na organogénese das placas de Peyer no intestino
durante a vida embrionária. No entanto, apesar de a expressão de RET ter sido
identificada em várias populações celulares, uma possível função de RET no
desenvolvimento ou função de células hematopoiéticas não é ainda conhecida.
As células estaminais hematopoiéticas, pelas suas capacidades de autorrenovação
e proliferação, são a base do programa de desenvolvimento e diferenciação que
origina todas as células do sangue. Por este motivo, é crucial compreender os
complexos mecanismos que regulam as células estaminais hematopoiéticas. Assim,
no laboratório estamos particularmente interessados no papel de RET na função das
células estaminais hematopoiéticas e no modo como a sinalização por RET pode ser
usada de forma a modular a sua resposta em situações de desequilíbrio como a
transplantação.
Uma vez que foi proposto um efeito do ligando de RET GDNF na sobrevivência de
timócitos in vitro, estamos também interessados em compreender a função de RET no
desenvolvimento de células T in vivo. O timo é responsável pela produção de todas as
populações de células T, que são essenciais para respostas imunitárias eficientes.
Como tal é indispensável perceber de que modo o microambiente tímico fornece uma
complexa rede de sinais que levam ao desenvolvimento de células T a partir de
precursores da medula óssea.

2
No laboratório descobrimos que a tirosina cinase RET tem uma função crítica na
sobrevivência e função das células estaminais hematopoiéticas. Estas expressam a
maquinaria de sinalização por RET, que inclui o receptor RET e os seus co-receptores,
enquanto o microambiente onde as células estaminais hematopoéticas se encontram
providencia os ligandos de RET necessários. Para além disso, a ablação de Ret leva
à redução do número de células estaminais hematopoiéticas e ao recrutamento de
células quiescentes para o estado proliferativo. Apesar de os progenitores
hematopoiéticos deficientes em RET terem um potencial de diferenciação normal,
apresentam uma fraca resposta ao stresse in vivo e um potencial de reconstituição
reduzido. Importante, a sinalização de RET fornece factores de sobrevivência às
células estaminais hematopoiéticas, por a jusante resultar na fosforilação da cinase
p38/MAPK e na activação do factor de transcrição CREB. Em concordância, a sobre-
expressão dos genes alvo a jusante de RET, Bcl2 ou Bcl2l1, resgata in vivo a função
hematopoiética de progenitores deficientes em Ret, aumentado o seu potencial te
transplantação. Na verdade, a activação de RET aumenta a sobrevivência de células
estaminais hematopoiéticas e a sua eficiência de transplantação in vivo, revelando
novas possibilidades de intervenção em terapias de transplantação e expansão ex vivo
de células estaminais hematopoiéticas. Assim, o nosso trabalho mostra que factores
neurotróficos presentes no nicho das células estaminais hematopoiéticas regulam a
sua função através do receptor RET.
Embora tenhamos confirmado que as moléculas envolvidas na sinalização de RET
são expressas no timo, especialmente na população de timócitos negativa para os co-
receptores CD4 e CD8 (DN), a remoção de Ret ou dos seus co-receptores Gfra1 ou
Gfra2 não afecta a timopoiese fetal. Concordantemente, animais adultos com
eliminação condicional de Ret em timócitos revelam que a capacidade de
desenvolvimento de timócitos deficientes em Ret é semelhante à dos controlos
selvagens. Do mesmo modo mutações que conferem um ganho de função no
receptor RET não influenciam o desenvolvimento tímico. Assim, apesar de a
sinalização por RET poder fornecer sinais de sobrevivência a timócitos, esta é
dispensável para o desenvolvimento de células T in vivo, mesmo em condições de
competição entre progenitores deficientes ou competentes em Ret.
No seu conjunto, o nosso trabalho demonstra que mecanismos moleculares
geralmente atribuídos a tecidos específicos, podem ser mais amplamente utilizado por
tipos de células não relacionadas, tais como células estaminais hematopoiéticas. Os
nossos resultados também ilustram como uma mesma via de sinalização pode ser
3
regulada de forma a originar diferentes respostas celulares. Contrariamente a
diversas populações de neurónios, que usam GFLs específicos dependendo do co-
receptor que expressam, as HSCs expressam múltiplos coreceptores de RET
respondem aos GFLs de forma redundante.
Existem cada vez mais evidências de que os sinais provenientes do sistema
nervoso podem controlar hematopoiese, nomeadamente através da regulação da
função dos osteoblastos e células estaminais mesenquimais presentes nos nichos das
HSCs. Surpreendentemente, nós mostramos que os neurônios e as HSCs utilizam
mecanismos comuns de regulação.. Deste modo, o nosso trabalho abre caminho a
novos estudos na utilização factores neurotróficos em protocolos de expansão e
transplantação de HSCs.

5
SUMMARY
Haematopoiesis is a developmental process that ensures the generation of all blood
cell lineages throughout life. As a consequence, this is a highly complex and dynamic
developmental cascade subject to tight regulatory mechanisms. Thus, the study of
novel molecular signals is critical to further understand how haematopoiesis operates
to ensure the balance between cell lineage commitment, cell homeostasis and efficient
haematopoietic responses to insults and disturbances.
The tyrosine kinase RET is the receptor for the GDNF (glial cell line-derived
neurotrophic factor) neurotrophic factor family (GDNF family ligands – GFLs).
Productive RET signalling controls the development and maintenance of the enteric
nervous system, kidneys and spermatogenesis. Interestingly, Ret expression was
detected in haematopoietic cells and lymphoid organs and RET signalling was shown
to regulate enteric lymphoid organogenesis. However the role of RET in
haematopoiesis remains completely unexplored.
Haematopoietic stem cells (HSCs) are at the onset of the developmental cascade
that generate all blood cells, thus we initially investigated the role of RET in HSC
function and how modulation of RET signalling can be used to control HSC responses.
Finally, we investigated the role of RET in late stages of haematopoietic cell precursor
differentiation into the T cell lineage.
We found that the tyrosine kinase RET is critical to HSC survival and function.
HSCs express RET signalling molecules and HSCs microenvironment provides RET
ligands. Moreover Ret ablation leads to reduced HSC numbers and recruitment of
quiescent cells into proliferation. Although RET null progenitors have normal
differentiation potential, they exhibit impaired in vivo stress response and reconstitution
potential. Remarkably RET downstream signalling results in p38/MAP kinase
phosphorylation and CREB transcription factor activation, providing HSCs with critical
surviving cues. In agreement, recue of Ret null progenitors was efficiently achieved in
vivo by forcing the expression of RET downstream targets, Bcl2 or Bcl2l1. Thus, RET
activation improves HSC survival and in vivo transplantation efficiency, unveiling
exciting new possibilities in transplantation and HSC ex vivo expansion. In addition,
our work demonstrates that HSC use neurotrophic factors to regulate and maintain
their fitness.

6
RET signalling molecules are also expressed in thymocytes, more specifically, we
found their expression in CD4/CD8 double negative thymocytes (DN). Nevertheless,
ablation of Ret or it co-receptors Gfra1 and Gfra2 had a minor impact in foetal
thymopoiesis. In agreement, Ret conditional knockout mice had similar thymocyte
development and fitness when compared to their WT counterparts. Thus, while RET
signalling is critical to HSC function, it is dispensable for T cell development in vivo.
Altogether, our work show that molecular mechanisms usually assigned to specific
tissues, can be more widely used by unrelated cell types, such as haematopoietic stem
cells. Our findings also illustrate how a same signalling pathway can be regulated to
originate different cell responses. Unlike several neuronal populations that use GFLs
depending on the specific expressed co-receptor, HSCs express multiple RET co-
receptors and respond to GFLs in a redundant fashion.
There is increasing evidence that nervous signals can control haematopoiesis,
namely by regulating osteoblast and mesenchymal stem cell function in HSC niches.
Herein, we show that neurons and HSC employ common regulatory mechanisms.
Thus, our work paves the way to further studies employing neurotrophic factors in HSC
expansion and transplantation protocols.
7
INTRODUCTION
The Haematopoietic system
The haematopoietic system, Ancient Greek for the system that makes blood, is
composed by a wide range of molecular and cellular components. Haematopoietic
cells are mainly found in lymphoid organs that promote haematopoietic cell interactions
with themselves and with other systems in the body. The main functions of the
haematopoietic system are: i. oxygen transportation, ii. blood coagulation, and iii.
defence against foreigner antigens1.
Since oxygen is a key element to energy production, this molecule is critically
required for tissue development in embryonic life. In mammals, oxygen transportation
is sustained by enucleated erythrocytes that contain haemoglobin, thus it is not
surprising that these cells are among the first haematopoietic cells to be produced in
the embryo. In mice they appear in the yolk sac’s blood island (YS) at embryonic day
7.5 (E7.5) as primitive erythrocytes; however, the first enucleated definitive erythrocyte
only appears by E12.52.
Blood coagulation prevents excessive blood loss from disrupted vessels, thus
ensuring haemostasis. Quickly after injury, platelets aggregate locally, forming a plug
at the site of injury, in an event called primary haemostasis3. Simultaneously, a myriad
of coagulation factors in the blood plasma, react in a complex signalling cascade that
result in the formation of fibrin strands that strengthen the platelet plug and make the
scaffold for consecutive tissue remodelling and cicatrization4.
Defence against potential pathogenic microorganisms and non-self antigens is
provided by white blood cells, called leukocytes. Leukocytes are responsible for
distinct immune responses in the body and encompass multiple immune cell
populations. Immune responses are traditionally subdivided into innate or adaptive
responses that cooperate for the elimination of infection or foreigner antigens. Innate
immune responses are considerably faster than adaptive immune responses and
provide non-specific inflammatory responses to pathogen and damage molecular
patterns, thus they constitute an initial front-line of protection. The main players of
innate immunity are myeloid cells, macrophages and granulocytes, which produce
inflammatory molecules and can phagocyte pathogens. Importantly, an emergent
family of innate lymphoid cells (ILC), which includes natural killer (NK) cells and ILC 2
and 3 have been recognized as main regulators of immune responses at mucosal

8
sites. In addition, NK cells can recognise and kill infected, transformed or altered cells,
thus being very important for tumour surveillance5-7.
The main feature of adaptive immune cells is their specificity to a given antigen.
Adaptive responses can take some days to become efficient, requiring the engagement
of antigen specific receptors in B and T lymphocytes, the B cell receptor (BCR) and T
cell receptor (TCR), respectively. Remarkably, B and T cell responses generate potent
memory cells that are long lived and react stronger and faster to previous encountered
antigens. Thus, productive adaptive immune responses and generation of
immunological memory are critical to efficient vaccination protocols.
9
Haematopoietic organs
Primary lymphoid organs
Haematopoiesis takes place in different tissues. Primary lymphoid organs ensure
blood cell generation from haematopoietic stem cells and may allow differentiation of
mature cells. Thus, their tissue microenvironment determines the development of
haematopoietic progenitors into several blood cell lineages.
In mammals the first haematopoietic progenitors appear in the yolk sac’s blood
island (YS) and generate primitive erythrocytes, while in fish this process occurs in the
intermediate cell mass2,8,9. Haematopoietic stem cells (HSCs) are generated at a later
stage in the aorta-gonad-mesonephros region (AGM) and sequentially migrate to the
foetal liver (FL) that becomes the main lymphoid organ of the embryo. Around birth, all
liver haematopoiesis ceases, and the bone marrow becomes the main primary
lymphoid organ10,11. In fish the kidney marrow and the spleen are the main primary
lymphoid organs12. Some haematopoietic cell lineages require additional lymphoid
organs to fully differentiate. As an example, the thymus provides the microenvironment
for lymphoid progenitors that migrate from foetal liver and bone marrow to differentiate
into mature T lymphocytes, and is therefore considered as a primary lymphoid organ13-
16. In most mammals, B cell differentiation occurs in the bone marrow. However in
sheep and cattle, the ileal Peyer’s patch is the primary lymphoid organ for B cell
development and in birds B cell development occurs in the bursa of Fabricius that gave
the name to B cells (bursa-derived)16-18.
Secondary lymphoid organs
Secondary lymphoid organs (SLOs), such as spleen and lymph nodes, are
generated in embryonic life in strategic positions throughout the body and constitute
specialized structures for cellular interactions. They are constituted by non-
haematopoietic meschymal cells and antigen-presenting cells that organise the
framework for T and B cell interactions. SLOs are interconnected by a network of
lymphatic vessels maximizing, in this way, not only the chance of encounters between
effectors cells and antigen-presenting cells loaded with foreigner antigens, but also to
meet regulatory cells. This ensures a rapid, efficient and controlled immune response.
Some secondary lymphoid organs were originated throughout evolution at mucosal

10
sites and constitute the first defence against pathogens. These include intestinal
Peyer’s patches, tonsils, and nasal (NALT) and bronchial-associated lymphoid tissues
(BALT) in the airways19-21.

11
Haematopoiesis
Every day there is a pressing need to replace aged or damaged blood cells due to
homeostatic cell turnover, pathological conditions, illness or trauma. Haematopoiesis
is the tightly orchestrated developmental process that is responsible for the continuous
formation of all blood cells types that guarantees oxygen delivery, haemostasis and the
ability to control microorganisms22. This process relies on the existence of rare long-
lived and self renewing haematopoietic stem cells (HSCs), which by extensive
proliferation accompanied by successive loss of multipotency, have the ability to
differentiate into all blood cell lineages. In fact, their extraordinary features make them
unique cell targets in the therapy of malignant and non malignant haematological
problems22-24.
Haematopoietic stem cell – from embryonic life to adulthood
In mice, the first haematopoietic activity is detected at embryonic day 7.5 (E7.5) in
the yolk sac (YS) (Fig. 1A). These primitive haematopoietic progenitors form a cluster
surrounded by endothelial cells that has been called ‘blood island’. At this site, a first
wave of nucleated primitive erythrocytes arises, followed by a second wave of
erythrocyte and myeloid progenitors2,9,25. Nevertheless, the appearance and ontogeny
of haematopoietic stem cells (HSCs) have been debatable matters in the last decades.
Despite the existence of progenitors with multilineage potential in the YS, the
emergence of true multipotent HSCs, with full multilineage reconstitution potential in
vivo, is believed to first appear in the paraaortic splanchnopleura that later develops
into the aorta-gonad-mesonephros region (AGM) around E8.511,26-28. Strikingly, it was
recently shown that the human AGM region harbours HSCs before they appear in the
YS, reinforcing the concept of an AGM origin of HSC precursors and definitive HSCs29.
Due to spatial and temporal proximity of blood and endothelial cell generation, and
because both cells types have a mesodermal origin, a common embryonic progenitor,
the haemangioblast, was first hypothesized and more recently proven to exist in
different organisms30-32. In mice the haemangioblast was shown to be a tri-potent
progenitor capable of generating haematopoietic, endothelial and vascular smooth
muscle cells33.
In addition to the YS and AGM regions, haematopoietic activity was also observed in
other embryonic tissues in both mouse and humans, namely the vitelline and umbilical

12
arteries and the placenta. At E11, clusters of haematopoietic cells are found in vitelline
and umbilical arteries and the frequencies of HSCs in these arteries were similar to
those found in the AGM. Since haematopoietic activity is detected at these sites only
after it begins in the AGM, it is unlikely that those HSC are locally generated de
novo34,35. Interestingly, a significant number of definitive HSCs are found at E11
placentas, suggesting a role for HSC generation or expansion in placenta vasculature.
In fact, HSC numbers expand until E13.5, being 15-fold higher than in the AGM. At
E15.5 HSC numbers in the placenta start to decline, suggesting a displacement of
HSCs to the foetal liver. Thus, the placenta is an important transitory haematopoietic
niche responsible for the expansion, rather than generation, of definitive HSCs, before
their expansion burst and differentiation in the foetal liver (FL) (Fig. 1B)36-38.
After E12.5 the FL becomes the major haematopoietic organ in the mouse embryo
(Fig. 1C). The colonization of the liver rudiment starts around E10-12 by AGM and YS
progenitors. The first progenitors are YS myeloid cells and primitive erythrocytes.
HSCs generated and expanded in the AGM and YS, and possibly in the placenta, also
migrate to the FL39,40. Contrary to the adult bone marrow, the FL microenvironment
provides the conditions for a massive HSC expansion thatexponentially increases their
numbers until E15.541. In addition, the FL provides the signals for complete
differentiation of haematopoietic progenitors into different haematopoietic lineages, yet
ensuring HSC maintenance42. From the FL, haematopoietic progenitors migrate to the
foetal spleen (FS) and to the developing thymus anlagen and generate the first waves
of T cells43-46. Just before birth, the FL haematopoietic activity diminishes; HSCs
migrate and seed the bone marrow, which by then becomes the main lifelong primary
lymphoid organ47,48.
Circulating FL haematopoietic progenitors colonise the foetal splenic rudiment (FS)
at E12.5, and splenic haematopoiesis is detected from day E14.5 until the first weeks
after birth. In contrast to the FL, splenic HSCs do not expand significantly. Instead the
FS environment drives differentiation of intermediate progenitor cells originated in the
FL into erythrocytes, myeloid cells and lymphoid progenitors44,49. Nevertheless,
removal of the neonatal spleen has no significant impact on bone marrow HSC
numbers, thus suggesting that the foetal and neonatal spleen have an important but
transitory role in maintaining blood cell numbers in newborns50.
13
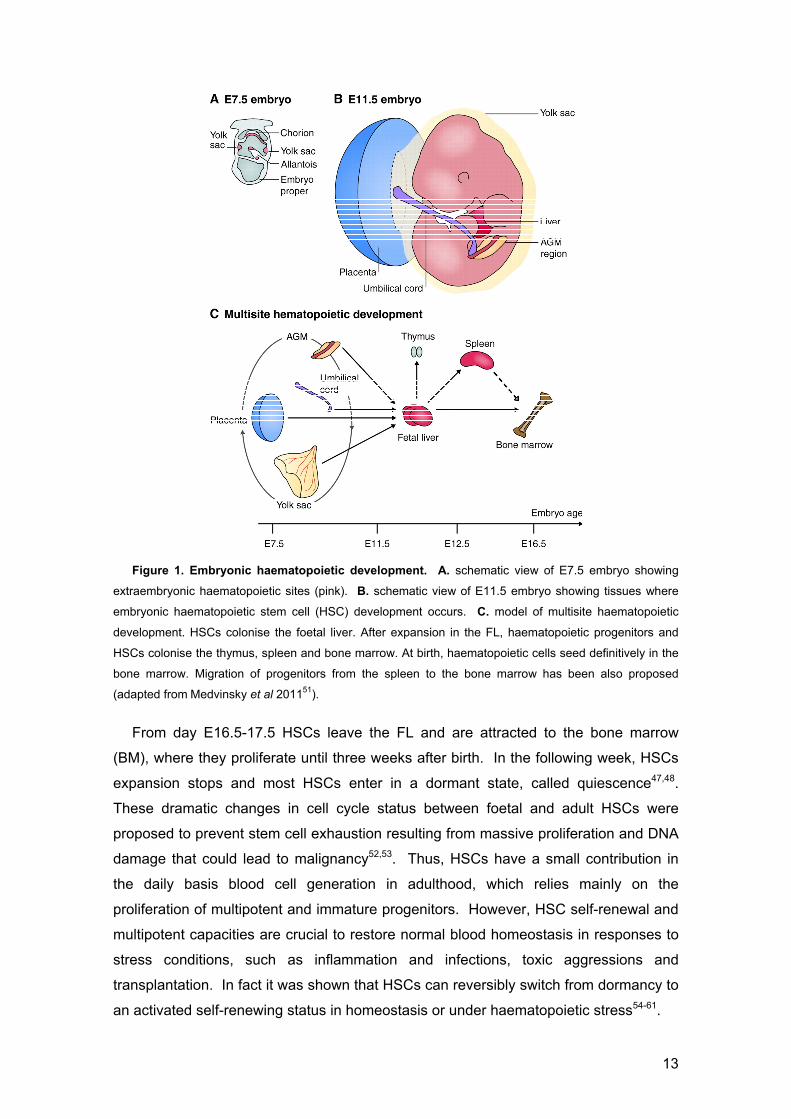
Figure 1. Embryonic haematopoietic development. A. schematic view of E7.5 embryo showing
extraembryonic haematopoietic sites (pink). B. schematic view of E11.5 embryo showing tissues where
embryonic haematopoietic stem cell (HSC) development occurs. C. model of multisite haematopoietic
development. HSCs colonise the foetal liver. After expansion in the FL, haematopoietic progenitors and
HSCs colonise the thymus, spleen and bone marrow. At birth, haematopoietic cells seed definitively in the
bone marrow. Migration of progenitors from the spleen to the bone marrow has been also proposed
(adapted from Medvinsky et al 201151).
From day E16.5-17.5 HSCs leave the FL and are attracted to the bone marrow
(BM), where they proliferate until three weeks after birth. In the following week, HSCs
expansion stops and most HSCs enter in a dormant state, called quiescence47,48.
These dramatic changes in cell cycle status between foetal and adult HSCs were
proposed to prevent stem cell exhaustion resulting from massive proliferation and DNA
damage that could lead to malignancy52,53. Thus, HSCs have a small contribution in
the daily basis blood cell generation in adulthood, which relies mainly on the
proliferation of multipotent and immature progenitors. However, HSC self-renewal and
multipotent capacities are crucial to restore normal blood homeostasis in responses to
stress conditions, such as inflammation and infections, toxic aggressions and
transplantation. In fact it was shown that HSCs can reversibly switch from dormancy to
an activated self-renewing status in homeostasis or under haematopoietic stress54-61.
14
Throughout life HSC can also be found in the blood, although in very low
percentages. The presence of HSCs in the blood was explained by their asymmetric
division followed by migration of the daughter cells into circulation, but active division-
independent egress of HSC was also demonstrated62. The biological function of these
circulating HSCs has not been completely elucidated. One hypothesis is the search for
vacant niches in distant bones; or, as shown by Massberg and colleagues, the
differentiation into mature immune cells in peripheral organs63.
In normal homeostatic conditions virtually all haematopoiesis is restricted to
haematopoietic progenitors in the bone marrow. Nevertheless in pathological
scenarios that cause severe depletion of haematopoietic cells, like anaemia or chronic
infections, haematopoietic activity is detected outside the bone marrow64,65. This
process, called extramedullary haematopoiesis, occurs in the adult spleen (Sp) and to
a lesser extend in the adult liver. Extramedullary haematopoiesis is critically important
in stress erythropoiesis that follows severe anaemia and transplantation in
myeloablative conditions66. In fact, one of the first demonstrations of a clonogenic
haematopoietic progenitors came from the work of Till and McCulloch demonstrating
that upon transplantation of bone marrow cells into irradiated animals, some cells
migrate to the spleen, proliferate and rapidly differentiate in order to protect the host.
These highly proliferative multipotent progenitors were later called colony-forming unit-
spleen (CFU-s)67-69. More recently true haematopoietic stem cells were observed in the
Sp after mobilization, contacting sinusoidal endothelial cells, and the existence of a
HSC niche in the spleen was also suggested70. In agreement, splenic stroma cells
have been shown to support in vitro development of dendritic cells from BM and Sp
haematopoietic precursors71. Albeit a crucial role for the spleen as a primary
haematopoietic organ in normal healthy individuals is unlikely, the importance of spleen
as an active site of haematopoiesis in pathological conditions, especially those that
interfere with the normal haematopoietic activity in bones, needs to be carefully
addressed.
Haematopoietic stem cell – characterization and function
Haematopoietic stem cells (HSC) are multipotent cells that have the ability to give
rise to all mature haematopoietic cell types through a process of expansion and
continuous loss of potential72,73. HSCs have the ability to self-renew their own pool of
undifferentiated progenitors. Although the self-renewal capacity may occur by alternate
15
divisions, were in one round of division only stem cells are produced proceeded by a
round of division that generate only committed cells; asymmetric cells divisions, where
in each round of division one stem cell and one committed cells are generated, were
found to be the dominant event23,73-75. Their joint ability to self-renew and differentiate
into all mature blood cells has been taken in advantage by physicians in HSC
transplantation protocols60. Indeed the capacity to fully reconstitute a recipient after
transplantation became the major functional hallmark of HSCs. As such, long term
repopulating assays, alone or in competition with cells bearing distinctive markers, are
widely used to evaluate the haematopoietic activity of unknown progenitors76-80.
Interestingly, HSCs differ from embryonic stem cells since their self-generation and
differentiation capacity are not unlimited and serial transplantations can only succeed
three of four times74.
As previously discussed, the first demonstration of functional differentiation plasticity
in haematopoietic progenitors derive from the work of Till, McCulloch and colleagues
when transplanting BM cells into lethally irradiated mice. In these experiments some
haematopoietic progenitors home to the spleen of irradiated recipients and form
colonies that appear at day 8 or 12 after transplantation. Analysis of these colonies
revealed that most of the cells present in a colony came from the same progenitor
cell67,68. Although it was later shown that colony-forming unit-spleen (CFU-s) were not
true HSCs, but myeloerythroid and multipotent progenitors, this work paved the way to
the subsequent identification of HSCs, and established CFU-sd8 and CFU-sd12 as short
term rescue assays of haematopoietic activity72,81,82.
With the advent of fluorescence-activated cell sorting (FACS)83 many different
approaches were developed to purify pluripotent haematopoietic stem cells from
multipotent progenitors. The first approaches took advantage of morphological
properties of cells, such as size and granularity, by binding to fluorochrome conjugated
wheat germ lectin, and by using cell penetrable dyes like rhodamine 123 (Rho) after
density separation84,85.
Since most immature haematopoietic stem cells have multidrug pumps from the
ABC transporter family, using vital dyes, like Hoechst 33342, and displaying their
fluorescence in two different wavelengths it is possible to identify a cell population with
low fluorescence, designated side population (SP), with phenotypic and functional
markers of HSCs86-88. Inside SP cells, Rhoneg/dull cells are further enriched for
HSCs85,89. However, the usage of vital dyes is not trivial and limits their application to

16
cell suspension samples. Finally, it is noteworthy that any event that interferes with
ABC transporters kinetics, like activation and proliferation, will directly impact on SP90.
In 1988, using fluorescent labelled antibodies, Weissman’s lab described a bone
marrow cell population that was LinnegThy1loSca1pos and that contained virtually all
haematopoietic stem cells72. However, Thy1 expression varies according to different
mouse strains, which makes its use impractical for common strain that do not carry the
haplotype Thy1.1, like the C57Bl/6 mice. In this regard, a continuous effort has been
made to identify HSC specific markers.
Consecutive work by Ogawa and colleagues revealed that the tyrosine kinase
receptor cKit (CD117) is expressed by many haematopoietic progenitor cells that lack
the expression on lineage markers91. Haematopoietic activity was then described in
the population of LinnegcKitposSca1pos (LSK) comprising approximately 0.05%-0.1% of
BM and FL cells, making cKit and Sca1 the most commonly used markers to define the
progenitor population that contains HSCs92,93. The tyrosine kinase cKit is the receptor
for stem cell factor (SCF), also called mast cell growth factor or Kit ligand.
Spontaneous mutations in either Kit or Kitl locus cause severe haematopoietic
problems such as macrocytic anaemia94-97. , In conjunction with other cytokines and
growth factors, like IL-3 and IL-6, Kit ligand is a potent HSC mitogen, and although its
role in HSC self renewal is controversial, it is critic for their proliferation, survival, and
possible adhesion through interaction of cKit with membrane bound Kit ligand present
in the HSC microenvironment93,98-101.
Sca1 was suggested to regulate HSC self-renewal, especially in haematopoietic
stress, since Sca1 null mice have thrombocytopenia, decreased multipotent
progenitors and CFU-s activity, and a competitive disadvantage in transplantation
compared with WT HSCs. Sca1 was also shown to be downstream of IFNαR-STAT1
signalling mediating IFNα induced HSC proliferation. Similarly to other GPI-linked
proteins, Sca1 was proposed to modulate signalling molecules in the lipid rafts. In fact,
Sca1 was suggested to interact with cKit signalling, as Sca1 deficiency together with
cKit partial loss of function (KitWv/Wv) results in increased embryonic lethality and
generation of severely anaemic foetus102.
Despite containing all haematopoietic activity, LSK cells are still heterogeneous and
less than 10% were calculated to be HSCs. Humans HSC and progenitor cells were
identified within a population expressing CD34 in the BM and blood, which can be
further enriched in HSCs by selecting CD34posCD38neg cells103,104. Interestingly, and in
17
contrast to humans, most immature HSCs in mice reside in the CD34neg, and injection
of a single LSK CD34neg cell can reconstitute around 20% of the recipient mice56.
Thus, together with the tyrosine kinase receptor Flt3, also called Flk2 or CD135, (fms-
like tyrosine kinase receptor-3 or foetal liver kinase-2), expression of CD34 defines
three categories of haematopoietic progenitors: LSK CD34negFlt3neg cells are long-term
reconstitution haematopoietic stem cells (LT-HSC) with self-renewal capacity,
responsible for long term engraftment and reconstitution of an irradiated host; LSK
CD34posFlt3neg cells are short-term reconstitution haematopoietic stem cells (ST-HSC),
which are active proliferating HSCs, with multipotency, limited self renewal capacity,
generate CFU-s and rapidly restore myelopoiesis and erythropoiesis; and finally
acquisition of Flt3 expression by LSK CD34posFlt3pos cells, a tyrosine kinase receptor
that gives proliferative and differentiation signals to many immature progenitors,
characterises multipotent progenitors (MPP) with myeloid and lymphoid-biased
potential, but with no self renewal capacity99,105-107.
In contrast to human HSCs, mouse HSCs express CD38 within LSK cells in foetal
and adult life. CD38 is a useful marker that correlates with HSC functions: LSKCD38neg
cells have most of the CFU-s but no long-term reconstituting cells (ST-LSK) and LSK
CD38pos cells contain virtually all long-term reconstituting stem cells (LT-LSK)108.
Nevertheless, the usage of CD34 and CD38 as markers for HSCs needs to be carefully
addressed since their expression varies in ontogeny and with cell activation. YS
primitive haematopoietic progenitors and definitive FL and BM HSCs from young mice
express CD34, a phenomenon also observed in mobilised or injury-activated
HSCs109,110. Nevertheless, it is interesting to notice that YS primitive haematopoietic
progenitors already express CD38111. Conversely, activated HSCs down regulate
CD38 expression, acquiring a phenotype similar to human stem cells112. As such, mice
mobilised HSCs appear CD34posCD38neg. Interestingly, when homeostasis is achieved
after transplant, the HSC phenotype reverts to CD34negCD38pos, reflecting the active
changes of HSCs under homeostasis and haematopoietic stress54. Together with the
fact that multilineage repopulating activity was also found in human CD34neg progenitor
cells, including the generation of CD34pos cells, these findings open the debate on
whether to use CD34 and CD38 as markers for HSCs, highlighting the differences
between homeostatic slow dividing and activated proliferating HSCs112,113.
In addition to CD34 expression, many phenotypical and functional differences were
revealed between foetal and adult HSCs. Mac1, or CD11b, a marker that identifies
adult myeloid cells, is expressed by foetal haematopoietic progenitors, but its
18
expression is restricted to foetal haematopoietic stem cells41. The expression of
CD45RB and CD93, recognised by the AA4.1 monoclonal antibody, as well as being
Rhopos/bright, also distinguishes foetal from adult stem cells79,114. Interestingly, FL HSCs
have increased haematopoietic activity when compared to HSCs from adult BM, as
revealed by their reconstitution potential in competitive repopulation assays with their
BM counterparts77-79.
Some of the markers commonly used to purify HSC populations, such as Thy1 and
Sca1, were shown to be differentially expressed in mice strains carrying different
haplotypes, thus limiting the comparison between assays using different models115,116.
In 2005 Kiel and colleagues found that the SLAM family receptors (Signalling
Lymphocyte Activation Molecule) were highly expressed in haematopoietic progenitors
and could distinguish HSCs from committed progenitors. Therefore, most HSCs are
CD150posCD48negCD244neg (many times described only as CD150posCD48neg), whereas
MPP are CD150negCD48negCD244pos and restricted progenitors are CD150negCD48pos
CD244neg 70. Using these markers, these authors achieved the same reconstitution
capacity as with the LSKCD34neg criteria (20%). When SLAM markers were applied
within the LSK compartment, almost 50% of engraftment and long-term multilineage
reconstitution of recipients could be obtained by transplanting a single LSK
CD150posCD48neg cell. Thus this marker combination is currently the best manner to
define long-term HSCs. Importantly, the expression patterns of SLAM receptors is
conserved among many mouse strains, characterises both adult and foetal HSCs, and
is maintained in mobilised and extramedullary HSCs70,117. The purity of HSCs can be
further enriched by excluding megakaryocyte progenitors with CD41, a marker for
megakaryocyte lineage cells that is also expressed in primitive haematopoietic
progenitors but is down regulated in definitive haematopoiesis118-121.
Recent work has shed light into other HSC markers. CD201 expression, the
endothelial protein C receptor (EPCR), alone or in combination with previously
described markers, identifies a HSC population with long-term reconstitution activity
and self-renewal potential in foetal, adult and cultured progenitors122-124. Long-term
repopulating HSCs are also positive for endoglin or CD105, a TGFβ accessory
receptor, and simple CD105posSca1posRholow analysis defines a nearly homogeneous
LT-HSC population125,126.

19
Figure 2. Critical signals for HSC maintenance. Schematic view of the molecular cascades in the
HSC-niche. Ligand–receptor interactions and interactions between adhesion molecules are depicted.
Contradictory evidence and indirect or unknown mechanisms are denoted by question mark (adapted from
Wilson & Trumpp, 2006127).
In order to maintain their function, HSCs need to balance multiple signals from
cytokines, chemokines and growth factors (Fig. 2)127. HSCs express the
thrombopoietin receptor MPL. Its downstream signalling provides survival, proliferative
and differentiation cues; more specifically it controls megakaryocyte differentiation128-
131. Thrombopoietin also regulates maintenance of quiescent adult HSC132,133. Growth
factors, such as insulin-like growth factor 2, were also shown to drive HSC expansion
and both foetal and adult HSCs express insulin-like growth factor 2 receptor
(IGF2R)134. In contrast, signals from angiopoetin-1 and its receptor the tyrosine kinase
Tie2, also called TEK, are critical to maintain quiescence and HSC repopulating activity
through cell division inhibition and improvement of HSC adhesion to the
microenvironment135,136. The maintenance of the HSC pool, as well as the migration
and retention of HSCs in the BM relies on CXCL12 interaction with CXCR4. CXCR4
antagonists mobilise human and murine HSCs from the BM into blood, a process that
is currently used in the clinics to collect human haematopoietic progenitor cells137-139.
Finally, HSCs also express numerous adhesion molecules such as N-cadherin, CD44
and various integrins, that collectively control HSC homing and maintenance in specific
microenvironments127,140.
20
While a significant proportion of foetal liver HSCs are in cycle, adult BM HSCs are
mostly slow dividing quiescent cells48. Several models were proposed to explain HSC
cell cycle regulation. The first model suggested a slow and continuous recruitment into
cell cycle, where at any time point 75% of HSCs would be in G0, but eventually all
would divide on average every 57 days141. However, a hierarchical model recently
postulated that the HSC population contains active and dormant HSCs (dHSCs).
These dHSCs would divide on average 5 times per lifetime, and are detected as label-
retaining cells (LRC) by pulsed labelling with BrdU or histone H2B-GFP fusion
protein54. In addition, a ‘dynamic repetition’ model was also proposed, whereby long
term reconstituting HSCs would be found both in cycling and quiescent populations.
More specifically, this model proposes that HSCs have the capacity to repetitively
change between cycling and quiescent states. Thus HSCs that for a given time are in
cycle may enter quiescence and vice versa142.
Haematopoietic stem cell – molecular regulation
To maintain haematopoiesis throughout life and the capacity to respond upon
physiological demand, HSCs need to balance between non-dividing quiescent state,
self-renewal and differentiation. As such, HSCs are subject to a tight regulation.
Active inhibition of the cell cycle is crucial to maintain quiescence and avoid HSC
exhaustion that results from persistent proliferation. Cyclin-dependent kinase inhibitor
p21 (encoded in Cdkn1a gene), and its regulator, the zinc-finger repressor transcription
factor GFI-1 (growth factor independent 1), are critical to restrict proliferation and
maintain quiescence143,144. Although their ablation results initially in increased HSCs
numbers and cycling HSCs, these cells have a defective stress response, impaired
repopulation capacity in transplantation and are rapidly exhausted. Other cyclin-
dependent kinase inhibitors, like p57 and p27, were also shown to be involved in HSC
maintenance and quiescence145-147.
Several other transcription factors were shown to regulate HSC homeostasis by
controlling cell proliferation. The transcription factor EGR1 (early growth response 1),
is highly expressed in LT-HSCs and controls both quiescence and retention in HSCs
niches. Absence of EGR1 in Egr1-/- mice results in increased proliferation and
mobilisation of HSCs to peripheral blood148. Interestingly, reduction in EGR1 also
causes reduced p21 levels. The transcription factor EVI1 (ecotropic viral integration
site 1), which was also shown to be over expressed in several myeloid malignancies, is

21
also critical to HSC self-renewal and long-term HSC activity149,150. Other transcription
factors regulate HSC function by inhibiting cell differentiation. The inhibitor of DNA
binding family member, ID1 regulate HSC fate by restraining myeloid commitment and
differentiation151.
The capacity of HSCs to self-renew is crucial when they need to rapidly expand,
such as during foetal development and HSC stress responses. Several members of
the HOX protein family, and their co-regulators, such as Meis1 and Pbx3, are
expressed by HSCs and are critical for HSC maintenance. Over expression of HOX
proteins in haematopoietic progenitors results in their expansion, and although they
have redundant functions, cumulative ablation of HOXA9, HOXB3 and HOXB4 cause
severe haematopoietic defects152,153. Importantly, Mixed Lineage Leukemia gene (Mll),
which is critical for primitive haematopoiesis in the YS and definitive foetal and adult
haematopoiesis, is an activator of several Hox genes and drives expansion of
haematopoietic progenitors154-158.
In addition to the direct transcriptional regulation of HSC function, posttranscriptional
mechanisms also take place in HSC regulation. The E3 ubiquitin ligase Fbw7 control
HSC quiescence and differentiation by regulating the levels of MYC protein that is
required for HSC proliferation159,160. Although sharing similar regulatory strategies,
foetal and adult HSCs differ in their proliferation status, haematopoietic activity and
differentiation potential. The balance between Lin28b transcriptional repressor and the
let-7 family of micro RNAs (miRNAs) is responsible for the switch from foetal to adult
HSC differentiation potential, in which expression of let-7 miRNAs is associated with
adult HSC profile and expression of Lin28b, a let-7 miRNAs blocker, correlates with a
foetal-like potential161. Interestingly, the stem-cell leukaemia SCL/tal-1 is essential for
HSC genesis in embryonic development, but it is dispensable for long-term
repopulation activity and multipotency of adult HSCs162-164. Hedgehog signalling was
also shown to be dispensable for adult HSC function, but it was suggested to regulate
foetal HSC development165,166.
Regulation of mitochondrial integrity, cell metabolism and control of oxidative stress
play crucial role in HSC homeostasis. Activation of mTOR complex, a known nutrient
sensing system, dramatically reduced haematopoiesis, promoting quiescent HSCs into
rapid cycling and increasing mitochondrial biogenesis and reactive oxygen species
(ROS) levels167. WNT signalling, which was shown to be critical to HSC maintenance,
counteracts mTOR signalling, and concomitant activation of WNT and inhibition of
mTOR increases the number of long-term HSCs in vivo168,169. The energy metabolism
22
regulator LKB1, the major kinase that phosphorilates AMP-activated protein kinase
(AMPK) also regulate HSC quiescence, cell cycle and metabolic homeostasis, thus
determining HSC survival170-172. Conditional ablation of Lkb1 results in a dramatic
decrease in energy content and increased mitochondria defects, causing rapid entry of
haematopoietic progenitors into cell cycle and HSC exhaustion. Likewise, DNA repair
machinery pathways and autophagy, critical in the protection against ROS and cellular
damage, are essential for HSC function and maintenance, and absence of molecules
involved in these pathways, such as Paf and Atg7, results in increased proliferation and
HSC failure173,174.
Several members of B-cell lymphoma 2 family (BCL2) have being implicated in
HSC survival175. myeloid cell leukaemia 1 (Mcl1), a BCL2 family member, is highly
expressed in HSCs and was shown to be critical for HSC survival and other early
haematopoietic progenitors176. Interestingly, known haematopoietic growth factors,
particularly the Kit ligand SCF, were shown to upregulate Mcl1 expression. Moreover,
proteins involved in MCL1 stabilization and maintenance of mitochondrial integrity,
such as heat shock protein 70 family members (HSC70) and guanosine nucleotide-
binding protein GIMAP5, are also important regulators of HSC and progenitor cell
survival177. Other BCL2 family member that bind to GIMAP5, BCLxL (encoded in the
Bcl2l1 gene) also play a role in HSC survival, as mice with BCLxL deficiency present
massive cell death of several haematopoietic progenitors178,179. BCLxL was also shown
to be involved in HSC180. Although the role of BCL2 in survival of HSCs is
controversial, loss of BCL2 results in lymphocytopenia and its upregulation was shown
to enhance hematopoietic differentiation from murine embryonic stem cells in vitro.
Moreover, overexpression of Bcl2 increases HSC numbers and their repopulation
potential181-183. Interestingly, it was shown that BCL2 causes upregulation of p27 cell
cycling inhibitor, thus coupling HSC survival with cell cycle regulation. Importantly,
some transcription factors shown to regulate HSC survival, maintenance and
differentiation, such as the GA binding protein (GABP), were shown to target BCL2,
BCLxL and MCL1184. In addition, calmodulin-dependent Protein Kinase IV (CaMKIV)
regulates HSC maintenance controlling Bcl2 expression downstream of the CREB
transcription factor and CREB-binding protein (CBP)185. Thus, several anti-apoptotic
factors regulate HSC survival, and their requirement may be influenced by particular
physiological contexts.

23
Haematopoietic lineage development and commitment
Mature blood cells with diverse functions can be divided in three different lineages
according to their ontogeny: erythroid, myeloid and lymphoid lineages. Haematopoietic
stem cells and the more committed multipotent progenitors (MPP) generate all mature
blood cells, but the mechanisms by which lineage restriction occurs are not obvious.
The classical model of haematopoietic differentiation proposes that the first
commitment of MPPs separates a common lymphoid progenitor (CLP) from myeloid
progenitors (MP) that include a common myeloid progenitor (CMP) with myeloid-
erythroid-megakaryocyte potential (Fig. 3). Therefore the CLP is a LinnegIL-7Rαpos
cKitlowSca1low population with rapid lymphoid (B, T and NK cells) reconstitution capacity
but with no myeloerythroid capacity, while LinnegIL-7Rαneg cKitposSca1neg MP are divided
with CD34 and FcγR (CD16/32) in LinnegIL-7RαnegcKitposSca1negFcγRlowCD34pos CMP,
LinnegIL-7RαnegcKitposSca1negFcγRhighCD34pos granulocyte-macrophage progenitors
(GMP) and LinnegIL-7RαnegcKitposSca1negFcγRlow CD34neg megakaryocyte-erythrocyte
progenitors (MEP)186,187. More recently, first in the foetal liver and later in the adult
bone marrow, several studies have identified haematopoietic progenitors that do not fit
the previous rigid model of haematopoietic development, such as the existence of
LSKCD34posFlt3high lymphoid-primed multipotent progenitors lacking megakaryocytic
and erythroid potential but with myelolymphoid potential, and progenitors that can
generate macrophages, B and T cells (M/T, M/B and M/T/B progenitors). Thereby a
revised or alternative model of haematopoietic commitment is a myeloid-biased model.
In this model, the generation of erythroid-megakaryocyte and lymphoid progenitors
within the MMPs are mutually exclusive, whereas the myeloid potential is promiscuous
and kept longer, thus generating common myelolymphoid (CMLP) and common
myeloerythroid (CMEP) progenitors188-196.
The differentiation potential of intermediate progenitors has been analysed in vivo by
transplantation into irradiated recipients and in vitro by identification of colony-forming
cells (CFC) using semi-solid media supplemented with known cytokine cocktails. In
these assays, progenitors with uni, bi and oligopotential were identified. Progenitors
with restricted potential are colony-forming units-erythrocyte (CFU-E), and the more
immature burst-forming unit-erythrocyte (BFU-E); colony-forming unit-megakaryocyte
(CFU-Mk); colony-forming unit-granulocyte (CFU-G) and colony-forming unit-
macrophage (CFU-M). Bipotential colonies are colony-forming unit-
granulocyte/macrophage (CFU-GM). The more immature colony-forming units
detected in these assays generate all myeloerythroid lineages and are called colony-

24
forming unit-granulocyte-erythrocyte-megakaryocyte-macrophage (CFU-GEMM).
Although colony-forming unit-PreB cells (CFU-PreB) can be detected with very specific
cytokine mixture in methylcellulose media, analysis of B and T potential normally
require co-culture of haematopoietic progenitors with stromal cells or, especially for T
cell development, complex tissue cultures such as foetal thymic organ cultures
(FTOC)197-199.
Figure 3. Lineage commitment of haematopoietic stem cells. Schematic view of a classical model
of haematopoietic differentiation. Self-renewing HSCs give rise to multipotent progenitors that proliferate
and differentiate into lineage-restricted progenitors. These generate mature blood cells. Alternatively,
HSCs first restrict erythroid-megakaryocyte and lymphoid potentials by generating common myelolymphoid
(CMLP) and common myeloerythroid (CMEP) progenitors, retaining myeloid potential longer in the
restriction developmental program (adapted from Metcalf 200774).
The erythroid call lineage is the first to appear in development, giving rise to
erythrocytes that transport oxygen and megakaryocytes that fragment into platelets1-4.
Haematopoietic cells that derive from the myeloid lineages are divided into two main
groups according to their nucleus morphology. Mononuclear cells are composed by
circulating monocytes and their progeny, dendritic cells and phagocytic macrophages
that reside in SLOs and peripheral tissues. Polymorphonuclear cells, called
granulocytes, include neutrophils, eosinophils, basophils and mast cells. Neutrophils
are one of the first responding cells to local inflammation and are crucial to resolve
bacterial infections; eosinophils are associated with responses to parasites and allergic
reactions; basophils and mast cells are responsible for the induction of allergic
inflammatory responses and have a role in ectoparasite infections1,195,200,201.

25
The lymphoid lineage generates three main types of mature cells: innate lymphoid
cells (ILCs); B cells and T cells. Nevertheless, some dendritic cell populations were
also shown to originate from CLP186,201. Innate lymphoid cells are a heterogeneous
family that includes cells capable of recognising and killing infected or malignant cells,
driving inflammatory responses against pathogens but also implicated in autoimmunity
and allergy. They are also crucial for SLOs formation in development7. B cells express
on their surface a receptor known as the B cell receptor (BCR) and are the effector arm
of humoral immunity. Upon BCR engagement with the cognate antigen, B cells can
differentiate into plasma cells which produce large amounts of soluble antibodies that
bind to the original antigen. B cells are also known to produce cytokines for other
immune cells202. T cells, also express a unique receptor, the T cell receptor (TCR).
The majority of T cells express a TCR composed of an α and a β chains (TCRαβ) and
are divided into two main populations based on the expression of CD4 or CD8 co-
receptors. CD8pos T cells are cytotoxic cells capable of killing neoplastic or infected
cells. CD4pos T cells can have multiple cytokine production profiles and are specialised
in providing help to other cells from the immune system in specific immune responses,
such as the control of antibody production by B cells. A small population of CD4pos
cells is characterised by the expression of the transcription factor FOXP3. These
FOXP3pos regulatory cells control excessive immune activation, thereby preventing
inflammatory diseases and autoimmunity203,204. The remaining T cells express a TCR
composed of a γ and a δ chains (TCRγδ) and are important inflammatory cytokine
producers that also bear cytotoxic activity205.
Specific microenvironments – haematopoietic stem cell niches
To regulate the balance between self-renewal and differentiation, stem cells require
a myriad of environmental signals. Stem cell niches can be defined as tri-dimensional
microstructures in which their cellular and molecular components ensure stem cell
maintenance. The concept of the stem cell niche was first proposed by Schofield in
197882. Since then, many non haematopoietic cell types were described to support
HSC function and were included the haematopoietic stem cell niche127,206-208.
Bone-lining, spindle-shaped N-cadherinpos osteoblasts (SNOs) were the first cells
described to support HSC maintenance, and to form a HSC niche in the bone marrow,
the endosteal niche209,210. This niche has a hypoxic state with low blood perfusion and
is thought to provide HSCs with soluble molecules, such as angiopoetin 1 and
26
thrombopoietin, and membrane-bound signals that regulate quiescence of dormant
HSCs132,136,207. Nevertheless, only 14% of HSCs were found to contact with
endosteum, and many contact with sinusoidal vascular endothelium, leading to the
concept of a perivascular endothelial niche70. Endothelial niches were also suggested
to exist in extra-medullary haematopoiesis sites and to control HSC engraftment. This
niche also supports activated HSCs, by controlling HSCs proliferation, differentiation
and entry into circulation70,207,211. Importantly, the sinusoidal endothelium is also found
near the endosteum, increasing the debate of HSCs niches as separate entities with
different functionalities, or as a rather complex unifying entity with multiple players.
Recently, several other cell types were shown to be part of the HSC niche. CXCL12-
abundant reticular (CAR) cells, an immature progenitor cell that express large amounts
of the chemokine CXCL12, are in contact with all HSCs and appear to be components
of both the endosteal and perivascular niche. CAR cells also form a unique niche with
cells that do not contact with the endosteum or sinusoidal endothelium, the reticular
niche137. Nestinpos mesenchymal stem cells (MSC), which have potential to self-renew
and differentiate into mesenchymal lineages, also express genes involved in HSC
maintenance and are in contact with at least 60% of the HSCs in the BM. Their
depletion leads to a rapidly decrease of HSCs in BM, which is indicative of a common
niche to these two stem cells, or a critical role of MSCs in controlling HSC niches 212.
Using flow cytometry the main cellular HSC niche components can be separated:
endothelial cells are CD45negLinnegCD31posSca1pos cells; osteoblasts are CD45negLinneg
CD31negSca1negCD51pos cells; MSCs are CD45negLinnegCD31negSca1posCD51pos cells
and the remaining population of CD45negLinnegCD31negSca1negCD51neg cells contain
CAR cells that can be selected based on the expression of PDGFRβ206,213. Some
haematopoietic populations, such as macrophages, can also promote the retention of
HSCs in their niches, and their conditional depletion results in HSC mobilization214,215.
In recent years several studies indicated a crosstalk between the nervous and
haematopoietic system in order to keep the balance between regular blood production
in homeostasis and rapid immune responses in conditions of stress216,217. Interestingly,
sympathetic nerve fibres in the BM are associated with cells of the HSC niche, such as
MSCs and osteoblasts. These studies revealed that neurons regulate MSCs and
osteoblast functions, thus indirectly regulating HSC maintenance. Moreover, glial cells
unsheathing autonomic nerves were described to maintain HSC quiescence directly by
activating TGF-β. Therefore cells from the nervous system, namely glial cells, are also
components of the HSC niche212,217-222.
27
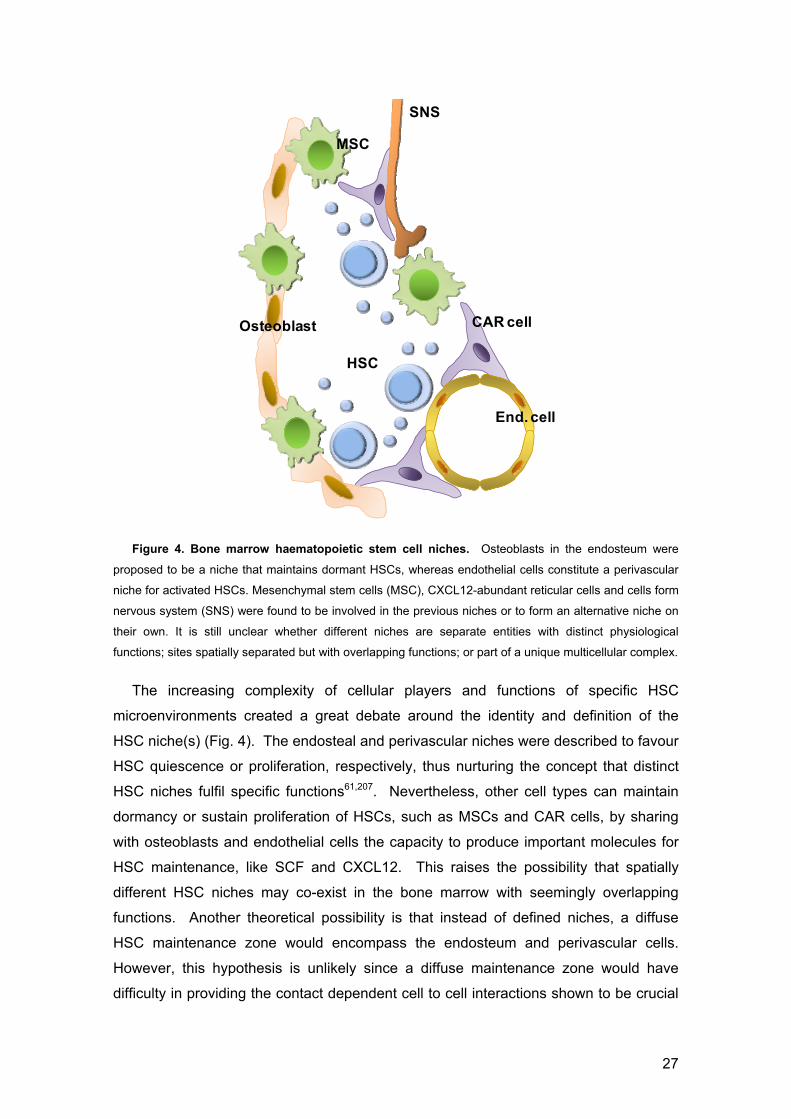
Figure 4. Bone marrow haematopoietic stem cell niches. Osteoblasts in the endosteum were
proposed to be a niche that maintains dormant HSCs, whereas endothelial cells constitute a perivascular
niche for activated HSCs. Mesenchymal stem cells (MSC), CXCL12-abundant reticular cells and cells form
nervous system (SNS) were found to be involved in the previous niches or to form an alternative niche on
their own. It is still unclear whether different niches are separate entities with distinct physiological
functions; sites spatially separated but with overlapping functions; or part of a unique multicellular complex.
The increasing complexity of cellular players and functions of specific HSC
microenvironments created a great debate around the identity and definition of the
HSC niche(s) (Fig. 4). The endosteal and perivascular niches were described to favour
HSC quiescence or proliferation, respectively, thus nurturing the concept that distinct
HSC niches fulfil specific functions61,207. Nevertheless, other cell types can maintain
dormancy or sustain proliferation of HSCs, such as MSCs and CAR cells, by sharing
with osteoblasts and endothelial cells the capacity to produce important molecules for
HSC maintenance, like SCF and CXCL12. This raises the possibility that spatially
different HSC niches may co-exist in the bone marrow with seemingly overlapping
functions. Another theoretical possibility is that instead of defined niches, a diffuse
HSC maintenance zone would encompass the endosteum and perivascular cells.
However, this hypothesis is unlikely since a diffuse maintenance zone would have
difficulty in providing the contact dependent cell to cell interactions shown to be crucial
Osteoblast
MSC
HSC
End. cell
SNS
CAR cell
28
for HSC maintenance. Finally, it is tempting to speculate that only a discrete common
unifying niche would gather the signals from both endosteum and endothelial cells208.
Throughout embryonic development, the generation, expansion and differentiation
of primitive haematopoietic progenitors is thought to depend on interactions between
haematopoietic cells and a myelo-supportive stroma8. In the foetal liver, the cellular
interactions that are established between HSCs and non-haematopoietic cells are not
completely understood. Thus, HSC niches have not been formally defined in this
context8. Nevertheless non-haematopoietic cells in the FL were claimed to support
HSCs and some similarities with adult HSC niche players were described. Cells in the
microvasculature of developing organs, such as YS, FL and placenta were suggested
to form an active HSC niche. In the FL, slowly dividing HSCs with long-term
reconstitution potential were found associated with perisinusoidal endothelial cells, and
these cells were also shown to maintain reconstitution capacity of HSCs in vitro36,124.
Foetal liver hepatocyte progenitors present in the HSC microenvironment were claimed
to be a supportive cell type for HSCs by producing key molecules like IGF2 and
CXCL12 and membrane-bound SCF223. The FL stroma, which consists of cells that
have an epithelial-to-mesenchymal transition phenotype, are an immature cell type that
shares some similarities with MSCs in the BM. FL stroma cells support the expansion
and differentiation of HSC, immature progenitors and lineage committed cells, and
were shown to amplify the repopulation ability of AGM-derived HSCs in vitro224-226.
Other cell types, such as epithelial cells and macrophages, may also directly impact on
HSC function and be part of a yet unidentified niche.

29
T cell development
The thymus is a bilobular organ located in the thoracic cavity near the heart. It has
a compartmentalised structure, forming several microenvironments that support T cell
development. The thymus is constituted by a blood vessel rich cortico-medullary
junction, an outer cortex that finishes in the subcapsular zone, and an inner medulla227.
Surprisingly, small cervical thymi , having a medulla-cortex structure and supporting T
cell development, were found in mice228.
As the thymus does not maintain self-renewing haematopoietic stem cells, the
continuous generation of T cells depends on permanent waves of immigrant foetal liver
or bone marrow-derived progenitors13-15,229-231. Nevertheless, recent reports found
substantial self-renewing capacity of thymic progenitors, suggesting that continuous
colonisation and survival of thymocytes is caused by competition and expulsion of
resident cells by freshly incoming progenitors232,233.
Early immature progenitors in the thymus
Despite several studies addressing T cell lineage commitment, there are still
controversies on the nature of the haematopoietic progenitors that seed the thymus.
Early thymic progenitors (ETPs) have some multilineage potential, since in addition to
strong T cell potential, they can generate NK cells, myeloid cells and dendritic cells.
Interestingly, different studies reported reduced B cell potential, suggesting that CLPs,
which in vitro were shown to have T/B/ILC(NK) potential, migrate poorly to the thymus.
Thus, other immature progenitors, such as lymphoid-primed multipontent progenitors
(LMPPs) or M/T progenitors, must also colonise the thymus. It is only inside the thymic
compartment that T cell lineage restriction occurs43,234,235. Nevertheless, genetic fate
mapping studies with IL-7Rα reporter mice, showed different origins of T and myeloid
cells, dissociating differentiation potential from in vivo developmental relevance236.
Immature thymic progenitors lack expression of lineage-associated co-receptors that
characterise mature T cells, CD4 and CD8, thereby being defined in the thymus as
double-negative cells (DN). Using CD44 and CD25 markers, DN cells can be further
divided into four progressive developmental stages, which are designated DN1
(CD4negCD8negCD44posCD25neg), DN2 (CD4negCD8negCD44posCD25pos), DN3 (CD4neg
CD8negCD44negCD25pos) and DN4 (CD4negCD8negCD44negCD25neg). However, only a
minority of cKitposCD24neg cells inside the DN1 population are thought to be colonising

30
cells with a foetal liver or bone marrow origin235. Seeding of the embryonic thymus by
haematopoietic progenitors occurs around E13.5 and few thymocytes are beyond the
DN stage until E16.5237. Full maturation of αβ T cells is residual before E19.5, but some
unique γδ T cell populations are produced exclusively at these foetal stages205,237.
Immature progenitors enter the thymic compartment in the cortico-medullary
junction. Once in the thymus, DN1 and DN2 cells enter a coordinated migration
through the thymic cortex toward the subcapsular zone. In this process, thymic
progenitors proliferate extensively, progressively loose the potential to generate
myeloid cells, NK cells and dendritic cells, and initiate TCR gene rearrangements228,235.
This process is driven by several cytokines, chemokines and adhesion molecules in the
thymus stromal cells. The commitment from immature progenitors to T cells is critically
dependent on Notch signalling, especially before TCR signals205,227,235,238. By the DN3
stage, T cell commitment is complete; thymocytes stop proliferating and dramatically
increase rearrangement of the TCR β, γ and δ genes, which will lead to β or γδ
selection (Fig. 5).
T cell lineages – αβ and γδ fate choice
The transition to DN3 thymocytes marks an important step in T cell development.
Thymocytes stop proliferating and start generating productive TCR products.
Rearrangements in the Tcrg, Trcb and Tcrd locus will generate the first separation in
the T cell lineage, as TCRγ and TCRδ chains heterodimerise generating γδ T cells –
γδ-selection – whereas TCRβ associate with germline encoding pre-TCRα (pTα) to
form pre-TCR complex – β-selection239. DN3 thymocytes can be divided into a DN3a
subset, with low expression of CD27 that did not yet pass TCR selection, and CD27high
DN3b cells, which are TCRγδ or β-selected cells240. Post-selection DN3 thymocytes
receive multiple survival and proliferative signals form cortex stromal cells such as the
activation of integrins and TCR/preTCR complex itself227. Although both TCRαβ and
TCRγδ share the same CD3 signalling complex, the initial signalling from TCRγδ and
pTα-TCRβ differ in their outcomes, initiating two different developmental programs.
Indeed signalling-strength and TCR-Notch synergy models have been used to explain
αβ (weak TCR signals and favoured by Notch signalling) or γδ (strong TCR signals) T
cell lineage choice205,241.

31
Figure 5. T cell developmental stages. Cross-section through an adult thymic lobule showing the
migration path of haematopoietic precursors during T cell development. Immature progenitors enter the
thymus through blood vessels near the cortico–medullary junction, and migrate to the outer rim of the
thymic cortex, the subcapsular zone, finishing the T cell commitment. After TCR gene rearrangement
TCRγδpos T cells are generated and TCRβ-selected cells start a reverse migration towards the thymic
medulla, becoming CD4/CD8 double positive (DP) cells. This allows positive and negative selection to
occur, generating mature CD4pos and CD8pos TCRαβpos T cells. Dashed arrows depict proposed
developmental outcomes of immature progenitors and alternative generation pathways for γδ T cells
(adapted from Rothenberg et al 2008235).
γδ-selected DN3 cells do not proceed to DN4 and DP stages characteristic of β-
selected cells, but instead enrol a distinct developmental program. Contrary to β-
selected cells, γδ-selected DN3 cells critically depend on IL-7 signalling but are less
depended on Notch signalling. They also diverge in their proliferative kinetics and in
the expression of activation markers such as CD5240. Differentiation of γδ T cells
requires, among different signals, the transcription factor SOX13, trans conditioning
lymphotoxin mediated signals by αβ DP cells and CD27 signals242-244. This result in the
generation of fully functional γδ T cells that are imprinted already in the thymus with
effector cytokine profiles as CD27pos IFN-γ producers or CD27neg IL-17-producing γδ T
cells. Interestingly, the generation of tissues-specific γδ T cells subpopulations bearing
monoclonal or oligoclonal TCR rearrangements are produced exclusively in the
embryo205,241,245.

32
From β-selection DN3 cells progress to DN4, which upregulate CD8, becoming first
immature single positive (ISP or ImmCD8) and then CD4 positive, forming a double-
positive population (DP), responsible for the generation of αβ T cells. DP thymocytes
start a inward migration through the cortex from the subcapsullar zone towards the
medulla227. In this DP state thymocytes stop cell division, possible waiting for the next
developmental check point, avoiding uncontrolled growth of non-functional T cells.
αβ T cell populations – CD4 and CD8 T cells
DP cells are thymocytes that received survival and differentiation signals from pre-
TCR complex after successful TCRβ-seletion. In this state they start and complete the
Tcra rearrangement, being the first thymocytes to generate an αβ TCR239. As DP cells
do not receive surviving signals from cytokines, αβ TCR signalling is critical for survival
and maturation of DP cells, which die by neglect if their TCR is not capable of engaging
peptide-loaded MHC class I or class II molecules – a process called positive
selection246-248.
Apart from positive selection, the specific TCR-MHC interactions dictate the critical
divergence in the two main αβ T cell populations, CD4pos helper T cells and CD8pos
cytotoxic T cells. DP cells with TCR restricted to MHC class I (MHC I) differentiate into
CD8 T cells whereas signals through MHC class II (MHC II) restricted TCR results in
the differentiation into CD4 T cells249. Consistent with this fact, differentiation of other
αβ T cell populations from DP thymocytes, like NKT cells, also require specific
interactions with MHC-like molecules, such as CD1d, which present glycolipid
antigens250.
Several models have been postulated to explain CD4/CD8 lineage choice and the
generation of CD4 and CD8 single positive (SP) cells. The first classical models,
stochastic and instructional models, couple lineage commitment and positive selection
induced simultaneously by TCR signals. The stochastic model suggests that during
positive selection DP cells randomly terminate expression of one of the co-receptors.
Consequently, only thymocytes that express the appropriate co-receptor for their TCR
will receive the required maturation and survival signals203. The instructional models
postulate that the strength/duration of TCR signals in the positive selection directs DP
cells to CD8SP or CD4SP, with weak/short interactions of TCRs with MHC I molecules
engaging a CD8 fate, while strong/long MHC II-TCRs interactions drive CD4

33
differentiation203. More recently a kinetic model proposes that positive selection is
dissociated from the CD4/CD8 choice. These processes would be sequential rather
than simultaneous, and lineage choice would be determined by TCR signal duration
balanced by cytokines from common cytokine receptor γ-chain (γc) family, particularly
IL-7. According to this model, positive selecting TCR signals, derived either by MHC
class I or MHC class II molecules, terminate Cd8 gene transcription, which makes DP
thymocytes acquiring a CD4posCD8low phenotype. If TCR signals persist in the absence
on CD8, IL-7 signalling is inhibited and thymocytes differentiate into CD4pos T cells. If
TCR signalling ceases, IL-7 signalling is induced and thymocytes differentiate into
CD8pos T cells – a process called co-receptor reversal. As co-receptor reversal occurs
in cells that no longer receive TCR signals, γc cytokines such IL-7 are critical for their
survival203.
From the cortex, early SP cells leave for the last part of their journey in the medulla,
where they receive the signals to become mature CD4 and CD8 T cells that can then
be exported to peripheral tissues. At this point, potentially self-reactive thymocytes are
eliminated from the thymocyte pool by a process called negative selection248,251. This
occurs when thymocytes receive signals from a TCR that engages a peptide–MHC
ligand with high affinity. Nevertheless, although less frequent, negative selection can
also occur in the thymus cortex. Contrary to pro-survival signals received by low
affinity TCR-MHC in positive selection, this strong TCR signals lead to activation of
apoptotic pathways resulting in cell death . The elimination of thymocytes that
recognise self antigens requires the expression and presentation of tissue-specific
antigens in the thymus environment. This is accomplished by medullary thymic
epithelial cells, as well as cross-presentation by dendritic cells. Moreover, it was
proposed that negative selection also requires second co-stimulatory signals251. Thus,
by deleting auto-reactive thymocytes, a largely self-tolerant peripheral T-cell repertoire
is generated.
The relatively few auto-reactive T cells that evade thymic negative selection are
actively controlled by tolerance mechanisms that depend on regulatory cells.
Interestingly, the main regulatory cells are FOXP3pos regulatory T cells (Treg), which are
generate in the thymus from cells that bear TCR with intermediate self-reactivity and
affinity to peptide–MHC ligand204.
After receiving final maturation signals from thymic stromal cells, newly generated T
cell populations are exported from the thymus to secondary lymphoid organs and
peripheral tissues where they will exert their functions.

34
RET tyrosine kinase receptor
Since its discovery, the tyrosine kinase receptor RET has been critically implied in
spermatogenesis and embryonic development of kidneys, nervous system and enteric
lymphoid organogenesis, controlling important biological processes such as growth and
differentiation, cell survival, migration and chemotaxis252-257.
The Ret locus, encoding the RET receptor, was identified as a proto-oncogene by
Takahashi and colleagues in 1985, and encodes a tyrosine kinase receptor family
member258-260. The name Ret stands for rearranged during transfection, as this gene
was identified as rearranged gene segments within a NIH 3T3 fibroblast cell line that
was transfected with human lymphoma DNA. The subsequent gene product encodes
for a fusion protein with a dimerizing motif in the N-terminal region fused with the RET
tyrosine kinase domain leading to kinase activation.
RET is composed of three main domains: an extracellular N-terminal domain that
has four cadherin-like repeats with calcium binding sites and a cysteine rich region ; a
transmembrane domain with two hydrophobic regions; and a cytoplasmatic C-terminal
domain, with two tyrosine kinase subdomains259-262. In humans, the cytoplasmatic
domain can have different isoforms that differ in their C-terminal amino acids: RET9;
RET43 and RET51263,264. The most studied isoforms, the short isoform – RET9 – and
the long isoform – RET51 – are conserved among vertebrates, including mice, and
although sharing the same extracellular binding domain, they generate different
signalling complexes, do not associate with each other, and control distinct biological
processes. Indeed, only ablation of the short isoform cause similar phenotype in
kidney and nervous system as the complete mutation of Ret and forced expression of
Ret9 can rescue Ret deficient mice253,265-267.
The RET extracellular domain has the capacity to bind different RET ligands. RET
functions as the receptor for the glial cell line-derived neurotrophic factor (GDNF) and
its family ligands (GFLs), also called RET-ligands. In order to signal through RET,
GFLs associate with GDNF family receptor-alpha (GFRαs) receptors268,269.
Nevertheless, the RET extracellular domain has cadherin-like repeats with calcium
binding sites, crucial for cadherins homophilic adhesions. Thus RET is also a distant
member of the cadherin superfamily. This property raised the hypothesis that RET
may have adhesion functions as a ‘sensing’ cadherin262,270. Despite the fact that a
direct adhesion-derived signalling was not yet found, a recent report showed that the
cleaved extracellular portion of RET, deprived of its kinase domain, can act as a

35
cadherin accessory protein stabilising N-cadherin, resulting in increased cell
adhesion271. Interestingly, it was also shown that RET kinase receptors physically
interact in their extracellular domain with protocadherins (Pcdhs) complexes, stabilising
Pcdhs intracellular domains. In turn, Pcdhs stabilise RET activation by GFLs and delay
RET degradation, specially the fast degrading RET51 isoform272.
Increasing the complexity of its interactions and signalling axes, it was recently
found in motor neurons that RET bound to ephrin-A, functions as a receptor driving
reverse signalling in the ephrin-A:ephrin-A receptor (Eph) system. Moreover RET
integrates both ephrin-As and GFL signals to achieve optimal neuronal function273.
Interestingly RET was also shown to induce apoptosis by a ligand-independent
mechanism, acting as a dependence receptor. In the absence of its cognate ligands,
RET can be cleaved by proteases, like caspases, exposing an intracellular pro-
apoptotic domain that drives apoptosis through p53 pathway274-276. Nevertheless GFL-
RET signalling was described to have anti-apoptotic effects. Thus, at least in several
cell lines in vitro and in somatotrophs in adenopituitary gland in vivo, RET acts as a
switch receptor that balances survival and apoptosis based on GFL availability.
GDNF family ligands
The RET tyrosine kinase was identified as the signalling receptor for the
neurotrophic factor GDNF, a distant member of TGF-β superfamily. However, GDNF
does not bind directly to RET and instead requires the formation of heterodimeric
complexes with the GDNF family receptor alpha (GFRα1), a
glycosylphosphatidylinositol (GPI)-linked cell surface receptor277-280. Other GDNF
family members (GFLs) were identified: neurturin (NRTN); artemin (ARTN) and
persephin (PSPN), and their productive activation of RET was shown to depend on
specific GPI-linked co-receptors, GFRα2, GFRα3 and GFRα4, respectively (Fig. 6a)281-
288. Despite the GFL-GFRα-RET high specificity, some degree of crosstalk was found
in vitro between GDNF, NRTN and ARTN and the co-receptors GFRα1, GFRα2 and
GFRα3285-288.
The original model for the initiation of GFL signalling complexes indicates that a GFL
homodimer binds to GFRα co-receptors, sequentially the GFL-GFRα complex brings
together two RET molecules, thereby inducing RET homodimerization and tyrosine
autophosphorylation, which then allows the assembly of intracellular signalling

36
components (Fig. 6b). Nevertheless, weaker interactions between RET and GFRαs
can also occurs in the absence of GFLs268,269. GFRα co-receptors are GPI-linked
membrane bound proteins that locate to lipid rafts, where they recruit RET for efficient
downstream signalling – signalling in cis289,290. Nevertheless, soluble forms of co-
receptors originated from enzyme cleavage or alternative splicing, are produced by
many cell types and are capable of activate RET with delayed kinetics – trans
signalling284,291,292. Activation of RET in trans is slower, but more sustained than in cis
activation, and may first occur outside lipid rafts. Ligand-activated RET associate with
different adaptor proteins depending on its localization outside or within the lipid rafts,
which in turn influences the intracellular signalling pathways activated by GFLs268,269.
In vitro studies in neurons suggested that GFRα signalling in cis and trans may
cooperate in the same cells for optimal effects of GFLs signals291,293. Nevertheless,
trans signalling in neurons has a reduced physiological relevance in vivo, since mice
that express GFRα1 in all RETpos cells but lack GFRα1 in other cells (Gfra1-/-.Ret+/Gfra1
mice), thus enabling only high affinity cis signalling, have a normal phenotype with no
developmental nervous problems even in processes where trans signaling has been
shown in vitro294. Strikingly, haematopoietic cells in the gut that express RET but lack
GFRa co-receptors rely on GFRas provides by neighbour cells and therefore employ
RET signalling in trans256,295.
All GFLs are thought to activate the same downstream signalling pathways, since
the kinetics of binding and RET activation in the four key tyrosine residues (Y905,
Y1015, Y1062, and Y1096 exclusively in the RET51 long isoform) is similar for all
GFLs-GFRαs pairs293. Nevertheless, a selective recruitment of signalling partners by
GFL-GFRα complexes cannot be excluded since the RET intracellular domain has 1
serine residue and 16 or 18 tyrosine residues in the short and long RET isoforms,
respectively. Moreover, even the same phophorylated residues can assembly different
adaptors that produce distinct biological responses. Importantly, the fact that each
GFRα has a unique developmentally regulated tissue specific expression pattern
indicates that despite the detected in vitro crosstalk, each GFL-GFRα pair has non-
redundant roles in vivo, which is confirmed by the very different outcomes from specific
ablation of each GFL or GFRα268,269.
Recently, two mechanisms of RET-independent GFL signalling were discovered for
GDNF and its specific co-receptor GFRα1. In RET-deficient neurons that express
GFRα1, GDNF triggers induction of Fos, Src family kinases (SFKs) activation and
phosphorylation of phospholipase C-γ (PLC-γ), mitogen-activated protein kinases
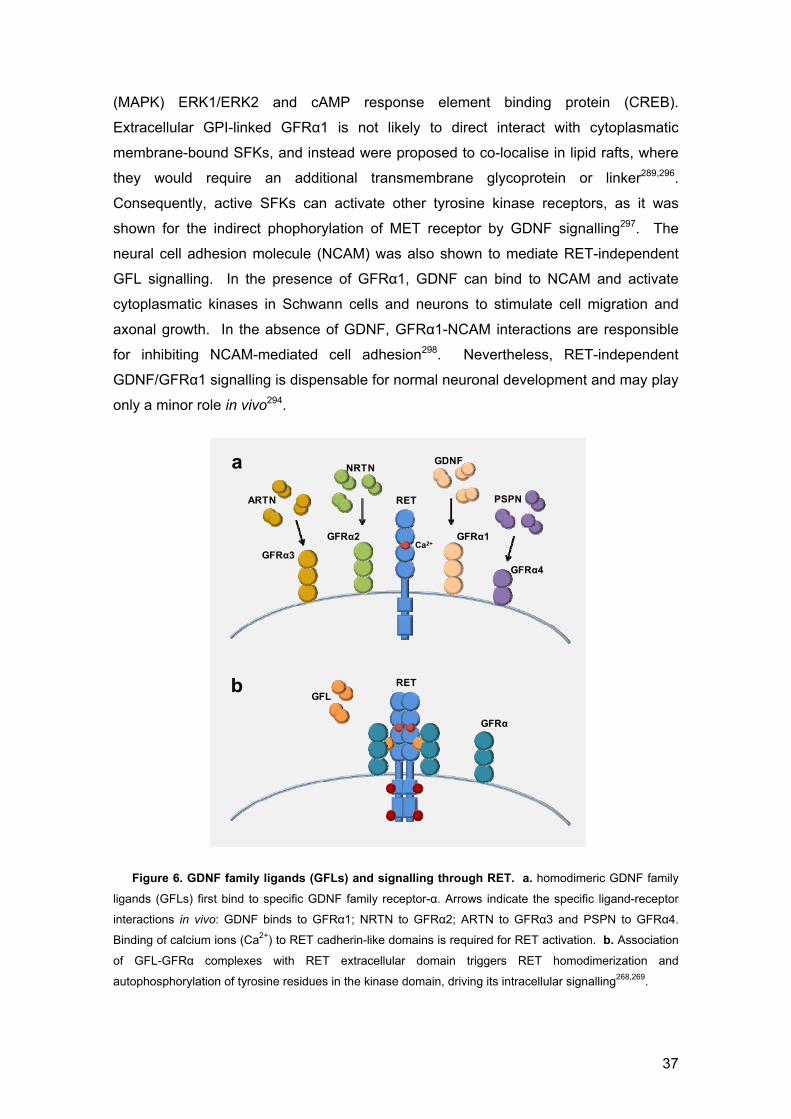
37
(MAPK) ERK1/ERK2 and cAMP response element binding protein (CREB).
Extracellular GPI-linked GFRα1 is not likely to direct interact with cytoplasmatic
membrane-bound SFKs, and instead were proposed to co-localise in lipid rafts, where
they would require an additional transmembrane glycoprotein or linker289,296.
Consequently, active SFKs can activate other tyrosine kinase receptors, as it was
shown for the indirect phophorylation of MET receptor by GDNF signalling297. The
neural cell adhesion molecule (NCAM) was also shown to mediate RET-independent
GFL signalling. In the presence of GFRα1, GDNF can bind to NCAM and activate
cytoplasmatic kinases in Schwann cells and neurons to stimulate cell migration and
axonal growth. In the absence of GDNF, GFRα1-NCAM interactions are responsible
for inhibiting NCAM-mediated cell adhesion298. Nevertheless, RET-independent
GDNF/GFRα1 signalling is dispensable for normal neuronal development and may play
only a minor role in vivo294.
Figure 6. GDNF family ligands (GFLs) and signalling through RET. a. homodimeric GDNF family
ligands (GFLs) first bind to specific GDNF family receptor-α. Arrows indicate the specific ligand-receptor
interactions in vivo: GDNF binds to GFRα1; NRTN to GFRα2; ARTN to GFRα3 and PSPN to GFRα4.
Binding of calcium ions (Ca2+) to RET cadherin-like domains is required for RET activation. b. Association
of GFL-GFRα complexes with RET extracellular domain triggers RET homodimerization and
autophosphorylation of tyrosine residues in the kinase domain, driving its intracellular signalling268,269.
GDNF
GFRα2 GFRα1
RET
GFRα3
NRTN
ARTN PSPN
GFRα4
Ca2+
RET
GFL
GFRα
a
b

38
RET signalling axes
RET activates several signalling cascades such as Ras/ERK; PI3K/Akt; PLC-γ;
JAK/STAT; JNK, p38MAPK and ERK5. Activated RET has multiple phophorylated
tyrosine residues that have different functions. Phophorylation of Y905 stabilises the
kinase conformation and facilitates the autophosphorylation of other C-terminal tyrosine
residues. This residue is also a docking site for Grb7/10 adaptors299. Y752 and Y928
were described to be a docking site and activate STAT3300. Phosphorylation of Y981
results in binding and activation of SFKs that have been implied in survival and
migration processes301. PLC-γ interacts with RET in the Y1015, and deficiencies in
Y1015 result in defective kidney development302,303. Activation of PI3K/Akt pathway
can be achieved by phosphorylation of Y1096, one of the two tyrosine residues that are
only present in the RET51 isoform304. Apart from tyrosine phosphorylation, serine
phosphorylation in S697 residue is also critical for activation of JNK pathway and the
lack of S697 results in enteric nervous system defects and impairs lamellipodia
formation305,306.
Y1062 is possibly the most important residue in RET kinase domain, since it acts as
a multidocking binding site for many adaptor and effector proteins. Phosphorylation of
Y1062 is the most studied RET activation site and results in the activation of Ras/ERK;
PI3K/Akt; JNK, p38MAPK and ERK5 intracellular signalling pathways. This leads to
activation of important transcription factors responsible for the pleiotropic effects of
RET signalling such cAMP response element binding protein (CREB) and NF-κB304,307.
Activation of these signalling pathways results in survival, proliferation and
differentiation programs downstream of RET, which are also implicated in neoplastic
diseases associated with increased or constitutive RET function268,269,308. Surprisingly,
in addition to its role in cell development and maintenance, RET was also shown in
vitro to have a role in stress response pathways, driving the expression of heat shock
protein (Hsp) family members309.
Deregulation of RET signalling
Ret mutations that result in deregulated RET signalling are responsible for several
human pathologies. Hirschprung’s disease (HSCR) is a multigenic disorder of neural
crest development characterised by reduction or absence of autonomic neuronal
ganglia in the colon – colonic aganglionosis – which results in a life-threatening
39
condition of severe constipation and intestinal obstruction in neonates and megacolon
in children and adults. RET loss-of-function dominant mutations, both in the tyrosine
kinase domain and in the extracellular domain, were implicated in the majority of
familial HSCR cases310,311. These mutations result in the unresponsiveness to GDNF
and impairment of neuronal migration. In mice, a dominant negative mutation in Ret
(Ret+/DN) causes intestinal hypoganglionosis and aganglionosis in the distal intestine
similar to HSCR disease in humans254. Accordingly, mice homozygous for a null
mutation of Ret (Ret-/-) are completely deprived of enteric neurons throughout the
digestive tract, and also show renal agenesis, confirming RET requirement for enteric
neurogenesis and kidney organogenesis253.
Over expression, gain-of-function mutations and production of aberrant forms of
RET are associated with oncogenesis312. Somatic chromosomal rearrangements
involving the Ret gene were found to cause papillary thyroid carcinoma (PTC), one of
the most common types of thyroid malignancies312,313. These rearrangements lead to
generation of chimeric oncogenes, designated as RET/PTC, as a result of fusion of the
RET tyrosine kinase domain with the 5′-terminal regions of heterologous genes314,315.
Similarly, translocation of the Ret kinase domain with genes encoding transmenbrane
receptors like Bcr and Fgfr1 were also found to contribute to chronic myelomonocytic
leukaemia316. The generated oncogenes can cause malignancy by multiple
mechanisms: substitution of Ret regulatory elements by the one of the 5′-terminal gene
results in ectopic Ret expression in cells where it is normally silent; or constitutive
activation of RET kinase domain in the generated oncogenes, since many of the fusion
partner genes have dimerizing domains. Finally, if the 5′-terminal gene has regulatory
or anti-tumour roles, its normal function will be disrupted as it occurs with the RET/PTC
chimeric oncogene269.
Familial cancer syndrome of multiple endocrine neoplasia type 2 (MEN 2) is also
caused by germline activating point mutations of Ret that are inherited in an autosomal
dominant manner. MEN 2 can be divided into three variants, with different genetic
alterations and clinical outcome: MEN 2A, MEN 2B, and familial medullary thyroid
carcinoma (FMTC) 312,314. Medullary thyroid carcinoma (MTC), which is a malignant
tumour arising from calcitonin-secreting parafollicular C cells, is the central feature of
MEN 2 syndromes. In addition, MEN 2A is also characterised by pheochromocytoma
and parathyroid hyperplasia or adenoma, although rare manifestations can include
cutaneous lichen amyloidosis, a pruritic cutaneous lesion, and intestinal aganglionosis
as in HSCR. FMTC is the least aggressive of the MEN 2 subtypes and consist on

40
MTC, with rare cases of associated HSCR317-319. The mutations that cause MEN 2A
and FMTC are similar, and in most cases cause a substitution of a cysteine residue,
particularly in the extracellular domain, but rarely additional cysteine residues can be
generated by base pair duplication. The generation of an unpaired cysteine forms an
activating intermolecular bridge that result in ligand-independent dimerization and
constitutive activation of RET. Moreover, some mutations can reduce cell surface
localization269. MEN 2B is the most aggressive of the MEN 2 variants and is
characterized by early MTC onset associated with pheochromocytoma, and less
frequently with developmental abnormalities as intestinal and mucosal
ganglioneuromatosis, ocular and skeletal abnormalities317. Approximately 95% of the
MEN 2B mutations are highly specific methionine to threonine substitutions in the
position 918. MEN 2B mutations also cause constitutive activation of RET, but were
proposed to alter the quality of RET intracellular signals by modifying substrate
specificity. Contrary to MEN 2A, MEN 2B ligand-independent activation of the kinase
occurs without causing a constitutive dimerization of RET molecules. Furthermore
RET ligands can induce dimerization or RET MEN 2B molecules, further enhancing
kinase activity, which can explain the aggressiveness of MEN 2B syndrome269. Finally,
several mice models with altered RET residues present many developmental
malformations and oncogenic transformations that mirror MEN 2 syndromes, although
less aggressive than in humans269,320.
Role of RET in the haematopoietic system
RET signalling functions have been intensively explored in nervous system
development and maintenance, but it has also been shown that RET controls critical
events in other systems, such as kidney development and spermatogonia
differentiation. Increasing evidence has highlighted striking similarities between the
nervous and the immune system, such as complex membrane synapse and
establishment of memory cells216,217. Interestingly, receptors for neurotransmitters were
found in human HSCs, fostering the concept of active crosstalk between nervous and
haematopoietic cells and unveiling putative common molecular pathways used by
these two systems221.
The tyrosine kinase receptor RET belongs to the same family as cKit, Tie2 and Flt3
receptors. These receptors are critical for proliferation, differentiation, migration and
survival of several haematopoietic progenitor cells. During embryonic development,

41
RET is expressed by haematopoietic lymphoid tissue initiator cells (LTin) and is
essential for Peyer’s patch organogenesis256. These LTin cells are attracted by GFLs
and RET signalling cause changes in motility of LTin cells, resulting in adhesion-
dependent cell arrest that induces maturation of non-haematopoietic stromal cells ,
thus initiating the priming events that lead to the formation of Peyer’s patches295.
Interestingly, this is the only process where RET signalling in trans has a physiological
relevance in vivo, since haematopoietic cells in the gut express RET but lack GFRa co-
receptors and rely on GFRas provided by neighbouring cells256,295.
In the embryo, expression of Ret was observed in the developing liver and was
suggested to be restricted to cells from haematopoietic origin, since the adult liver do
not express Ret321. Sequentially, Ret expression was also shown in the thymus, spleen
and lymph nodes of young and adult rats, as well as in bone marrow haematopoietic
cells322,323. In the bone marrow, stromal cells were also shown to express RET
signalling partners, Gfra1, Gfra2, Gdnf and Nrtn, strongly suggesting a broader role of
RET in the haematopoietic system323,324. Although with unknown functions, expression
of Ret and Gfra co-receptors was already described in many human haematopoietic
cells populations, from CD34pos haematopoietic progenitors, to mature monocytes, T
cells and B cells324-326.
As a proto-oncogene, RET activation can lead to malignancies, like in the cases of
multiple endocrine neoplasias type 2. Moreover Ret expression was detected in
multiple leukaemia/lymphoma cell lines and in primary haematopoietic malignancies,
uncovering a possible impact of deregulated RET signalling in the establishment of
haematological cancers316,323,324,327-329. Interestingly forced activation of RET in
immature Linneg progenitors was found to drive differentiation to monocyte/macrophage
lineage that ultimately lead to leukaemia, uncovering a possible function of RET in
myeloid cell differentation316.
Previous studies have indicated RET expression in diverse steps of lymphocyte
differentiation. Ret expression was shown to be tightly regulated in B cell development.
It is already detected in the most immature B cell progenitor, pre-Pro-B cell, and
increase until the late Pro-B/large Pre-B stage. Thereafter its expression decreases
until the mature B cell stage in the BM. Interestingly, this tightly regulated reduction of
Ret expression was proposed to depend on productive immunoglobulin
rearrangements of both heavy (Igμ) and light (Igκ) chains, as Pro-B cells generated in
recombination-deficient mice, SCID and Rag1-/-, have a 3-fold induction of Ret
expression compared to wild-type mice, a phenotype rescued if SCID and Rag1-/- had μ
42
and κ transgenes330. Strikingly, forced expression of constitutively activated Ret
oncogene under the enhancer of immunoglobulin heavy chain (Eμ-Ret mice), active in
Pro-B cells, results in increased proliferation of foetal B-cell progenitors, expansion of
immature progenitors in the BM, impairment in the elimination of late Pro-B cells with
non-productive immunoglobulin rearrangements and cell cycle and apoptosis
disturbances, which give rise to B cell precursor leukaemia328,329. Notwithstanding,
whether RET signalling plays a role in normal B cell development is still unclear.
Expression of Ret, Gfra1 and Gdnf was also detected in the foetal and adult thymus.
Gfra1 and Gdnf expression were found respectively in thymocytes and thymic stromal
cells, suggesting an involvement of GFL signalling in T cell development331. E14.5
foetal thymocytes strongly express Gfra1, but this gene expression is thereafter
reduced in adulthood, remaining only in the double negative (DN) stage of T cell
development. Furthermore, GNDF was proposed to provide thymocyte growth and
survival without affecting cell differentiation. Nevertheless, it is still unclear whether
RET signals are required for proper thymopoiesis in vivo.
Taken together, numerous observations have suggested a possible broad role of
RET in haematopoietic cell biology, but the precise consequences and molecular
mechanisms of these putative functions are poorly understood.

43
AIMS OF THIS THESIS
For proper haematopoiesis, HSCs need to regulate the delicate balance between
maintenance, self-renewal and differentiation. To achieve that HSCs require multiple
soluble and contact-dependent signals provided by the HSC microenvironments127.
Previous studies have demonstrated a key role of several tyrosine kinase receptors in
controlling different haematopoietic stem cell functions. Tyrosine kinase receptors
respond to many different cytokines and growth factors, such SCF and angiopoetin,
which in HSCs control processes of survival, self-renewal, quiescence proliferation and
differentiation. Interestingly, it was shown that RET signals are crucial for enteric
lymphoid organogenesis256. Moreover, expression of the tyrosine kinase receptor RET
and its neurotrophic factor ligands, was previously described in primary lymphoid
organs and immune cells, and a function on thymocyte survival and maturation was
also suggested321-331. Nevertheless, the role of RET in HSC function and thymocyte
development, in vivo remains totally unexplored.
In this thesis, we aimed at determining the role of RET in HSC function and
thymopoiesis. By analysing loss and gain of function mouse models of Ret we
characterized the impact of RET in HSC function in normal haematopoietic
development and stressful conditions253,320. We then aimed to understand how
manipulation of RET signalling influences transplantation protocols in order to favour
critical HSC responses.
Despite an increased survival of GDNF-treated thymocytes, the physiological
relevance of GFL signalling in T cell development in vivo remains elusive331.
Therefore, we aim to dissect the role of RET signalling in foetal and adult T cell
differentiation and understand the differential contribution of GFLs and GFRα co-
receptors in this process.
Similarities between the haematopoietic system and the nervous systems were
recently highlighted, as cells from both systems share common features216. With our
work we aim to understand how the neurotrophic receptor RET is used by
haematopoietic cells in order to orchestrate their function, thus shedding light into
unexpected regulatory mechanisms used to control haematopoiesis.

45
THE NEUROTROPHIC FACTOR RECEPTOR RET DRIVES
HAEMATOPOIETIC STEM CELL SURVIVAL AND FUNCTION
Diogo Fonseca-Pereira, Silvia Arroz-Madeira, Mariana Campos, Inês Barbosa, Rita
G. Domingues, Afonso R. M. Almeida, Hélder Ribeiro, Alexandre Potocnik and
Henrique Veiga-Fernandes
Abstract
Haematopoiesis is a developmental cascade that generates all blood cell lineages in
health and disease. This process relies on quiescent Haematopoietic Stem Cells
(HSCs) capable to differentiate, to self renew and to expand upon physiological
demand61. However, the mechanisms regulating HSC homeostasis and function
remain largely unknown. Here we show that the neurotrophic factor receptor RET is
critical to HSC survival and function. We found that RET signalling molecules are
expressed by HSCs and Ret ablation leads to reduced HSC numbers. Despite normal
differentiation potential, RET null progenitors exhibit loss of in vivo stress response and
reconstitution potential, being rapidly exhausted. Strikingly, RET signals provide HSCs
with critical Bcl2 and Bcl2l1 surviving cues, downstream of p38/MAP kinase and CREB
activation. Accordingly, enforced expression of RET down-stream targets, Bcl2 or
Bcl2l1, is sufficient to restore the activity of Ret null progenitors in vivo. Remarkably,
activation of RET results in improved HSC survival and in vivo transplantation
efficiency, thus opening new horizons to the usage of RET agonist in HSC expansion
and transplantation protocols. Finally, our work shows that RET is an essential cell-
autonomous regulator of HSCs function, revealing neurotrophic factors as novel
components of the HSC microenvironment.

46
Methods
Mice: C57BL/6J (CD45.2 and CD45.1), Rag1-/- (CD45.2 and CD45.1)332, Vav1-
iCre333, Gfra1-/- 334, Gfra2-/- 335, Gfra3-/- 336, RetMEN2B 320 and Ret-/- 253 were on a C57BL/6J
genetic background. All mice strains were bred and maintained at IMM animal facility.
Animal procedures were performed in accordance to national and institutional
guidelines.
Generation of Ret conditional knockout mice: To generate mice harbouring a
conditional Ret knock-out allele we engineered a targeting construct that firstly,
included the introduction of a floxed 2.1 kb, Neomycin resistance (Neor) cassette under
the control of the phosphoglycerate kinase-1 (PGK) promoter and a polyA tail (pA).
This cassette (PGK-NEOr-pA) was inserted approximately 4.5 kb upstream at the Xho I
site of the pBluescript KS (pBS KS) vector that carried approximately 13 kb of the 5’
end of mouse Ret genomic locus flanking exon 1. The second modification included an
insertion of a loxP ~ 2.5 kb downstream of exon 1, at the Hind III site in the intron
between exons 1 and 2 of the mouse Ret locus. Finally, a viral thymidine kinase
cassette (~3 kb) under the control of the PGK promoter (PGK-TK-pA) was inserted at
the Hind III site ~5kb downstream of the inserted LoxP site. To obtain homologous
recombination, this targeting construct was linearised by Xho I, purified by gel elution
and extraction using the Qiaquick gel extraction kit (Qiagen), prior to electroporation
into 129SvJ-derived R1 ES cells grown on mouse embryonic fibroblast (MEF) feeder
layers. Following double selection with 300µg/ml Geneticin (G418, Invitrogen) and
2µM Gancyclovir (Sigma), positive clones were identified by Southern blotting.
Genomic DNA was digested with Hind III restriction enzymes and a 5’ external probe of
500bp (see figure) was used to screen for positive clones. With the Hind III digest the
WT and mutant alleles showed a band size of 16.5 kb and 6 kb respectively. Positive
animals were subsequently crossed with transgenic mice expressing Vav1-iCre333 in
order to delete the PGK-NEOr-pA cassette. This recombination resulted in generating
the floxed Ret mice wherein the two remaining LoxP sites were found flanking the first
exon of the Ret locus, or the complete deletion of the first exon. These mice are further
designated as Ret floxed (Retfl) and Ret null (Retnull). Mice were further screened by
PCR. Primer sequences were: P1: AAG CTC CCT CCT ACC GTG CT; P2: TGG GAT
GAA CTC TGC CCA TT; P3: TGC TGC TCC ATA CAG ACA CA; P4: TAC ATG CTG
TCT GCT CTC AG.
Colony-Forming Units assays and homing capacity: 5x10³ E14.5 LinnegcKitpos
cells MACS purified (Miltenyi Biotec) from WT, Ret-/- or RetMEN2B were cultured in

47
M3434 (Stem Cell Technologies) and scored at day 8 to 10 by flow cytometry and
microscope analysis. 3x10⁴ E14.5 LinnegcKitpos cells were MACS (Miltenyi Biotec)
purified from WT, Ret-/- or RetMEN2B and were injected into lethally irradiated mice (9Gy)
and CFU-s scored at day 8 or 12 by flow cytometry and microscope analysis. Homing
assays were done using E14.5 LinnegcKitpos cells labelled with CMTMR, injected into
lethally irradiated mice. Flow cytometry analysis was performed 20h post-injection.
Transplantation experiments: For reconstitution experiments with foetal liver,
1x10⁵ E14.5 LinnegcKitpos cells MACS purified from WT, Ret-/- or RetMEN2B were injected
alone or in direct competition (1:1 ratio) into lethally irradiated Rag1-/- CD45.1 mice.
For the 3:1 ratio 1.5x10⁵ WT CD45.1/CD45.2 cells were co-injected with 0.5x10⁵ Ret-/-
CD45.2 cells; for the 1:3 ratio 0.5x10⁵ WT CD45.1/CD45.2 cells were co-injected with
1.5x10⁵ Ret-/- CD45.2 cells. For secondary reconstitution experiments with bone
marrow 2.5x10⁵ cells from each genotype were FACS sorted from primary recipients
and injected in direct competition into lethally irradiated Rag1-/- CD45.1 mice.
5-FU treatment: Vav1-iCrepos.Retnull/fl and littermate controls were injected weekly
with 150 μg of 5-FU per g of animal.
Rescue of in vivo transplantation: E14.5 LinnegcKitpos WT or Ret-/- cells were
transduced overnight with pMig.IRES-GFP retroviral vector containing Ret9, Bcl2 or
Bcl2l1 and GFPpos cells injected into lethally irradiated mice. 6 to 8 weeks later
transduced BM LinnegCD45.2posGFPpos were purified by flow cytometry and 105 cells
were co-injected with a radio-protective dose 105 CD45.1 BM cells into lethally
irradiated recipients.
Flow cytometry: Embryonic foetal livers were micro-dissected and homogenized in
70µm cell strainers. Bone marrow cells were either collected by flushing or crushing
bones. Cell suspensions were stained with: anti-CD117 (cKit) (2B8), anti-Ly-6A/E
(Sca-1) (D7), anti-CD16/32 (FcRγII/III) (93), anti-CD3 (eBio500A2), anti-CD150
(mShad150), anti-CD48 (HM48-1), anti-CD19 (eBio1D3), anti-CD11b (M1/70), anti-Ly-
6G (Gr-1) (RB6-8C5), anti-Ly79 (TER119), anti-NK1.1 (PK136), anti-CD11c (N418),
anti-CD45.1 (A20), anti-CD45.2 (104), anti-CD54 (ICAM-1) (YN1/1.7.4), anti-CD34
(RAM34), anti-CD51 (RMV-7) and anti-CD41 (eBioMWReg30) from eBioscience; anti-
CD38 (90), anti-CD3 (145-2C11), anti-CD34 (HM34) and anti-CD31 (390) from
BioLegend; anti-Ly6C (HK1.4) from Abcam, Annexin V from BD Pharmingen. Lineage
cocktail include anti-CD3, anti-CD19, anti-Ly-6G, anti-Ly6C, anti-Ly79, anti-NK1.1, anti-
CD11c for embryonic foetal livers plus anti-CD11b for adult bone marrow cells. Human

48
cord blood was enriched in CD34pos cells using CD34 MicroBead Kit (Miltenyi Biotec)
after Histopaque separation (Sigma) and stained with anti-human CD34 (AC136)
(Miltenyi Biotec) and anti-human CD38 (HIT2) (eBioscience). Samples were sorted on
a FACSAria I or FACSAria III and analysed on a FACSCanto or LSRFortessa (BD).
Flow cytometry data was analysed with FlowJo 8.8.7 software (Tree Star).
Cell cycle analysis and intracellular staining: Animals were injected 12 hours
before analysis with 66.6 μg of BrdU per g of animal. Intracellular stainings were done
using BrdU Flow Kit and anti-BrdU (3D4), 7AAD, anti-Ki-67 (B56), anti-S6
(pS235/pS236) (N7-548) and anti-Akt (pT308) (JI-223.371) from BD Pharmingen, anti-
human RET (132507) from R&D Systems, anti-PIP3 (Z-P345) from Echelon
Biosciences, anti-CREB (pS133) (87G3), anti-p38 (pT180/Y182) (28B10), anti-Akt
(pS473) (D9E) and anti-ERK1/2 (pT202/pY204) (D13.14.4E) from Cell Signaling
Technology.
in vitro culture of haematopoietic progenitors: 106 E14.5 WT LinnegcKit pos cells
were cultured in DMEM and starved for 2 hours. To test CREB phosphorilation upon
GFL stimulation LinnegcKit pos cells were stimulated 1 hour with 500ng/ml of each GFL
and co-receptor. LSK cells were purified by flow cytometry and stimulated overnight
with GFL/GFRα combinations in order to determine Bcl2 and Bcl2l1 expression levels.
For inhibition experiments cells were incubated 2hours prior GFLs stimulation, to test
CREB phosphorilation, or during overnight stimulation with GFLs, to determine Bcl2
and Bcl2l1 expression levels, with SB 202190 (10 μM) and PD98,059 (40 μM) from
Sigma-Aldrich or Akt1/2, Akt InhibitorVIII (58 nM) and CBP-CREB Interaction Inhibitor
(2.5 μM) from Calbiochem. LinnegcKit pos cells were stimulated with GFL/GFRα for 120
hours and 2.5x10⁵ CD45.2posLinnegcKitpos cells were sequentially analysed by flow
cytometry and transplanted into lethally irradiated hosts with a radio-protective dose
2.5x10⁵ CD45.1 BM cells. To detect Annexin V, 4x10⁴ E14.5 WT or Ret-/- Linnegckit pos
cells per well were cultured overnight in DMEM alone or with GFL/GFRα. When
analysed by flow cytometry haematopoietic progenitors were further stained with an
LSK antibody cocktail.
Real-time PCR analysis: RNA was extracted from cell suspension using RNeasy
Mini Kit or RNeasy Micro Kit (Qiagen). Real-time PCR for Ret, Gfra1, Gfra2 and Gfra3
were done as previously described 256,337. Hprt1 was used as housekeeping gene. For
TaqMan assays (Applied Biosystems) RNA was retro-transcribed using High Capacity
RNA-to-cDNA Kit (Applied Biosystems), followed by a pre-amplification PCR using
TaqMan PreAmp Master Mix (Applied Biosystems). TaqMan Gene Expression Master
49
Mix (Applied Biosystems) was used in real-time PCR. TaqMan Gene Expression
Assays bought from Applied Biosystems were the following: Gapdh Mm99999915_g1;
Hprt1 Mm00446968_m1; Gusb Mm00446953_m1; Mpl Mm00440310_m1; Mcl1
Mm00725832_s1; Meis1 Mm00487664_m1; Angpt1 Mm00456503_m1; Eya1
Mm00438796_m1; Eya2 Mm00802562_m1; Egr1 Mm00656724_m1; Tek
Mm00443243_m1; Slamf1 Mm00443316_m1; Lef1 Mm00550265_m1; Thy1
Mm00493681_m1; Mllt3 Mm00466169_m1; Hoxa5 Mm00439362_m1; Hoxa9
Mm00439364_m1; Hoxc4 Mm00442838_m1; Pbx3 Mm00479413_m1; Ndn
Mm02524479_s1; Evi1 Mm00514814_m1; Mll1 Mm01179213_g1; Hlf
Mm00723157_m1; Cxcr4 Mm01292123_m1; Smo Mm01162710_m1; Igf2r
Mm00439576_m1; Cdkn1a Mm00432448_m1; Notch1 Mm00435249_m1; Kitl
Mm00442972_m1; Thpo Mm00437040_m1; Bcl2l1 Mm00437783_m1; Bcl2
Mm00477631_m1; Pspn Mm00436009_g1; Artn Mm00507845_m1; Nrtn
Mm03024002_m1; Gdnf Mm00599849_m1; Ret Mm00436304_m1. For HSC
signature gene arrays, gene expression levels were normalized to Gapdh, Hprt1 and
Gusb. For Bcl2 / Bcl2l1 expression after HSC stimulation and Ret expression levels
after in vivo transfer gene expression levels were normalized to Gapdh and Hprt1.
Statistics: Statistical analysis was done using Microsoft Excel. Variance was
analyzed using F-test. Student’s t-test was performed on homocedastic populations
and student’s t-test with Welch correction was applied on samples with different
variances. Kaplan-Meier survival curves were analyzed using a log-rank test.
50
Results
Haematopoiesis starts during embryonic life, mainly in the Foetal Liver (FL), and is
maintained throughout adulthood in the Bone Marrow (BM). Although HSCs are mostly
quiescent in adults, they become proliferative upon physiological demand.
Interestingly, autonomic nerves have been recently shown to actively participate in
HSC niches raising the hypothesis that neurotrophic factors may regulate HSC
function220. The neuronal growth factor family includes the glial cell-line derived
neurotrophic factor (GDNF) ligands (GFLs), which signal through the RET tyrosine
kinase receptor and act mainly in the autonomous nervous system, kidney and mature
lymphoid cells256,268,325,331.
To explore the role of GFLs in HSC biology we initially determined the expression of
their canonical receptor RET in embryonic day 14.5 (E14.5) FL LinnegSca1poscKitpos
(LSK) cells, a population highly enriched in HSCs. When compared to myeloid
progenitors (LinnegSca1negcKitpos) (MP), LSKs expressed high levels of Ret and its co-
receptors Gfra1, Gfra2, and Gfra3; a finding also confirmed in BM LSKs and human
CD34posCD38neg cord blood progenitors (Fig. 1a; Supplementary Fig. 1). Strikingly, Ret
expression in FL was restricted to LinnegSca1poscKitposCD150posCD48neg haematopoietic
stem cells (HSC), while multipontent progenitors (LinnegSca1poscKitposCD150negCD48pos
(MPPs)) expressed this gene poorly (Fig. 1b)70,117. Interestingly, FL mesenchymal cells
and BM osteoblasts, which were described as important players in HSC
microenvironment, co-expressed the neurotrophic RET ligands Gdnf, Nrtn and Artn,
further suggesting an unexpected involvement of RET signalling in HSCs (Fig. 1c;
Supplementary Fig. 2)61.
To dissect this hypothesis we analysed mice with a null mutation of Ret253. E14.5
Ret deficient progenitors were generated in similar proportions to their WT littermate
controls (Fig. 1d). However, LSK numbers and total foetal liver cellularity were strongly
reduced in Ret-/- embryos (Fig. 1e). Despite their reduced cell number, the
differentiation potential of Ret-/- LSKs was intact as revealed by normal numbers of
methylcellulose colony-forming units (CFU) (Fig. 1f). Further dissection of LSK cells
into short-term (ST-LSK) and long-term LSKs (LT-LSK) by CD38 expression108,
revealed a preferential reduction of Ret deficient LT-LSKs (Supplementary Fig. 3a).
This abnormal LSK population structure correlated with an altered cell cycle status of
Ret-/- LSK. Thus, despite similar G1/S/G2+M fractions (Supplementary Fig. 3b), and
turnover rate determined by BrdU incorporation (Fig. 1g), quiescent Ki-67neg G0 phase

51
LSKs were consistently reduced in Ret-/- animals (Fig. 1g-h). Accordingly, Ret
deficiency resulted in decreased HSC numbers (Fig. 1i).
Figure 1. Ret deficiency leads to reduced HSCs. a., b. FL E14.5 MP and LSK, HSCs and MPPs
were analysed by quantitative RT-PCR. c. FL E14.5 TER119negCD45negCD31pos endothelial cells (EC),
TER119negCD45negCD31negcKitposICAM-1neg hepatocyte progenitor cells (HP) and TER119negCD45neg
CD31negcKitnegICAM-1pos mesenchymal cells (MC) were analysed by quantitative RT-PCR. d. Flow
cytometry analysis of E14.5 Ret-/- and WT littermate control LSKs (top) and MPs (bottom). e. Number of
LSKs and total FL cells. WT n=18; Ret-/- n=17. f. Day 8 CFU colony numbers. WT n=3; Ret-/- n=3. g. BrdU
and Ki-67 in E14.5 LSK cells. h. Percentage of Ki-67neg LSKs (G0 cells). WT n=12; Ret-/- n=14. i. Number
of E14.5 HSCs. WT n=20; Ret-/- n=18. j. Survival of VaviCre.Retnull/fl and littermate controls after 5-FU
treatment. P value for log-rank test is indicated. Vav1 iCre.RetWT/fl n=5; Vav1 iCre.Retnull/fl n=5. Two tailed
t-test P values are indicated. Error bars show s.e..
Sca1
WT Ret -/-
cKit
37 1.7 36.4 1.2
CD34
6.9
8.4
57.8FcR
II/I
II
7
7.5
57.6
LinnegSca1negcKitpos
dBFU-E CFU-GM
p = 0.13
CFU-GEMM
CF
U n
um
ber
/5x1
03L
inn
egcK
itp
os
45
0
90
p = 0.77 p = 0.7
WT Ret -/- WTRet -/- WT Ret -/-
f
Cel
l nu
mb
er (
x106
)
e
p = 0.004
0
0.12
LSK
WT Ret -/-
j
Vav1-iCre.RetWT/fl
Vav1-iCre.Retnull/fl
Days after 5-FU injection
5-FU treatment
80
60
40
20
02 4 6 8 10 12
Su
rviv
al (
%)
100
14 16
p = 0.002
HSC
0
4.5
WT Ret -/-
Cel
l nu
mb
er (
x103 )
i
p = 1.24x10⁻⁴
Total FL
9
0
18
WT Ret -/-
p = 0.008
% o
f K
i67n
egce
lls
LSK
p = 9.22x10⁻⁶
0
25
WT Ret -/-
hgWT Ret -/-
Brd
U
44.7
17.5
7AAD
35.8
44.0
17.8
36.9
LinnegSca1poscKitpos
7AAD
Ki-
67
36.8
22.9
62.3
11.4
38 26.2
c
Rel
ativ
e E
xpre
ssio
n (
A.U
.)
Gdnf
HPEC MC MC
Nrtn
HPEC
Gfra2
MP LSK
a
LSK
Ret
MP
Rel
ativ
e E
xpre
ssio
n (
A.U
.)
LSKMP
Gfra1 Ret
HSC MPP
b
Rel
ativ
e E
xpre
ssio
n (
A.U
.)
LSK
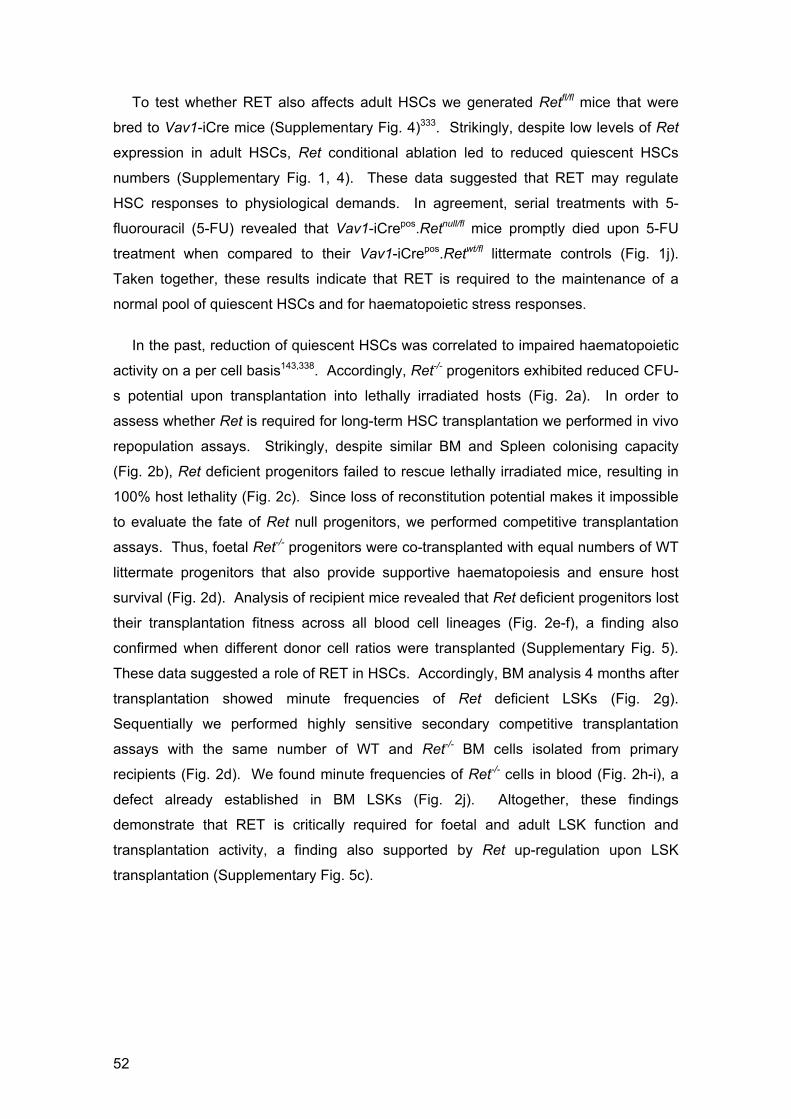
52
To test whether RET also affects adult HSCs we generated Retfl/fl mice that were
bred to Vav1-iCre mice (Supplementary Fig. 4)333. Strikingly, despite low levels of Ret
expression in adult HSCs, Ret conditional ablation led to reduced quiescent HSCs
numbers (Supplementary Fig. 1, 4). These data suggested that RET may regulate
HSC responses to physiological demands. In agreement, serial treatments with 5-
fluorouracil (5-FU) revealed that Vav1-iCrepos.Retnull/fl mice promptly died upon 5-FU
treatment when compared to their Vav1-iCrepos.Retwt/fl littermate controls (Fig. 1j).
Taken together, these results indicate that RET is required to the maintenance of a
normal pool of quiescent HSCs and for haematopoietic stress responses.
In the past, reduction of quiescent HSCs was correlated to impaired haematopoietic
activity on a per cell basis143,338. Accordingly, Ret-/- progenitors exhibited reduced CFU-
s potential upon transplantation into lethally irradiated hosts (Fig. 2a). In order to
assess whether Ret is required for long-term HSC transplantation we performed in vivo
repopulation assays. Strikingly, despite similar BM and Spleen colonising capacity
(Fig. 2b), Ret deficient progenitors failed to rescue lethally irradiated mice, resulting in
100% host lethality (Fig. 2c). Since loss of reconstitution potential makes it impossible
to evaluate the fate of Ret null progenitors, we performed competitive transplantation
assays. Thus, foetal Ret-/- progenitors were co-transplanted with equal numbers of WT
littermate progenitors that also provide supportive haematopoiesis and ensure host
survival (Fig. 2d). Analysis of recipient mice revealed that Ret deficient progenitors lost
their transplantation fitness across all blood cell lineages (Fig. 2e-f), a finding also
confirmed when different donor cell ratios were transplanted (Supplementary Fig. 5).
These data suggested a role of RET in HSCs. Accordingly, BM analysis 4 months after
transplantation showed minute frequencies of Ret deficient LSKs (Fig. 2g).
Sequentially we performed highly sensitive secondary competitive transplantation
assays with the same number of WT and Ret-/- BM cells isolated from primary
recipients (Fig. 2d). We found minute frequencies of Ret-/- cells in blood (Fig. 2h-i), a
defect already established in BM LSKs (Fig. 2j). Altogether, these findings
demonstrate that RET is critically required for foetal and adult LSK function and
transplantation activity, a finding also supported by Ret up-regulation upon LSK
transplantation (Supplementary Fig. 5c).

53
Figure 2. Ret-/- LSKs have poor in vivo reconstitution potential. a. Day 12 CFU-s. WT n=10; Ret-/-
n=10. b. Percentage of LinnegcKitposCMTMRpos cells in BM and spleen 20h post-injection. WT n=3; Ret-/-
n=3. c. Survival upon transplantation. P value for log-rank test is indicated. WT n=5; Ret-/- n=6. d.
Scheme of Primary and Secondary (red) transplantation. e. Percentage of Mac1pos cells after
transplantation. WT n=8; Ret-/- n=8. f. Blood cell lineages 16 weeks post-transplantation. g. BM Linneg and
LSK cells at 16 weeks and percentage of BM LSK cells. WT n=4; Ret-/- n=4. h. Percentage of Mac1pos
cells post-secondary transplantation. WT n=4; Ret-/- n=4. i. Blood cell lineages 16 weeks post-secondary
transplantation. j. BM Linneg and LSK cells at 16 weeks and percentage of BM LSK cells. WT n=4; Ret-/-
n=4. Two tailed t-test P values are indicated. Error bars show s.e..
% o
f d
on
or
cells
(M
ac1
po
s )
p = 1.64x10⁻¹⁰
100
80
60
40
20
0
p = 1.46x10⁻¹¹
Secondary transplantationPrimary transplantation
105linnegcKitpos
E14.5 FL
105linnegcKitpos
E14.5 FL
20 weeks
0.25x10⁵
WT CD45.1/2
0.25x10⁵
Ret-/- CD45.2
Isolate Bone Marrow
cells
CFU-S
WT
Ret -/-
a
Nu
mb
er o
f C
FU
-S
0
5
10
15
p = 8x10⁵
WT Ret -/-
c
WTCD45.1/2
Ret-/-
CD45. 2
Rag2-/-
CD45.1Rag2-/-
CD45.1
d
WT Ret -/- WT Ret -/-
16 weeks8 weeks
% o
f d
on
or
cell
s (M
ac1
po
s )
p = 2.7x10⁻⁸
100
80
60
40
20
0
p = 4.2x10⁻⁷
WT Ret -/- WT Ret -/-
16 weeks8 weeks
81.9
17.9
88.1
11.8
75.2
24.7
85.6
14.4
CD19pos CD3pos
Total blood Mac1pos
CD45.2
CD
45.1
93.1
6.9
99
0.7
97.2
2.5
90
9.5
CD19pos CD3pos
Total blood Mac1pos
CD45.2
CD
45.1 Sca1
BM Linneg
cKit
1.5
CD45.2
CD
45.1
BM LSK
99
0.5
Sca1
BM Linneg
cKit
1.2
CD45.2
CD
45.1
BM LSK
87
11
% o
f d
on
or
cells
100
80
60
40
20
0
p = 1.47x10⁻⁵
WT Ret -/-
BM LSK
% o
f d
on
or
cell
s
100
80
60
40
20
0
p = 3.7x10⁻⁹
WT Ret -/-
BM LSK
e f g
h i j
%L
inn
egcK
itp
os C
MT
MR
po
s
BM
0
2
4
6
p = 0.11
Spleen
0
0.8
1.6
p = 0.83
WT Ret -/- WT Ret -/-
b
80
60
40
20
010 20 30 40 50 60
Days after transplantation
Su
rviv
al (
%)
Donor Recipient105linnegcKitpos
100
WT
Ret -/-
p = 0.021
WT
Ret-/-
WT
Ret-/-
WT
Ret-/-
WT
Ret-/-

54
Figure 3. RET induces Bcl2/Bcl2l1 downstream of p38/MAP and CREB activation. a., b.
Quantitative RT-PCR for FL E14.5 Ret-/- and WT LSKs and HSCs. n=3. c. AnnexinVpos cells in cultured
E14.5 LSK cells. WT n=7; Ret-/- n=4. d. Number of recovered LSKs and HSCs treated with GFLs for 4
days. n=12. e. AnnexinVpos cells in cultured LSK cells. Alone n=9; GFLs n=9. f. Flow cytometry of E14.5
Ret-/- and WT littermate control LSKs. WT n>8; Ret-/- n>7. g. Flow cytometry analysis of LSK cells in the
absence or presence of GFLs for 1h. n>6. h. Bcl2 and Bcl2l1 expression upon GFL treatment. i. Flow
cytometry analysis of LSKs cultured with GFLs (black line) or GFLs and the inhibitors SB 202190 (SB);
PD98,059 (PD);or Akt1/2, Akt Inhibitor VIII (AktVIII) (solid grey). n>5. j. Bcl2 and Bcl2l1 expression upon
GFL treatment and different inhibitors. k. Bcl2 and Bcl2l1 expression relative to untreated LSKs, upon
GFL treatment or GFL+CBP-CREB interaction inhibitor (CREBinh). Two tailed t-test P values are
indicated. Error bars show s.e.. Light grey: isotype control.
LinnegSca1poscKitposa
-2.5
-1
0
Lo
g2
fold
incr
eas
e to
WT
0.5
-0.5
-3
-1.5
-2
2x decrease
8x decrease
Fo
ld in
crea
se
pAkt (S473)
pCREB
p = 0.0003
g
p = 0.0002
p38 (T180/Y182)
Fo
ld in
cre
ase
hBcl2
1
6
GDNF NRTN ARTN GFLs
Fo
ld in
crea
se
j Bcl2
1
2.3
0.2
1
Bcl2l1
LSK
Rel
ativ
e n
um
ber
pCREB
p = 0.03
p38 (T180/Y182)
p = 0.03
p = 0.23
pERK1/2
pAkt (S473)
p = 0.24
pERK1/2
LSK
pCREB
SB
pCREB
PD
p = 0.002
p = 0.35
pCREB
AktVIII
p = 0.304
LSK
WT
Ret-/-
Alone
GFLs
i
3.5
Bcl2l1
1GDNF NRTN ARTN GFLs
SB AktVIII PD
SB AktVIII PD
1
1.2
Bcl2 Bcl2l1
GFL GFL+
CREBinh
GFL GFL+
CREBinh
k
p = 0.23
p = 0.43
f
LSKF
SC
-W
Annexin V
WT
Ret -/-
8
15.4
c d p = 1.1x10⁻⁵
0
Alone GFLs
4.5
Cel
l nu
mb
er (
x103
)
LSK
p = 1.5x10⁻³
0
Alone GFLs
1.5
HSC
LSK
FS
C-W
Annexin V
Alone
GFLs
8.1
3.27
eb
0
6x decrease
0.5
-2.5
HSC
Lo
g2
fold
incr
ease
to
WT
0
-0.5
-1
-1.5
-2
-3
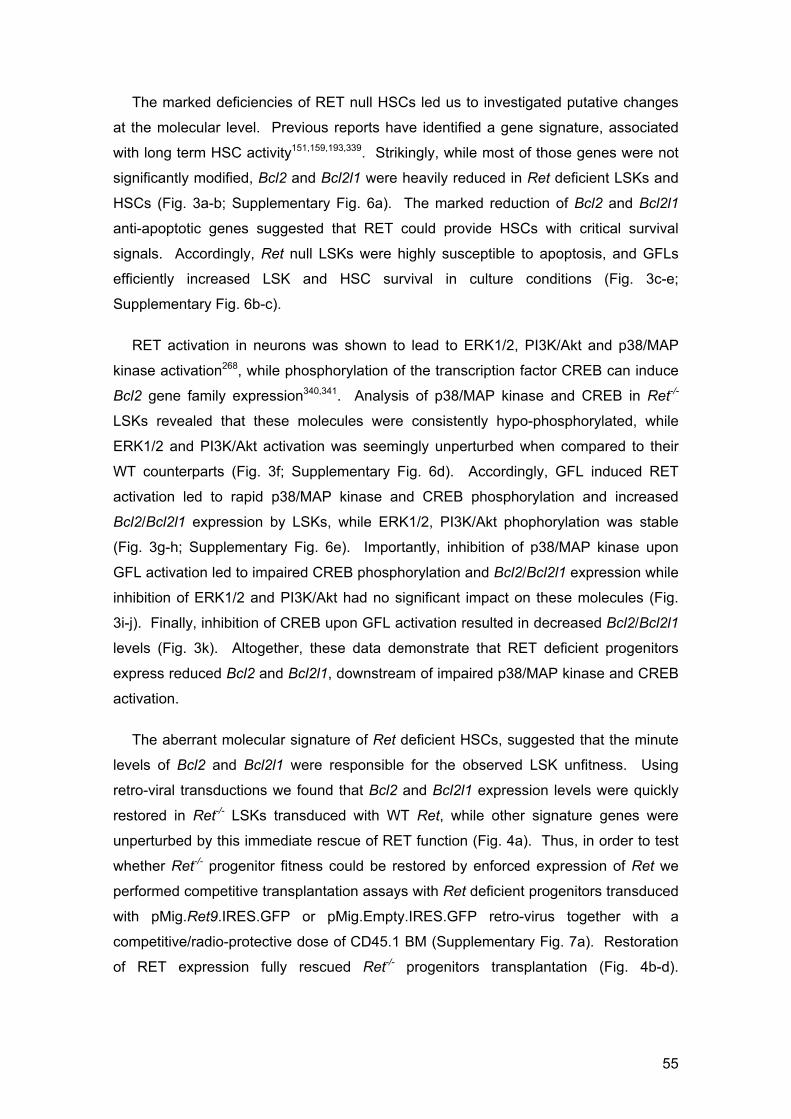
55
The marked deficiencies of RET null HSCs led us to investigated putative changes
at the molecular level. Previous reports have identified a gene signature, associated
with long term HSC activity151,159,193,339. Strikingly, while most of those genes were not
significantly modified, Bcl2 and Bcl2l1 were heavily reduced in Ret deficient LSKs and
HSCs (Fig. 3a-b; Supplementary Fig. 6a). The marked reduction of Bcl2 and Bcl2l1
anti-apoptotic genes suggested that RET could provide HSCs with critical survival
signals. Accordingly, Ret null LSKs were highly susceptible to apoptosis, and GFLs
efficiently increased LSK and HSC survival in culture conditions (Fig. 3c-e;
Supplementary Fig. 6b-c).
RET activation in neurons was shown to lead to ERK1/2, PI3K/Akt and p38/MAP
kinase activation268, while phosphorylation of the transcription factor CREB can induce
Bcl2 gene family expression340,341. Analysis of p38/MAP kinase and CREB in Ret-/-
LSKs revealed that these molecules were consistently hypo-phosphorylated, while
ERK1/2 and PI3K/Akt activation was seemingly unperturbed when compared to their
WT counterparts (Fig. 3f; Supplementary Fig. 6d). Accordingly, GFL induced RET
activation led to rapid p38/MAP kinase and CREB phosphorylation and increased
Bcl2/Bcl2l1 expression by LSKs, while ERK1/2, PI3K/Akt phophorylation was stable
(Fig. 3g-h; Supplementary Fig. 6e). Importantly, inhibition of p38/MAP kinase upon
GFL activation led to impaired CREB phosphorylation and Bcl2/Bcl2l1 expression while
inhibition of ERK1/2 and PI3K/Akt had no significant impact on these molecules (Fig.
3i-j). Finally, inhibition of CREB upon GFL activation resulted in decreased Bcl2/Bcl2l1
levels (Fig. 3k). Altogether, these data demonstrate that RET deficient progenitors
express reduced Bcl2 and Bcl2l1, downstream of impaired p38/MAP kinase and CREB
activation.
The aberrant molecular signature of Ret deficient HSCs, suggested that the minute
levels of Bcl2 and Bcl2l1 were responsible for the observed LSK unfitness. Using
retro-viral transductions we found that Bcl2 and Bcl2l1 expression levels were quickly
restored in Ret-/- LSKs transduced with WT Ret, while other signature genes were
unperturbed by this immediate rescue of RET function (Fig. 4a). Thus, in order to test
whether Ret-/- progenitor fitness could be restored by enforced expression of Ret we
performed competitive transplantation assays with Ret deficient progenitors transduced
with pMig.Ret9.IRES.GFP or pMig.Empty.IRES.GFP retro-virus together with a
competitive/radio-protective dose of CD45.1 BM (Supplementary Fig. 7a). Restoration
of RET expression fully rescued Ret-/- progenitors transplantation (Fig. 4b-d).

56
Strikingly, enforced expression of RET down-stream targets, Bcl2 or Bcl2l1, was
sufficient to recover the engraftment of Ret null LSKs (Fig. 4b-d).
Figure 4. Triggering of RET signalling improves transplantation activity. a. Quantitative RT-PCR.
Fold increase ratio between Ret-/- pMig.GFP-IRES-Ret9 and empty vector. n=3. b. Flow cytometry
analysis of Ret-/- blood cells at 4 weeks upon transduced cell transplantation. c. Percentage of
CD45.2posGFPpos in the blood at 4 weeks post transplantation with Ret-/- progenitors transduced with
pMig.GFP-IRES-Empty (Empty), pMig.GFP-IRES-Ret9 (Ret9), pMig.GFP-IRES-Bcl2l1 (Bcl2l1) or
pMig.GFP-IRES-Bcl2 (Bcl2). Empty n=13; Ret9 n=5; Bcl2l1 n=8; Bcl2 n=7. d. Number of BM LSK cells
transduced as indicated in Fig.4b. Ret-/- Empty n=13; Ret9 n=4; Bcl2l1 n=6; Bcl2 n=5. e. Flow cytometry
analysis of blood cells at 8 weeks upon transplantation. f. Percentage of CD45.2pos donor cells in Mac1pos
cells from blood. Alone n=5; GFLs n=5. g. Percentage of BM CD45.2pos donor LSK and HSC cells, 12
weeks upon transplantation. Alone n=5; GFLs n=5. Two tailed t-test P values are indicated.
d
1
10
100
1000
Cel
l nu
mb
er
BM LSK GFPpos
p = 0.017
p = 0.009
p = 0.015
WT
c
0
10
20
30
40
50
% o
f d
on
or
cell
s(G
FP
po
s )
p = 6.05x10⁻⁴
p = 1.26x10⁻⁴
p = 0.022
4 weeks
60
WT
bRet9
1.12
Empty
Bcl2l1 Bcl2
11.1
7.3
37.5
CD45.2
CD
45.1
Ret-/- LSK pMig.GFP-IRES-Ret9a
1
2.5
3.5
4.5
Fo
ld in
cre
ase
4
3
2
1.5
3x increase
4x increase
f
% o
f d
on
or
cel
ls (
Ma
c1p
os ) 50
40
30
20
10
0
p = 0.013
Alone GFLs
8 weekse
19.2
0.16
Mac1pos
Alone
GFLs28.3
0.66
Alone
GFLs
Total
CD
45.2
CD45.1 GFLs
8
6
4
2
0
p = 0.045
Alone
HSC
GFLs
g
% o
f d
on
or
cel
ls
50
30
20
10
0
p = 0.048
Alone
LSK
40
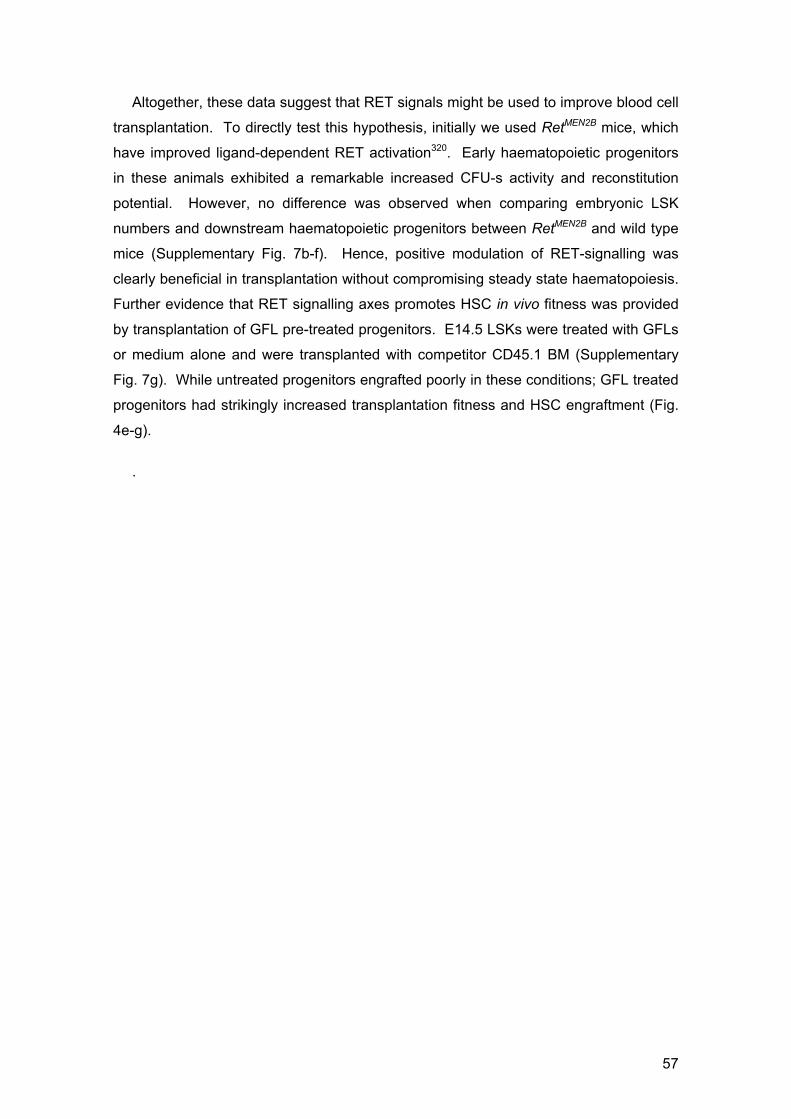
57
Altogether, these data suggest that RET signals might be used to improve blood cell
transplantation. To directly test this hypothesis, initially we used RetMEN2B mice, which
have improved ligand-dependent RET activation320. Early haematopoietic progenitors
in these animals exhibited a remarkable increased CFU-s activity and reconstitution
potential. However, no difference was observed when comparing embryonic LSK
numbers and downstream haematopoietic progenitors between RetMEN2B and wild type
mice (Supplementary Fig. 7b-f). Hence, positive modulation of RET-signalling was
clearly beneficial in transplantation without compromising steady state haematopoiesis.
Further evidence that RET signalling axes promotes HSC in vivo fitness was provided
by transplantation of GFL pre-treated progenitors. E14.5 LSKs were treated with GFLs
or medium alone and were transplanted with competitor CD45.1 BM (Supplementary
Fig. 7g). While untreated progenitors engrafted poorly in these conditions; GFL treated
progenitors had strikingly increased transplantation fitness and HSC engraftment (Fig.
4e-g).
.

58
Discussion
Our results reveal that RET signalling is a crucial novel pathway regulating foetal
and adult HSC activity by providing critical surviving signals through BCL2 family
members. Although no appreciable HSC survival deficiencies were reported in Bcl2
deficient mice, it is possible that haematopoietic stress conditions could reveal such
deficits181. Alternatively, Bcl2 and Bcl2l1 may have redundant roles in HSCs, an idea
supported by our data demonstrating that Bcl2l1 or Bcl2 are independently sufficient to
fully rescue Ret deficient HSC function (Fig. 4b-d).
Haematopoietic progenitors express multiple RET co-receptors and actively respond
to their respective ligands (Fig. 1a; Fig. 3g-h; Supplementary Fig. 6). We hypothesise
that contrary to nervous cells, HSCs might use GFLs in a versatile and redundant
manner since analysis of RET co-receptors single knockouts revealed normal LSK
numbers (Supplementary Fig. 8)334-336. In agreement with this concept, it was recently
shown that Lymphoid Tissue initiator cells can respond redundantly to all RET
ligands295.
Figure 5. Neuronal growth factors regulate HSC response to physiological demand. The
neurotrophic factors GDNF, NRTN and ARTN are produced by cells in the HSC microenvironment and act
directly on HSCs by binding to RET/GFRa heterodimers. Highlighted area: RET stimulation results
p38/MAP kinase and CREB activation leading to Bcl2 and Bcl2l1 expression. Thus, RET signal provide
HSCs with critical survival signals.
GFLs
RETP p38p38
CREB
Bcl2 / Bcl2l1CBP/CREB
GDNF
GFR2
GFR1
RET
GFR3
Osteoblast
MSC
HSC End. cell
SNS NRTN
ARTN
P CREB
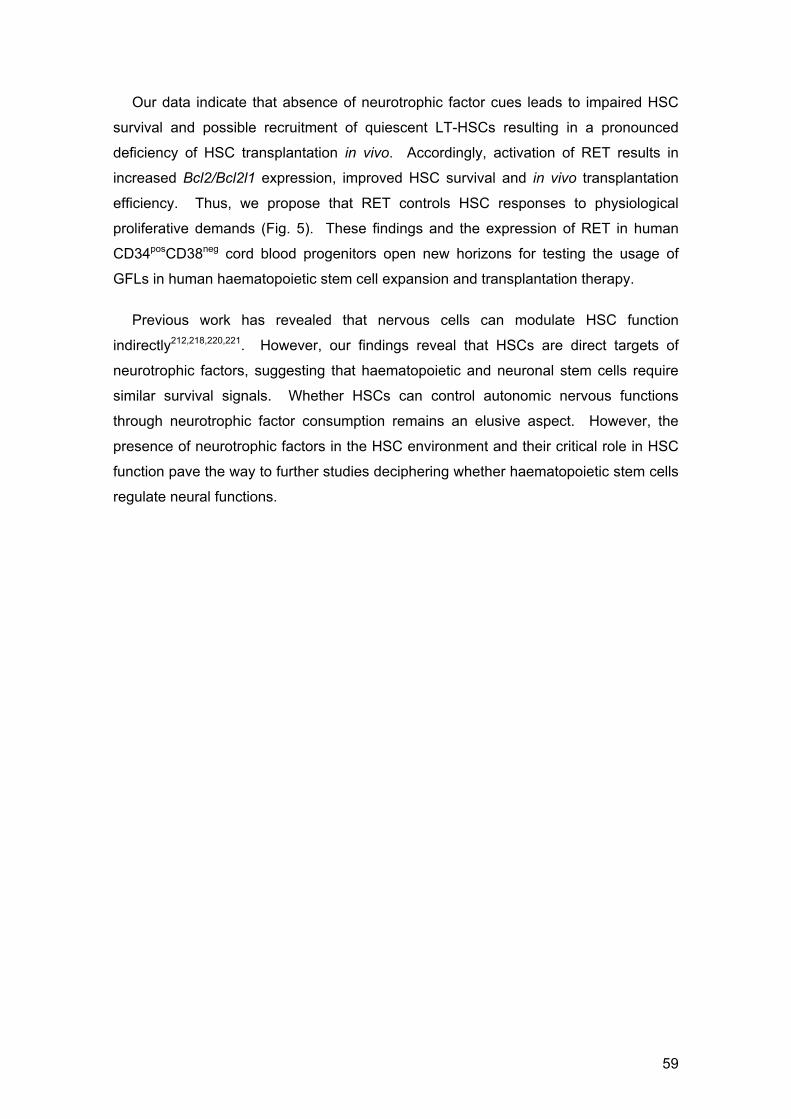
59
Our data indicate that absence of neurotrophic factor cues leads to impaired HSC
survival and possible recruitment of quiescent LT-HSCs resulting in a pronounced
deficiency of HSC transplantation in vivo. Accordingly, activation of RET results in
increased Bcl2/Bcl2l1 expression, improved HSC survival and in vivo transplantation
efficiency. Thus, we propose that RET controls HSC responses to physiological
proliferative demands (Fig. 5). These findings and the expression of RET in human
CD34posCD38neg cord blood progenitors open new horizons for testing the usage of
GFLs in human haematopoietic stem cell expansion and transplantation therapy.
Previous work has revealed that nervous cells can modulate HSC function
indirectly212,218,220,221. However, our findings reveal that HSCs are direct targets of
neurotrophic factors, suggesting that haematopoietic and neuronal stem cells require
similar survival signals. Whether HSCs can control autonomic nervous functions
through neurotrophic factor consumption remains an elusive aspect. However, the
presence of neurotrophic factors in the HSC environment and their critical role in HSC
function pave the way to further studies deciphering whether haematopoietic stem cells
regulate neural functions.
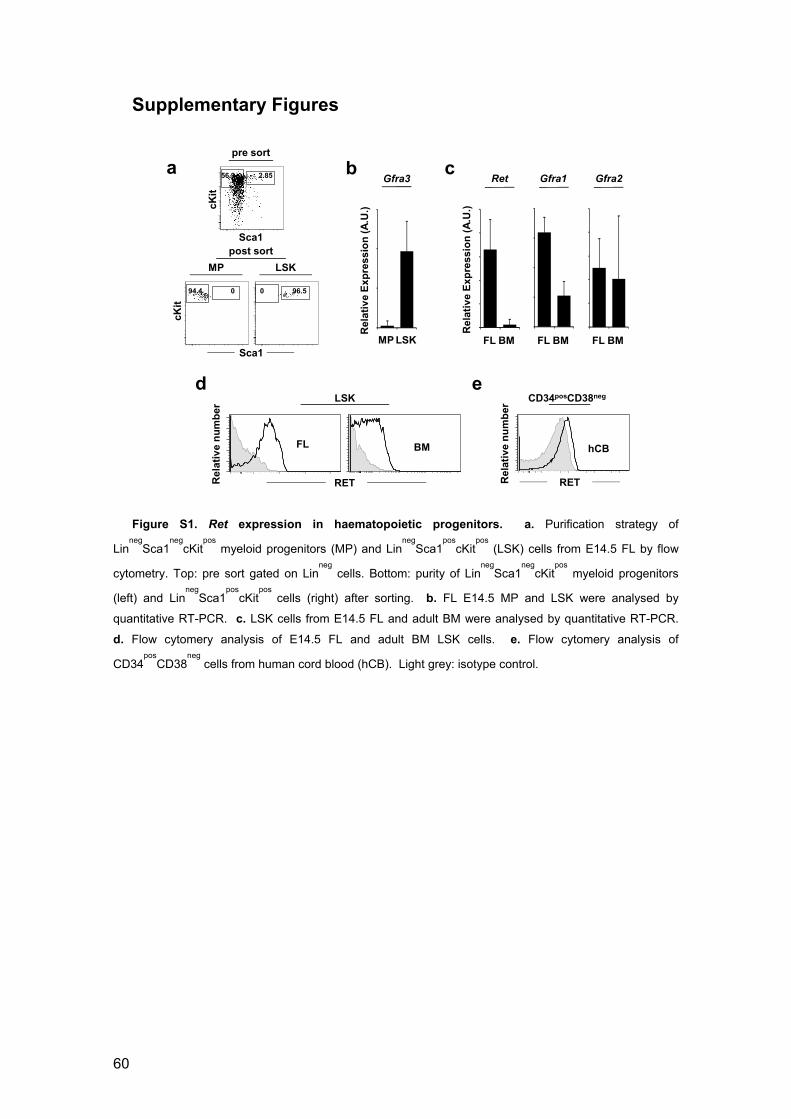
60
Supplementary Figures
Figure S1. Ret expression in haematopoietic progenitors. a. Purification strategy of
Linneg
Sca1neg
cKitpos
myeloid progenitors (MP) and Linneg
Sca1pos
cKitpos
(LSK) cells from E14.5 FL by flow
cytometry. Top: pre sort gated on Linneg
cells. Bottom: purity of Linneg
Sca1neg
cKitpos
myeloid progenitors
(left) and Linneg
Sca1pos
cKitpos
cells (right) after sorting. b. FL E14.5 MP and LSK were analysed by
quantitative RT-PCR. c. LSK cells from E14.5 FL and adult BM were analysed by quantitative RT-PCR.
d. Flow cytomery analysis of E14.5 FL and adult BM LSK cells. e. Flow cytomery analysis of
CD34pos
CD38neg
cells from human cord blood (hCB). Light grey: isotype control.
a
Sca1
pre sort
cKit
56.9 2.85cK
it
post sort
Sca1
MP LSK
94.4 0 0 96.5
RETRel
ativ
e n
um
ber
hCB
CD34posCD38nege
RET
LSK
FL BM
Rel
ativ
e n
um
ber
d
Rel
ativ
e E
xpre
ssio
n (
A.U
.)
FL BM
cRet
FL BM
Gfra1
FL BM
Gfra2Gfra3
MP LSK
Rel
ativ
e E
xpre
ssio
n (
A.U
.)
b

61
Figure S2. Ret ligands are expressed in foetal and adult haematopoietic stem cell environment.
a. E14.5 FL TER119neg
CD45neg
CD31pos
endothelial cells (EC), TER119neg
CD45neg
CD31neg
cKitpos
ICAM-1neg
hepatocyte progenitor cells (HP) and TER119neg
CD45neg
CD31neg
cKitneg
ICAM-1pos
mesenchymal cells (MC)
were analysed by quantitative RT-PCR. b. BM TER119neg
CD45neg
CD31pos
Sca1pos
endothelial cells
(Endo), TER119neg
CD45neg
CD31neg
Sca1neg
CD51pos
osteoblasts (Osteo), TER119neg
CD45neg
CD31neg
Sca1pos
CD51pos
mesenchymal stem cells (MSC) and the remaining TER119neg
CD45neg
CD31neg
Sca1neg
CD51neg
(CD51neg
) cells were analysed by quantitative RT-PCR. Results are representative of
three independent experiments.
Artn
HPEC MC
a
Rel
ativ
e E
xpre
ssio
n (
A.U
.)
b
Rel
ativ
e E
xpre
ssi
on
(A
.U.)
Gdnf Nrtn Artn

62
Figure S3. Long-term reconstituting LSK cell numbers are affected by Ret deficiency. a. Number
of E14.5 ST-LSK (LSKCD38neg
) and LT-LSK (LSKCD38pos
) cells. WT n=12; Ret-/-
n=11. b. Percentage of
LSK cells in G0+G1, S or G2+M cell cycle phases according to DNA content (7AAD). WT n=7; Ret-/-
n=6.
Two tailed t-test P value is indicated. Error bars show s.e..
Cel
l nu
mb
er (
x103
)p = 0.27
0
5
15
25
LSK CD38neg
WT Ret -/-
p = 0.027
0
16
WT Ret -/-
8
LSK CD38pos
a
0
80
% o
f ce
lls
G0+G1 S G2+M
WTRet -/- WTRet -/-WTRet -/-
p = 0.79 p = 0.82 p = 0.92
b

63
Figure S4. Generation of Ret conditional knockout mice and analysis of BM haematopoietic
stem cells. a. (A) The floxed Neomycin cassette was inserted ~4.5 kb upstream of exon 1 of mouse Ret
locus, a third loxP (LoxP3) was introduced downstream of exon 1 and ~ 5 kb downstream the PGK-TK-pA
cassette was inserted to aid negative selection. Targeted events were identified by Southern analysis of
either Hind III digests of genomic DNA using the 5’ external probe. (B) The floxed allele was identified by
PCR and the primers P1/P2 were used to identify the loxP that remained after excision of the Neomycin
cassette (PGK-Neo-PA), while the loxP3 was identified using primers P3/P4. The primer sequences are in
the methods section. (C) To screen for the null allele, primers P1 and P4 were used. b. Southern-blot
using HindIII digest and the 5’ external probe. c. Genotyping results from a litter of mice obtained from a
cRet131WT/null
x cRet131fl/fl
breeding. In the loxP sites PCRs, upper band corresponds to the sequence with
the loxP site and the lower band to the WT sequence. d. Numbers of BM HSCs. Vav1-iCre.RetWT/fl
(RetWT/fl
) n=5; Vav1-iCre.Retnull/fl
(Retnull/fl
) n=4. e. Ki-67 in HSCs. Vav1-iCre.RetWT/fl
=68.85 ± 1.43; Vav1-
iCre.Retnull/fl
=60.09 ± 1.59 (mean ± s.e.); t-test P=0.003. Vav1-iCre.Retnulll/fl
n=10; Vav1-iCre.Retnull/fl
n=7.
Two tailed t-test P value is indicated. Error bars show s.e..
a b
RetWT
Retfl
Retnull
1 2 3
1st loxP siteP1+P2
2nd loxP siteP3+P4
Ret nullP1+P4
c d
RetWT/fl Retnull/fl
Cel
l nu
mb
er (
x103
)p = 0.038
0
15
HSC
10
5
e
HSC
Ki-
67
7AAD
RetWT/fl
Retnull/fl
28.1
36.5
71.2
62.2
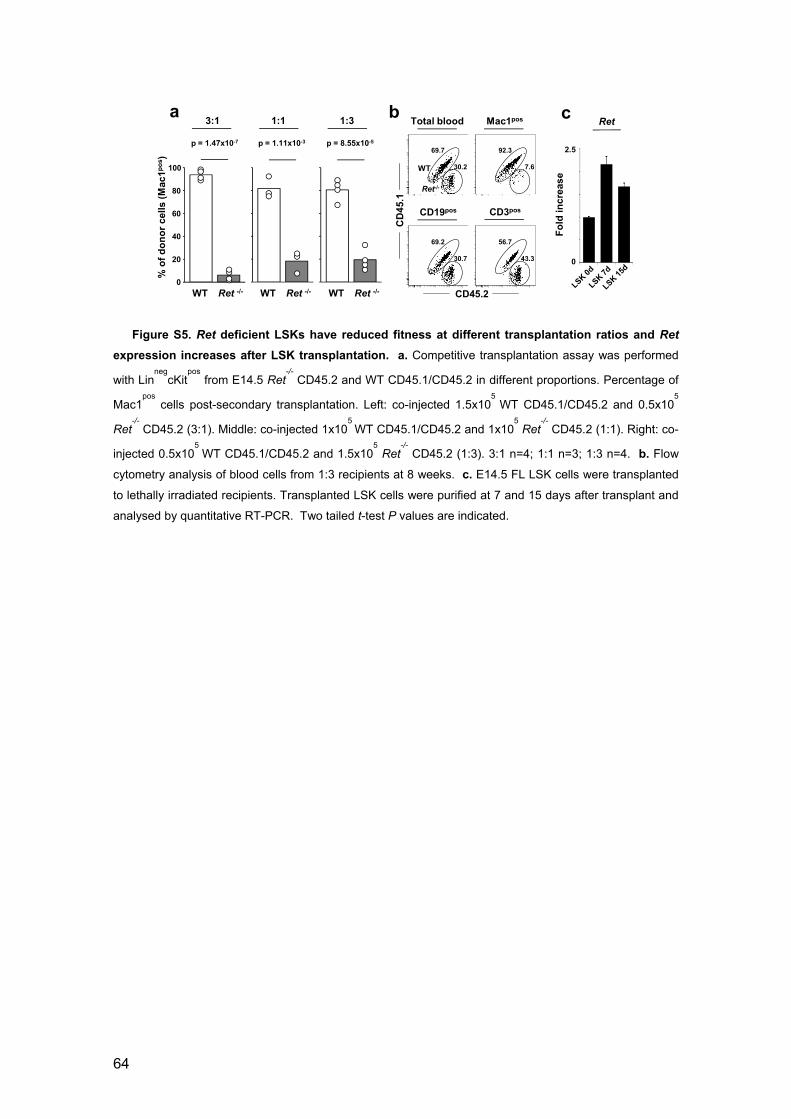
64
Figure S5. Ret deficient LSKs have reduced fitness at different transplantation ratios and Ret
expression increases after LSK transplantation. a. Competitive transplantation assay was performed
with Linneg
cKitpos
from E14.5 Ret-/-
CD45.2 and WT CD45.1/CD45.2 in different proportions. Percentage of
Mac1pos
cells post-secondary transplantation. Left: co-injected 1.5x10⁵
WT CD45.1/CD45.2 and 0.5x10⁵
Ret-/-
CD45.2 (3:1). Middle: co-injected 1x10⁵
WT CD45.1/CD45.2 and 1x10⁵ Ret
-/- CD45.2 (1:1). Right: co-
injected 0.5x10⁵
WT CD45.1/CD45.2 and 1.5x10⁵ Ret
-/- CD45.2 (1:3). 3:1 n=4; 1:1 n=3; 1:3 n=4. b. Flow
cytometry analysis of blood cells from 1:3 recipients at 8 weeks. c. E14.5 FL LSK cells were transplanted
to lethally irradiated recipients. Transplanted LSK cells were purified at 7 and 15 days after transplant and
analysed by quantitative RT-PCR. Two tailed t-test P values are indicated.
p = 1.11x10⁻³
WT Ret -/-
1:1
% o
f d
on
or
cel
ls (
Mac
1po
s )100
80
60
40
20
0
p = 1.47x10⁻⁷
WT Ret -/-
3:1a
1:3
p = 8.55x10⁻⁵
WT Ret -/-
69.7
30.2
92.3
7.6
69.2
30.7
56.7
43.3
CD19pos CD3pos
Total blood Mac1pos
CD45.2
CD
45.
1
bRet
c
0
2.5
Fo
ld in
crea
se
WT
Ret-/-

65
Figure S6. RET signalling results in increased survival and CREB phosphorylation. a.
Quantitative RT-PCR for FL E14.5 Ret-/-
and WT HSCs. n=3. b. Percentage of AnnexinVpos
LSK cells after
culture. WT n=7, Ret-/-
n=4. c. Percentage of AnnexinVpos
LSK cells after culture. Alone n=7, GFLs n=4.
d. Flow cytometry analysis E14.5 Ret-/-
or WT littermate control LSK cells. WT n=6; Ret-/-
n=6. e. Flow
cytometry analysis of LSK cells in absence or presence of GDNF, NRTN or ARTN for 1h. n = 6. Two tailed
t-test P value is indicated. Error bars show s.e.. Light grey: isotype control.
d
Rel
ativ
e n
um
ber
pAkt (T308)
p = 0.71
pS6
p = 0.08
PIP3
p = 0.33
LSK
e
Rel
ativ
e n
um
ber
LSK
GDNF
pCREB
p = 0.0287
ARTN
pCREB
p = 0.0329
pCREB
NRTN
p = 0.0047
An
nex
inV
(%
)
p = 0.02
0
15
10
5
WT Ret -/-
b
An
nex
inV
(%
)
p = 0.003
0
9
6
3
Alone GFLs
cLSKLSK
a LinnegSca1negcKitposCD48negCD150pos
-1
0
Lo
g2
fold
incr
ease
to
WT
-1.5
-3
-2
-0.5
-2.5
2x decrease
8x decrease
0.5
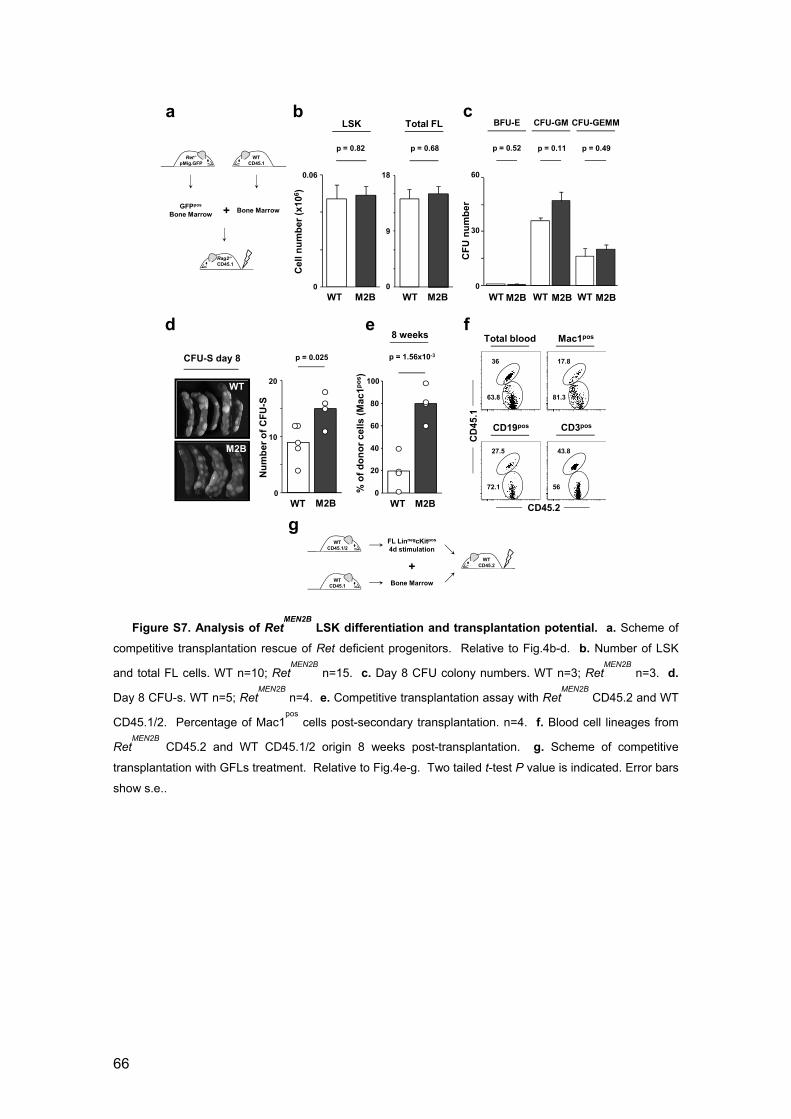
66
Figure S7. Analysis of RetMEN2B
LSK differentiation and transplantation potential. a. Scheme of
competitive transplantation rescue of Ret deficient progenitors. Relative to Fig.4b-d. b. Number of LSK
and total FL cells. WT n=10; RetMEN2B
n=15. c. Day 8 CFU colony numbers. WT n=3; RetMEN2B
n=3. d.
Day 8 CFU-s. WT n=5; RetMEN2B
n=4. e. Competitive transplantation assay with RetMEN2B
CD45.2 and WT
CD45.1/2. Percentage of Mac1pos
cells post-secondary transplantation. n=4. f. Blood cell lineages from
RetMEN2B
CD45.2 and WT CD45.1/2 origin 8 weeks post-transplantation. g. Scheme of competitive
transplantation with GFLs treatment. Relative to Fig.4e-g. Two tailed t-test P value is indicated. Error bars
show s.e..
p = 0.68
Total FL
9
0
18
WT M2BC
ell n
um
ber
(x1
06 )
p = 0.82
0
0.06
LSK
WT M2B
b c
CF
U n
um
ber
30
0
60
p = 0.52 p = 0.11 p = 0.49
BFU-E CFU-GM CFU-GEMM
WT M2B WT WTM2B M2B
a
Rag2-/-
CD45.1
Bone Marrow
WTCD45.1
+GFPpos
Bone Marrow
Ret-/-
pMig.GFP
WT
M2B
CFU-S day 8
d
10
20
p = 0.025
0
WT M2B
Nu
mb
er o
f C
FU
-S
% o
f d
on
or
cells
(M
ac1p
os ) 100
80
60
40
20
0
p = 1.56x10⁻³
WT M2B
8 weekse f
36
63.8
17.8
81.3
27.5
72.1
43.8
56
CD19pos CD3pos
Total blood Mac1pos
CD45.2
CD
45.1
g
WT CD45.2
FL LinnegcKitpos
4d stimulationWT
CD45.1/2
+Bone MarrowWT
CD45.1

67
Figure S8. Gfra deficient embryos have normal LSK cell numbers. a. Flow cytometry analysis of
E14.5 Gfra1-/- and WT littermate control LSKs (top) and MPs (bottom). b. Number of LSKs and total FL
cells. WT n=9; Gfra1-/- n=10. c. Flow cytometry analysis of E14.5 Gfra2-/- and WT littermate control LSKs
(top) and MPs (bottom). d. Number of LSKs and total FL cells. WT n=12; Gfra2-/- n=11. e. Flow cytometry
analysis of E14.5 Gfra3-/- and WT littermate control LSKs (top) and MPs (bottom). f. Number of LSKs and
total FL cells. WT n=11; Gfra3-/- n=20. Two tailed t-test P value is indicated. Error bars show s.e..
p = 0.27
Total FL
10
0
20
WT Gfra1 -/-
Ce
ll n
um
ber
(x1
06 )
p = 0.1
0
0.06
LSK
WT Gfra1 -/-
Sca1
WT Gfra1 -/-
cK
it
40.6 1.6 35.7 1.8
CD34
6.6
6.8
72.9FcR
II/I
II
6.4
6.7
79.8
a b
LinnegSca1negcKitpos
p = 0.6
Total FL
10
0
20
WT Gfra3 -/-
Ce
ll n
um
ber
(x1
06 )
p = 0.75
0
0.06
LSK
WT Gfra3 -/-
Sca1
WT Gfra3 -/-
cK
it
44.7 1.7 42.7 1.3
CD34
6
6.5
70.3FcR
II/I
II
6.1
7.7
70.8
e f
LinnegSca1negcKitpos
p = 0.26
Total FL
8
0
16
WT Gfra2 -/-
Cel
l nu
mb
er (
x10
6 )
p = 0.47
0
0.06
LSK
WT Gfra2 -/-
Sca1
WT Gfra2 -/-
cKit
65.8 1.9 68.2 1.8
CD34
14.8
8.2
52FcR
II/I
II
9
54.4
14.7
c d
LinnegSca1negcKitpos


69
RET/GFRα SIGNALS ARE DISPENSABLE FOR THYMIC T CELL
DEVELOPMENT IN VIVO
Afonso R. M. Almeida, Sílvia Arroz-Madeira, Diogo Fonseca-Pereira, Hélder Ribeiro,
Reena Lasrado, Vassilis Pachnis and Henrique Veiga-Fernandes
Abstract
Identification of thymocyte regulators is a central issue in T cell biology.
Interestingly, growing evidence indicates that common key molecules control neuronal
and immune cell functions. The neurotrophic factor receptor RET mediates critical
functions in foetal hematopoietic subsets, thus raising the possibility that RET-related
molecules may also control T cell development. We show that Ret, Gfra1 and Gfra2
are abundantly expressed by foetal and adult immature DN thymocytes. Despite the
developmentally regulated expression of these genes, analysis of foetal thymi from
Gfra1, Gfra2 or Ret deficient embryos revealed that these molecules are dispensable
for foetal T cell development. Furthermore, analysis of RET gain of function and Ret
conditional knockout mice showed that RET is also unnecessary for adult
thymopoiesis. Finally, competitive thymic reconstitution assays indicated that Ret
deficient thymocytes maintained their differentiation fitness even in stringent
developmental conditions. Thus, our data demonstrate that RET/GFRα signals are
dispensable for thymic T cell development in vivo, indicating that pharmacological
targeting of RET signalling in tumours is not likely to result in T cell production failure.
70
Methods
Mice: C57Bl/6J (CD45.2, CD45.1 and CD45.1CD45.2), Rag1-/- (CD45.2 and
CD45.1)332, hCd2-iCre333, Gfra1-/- 334, Gfra2-/- 335, and Ret-/- 253, all in C57Bl/6J
background, were bred and maintained at the IMM animal facility. Generation of as
Ret floxed (Retfl) and Ret null (Retnull) mice was already described in this thesis. All
animal procedures were performed in accordance to national and institutional
guidelines.
Flow Cytometry: Embryonic thymi were micro-dissected and either homogenized
in 70µM cell strainers or digested with Accutase medium (PAA Laboratories, Austria),
30’ at 37º. Adult thymi were homogenized in 70µm cell strainers. Single cell
suspensions were stained with the following antibodies from ebioscience, Biolegend, or
BD: anti-CD3 (145-2C11), anti-CD4 (RM4-5), anti-CD8 (53-6.7), anti-CD44 (IM7), anti-
CD25 (7D4), anti-CD45 (30-F11), anti-CD45.1 (A20), antiCD45.2 (104), anti-γδ TCR
(GL3), anti-CD117 (2B8), anti-Sca1 (D7), Lineage (Lin) cocktail (anti-CD19 (eBio1D3),
anti-CD11b (M1/70), anti-Gr.1 (RB6-8C5), anti-Ly79 (Ter119) and anti-NK1.1 (PK136)).
Antibodies were coupled to FITC, PE, PerCP, PerCP-Cy5, PE-Cy7, APC, APC-Cy7,
Pacific Blue, Brilliant Violet 421 and Horizon V500 fluorochromes or to biotin.
Secondary incubation with fluorochrome binding streptavidin was performed when
biotin coupled antibodies were used. Anti hRET was performed with antibody from
R&D (132507) and respective anti-mouse IgG1 isotype control. Flow cytometry
analysis was performed on a LSR Fortessa (BD) and data was analyzed with FlowJo
8.8.7 software (Tree Star). Cell-sorting was performed on a FACSAria I or FACSAria
III (BD), and purity of obtained samples was >97%. CD45pos and CD45neg populations
were sorted from the same samples.
Real-time PCR analysis: RNA was extracted from sorted cell suspensions using
RNeasy Micro Kit (Qiagen). Real-time PCR for Gfra1 and Gfra2 were done as
previously described256,337. Hprt1 was used as housekeeping gene. For TaqMan
assays (Applied Biosystems) RNA was retro-transcribed using High Capacity RNA-to-
cDNA Kit (Applied Biosystems), followed by a pre-amplification PCR using TaqMan
PreAmp Master Mix (Applied Biosystems). TaqMan Gene Expression Master Mix
(Applied Biosystems) was used in real-time quantitative PCR. TaqMan Gene
Expression Assays bought from Applied Biosystems were the following: Gapdh
Mm99999915_g1; Hprt1 Mm00446968_m1; Nrtn Mm03024002_m1; Gdnf
Mm00599849_m1; Ret Mm00436304_m1.
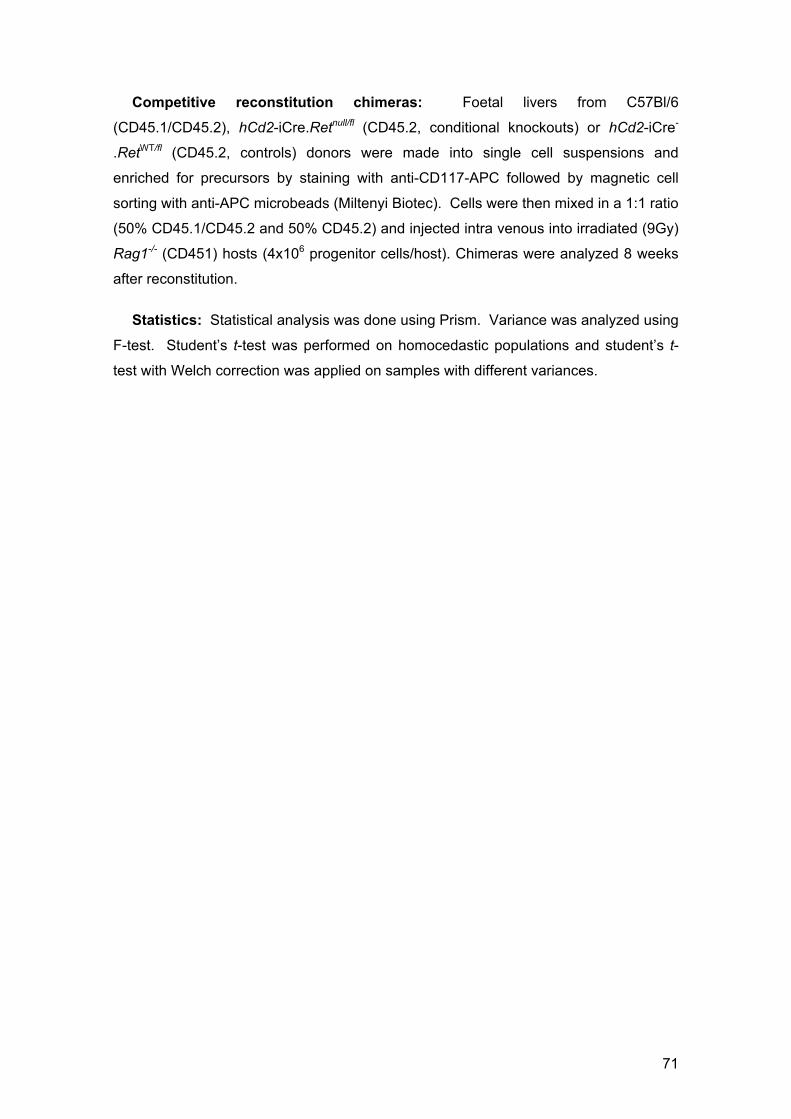
71
Competitive reconstitution chimeras: Foetal livers from C57Bl/6
(CD45.1/CD45.2), hCd2-iCre.Retnull/fl (CD45.2, conditional knockouts) or hCd2-iCre-
.RetWT/fl (CD45.2, controls) donors were made into single cell suspensions and
enriched for precursors by staining with anti-CD117-APC followed by magnetic cell
sorting with anti-APC microbeads (Miltenyi Biotec). Cells were then mixed in a 1:1 ratio
(50% CD45.1/CD45.2 and 50% CD45.2) and injected intra venous into irradiated (9Gy)
Rag1-/- (CD451) hosts (4x10⁶ progenitor cells/host). Chimeras were analyzed 8 weeks
after reconstitution.
Statistics: Statistical analysis was done using Prism. Variance was analyzed using
F-test. Student’s t-test was performed on homocedastic populations and student’s t-
test with Welch correction was applied on samples with different variances.

72
Results
T cell development occurs mainly in the thymus227. However, by the time T cell
precursors reach this primary lymphoid organ, they are not fully committed, and only
later receive the cues that engage them on a T cell fate205,227,342. Recently it came to
evidence that nervous system and immune systems share several regulatory
mechanisms and signalling pathways216. RET signalling axes are critical to the
neuronal system and kidney, but recent evidence indicates that RET signals are also
key to intestinal lymphoid organ development256,268,295. Interestingly, it was shown that
RET is expressed by mature lymphocytes and GDNF promotes DN thymocytes
survival in vitro; thus, raising the exciting possibility that RET signalling may control
thymocyte development in vivo325,331.
Initially we investigated the expression of Ret and its co-receptors in E15.5
thymocyte subsets by RT-PCR. Although most E15.5 thymocytes are at the DN
stage237, due to minute cell numbers available at this developmental stage we sorted
DN1+DN2 (pooling CD4negCD8negCD3negCD44posCD25neg and CD4negCD8negCD3neg
CD44posCD25pos cells) and DN3+DN4 thymocytes (CD4negCD8negCD3negCD44neg
CD25pos and CD4negCD8negCD3negCD44negCD25neg) by flow cytometry. We found that
while Ret, Gfra1 and Gfra2 were expressed in the foetal thymus, Gfra3 and Gfra4 were
absent (Fig. 1a). Sequentially, quantitative RT-PCR analysis confirmed expression of
Ret and Gfra1 in thymocytes at all DN developmental stages, a finding also confirmed
at the protein level for RET (Fig. 1b-c). In contrast, Gfra2 was present in DN1+DN2 but
absent from later DN stages (Fig. 1b). We then evaluated the expression of the RET-
ligands Gdnf and Nrtn in the thymic environment. We found that the main source of
these transcripts were CD45neg cells (Fig. 1d), while hematopoietic (CD45pos) DN
thymocytes only expressed minute levels of Gdnf and Nrtn (Fig. 1d-e). Thus, we
confirmed that the molecules required for active RET signalling are expressed in the
embryonic thymus, suggesting a role for these neurotrophic factor signalling axes in the
early stages of foetal thymocyte development.
In order to determine whether RET mediated signals are required for foetal
thymocyte development, we analyzed E18.5 thymus from Ret-/-, Gfra1-/- or Gfra2-/-
animals, thus including in our analysis DN thymocytes and emergent immCD8, DP and
γδ TCR thymocytes253,334,335.
Since expression of Ret, Gfra1 and Gfra2 is higher in early DN thymocytes (DN1
and DN2) (Fig. 1b), we initially evaluated these differentiation stages in Ret, Gfra1 or
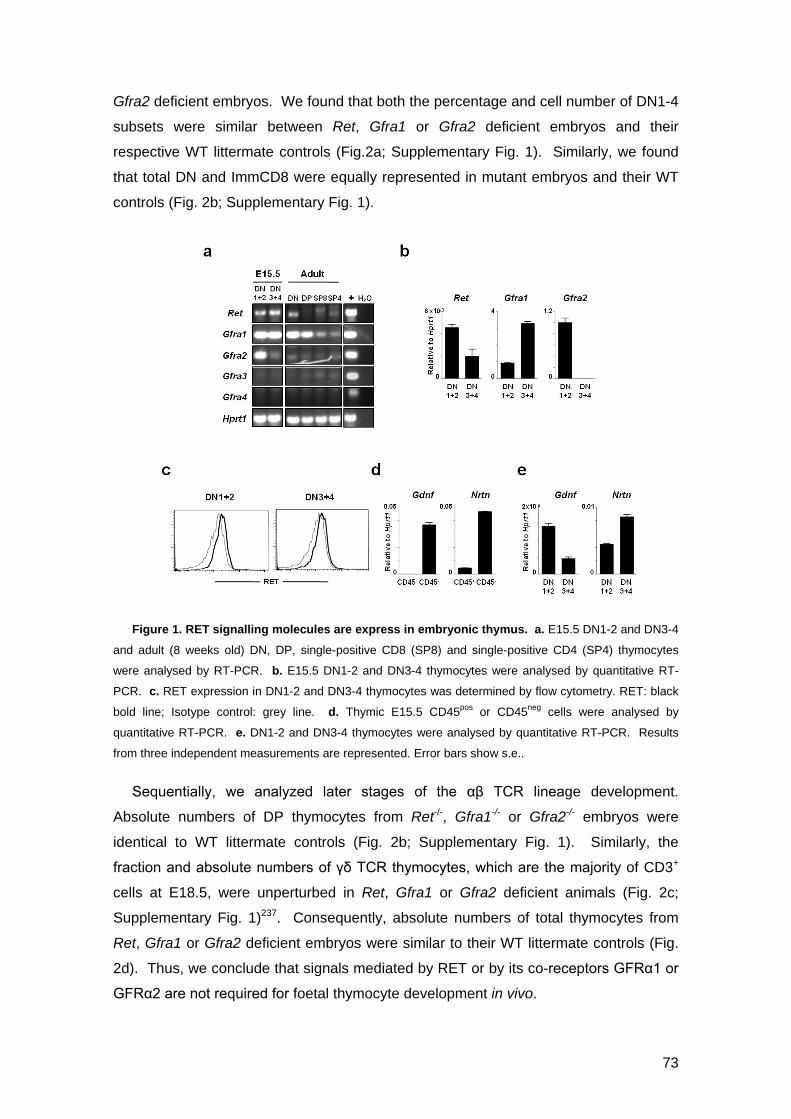
73
Gfra2 deficient embryos. We found that both the percentage and cell number of DN1-4
subsets were similar between Ret, Gfra1 or Gfra2 deficient embryos and their
respective WT littermate controls (Fig.2a; Supplementary Fig. 1). Similarly, we found
that total DN and ImmCD8 were equally represented in mutant embryos and their WT
controls (Fig. 2b; Supplementary Fig. 1).
Figure 1. RET signalling molecules are express in embryonic thymus. a. E15.5 DN1-2 and DN3-4
and adult (8 weeks old) DN, DP, single-positive CD8 (SP8) and single-positive CD4 (SP4) thymocytes
were analysed by RT-PCR. b. E15.5 DN1-2 and DN3-4 thymocytes were analysed by quantitative RT-
PCR. c. RET expression in DN1-2 and DN3-4 thymocytes was determined by flow cytometry. RET: black
bold line; Isotype control: grey line. d. Thymic E15.5 CD45pos or CD45neg cells were analysed by
quantitative RT-PCR. e. DN1-2 and DN3-4 thymocytes were analysed by quantitative RT-PCR. Results
from three independent measurements are represented. Error bars show s.e..
Sequentially, we analyzed later stages of the αβ TCR lineage development.
Absolute numbers of DP thymocytes from Ret-/-, Gfra1-/- or Gfra2-/- embryos were
identical to WT littermate controls (Fig. 2b; Supplementary Fig. 1). Similarly, the
fraction and absolute numbers of γδ TCR thymocytes, which are the majority of CD3+
cells at E18.5, were unperturbed in Ret, Gfra1 or Gfra2 deficient animals (Fig. 2c;
Supplementary Fig. 1)237. Consequently, absolute numbers of total thymocytes from
Ret, Gfra1 or Gfra2 deficient embryos were similar to their WT littermate controls (Fig.
2d). Thus, we conclude that signals mediated by RET or by its co-receptors GFRα1 or
GFRα2 are not required for foetal thymocyte development in vivo.
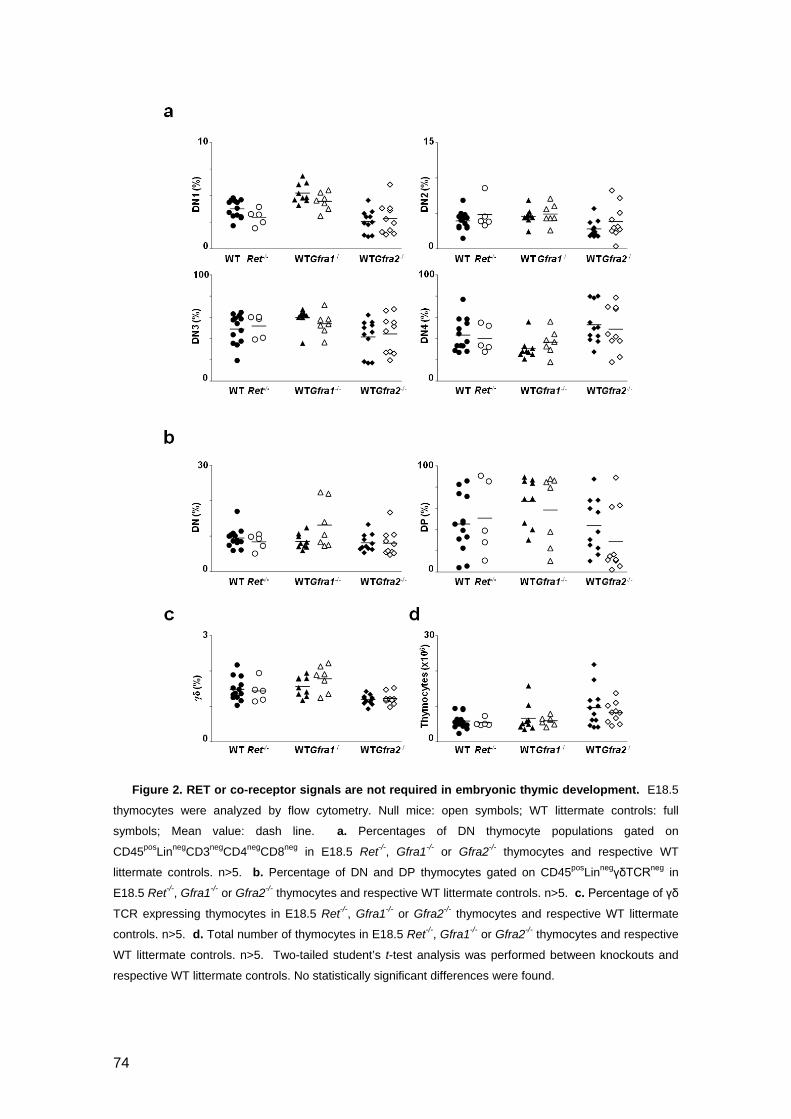
74
Figure 2. RET or co-receptor signals are not required in embryonic thymic development. E18.5
thymocytes were analyzed by flow cytometry. Null mice: open symbols; WT littermate controls: full
symbols; Mean value: dash line. a. Percentages of DN thymocyte populations gated on
CD45posLinnegCD3negCD4negCD8neg in E18.5 Ret-/-, Gfra1-/- or Gfra2-/- thymocytes and respective WT
littermate controls. n>5. b. Percentage of DN and DP thymocytes gated on CD45posLinnegγδTCRneg in
E18.5 Ret-/-, Gfra1-/- or Gfra2-/- thymocytes and respective WT littermate controls. n>5. c. Percentage of γδ
TCR expressing thymocytes in E18.5 Ret-/-, Gfra1-/- or Gfra2-/- thymocytes and respective WT littermate
controls. n>5. d. Total number of thymocytes in E18.5 Ret-/-, Gfra1-/- or Gfra2-/- thymocytes and respective
WT littermate controls. n>5. Two-tailed student’s t-test analysis was performed between knockouts and
respective WT littermate controls. No statistically significant differences were found.

75
The thymic environment supports T cell development in embryonic and adult life.
Nevertheless, T cell development in the fetus and adult thymus employs differential
pathways, leading to different viability, proliferation and lineage commitment237. Thus,
we investigated whether Ret related genes maintain their expression through adult
thymopoiesis.
DN (CD4negCD8negCD3neg), DP, single-positive CD4pos T cells (SPCD4) and single
positive CD8pos T cells (SPCD8) were FACS sorted and analyzed by quantitative RT-
PCR analysis. RT-PCR analysis revealed that similarly to the foetal thymus only Ret
and its co-receptors Gfra1 and Gfra2 were expressed in the adult thymus (Fig. 1a).
Quantitative RT-PCR confirmed that Ret, Gfra1 and Gfra2 expression was mainly
expressed by DN thymocytes, although low levels of Gfra1 and Gfra2 expression were
also expressed by DP thymocytes, a finding also confirmed at the protein level for RET
(Fig. 3a-b). Sequentially, we evaluated the expression of the RET-ligands Gdnf and
Nrtn in the adult thymus. While Gdnf expression was mostly found on CD45neg cells,
Nrtn was expressed both by CD45neg and CD45pos DN and DP thymocytes (Fig. 3c).
Figure 3. Ret and co-receptors are expressed in adult thymocytes. a. DN, DP, SPCD8pos and
SPCD4po thymocytes were analysed by quantitative RT-PCR. b. RET expression in DN and DP
thymocytes was determined by flow cytometry. RET: black bold line; Isotype control: grey line. c. DN, DP,
SPCD8pos and SPCD4pos thymocytes and thymic CD45neg cells were analysed by quantitative RT-PCR. d. DN1, DN2, DN3 and DN4 thymocytes were analysed by quantitative RT-PCR. Error bars show s.e..
Results from three independent measurements are represented.
Dissection of DN cells into DN1-DN4 subsets further revealed that DN1 thymocytes
were the only DN subset that co-expressed appreciable levels of Ret, Gfra1 and Gfra2,
while all other DN subsets expressed Gfra1 but only minute levels of Ret (Fig. 3d).
Thus, we conclude that the expression of RET signalling partners in adult thymocytes

76
mirrors to large extend the expression patterns of foetal thymocytes, ie, Ret, Gfra1 and
Gfra2 are most abundant in the earliest stages of T cell development, while Gdnf and
Nrtn are mainly produced by non-hematopoietic thymic cells.
Figure 4. RET-mediated signals are dispensable in normal T cell development. 8 week old Ret
conditional knockout hCd2-iCre.Retnull/fl (Retnull/fl) and control hCd2-iCre-.RetWT/fl (RetWT/fl) mice were
analyzed by flow cytometry. Percentages are indicated. Mean value: dash line. a. Left: Flow cytometry
analysis of CD4negCD8negCD3neg thymocytes. Right: Percentage of DN1-DN4 in Retnull/fl and control RetWT/fl
mice. RetWT/fl
n=7; Retnull/fl
n=7. b. Left: Flow cytometry analysis of CD4 versus CD8 expression profile.
Right: Percentage of DN, DP, SP4 and SP4 in Retnull/fl and control mice. RetWT/fl
n=7; Retnull/fl
n=7. c.
Proportion and total numbers of γδ TCR expressing thymocytes in Retnull/fl and control mice. RetWT/fl
n=7;
Retnull/fl
n=7. d. Total thymocyte numbers. RetWT/fl
n=7; Retnull/fl
n=7. Two-tailed student’s t-test analysis
was performed between mutant and control mice. No statistically significant differences were found.
Ret-/- animals die perinatally due to kidney failure, hindering analysis of adult T cell
development253. Thus, in order to determine the role of RET signalling in adult
77
thymopoiesis, we developed a Ret conditional knockout model (Retfl/fl) that allows a
lineage targeted strategy for Ret ablation. These mice were bred to human hCd2-iCre
animals that ensure Cre activity from DN1 stage onwards (Supplementary Fig. 2)333.
Analysis of the offspring of this breeding at 8 weeks of age showed that despite a
marginal reduction in DN1 thymocyte numbers in hCd2-iCre.Retnull/fl animals, the
subsequent DN stages were similarly represented in hCd2-iCre.Retnull/fl and hCd2-iCre-
.RetWT/fl mice (Fig. 4a; Supplementary Fig. 3). Analysis of DN to SP αβ T cell
development showed similar fractions and absolute numbers of thymocytes within each
subset (DN, DP, SP4 and SP8) in both hCd2-iCre.Retnull/fl and hCd2-iCre-.RetWT/fl mice
(Fig. 4b; Supplementary Fig. 3). Finally, the fraction and absolute numbers of thymic
γδ TCR expressing T cells and total thymocyte numbers were not affected by Ret
deletion (Fig. 4c-d). Thus, altogether our data indicate that RET-mediated signals are
dispensable for foetal and adult thymic T cell development in vivo.
Over expression and expression of gain-of-function forms of RET are characteristic
of proliferative cell phenotypes and oncogenic diseases269. Thus, in order to elucidate
whether improved RET signals could affect thymopoiesis, we used a genetic model
that drives a constitutively activated form of RET in Ret expressing cells (RetMEN2B)320.
These mice harbour a single point mutation (Met919Thr) introduced into the
endogenous Ret gene locus, thus resulting in improved ligand-dependent RET
activation320.
Analysis of RetMEN2B/MEN2B and their WT littermate controls at 8 weeks of age
revealed that DN (DN1-DN4) to SP mature αβ T cell development had similar fractions
and absolute numbers (Fig. 5a-c; Supplementary Fig. 4). Consequently, total
thymocyte numbers were not affected by the RetMEN2B gain-of-function mutation (Fig.
5d), demonstrating that this Ret gain-of-function mutation does not affect thymopoiesis.
Ret signalling has been implicated in the survival of a variety of peripheral and
central neural cells, including motor, sensory and autonomic neurons268. Furthermore,
it was shown that the RET ligand GDNF could promote thymocyte survival in foetal
thymus organ culture (FTOC) systems331. Thus, it is plausible that subtle effects of
RET signalling on thymocyte development might be masked in Ret conditional
knockouts by compensatory mechanisms at later stages of thymocyte differentiation.
In order to specifically address that hypothesis, we performed sensitive competitive
thymic repopulation assays to assess whether T cell progenitors lacking RET are able
to compete with RET competent T cell progenitors. Bone marrow cells from hCd2-
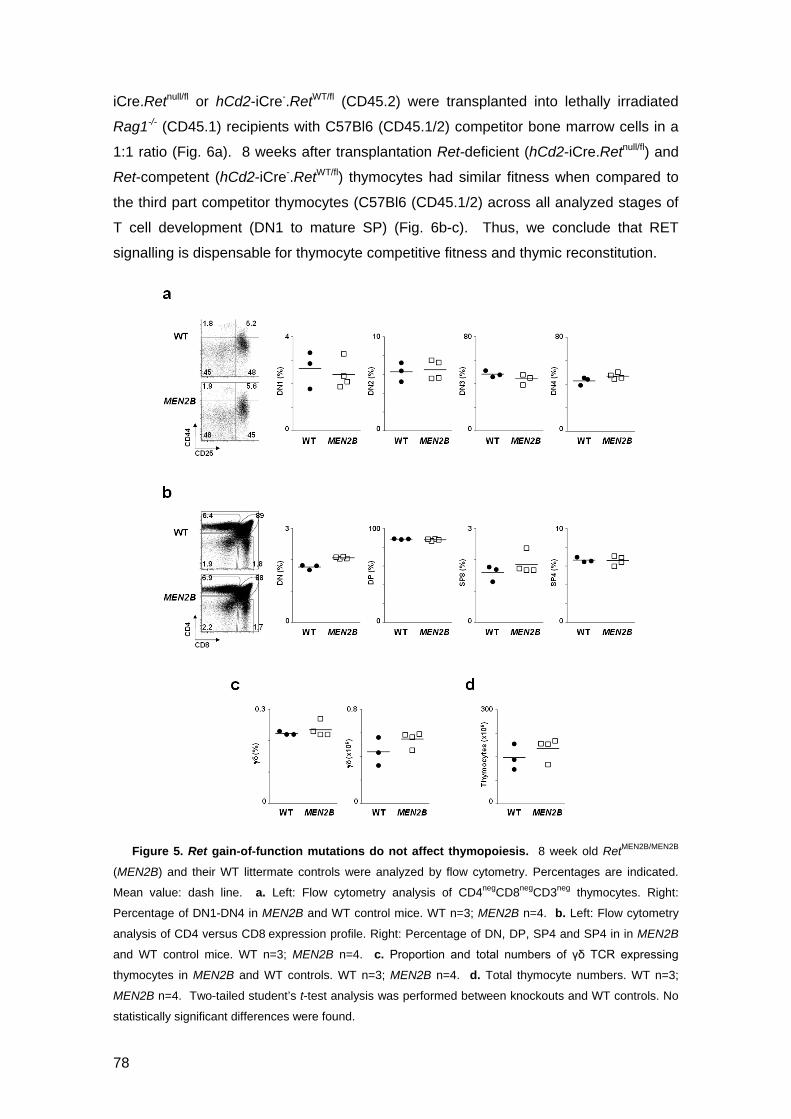
78
iCre.Retnull/fl or hCd2-iCre-.RetWT/fl (CD45.2) were transplanted into lethally irradiated
Rag1-/- (CD45.1) recipients with C57Bl6 (CD45.1/2) competitor bone marrow cells in a
1:1 ratio (Fig. 6a). 8 weeks after transplantation Ret-deficient (hCd2-iCre.Retnull/fl) and
Ret-competent (hCd2-iCre-.RetWT/fl) thymocytes had similar fitness when compared to
the third part competitor thymocytes (C57Bl6 (CD45.1/2) across all analyzed stages of
T cell development (DN1 to mature SP) (Fig. 6b-c). Thus, we conclude that RET
signalling is dispensable for thymocyte competitive fitness and thymic reconstitution.
Figure 5. Ret gain-of-function mutations do not affect thymopoiesis. 8 week old RetMEN2B/MEN2B
(MEN2B) and their WT littermate controls were analyzed by flow cytometry. Percentages are indicated.
Mean value: dash line. a. Left: Flow cytometry analysis of CD4negCD8negCD3neg thymocytes. Right:
Percentage of DN1-DN4 in MEN2B and WT control mice. WT n=3; MEN2B n=4. b. Left: Flow cytometry
analysis of CD4 versus CD8 expression profile. Right: Percentage of DN, DP, SP4 and SP4 in in MEN2B
and WT control mice. WT n=3; MEN2B n=4. c. Proportion and total numbers of γδ TCR expressing
thymocytes in MEN2B and WT controls. WT n=3; MEN2B n=4. d. Total thymocyte numbers. WT n=3;
MEN2B n=4. Two-tailed student’s t-test analysis was performed between knockouts and WT controls. No
statistically significant differences were found.

79
Figure 6. RET signalling is dispensable for thymic reconstitution and thymocyte fitness. a.
Sheme of competitive transplantation. hCd2-iCre.Retnull/fl or hCd2-iCre-.RetWT/fl control progenitors
(CD45.2) were transplanted together with competitor precursors (CD45.1/2) into lethally irradiated Rag1-/-
(CD45.1). b. c. Ratio between hCd2-iCre.Retnull/fl (Retnull/fl
– grey bars) or hCd2-iCre-.RetWT/fl (RetWT/fl
–
black bars) and the third part WT competitor through thymic T cell development, 8 weeks after
transplantation. RetWT/fl
n=4; Retnull/fl
n=4. Error bars show s.d. Two-tailed student t-tests were performed.
No significant differences were found.

80
Discussion
Our data indicate that the neuroregulatory genes Ret, Gfra1 and Gfra2 are
expressed in discrete DN thymocytes, while Gfra3 and Gfra4 transcripts were absent in
thymocytes. Interestingly, the RET ligands Gdnf and Nrtn are predominantly produced
by non-hematopoietic thymic cells. These gene expression patterns raised the exciting
possibility that RET signalling axes could control T cell development, adding to the
growing body of evidence that the nervous and immune systems share similar key
molecular signals256,295,323-325,331. In line with this hypothesis, it was previously shown
that GDNF could promote survival and maturation of thymocytes in vitro331.
In order to test whether RET signalling axes control T cell development, we
analyzed the thymus of genetically mutant embryos for Ret, Gfra1 or Gfra2 at
E18.5253,334,335. Despite expression of Ret in foetal thymocytes, Ret deficient embryos
showed normal DN, immCD8 DP and γδ T cell development. These findings were also
consistent with normal T cell development in null mice for the RET co-receptors that
provide specificity to the neurotrophic factors GDNF and NRTN, respectively Gfra1-/-
and Gfra2-/- mice. Thus, we conclude that RET and its signalling partners GFRα1 and
GFRα2, are dispensable for foetal T cell development.
Since T cell development in adulthood employs additional molecular mechanisms to
foetal thymopoiesis, we investigated whether Ret related genes controlled adult T cell
development. Our data indicate co-expression of Ret, Gfra1 and Gfra2 in the early
DN1 stage, and production of Gdnf and Nrtn in the adult thymic microenvironment.
Both foetal and adult immature thymocytes co-express Ret, Gfra1 and Gfra2. These
data are in line with a previous report indicating expression of these genes in the foetal
thymus by in situ hybridization343. However, DP thymocytes expressed the RET co-
receptors Gfra1 and Gfra2, despite absence of Ret expression, and similarly, adult
DN2-4 expressed Gfra1 but lacked significant Ret expression. This observation is in
line with previous reports showing that GFRαs are more abundantly expressed than
RET, which suggests that GFRαs may modulate RET signalling in a non-cell-
autonomous manner (signalling in trans)291,344-346. Accordingly, we have recently shown
that Lymphoid Tissue initiator cells use unconventional RET signalling in which
receptor activation is provided by soluble ligand and co-receptors in trans secreted
from nearby cells295. Thus, it is possible that RET negative, GFRα positive thymocytes
may modulate the activity of neighbouring non-hematopoietic RET expressing cells.

81
Analysis of adult conditional Ret mutant mice (Retfl/fl) bred to hCd2-Cre mice
revealed a significant, but small impact on the absolute numbers of DN1 thymocytes.
However, this reduction was not translated into consecutive developmental stages,
indicating that RET mediated signals are dispensable to T cell production in vivo. The
co-expression of Ret/Gfra1 in DN1 and the decreased number of DN1 cells in Retfl/fl
mice are consistent with a previous report indicating that GDNF promotes thymocyte
survival in foetal thymic organ cultures (FTOCs)331. Nevertheless, our data does not
support a major role for this signalling axis in vivo, since Ret mutant thymocytes
develop normally and positive modulation of RET-signalling (RetMEN2B) was not
beneficial for T cell development. Thus, the contribution of RET signalling to T cell
development in vivo appears to be insignificant. Moreover, while FTOCs reproduce
several aspects of T cell development199, they fail to mimic the exact events in T cell
development15,347, and therefore these different methodologies may also contribute to
the observed discrepancies.
GDNF/GFRα1 have been shown to activate the transmembrane receptor RET and
the neural cell adhesion molecule (NCAM) in neurons278,298. Thus, although activation
of a putative NCAM analogue by GDNF cannot be fully discarded in thymocytes, this is
unlikely to have a significant physiological relevance since NCAM downstream
signalling requires GFRα1 and Gfra1-/- embryos displayed normal thymopoiesis298.
In order to overcome possible viability/proliferative compensatory mechanisms that
may arise through T cell development, we performed sensitive competitive
reconstitution assays in vivo with Ret deficient (hCd2-iCre.Retnull/fl) and Ret competent
(hCd2-iCre-.RetWT/fl) thymocytes. Our data demonstrate that even in a very sensitive
competitive setting the fitness of Ret deficient T cell precursors is intact.
Finally, our findings indicate that pharmacological inhibition of the RET pathway in
severe pathologies, such as medullary thyroid cancer, should not be confronted with
undesirable T cell production failure348,349.
In summary, our data demonstrate that RET signalling is dispensable to foetal and
adult T cell development in vivo. Nevertheless, RET and its signalling partners are also
expressed by mature T cells325, thus, lineage targeted strategies will be critical to
elucidate the contribution of RET signals to T cell function.
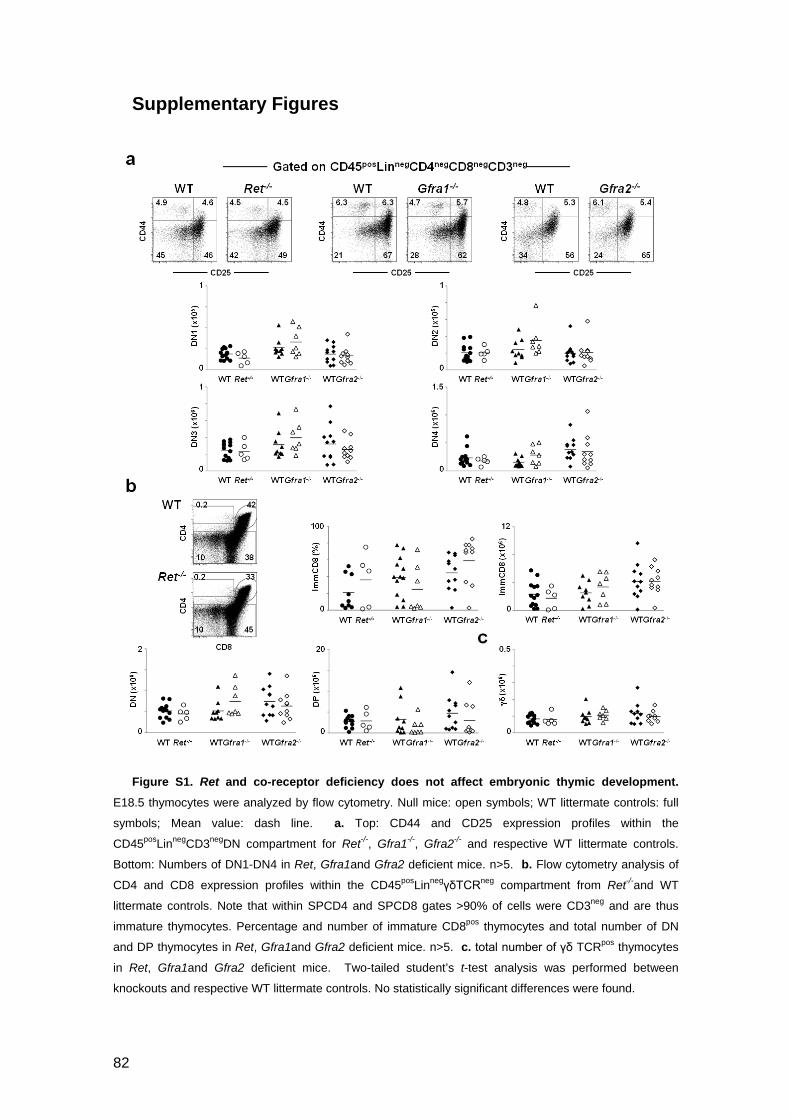
82
Supplementary Figures
Figure S1. Ret and co-receptor deficiency does not affect embryonic thymic development. E18.5 thymocytes were analyzed by flow cytometry. Null mice: open symbols; WT littermate controls: full
symbols; Mean value: dash line. a. Top: CD44 and CD25 expression profiles within the
CD45posLinnegCD3negDN compartment for Ret-/-, Gfra1-/-, Gfra2-/- and respective WT littermate controls.
Bottom: Numbers of DN1-DN4 in Ret, Gfra1and Gfra2 deficient mice. n>5. b. Flow cytometry analysis of
CD4 and CD8 expression profiles within the CD45posLinnegγδTCRneg compartment from Ret-/-and WT
littermate controls. Note that within SPCD4 and SPCD8 gates >90% of cells were CD3neg and are thus
immature thymocytes. Percentage and number of immature CD8pos thymocytes and total number of DN
and DP thymocytes in Ret, Gfra1and Gfra2 deficient mice. n>5. c. total number of γδ TCRpos thymocytes
in Ret, Gfra1and Gfra2 deficient mice. Two-tailed student’s t-test analysis was performed between
knockouts and respective WT littermate controls. No statistically significant differences were found.

83
Figure S2. hCd2-iCre is active in thymocytes from DN1 developmental stage. In order to evaluate
the activity of Cre recombinase driven by hCd2, we bred hCd2-iCre-expressing animals to Rosa26eYFP
animals. Histograms show flow cytometry analysis of eYFP expression in DN1 to DN4 thymocytes.
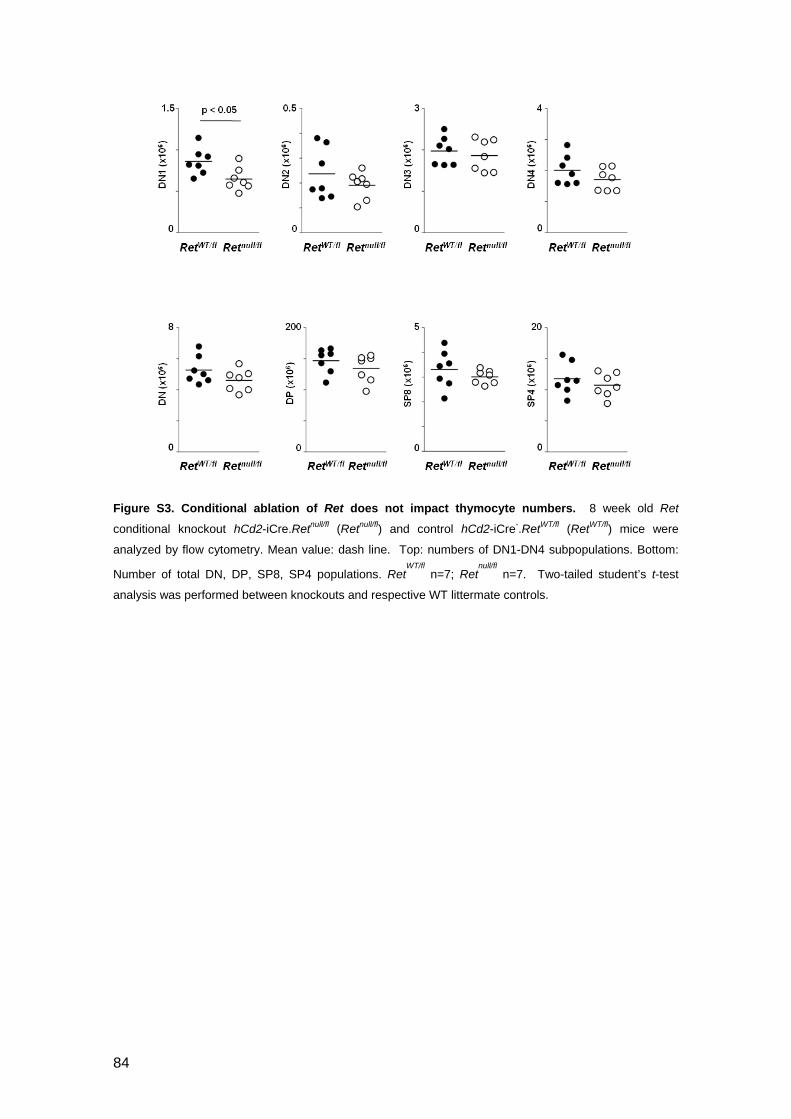
84
Figure S3. Conditional ablation of Ret does not impact thymocyte numbers. 8 week old Ret
conditional knockout hCd2-iCre.Retnull/fl (Retnull/fl) and control hCd2-iCre-.RetWT/fl (RetWT/fl) mice were
analyzed by flow cytometry. Mean value: dash line. Top: numbers of DN1-DN4 subpopulations. Bottom:
Number of total DN, DP, SP8, SP4 populations. RetWT/fl
n=7; Retnull/fl
n=7. Two-tailed student’s t-test
analysis was performed between knockouts and respective WT littermate controls.

85
Figure S4. RetMEN2B gain-of-function mutation does not affect adult thymic development. 8 week old
RetMEN2B/MEN2B (MEN2B) and their WT littermate controls were analyzed by flow cytometry. Mean value:
dash line. Top: numbers of DN1-DN4 subpopulations. Bottom: Number of total DN, DP, SP8, SP4
populations. WT n=7; MEN2B n=7. Two-tailed student’s t-test analysis was performed between knockouts
and respective WT littermate controls. No statistically significant differences were found.


87
GENERAL DISCUSSION
Reciprocal interactions between particular cell types and their neighbour cells are
the driving force of tissue formation in ontogeny. Haematopoietic cells interact with
non-haematopoietic stroma cells forming particular microenvironments, or niches.
Haematopoietic stem cell niches provide the specific cues that regulate HSC function.
These can be direct cell to cell interactions using membrane-bound receptors or
soluble signalling molecules such as cytokines and growth factors. Tyrosine kinase
receptors encompass receptors for soluble molecules as well as membrane-bound
ligands. In these thesis we analysed the role of RET tyrosine kinase receptor in
haematopoietic cell development. Our data revealed that RET is crucial for
haematopoietic stem cell (HSC) survival, but unnecessary to T cell development.
Initially we confirmed that Ret and it co-receptors are expressed in haematopoietic
cells in primary lymphoid organs and RET ligands are produced by stromal cells321-326.
Surprisingly, we found that compared with more committed progenitors, HSCs express
higher levels of RET signalling molecules and importantly, cells in the HSC
microenvironment, such as osteoblasts and mesenchymal stem cells in the bone
marrow niches, produce RET ligands. The production of soluble GFLs by neighbour
cells in HSCs microenvironments is critical for their possible function in HSC biology as
GFLs were described to bind to heparan sulphates in the extracellular matrix, thus
preventing their diffusion and increasing local concentration350.
In agreement, ablation of Ret resulted in reduced foetal and adult HSC numbers.
Ret-/- HSCs were inefficient in reconstituting the haematopoietic system, which reveals
the importance of RET signalling in HSC function. As Ret deficiency results in several
problems in the nervous system and kidney development, systemic embryonic defects
could contribute to the differences between Ret-/- and conditional Ret deficient
embryos253. However, our data does not support this hypothesis. First, analysis of
Gfra1-/- deficient animals, which phenocopy the defects of Ret-/- embryos in kidney and
nervous system development and also die perinatally, show normal haematopoiesis,
which indicates that intrinsic haematopoietic defects are present in Ret deficient
animals334. Second, adoptive transfer the same number of RET deficient cells and WT
competitor cells showed that Ret-/- haematopoietic progenitors have impaired
haematopoietic activity. Whereas these could be explained in the primary transfers by
deficiencies in the microenvironment in which HSCs where generated, secondary
transplantation clearly shows cell autonomous requirement of RET by HSCs, since WT
88
and Ret-/- cells where maintained in the same animals. Third, conditional deletion of
Ret in the haematopoietic system in Vav1-iCrepos.Retnull/fl mice, which maintain a normal
RET proficient animal; also present a significant reduction in HSCs.
Our data further suggest that RET signalling is particularly important in situations of
proliferative responses, like foetal development and transplantation, as Ret is
upregulated in haematopoietic progenitors after transplantation. In accordance,
although Ret deficient animals in adulthood live with no noticeable problems, their
stress response after chemical aggression is defective.
RET signalling has distinct outcomes depending on the cell types in which it
operates. Nevertheless, it is reasonable to claim that providing migratory/chemotaxis
and survival cues are two of its main functions255-257,295. Contrary to what was observed
in lymphoid tissue initiator cells (LTin), where GFLs act by changing the motility
behaviour of LTin cells, inducing adhesion-dependent motility arrest, we could not
detect any effect of RET in the migration and homing of HSCs to lymphoid organs295.
Strikingly our results show that RET provides anti-apoptotic signals to HSCs by cAMP
response element-binding protein (CREB) dependent transcription of anti-apoptotic B-
cell CLL/lymphoma 2 (BCL2) family members, BCL2 and BCLxL, and that restoration
of these downstream surviving signals is required and sufficient to recover HSC fitness
in the absence of RET. In fact, CREB dependent BCL2 expression was shown to be
crucial for NGF-dependent survival of sympathetic neurons and for HSC maintenance
downstream CaM kinase IV185,351. Moreover, overexpression of BCL2 increases the
number, quiescence and repopulation capacity of haematopoietic progenitors183.
Several canonical signalling pathways, such as mitogen-activated protein (MAP)
kinases p42/p44 (ERK1/2), p38 MAP kinase and PI3K/Akt pathways, which were
shown to act downstream of RET could be responsible for CREB phosphorylation and
consequent Bcl2 and Bcl2l1 expression. In neuronal cell lines, CREB phosphorylation
upon RET activation was shown to critically depend on ERK1/2 signalling pathway;
however CREB activation downstream of several tyrosine receptor kinases depend
both of ERK1/2 and p38 signalling axes307,352,353. Indeed our results indicate that in
HSCs activation of p38 MAP kinase by RET signalling is critical for CREB
phosphorylation and anti-apoptotic gene expression. Together these results show that
haematopoietic and neuronal cells may use similar molecular mechanisms to obtain
survival and maintenance signals, although the internal wiring of these signals may
differ. Moreover, these data suggest a possible co-regulation in shared
microenvironments, such as the bone marrow niches.
89
In our work we also observed that Ret-/- progenitors have a significant altered cell
cycle status measured by Ki-67 expression. Compared with WT controls, Ret deficient
animals have a higher proportion of cells in cycle (Ki-67pos), and consequentially
reduced number of quiescent cells, which was previously shown to result in HSC
exhaustion and loss of haematopoietic activity338. Nevertheless, both in LSK cells and
HSCs, the genetic signature of Ret-/- haematopoietic progenitors was not altered.
Expression of genes involved in HSC expansion and proliferation such as HOX
proteins and their co-regulators, Meis1 and Pbx3, as well as relevant molecules for
HSC quiescence and self-renewal, like Evi1, Tek and its ligand Angpt1, was similar
between WT and Ret-/- progenitors135,136,149,152,153,157. Similarly, expression of
phenotypic markers of HSCs, Slamf1 and Thy1, and more important of the cell cycle
regulator p21 was not affected by the lack of RET70,72,144,354. Thus we postulate that
rather than a direct effect of RET in cell cycle regulation, poor HSC survival followed by
recruitment of quiescent cells into cycle cause the observed reduction in quiescent
HSCs and the loss of repopulation capacity due to exhaustion of the HSC pool.
RET kinase receptor emerges as a new regulator of HSC survival and may be used
to modulate HSC fitness. Our work suggest that RET is critical in situations of
proliferative stress such as foetal haematopoiesis, chemical aggression and
transplantation. Accordingly we found that in vitro pre-treatment of HSC with RET
ligands increase their transplantation efficiency. Interestingly, we found that Ret-/-
progenitors have poor CFU-s generation and fail to rapidly reconstitute the
haematopoietic system of irradiated recipients. The CFU-s is a heterogeneous
population of myeloid and multipotent progenitors also responsible for rapidly transient
reconstitution that allow the irradiated host to survive initial haematopoietic aplasia and
anaemia, before the durable engraftment provided by HSCs72,81,82. Thus the
deficiencies observed in early reconstitution assays suggest that either defects present
in Ret-/- HSCs permanently affect the subsequent more committed cells or, at least in
transplantation settings, RET signals at the HSC level may empower more committed
progenitors with improved surviving capacities.
Remarkably, we found that human haematopoietic progenitors also express RET.
Although further studies are needed to dissect the role of RET in human HSCs, very
preliminary data from our lab suggest that human haematopoietic stem cells survive
better in vitro in the presence of GFLs. If modulation of RET signalling also favours in
vivo human HSCs responses will be subject to future studies. Nevertheless, our work

90
unveils the exciting possibility of using GFLs in HSC expansion protocols to improve
bone marrow and cord blood stem cell fitness.
GDNF was previously shown to promote survival and maturation of thymocytes in
vitro. Thereafter, we investigate the role of RET signalling in thymocyte development in
vivo, first by confirming the expression of the neuroregulatory genes Ret, Gfra1 and
Gfra2 in thymocytes331,343. Interestingly RET ligands Gdnf and Nrtn are predominantly
produced by non-hematopoietic thymic cells, which rose the interestingly possibility that
RET signalling axes could control T cell development. However Ret deficient embryos
showed normal thymocyte development, and consistently, null embryos for the RET co-
receptors that provide specificity to the neurotrophic factors GDNF and NRTN,
respectively Gfra1-/- and Gfra2-/-, have normal T cell development. Thus, we conclude
that RET and its signalling partners GFRα1 and GFRα2 are dispensable for foetal T
cell development.
Sequentially we evaluate the impact of Ret ablation in adult thymopoiesis. We
found Gdnf and Nrtn expression in the adult thymic microenvironment and expression
of Ret and Gfra co-receptors in DN1 thymocytes. Interestingly, it is possible that more
committed DN and DP thymocytes, which express Gfra co-receptors but lack Ret
expression, control RETpos thymocytes by providing soluble GFRαs. Similarly our
laboratory showed that LTin cell in the embryo use RET signalling in trans where GFRα
co-receptors are provided by neighbour cells295. Nevertheless analysis of adult
conditional Ret mutant mice (Retfl/fl) bred to hCd2-iCre mice revealed a small reduction
on the absolute numbers of DN1 thymocytes. Although Ret may act directly on early
DN1 thymocytes, it is also possible that prior to thymus seeding, deletion of Ret in bone
marrow progenitors by early expression of hCd2-iCre may contribute to the observed
reduction in DN1 thymocytes. However, regardless of its origin, this reduction in DN1
thymocytes is rapidly compensated and is not translated into consecutive
developmental stages, thus indicating that RET mediated signals are also dispensable
for adult T cell production in vivo. Accordingly, positive modulation of RET-signalling
(RetMEN2B) was not beneficial for T cell development. By transplanting Ret-/- and WT
progenitors into irradiated hosts, we found that even in very sensitive competitive
reconstitution assays, which ride out possible non-cell autonomous compensatory
mechanisms in Ret deficient animals, the fitness of Ret deficient T cell precursors is
intact and similar to WT controls. Thus, while the co-expression of Ret/Gfra1 in DN1
and the decreased number of DN1 cells in Retfl/fl mice are consistent with the previous
reported survival effect of GDNF in FTOCs, it is likely that during T cell development in
91
vivo, other molecules compensate for the absence of RET331. Finally, it is possible that
pathological or stressed conditions may resemble the in vitro serum free FTOCs used
in the previous study, and that contrary to homeostasis, stressed thymopoiesis may
actively profit from GFLs signals.
GDNF signalling independent of RET was also shown, particularly by activation of
the neural cell adhesion molecule (NCAM) in neurons298. A similar effect in thymocytes
could explain the survival effect reported in GDNF treated in vitro cultures.
Nevertheless, GFL signalling still need its cognate co-receptor. However, we found no
significant differences in GFRα1 and GFRα2 deficient embryos, thus RET independent
GFL signalling is unlikely to have an important role in thymopoiesis.
RET and its signalling partners were shown to be expressed in several
haematopoietic cells, particularly by mature T cells; thereafter it may impact T cell
function while being dispensable for T cell development325. Thus, it would be
interesting to evaluate the importance of RET signals in specific T cell responses.
The kinase receptor RET has a myriad of functions that include the provision of
migratory and survival signals to several neuronal subpopulations, regulation of
spermatogenesis, renal development and enteric lymphoid organogenesis. Herein we
have shown that while RET is critical to HSC response to physiological demand, it is
dispensable for proper T cell development in vivo. Interestingly, previous studies in
animal models and human patients showed that sustained or deregulated RET
activation may cause several non haematopoietic cancers, particularly thyroid
carcinomas. Importantly, Ret expression has been also detected in haematopoietic
cancers, and RET anti-apoptotic downstream targets BCL2 and BCLxL have oncogene
potential. However our results showed that transient RET signalling significantly
improves HSC transplantation but does not affect haematopoietic cell differentiation.
Thus the possible application of GFLs treatment to improve HSC transplantation should
not be damped by the fear of establishment of haematological malignancies.
Pharmacological inhibition of the RET signalling pathway has been considered in
severe malignancies, such as medullary thyroid cancer348,349. Although some
haematopoietic perturbations may occur from RET signalling inhibition, we observe that
adult HSCs in conditional Ret deficient animals seem to be less dependent of RET than
active proliferating foetal or stressed HSCs. Consequently, inhibition of RET signalling
is expected to affect mainly RET-dependent cancers, which normally have increased
RET activity due to mutations in the Ret gene, such as in patient with MEN 2

92
syndromes. Importantly, as Ret deficiency has no impact in thymopoiesis, inhibition of
RET signalling is not likely to compromise the development of T cells, crucial to
maintain protective immunity.
The work presented in this thesis illustrates how molecular mechanisms historically
associated with specific tissues are used by cells with different origins. We showed
that haematopoietic stem cells receive neurotrophic survival signals through the RET
receptor. Signals from nervous cells were already shown to regulate haematopoiesis
by different mechanisms. Adrenergic neurotransmitters regulate HSC niche
components, such as osteoblasts and mesenchymal stem cells, indirectly influencing
HSC responses like proliferation and BM egress212,217-219. Nervous fibres were also
seen in association with MSCs and HSCs and can controls HSCs directly, as both
human and mice HSCs express adrenergic receptors221,222. Moreover, glial cells
ensheathing non-myelinatined autonomic nerves in BM control HSC maintenance and
quiescence by regulating activation of latent TGFβ220. Still, neurotrophic factors are not
neuronal signals but crucial growth factors to maintain several nervous populations.
The finding that HSCs also respond to GFLs suggests that HSCs and neuronal cells
use common regulatory pathways. The importance of this shared mechanism in HSCs
microenvironments is still not understood and should be the focus of futures studies.
Nevertheless we should consider the hypothesis that RET signalling components may
be part of an active crosstalk mechanism between these two systems. As several
players in HSCs niche produce GFLs one may conceive that in these
microenvironments neurotrophic signals are used to maintain both haematopoietic
progenitors and nervous cells. Moreover we can imagine the possibility that HSCs
directly impact neuronal functions by consumption of neurotrophic factors. HSCs might
regulate neuronal cells by keeping a determine amount of available GFLs.
Furthermore, the amount of available GFLs in the HSC niches might be read by
nervous cells as an indicator of the haematopoietic status, since with our results we
would expect that active proliferating cells, in which RET signalling plays a crucial role,
cause a reduction in GFLs; whereas cell aplasia would increase GFL availability.
Interestingly, the proposed crosstalk probably have a complex subtle architecture as
we found that HSCs respond to multiple RET ligands, whereas different nervous
populations where shown to depend on specific GFL-GFRα-RET axes, thus expanding
the possibilities of HSC-nervous cell-microenvironment interactions.
In addition to non-haematopoietic stroma cells in the HSC niche, increasing
evidence shows involvement of mature haematopoietic cells in HSC regulation.

93
Recently, T cells were shown to be required for parathyroid hormone derived HSC
expansion355. Importantly, while we found no requirement for RET signals in T cell
differentiation; mature T cells also express RET signalling molecules. Therefore, an
interaction between T cells and HSCs using RET mediated signals cannot be excluded
and should be taken in consideration when analysing the impact of RET in mature T
cell populations.

95
REFERENCES
1 Paul, W. E. Fundamental Immunology. (Lippincott Williams & Wilkins, 1984).
2 Haar, J. L. & Ackerman, G. A. A phase and electron microscopic study of
vasculogenesis and erythropoiesis in the yolk sac of the mouse. The Anatomical
Record 170, 199-223, (1971).
3 Brewer, D. B. Max Schultze (1865), G. Bizzozero (1882) and the discovery of the
platelet. British Journal of Haematology 133, 251-258, (2006).
4 Davie, E. W. & Ratnoff, O. D. Waterfall sequence for intrinsic blood clotting. Science
145, 1310-1312, (1964).
5 Janeway, C. A., Jr. & Medzhitov, R. Innate immune recognition. Annual Review
Immunology 20, 197-216, (2002).
6 Takeuchi, O. & Akira, S. Pattern recognition receptors and inflammation. Cell 140,
805-820, (2010).
7 Spits, H. & Di Santo, J. P. The expanding family of innate lymphoid cells: regulators
and effectors of immunity and tissue remodeling. Nature Immunology 12, 21-27,
(2011).
8 Cumano, A. & Godin, I. Ontogeny of the hematopoietic system. Annual Review
Immunology 25, 745-785, (2007).
9 Moore, M. A. & Metcalf, D. Ontogeny of the haemopoietic system: yolk sac origin of in
vivo and in vitro colony forming cells in the developing mouse embryo. British Journal
of Haematology 18, 279-296, (1970).
10 Durand, C. & Dzierzak, E. Embryonic beginnings of adult hematopoietic stem cells.
Haematologica 90, 100-108, (2005).
11 Medvinsky, A. & Dzierzak, E. Definitive hematopoiesis is autonomously initiated by the
AGM region. Cell 86, 897-906, (1996).
12 Davidson, A. J. & Zon, L. I. The 'definitive' (and 'primitive') guide to zebrafish
hematopoiesis. Oncogene 23, 7233-7246, (2004).
96
13 Moore, M. A. & Owen, J. J. Experimental studies on the development of the thymus.
The Journal of Experimental Medicine 126, 715-726, (1967).
14 Miller, J. F. & Osoba, D. Current concepts of the immunological function of the thymus.
Physiological Reviews 47, 437-520, (1967).
15 Ciofani, M. & Zuniga-Pflucker, J. C. The thymus as an inductive site for T
lymphopoiesis. Annual Review Cell and Developmental Biology 23, 463-493, (2007).
16 Cooper, M. D. et al. The functions of the thymus system and the bursa system in the
chicken. The Journal of Experimental Medicine 123, 75-102, (1966).
17 Yasuda, M. et al. The sheep and cattle Peyer's patch as a site of B-cell development.
Veterinary Research 37, 401-415, (2006).
18 Reynolds, J. D. et al. Ilal Peyer's patch emigrants are predominantly B cells and travel
to all lymphoid tissues in sheep. European Journal of Immunology 21, 283-289,
(1991).
19 Fu, Y. X. & Chaplin, D. D. Development and maturation of secondary lymphoid
tissues. Annual Review Immunology 17, 399-433, (1999).
20 Mebius, R. E. Organogenesis of lymphoid tissues. Nature Reviews Immunology 3,
292-303, (2003).
21 van de Pavert, S. A. & Mebius, R. E. New insights into the development of lymphoid
tissues. Nature Reviews Immunology 10, 664-674, (2010).
22 Smith, C. Hematopoietic stem cells and hematopoiesis. Cancer Control 10, 9-16,
(2003).
23 Reya, T. et al. Stem cells, cancer, and cancer stem cells. Nature 414, 105-111,
(2001).
24 Tolar, J. et al. Hematopoietic cell transplantation for nonmalignant disorders. Biology
of Blood and Marrow Transplantation 18, S166-S171, (2012).
25 Palis, J. et al. Development of erythroid and myeloid progenitors in the yolk sac and
embryo proper of the mouse. Development 126, 5073-5084, (1999).

97
26 Cumano, A. et al. Lymphoid potential, probed before circulation in mouse, is restricted
to caudal intraembryonic splanchnopleura. Cell 86, 907-916, (1996).
27 Cumano, A. et al. Intraembryonic, but not yolk sac hematopoietic precursors, isolated
before circulation, provide long-term multilineage reconstitution. Immunity 15, 477-485,
(2001).
28 Medvinsky, A. L. et al. An early pre-liver intraembryonic source of CFU-S in the
developing mouse. Nature 364, 64-67, (1993).
29 Ivanovs, A. et al. Highly potent human hematopoietic stem cells first emerge in the
intraembryonic aorta-gonad-mesonephros region. The Journal of Experimental
Medicine 208, 2417-2427, (2011).
30 Huber, T. L. et al. Haemangioblast commitment is initiated in the primitive streak of the
mouse embryo. Nature 432, 625-630, (2004).
31 Vogeli, K. M. et al. A common progenitor for haematopoietic and endothelial lineages
in the zebrafish gastrula. Nature 443, 337-339, (2006).
32 Mandal, L. et al. Evidence for a fruit fly hemangioblast and similarities between lymph-
gland hematopoiesis in fruit fly and mammal aorta-gonadal-mesonephros mesoderm.
Nature Genetics 36, 1019-1023, (2004).
33 Ema, M. et al. Combinatorial effects of Flk1 and Tal1 on vascular and hematopoietic
development in the mouse. Genes & Development 17, 380-393, (2003).
34 de Bruijn, M. F. et al. Definitive hematopoietic stem cells first develop within the major
arterial regions of the mouse embryo. The EMBO Journal 19, 2465-2474, (2000).
35 Cumano, A. et al. [Intra-embryonic hematopoiesis in mice]. Comptes Rendus des
Seances de la Societe de Biologie et de ses Filiales 189, 617-627, (1995).
36 Gekas, C. et al. The placenta is a niche for hematopoietic stem cells. Developmental
Cell 8, 365-375, (2005).
37 Ottersbach, K. & Dzierzak, E. The murine placenta contains hematopoietic stem cells
within the vascular labyrinth region. Developmental Cell 8, 377-387, (2005).

98
38 Robin, C. et al. Human placenta is a potent hematopoietic niche containing
hematopoietic stem and progenitor cells throughout development. Cell Stem Cell 5,
385-395, (2009).
39 Houssaint, E. Differentiation of the mouse hepatic primordium. II. Extrinsic origin of the
haemopoietic cell line. Cell Differentiation 10, 243-252, (1981).
40 Kumaravelu, P. et al. Quantitative developmental anatomy of definitive haematopoietic
stem cells/long-term repopulating units (HSC/RUs): role of the aorta-gonad-
mesonephros (AGM) region and the yolk sac in colonisation of the mouse embryonic
liver. Development 129, 4891-4899, (2002).
41 Morrison, S. J. et al. The purification and characterization of fetal liver hematopoietic
stem cells. Proceedings of the National Academy of Sciences 92, 10302-10306,
(1995).
42 Ema, H. et al. In vitro self-renewal division of hematopoietic stem cells. The Journal of
Experimental Medicine 192, 1281-1288, (2000).
43 Masuda, K. et al. Thymic anlage is colonized by progenitors restricted to T, NK, and
Dendritic cell lineages. The Journal of Immunology 174, 2525-2532, (2005).
44 Bertrand, J. Y. et al. Fetal spleen stroma drives macrophage commitment.
Development 133, 3619-3628, (2006).
45 Djaldetti, M. et al. Hematopoiesis in the embryonic mouse spleen: an electron
microscopic study. Blood 39, 826-841, (1972).
46 Sasaki, K. & Matsumura, G. Spleen lymphocytes and haemopoiesis in the mouse
embryo. Journal of Anatomy 160, 27-37, (1988).
47 Christensen, J. L. et al. Circulation and chemotaxis of fetal hematopoietic stem cells.
PLoS Biology 2, 16, (2004).
48 Bowie, M. B. et al. Hematopoietic stem cells proliferate until after birth and show a
reversible phase-specific engraftment defect. The Journal of Clinical Investigation 116,
2808-2816, (2006).
49 Godin, I. et al. Stem cell emergence and hemopoietic activity are incompatible in
mouse intraembryonic sites. The Journal of Experimental Medicine 190, 43-52, (1999).

99
50 Wolber, F. M. et al. Roles of spleen and liver in development of the murine
hematopoietic system. Experimental Hematology 30, 1010-1019, (2002).
51 Medvinsky, A. et al. Embryonic origin of the adult hematopoietic system: advances
and questions. Development 138, 1017-1031, (2011).
52 Orford, K. W. & Scadden, D. T. Deconstructing stem cell self-renewal: genetic insights
into cell-cycle regulation. Nature Reviews Genetics 9, 115-128, (2008).
53 Park, Y. & Gerson, S. L. DNA repair defects in stem cell function and aging. Annual
Review of Medicine 56, 495-508, (2005).
54 Wilson, A. et al. Hematopoietic stem cells reversibly switch from dormancy to self-
renewal during homeostasis and repair. Cell 135, 1118-1129, (2008).
55 Kondo, M. et al. Biology of hematopoietic stem cells and progenitors: implications for
clinical application. Annual Review of Immunology 21, 759-806, (2003).
56 Osawa, M. et al. Long-term lymphohematopoietic reconstitution by a single CD34-
low/negative hematopoietic stem cell. Science 273, 242-245, (1996).
57 Baldridge, M. T. et al. Quiescent haematopoietic stem cells are activated by IFN-
gamma in response to chronic infection. Nature 465, 793-797, (2010).
58 Essers, M. A. et al. IFNalpha activates dormant haematopoietic stem cells in vivo.
Nature 458, 904-908, (2009).
59 Harrison, D. E. & Lerner, C. P. Most primitive hematopoietic stem cells are stimulated
to cycle rapidly after treatment with 5-fluorouracil. Blood 78, 1237-1240, (1991).
60 Weissman, I. L. Translating stem and progenitor cell biology to the clinic: barriers and
opportunities. Science 287, 1442-1446, (2000).
61 Trumpp, A. et al. Awakening dormant haematopoietic stem cells. Nature Reviews
Immunology 10, 201-209, (2010).
62 Bhattacharya, D. et al. Niche recycling through division-independent egress of
hematopoietic stem cells. The Journal of Experimental Medicine 206, 2837-2850,
(2009).

100
63 Massberg, S. et al. Immunosurveillance by hematopoietic progenitor cells trafficking
through blood, lymph, and peripheral tissues. Cell 131, 994-1008, (2007).
64 Paulson, R. F. et al. Stress erythropoiesis: new signals and new stress progenitor
cells. Current Opinion in Hematology 18, 139-145, (2011).
65 Lee, J. H. et al. FoxP3+ regulatory T cells restrain splenic extramedullary myelopoiesis
via suppression of hemopoietic cytokine-producing T cells. The Journal of Immunology
183, 6377-6386, (2009).
66 Lenox, L. E. et al. Extramedullary erythropoiesis in the adult liver requires BMP-
4/Smad5-dependent signaling. Experimental Hematology 37, 549-558, (2009).
67 Till, J. E. & Mc, C. E. A direct measurement of the radiation sensitivity of normal
mouse bone marrow cells. Radiation Research 14, 213-222, (1961).
68 Becker, A. J. et al. Cytological demonstration of the clonal nature of spleen colonies
derived from transplanted mouse marrow cells. Nature 197, 452-454, (1963).
69 Necas, E. et al. Hematopoietic reserve provided by spleen colony-forming units (CFU-
S). Experimental Hematology 23, 1242-1246, (1995).
70 Kiel, M. J. et al. SLAM family receptors distinguish hematopoietic stem and progenitor
cells and reveal endothelial niches for stem cells. Cell 121, 1109-1121, (2005).
71 Periasamy, P. et al. Splenic stromal niches support hematopoiesis of dendritic-like
cells from precursors in bone marrow and spleen. Experimental Hematology 37, 1060-
1071, (2009).
72 Spangrude, G. J. et al. Purification and characterization of mouse hematopoietic stem
cells. Science 241, 58-62, (1988).
73 Suda, T. et al. Disparate differentiation in mouse hemopoietic colonies derived from
paired progenitors. Proceedings of the National Academy of Sciences 81, 2520-2524,
(1984).
74 Metcalf, D. On hematopoietic stem cell fate. Immunity 26, 669-673, (2007).
75 Brummendorf, T. H. et al. Asymmetric cell divisions in hematopoietic stem cells.
Annals of the New York Academy of Sciences 872, 265-273, (1999).
101
76 Harrison, D. E. Competitive repopulation: a new assay for long-term stem cell
functional capacity. Blood 55, 77-81, (1980).
77 Rebel, V. et al. The repopulation potential of fetal liver hematopoietic stem cells in
mice exceeds that of their liver adult bone marrow counterparts. Blood 87, 3500-3507,
(1996).
78 Jordan, C. T. et al. Long-term repopulating abilities of enriched fetal liver stem cells
measured by competitive repopulation. Experimental Hematology 23, 1011-1015,
(1995).
79 Rebel, V. I. et al. A comparison of long-term repopulating hematopoietic stem cells in
fetal liver and adult bone marrow from the mouse. Experimental Hematology 24, 638-
648, (1996).
80 Harrison, D. E. et al. Primitive hemopoietic stem cells: direct assay of most productive
populations by competitive repopulation with simple binomial, correlation and
covariance calculations. Experimental Hematology 21, 206-219, (1993).
81 Jones, R. J. et al. Separation of pluripotent haematopoietic stem cells from spleen
colony-forming cells. Nature 347, 188-189, (1990).
82 Schofield, R. The relationship between the spleen colony-forming cell and the
haemopoietic stem cell. Blood cells 4, 7-25, (1978).
83 Herzenberg, L. A. & Sweet, R. G. Fluorescence-activated cell sorting. Scientific
American 234, 108-117, (1976).
84 Visser, J. W. et al. Isolation of murine pluripotent hemopoietic stem cells. The Journal
of Experimental Medicine 159, 1576-1590, (1984).
85 Bertoncello, I. et al. Multiparameter analysis of transplantable hemopoietic stem cells:
I. The separation and enrichment of stem cells homing to marrow and spleen on the
basis of rhodamine-123 fluorescence. Experimental Hematology 13, 999-1006, (1985).
86 Zhou, S. et al. The ABC transporter Bcrp1/ABCG2 is expressed in a wide variety of
stem cells and is a molecular determinant of the side-population phenotype. Nature
Medicine 7, 1028-1034, (2001).
102
87 Goodell, M. A. et al. Isolation and functional properties of murine hematopoietic stem
cells that are replicating in vivo. The Journal of Experimental Medicine 183, 1797-
1806, (1996).
88 Camargo, F. D. et al. Hematopoietic stem cells do not engraft with absolute
efficiencies. Blood 107, 501-507, (2006).
89 Uchida, N. et al. Different in vivo repopulating activities of purified hematopoietic stem
cells before and after being stimulated to divide in vitro with the same kinetics.
Experimental Hematology 31, 1338-1347, (2003).
90 Mayle, A. et al. Flow cytometry analysis of murine hematopoietic stem cells. Cytometry
Part A 26, 22093, (2012).
91 Ogawa, M. et al. Expression and function of c-Kit in hemopoietic progenitor cells.
Journal of Experimental Medicine 174, 63-71, (1991).
92 Okada, S. et al. In vivo and in vitro stem cell function of c-kit- and Sca-1-positive
murine hematopoietic cells. Blood 80, 3044-3050, (1992).
93 Ikuta, K. & Weissman, I. L. Evidence that hematopoietic stem cells express mouse c-
kit but do not depend on steel factor for their generation. Proceedings of the National
Academy of Sciences 89, 1502-1506, (1992).
94 Huang, E. et al. The hematopoietic growth factor KL is encoded by the SI locus and is
the ligand of the c-kit receptor, the gene product of the W locus. Cell 63, 225-233,
(1990).
95 Williams, D. E. et al. Identification of a ligand for the c-kit proto-oncogene. Cell 63,
167-174, (1990).
96 Copeland, N. G. et al. Mast cell growth factor maps near the steel locus on mouse
chromosome 10 and is deleted in a number of steel alleles. Cell 63, 175-183, (1990).
97 Zsebo, K. M. et al. Stem cell factor is encoded at the SI locus of the mouse and is the
ligand for the c-kit tyrosine kinase receptor. Cell 63, 213-224, (1990).
98 Ogawa, M. et al. Expression and function of c-Kit in fetal hemopoietic progenitor cells:
transition from the early c-Kit-independent to the late c-Kit-dependent wave of
hemopoiesis in the murine embryo. Development 117, 1089-1098, (1993).
103
99 Lyman, S. D. & Jacobsen, S. E. c-kit ligand and Flt3 ligand: stem/progenitor cell
factors with overlapping yet distinct activities. Blood 91, 1101-1134, (1998).
100 Li, C. & Johnson, G. Stem cell factor enhances the survival but not the self-renewal of
murine hematopoietic long-term repopulating cells. Blood 84, 408-414, (1994).
101 Thorén, L. A. et al. Kit regulates maintenance of quiescent hematopoietic stem cells.
The Journal of Immunology 180, 2045-2053, (2008).
102 Ito, C. Y. et al. Hematopoietic stem cell and progenitor defects in Sca-1/Ly-6A-null
mice. Blood 101, 517-523, (2003).
103 Baum, C. M. et al. Isolation of a candidate human hematopoietic stem-cell population.
Proceedings of the National Academy of Sciences 89, 2804-2808, (1992).
104 Novelli, E. M. et al. Biology of CD34+CD38- cells in lymphohematopoiesis. Leukemia
& Lymphoma 31, 285-293, (1998).
105 Yang, L. et al. Identification of Lin(-)Sca1(+)kit(+)CD34(+)Flt3- short-term
hematopoietic stem cells capable of rapidly reconstituting and rescuing myeloablated
transplant recipients. Blood 105, 2717-2723, (2005).
106 Adolfsson, J. et al. Upregulation of Flt3 expression within the bone marrow Lin(-
)Sca1(+)c-kit(+) stem cell compartment is accompanied by loss of self-renewal
capacity. Immunity 15, 659-669, (2001).
107 Christensen, J. L. & Weissman, I. L. Flk-2 is a marker in hematopoietic stem cell
differentiation: A simple method to isolate long-term stem cells. Proceedings of the
National Academy of Sciences 98, 14541-14546, (2001).
108 Randall, T. D. et al. Expression of murine CD38 defines a population of long-term
reconstituting hematopoietic stem cells. Blood 87, 4057-4067, (1996).
109 Sanchez, M. J. et al. Characterization of the first definitive hematopoietic stem cells in
the AGM and liver of the mouse embryo. Immunity 5, 513-525, (1996).
110 Tajima, F. et al. CD34 expression by murine hematopoietic stem cells mobilized by
granulocyte colony-stimulating factor. Blood 96, 1989-1993, (2000).

104
111 Dagher, R. N. et al. c-Kit and CD38 are expressed by long-term reconstituting
hematopoietic cells present in the murine yolk sac. Biology of Blood and Marrow
Transplantation 4, 69-74, (1998).
112 Tajima, F. et al. Reciprocal expression of CD38 and CD34 by adult murine
hematopoietic stem cells. Blood 97, 2618-2624, (2001).
113 Ogawa, M. Changing phenotypes of hematopoietic stem cells. Experimental
Hematology 30, 3-6, (2002).
114 Jordan, C. T. et al. Cellular and developmental properties of fetal hematopoietic stem
cells. Cell 61, 953-963, (1990).
115 Spangrude, G. J. & Brooks, D. M. Phenotypic analysis of mouse hematopoietic stem
cells shows a Thy-1-negative subset. Blood 80, 1957-1964, (1992).
116 Spangrude, G. J. & Brooks, D. M. Mouse strain variability in the expression of the
hematopoietic stem cell antigen Ly-6A/E by bone marrow cells. Blood 82, 3327-3332,
(1993).
117 Kim, I. et al. Enhanced purification of fetal liver hematopoietic stem cells using SLAM
family receptors. Blood 108, 737-744, (2006).
118 Pronk, C. J. et al. Elucidation of the phenotypic, functional, and molecular topography
of a myeloerythroid progenitor cell hierarchy. Cell Stem Cell 1, 428-442, (2007).
119 Nakorn, T. N. et al. Characterization of mouse clonogenic megakaryocyte progenitors.
Proceedings of the National Academy of Sciences 100, 205-210, (2003).
120 Ferkowicz, M. J. et al. CD41 expression defines the onset of primitive and definitive
hematopoiesis in the murine embryo. Development 130, 4393-4403, (2003).
121 Mikkola, H. K. A. et al. Expression of CD41 marks the initiation of definitive
hematopoiesis in the mouse embryo. Blood 101, 508-516, (2003).
122 Balazs, A. B. et al. Endothelial protein C receptor (CD201) explicitly identifies
hematopoietic stem cells in murine bone marrow. Blood 107, 2317-2321, (2006).
105
123 Kent, D. G. et al. Prospective isolation and molecular characterization of
hematopoietic stem cells with durable self-renewal potential. Blood 113, 6342-6350,
(2009).
124 Iwasaki, H. et al. Endothelial protein C receptor-expressing hematopoietic stem cells
reside in the perisinusoidal niche in fetal liver. Blood 116, 544-553, (2010).
125 Chen, C.-Z. et al. Identification of endoglin as a functional marker that defines long-
term repopulating hematopoietic stem cells. Proceedings of the National Academy of
Sciences 99, 15468-15473, (2002).
126 Chen, C.-Z. et al. The endoglin(positive) sca-1(positive) rhodamine(low) phenotype
defines a near-homogeneous population of long-term repopulating hematopoietic stem
cells. Immunity 19, 525-533, (2003).
127 Wilson, A. & Trumpp, A. Bone-marrow haematopoietic-stem-cell niches. Nature
Reviews Immunology 6, 93-106, (2006).
128 Matsunaga, T. et al. Thrombopoietin promotes the survival of murine hematopoietic
long-term reconstituting cells: comparison with the effects of FLT3/FLK-2 ligand and
interleukin-6. Blood 92, 452-461, (1998).
129 Sitnicka, E. et al. The effect of thrombopoietin on the proliferation and differentiation of
murine hematopoietic stem cells. Blood 87, 4998-5005, (1996).
130 Alexander, W. et al. Deficiencies in progenitor cells of multiple hematopoietic lineages
and defective megakaryocytopoiesis in mice lacking the thrombopoietic receptor c-
Mpl. Blood 87, 2162-2170, (1996).
131 Petit-Cocault, L. et al. Dual role of Mpl receptor during the establishment of definitive
hematopoiesis. Development 134, 3031-3040, (2007).
132 Yoshihara, H. et al. Thrombopoietin/MPL signaling regulates hematopoietic stem cell
quiescence and interaction with the osteoblastic niche. Cell Stem Cell 1, 685-697,
(2007).
133 Qian, H. et al. Critical role of thrombopoietin in maintaining adult quiescent
hematopoietic stem cells. Cell Stem Cell 1, 671-684, (2007).
106
134 Zhang, C. C. & Lodish, H. F. Insulin-like growth factor 2 expressed in a novel fetal liver
cell population is a growth factor for hematopoietic stem cells. Blood 103, 2513-2521,
(2004).
135 Puri, M. C. & Bernstein, A. Requirement for the TIE family of receptor tyrosine kinases
in adult but not fetal hematopoiesis. Proceedings of the National Academy of Sciences
100, 12753-12758, (2003).
136 Arai, F. et al. Tie2/Angiopoietin-1 signaling regulates hematopoietic stem cell
quiescence in the bone marrow niche. Cell 118, 149-161, (2004).
137 Sugiyama, T. et al. Maintenance of the hematopoietic stem cell pool by CXCL12-
CXCR4 chemokine Signaling in bone marrow stromal cell niches. Immunity 25, 977-
988, (2006).
138 Broxmeyer, H. E. et al. Rapid mobilization of murine and human hematopoietic stem
and progenitor cells with AMD3100, a CXCR4 antagonist. The Journal of Experimental
Medicine 201, 1307-1318, (2005).
139 Suarez-Alvarez, B. et al. Mobilization and homing of hematopoietic stem cells.
Advances in Experimental Medicine and Biology 741, 152-170, (2012).
140 Potocnik, A. J. et al. Fetal and adult hematopoietic stem cells require beta1 integrin
function for colonizing fetal liver, spleen, and bone marrow. Immunity 12, 653-663,
(2000).
141 Cheshier, S. H. et al. In vivo proliferation and cell cycle kinetics of long-term self-
renewing hematopoietic stem cells. Proceedings of the National Academy of Sciences
96, 3120-3125, (1999).
142 Takizawa, H. et al. Dynamic variation in cycling of hematopoietic stem cells in steady
state and inflammation. The Journal of Experimental Medicine 208, 273-284, (2011).
143 Hock, H. et al. Gfi-1 restricts proliferation and preserves functional integrity of
haematopoietic stem cells. Nature 431, 1002-1007, (2004).
144 Cheng, T. et al. Hematopoietic stem cell quiescence maintained by p21cip1/waf1.
Science 287, 1804-1808, (2000).
107
145 Passegue, E. et al. Global analysis of proliferation and cell cycle gene expression in
the regulation of hematopoietic stem and progenitor cell fates. The Journal of
Experimental Medicine 202, 1599-1611, (2005).
146 Zou, P. et al. p57(Kip2) and p27(Kip1) cooperate to maintain hematopoietic stem cell
quiescence through interactions with Hsc70. Cell Stem Cell 9, 247-261, (2011).
147 Matsumoto, A. et al. p57 is required for quiescence and maintenance of adult
hematopoietic stem cells. Cell Stem Cell 9, 262-271, (2011).
148 Min, I. M. et al. The transcription factor EGR1 controls both the proliferation and
localization of hematopoietic stem cells. Cell Stem Cell 2, 380-391, (2008).
149 Kataoka, K. et al. Evi1 is essential for hematopoietic stem cell self-renewal, and its
expression marks hematopoietic cells with long-term multilineage repopulating activity.
The Journal of Experimental Medicine 208, 2403-2416, (2011).
150 Zhang, Y. et al. PR-domain-containing Mds1-Evi1 is critical for long-term
hematopoietic stem cell function. Blood 118, 3853-3861, (2011).
151 Jankovic, V. et al. Id1 restrains myeloid commitment, maintaining the self-renewal
capacity of hematopoietic stem cells. Proceedings of the National Academy of
Sciences 104, 1260-1265, (2007).
152 Magnusson, M. et al. Hoxa9/hoxb3/hoxb4 compound null mice display severe
hematopoietic defects. Experimental Hematology 35, 1421-1428, (2007).
153 Auvray, C. et al. HOXC4 homeoprotein efficiently expands human hematopoietic stem
cells and triggers similar molecular alterations as HOXB4. Haematologica 97, 168-
178, (2012).
154 Hess, J. L. et al. Defects in yolk sac hematopoiesis in Mll-null embryos. Blood 90,
1799-1806, (1997).
155 Ernst, P. et al. Definitive hematopoiesis requires the mixed-lineage leukemia gene.
Developmental Cell 6, 437-443, (2004).
156 McMahon, K. A. et al. Mll has a critical role in fetal and adult hematopoietic stem cell
self-renewal. Cell Stem Cell 1, 338-345, (2007).

108
157 Zeisig, B. B. et al. Hoxa9 and Meis1 are key targets for MLL-ENL-mediated cellular
immortalization. Molecular and Cellular Biology 24, 617-628, (2004).
158 Ernst, P. et al. An Mll-dependent Hox program drives hematopoietic progenitor
expansion. Current Biology 14, 2063-2069, (2004).
159 Thompson, B. J. et al. Control of hematopoietic stem cell quiescence by the E3
ubiquitin ligase Fbw7. The Journal of Experimental Medicine 205, 1395-1408, (2008).
160 Reavie, L. et al. Regulation of hematopoietic stem cell differentiation by a single
ubiquitin ligase-substrate complex. Nature Immunology 11, 207-215, (2010).
161 Yuan, J. et al. Lin28b reprograms adult bone marrow hematopoietic progenitors to
mediate fetal-like lymphopoiesis. Science 335, 1195-1200, (2012).
162 Robb, L. et al. Absence of yolk sac hematopoiesis from mice with a targeted disruption
of the scl gene. Proceedings of the National Academy of Sciences 92, 7075-7079,
(1995).
163 Shivdasani, R. A. et al. Absence of blood formation in mice lacking the T-cell
leukaemia oncoprotein tal-1/SCL. Nature 373, 432-434, (1995).
164 Mikkola, H. K. et al. Haematopoietic stem cells retain long-term repopulating activity
and multipotency in the absence of stem-cell leukaemia SCL/tal-1 gene. Nature 421,
547-551, (2003).
165 Gao, J. et al. Hedgehog signaling is dispensable for adult hematopoietic stem cell
function. Cell Stem Cell 4, 548-558, (2009).
166 Hofmann, I. et al. Hedgehog signaling is dispensable for adult murine hematopoietic
stem cell function and hematopoiesis. Cell Stem Cell 4, 559-567, (2009).
167 Chen, C. et al. TSC-mTOR maintains quiescence and function of hematopoietic stem
cells by repressing mitochondrial biogenesis and reactive oxygen species. The Journal
of Experimental Medicine 205, 2397-2408, (2008).
168 Fleming, H. E. et al. Wnt signaling in the niche enforces hematopoietic stem cell
quiescence and is necessary to preserve self-renewal in vivo. Cell Stem Cell 2, 274-
283, (2008).

109
169 Huang, J. et al. Maintenance of hematopoietic stem cells through regulation of Wnt
and mTOR pathways. Nature Medicine 11, (2012).
170 Gan, B. et al. Lkb1 regulates quiescence and metabolic homeostasis of
haematopoietic stem cells. Nature 468, 701-704, (2010).
171 Gurumurthy, S. et al. The Lkb1 metabolic sensor maintains haematopoietic stem cell
survival. Nature 468, 659-663, (2010).
172 Nakada, D. et al. Lkb1 regulates cell cycle and energy metabolism in haematopoietic
stem cells. Nature 468, 653-658, (2010).
173 Amrani, Y. M. et al. The Paf oncogene is essential for hematopoietic stem cell function
and development. The Journal of Experimental Medicine 208, 1757-1765, (2011).
174 Mortensen, M. et al. The autophagy protein Atg7 is essential for hematopoietic stem
cell maintenance. The Journal of Experimental Medicine 208, 455-467, (2011).
175 Domen, J. The role of apoptosis in regulating hematopoiesis and hematopoietic stem
cells. Immunol Res 22, 83-94, (2000).
176 Opferman, J. T. et al. Obligate role of anti-apoptotic MCL-1 in the survival of
hematopoietic stem cells. Science 307, 1101-1104, (2005).
177 Chen, Y. et al. Critical role for Gimap5 in the survival of mouse hematopoietic stem
and progenitor cells. The Journal of Experimental Medicine 208, 923-935, (2011).
178 Motoyama, N. et al. Bcl-x prevents apoptotic cell death of both primitive and definitive
erythrocytes at the end of maturation. The Journal of Experimental Medicine 189,
1691-1698, (1999).
179 Motoyama, N. et al. Massive cell death of immature hematopoietic cells and neurons
in Bcl-x-deficient mice. Science 267, 1506-1510, (1995).
180 Suzuki, N. et al. Homeostasis of hematopoietic stem cells regulated by the
myeloproliferative disease associated-gene product Lnk/Sh2b3 via Bcl-xL.
Experimental Hematology 40, 166-174, (2012).

110
181 Nakayama, K. et al. Targeted disruption of Bcl-2 alpha beta in mice: occurrence of
gray hair, polycystic kidney disease, and lymphocytopenia. Proceedings of the
National Academy of Sciences 91, 3700-3704, (1994).
182 Wang, Y. Y. et al. Bcl2 enhances induced hematopoietic differentiation of murine
embryonic stem cells. Experimental Hematology 36, 128-139, (2008).
183 Domen, J. et al. The role of apoptosis in the regulation of hematopoietic stem cells:
Overexpression of Bcl-2 increases both their number and repopulation potential. The
Journal of Experimental Medicine 191, 253-264, (2000).
184 Yu, S. et al. GABP controls a critical transcription regulatory module that is essential
for maintenance and differentiation of hematopoietic stem/progenitor cells. Blood 117,
2166-2178, (2011).
185 Kitsos, C. M. et al. Calmodulin-dependent protein kinase IV regulates hematopoietic
stem cell maintenance. The Journal of Biological Chemistry 280, 33101-33108,
(2005).
186 Kondo, M. et al. Identification of clonogenic common lymphoid progenitors in mouse
bone marrow. Cell 91, 661-672, (1997).
187 Akashi, K. et al. A clonogenic common myeloid progenitor that gives rise to all myeloid
lineages. Nature 404, 193-197, (2000).
188 Lacaud, G. et al. Identification of a fetal hematopoietic precursor with B cell, T cell, and
macrophage potential. Immunity 9, 827-838, (1998).
189 Cumano, A. et al. Bipotential precursors of B cells and macrophages in murine fetal
liver. Nature 356, 612-615, (1992).
190 Lu, M. et al. The common myelolymphoid progenitor: A key intermediate stage in
hemopoiesis generating T and B cells. The Journal of Immunology 169, 3519-3525,
(2002).
191 Mebius, R. E. et al. The fetal liver counterpart of adult common lymphoid progenitors
gives rise to all lymphoid lineages, CD45+CD4+CD3- cells, as well as macrophages.
The Journal of Immunology 166, 6593-6601, (2001).

111
192 Adolfsson, J. r. et al. Identification of Flt3+ lympho-myeloid stem cells lacking erythro-
megakaryocytic potential: a revised road map for adult blood lineage commitment. Cell
121, 295-306, (2005).
193 Mansson, R. et al. Molecular evidence for hierarchical transcriptional lineage priming
in fetal and adult stem cells and multipotent progenitors. Immunity 26, 407-419,
(2007).
194 Chi, A. W. S. et al. Identification of Flt3+CD150- myeloid progenitors in adult mouse
bone marrow that harbor T lymphoid developmental potential. Blood 118, 2723-2732,
(2011).
195 Kawamoto, H. & Katsura, Y. A new paradigm for hematopoietic cell lineages: revision
of the classical concept of the myeloid-lymphoid dichotomy. Trends in Immunology 30,
193-200, (2009).
196 Arinobu, Y. et al. Reciprocal activation of GATA-1 and PU.1 marks initial specification
of hematopoietic stem cells into myeloerythroid and myelolymphoid lineages. Cell
Stem Cell 1, 416-427, (2007).
197 Nakano, T. Lymphohematopoietic development from embryonic stem cells in vitro.
Seminars in Immunology 7, 197-203, (1995).
198 Schmitt, T. M. & Zuniga-Pflucker, J. C. Induction of T cell development from
hematopoietic progenitor cells by delta-like-1 in vitro. Immunity 17, 749-756, (2002).
199 Anderson, G. & Jenkinson, E. J. Bringing the thymus to the bench. The Journal of
Immunology 181, 7435-7436, (2008).
200 Rosenbauer, F. & Tenen, D. G. Transcription factors in myeloid development:
balancing differentiation with transformation. Nature Reviews Immunology 7, 105-117,
(2007).
201 Ardavin, C. Origin, precursors and differentiation of mouse dendritic cells. Nature
Reviews Immunology 3, 582-591, (2003).
202 Shapiro-Shelef, M. & Calame, K. Regulation of plasma-cell development. Nature
Reviews Immunology 5, 230-242, (2005).
112
203 Singer, A. et al. Lineage fate and intense debate: myths, models and mechanisms of
CD4- versus CD8-lineage choice. Nature Reviews Immunology 8, 788-801, (2008).
204 Hsieh, C.-S. et al. Selection of regulatory T cells in the thymus. Nature Reviews
Immunology 12, 157-167, (2012).
205 Hayday, A. C. & Pennington, D. J. Key factors in the organized chaos of early T cell
development. Nature Immunology 8, 137-144, (2007).
206 Nagasawa, T. et al. Control of hematopoietic stem cells by the bone marrow stromal
niche: the role of reticular cells. Trends in Immunology 32, 315-320, (2011).
207 Wilson, A. et al. Dormant and self-renewing hematopoietic stem cells and their niches.
Annals of the New York Academy of Sciences 1106, 64-75, (2007).
208 Kiel, M. J. & Morrison, S. J. Uncertainty in the niches that maintain haematopoietic
stem cells. Nature Reviews Immunology 8, 290-301, (2008).
209 Calvi, L. M. et al. Osteoblastic cells regulate the haematopoietic stem cell niche.
Nature 425, 841-846, (2003).
210 Zhang, J. et al. Identification of the haematopoietic stem cell niche and control of the
niche size. Nature 425, 836-841, (2003).
211 Hooper, A. T. et al. Engraftment and reconstitution of hematopoiesis Is dependent on
VEGFR2-mediated regeneration of sinusoidal endothelial cells. Cell Stem Cell 4, 263-
274, (2009).
212 Mendez-Ferrer, S. et al. Mesenchymal and haematopoietic stem cells form a unique
bone marrow niche. Nature 466, 829-834, (2010).
213 Winkler, I. G. et al. Positioning of bone marrow hematopoietic and stromal cells
relative to blood flow in vivo: serially reconstituting hematopoietic stem cells reside in
distinct nonperfused niches. Blood 116, 375-385, (2010).
214 Chow, A. et al. Bone marrow CD169+ macrophages promote the retention of
hematopoietic stem and progenitor cells in the mesenchymal stem cell niche. The
Journal of Experimental Medicine 208, 261-271, (2011).
113
215 Winkler, I. G. et al. Bone marrow macrophages maintain hematopoietic stem cell
(HSC) niches and their depletion mobilizes HSCs. Blood 116, 4815-4828, (2010).
216 Kioussis, D. & Pachnis, V. Immune and nervous systems: more than just a superficial
similarity? Immunity 31, 705-710, (2009).
217 Spiegel, A. et al. Stem cell regulation via dynamic interactions of the nervous and
immune systems with the microenvironment. Cell Stem Cell 3, 484-492, (2008).
218 Katayama, Y. et al. Signals from the sympathetic nervous system regulate
hematopoietic stem cell egress from bone marrow. Cell 124, 407-421, (2006).
219 Mendez-Ferrer, S. et al. Haematopoietic stem cell release is regulated by circadian
oscillations. Nature 452, 442-447, (2008).
220 Yamazaki, S. et al. Nonmyelinating Schwann cells maintain hematopoietic stem cell
hibernation in the bone marrow niche. Cell 147, 1146-1158, (2011).
221 Spiegel, A. et al. Catecholaminergic neurotransmitters regulate migration and
repopulation of immature human CD34+ cells through Wnt signaling. Nature
Immunology 8, 1123-1131, (2007).
222 Muthu, K. et al. Murine hematopoietic stem cells and progenitors express adrenergic
receptors. Journal of neuroimmunology 186, 27-36, (2007).
223 Chou, S. & Lodish, H. F. Fetal liver hepatic progenitors are supportive stromal cells for
hematopoietic stem cells. Proceedings of the National Academy of Sciences 107,
7799-7804, (2010).
224 Chagraoui, J. et al. Fetal liver stroma consists of cells in epithelial-to-mesenchymal
transition. Blood 101, 2973-2982, (2003).
225 Fromigué, O. et al. Distinct osteoblastic differentiation potential of murine fetal liver
and bone marrow stroma-derived mesenchymal stem cells. Journal of Cellular
Biochemistry 104, 620-628, (2008).
226 Takeuchi, M. et al. Cultivation of aorta-gonad-mesonephros-derived hematopoietic
stem cells in the fetal liver microenvironment amplifies long-term repopulating activity
and enhances engraftment to the bone marrow. Blood 99, 1190-1196, (2002).
114
227 Petrie, H. T. & Zuniga-Pflucker, J. C. Zoned out: functional mapping of stromal
signaling microenvironments in the thymus. Annual Review of Immunology 25, 649-
679, (2007).
228 Terszowski, G. et al. Evidence for a Functional Second Thymus in Mice. Science 312,
284-287, (2006).
229 Wallis, V. J. et al. On the sparse seeding of bone marrow and thymus in radiation
chimaeras. Transplantation 19, 2-11, (1975).
230 Goldschneider, I. et al. Studies of thymocytopoiesis in rats and mice. I. Kinetics of
appearance of thymocytes using a direct intrathymic adoptive transfer assay for
thymocyte precursors. The Journal of Experimental Medicine 163, 1-17, (1986).
231 Foss, D. L. et al. The importation of hematogenous precursors by the thymus is a
gated phenomenon in normal adult mice. The Journal of Experimental Medicine 193,
365-374, (2001).
232 Peaudecerf, L. et al. Thymocytes may persist and differentiate without any input from
bone marrow progenitors. The Journal of Experimental Medicine 209, 1401-1408,
(2012).
233 Martins, V. C. et al. Thymus-autonomous T cell development in the absence of
progenitor import. The Journal of Experimental Medicine 209, 1409-1417, (2012).
234 Katsura, Y. Redefinition of lymphoid progenitors. Nature Reviews Immunology 2, 127-
132, (2002).
235 Rothenberg, E. V. et al. Launching the T-cell-lineage developmental programme.
Nature Reviews Immunology 8, 9-21, (2008).
236 Schlenner, S. M. et al. Fate mapping reveals separate origins of T cells and myeloid
lineages in the thymus. Immunity 32, 426-436, (2010).
237 David-Fung, E. S. et al. Progression of regulatory gene expression states in fetal and
adult pro-T-cell development. Immunological Reviews 209, 212-236, (2006).
238 Calderon, L. & Boehm, T. Three chemokine receptors cooperatively regulate homing
of hematopoietic progenitors to the embryonic mouse thymus. Proceedings of the
National Academy of Sciences 108, 7517-7522, (2011).

115
239 Krangel, M. S. Mechanics of T cell receptor gene rearrangement. Current Opinion in
Immunology 21, 133-139, (2009).
240 Taghon, T. et al. Developmental and molecular characterization of emerging beta- and
gammadelta-selected pre-T cells in the adult mouse thymus. Immunity 24, 53-64,
(2006).
241 Kreslavsky, T. et al. αβ versus γδ fate choice: counting the T-cell lineages at the
branch point. Immunological Reviews 238, 169-181, (2010).
242 Melichar, H. J. et al. Regulation of gammadelta versus alfabeta T lymphocyte
differentiation by the transcription factor SOX13. Science 315, 230-233, (2007).
243 Silva-Santos, B. et al. Lymphotoxin-mediated regulation of gammadelta cell
differentiation by alphabeta T cell progenitors. Science 307, 925-928, (2005).
244 Ribot, J. C. et al. CD27 is a thymic determinant of the balance between interferon-
[gamma]- and interleukin 17-producing [gamma][delta] T cell subsets. Nature
Immunology 10, 427-436, (2009).
245 Xiong, N. & Raulet, D. H. Development and selection of γδ T cells. Immunological
Reviews 215, 15-31, (2007).
246 Yu, Q. et al. Cytokine signal transduction is suppressed in preselection double-positive
thymocytes and restored by positive selection. The Journal of Experimental Medicine
203, 165-175, (2006).
247 Jameson, S. C. et al. Positive selection of thymocytes. Annual Review of Immunology
13, 93-126, (1995).
248 Starr, T. K. et al. Positive and negative selection of T cells. Annual Review of
Immunology 21, 139-176, (2003).
249 Teh, H. S. et al. Thymic major histocompatibility complex antigens and the alpha beta
T- cell receptor determine the CD4/CD8 phenotype of T cells. Nature 335, 229-233.,
(1988).
250 Godfrey, D. I. & Berzins, S. P. Control points in NKT-cell development. Nature
Reviews Immunology 7, 505-518, (2007).
116
251 Palmer, E. Negative selection--clearing out the bad apples from the T-cell repertoire.
Nature Reviews Immunology 3, 383-391, (2003).
252 Durbec, P. L. et al. Common origin and developmental dependence on c-ret of
subsets of enteric and sympathetic neuroblasts. Development 122, 349-358, (1996).
253 Schuchardt, A. et al. Defects in the kidney and enteric nervous system of mice lacking
the tyrosine kinase receptor Ret. Nature 367, 380-383, (1994).
254 Jain, S. et al. Mice expressing a dominant-negative Ret mutation phenocopy human
Hirschsprung disease and delineate a direct role of Ret in spermatogenesis.
Development 131, 5503-5513, (2004).
255 Meng, X. et al. Regulation of cell fate decision of undifferentiated spermatogonia by
GDNF. Science 287, 1489-1493, (2000).
256 Veiga-Fernandes, H. et al. Tyrosine kinase receptor RET is a key regulator of Peyer's
Patch organogenesis. Nature 446, 547-551, (2007).
257 Enomoto, H. et al. RET signaling is essential for migration, axonal growth and axon
guidance of developing sympathetic neurons. Development 128, 3963-3974, (2001).
258 Takahashi, M. et al. Activation of a novel human transforming gene, ret, by DNA
rearrangement. Cell 42, 581-588, (1985).
259 Takahashi, M. & Cooper, G. M. ret transforming gene encodes a fusion protein
homologous to tyrosine kinases. Molecular and Cellular Biology 7, 1378-1385, (1987).
260 Takahashi, M. et al. Cloning and expression of the ret proto-oncogene encoding a
tyrosine kinase with two potential transmembrane domains. Oncogene 3, 571-578,
(1988).
261 Iwamoto, T. et al. cDNA cloning of mouse ret proto-oncogene and its sequence
similarity to the cadherin superfamily. Oncogene 8, 1087-1091, (1993).
262 Anders, J. et al. Molecular modeling of the extracellular domain of the RET receptor
tyrosine kinase reveals multiple cadherin-like domains and a calcium-binding site. The
Journal of Biological Chemistry 276, 35808-35817, (2001).

117
263 Tahira, T. et al. Characterization of ret proto-oncogene mRNAs encoding two isoforms
of the protein product in a human neuroblastoma cell line. Oncogene 5, 97-102,
(1990).
264 Myers, S. M. et al. Characterization of RET proto-oncogene 3' splicing variants and
polyadenylation sites: a novel C-terminus for RET. Oncogene 11, 2039-2045, (1995).
265 Carter, M. T. et al. Conservation of RET proto-oncogene splicing variants and
implications for RET isoform function. Cytogenetics and Cell Genetics 95, 169-176,
(2001).
266 Tsui-Pierchala, B. A. et al. The long and short isoforms of Ret function as independent
signaling complexes. Journal of Biological Chemistry 277, 34618-34625, (2002).
267 de Graaff, E. et al. Differential activities of the RET tyrosine kinase receptor isoforms
during mammalian embryogenesis. Genes & Development 15, 2433-2444, (2001).
268 Airaksinen, M. S. & Saarma, M. The GDNF family: signalling, biological functions and
therapeutic value. Nature Reviews Neuroscience 3, 383-394, (2002).
269 Arighi, E. et al. RET tyrosine kinase signaling in development and cancer. Cytokine
Growth Factor Rev 16, 441-467, (2005).
270 Takahashi, M. et al. Characterization of the ret proto-oncogene products expressed in
mouse L cells. Oncogene 8, 2925-2929, (1993).
271 Cabrera, J. R. et al. RET modulates cell adhesion via its cleavage by caspase in
sympathetic neurons. The Journal of Biological Chemistry 286, 14628-14638, (2011).
272 Schalm, S. S. et al. Phosphorylation of protocadherin proteins by the receptor tyrosine
kinase Ret. Proceedings of the National Academy of Sciences 107, 13894-13899,
(2010).
273 Bonanomi, D. et al. Ret is a multifunctional coreceptor that integrates diffusible- and
contact-axon guidance signals. Cell 148, 568-582, (2012).
274 Bordeaux, M.-C. et al. The RET proto-oncogene induces apoptosis: a novel
mechanism for Hirschsprung disease. The EMBO Journal 19, 4056-4063, (2000).
118
275 Canibano, C. et al. The dependence receptor Ret induces apoptosis in somatotrophs
through a Pit-1/p53 pathway, preventing tumor growth. The EMBO Journal 26, 2015-
2028, (2007).
276 Goldschneider, D. & Mehlen, P. Dependence receptors: a new paradigm in cell
signaling and cancer therapy. Oncogene 29, 1865-1882, (2010).
277 Durbec, P. et al. GDNF signalling through the Ret receptor tyrosine kinase. Nature
381, 789-793, (1996).
278 Trupp, M. et al. Functional receptor for GDNF encoded by the c-ret proto-oncogene.
Nature 381, 785-789, (1996).
279 Jing, S. et al. GDNF-induced activation of the ret protein tyrosine kinase is mediated
by GDNFR-alpha, a novel receptor for GDNF. Cell 85, 1113-1124, (1996).
280 Treanor, J. J. et al. Characterization of a multicomponent receptor for GDNF. Nature
382, 80-83, (1996).
281 Kotzbauer, P. T. et al. Neurturin, a relative of glial-cell-line-derived neurotrophic factor.
Nature 384, 467-470, (1996).
282 Milbrandt, J. et al. Persephin, a novel neurotrophic factor related to GDNF and
neurturin. Neuron 20, 245-253, (1998).
283 Klein, R. D. et al. A GPI-linked protein that interacts with Ret to form a candidate
neurturin receptor. Nature 387, 717-721, (1997).
284 Lindahl, M. et al. Human glial cell line-derived neurotrophic factor receptor alpha 4 is
the receptor for persephin and is predominantly expressed in normal and malignant
thyroid medullary cells. The Journal of Biological Chemistry 276, 9344-9351, (2001).
285 Jing, S. et al. GFRalpha-2 and GFRalpha-3 are two new receptors for ligands of the
GDNF family. The Journal of Biological Chemistry 272, 33111-33117, (1997).
286 Baloh, R. H. et al. Artemin, a novel member of the GDNF ligand family, supports
peripheral and central neurons and signals through the GFRalpha3-RET receptor
complex. Neuron 21, 1291-1302, (1998).
119
287 Baloh, R. H. et al. TrnR2, a novel receptor that mediates neurturin and GDNF
signaling through Ret. Neuron 18, 793-802, (1997).
288 Airaksinen, M. S. et al. GDNF family neurotrophic factor signaling: four masters, one
servant? Molecular and Cellular Neurosciences 13, 313-325, (1999).
289 Poteryaev, D. et al. GDNF triggers a novel Ret-independent Src kinase family-coupled
signaling via a GPI-linked GDNF receptor alpha1. FEBS Letters 463, 63-66, (1999).
290 Tansey, M. G. et al. GFRalpha-mediated localization of RET to lipid rafts is required
for effective downstream signaling, differentiation, and neuronal survival. Neuron 25,
611-623, (2000).
291 Paratcha, G. et al. Released GFRalpha1 potentiates downstream signaling, neuronal
survival, and differentiation via a novel mechanism of recruitment of c-Ret to lipid rafts.
Neuron 29, 171-184, (2001).
292 Worley, D. S. et al. Developmental regulation of GDNF response and receptor
expression in the enteric nervous system. Development 127, 4383-4393, (2000).
293 Coulpier, M. et al. Coordinated activation of autophosphorylation sites in the RET
receptor tyrosine kinase: importance of tyrosine 1062 for GDNF mediated neuronal
differentiation and survival. The Journal of Biological Chemistry 277, 1991-1999,
(2002).
294 Enomoto, H. et al. GFRalpha1 expression in cells lacking RET is dispensable for
organogenesis and nerve regeneration. Neuron 44, 623-636, (2004).
295 Patel, A. et al. Differential RET signaling pathways drive development of the enteric
lymphoid and nervous systems. Science Signaling 5, (2012).
296 Trupp, M. et al. Ret-dependent and -independent mechanisms of glial cell line-derived
neurotrophic factor signaling in neuronal cells. The Journal of Biological Chemistry
274, 20885-20894, (1999).
297 Popsueva, A. et al. GDNF promotes tubulogenesis of GFRalpha1-expressing MDCK
cells by Src-mediated phosphorylation of Met receptor tyrosine kinase. The Journal of
Cell Biology 161, 119-129, (2003).
120
298 Paratcha, G. et al. The neural cell adhesion molecule NCAM is an alternative signaling
receptor for GDNF family ligands. Cell 113, 867-879, (2003).
299 Iwashita, T. et al. Identification of tyrosine residues that are essential for transforming
activity of the ret proto-oncogene with MEN2A or MEN2B mutation. Oncogene 12,
481-487, (1996).
300 Schuringa, J. J. et al. MEN2A-RET-induced cellular transformation by activation of
STAT3. Oncogene 20, 5350-5358, (2001).
301 Encinas, M. et al. Tyrosine 981, a novel Ret autophosphorylation site, binds c-Src to
mediate neuronal survival. The Journal of Biological Chemistry 279, 18262-18269,
(2004).
302 Borrello, M. G. et al. The full oncogenic activity of Ret/ptc2 depends on tyrosine 539, a
docking site for phospholipase Cgamma. Molecular and Cellular Biology 16, 2151-
2163, (1996).
303 Jain, S. et al. Critical and distinct roles for key RET tyrosine docking sites in renal
development. Genes & Development 20, 321-333, (2006).
304 Besset, V. et al. Signaling complexes and protein-protein interactions involved in the
activation of the Ras and phosphatidylinositol 3-kinase pathways by the c-Ret receptor
tyrosine kinase. The Journal of Biological Chemistry 275, 39159-39166, (2000).
305 Fukuda, T. et al. novel mechanism of regulation of Rac activity and lamellipodia
formation by RET tyrosine kinase. The Journal of Biological Chemistry 277, 19114-
19121, (2002).
306 Asai, N. et al. Targeted mutation of serine 697 in the Ret tyrosine kinase causes
migration defect of enteric neural crest cells. Development 133, 4507-4516, (2006).
307 Hayashi, H. et al. Characterization of intracellular signals via tyrosine 1062 in RET
activated by glial cell line-derived neurotrophic factor. Oncogene 19, 4469-4475,
(2000).
308 Wells, S. A., Jr. & Santoro, M. Targeting the RET pathway in thyroid cancer. Clinical
Cancer Research 15, 7119-7123, (2009).
121
309 Myers, S. M. & Mulligan, L. M. The RET receptor is linked to stress response
pathways. Cancer Research 64, 4453-4463, (2004).
310 Romeo, G. et al. Point mutations affecting the tyrosine kinase domain of the RET
proto-oncogene in Hirschsprung's disease. Nature 367, 377-378, (1994).
311 Edery, P. et al. Mutations of the RET proto-oncogene in Hirschsprung's disease.
Nature 367, 378-380, (1994).
312 Jhiang, S. M. The RET proto-oncogene in human cancers. Oncogene 19, 5590-5597,
(2000).
313 Pierotti, M. A. et al. Cytogenetics and molecular genetics of carcinomas arising from
thyroid epithelial follicular cells. Genes, Chromosomes & Cancer 16, 1-14, (1996).
314 Ichihara, M. et al. RET and neuroendocrine tumors. Cancer Letters 204, 197-211,
(2004).
315 Pasini, B. et al. RET mutations in human disease. Trends in Genetics 12, 138-144,
(1996).
316 Ballerini, P. et al. RET fusion genes are associated with chronic myelomonocytic
leukemia and enhance monocytic differentiation. Leukemia 19, 109, (2012).
317 Eng, C. et al. The relationship between specific RET proto-oncogene mutations and
disease phenotype in multiple endocrine neoplasia type 2. International RET mutation
consortium analysis. Jama 276, 1575-1579, (1996).
318 Gagel, R. F. et al. Multiple endocrine neoplasia type 2A associated with cutaneous
lichen amyloidosis. Annals of Internal Medicine 111, 802-806, (1989).
319 Decker, R. A. et al. Hirschsprung disease in MEN 2A: increased spectrum of RET
exon 10 genotypes and strong genotype-phenotype correlation. Human Molecular
Genetics 7, 129-134, (1998).
320 Smith-Hicks, C. L. et al. C-cell hyperplasia, pheochromocytoma and sympathoadrenal
malformation in a mouse model of multiple endocrine neoplasia type 2B. The EMBO
Journal 19, 612-622, (2000).

122
321 Avantaggiato, V. et al. Developmental expression of the RET protooncogene. Cell
Growth & Differentiation 5, 305-311, (1994).
322 Tsuzuki, T. et al. Spatial and temporal expression of the ret proto-oncogene product in
embryonic, infant and adult rat tissues. Oncogene 10, 191-198, (1995).
323 Nakayama, S. et al. Implication of expression of GDNF/Ret signalling components in
differentiation of bone marrow haemopoietic cells. British Journal of Haematology 105,
50-57, (1999).
324 Gattei, V. et al. Expression of the RET receptor tyrosine kinase and GDNFR-alpha in
normal and leukemic human hematopoietic cells and stromal cells of the bone marrow
microenvironment. Blood 89, 2925-2937, (1997).
325 Vargas-Leal, V. et al. Expression and function of glial cell line-derived neurotrophic
factor family ligands and their receptors on human immune cells. The Journal of
Immunology 175, 2301-2308, (2005).
326 Visser, M. et al. Haemopoietic growth factor tyrosine kinase receptor expression
profiles in normal haemopoiesis. British Journal of Haematology 94, 236-241, (1996).
327 Takahashi, M. et al. Identification of the ret proto-oncogene products in neuroblastoma
and leukemia cells. Oncogene 6, 297-301, (1991).
328 Zeng, X. X. et al. The fetal origin of B-precursor leukemia in the E-mu-ret mouse.
Blood 92, 3529-3536, (1998).
329 Wasserman, R. et al. The evolution of B precursor leukemia in the Emu-ret mouse.
Blood 92, 273-282, (1998).
330 Wasserman, R. et al. Differential expression of the blk and ret tyrosine kinases during
B lineage development is dependent on Ig rearrangement. The Journal of Immunology
155, 644-651, (1995).
331 Kondo, S. et al. Possible involvement of glial cell line-derived neurotrophic factor and
its receptor, GFRalpha1, in survival and maturation of thymocytes. European Journal
of Immunology 33, 2233-2240, (2003).
332 Mombaerts, P. et al. RAG-1-deficient mice have no mature B and T lymphocytes. Cell
68, 869-877., (1992).
123
333 de Boer, J. et al. Transgenic mice with hematopoietic and lymphoid specific
expression of Cre. European Journal of Immunology 33, 314-325, (2003).
334 Cacalano, G. et al. GFRalpha1 is an essential receptor component for GDNF in the
developing nervous system and kidney. Neuron 21, 53-62, (1998).
335 Rossi, J. et al. Retarded growth and deficits in the enteric and parasympathetic
nervous system in mice lacking GFR alpha2, a functional neurturin receptor. Neuron
22, 243-252, (1999).
336 Nishino, J. et al. GFR alpha3, a component of the artemin receptor, is required for
migration and survival of the superior cervical ganglion. Neuron 23, 725-736, (1999).
337 Peixoto, A. et al. Quantification of multiple gene expression in individual cells. Genome
Research 14, 1938-1947, (2004).
338 Ohta, H. et al. Polycomb group gene rae28 is required for sustaining activity of
hematopoietic stem cells. The Journal of Experimental Medicine 195, 759-770, (2002).
339 Terskikh, A. V. et al. Gene expression analysis of purified hematopoietic stem cells
and committed progenitors. Blood 102, 94-101, (2003).
340 Perianayagam, M. C. et al. CREB transcription factor modulates Bcl2 transcription in
response to C5a in HL-60-derived neutrophils. European Journal of Clinical
Investigation 36, 353-361, (2006).
341 Shukla, A. et al. Activated cAMP response element binding protein is overexpressed in
human mesotheliomas and inhibits apoptosis. The American Journal of Pathology
175, 2197-2206, (2009).
342 Rothenberg, E. V. Transcriptional drivers of the T-cell lineage program. Current
Opinion in Immunology 24, 132-138, (2012).
343 Golden, J. P. et al. Expression of neurturin, GDNF, and GDNF family-receptor mRNA
in the developing and mature mouse. Experimental Neurology 158, 504-528, (1999).
344 Trupp, M. et al. Complementary and overlapping expression of glial cell line-derived
neurotrophic factor (GDNF), c-ret proto-oncogene, and GDNF receptor-alpha indicates
multiple mechanisms of trophic actions in the adult rat CNS. The Journal of
Neuroscience 17, 3554-3567, (1997).

124
345 Carlomagno, F. et al. Glial cell line-derived neurotrophic factor differentially stimulates
ret mutants associated with the multiple endocrine neoplasia type 2 syndromes and
Hirschsprung's disease. Endocrinology 139, 3613-3619, (1998).
346 Ledda, F. et al. Target-derived GFRalpha1 as an attractive guidance signal for
developing sensory and sympathetic axons via activation of Cdk5. Neuron 36, 387-
401, (2002).
347 Bleul, C. C. & Boehm, T. BMP signaling is required for normal thymus development.
The Journal of Immunology 175, 5213-5221, (2005).
348 Houvras, Y. Completing the Arc: targeted inhibition of RET in medullary thyroid
cancer. Journal of Clinical Oncology 30, 200-202, (2012).
349 Wells, S. A., Jr. et al. Vandetanib in patients with locally advanced or metastatic
medullary thyroid cancer: a randomized, double-blind phase III trial. Journal of Clinical
Oncology 30, 134-141, (2012).
350 Hamilton, J. F. et al. Heparin coinfusion during convection-enhanced delivery (CED)
increases the distribution of the glial-derived neurotrophic factor (GDNF) ligand family
in rat striatum and enhances the pharmacological activity of neurturin. Experimental
Neurology 168, 155-161, (2001).
351 Riccio, A. et al. Mediation by a CREB family transcription factor of NGF-dependent
survival of sympathetic neurons. Science 286, 2358-2361, (1999).
352 Xing, J. et al. Nerve growth factor activates extracellular signal-regulated kinase and
p38 mitogen-activated protein kinase pathways to stimulate CREB serine 133
phosphorylation. Molecular and Cellular Biology 18, 1946-1955, (1998).
353 Tan, Y. et al. FGF and stress regulate CREB and ATF-1 via a pathway involving p38
MAP kinase and MAPKAP kinase-2. The EMBO Journal 15, 4629-4642, (1996).
354 Cheng, M. et al. The p21(Cip1) and p27(Kip1) CDK 'inhibitors' are essential activators
of cyclin D-dependent kinases in murine fibroblasts. The EMBO Journal 18, 1571-
1583., (1999).
355 Li, J. Y. et al. PTH expands short-term murine hemopoietic stem cells through T cells.
Blood 120, 4352-4362, (2012).