Role of substrate attachment in cell mechanics: Implications in...
156
Tesi doctoral Role of substrate attachment in cell mechanics: Implications in neutrophils and microvascular endothelial cells. Memòria presentada per Pere Roca-Cusachs Soulere Per optar al grau de doctor Barcelona, Octubre de 2006 Treball dirigit pel Dr. Daniel Navajas Navarro A la Unitat de Biofísica i Bioenginyeria Del departament de Ciències Fisiològiques I; Facultat de Medicina, Universitat de Barcelona
Transcript of Role of substrate attachment in cell mechanics: Implications in...

Tesi doctoral
Role of substrate attachment in cell mechanics: Implications in neutrophils and microvascular endothelial
cells.
Memòria presentada per
Pere Roca-Cusachs Soulere
Per optar al grau de doctor
Barcelona, Octubre de 2006
Treball dirigit pel Dr. Daniel Navajas Navarro
A la Unitat de Biofísica i Bioenginyeria
Del departament de Ciències Fisiològiques I;
Facultat de Medicina, Universitat de Barcelona


Es gibt Menschen, die kämpfen einen Tag, und sie sind gut.
Es gibt andere, die kämpfen ein Jahr und sind besser.
Es gibt Menschen, die kämpfen viele Jahre und sind sehr gut.
Aber es gibt Menschen, die kämpfen ihr Leben lang:
Das sind die Unersetzlichen.
Bertolt Brecht
Hi ha persones que estimen durant un dia, i són bones.
N’hi ha d’altres que estimen durant un any, i són millors.
Hi ha persones que estimen durant tota una tesi doctoral, i són molt bones.
Però hi ha una persona que porta 7 anys estimant-me:
Aquesta és la imprescindible.
(Traducció lliure al Català)
A la Isabel


The most exciting phrase to hear in science,
the one that heralds new discoveries,
is not Eureka! (I found it!)
but rather, "hmm.... that's funny...."
Isaac Asimov


Agraïments
Gracias a la vida
Que me ha dado tanto
Me ha dado la risa
Y me ha dado el llanto
Violeta Parra
En una tesi doctoral, com a tot a la vida, hi ha moments bons i moments dolents.
Afortunadament, però, he estat envoltat durant tots aquests anys de gent que ha fet que els
primers fossin molt més abundants que els segons i que, a base de riures i plors, m’ha fet créixer
com a científic i com a persona. Voldria aquí dedicar unes paraules d’agraïment a totes aquestes
persones.
Al meu director de tesi, el Daniel. Gràcies per haver cregut en mi des del primer moment, i per
haver posat els mitjans (científics, personals i econòmics) perquè jo hagi pogut fer aquesta tesi.
El teu treball de direcció, donant-me una gran llibertat d’acció però estant al mateix temps
sempre al peu del canó, m’ha format com a científic i m’ha permès arribar on sóc.
A tot l’heterogeni conjunt de gent que forma la Unitat de Biofísica i Bioenginyeria, UBB pels
amics. Començant pels membres més veterans: Al Ramon, per ensenyar-me a veure i jutjar la
meva pròpia recerca des de fora, i per proveir-me d’excel·lents cerveses alemanyes. A la Mar,
pel seu brusc afecte i per portar amb estoïcisme les meves contínues pèrdues de factures i
justificants. Al Domènec, pel seu contagiós bon humor, que manté encara que estigui treballant
passades les 9 de la nit. I al Miguel Ángel, per la seva capacitat de pensar i muntar en plàstic i en
5 minuts aquell aparell clau per les teves mesures que Harvard Apparatus ven per 50000 dòlars.
I seguint pels menys veterans, en ordre d’aparició: Al Xavi, per mostrar-me que l’èxit en ciència
comença per la confiança en un mateix. Al Félix, per ensenyar-me amb irritada però infinita
paciència els misteris de l’AFM, i per aquell tendre odi caribeny. A la Ferranda, per l’alegria
amb què omple el laboratori, i per haver perdut un munt de temps de la seva feina per ensenyar-
me a dur a terme tasques tant fascinants i intel·lectualment enriquidores com el cultiu cel·lular o
fer immunos. A la Núria, per estar sempre disposada a discutir en profunditat sobre mecànica
cel·lular, la política interna d’esquerra republicana o l’últim cotilleo de la unitat. Al Raimon, per
la seva constant disposició a ajudar i per ser l’home amb el ratio capacitat científica / autoestima
més alt del món. A l’Isaac, per aprendre a hipervelocitat a aïllar neutròfils, cosa que va permetre
(petit detall) que fes mesures sobre ells... Isaac, al final se vio que así si que se puede trabajar! A
la Irene, per creure tant en mi. Tu lluita que tens energia per arribar on vulguis... I a l’Alba, per
dir-me profe i fer-me sentir important, cosa que sempre desitjo secretament.
Aquests anys tampoc haguessin estat el mateix sense tota la gent, present i passada, del
nanobiolab. Vull agrair al grup del Dr. Samitier en general (Chris, Gabriel, Errachid, Jordi, Marc,
Nacho, Romén, Isabel, Javi, Laura, Elena...) i al “cell patterning team” en concret (Mateu,
François, Eyleen) per haver-me acollit com a un més del grup, i per haver-me donat suport
personal i tècnic per tirar endavant aquesta tesi. Sense oblidar però la resta de gent del laboratori
(Xavi(s), Ramona, Muriel,, Miriam, Mari Carmen...). Les hores passades aprenent a fer dibuixets
de proteïnes sobre diferents substrats, microforadant substrats de silici, fent calçotades, pescant
pops, firmant DEAs falsos per 3 euros, o intentant seguir el ritme de cerveses del Chris han estat
una part integral de la meva formació i de la meva vida.
Thanks as well to all the people I met at the Bissell lab, who taught me about cell biology, the
ECM, californian lifestyle, and texas hold’em: Mina, Paraic, Genee, Jimmie, Hidetoshi, Celeste...
I molt especialment al Jordi, que, apart de ser el millor hoste que un podria desitjar per passar
uns mesos a la bay area, ha dedicat i segueix dedicant temps i esforços a intentar
desesperadament fer entrar quatre conceptes bàsics de senyalització bioquímica dins del meu cap.
I finalment, gràcies a tota la gent que ha fet possible aquesta tesi de forma més indirecta, però no
menys important. Als meus amics, per aguantar-me i riure’m les gràcies en els moments bons i
en els dolents. Al Fernando i la Quica, per donar-me suport en tots els sentits en tot el que he fet
sempre, per haver-me educat com ho heu fet, i per haver fet de mi amb treball i amor la persona
que sóc. Només espero poder-ho fer igual amb els meus propis fills. I a tu, per estimar-me, per
estar sempre disposada a lluitar per mi, per haver-me donat el que ningú m’havia donat i ningú
em podrà donar mai.

Contents
Agraïments .............................................................................................................................................. 7
Preface – On noses and toes .................................................................................................................. 11
CHAPTER 1 INTRODUCTION ........................................................................................................................ 13
1.1 The meaning of cell mechanics............................................................................................... 13
1.2 Cell mechanics of non adherent cells...................................................................................... 14
1.3 Cell mechanics of adherent cells............................................................................................. 27
1.4 Implications of substrate attachment and mechanics in cell function ..................................... 38
CHAPTER 2 AIMS OF THE THESIS .............................................................................................................. 47
2.1 General aim............................................................................................................................. 47
2.2 Specific aims........................................................................................................................... 47
CHAPTER 3 IMPLEMENTED METHODOLOGICAL TECHNIQUES ..................................................... 49
3.1 Use of Focused Ion Beam technology for Soft Lithography applications............................... 50
3.2 Microcontact printing for cell patterning ................................................................................ 56
CHAPTER 4 RHEOLOGY OF PASSIVE AND ADHESION-ACTIVATED NEUTROPHILS PROBED
BY ATOMIC FORCE MICROSCOPY.................................................................................................................. 63
4.1 Abstract................................................................................................................................... 63
4.2 Introduction............................................................................................................................. 63
4.3 Methods .................................................................................................................................. 66
4.4 Results..................................................................................................................................... 73
4.5 Discussion............................................................................................................................... 77
CHAPTER 5 ROLE OF MECHANICS AND NUCLEAR VOLUME IN CELL SHAPE CONTROL OF
PROLIFERATION IN SINGLE ENDOTHELIAL CELLS. ................................................................................ 85
5.1 Abstract................................................................................................................................... 85
5.2 Introduction............................................................................................................................. 86
5.3 Materials and methods ............................................................................................................ 87
5.4 Results..................................................................................................................................... 91
5.5 Discussion............................................................................................................................... 96

CHAPTER 6 STABILITY OF MICROFABRICATED HIGH ASPECT RATIO STRUCTURES IN
POLY(DIMETHYLSILOXANE).......................................................................................................................... 101
6.1 Abstract..................................................................................................................................101
6.2 Introduction ...........................................................................................................................102
6.3 Ground collapse model ..........................................................................................................104
6.4 Materials and methods...........................................................................................................106
6.5 Results ...................................................................................................................................110
6.6 Discussion..............................................................................................................................113
6.7 Conclusion.............................................................................................................................117
CHAPTER 7 CONCLUSIONS OF THE THESIS ......................................................................................... 119
APPENDIX A USE OF FOCUSED ION BEAM TECHNOLOGY FOR AFM CANTILEVER TIP
MODIFICATION ................................................................................................................................................. 123
A.1 Introduction ...........................................................................................................................123
A.2 Fabrication of cuboidal tips ...................................................................................................124
A.3 Fabrication of cylindrical tips................................................................................................125
A.4 Conclusion.............................................................................................................................126
APPENDIX B PROTOCOL FOR CELL MICROPATTERNING ON COMMON PETRI CULTURE
DISHES USING MICROCONTACT PRINTING .............................................................................................. 127
B.1 Silicon master fabrication ......................................................................................................127
B.2 Obtention of PDMS stamp.....................................................................................................129
B.3 Microcontact printing process ...............................................................................................130
B.4 Plating of cells .......................................................................................................................131
B.5 Matlab source code of bmp2str.m program ...........................................................................132
APPENDIX C PUBLICATIONS AND CONFERENCE COMMUNICATIONS .................................... 135
C.1 Publications ...........................................................................................................................135
C.2 Conference communications .................................................................................................135
LIST OF ABBREVIATIONS ................................................................................................................................ 137
REFERENCES ....................................................................................................................................................... 139

Preface – On noses and toes
During my stay at the Lawrence Berkeley Laboratory of Berkeley, California during the winter
of 2006 I attended a talk given by Mina Bissell, renowned scientist in the field of cell biology
and director of the lab that hosted me. During that talk, Dr. Bissell posed an apparently simple
question that is, in my opinion, one of the most fascinating open problems in biology: Why are
noses different from toes? While this question might initially sound even silly, it is not, and has
fascinated scientists beginning with Aristotle (23). The cells composing noses and toes in a given
individual have exactly the same genetic sequence, and they differentiated from precursor cells
that, at some stage of embryonary development, were identical. Through what means, then, do
nose cells know that they must behave as such and not start growing nails?
The general answer to this matter is the cellular microenvironment. Cells are able to sense not
only soluble factors, but also information coming from their attachment to neighboring cells and
from their substrate, the extracellular matrix (ECM). Through these attachments, cells receive the
necessary information that will lead to a given behavior. Much effort has been directed to
elucidating how cells sense these inputs from the ECM and respond adequately. Besides the
obvious importance of biochemical signaling through cell-ECM adhesion molecules, there is a
general consensus in the literature that mechanical forces transmitted through the cell
cytoskeleton play a crucial role in determining cell function. However, a gap exists in that there
is a certain scarcity of data regarding the effects of cell-substrate interaction on cell mechanics,
and its implications on cell function. In many publications, the effects of cell mechanics on
different cell functions are even discussed without providing any mechanical measurements. As
an attempt to bridge this gap, the general aim of this thesis was to apply Atomic Force
Microscopy (AFM) to study the role of cell-substrate attachment in cellular mechanics, and to
analyze its implications in cell function. This was done for two different cell systems
(neutrophils and endothelial cells) relevant to the area of interest of our lab, centered on cellular
and pulmonary biomechanics. A different cellular function was analyzed in each case: activation
in the case of neutrophils, and proliferation in the case of endothelial cells.
The work presented here is the result of 3 and a half years of research at the Biophysics and
Bioengineering Unit of the department of Physiological Sciences I at the School of Medicine of
the University of Barcelona. The thesis is divided into 7 chapters. In the introduction (Chapter 1)

I provide an overview of the field of cell mechanics, with an emphasis in the effects of cell-
substrate attachment or adhesion. I also briefly review the current knowledge on the roles of
adhesion and mechanics in neutrophil activation and endothelial cell proliferation. The aims of
the thesis are described in Chapter 1, and correspond to each of the experimental works
presented. To present these experimental works, I first describe the methodologies developed to
conduct them in Chapter 3. Then I deal separately with each work in Chapters 4-6, which
constitute the main body of this thesis. In Chapter 4, I examined the mechanical changes induced
by neutrophil substrate adhesion. Neutrophil adhesion takes place with the capillary endothelium
in a process known as activation, and is a crucial step in immune response to inflammation. This
work has been published in the Biophysical Journal (24). In Chapter 5, I have studied the
relationship between cell substrate adhesion, mechanics and proliferation in lung human
microvascular endothelial cells (HMVEC). Endothelial cell proliferation takes place mainly in
the process of angiogenesis, the deregulation of which is one of the hallmarks of tumor
formation. This work is at present being readied for submission. In Chapter 6, I present a study
dealing with the design rules of one type of devices used to measure the forces involved in cell-
substrate attachment, microfabricated post-array detectors (mPADs). This work has been
published in Langmuir (25). In Chapter 7 I expose the conclusions of the thesis. Finally, in
Appendix A I present the detailed protocol used to perform cell patterning with Focused Ion
Beam (FIB) and microcontact printing technologies, while in Appendix B I discuss the use of
FIB for AFM cantilever tip modification. This last development, which I implemented at the
facilities of the Barcelona Science Park, is currently being used to modify AFM tips for the
probing of cell adhesion and mechanics. The corresponding scientific manuscript is currently in
preparation.
12

Chapter 1 Introduction
1.1 The meaning of cell mechanics
The field of cell mechanics could be defined as the study of the relationship between forces and
deformations when these are applied to cells. According to this simple definition, measurements
of cell mechanics will reflect basically the properties of cell stiffness and viscoelasticity.
However, the term of cell mechanics is often employed in a broad sense that also includes cell
traction forces, that is, the contractile forces and deformations that cells actively exert on their
substrates. While the concepts of cell stiffness and viscoelasticity apply to all cells, cell traction
forces require the presence of a substrate, and can only be applied by adherent cells. The
mechanics of non-adherent and of adherent cells can therefore be characterized through different
means. To make this distinction explicit, I will first comment on the viscoelasticity of cells not
adhered to any substrate, and then I will move on to examine how cell attachment affects
viscoelasticity and leads to contractile traction forces.

Chapter 1 Introduction
1.2 Cell mechanics of non adherent cells
1.2.1 Determinants of cell mechanics
Cytoskeleton
The cytoskeleton is a meshwork of different sets of polymeric proteins that provide structural
support to the cells and stabilize cell shape (Fig. 1.1). As such, it is the main determinant of cell
viscoelasticity, even though it also plays a crucial role in functions such as intracellular
trafficking, cell division, or crawling (in adherent cells). Its main components are actin
microfilaments, microtubules, and intermediate filaments, along with the associated proteins that
bind to them.
Actin microfilaments
Microfilaments are linear polymers of the monomeric form of actin, known as globular actin (G-
Fig. 1.1 Structure and electron microscopy images of the different cytoskeletal proteins. Adapted from (1).
14

1.2 Cell mechanics of non adherent cells
actin). Microfilaments have a diameter of ~8 nm, a length that can reach up to 30-100 µm, a
Young’s modulus (indicative of stiffness, see section 1.2.2) of ~2 GPa (26; 27), and a polar
configuration. Certainly, microfilaments have a pointed end, with low polymerization rates, and
a barbed end, with higher polymerization rates and growth. Actin is the most abundant protein in
most eukaryotic cells, accounting for about 5-10% of the total protein content. Among all
cytoskeletal proteins, actin is the major determinant of cell viscoelasticity. Indeed, the stiffness
of several cell types has been reported to decrease remarkably if the actin cytoskeleton is
disrupted using different actin-binding drugs (such as cytochalasins or latrunculin) (28-31). By
reconstituting actin gels outside of their cellular environment, it has been observed that the
stiffness of the actin cytoskeleton is crucially dependent on the concentration of cross-linking
proteins such as filamin and α-actinin (27). In non-adherent cells such as leukocytes or red blood
cells, actin microfilaments are organized in a cortex situated underneath the plasma membrane,
with a thickness of the order of ~0.1 µm (26; 32). In the case of leukocytes, this cortex has been
mechanically characterized through micropipette aspiration experiments with a surface tension
of the order of 10 mN/m (8) and a bending modulus of the order of 1018 J (32). The stiffness of
the cortex depends also on the activity of myosin II, an actin-binding protein which is
responsible for force generation and, in adherent cells, contractility (27). It must be noted that the
terms “cortex” and “membrane” are sometimes used interchangeably. This might lead to certain
confusion about the respective roles of the actin cortex and of the lipid bilayer membrane. Even
though the relative contributions of membrane and cortex to cell mechanical compliance are
unclear (33), the important difference in thickness between both structures (~0.1 µm for the actin
cortex and 4-5 nm for the lipid membrane (26; 32)) suggests that membrane stiffness might be
small in comparison to that of the cortex.
Microtubules
Microtubules are formed by the polymerization of tubulin dimers, which form hollow cylinders
of ~25 nm diameter that can be more than 100 µm long. These cylinders have a distinct polarity,
with a plus end that recruits additional dimers faster than the minus end. Their Young’s modulus
has been estimated to be of ~ 0.8 GPa (34). The amount of microtubules present in cells is much
smaller than that of microfilaments, and their respective organizations are very different. While
microfilaments arrange to form the actin cortex (in non-adherent cells) or actin bundles (in
adherent cells, as I will describe later), microtubules radiate individually from a nucleating center
called the centrosome (27). Additionally, individual microtubules are very unstable structures,
15

Chapter 1 Introduction
which randomly switch from net polymerization and growth to net depolymerization and
shrinkage in a process termed dynamic instability. This process can be stopped if the plus end is
capped by some cellular structure, providing thus for specific stable microtubule arrangements
which are then used for processes like mitosis and for the trafficking of proteins, vesicles, and
organelles with the assistance of molecular motors such as kynesin or dynein.
Microtubules can also be disrupted using drugs such as nocodazole or colchicine. Studies using
these drugs in cells with little or no substrate attachment suggested that microtubule disruption
either decreased stiffness (35) or had no effect on it (36). This effect is opposed to that observed
in some adherent cells (37; 38). This different effect might be related to a role of microtubules in
balancing cell contractility, which will be discussed in section 1.3.5. In general terms, however,
it is generally accepted that the role of microtubules in determining cell viscoelasticity is
markedly smaller than that of microfilaments.
Intermediate filaments
Intermediate filaments are formed by subunits of coiled-coil dimers, have a diameter of ~ 10 nm
and a Young’s modulus of ~ 2GPa (39). There are up to 50 different types of intermediate
filaments, each fulfilling different functions. For instance, keratins are abundant in epithelial
cells and provide structural support to hair or nails, vimentin filaments associate with
microtubules, and lamins form the nuclear lamina, a structure placed immediately underneath the
nuclear membrane which stabilizes the nuclear envelope (27). Unlike microfilaments and
microtubules, intermediate filaments are not polar, and are thus not used for intracellular
transport. The mechanical role of intermediate filaments remains unclear, although disruption of
vimentin filaments with acrylamide or calyculin A was reported to reduce stiffness in non
adhesive T lymphocytes (40) and in adhesive fibroblasts and endothelial cells (41). Consistently,
vimentin-deficient cells were measured to be softer than control cells (41), suggesting that
vimentin plays a significant contribution in determining cell stiffness. In adhesive cells, vimentin
filaments might contribute to stiffness by carrying tensile stress (42), even though their role
might only be appreciable at high loadings (43). Thus, intermediate filaments could serve as a
support mechanism to the actin cytoskeleton, preventing excessive deformations when the cell is
submitted to high stresses (44).
16

1.2 Cell mechanics of non adherent cells
Cytoplasm
The cell cytoplasm is composed of water and up to 40% of proteins (45). At this density, proteins
cannot freely diffuse as in a dilute aqueous solution. Rather, they are in a highly confined
environment which has been termed molecular crowding. This crowding of proteins has recently
been observed directly on Dictyostelium discoideum cells with cryeoectron tomography
imaging (5), showing a configuration in which macromolecules could occupy up to 40% of
available space (Fig. 1.2). The cytoplasm is thus a complex fluid that can hardly be modelled
mechanically as a Newtonian liquid. Indeed, measurements obtained on the cytoplasm of
neutrophils showed that the displacement of intracellular granules moved with optical tweezers
followed a scale free power law behavior with time (46). This type of behavior, which will be
discussed in section 1.2.4, is inconsistent with that of a Newtonian liquid and suggests that
processes with characteristic time scales spanning wide range of time scales could be responsible
for cytoplasmic mechanics. Measured values of the Young’s modulus of the neutrophil
cytoplasm (46) and of cytoplasmic extracts from Xenopus laevis eggs (47) are of the order of
100-101 Pa, which is an order of magnitude below typical values for whole cells.
Fig. 1.2 Cryoelectron tomography image showing actin filaments (red), macromolecular complexes (green), and membranes (blue). Field of image is 815 x 870 nm. Adapted from (5).
17

Chapter 1 Introduction
Nucleus
The nucleus can constitute an important fraction of total cell volume (~20% in leukocytes (48),
for example). Consequently, it can play an important role in mechanical measurements,
especially if the measurement technique probes the cell globally and not locally from the surface.
The cell nucleus is believed to be about an order of magnitude stiffer than the surrounding
cytoplasm (43; 49), and also shows a scale free power law behavior (50). Additionally, the
nucleus is mechanically connected to the cytoskeleton: Mechanical perturbations of the cell
exerted from its membrane transmit to the nucleus via actin and vimentin filaments (43; 51), and
nuclear size has been reported to decrease after cytoskeletal disruption (52). The mechanical
regulation of nuclear size could play a crucial role in functions such as DNA transcription (50) or
synthesis by changing the degree of DNA condensation.
1.2.2 Cell stiffness and viscoelasticity
Stiffness
The simplest way to assess cell mechanical properties is to measure stiffness, which can be
quantified simply by obtaining the ratio between cell stress and strain after a given deformation.
If a quantification of cell stiffness independent of the measurement technique is needed, however,
then the stress/strain data must be processed to account for the geometry of contact between the
cell and the measuring probe. In this way, cell stiffness can be quantified by calculating its
Young’s modulus E (if the cell is treated as a homogeneous body) or by calculating the
mechanical parameters of the different cell components (if the cell is treated as a mechanically
heterogeneous body). By using this approach, it has been observed that all cells (and especially
non-adherent cells) are extremely soft. Indeed, while the Young’s modulus of man-made rubbers
falls in the range of 106-107 Pa (53), values for E for leukocytes fall in the range of 200-1400 Pa
(54-57), while red blood cells are somewhat softer (4). The high variability of reported stiffness,
even for the same cell type, could be due to different reasons. First, different measuring
techniques probe cell stiffness at different cell regions and length scales. This can result in
greatly varying values of E given by cell heterogeneity. Second, different cell/probe contact
models and cell mechanical models can also lead to changing calculated values of E. Finally, the
viscoelasticity of cells, discussed in the next section, can lead to different estimated stiffness as a
18

1.2 Cell mechanics of non adherent cells
function of the time scale of the measurement.
Viscoelasticity
All cells (adherent and non adherent) exhibit a viscoelastic behavior. That is, the relationship
between stress and strain in any measurement will depend on the time scale of the measurement.
In this way, the response to an applied cell stress is not an immediate elastic deformation but a
creep response (10; 58-60), the stress exerted by cells after a fixed strain decays with time (61),
and the stress/strain relationship measured from cyclic loading experiments depends on the
loading frequency (15; 62). To measure cell viscoelasticity, it thus is insufficient to obtain E, as
this parameter will depend on the time scale or frequency of the measurement. The quantification
of cell viscoelasticity is generally done by calculating the complex shear modulus G*(ω) = G’ +
iG’’, which is a function of frequency ω and is composed of its real elastic part G’ and its
imaginary viscous part G’’. Alternatively, and if a particular cell mechanical model is assumed,
cell viscoelasticity can be quantified by estimating the model parameters that best fit stress/strain
data. This approach has the limitation that it is model-dependent, but has been widely used in the
analysis of leukocyte deformation (8; 19; 22; 63-66).
1.2.3 Measuring cell viscoelasticity
In this section I will briefly review existing techniques used to probe the viscoelasticity of non-
adhered cells. All the techniques described can also be employed to probe adherent cells.
However, in this section I do not mention any of the techniques that require a firm cell-substrate
attachment for operation. By definition, these techniques can only be applied to adherent cells
and they are discussed in section 1.3.4.
Micropipette aspiration
Micropipette aspiration is one of the earliest and most widely used techniques to probe the
viscoelasticity of non-adherent cells, especially leukocytes. In a typical experiment, the cell is
first brought into contact with a glass micropipette with an inner diameter smaller than that of the
cell. A negative suction pressure (of the order of 101-102 Pa) is then applied to the micropipette,
causing the cell to extend a protrusion (Fig. 1.3). The evolution of the protrusion is recorded with
videomicroscopy (8; 64; 67), resulting thus in a creep experiment where deformation is
19

Chapter 1 Introduction
measured as a function of time for a constant stress (aspiration pressure). Alternatively, cells can
be fully drawn into a micropipette, kept in it for some minutes, and expelled. The process of
recovery of the original spherical cell shape is then recorded (19; 22). This technique has the
advantage that it can be used to partially mimic the physiological process of passage of
leukocytes or red blood cells through microcapillaries. However, it also presents some
limitations. The considerable deformation and the complicated contact geometry present in
experiments require complex calculations to obtain cell mechanical parameters. This results in
calculated mechanical parameters which generally depend on the assumed mechanical model,
and do not provide a direct estimation of G*(ω). Additionally, the range of time scales or
frequencies observable in micropipette aspiration tests is reduced due to the limitations given by
image acquisition rate (high frequency limitation) and by the time it takes for leukocyte
protrusions to extend fully (low frequency limitation).
Particle tracking
Two main approaches exist to measure cell viscoelasticity by tracking the motions of particles
inside cells. In the first approach, a focused laser beam is used to catch an intracellular particle in
an optical trap, in a technology commonly called optical tweezers. When the focus of the laser
beam is displaced, the particle experiences a spring-like force towards the focal point of the laser
beam (68). Given that the stiffness or spring constant of the trap can be calibrated, force-
displacement curves of the particles can be obtained and the viscoelasticity of the cell cytoplasm
can be assessed. The used particle can be a granule or mitochondria of the cell (46), or a
Fig. 1.3 Images of two cell types being aspirated into a micropipette (top) and after full aspiration (bottom). Scale bars indicate 5 µm. Adapted from (4).
20
1.2 Cell mechanics of non adherent cells
microbead attached to the cell membrane (69). The main limitation of this approach is that the
applied forces are necessarily small, given that large laser intensities can damage cells (70). In
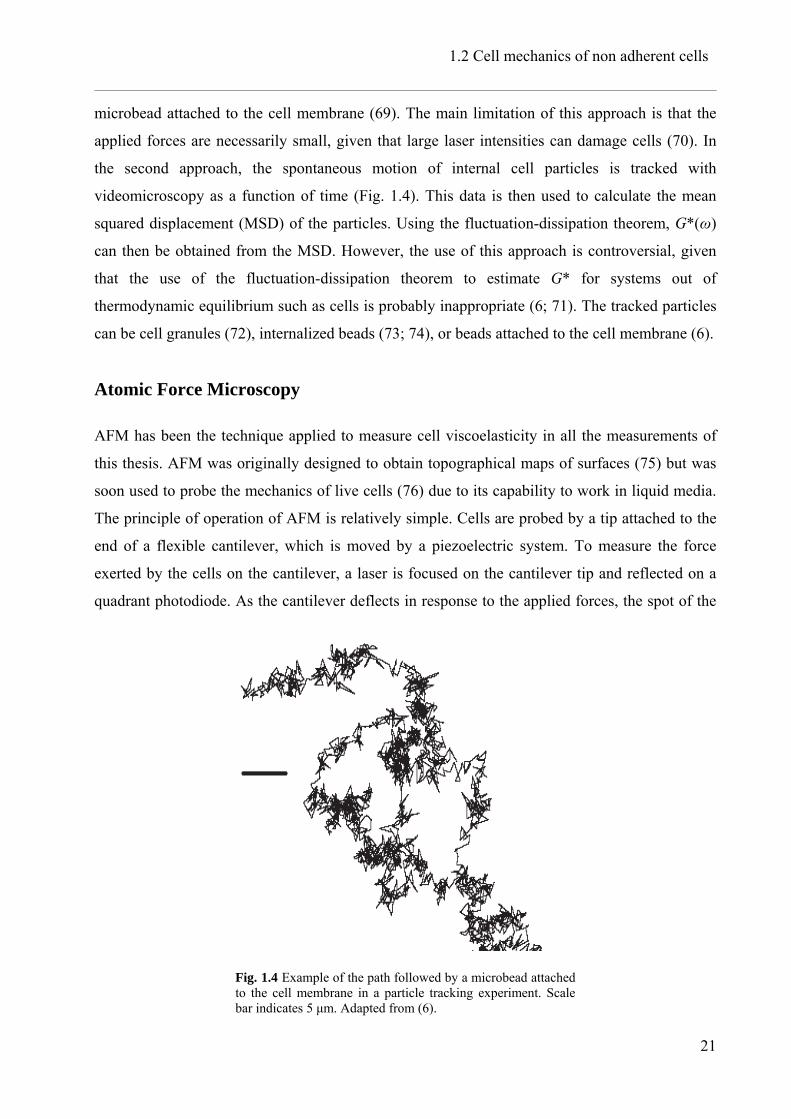
the second approach, the spontaneous motion of internal cell particles is tracked with
videomicroscopy as a function of time (Fig. 1.4). This data is then used to calculate the mean
squared displacement (MSD) of the particles. Using the fluctuation-dissipation theorem, G*(ω)
can then be obtained from the MSD. However, the use of this approach is controversial, given
that the use of the fluctuation-dissipation theorem to estimate G* for systems out of
thermodynamic equilibrium such as cells is probably inappropriate (6; 71). The tracked particles
can be cell granules (72), internalized beads (73; 74), or beads attached to the cell membrane (6).
Atomic Force Microscopy
AFM has been the technique applied to measure cell viscoelasticity in all the measurements of
this thesis. AFM was originally designed to obtain topographical maps of surfaces (75) but was
soon used to probe the mechanics of live cells (76) due to its capability to work in liquid media.
The principle of operation of AFM is relatively simple. Cells are probed by a tip attached to the
end of a flexible cantilever, which is moved by a piezoelectric system. To measure the force
exerted by the cells on the cantilever, a laser is focused on the cantilever tip and reflected on a
quadrant photodiode. As the cantilever deflects in response to the applied forces, the spot of the
Fig. 1.4 Example of the path followed by a microbead attached to the cell membrane in a particle tracking experiment. Scale bar indicates 5 µm. Adapted from (6).
21
Chapter 1 Introduction
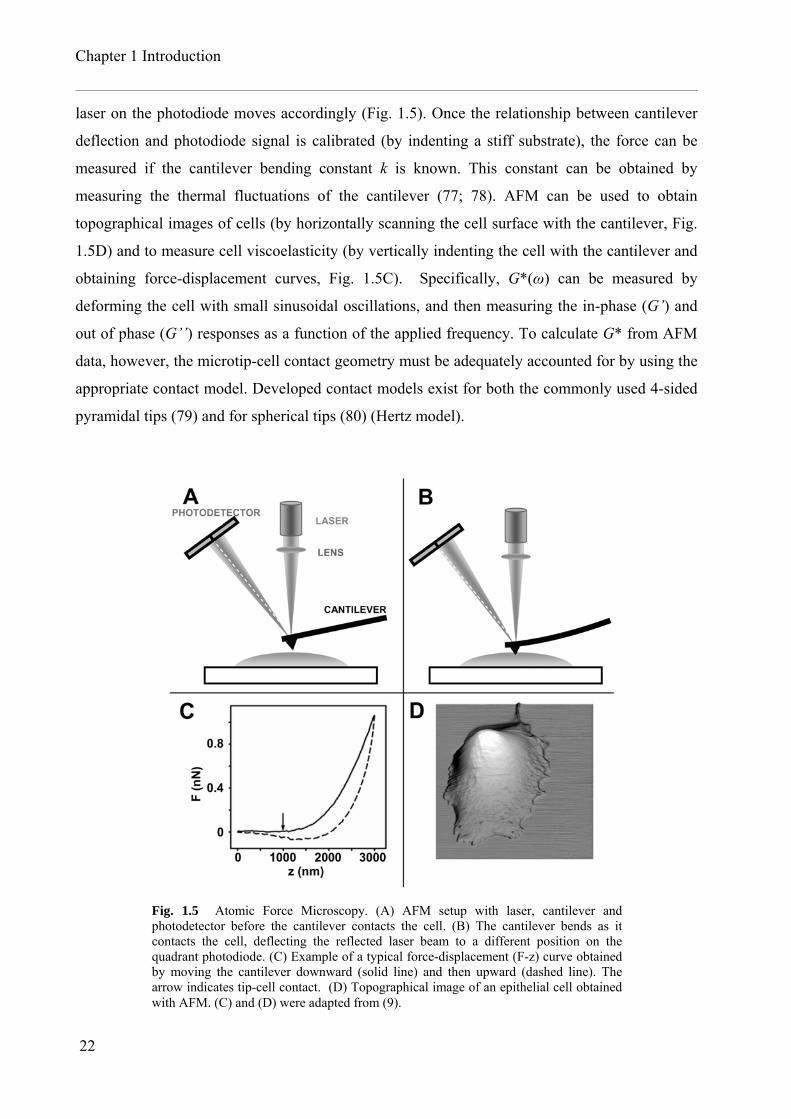
laser on the photodiode moves accordingly (Fig. 1.5). Once the relationship between cantilever
deflection and photodiode signal is calibrated (by indenting a stiff substrate), the force can be
measured if the cantilever bending constant k is known. This constant can be obtained by
measuring the thermal fluctuations of the cantilever (77; 78). AFM can be used to obtain
topographical images of cells (by horizontally scanning the cell surface with the cantilever, Fig.
1.5D) and to measure cell viscoelasticity (by vertically indenting the cell with the cantilever and
obtaining force-displacement curves, Fig. 1.5C). Specifically, G*(ω) can be measured by
deforming the cell with small sinusoidal oscillations, and then measuring the in-phase (G’) and
out of phase (G’’) responses as a function of the applied frequency. To calculate G* from AFM
data, however, the microtip-cell contact geometry must be adequately accounted for by using the
appropriate contact model. Developed contact models exist for both the commonly used 4-sided
pyramidal tips (79) and for spherical tips (80) (Hertz model).
Fig. 1.5 Atomic Force Microscopy. (A) AFM setup with laser, cantilever and photodetector before the cantilever contacts the cell. (B) The cantilever bends as it contacts the cell, deflecting the reflected laser beam to a different position on the quadrant photodiode. (C) Example of a typical force-displacement (F-z) curve obtained by moving the cantilever downward (solid line) and then upward (dashed line). The arrow indicates tip-cell contact. (D) Topographical image of an epithelial cell obtained with AFM. (C) and (D) were adapted from (9).
22

1.2 Cell mechanics of non adherent cells
Even though AFM was initially used with adherent cells, it can also be used with non-adhesive
1.2.4 Models of cell mechanics
of cell mechanics that do not take into account the
Newtonian liquid droplet model
s developed by Yeung and Evans (82) to interpret the
plet.
cells if these are immobilized to prevent slipping. Non-adhesive cells can be immobilized by
placing them in micropores with diameters slightly larger than those of the cell (81).
Alternatively, the substrate attachment of cells like leukocytes can be minimized but not
completely eliminated through coating with poly(HEMA) (54).
In this section I will review different models
effect of cell contractility or prestress. All of these models (except the structural damping model)
have been used mostly to describe the mechanics of non adherent cells, and especially that of
leukocytes and red blood cells.
The Newtonian liquid droplet model wa
behavior of leukocytes in micropipette aspiration experiments. In this model, the cell is
considered to be composed of a membrane with cortical tension T enclosing a Newtonian
viscous liquid (Fig. 1.6). The model is able to explain the experimentally observed formation of
a static spherical projection of leukocytes into micropipettes, which increases with cell suction
pressure (8). Once the suction pressure reaches a critical value (corresponding to the formation
of a hemispherical projection), the model predicts a continuous viscous flow of the leukocyte
into the micropipette. However, data from different micropipette aspiration experiments (64; 67)
showed an initial fast viscoelastic deformation that could not be explained by this viscous
continuous flow. This led to the development of alternative models for leukocyte rheology.
Red blood cell viscoelasticity is widely accepted to conform to that of a Newtonian liquid dro
Red blood cell membrane, however, is characterized by a shear modulus (and not cortical tension)
as this type of cells does not flow into micropipettes after a threshold pressure. This could be due
to the fact that, unlike that of leukocytes, the membrane of red blood cells shows a great
resistance to area expansion (4).
23

Chapter 1 Introduction
Alternative liquid droplet models
Different alternative viscoelastic liquid droplet models have been proposed to account for the
non-newtonian behavior of leukocytes and other cell types. The compound liquid droplet model
treated the nucleus as a liquid with a different viscosity than that of the cytoplasm, either with
(83) or without (63; 84) an enclosing cortical layer. However, even though the increase in the
number of parameters evidently improved the quality of the fits to experimental data, it was
found that an infinite number of combinations of parameters could reproduce the same
micropipette aspiration data (85). This result showed that models accounting for many different
cell regions are difficult to validate unless these regions are probed separately. Tsai and co-
workers (67) observed that the apparent cytoplasmic viscosity of neutrophils determined with the
Newtonian model decreased with increasing aspiration pressure. This led to the development of
the shear thinning model, in which cytoplasmic viscosity µ is considered to decrease with shear
rate γ as a power law of the type µ α γ-b, with b being of the order of 0.5. This model is able to fit
micropipette aspiration data better than the Newtonian model, and is consistent with the behavior
of F-actin and microtubule suspensions (86). In the Maxwell liquid droplet model introduced by
Dong and co-workers (19), cytoplasmic viscoelasticity was accounted for by modelling the
cytoplasm as a viscoelastic Maxwell body (a dashpot in parallel with a spring, Fig. 1.6). This
model was able to better reproduce the initial fast deformation of leukocytes when entering
micropipettes, but failed to properly account for leukocyte behaviour in large deformation
experiments (84; 87). Finally, the standard viscoelastic or Kelvin model introduced by Schmid-
Schonbein and co-workers (88) accounts for both membrane elasticity and cytoplasmic
viscoelasticity by modelling cells as a homogeneous standard viscoelastic body (composed of a
Newtonian Liquid +cortical tension
Kelvin bodyMaxwell liquid + cortical tension
µN
µM
kM
µS
ks2ks1
T T
Newtonian Liquid +cortical tension
Kelvin bodyMaxwell liquid + cortical tension
µN
µM
kM
µS
ks2ks1
TT TT
Fig. 1.6 Spring-dashpot representations of different models commonly used to describe leukocyte rheology. K symbols denote springs, µ symbols denote dashpots, and T symbols denote cortical tension.
24

1.2 Cell mechanics of non adherent cells
spring in parallel to a Maxwell body, Fig. 1.6). Even though this model was originally proposed
for leukocytes, it has later been applied to adherent cells such as chondrocytes (89; 90) or
endothelial cells (91). Even though I have described it in this section, the standard viscoelastic
model is not a liquid droplet model as it is not composed of a cortical membrane enclosing a
liquid cytoplasm.
Power law structural damping model
The power law structural damping model was introduced to explain the power law dependency
of G* on frequency measured in several cell types with AFM or magnetic twisting cytometry
(MTC). Its prediction of G*(ω) is:
( ) ( ) πωω η µ−⎛ ⎞⎟⎜= + Γ − − +⎟⎜ ⎟⎜⎝ ⎠Φ
1
2* ( ) 1 2 cos ( 1)x
oo
G G i x x ωi (1.1)
where G0 and Φ0 are scaling factors for stiffness and frequency respectively,
is the hysteresivity or structural damping coefficient, α = x-1 is the power law exponent, and iωµ
is an additional newtonian viscous term. This equation predicts a scale free power law behavior
of both G’ and G’’, and a coupling between them (G’’ = ηG’) at low frequencies (where iωµ is
small). By modifying the parameter x, G*(ω) can become that of an elastic solid (x =1) or that of
a Newtonian viscous liquid (x=2).
tan(( 1) /2)xη π= −
The frequency dependence predicted in Eq. (1.1) has been observed in epithelial cells (62),
airway smooth muscle cells, carcinoma cells, and adherent macrophages and neutrophils (15). In
all cases, x was of the order of 1.1, implying that G* scaled as a weak power law with frequency.
This power law behavior is inconsistent with the liquid droplet models described earlier, which
predict either linear or exponential dependencies of G* on ω (except for the shear thinning
model of Tsai and co-workers (67)). Liquid droplet models have nevertheless been used
successfully to describe leukocyte behavior in micropipette aspiration experiments. An
explanation for this apparent discrepancy is that the prediction for the creep function of liquid
droplet models (or of any other model based in springs and dashpots) is a combination of
exponential functions of displacement with time. In a structural damping body, however, the
creep function is a power law function. These two types of functions might be indistinguishable
if the range of time scales probed is small (Fig. 1.7), as is the case in creep functions measured
with micropipette aspiration tests. However, it must be noted that power law behavior has only
been observed for adherent cells, while liquid droplet models have been applied mainly to non-
25

Chapter 1 Introduction
adherent cells. The differences between the two models could thus in principle reflect
mechanical changes related to cell-substrate adhesion.
The power law rheology observed in cells has been interpreted with the theory of Soft Glassy
Rheology (SGR) (15; 92). This theory describes the rheology of a class of materials known as
soft glassy materials, which includes foams, emulsions, colloid suspensions, pastes, and slurries
(92). These materials show a mechanical behavior which is very similar to that of cells: they are
very soft, the frequency dependence of G* can be described by Eq. (1.1), and the parameter x is
of the order of 1.1. To understand how all these different materials could show these common
characteristics, Sollich and co-workers (92) suggested that the rheology of soft glassy materials
could reflect a level of structural order with characteristic energy levels higher than those of
thermal agitation. In this view, soft glassy materials are composed of structural elements trapped
in energy wells formed by their neighboring elements. If enough energy is applied to the system,
then the elements can escape from their traps. This energy, which is of non-thermal origin, is
regulated by the parameter x, which is interpreted as an effective temperature. For x=1, the
system is at its glass transition, the elements are fixed in their wells and the material behaves as
an elastic solid with stiffness G0. As the effective temperature increases, the system becomes
more disordered until reaching the state of a pure Newtonian liquid (x=2). In the case of cells, x
would reflect the ability of the cytoskeleton to resist forces (small x) or to deform and flow
Fig. 1.7 Example of a creep experiment. Displacement of microbeads attached to the surface of human airway smooth muscle cells as a function of time after applying a step force. Solid line shows a power law fit, dashed line shows the best fit of a spring-dashpot model composed of a Kelvin body in series with a Maxwell body. Even though the spring-dashpot model has 5 adjustable parameters and 4 time constants, its fit to the data is markedly worse than that of the power law fit. However, if the measured data were restricted to a time scale between 10-1 – 101 s, both models would result in good fits. Image adapted from (14).
26

1.3 Cell mechanics of adherent cells.
(larger x). Consistently with this hypothesis, a great variety of drugs affecting cytoskeletal
integrity has been shown to regulate x in several cell types (15; 30; 31). However, at present the
nature of the structural elements that could be responsible for cell rheology remains unidentified.
It has been suggested that structural elements and their interactions could be related to attractive
forces between many different macromolecules (6). However, recent work showed that weak
power law behavior could be reproduced simply by an actin gel cross-linked with filamin A (93),
implying that the scale free dynamics of cells could be due mostly to the heterogeneity,
molecular aggregation or distribution of internal stresses of the actin cytoskeleton (94).
1.3 Cell mechanics of adherent cells.
1.3.1 Cell-substrate adhesion
The extracellular matrix
The ECM is a network of filamentous proteins which provides a structural support for cell
attachment. The ECM, which is secreted by the cells themselves, is composed of many different
types of proteins, including collagen, fibronectin, and laminin (26). As I will discuss later, the
profound effect of cell-ECM interaction on mechanical properties could be a determinant in
different cell functions. However, the density and composition of the ECM, which are highly
tissue-dependent, also play an important role in cell behavior by signaling through cell-ECM
adhesion complexes. In mammary epithelia, for instance, the presence of laminin is required for
the expression of milk proteins (95), while the condensation of fibronectin might drive the initial
stages of skeletal development (96).
Cell-ECM adhesion complexes
Adhesion between cells and the ECM takes place through complex structures composed of many
different proteins. Of the different observed types of adhesion structures, focal adhesions are
probably the best characterized. Focal adhesions can be up to a few microns in length, and
contain a molecular complexity that is far from unraveled (97). The main transmembrane
receptors attaching cells to the ECM in focal adhesions, however, are known to be integrins.
27

Chapter 1 Introduction
Integrins are heterodimers of α and β subunits containing extracellular domains for ECM protein
binding, a transmembrane domain, and a cytoplasmic domain (98). Different combinations of the
various existing types of α and β subunits determine the binding specificity between integrins
and ECM molecules. In the cytoplasmic side, Focal adhesions connect integrins with actin
filaments and the cytoskeleton through a great diversity of proteins (Fig. 1.8), including vinculin,
talin, tensin, α-actinin, Focal Adhesion Kinase (FAK), and many others (97). FA thus provide a
direct mechanical connection between the ECM and the cytoskeleton.
Focal adhesions are oval structures located at the periphery of cells (99; 100). Other types of
cell-ECM adhesion complexes include fibrillar adhesions, which are elongated structures with a
somewhat different protein composition and bind to fibronectin fibrils (101), and focal
complexes, which are small structures located at the edges of lamellipodia (102).
Adhesion-induced remodeling of the cytoskeleton
The adhesion and spreading of cells onto the ECM results in important changes in cytoskeletal
organization. The initial stages of cell spreading lead to the formation of cell-ECM contacts
(103). Through these contacts, cells then begin exerting traction forces on their substrate,
probably through the activation of the small GTPase RhoA (104). The application of force on
cell-ECM contacts promotes their maturation first into focal complexes (105) and then into focal
adhesions (106), and the formation of stress fibers (104). Stress fibers, which are characteristic of
adherent cells, are bundles of actin filaments connected to focal adhesions, and exert traction
Fig. 1.8 Simplified depiction of the different proteins involved in focal adhesions. Adapted from (2)
28

1.3 Cell mechanics of adherent cells.
forces on the ECM through their association with myosin II. Stress fibers are believed to be
responsible for most of the contractility of spread cells (103).
As we have seen, the organization of the actin cytoskeleton in adherent and non-adherent cells is
fundamentally different. While non-adherent cells show only a cortical cytoskeleton beneath the
plasma membrane, adherent cells present stress fibers connecting the cell with the ECM through
focal adhesions. This organization provides a mechanical connection between ECM, the cell, and
its nucleus, enables mechanotransduction, and has a deep impact in cell mechanical properties.
1.3.2 Controlling cell-substrate attachment
ECM protein density regulation
A variety of tools have been developed to control the extent of cell spreading to study how the
mechanics and function of cells are affected by their adhesion. Folkman and Moscona (107)
plated cells on substrates coated with poly(HEMA), a polymer which is nonadhesive to proteins
and cells. By regulating the thickness of the coating, the amount of ECM proteins absorbed on
the substrate could be controlled, regulating thus the degree of cell adhesion. Improving this
technique, Ingber (108) directly controlled the density of absorbed ECM protein by plating cells
on substrates coated with increasing concentrations of fibronectin. Non-specific adhesion
between cells and the substrate was blocked with Bovine Serum Albumin. However, the fact that
these techniques controlled cell-substrate attachment by modifying ECM ligand density implied
that the roles of integrin-ECM binding and that of cell spreading or shape per se could not be
distinguished.
Lithography techniques
The roles of integrin binding and cell shape could be isolated with the help of lithography
techniques. Using conventional photolithography traditionally employed in microelectronics,
patterns of ECM molecules can be deposited onto substrates (109). Cells with different shapes
can then be grown on these patterns, even though ECM ligand density is kept constant.
Photolitography techniques, however, are not well suited to biological applications due to their
requirement of clean room facilities and their use of materials which are toxic to cells. An
alternative set of lithographic techniques, collectively known as Soft Lithography (110), has
29

Chapter 1 Introduction
proven to be better adaptable to cell culture applications. Soft lithographic techniques are based
on the use of a soft elastomeric polymer, Poly(dimethylsiloxane) (PDMS), as a stamp to pattern
proteins onto substrates. In the most common cell patterning soft lithographic technique,
microcontact printing (shown in Fig. 1.9 and discussed in detail in Chapter 3), a PDMS stamp
containing a pattern of raised features is soaked in a solution containing alkanethiols (typically
terminated in CH3 groups). The PDMS is then used to stamp a gold substrate, which is left with a
covalently attached patterned monolayer of alkanethiols. The remaining unstamped regions are
exposed to another alkanethiol, terminated in a Poly(ethylenglycol) (PEG) group. While the CH3
terminated pattern will be adhesive to proteins and cells, the complementary PEG pattern will
not, allowing thus for selective protein and cell patterning (12). Alternatively, PDMS stamps can
be used to directly stamp proteins onto plastic surfaces if the wettabilities of both stamp and
substrate are appropriate (111).
Other soft lithographic techniques include microfluidic patterning, membrane based patterning
(MEMPAT), and physical patterning. In microfluidic patterning (112; 113), a PDMS
microchannel is sealed onto a desired substrate. By circulating a liquid solution through the
channel, proteins or even cells can be directly patterned on the substrate. This technique has the
advantage of allowing the coculture of patterns of different cells or proteins. In MEMPAT (114),
a very thin membrane of PDMS with patterned holes is put in conformal contact with a substrate.
Fig. 1.9 Human endothelial cells patterned with microcontact printing. (A) Differential Interference Micrographs of cells on single square patterns (12). (B) Cell plated on multiple dotted patterns and stained for vinculin. Vinculin, a focal adhesion marker, only localizes in the dots previously micropatterned with fibronectin where cell-ECM adhesion takes place. (C) Same cell stained for F-actin (red). Blue staining shows the underlying micropatterned distribution of fibronectin. B and C are adapted from (21).
30

1.3 Cell mechanics of adherent cells.
The substrate is then exposed to a solution of a desired protein. When the membrane is later
removed, a pattern of protein remains, which can then be used for cell patterning. This technique
has the advantage of being applicable to very soft substrates, which allowed Wang and co-
workers to combine cell micropatterning with traction force microscopy (115). In physical
patterning, a soft lithographic process is used to finally obtain a thin membrane of an agarose gel
(non-adhesive to cells) on a glass substrate (116). This membrane contains micrometric holes
with given shapes, which expose the glass substrate (where cells can adhere). Cells are thus
physically confined to these holes and adopt their shape. This technique allows controlling not
only cell-ECM adhesion and cell shape but also cell-cell contacts, which can be inhibited due to
the fact that a physical agarose wall surrounds the cell.
Nanopatterning
Recently, some techniques have appeared which permit to control cell-substrate adhesion at the
molecular level. Using dip pen nanolithography, protein patterns of 100-300 nm size could be
“inked” onto a substrate using a modified AFM tip (117). Cell-substrate adhesion was observed
to be still feasible through these small patterns. Using a novel synthesized polymer presenting a
controlled number of RGD (Arg-Gly-Asp) peptides (an integrin binding site of most ECM
proteins), Koo et al. (118) could study the effect of both ECM ligand density and clustering.
Both effects were observed to be important. Finally, Arnold and co-workers (119) used block-
copolymer micelle nanolithography to position gold nanodots coated with a single RGD peptide
in an array where dot spacing was precisely controlled between 28 and 85 nm. In this way, they
could observe that focal adhesions could not form if the spacing between ligands was greater
than ~ 70 nm.
1.3.3 Adherent cell mechanical properties
Cell contractility
The terms “cell contractility” and “mechanical tension” are broad concepts referring to the forces
exerted by cells on their substrates through their adhesion points. These forces are usually
applied by cells at their periphery, with a centripetal orientation (that is, contractile forces tend to
contract the cell towards its center) (115). There are different ways to quantify cell contractility.
31

Chapter 1 Introduction
In the simplest approach, a contractile force can be defined as the integral of the force applied by
the cell throughout the entire cell-substrate contact area (17; 120). This force can then be
normalized by this cell-substrate contact area (115). Alternatively, a contractile moment can be
defined as the net moment tending to contract the substrate in the x and y directions (17; 121).
Finally, cell prestress (11) can be calculated to quantify the level of tensile stress carried by
individual load-bearing elements of the cell (mainly stress fibers). Cell prestress can also be
viewed as the tensile stress carried per unit of cell cross-sectional area (Fig. 1.10). To calculate
prestress from traction forces, however, cell topography must be either known or assumed (Fig.
1.10). It must be noted that all these magnitudes, which are the ones measured in contractility
studies, provide information only about the tensile stress that is balanced by the substrate. A
fraction of the total cell tensile stress can be balanced by compressed microtubules, even though
it has been reported to be small in different cell types (37; 38).
Cell contractility depends on several factors. Increasing levels of cell spreading (that is, the area
of cell-substrate adhesion) increase contractility (115; 122) as well as stiffness (123), which is to
be expected given that the actin cytoskeleton and stress fibers require a certain degree of
spreading to develop (21). Disruption of the actin cytoskeleton or of myosin activity (17; 124)
greatly decreases contractile forces, illustrating their importance in establishing a contractile
state. Cell mechanical tension has also been reported to be highly dependent on the activity of
the Rho family of small GTPases (17; 106), and on the stiffness of the underlying substrate (125;
126). Finally, it is important to note that stiffness and contractility have been observed to be
closely related in Human Airway Smooth Muscle (HASM) cells (11; 127). This association,
confirmed by a great degree of circumstantial evidence (128), suggests that stiffness and
contractility reflect the same mechanism and has given support to the tensegrity theory, which
Fig. 1.10 Calculation of cell prestress. t’ represents the mean traction force, A’ the cell-substrate contact area, A’’ the area of a vertical cell cross-section, and pt the prestress. The prestress can be calculated by considering that the balance of forces imposes that ptA’’ = tA’. Adapted from (11).
32

1.3 Cell mechanics of adherent cells.
will be described in section 1.3.5.
1.3.4 Measuring adherent cell mechanics
In this section I will first describe two techniques to measure cell viscoelasticity (Microplates
and MTC) which, due to their characteristics, can only be applied to adherent cells. Then I will
move on to describe the different existing techniques designed to measure cell contractility.
Microplates
In this technique designed to probe the viscoelasticity of whole cells, a single cell is adhered
between two microplates. One of them is rigid, while the other is flexible and is used as a sensor.
The cell is then either compressed or stretched by displacing the microplates with a piezoelectric
actuator, which allows for both oscillatory measurements as a function of frequency (61) or
creep function measurements as a function of time (60). Results obtained with this technique
have been interpreted both with liquid droplet models (61) or with the power-law structural
damping model (60).
Magnetic Tweezers
Magnetic Tweezers (Fig. 1.11) are based in the manipulation of para- or ferromagnetic
microbeads embedded or attached to the measured sample. To externally apply forces to the
beads, an external magnetic field is induced with permanent magnets (129; 130), electromagnets
with soft iron cores (131-133), or simple coaxial coils (134; 135). If the core of an electromagnet
Fig. 1.11 Magnetic tweezers setup showing how the core of an electromagnet can be pointed next to a cell with attached microbeads. In this particular setup, the distance r from the core to the cells was between 10 and 100 µm. Adapted from (10).
33
Chapter 1 Introduction
is pointed close to the sample, forces of up to 10 nN can be achieved (10). Magnetic Tweezers
require a firm adhesion between the cell and the substrate (to keep cells immobile during
measurements) and between the cell and the bead (to ensure that beads deform the cell as they
move).
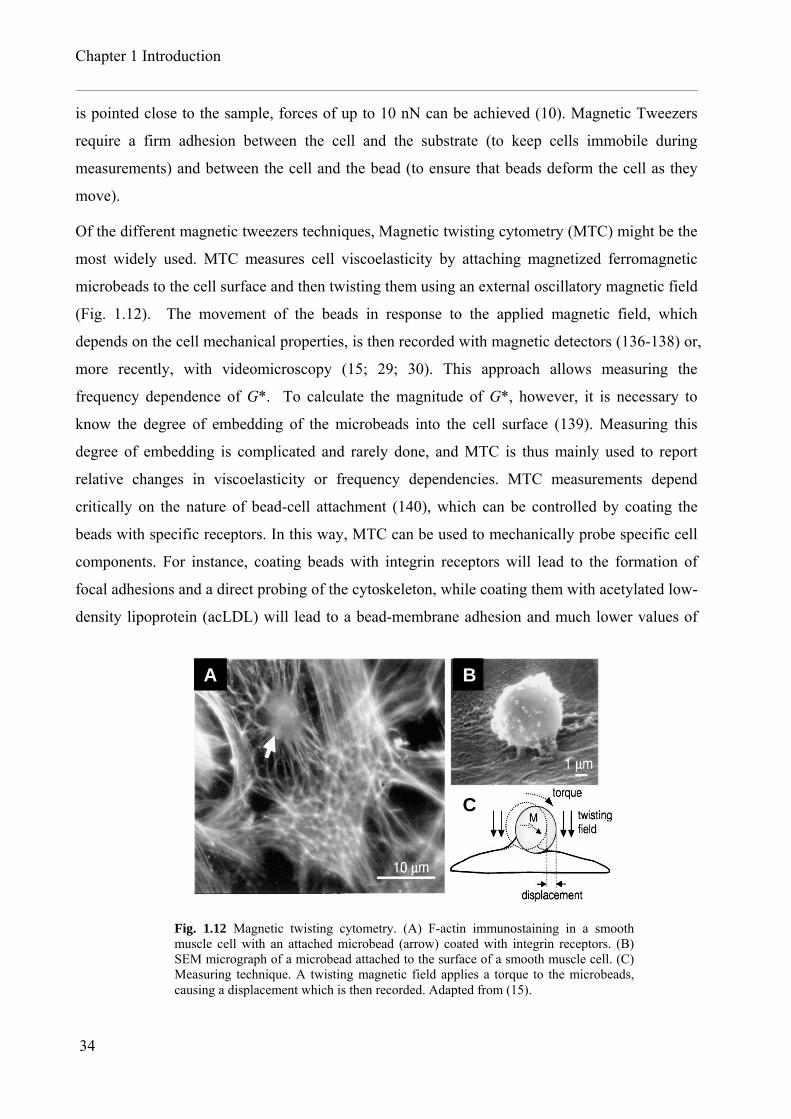
Of the different magnetic tweezers techniques, Magnetic twisting cytometry (MTC) might be the
most widely used. MTC measures cell viscoelasticity by attaching magnetized ferromagnetic
microbeads to the cell surface and then twisting them using an external oscillatory magnetic field
(Fig. 1.12). The movement of the beads in response to the applied magnetic field, which
depends on the cell mechanical properties, is then recorded with magnetic detectors (136-138) or,
more recently, with videomicroscopy (15; 29; 30). This approach allows measuring the
frequency dependence of G*. To calculate the magnitude of G*, however, it is necessary to
know the degree of embedding of the microbeads into the cell surface (139). Measuring this
degree of embedding is complicated and rarely done, and MTC is thus mainly used to report
relative changes in viscoelasticity or frequency dependencies. MTC measurements depend
critically on the nature of bead-cell attachment (140), which can be controlled by coating the
beads with specific receptors. In this way, MTC can be used to mechanically probe specific cell
components. For instance, coating beads with integrin receptors will lead to the formation of
focal adhesions and a direct probing of the cytoskeleton, while coating them with acetylated low-
density lipoprotein (acLDL) will lead to a bead-membrane adhesion and much lower values of
A B
C
A B
C
Fig. 1.12 Magnetic twisting cytometry. (A) F-actin immunostaining in a smooth muscle cell with an attached microbead (arrow) coated with integrin receptors. (B) SEM micrograph of a microbead attached to the surface of a smooth muscle cell. (C) Measuring technique. A twisting magnetic field applies a torque to the microbeads, causing a displacement which is then recorded. Adapted from (15).
34

1.3 Cell mechanics of adherent cells.
G* (141).
Deformable substrates
The first attempts to assess cell contractility were done by culturing cells on substrates flexible
enough so that cell traction forces could deform them. The deformation of these substrates,
which could be composed of plasma clots (142) or PDMS (143; 144), could then be observed as
wrinkles (Fig. 1.13A). This approach, however, was far from quantitative. To overcome this
problem, a technique named traction force microscopy was developed. In this approach, cells are
still cultured on deformable substrates, which are however not soft enough for wrinkle formation.
Instead, the small substrate deformations produced are measured by marking the substrate
surface with fluorescent microbeads (17; 121; 145), (Fig. 1.13B) or with micropatterned motifs
(146), (Fig. 1.13C) and then tracking their movement. If the Young’s modulus of the deformable
substrate is known, a map of the forces exerted by cells can be obtained after tracking the
movement of the markers.
Microfabricated cantilevers
Cell traction forces have also been measured with microfabricated cantilevers ((Fig. 1.13D).
Initially, cantilevers were fabricated in silicon and placed horizontally on the cell substrate (147).
As cells moved over the cantilevers, it was possible to measure traction forces by measuring the
cantilever displacement they caused. This technique, however, required expensive silicon
microfabrication technology, and did not provide a map of traction forces but a single force
measurement for each cell. Microfabricated post-array detectors (mPADs) (124; 148) supposed a
Fig. 1.13 Techniques for the measurement of cell contractility. (A) A fibroblast wrinkling a deformable substrate. (B) A fibroblast migrating on a gel with embedded fluorescent microbeads (traction microscopy). Arrow indicates direction. (C) Fibroblast growing on a traction microscopy assay with micropatterned motifs as markers. (D) Fibroblast moving over a horizontal cantilever. (E) Smooth muscle cell distorting an mPAD detector. Reproduced from (7).
35

Chapter 1 Introduction
significant improvement of the technique. mPADs are arrays of vertical cylindrical posts
microfabricated in PDMS with soft lithography techniques. In a typical array, posts are 1-3 µm
in diameter and 5-10 µm in height, with a spacing between posts of 2-10 µm. When cells are
cultured on the arrays, they adhere to the top of the posts (previously functionalized with
fibronectin). As cells exert traction forces, they bend the posts proportionally to their bending
constant, which depends on the Young’s modulus of the PDMS and the post dimensions (Fig.
1.13E). If these parameters are known, the force exerted on each individual post can be
calculated simply by measuring its deflection. This approach has some advantages with respect
to traction microscopy. First, unlike in traction microscopy, where deformations at each point are
a function of the forces exerted by the cell in all of its substrate, the bending of each individual
post is independent from that of neighboring posts. That makes calculations of exerted forces
much more straight forward. Second, forces can be calculated in real time. Finally, the bending
stiffness of posts can be controlled individually, allowing for a precise micrometric tuning of
substrate stiffness. However, the resolution of mPADs is limited by the lateral instability of the
posts. Indeed, if the posts are too thin, too high, or too close together, they can adhere to each
other or to the substrate (13; 149). This limitation of micropost arrays is dealt with in extension
in Chapter 6.
1.3.5 The cell tensegrity model
Of all the models attempting to describe cellular mechanics, the different versions of tensed
cable or tensegrity models (128) are the only ones specifically accounting for the non-cortical
cytoskeletal network. Indeed, while SGR does not consider any subcellular structure, and liquid
droplet models only take into account the cortical submembraneous cytoskeleton, tensegrity
models separately deal with stress fibers and microtubules that extend throughout the cytoplasm.
Stress fibers are modeled as tensile elements (cables) carrying tension. This tension is then
balanced by the ECM, attachment to other cells, and microtubules, which are viewed as
compressive struts (Fig. 1.14).
36

1.3 Cell mechanics of adherent cells.
The tensegrity model predicts some experimentally observed cell mechanical behaviors. First,
the tensegrity hypothesis implies that mechanical loads are carried by a discrete network of
filaments and not by the cortical cytoskeleton. This is consistent with the fact that MTC
mechanical measurements depend critically on microbead coating, and therefore on the
formation of focal adhesions and the associated actin filaments around the attached bead (140).
Additionally, a mechanical connection through actin microfilaments between focal adhesions
and different cell elements (such as the nucleus) has also been reported (43). Second, tensegrity
naturally explains cell contractility, and also predicts the observed coupling between prestress
and stiffness (150; 151). Finally, the increase in traction forces and stiffness reported in different
cell types after microtubule disruption (37; 38) is also consistent with their role as compressive
elements. However, the reported increase was small, and other studies have observed an opposite
effect of microtubule disruption on stiffness (152-154). A recent model based on tensegrity
theory suggested that the mechanical role of microtubules could depend on the degree of
spreading (35). In any case, the relevance of the role of microtubules seems to be small, as most
of the cell prestress appears to be balanced by cell-ECM adhesion sites.
Despite their success in describing many aspects of cellular mechanical complexity, tensegrity
theories have two main limitations. At their current stage, tensegrity models do not take into
account the rapid remodeling of cytoskeletal filaments and focal adhesions (155). Additionally,
these models do not naturally predict the observed scale-free power law behavior of G*(ω) or the
frequency invariance of G’’/G’, even though a recent theoretical work suggested that tensegrity
Fig. 1.14 The cell tensegrity model. (A) Sculpture based on tensegrity structure where mechanical tension is carried by cables and compression by struts. (B) Under the tensegrity hypothesis, the tensile loads carried by actin microfilaments is compensated partially by the ECM and partially by microtubules (top). When microtubules are disrupted, the tensile load is fully balanced by the ECM (bottom). Taken from (20).
37

Chapter 1 Introduction
structures could exhibit power-law behavior for a certain frequency range (156).
1.4 Implications of substrate attachment and mechanics in cell function
Besides the regulation of mechanics discussed in section 1.3, the degree of cell-substrate
attachment (also referred to as cell shape) is an important determinant of different cell functions.
With the help of different cell patterning techniques, it has been reported that cell shape can
drive proliferation, apoptosis, and differentiation (12; 123; 157), protein expression (158),
motility (159), stem cell lineage commitment (160), and even cell division axis orientation (161).
It has been hypothesized that this regulation of the function of cells by their shape is determined
to a great extent by the cytoskeletal and mechanical changes given by cell adhesion. Indeed, the
increased mechanical tension of spread cells could be converted to biochemical signals through
different means. The force transmitted by the cell cytoskeleton could expose cryptic peptide
sequences in focal adhesion proteins (162), enhance enzyme activities (163), or activate
mechanosensitive ion channels (164). Alternatively, the cell tensegrity hypothesis provides a
framework in which cytoskeletal tension could be transmitted to many different cell elements,
which would then result in an integrated cell response (20).
In this work, I have studied the relationship between substrate attachment, mechanics and
function in two different systems relevant to the area of interest of our lab, centered on
pulmonary biomechanics. First, I have examined the mechanical changes induced by neutrophil
substrate adhesion, along with its implications. Neutrophil adhesion takes place with the
capillary endothelium in a process known as activation. Second, I have studied the relationship
between cell shape, mechanics and proliferation in lung HMVEC cells. In this section, I
introduce the processes and relevance of neutrophil activation and endothelial cell proliferation.
The two subjects, however, are treated separately in extension in Chapters 4 and 5.
38

1.4 Implications of substrate attachment and mechanics in cell function
1.4.1 Neutrophil activation
The process of neutrophil activation
Neutrophils compose ~ 80% of the number of white blood cells or leukocytes in humans. These
cells circulate passively in the bloodstream until they undergo the process of activation, by which
they contribute to the body’s immune response to inflammation or infection. Neutrophil
activation is characterized by the adhesion between the neutrophil and the endothelium (also
known as firm adhesion), and is accompanied by marked changes in cell shape, protein
expression, and cytoskeletal structure (Fig. 1.15). While passive neutrophils have a spherical
shape and a cortical non-polar F-actin distribution, activated neutrophils show very different
characteristics. Due to the expression of integrins and immobilized chemokines on the surface of
endothelial cells (characteristic of inflammatory processes), adhered neutrophils polarize and
extend an F-actin-rich lamellipodium (leading edge) and a uropod (trailing edge) where the
microtubule and intermediate filament networks are located (16), (Fig. 1.15). In this process of
polarization, the uropod also exposes a set of adhesion molecules, such as intercellular adhesion
molecules (ICAMs), CD43, CD44, P-selectin glycoprotein ligand-1 (PSGL1) or CD95 (165).
Once neutrophils are polarized, they migrate through the endothelium until they reach an
endothelial cell junction, where they extravasate into the target organ (16).
Fig. 1.15 Neutrophil polarization in activation. Once activated and adhered to the endothelium, neutrophils develop a broad lamellipodium or leading edge with an accumulation of F-actin. Proteins related to actin polymerization (such as the rho GTPases RhoA, Rac1 and CDC42) also localize in the lamellipodium. The traling edge or uropod shows clustering of adhesion molecules (such as PSGL1 Or ICAMs) and a higher concentration of microtubules and intermediate filaments. Reproduced from (16).
39

Chapter 1 Introduction
In large blood vessels, firm adhesion is preceded by the process of rolling (Fig. 1.16) (166), in
which circulating neutrophils transiently adhere to the endothelium through the selectin family of
adhesion molecules. This transient adhesion causes the cells to roll along the endothelium until
they are slowed down enough for firm adhesion (which is mainly mediated by integrins) to occur.
In pulmonary microcapillaries, however, rolling may not be necessary. While the diameter of
neutrophils is of ~ 6-8 µm, that of pulmonary microcapillaries ranges from 2 to 15 µm (167).
This implies that neutrophils must often deform as they cross the microcapillaries. This process
of deformation might be sufficient to slow neutrophils enough for firm adhesion to occur (167).
Mechanical effects of activation
The major cytoskeletal rearrangements that take place during activation have important effects
on the viscoelasticity of neutrophils. Neutrophil activation in vitro has been induced either by
exposing cells to chemoattractants such as formyl-Met-Leu-Phe (fMLP) (54), by adhering the
neutrophils to a monolayer of endothelial cells (168), or simply by adhering cells to glass (46).
Using these approaches, and measuring cell viscoelasticity with MTC (28; 168), cell poker (a
precursor of AFM) (54) and micropipette aspiration (66), it was found that activation stiffens
cells up to 7-fold. Interestingly, results obtained by tracking the motion of endogenous granules
(72) showed a decrease in stiffness of the neutrophil cytoplasm after mechanical activation
caused by the large deformation of cells into 3 µm pores. However, it is not clear to what extent
mechanical stimulation resembles neutrophil activation through adhesion or exposure to
Fig. 1.16 The process of neutrophil arrest and extravasation. In large blood vessels, neutrophils initially adhere through selectins and roll along the endothelium (left). Firm adhesion then takes place mainly through ICAMs (center). Finally, neutrophils migrate and extravasate between endothelial cells (right). In microcapillaries, the initial process of rolling does not take place. Reproduced from (16).
40

1.4 Implications of substrate attachment and mechanics in cell function
chemoattractants. Additionally, as discussed in section 1.2.3, computations of stiffness done by
tracking the spontaneous motions of cell particles is controversial due to the inapplicability of
the fluctuation-dissipation theorem to living cells.
While activation seems to stiffen neutrophils, its effect on viscoelasticity (G*(ω)) are less clear.
To begin with, opposing models have been proposed to describe neutrophil rheology. Most
studies dealing with this subject have modelled neutrophils as Newtonian (8; 63; 64) or Maxwell
(19; 65) liquids or as standard viscoelastic (Kelvin) bodies (22; 66). With this type of approach,
neutrophil activation has been modeled for instance as an increase in the viscosity of the dashpot
present in the Kelvin model (66), or as an increase of both the dashpot and the spring present in
the Maxwell model (169). Recent studies (15; 46) found a power-law structural damping
behavior of G*(ω) in neutrophils. However, these studies were restricted to activated cells, and
so it remains unclear whether power-law behavior is a general feature of neutrophil rheology or
characteristic only of adhered activated cells.
Implications in the immune response in the pulmonary capillary circulation
As mentioned earlier, the process of neutrophil adhesion to the endothelium and subsequent
extravasation into the damaged tissue in pulmonary microcapillaries is not dependent on rolling,
but on neutrophil deformation (167). As neutrophils deform when entering microcapillaries,
their speed is reduced, making thus firm adhesion to the endothelium possible. This process is
critically dependent on neutrophil stiffness: stiffer neutrophils necessarily deform slower,
enhancing thus the likelihood of neutrophil arrest and extravasation (54). The regulation of
neutrophil stiffness during activation is thus a key parameter to modulate the immune response
in microcapillaries.
The viscoelasticity of neutrophils could also be a determinant of their immune response. Passage
of neutrophils from arterioles to venules lasts from 1 second to over 20 minutes (170), a range
probably given by the different times needed to deform into differently sized capillaries.
Considering that neutrophils must cross from 40 to 100 capillaries when crossing from arterioles
to venules (167), the time scale of neutrophil deformation into individual capillaries might range
from milliseconds to minutes. To properly understand neutrophil entry into capillaries and
subsequent arrest, it is thus crucial to characterize neutrophil rheology for the wide range of time
scales or frequencies involved. This implies establishing which model (liquid droplet or
structural damping) best reproduces G* of neutrophils, both as a function of frequency and
41

Chapter 1 Introduction
activation.
1.4.2 Endothelial cell proliferation
The relevance of endothelial cell proliferation
Endothelial cells interconnect to form the blood vessels responsible for blood transport and tissue
perfusion. New blood vessels are formed by two different processes. The endothelial cells
composing the newly formed blood vessel can be formed from precursor cell types
(vasculogenesis) or from proliferating endothelial cells (angiogenesis) (171; 172). In normal
adult mammals, angiogenesis is the only one of the two processes that takes place. The
vasculature of healthy adult individuals is nevertheless generally quiescent, except in processes
related to female pregnancy (173). Angiogenesis thus generally takes place in pathological
situations, such as in alveolo-capillary barrier repair, wound healing in general, or tumor
formation. Indeed, angiogenesis was actually long acknowledged to be key to tumor growth.
Tumors without an appropriate vascularization cease growth (174) or become apoptotic (175;
176). Understanding how angiogenesis is triggered is thus of fundamental relevance to cancer
research. However, the mechanisms regulating whether a particular endothelial cell remains
quiescent or proliferates are very complex, as exemplified by the fact that neighboring regions of
the endothelium can simultaneously exhibit very different behaviors (177). This observation
shows that endothelial cell growth control is not merely controlled by angiogenic soluble factors,
but is also dependent on structural cues given by the microenvironment.
Role of adhesion and shape
One of the earliest demonstrations that endothelial cell proliferation depends not only on soluble
growth factors but also on their physical microenvironment came from the work of Folkman and
Moscona (107). By controlling the degree of cell spreading through coating culture plates with
poly(HEMA) (see section 1.3.2), Folkman and Moscona observed that endothelial cell spreading
was tightly coupled to DNA synthesis and cell growth. This led them to hypothesize that the
level of cell-ECM binding somehow controls proliferation rates. Controlling cell spreading
through coating with poly(HEMA), however, does not directly regulate the degree of cell-ECM
attachment or of integrin ligation. The experiment of Folkman and Moscona could thus not
42

1.4 Implications of substrate attachment and mechanics in cell function
discriminate between the effects on proliferation of cell shape per se and of ECM binding. To
solve this problem, Chen and co-workers (12) plated endothelial cells on micropatterned islands
of fibronectin of defined shape, observing the same correlation between spreading and
proliferation. This allowed proving that cell spreading had an effect even if the density of ECM
ligands on the substrate was kept constant. However, cells growing on larger micropatterned
islands still had more integrin ligation than those growing on small micropatterns, given their
larger cell-substrate contact area. To rule out this factor, Chen and co-workers grew cells not on
one single island, but over several small circular patterns of different size and spacing (Fig. 1.17).
In this way, cell-ECM contact area (and thus the degree of cell-ECM binding) could be
controlled independently of cell spreading (cell projected area). Even if cell-ECM contact area
was kept constant, cell spreading was observed to correlate with proliferation. Therefore, cell
spreading per se is able to control growth in endothelial cells independently of the biochemical
signaling given by soluble growth factors or integrins, indicating that some biophysical
parameter associated with cell shape is an important regulator of cell function. Later work
showed that, while little spreading promotes apoptosis and high spreading promotes proliferation,
intermediate levels induce differentiation (157). Additionally, the control of proliferation by cell
shape is probably a general feature of adherent cells, as similar behavior has been observed in
hepathocytes (123), osteoblasts (158), and fibroblasts (107).
A C
B
A C
B
Fig. 1.17 Cell proliferation depends on cell spreading independently of cell-ECM contact area. (A) Micropattern types used to control endothelial cell spreading and cell-ECM contact area. (B) Examples of cells growing on these micropatterns. (C) Plots of cell spreading (black bars, top), cell-ECM contact area (gray bars, top), cell growth (middle), and apoptosis (bottom) for different types of micropatterns. Even though cell-ECM contact area remains approximately constant (gray bars), cell growth (proliferation) increases with spreading. Adapted from (12).
43

Chapter 1 Introduction
Possible role of cell mechanics
The most widely accepted hypothesis regarding the control of proliferation (and cell function in
general) by cell spreading or shape is that it is mediated by cell mechanics. Several lines of
evidence point in this direction. First, I have already discussed in section 1.3.3 that cell spreading
is associated with an increase in mechanical tension and stiffness. Spreading, tension, and
proliferation seem thus to be associated, clearly suggesting a link. Additionally and in
endothelial cells, the disruption of cytoskeletal elements bearing mechanical tension has been
shown to reduce proliferation (178), while patterns of proliferation within sheets of cells have
been observed to be determined by the underlying cell mechanical tension (179).
The hypothesis that proliferation is driven by mechanical tension has been used to propose an
explanation for the local control of endothelial cell proliferation observed in angiogenesis (Fig.
1.18) (20). Accelerated turnover of the ECM, which is present for example at the tips of newly
formed capillaries (180), could reduce the thickness of the basal membrane underlying the
endothelium. This would reduce the stiffness of the membrane, which would no longer be able to
balance the contractility of the cells. The mechanical prestress of individual endothelial cells
would then transmit to neighboring cells (instead of the membrane). This would then increase
cytoskeletal tension of these neighboring cells, and possibly trigger cell cycle progression.
Through this mechanism, local differences in basal membrane thickness could drive the
Fig. 1.18 Possible mechanism for the mechanical control of angiogenesis. (Top) Due to a thinner basement membrane (depicted in green), mechanical tension in underlying cells (depicted in red) increases, promoting proliferation and triggering angiogenesis. (Bottom) The reiteration of this process could lead to the generation of a branching capillary network. Reproduced from (20).
44

1.4 Implications of substrate attachment and mechanics in cell function
formation of new blood vessels.
The mechanism by which mechanical tension could drive proliferation, however, is at present
unclear. It has been suggested that mechanical growth control could be exerted through the force
activation of integrins (20). Additionally, mechanical tension is closely related to the Rho family
of GTPases, which have been reported to be closely related to G1-S phase transition (181; 182).
However, overexpression of myosin light chain (MLC) kinase in fibroblasts resulted in increased
stiffness but decreased proliferation (183), suggesting that the link between mechanics and
proliferation might not be as direct as previously believed.
45


Chapter 2 Aims of the thesis
2.1 General aim
The general aim of this thesis was to study the role of substrate attachment in cell mechanics,
and to analyze its implications in neutrophils and endothelial cells.
2.2 Specific aims
1. To study with AFM how the rheology of neutrophils is affected by their attachment to
glass substrates and their subsequent activation, and to analyze the implications of
neutrophil rheology in neutrophil transit, arrest and transmigration in vascular
microcirculation.
2. To analyze with AFM how cell-substrate attachment and the resulting cell shape affect
the mechanical properties of human microvascular endothelial cells, and to assess the role
of cell mechanics in determining proliferation.
3. To establish design rules to ensure the proper operation of the mPAD detectors for the
measurement of cell traction forces.


Chapter 3 Implemented methodological techniques
Different methodological techniques were employed to conduct the experimental measurements
reported in this thesis. Among them, AFM was used to probe cell mechanical properties
(Chapters 4 and 5). FIB technology was employed to generate topographical micropatterns in
silicon substrates, which were later used to fabricate the PDMS molds used in Chapter 5 for
microcontact printing and in Chapter 6 for the study of microposts. Finally, microcontact
printing technology was used to pattern cells in Chapter 5. While the AFM technology used
(both apparatus and, to a certain extent, measuring protocols) had been previously set up and
discussed in extension by former researchers in our lab (184; 185), the other two methodological
techniques were first implemented in our lab by me during this thesis. Both techniques were
developed at the Nanobioengineering lab of the Barcelona Science Park, using the state of the art
facilities of the nanotechnology platform. Given that the methodological section of each Chapter
is necessarily brief (as the Chapters correspond to a scientific manuscripts either published or in
preparation) I expand here on the use of FIB for Soft Lithography applications and on the
technique of microcontact printing applied to cell patterning. In addition, in Appendix B I
present the detailed protocol used to perform cell patterning (including master fabrication with
FIB and microcontact printing procedure).

Chapter 3 Implemented methodological techniques
3.1 Use of Focused Ion Beam technology for Soft Lithography applications
3.1.1 Introduction
The set of techniques known as Soft Lithography (described in section 1.3.2) are specially suited
to biological applications due to the characteristics of the soft polymers they use (generally
PDMS). First, PDMS is both elastic and soft (Young’s modulus ~ 2 MPa), implying that stamps
made from this material can easily establish conformal contact with many surfaces, even if they
have relatively high levels of roughness. Second, it is transparent, being thus well-suited to
optical microscopy applications. Third, it is biologically compatible. Finally, it can be
polymerized easily by mixing the prepolymer and the corresponding crosslinking agent, and then
heating the mixture. PDMS samples with a given surface pattern can then be fabricated simply
by polymerizing PDMS on an appropriate mold (which can be reused almost indefinitely).
Even though the generation of PDMS samples with a given pattern is very straight forward, the
fabrication of the necessary mold (usually referred to as master) is a different issue. In this thesis,
I generated PDMS samples in the works described in Chapters 5 and 6. In Chapter 5, I fabricated
PDMS samples with raised micrometric features, which I then used as stamps to deliver a pattern
of fibronectin to a bare Petri dish using the microcontact printing technique. In Chapter 6, I
generated PDMS microposts to study their stability. In both cases, the masters used to create
these PDMS samples were made of silicon, and the features they contained were fabricated with
FIB technology. To my knowledge, FIB had not previously been used in Soft Lithographic
applications. For this reason, I discuss here the applicability of FIB to the generation of masters
for Soft Lithography, and compare the technique to those usually employed.
3.1.2 Techniques for the generation of Masters for Soft Lithography applications
In most reported Soft Lithographic applications, the masters used have been fabricated through
photolithographic processes (186). The photolithographic fabrication of masters works as
follows (Fig. 3.1). First, a substrate of silicon or glass is coated with a thin uniform layer of
50

3.1 Use of Focused Ion Beam technology for Soft Lithography applications
photoresist material, such as poly(methyl methacrylate) or SU-8. Using a mask aligner, this
substrate is then exposed to UV light through a mask containing the desired pattern. If a positive
tone photoresist is used, exposing it to the UV radiation will alter it chemically and make it
soluble. Exposed photoresist will then be eliminated in the developing process, leaving a pattern
of raised features corresponding to the unexposed parts of the substrate. If a negative tone
photoresist is used, exposure to UV will make it insoluble, and the developing process will wash
away the unexposed parts. In either case, the final result is a substrate with raised features of the
photoresist, which can be used directly as a master to create PDMS samples.
Different methods can be used to generate the necessary masks for the photolithographic process
(187). If a high precision is required, chrome masks (composed of a thin layer of chrome
deposited on a quartz substrate) can be generated through optical or electron beam lithography.
In this technique, a layer of photoresist is spun onto the chrome, and exposed to a directed beam
of photons or electrons. After developing the photoresist, the chrome in the exposed areas can be
removed with an acid etch. Chrome masks obtained with optical lithography can have a sub-
micrometric resolution, while those obtained with electron beam lithography can have features
smaller than 50 nm. However, electron beam generation of chrome masks is a costly and lengthy
process. If the required resolution is above 10 µm, masks can be generated simply by printing the
desired pattern on a transparency sheet using a high resolution inkjet printer.
Although photolithography has been the technique of choice for the generation of masters for
soft lithography, some alternative techniques have been developed. In the mechanical scribing
technique (188), topographic features are milled on glass substrates with a diamond tip using a
Fig. 3.1 Scheme of the photolithographic master fabrication process. (Top) A positive tone photoresist (depicted in orange) is exposed to UV light (black arrows) through a mask (depicted in black). (Bottom) The exposed zones become soluble and are eliminated. The master is ready to be used to generate PDMS replicas.
51

Chapter 3 Implemented methodological techniques
computer numerical controlled milling machine. In acoustic micromachining (189), an acoustic
signal is used to create a pattern on a nickel substrate.
3.1.3 Focused Ion Beam Technology
Principle and application
FIB technology, which began to be developed as early as 1973 (190), consists in the targeted
delivery of ion beams to a designated substrate (Fig. 3.2). If the ions composing the beam are
sufficiently heavy and properly focused, the substrate can then be selectively etched, creating
thus the desired pattern. An FIB apparatus functions as follows (191). First, a source of liquid
metal (generally of Ga) is inserted into a needle and accelerated through the application of a
given voltage. The ions from the metal are then emitted through the tip of the needle, and
focused on the substrate using a set of electrostatic lenses. Given the low lateral and
backscattering of emitted ions, etching of features with dimensions below 30 nm can be achieved
if the beam is properly focused (192). Once the ions reach the target, they collide against the
substrate atoms, transferring their momentum. If this momentum is high enough (3.8 eV for Au
substrates and 4.7 for Si, for example), the atom will be ejected in a phenomenon termed
sputtering. If the ion beam is focused sequentially on different parts of the substrate, a pattern
can be fabricated in which the size and depth of the features can be precisely controlled by
regulating the total exposure time of each substrate region to the beam.
FIB was initially designed as a tool for the semiconductor industry. Indeed, its high resolution
and its ability to create patterns without using prefabricated masks rendered it ideal for the
Metal source
LensesIon beam
Sputtered atoms
Metal source
LensesIon beam
Sputtered atoms
Fig. 3.2. Depiction of an FIB apparatus while milling a substrate
52

3.1 Use of Focused Ion Beam technology for Soft Lithography applications
analysis and manipulation of semiconductor devices once they were already fabricated. In this
way, FIB has been regularly used for mask repairing, device modification, failure analysis and
integrated circuit debugging (192). However, the fast development of the field of micro and
nanotechnologies has brought new uses to the technique. Among others, FIB has been employed
to generate micrometric optical elements (193), to modify AFM tips (194), and to fabricate
micrometric mechanical elements such as gears (195) or lathe tools (196).
Generation of masters
Given the ability of FIB to generate topographic patterns in designated substrates, the technique
can readily be used to fabricate masters for soft lithographic applications. The process of master
fabrication with FIB consists simply in the milling of the desired patterns onto a substrate
(silicon in this work). The milled patterns will thus form lowered wells in an otherwise flat
master. Optionally and to minimize sticking between the silicon and the PDMS during molding,
the master can be silanized by exposure to a fluorosilane vapor such as (tridecafluoro-1,1,2,2-
tetrahydrooctyl)-1-trichlorosilane. Even though the fabrication process is simple, a number of
factors have to be taken into account when fabricating masters with FIB.
Redeposition
Atoms sputtered from the substrate can redeposit next to the milled areas in a phenomenon
termed redeposition. If the aspect ratio of the milled features (that is, the ratio between feature
depth and width) is low, sputtered particles can travel away from the milling region, and
sputtering is not a problem. However, if the aspect ratio is high (as when attempting to mill a
very deep cylinder), sputtered particles tend to redeposit along the walls of the feature. This
results in tilted rather than perfectly vertical walls. Examples of this phenomenon are the conical
(rather than cylindrical) posts fabricated in Chapter 6, which were however milled using a
cylindrical pattern. The walls of the features of the master fabricated in Chapter 5, however,
were perfectly vertical, as the aspect ratio was low.
Beam intensity
Beam intensity is also a crucial parameter to control. Correct adjustment of this setting will
depend on the desired pattern resolution and on available time. High intensities will mean shorter
milling times, but will result in poor lateral resolution. If the milled pattern has features of sizes
around 100-200 nm, for instance, beam intensities above 300 pA would not be advisable. If the
53

Chapter 3 Implemented methodological techniques
desired resolution is above the micron range, then probably a very high intensity (20000 pA) can
be used. Even in this case, however, the process of milling can be quite slow. At 20000 pA, I
found the speed of milling in silicon to be of ~ 8000 µm3/h. This implied that, to fabricate the
masters used in Chapter 5 (composed of ~ 30 features with sizes of ~ 1000 µm2 and depths of ~ 3
µm), an entire night of milling (13 h) was needed. The resulting patterned surface covered a total
area of ~ 700x700 µm, thus showing that FIB cannot possibly be used for the generation of large
scale patterns covering square centimeters. An additional limit to the surface area that can be
patterned with FIB comes from the limitation in the size of the field of view (1 mm2 for the FEI
Strata DB235 used in this work).
Milling process
The milling process is done by feeding the FIB software with a pixel map detailing which zones
of the substrate to mill. The dwell time will specify how much time the beam stops in each pixel,
and the number of passes will determine how many times the beam goes through all the pixels.
For a given total beam dose, reducing the dwell time (and thus increasing the number of passes)
can result in less redeposition, as part of the redeposited material can be etched away in
subsequent passes. During this work, however, this parameter (generally set to 100 ns) was not
observed to be determinant. In contrast, a parameter that was found to be crucial was the milling
order. In the pixel map given to the FIB software, it is possible to specify the sequential order in
which the beam goes over each pixel. When doing this, it is important to ensure that the FIB
beam will spend as little time as possible over zones which do not have to be patterned. Even
though the ion flux is switched off (or more accurately, deflected away) when crossing these
zones, inaccuracies in the timing of switching on and off can result in a certain etching of
unpatterned areas. If the sample to be milled is for example composed of 2 squares separated by
an unpatterned area, it is best if the beam goes over all the pixels of the first square, and then
moves on to the second. If the beam goes back an forth between the pixels of both squares (for
example drawing the bottom line of each square before moving on to the next) the space in
between the squares will be partially milled.
54

3.1 Use of Focused Ion Beam technology for Soft Lithography applications
Feature height
If the fabricated master is designed for a microcontact printing application (Fig. 3.3), the PDMS
stamp molded from the master will be used to selectively deliver a chemical ink (such as proteins)
to a designated substrate. Correctly selecting the depth of the master features (and thus the height
of the replicated features in PDMS) will be crucial to ensure a proper function of the stamp. On
the one hand, a very high aspect ratio of the PDMS structures could lead them to buckle and
collapse during stamping (197), resulting in an incorrect ink delivery. Additionally, a large
feature depth would result in very long milling times. On the other hand, a very low aspect ratio
could cause a collapse of the unpatterned space between features (roof collapse) (197; 198). This
would result in a complete rather than selective ink transfer. An aspect ratio of 0.2 has been
suggested as the minimum value needed to ensure proper stamping (199), although the precise
number depends on the exact feature sizes and shapes and on the adhesive and mechanical
properties of stamp and substrate. For the stamps fabricated in Chapter 5, an aspect ratio of 0.1
(3 µm tall features separated by 30 µm) was observed to be stable. It must also be noted that, for
cell patterning applications, a minimum separation of ~25 µm between patterns is needed to
prevent cell spreading on more than one pattern.
A
B C
A
B C
Fig. 3.3 Fabrication of masters for microcontact printing. A) Scanning electron micrograph of silicon master after milling of the features. B) Scanning electron micrograph of resulting PDMS replica. C) Interferometer three dimensional image of the PDMS replica. Feature height was of ~ 2 µm. These structures were used to test the fabrication process, but were never used in actual cell patterning experiments due to the small separation between patterns. Scale bar indicates 20 µm.
55

Chapter 3 Implemented methodological techniques
3.1.4 Conclusion
The application of FIB technology to the generation of soft lithography masters has certain
advantages over conventional photolithography techniques. First, it is a maskless technique,
implying that a pattern designed with any software package can be transferred to a silicon
substrate in one step. Importantly, this implies that the time spent from design to application can
be as short as a few days or even some hours. Additionally, it can achieve lateral resolutions of
down to a few tens of nanometers. Finally, it can readily be used to pattern features with
different depths on the same master. In terms of cell patterning applications, all these advantages
render the technique ideal to be used in combination with techniques for the study of single cells,
such as AFM. However, FIB is limited in that it can only be used to pattern areas of 1 mm2
surface area at the most. This renders the technology very unsuited to study large populations of
cells (even with AFM), and makes it incompatible with techniques such as western blotting or
polymerase chain reaction (PCR).
3.2 Microcontact printing for cell patterning
3.2.1 Introduction
The different existing techniques for the spatial patterning of cells (briefly reviewed in section
1.3.2) are powerful tools which have been applied to the study of different aspects of cell biology.
Cell patterning applications have provided information on cell-ECM interaction (12; 158), cell-
cell communication (200), cell mechanics (122), or tissue architecture (179). Among the
different patterning techniques, microcontact printing is probably the most widely used due to its
relative simplicity and the fact that it does not require expensive fabrication equipment.
Microcontact printing is characterized by the use of a stamp made of a soft elastomeric polymer
such as PDMS. This stamp, containing a micrometric relief pattern, is then used to selectively
transfer a given chemical “ink” to a given substrate. The resulting chemical patterning of the
substrate can then be used to create a surface that is only adhesive to cells in designated areas.
Different ink-substrate combinations can be used to achieve the final goal of selective cell
patterning. The first technique to be employed was the delivery of alkanethiols to gold substrates
(12), but it is also possible to directly stamp proteins onto PDMS, glass, or polystyrene (111; 201;
56

3.2 Microcontact printing for cell patterning
202). In this thesis, I conducted cell patterning by using the alkanethiol-gold and the protein-
polystyrene combinations. This last technique was the one employed to pattern cells in the work
of Chapter 5. Here, I provide a description of both techniques, and compare their applicability to
cell patterning.
3.2.2 Microcontact printing on gold surfaces
Gold substrate preparation
To properly conduct microcontact printing on gold surfaces, it is obviously important to have
adequate gold substrates. For cell biology applications, it will also generally be necessary to have
transparent substrates. This can be achieved by evaporating ~10 nm of gold onto glass slides
using an electron beam evaporator. To ensure proper bonding between the glass and the gold, an
intermediate adhesive layer of Titanium (1.5 nm) should be deposited first. While metal
evaporation is a lengthy and expensive process, it is preferable to simple gold sputtering.
Sputtering of gold on a glass substrate will leave an irregular gold coating that could easily be
removed when stamping with PDMS. Alternatively, gold coated slides can be acquired
commercially (Madison, WI, USA), although at a very high price.
Alkanethiols
Microcontact printing on gold surfaces is based in the use of alkanethiols. Alkanethiols are
chemical compounds with the structure HS-(CH2)n-X, where HS is the thiol group and X
represents a terminal functional group. When exposed to a gold surface, these compounds have
the interesting properties of establishing covalent bonds (through the thiol group) and of
naturally forming densely packed surface coatings composed of a single molecule layer known
as self-assembled monolayers (SAMs) (203). Once the SAM is formed, its high lateral packing
density results in a surface with a chemical functionality defined by the only exposed group (the
terminal group X). By adequately choosing the X group, SAMs thus allow to modify the
wettability, chemical reactivity, and adhesiveness of a given gold surface (204).
57

Chapter 3 Implemented methodological techniques
Cell patterning protocol
Due to their high hydrophobicity (caused by the large number of methyl groups they contain),
alkanethiols adsorb easily to PDMS (which is also very hydrophobic). Alkanethiols can thus
easily be stamped onto gold surfaces using PDMS stamps. In cell patterning applications, the
patterning process usually works as follows (Fig. 3.4). First, a pattern of an alkanethiol with
composition HS-(CH2)n-CH3 (with n ranging from 12 to 19) is delivered to a gold surface with a
PDMS stamp. This is done by soaking the stamp in an ethanol solution with 10 mM of the
alkanethiol for a few seconds, drying the stamp and then stamping on the gold. The higher the
number of methyl groups per molecule, the less the molecules will diffuse away from the
patterns, increasing thus the printing resolution. However, values of n above 19 will form
disordered SAMs and crystallize on the PDMS stamps (205). Then, the gold surface is exposed
to an ethanol solution with 2 mM of a thiol with composition HS-(CH2)n-(EG)m-OH. The EG
(ethylene glycol) groups (-O-CH2-CH2-) are known to resist protein and cell adsorption almost
completely from m values starting at 3 (206). In this way, an EG-terminated SAM will cover the
entire gold surface not previously stamped with the CH3 terminated thiol. While the formation of
the CH3 terminated SAM can be completed with as little as 1 minute of stamping, the EG-
terminated SAM is formed slower and requires about 12 hours of incubation at 10 ºC. Both types
of thiols are commercially available, although EG-terminated thiols have only become so lately
(Prochimia, Sopot, Poland), and are very expensive.
HS-(CH2)n-CH3
HS-(CH2)n-(EG)m
ECM protein
Au
ECM protein
Pluronic
Petri dish
PDMSPDMS
HS-(CH2)n-CH3
HS-(CH2)n-(EG)m
ECM protein
Au
ECM protein
Pluronic
Petri dish
PDMSPDMS
Fig. 3.4 Schemes of protocols for cell patterning on gold (left) and on polystyrene (right). (see text for details).
58

3.2 Microcontact printing for cell patterning
Once this process is completed, the functionalized gold surface is exposed to a solution
containing a saturating concentration of ECM proteins (such as fibronectin at 25 µg/ml). ECM
proteins will adsorb selectively on the CH3 functionalized regions, but not on the EG covered
parts. At this stage, the gold substrate is ready for culturing of cells, which will only attach to the
regions adsorbed with ECM protein.
3.2.3 Microcontact printing on polystyrene
The process of microcontact printing on polystyrene is simpler and involves fewer steps than that
on gold, as the ECM protein is stamped directly onto the substrate. Rather than relying on the
formation of covalent bonds between the substrate and a given molecule, this process is based on
the respective wettabilities of stamp, substrate, ink, and blocking agent.
Pluronic block copolymers
In microcontact printing on polystyrene, the blocking agent used to prevent cell adhesion to the
unpatterned areas of the substrate is a product called Pluronics (Basf, Mount Olive, NJ, USA).
Pluronic block copolymers are formed by a central chain of propylene glycol (PG) subunits
surrounded by two chains formed by EG subunits (Fig. 3.5). The central more hydrophobic PG
chain adsorbs to the substrate through hydrophobic interactions, while the two hydrophilic EG
side chains are exposed to the aqueous environment of cell culture medium, forming a layer that
prevents cell adhesion. Therefore, Pluronic copolymers require a hydrophobic substrate for
proper adsorption.
Different types of Pluronic copolymers are commercially available depending on the number of
PG and EG subunits on each chain. The protein-resistant properties of Pluronic products improve
with increasing lengths of both the PG and EG chains, with Pluronic F127 (with 98 subunits in
each EG chain and 68 subunits in its PG chain) being ideally suited (207). It must be noted that
the Pluronic products used for cell patterning applications (such as Pluronic F108 and F127) are
CH3
|
[CH2 –CH2-O]n-[CH2 –CH-O]m-[CH2 –CH2-O]n
Fig. 3.5 Chemical structure of Pluronic block copolymers.
59

Chapter 3 Implemented methodological techniques
only available in the USA. Their equivalent European version (Pluronic PE10500) is toxic to
cells and cannot be used.
Cell patterning protocol
The process of microcontact printing on polystyrene works as follows (Fig. 3.4). First, the
PDMS stamp is soaked with the ECM protein at saturating concentration (preferably fibronectin,
25 µg/ml) for at least an hour, given that the affinity between proteins and PDMS is not very
high. Then, the PDMS is used to stamp the protein directly onto a polystyrene substrate (a Petri
dish). Proteins have affinity for hydrophilic surfaces (208), so the wettability of the substrate will
have to be higher than that of PDMS for the transfer to be effective. To render the unpatterned
portion of the substrate non-adhesive to cells, the polystyrene substrate is then immersed in a
solution of 1% Pluronics F127 in phosphate buffer saline (PBS) for one hour. Once this step is
completed, cells can be plated directly on the Petri dish.
Wettability control
To ensure proper protein and cell patterning onto polystyrene, two opposing requirements must
be met: the polystyrene substrate must be hydrophilic enough to permit the stamping of the
protein, but hydrophobic enough to allow the adsorption of Pluronic. This requirement is only
fulfilled for an intermediate range of wettabilities (111). While untreated polystyrene is within
this range, the polystyrene employed in common Petri dishes used in tissue culture is plasma-
treated, more hydrophilic, and not suited to this technique (111). Petri dishes designed for the
culture of bacteria (sometimes referred to as bacteriological Petri dishes) are not plasma-treated
and are appropriate for use with this technique.
Depending on the substrate used, transfer of protein from the PDMS stamp to the substrate can
be optimized by making the stamp more hydrophobic. This can be achieved by silanizing the
stamp overnight with (tridecafluoro-1,1,2,2, tetrahydrooctyl)-1-trichlorosilane after a 1 minute
exposure to an oxygen plasma.
3.2.4 Conclusion
Cell micropatterning on gold substrates has two main disadvantages with respect to polystyrene.
60

3.2 Microcontact printing for cell patterning
First, the materials used (such as EG-terminated alkanethiols or gold coated glass slides) are
either hard to synthesize/fabricate or expensive to buy. Second, the process involves more steps
and is more time-consuming. For this reason, it will be generally recommendable to use the
polystyrene technique in most applications. However, some microscopy applications (such as
differential interference contrast or total internal reflection fluorescence) require a glass substrate
for proper operation. For this reason, cell micropatterning on gold substrates with alkanethiols
remains a useful and viable option.
61


Chapter 4 Rheology of passive and adhesion-activated neutrophils probed
by Atomic Force Microscopy
4.1 Abstract
The rheology of neutrophils in their passive and activated states plays a key role in determining
their function in response to inflammatory stimuli. AFM was used to study neutrophil rheology
by measuring the complex shear modulus G*(ω) of passive non adhered rat neutrophils on
poly(HEMA) and neutrophils activated through adhesion to glass. G*(ω) was measured over 3
frequency decades (0.1 – 102.4 Hz) by indenting the cells 500 nm with a spherical tip and then
applying a 50 nm amplitude multifrequency signal. G*(ω) of both passive and adhered
neutrophils increased as a power law with frequency, with a coupling between elastic (G’) and
loss (G’’) moduli. For passive neutrophils at 1.6 Hz, G’ = 380 ± 121 Pa, while G’’ was 4-fold
smaller and the power law coefficient was of x = 1.184. Adhered neutrophils were over 2-fold
stiffer with a lower slope (x = 1.148). This behavior was adequately described by the power law
structural damping model but not by liquid droplet and Kelvin models. The increase in stiffness
with frequency may modulate neutrophil transit, arrest and transmigration in vascular
microcirculation.
4.2 Introduction
The mechanical properties of leukocytes, and neutrophils in particular, and the changes they
suffer during activation play a key role in determining their function in response to inflammatory

Chapter 4 Rheology of passive and adhesion-activated neutrophils probed by AFM
stimuli (16; 167). Pulmonary microcapillaries, with diameters that can be smaller than those of
neutrophils (209), induce retention of neutrophils (54). This retention, which increases the
probability of transendothelial migration (167), is probably due to the process of deformation
that neutrophils undergo when entering microcapillaries, which is dependent on neutrophil
mechanical properties. Indeed, the retention of neutrophils in microcapillaries is known to
increase with neutrophil stiffness (54). Additionally, the stiffness of leukocytes could also
regulate their adhesion to the endothelium in larger blood vessels by modulating the contact area
between leukocytes and the endothelium (57; 210; 211). Neutrophil deformation and recovery
during microvascular transit are dynamic processes involving a wide range of time scales.
Therefore, apart from a characterization of stiffness, knowledge of neutrophil rheology as a
function of activation and for a broad range of frequencies or time scales is necessary to better
understand the pathophysiological implications of neutrophil mechanics. However, existing
techniques measuring neutrophil rheology present limitations in controlling the activation state
of neutrophils, in unambiguously determining their complex shear modulus G*(ω), or in
providing measurements at a range of frequencies wide enough for an adequate characterization.
G*(ω) defines the mechanical constitutive equation of the cell and provides knowledge of the
cell stress-strain response in a model independent manner. The limitations of existing techniques
have led to contradictory descriptions of the rheology of passive neutrophils and its changes with
activation.
Leukocyte rheology has been studied extensively through the micropipette aspiration technique
(8; 19; 22; 64). This technique consists generally in the aspiration of a leukocyte with a
micropipette having a diameter smaller than that of the leukocyte, which causes the cell to
extend a protrusion into the micropipette. The evolution of this protrusion is then recorded
through the acquisition of optical microscopy images as a function of time, aspiration pressure,
and micropipette radius. The observed resistance of leukocyte protrusions to enter micropipettes
and the subsequent resistance to flow were interpreted through different viscoelastic mechanical
models. These models, which were characterized by one or two time constants, described
leukocytes as either an elastic cortex enclosing a Newtonian (8; 63; 64) or Maxwell (19; 65)
liquid or as standard viscoelastic (Kelvin) bodies (22; 66). However, micropipette aspiration
experiments present several limitations. First, the high levels of deformation involved might alter
the state of the leukocyte. Indeed, leukocytes have been observed to activate and modify their
mechanical properties when forced to enter narrow channels (212). Second, the considerable
deformation and the complicated contact geometry present in experiments require complex
64

4.2 Introduction
calculations to obtain leukocyte mechanical parameters. This results in calculated mechanical
parameters which generally depend on the assumed leukocyte mechanical model, and do not
provide a direct estimation of G*(ω). Finally, the range of time scales or frequencies observable
in micropipette aspiration tests is reduced due to the limitations given by image acquisition rate
(high frequency limitation) and by the time it takes for leukocyte protrusions to extend fully (low
frequency limitation).
The limitation in frequency range has been overcome by rheological measurements on
neutrophils made with MTC, a technique which probes cell mechanical properties by binding
magnetic microbeads (~5 µm in diameter) to the cell membrane with specific cytoskeletal
receptors, oscillating the beads horizontally with an external magnetic field, and measuring the
resulting bead displacement. By calculating an apparent complex modulus g*(ω) (defined as the
ratio between applied torque and bead displacement) over 4 frequency decades (0.1 – 1000 Hz)
with MTC, Fabry and co-workers (28) observed a scale free behavior with frequency. These
results were analyzed with a power law structural damping model and interpreted through the
theory of SGR (92). SGR explains this behavior as a scale free relaxation of the structural
elements of the cells, and characterizes modifications in the cell mechanical state as changes in
the power law exponent. However, MTC also presents limitations. In MTC, cells must be firmly
adhered to a substrate to ensure that the stresses applied by the beads deform the cytoskeleton
locally and do not move the cell as a whole. However, neutrophil adhesion (which in MTC takes
place both with substrate and bead) is known to change the activation state of neutrophils (213),
as well as their mechanical properties (54). Passive neutrophils thus cannot readily be probed
with existing MTC techniques. Moreover, obtaining the magnitude of G*(ω) from the value of
g*(ω) measured with MTC requires knowledge of the degree of microbead embedding, which is
difficult to determine.
AFM may overcome most of the limitations of the above techniques for probing neutrophil
rheology. AFM can obtain G*(ω) of single cells by applying oscillatory indentations to the cell
with a microtip attached to a cantilever of a known bending constant, and then measuring the
resulting force (62). Measurements can be made for oscillations spanning a range of three
frequency decades. Moreover, neutrophils can be maintained in a passive state by plating them
on substrates rendered almost non-adhesive through coating with poly(HEMA) (107), and by
applying only small deformations. Finally and given the geometry of measurements, the use of
microspheres as cantilever tips allows the application of the simple 2-sphere Hertz contact
equation, which has few assumptions and provides a direct estimation of G*(ω). The use of
65
Chapter 4 Rheology of passive and adhesion-activated neutrophils probed by AFM
microspheres with sizes comparable to that of neutrophils also provides a measurement at the
whole cell level, which is the length scale of neutrophil dynamics during microvascular
circulation.
The aim of this work was thus to measure G*(ω) for passive and activated rat neutrophils with
AFM over a broad frequency range. For this purpose, neutrophils were isolated from Sprague-
Dawley rats and seeded onto glass slides with a part coated with poly(HEMA), where cells
remain almost non adhered and are thus prevented from activating, and another uncoated part
where cells firmly adhere and activate. G*(ω) was measured by indenting the neutrophils with
spherical AFM tips and then applying a multifrequency signal of 50 nm amplitude with 6
sinusoidal components of frequencies ranging from 0.1 to 102.4 Hz. The effect of cytoskeletal
structure in neutrophil rheology was assessed by disrupting the F-actin cytoskeleton with
cytochalasin D. Cell rheological behavior was interpreted by means of the Kelvin body model
and the power law structural damping model.
4.3 Methods
4.3.1 Isolation of rat neutrophils
Neutrophils were isolated from male Sprague-Dawley rats (Charles River, Wilmington, MA)
following a three-step gradient (1.083mg/ml / 1.119mg/ml) technique (214). All products used in
the process were obtained from Sigma (Sigma, St. Louis, MO) unless otherwise stated. First, rats
were anesthetized with pentobarbital sodium (Laboratorios Normon, Madrid, Spain). The blood
of the animal was then extracted by cardiac puncture and anticoagulated with sodium citrate 1:9.
Next, 7 ml of blood were left to sediment in a solution containing 2/3 (v/v) 3% dextran (0,9%
saline solution) for 30 minutes at room temperature. The buffy coat was then collected and
layered on 3 ml of Histopaque 1.083 and 3 ml of Histopaque 1.119 in a Falcon tube, which was
centrifuged for 35 min at 380×g and 4ºC. The solution present at the interphase between the two
Histopaque solutions was then collected, resuspended in 10 ml NH4Cl 0.83% (w/v) (lysis
solution, pH 7.4) for 5 min, and centrifuged again for 10 min at 330×g and 4ºC. Finally, the
pellet obtained was suspended in PBS, centrifuged for 10 min at 330G and 4ºC, and resuspended
with Hank’s Balanced Salt Solution (HBSS). The purity of isolated neutrophils was greater than
95%.
66

4.3 Methods
4.3.2 Sample preparation
To prepare glass slides, a stamp (1 cm2 area) of PDMS (Dow Corning, Midland MI) was first
placed in conformal contact with a coverslip of 18 mm diameter. A solution (150 µl) containing
1.5 µg/ml of poly(HEMA) (Sigma) in 95% ethanol was then deposited on the coverslip, and left
to dry at 40 ºC for 3 hours. After removing the PDMS stamp, the slide showed a coated portion
(corresponding to a rim around the PDMS stamp) and an uncoated portion (corresponding to the
zone protected by the PDMS stamp). The used concentration of poly(HEMA) was high enough
to prevent neutrophil activation in contact with glass, but low enough so that cells would not
move freely, allowing thus for AFM measurements. A solution of HBSS containing from 105 to
5 ×10⁵ cells was then placed on the coverslip, incubated for 10 minutes at room temperature and
rinsed with HBSS. In cytochalasin D experiments, cells were then incubated with cytochalasin D
2 µM (Sigma) for 30 minutes prior to AFM measurements. For cell diameter measurements and
F-actin imaging, cells were plated in coverslips either completely coated with poly(HEMA) or
uncoated without using PDMS stamps.
4.3.3 AFM Measurements
G*(ω) of cells was measured with a custom built AFM attached to an inverted optical
microscope (Zeiss Axiovert S 100) by using a previously described method (Fig. 4.1) (62; 215).
Cells were probed by V-shaped Au-coated silicon nitride cantilevers (nominal spring constant of
k = 0.01 N/m) with a spherical polystyrene bead of radius rt = 2.25 µm glued at their end
(Novascan Technologies, Ames, IA). First, the spring constant of the cantilevers was calibrated
using the thermal fluctuations method (77; 78). Before measurements, the relationship between
the photodiode signal and cantilever deflection was calibrated by taking a force-displacement
curve at a bare region of the glass coverslip and measuring its slope.
67

Chapter 4 Rheology of passive and adhesion-activated neutrophils probed by AFM
At the time of measurements, the bright-field image from the microscope attached to the AFM
was used to position the spherical tip of the cantilever over the central region of a neutrophil.
Ten force-displacement (F-z) curves (where F = kd, d being cantilever deflection) were obtained
by ramping the cantilever in the vertical direction at a constant speed (2.5 µm amplitude, 1 Hz,
indentation ~1 µm) to determine the zero force offset and the contact point (Fc, zc) between the
cell and the cantilever tip. The tip was then placed at an indentation δ = (z-zc)-d of ~0.5 µm, and
a small vertical oscillation containing a multifrequency signal composed of 6 sine waves (0.1,
0.4, 1.6, 6.4, 25.6, and 102.4 Hz, 50 nm amplitude) was applied for 140 seconds. Finally, the
contact point was determined again as described to account for possible drifts. To determine the
viscous drag of the cantilever, 3 force-displacement curves (2.5 µm amplitude, 0.1 Hz, max.
indentation 1 µm) with a superimposed sinusoidal oscillation of 50 nm amplitude and 102.4 Hz
were obtained over the cell (216). AFM was also used to evaluate cell height by taking a force
curve in a bare region of the coverslip next to the cell. The difference between the contact point
between the tip and the substrate and the previously found contact point between the tip and the
cell was taken as the cell height. Neutrophils were measured sequentially from the same sample
for 1 hour, switching randomly between the poly(HEMA) coated part and the uncoated part.
Rounded neutrophils were selected on the coated portion, while spread polarized neutrophils
were selected on the uncoated portion (both morphologies represented the vast majority of
Fig. 4.1 Illustration of the measurement method. (Left) Example of a force-indentation (F-δ) curve obtained as the cantilever tip approached and contacted the cell (solid line) and then retracted (dashed line). The curve was then used to determine the contact point between tip and cell (arrow). Starting from the arrow, positive values of δ indicate indentation, whereas negative values indicate tip-cell distance. Once the contact point was determined, the cantilever was placed at an operating indentation (δ0) of ~500 nm and a multifrequency signal of 50 nm amplitude was applied. (Right) Corresponding multifrequency indentation (top) and force (bottom) signals used to calculate G*(ω).
68

4.3 Methods
neutrophils in each respective portion).
4.3.4 Data processing
G*(ω) was calculated from AFM measurements as described previously (62; 215). Briefly, the
contact point zc and the apparent Young’s modulus E were determined by least squares fitting of
the Hertzian force-indentation relationship of a spherical punch with infinite stiffness indenting
an elastic sphere (80):
( )( )( )
( )3/21/2 1/2 3/2
24
3 1 3 1cE
F R z z d R δν ν
= − − =− − 2
4E (4.1)
where ν is the Poisson ratio (assumed to be 0.5) and 1/R = 1/rt+1/rn,, with rt = 2.25 µm being the
radius of the spherical cantilever tip and rn being the average neutrophil radius. For each cell, E
and zc were taken as the average of the values determined from the force-displacement curves
obtained before and after the multifrequency oscillations. Once the contact point was determined,
force-displacement curves were also used to obtain the value predicted for E from Eq. (4.1) as a
function of indentation to evaluate whether the measurements were affected by the underlying
substrate (215). Eq. (4.1) can be approximated for oscillations around an operating indentation δ0
by taking the first term of the Taylor expansion. Expressing then Eq. (4.1) in terms of the shear
modulus G = E/2(1+ν), and converting to the frequency domain (62):
( ) ( )ωνω
δ ωδ⎛− ⎟⎜= − ⎟⎜ ⎟⎟⎜⎝1/21/2
0
( )1*
( )4F
GR
⎞⎠
0iwb (4.2)
where ω = 2πf is the angular frequency and iωb(0) is the correction for the viscous drag force
exerted by the liquid medium on the cantilever. The viscous drag factor b was calculated at
different heights from the cell surface and extrapolated to the cell surface (b(0)) by analyzing the
non-contact parts of the curves as described in (216). G*(ω) was expressed in terms of its real
and imaginary parts as G* = G’ + iG’’, with G’ and G’’ being the elastic and loss moduli
respectively.
4.3.5 Immunofluorescence and optical microscopy
To observe the organization of the F-actin cytoskeleton, cells were fixed with 4% formaldehyde
in PBS, incubated with Phalloidin–Tetramethylrhodamine (Sigma) and then visualized with a
69

Chapter 4 Rheology of passive and adhesion-activated neutrophils probed by AFM
charged coupled device (CCD) camera (ORCA-AG, Hamamatsu, Morimoto, Japan) attached to
an inverted optical microscope (Eclipse TE 2000 microscope, Nikon, Tokyo, Japan) using a 60×
objective. Sample manipulation and rinsing was done with extreme care to prevent detachment
of cells from poly(HEMA) substrates. Live cells were also visualized with phase contrast (10×)
and differential interference contrast (DIC, 60×) microscopy using the same microscope. Phase
contrast images were also used to measure mean cell diameters after visual identification.
4.3.6 Modeling
Liquid droplet and Kelvin models
In some studies, leukocytes have been modeled as a liquid droplet consisting of a cortex with
cortical tension T enclosing either a viscous Newtonian liquid (with viscosity µN) (8; 63; 64) or a
viscoelastic Maxwell liquid (represented by a spring constant kM in series with a dashpot with
viscosity µM) (19; 65). In other studies, leukocytes have been modeled as a whole as a Standard
viscoelastic or Kelvin body, with two springs kS1 and kS2 and a dashpot µS (22; 66) (Fig. 4.2). The
complex shear modulus of a Kelvin body can be expressed as (217):
( )2 2 2
*2 2 2 2 2
S S2 S S2K S1
S2 S S2 S
k kG k ik kµ ω µ ωωµ ω µ ω
= + ++ + 2 (4.3)
It is however less straight forward to fit liquid droplet models to the data, as force-indentation
data were processed considering the cell as a single body and without distinguishing between
cortex and interior. This distinction can be made by considering that the cell cortex exerts a force
on the spherical tip which is calculated as (218):
22membrane
t
TF ar
π= (4.4)
where a is the contact radius between the tip and the cell, which is related to the indentation δ as
a2 = δR for small indentations (80). Neglecting cortex thickness, the total force on the cantilever
is the sum of the forces exerted by the cortex and the cell interior:
( ) δν
=−
1/2 3/22
43 1
i
t
EF R
rπδ+ 2T R (4.5)
where Ei is the Young’s modulus of the interior of the cell. Equating Eq. (4.1) with Eq. (4.5), we
can relate E as calculated in the data processing section with the liquid droplet model parameters.
70

4.3 Methods
After expressing in terms of G, approximating around an indentation point δ0 and converting to
the frequency domain it can be seen that:
* *( ) ( )NM i TG Gω ω= + k (4.6)
where
1/ 2
0
(1 )2T
t
Rkr
π νδ
⎛ ⎞− ⎟⎜= ⎟⎜ ⎟⎜⎝ ⎠ T (4.7)
G*NM(ω) in Eq. (4.6) corresponds to the liquid droplet model prediction of the measured G*(ω)
(defined in Eq. (4.2)), which in this model should be equal to the sum of G*i(ω) (the complex
shear modulus of the cell interior) and a frequency-independent term kT given by cortical tension.
For the purposes of this study, the cortical tension present in the liquid droplet models can then
be considered as a spring in parallel to the cell interior with spring constant kT. Note that kT
depends on the specific measurement conditions, and is thus a function of δ0, rt, and rn. The
Maxwell liquid droplet model becomes thus equivalent to the Kelvin model with kS1 = kT. The
Newtonian liquid droplet model becomes a particular case of the Kelvin model with kS1 = kT and
kS2 = ∞ (Fig. 4.2). Given that the Kelvin model (with G*(ω) defined in Eq. (4.3)) comprises all
other models, it was chosen to fit the data. Eq. (4.3) was also used to estimate values of G*(ω)
Fig. 4.2 Mechanical models commonly used to interpret leukocyte rheology. The Newtonian liquid droplet model is composed of a cell cortex with cortical tension T enclosing a Maxwell liquid droplet with viscosity µN . In the Maxwell liquid droplet model, the cell cortex encloses a viscoelastic liquid (represented by a spring kM in series with a dashpot µM). In the Kelvin model, cortex and cell interior are represented as a viscoelastic body composed of a spring kS1 in parallel with a series combination of a spring kS2 and a dashpot µS. For the small indentations used in this study, the cortical tensions in parallel present in the liquid droplet models can be considered as springs (see Methods).
71

Chapter 4 Rheology of passive and adhesion-activated neutrophils probed by AFM
from previous publications reporting parameters obtained with liquid droplet or Kelvin models
from micropipette aspiration tests in leukocytes. To estimate G*(ω) from works using
Newtonian and Maxwell liquid droplet models, values of rt = 2.25 µm, δ0 = 0.5 µm, and the
mean rn obtained in this study were used to calculate kT.
Power law structural damping model
The power law structural damping model describes G*(ω) as (15):
( ) ( ) πω η µ−⎛ ⎞⎟⎜= + Γ − − +⎟⎜ ⎟⎜⎝ ⎠Φ
1*
21 2 cos ( 1)x
SGR oo
G G i x x iω (4.8)
where G0 and Φ0 are scaling factors for stiffness and frequency respectively,
is the hysteresivity or structural damping coefficient, α = x-1 is the power law exponent and iωµ
is an additional newtonian viscous term. In the model, x = 1 corresponds to a purely elastic solid ,
while x = 2 corresponds to a Newtonian liquid. This equation predicts a scale free power law
behavior of both G’ and G’’, and a coupling between them (G’’ = ηG’) at low frequencies
(where iωµ is small). It has been reported that Φ
tan(( 1) /2)xη π= −
0 can be assumed to be constant within a given
cell type, and even across cell types (28; 29; 31). We therefore took Φ0 = 2.5×10⁸ rad/s, a value
which has been shown to provide an adequate fit for many cell types, including neutrophils (15).
Eq. (4.8) was fitted independently to G*(ω) data for each cell condition (on poly(HEMA) or on
glass and with or without cytochalasin D).
Fits to the data for the Kelvin and structural damping models were done for the mean values of
G*(ω) for each cell condition. Fits were obtained by minimizing the sum of squares of the
differences between the logarithm of G*(ω) and that of the predictions of the models (Eqs. (4.3)
and (4.8)) (31). Software developed in MATLAB (Mathworks, Natick, MA) using a nonlinear
least-squares trust-region algorithm was used for fitting.
4.3.7 Statistics
Data are shown as mean ± SE for neutrophils extracted from n = 6 rats (G*(ω) of untreated cells
and cell height data) or n = 3 rats (G*(ω) of cytochalasin D treated cells and cell diameter data).
For each rat and condition, data were taken as the average of all measured neutrophils
(approximately 4 neutrophils per rat and condition for G*(ω) and cell height data and 15 for cell
diameter data). The combined effects of activation and cytochalasin D on G’ at 1.6 Hz were
72

4.4 Results
analyzed with two-way analysis of variance. Cell heights and diameters and regression
coefficient (r2) values obtained from Kelvin and structural damping fits were analyzed with
Student’s t-tests. All analyses were performed with SigmaStat software (Systat software,
Richmond, CA). Statistical significance was assumed at p < 0.05.
4.4 Results
Differences were found between neutrophils depending on whether they were allowed to adhere
to their substrate or not (Fig. 4.3). On the one hand, neutrophils on poly(HEMA) had a diameter
Fig. 4.3 Differences between neutrophils plated on poly(HEMA) and glass. (A) DIC image showing the border between the portion coated with poly(HEMA) (left) and the uncoated part (right). A neutrophil can be seen in each of the portions, with the cell on glass being larger and less rounded. (B and C) Magnified DIC image of a neutrophil on poly(HEMA) (B, left) and on glass (C, right). (D and E) Immunofluorescence images of F-actin of a neutrophil on poly(HEMA) (D, left) and glass (E, right). The leading edge with an accumulation of F-actin is clearly visible in the cell on glass, while the cell on poly(HEMA) shows a more uniform distribution of F-actin. (F) Mean cell diameter and height of neutrophils on poly(HEMA) (open bars) and glass (closed bars).
73

Chapter 4 Rheology of passive and adhesion-activated neutrophils probed by AFM
of 8.15 ± 0.33 µm, a height of 4.95 ± 0.47 µm and most showed a rounded shape. These cells did
not adhere firmly (as they could be removed from the coverslip by means of a few rinses) and
showed a mainly cortical and non-polar F-actin organization. On the other hand, neutrophils
firmly adhered to bare glass had a larger diameter (13.19 ± 0.90 µm, p<0.01), and a lower height
(3.62 ± 0.32 µm, p<0.05). The shape of neutrophils on glass was generally less rounded and
more polarized, and allowed to distinguish between a lamellipodium and a uropod (usually
referred to as leading and trailing edges). Moreover, F-actin organization was polarized on cells
plated on glass, with a clear accumulation on the lamellipodium.
Round neutrophils on poly(HEMA) had a mean value of E = 893 ± 275 Pa. The dependence of E
on indentation was evaluated for the obtained force-displacement curves (Eq. (4.1)). The results
showed that E (and thus G*(ω)) was independent of indentation around the operating point δ0 =
500 nm (Fig. 4.4). The working indentation was thus high enough to be beyond the contact zone,
where E is misestimated (215), and low enough to prevent substrate effects (which lead to an
overestimation of E (219)).
The changes observed in neutrophil morphology and cytoskeletal organization were associated
with changes in rheology. At 1.6 Hz, round neutrophils on poly(HEMA) had G’ = 380 ± 121 Pa,
while spread neutrophils on glass showed a higher mean G’ value of 909 ± 135 Pa (p < 0.05).
Fig. 4.4 Effect of cell thickness on the determination of the apparent Young’s modulus E. Plots showing the Hertz contact model calculation of E as a function of indentation for representative force-displacement curves of a very thin cell on glass (solid line, 2066 nm thickness) and a thick cell on poly(HEMA) (dashed line, 5591 nm thickness). The plateau observed for the thick cell indicates that there is no substrate effect. Substrate effects for the thin cell (observed as an increase in E as a function of indentation) only become important at indentations higher than the working indentation (~500 nm).
74
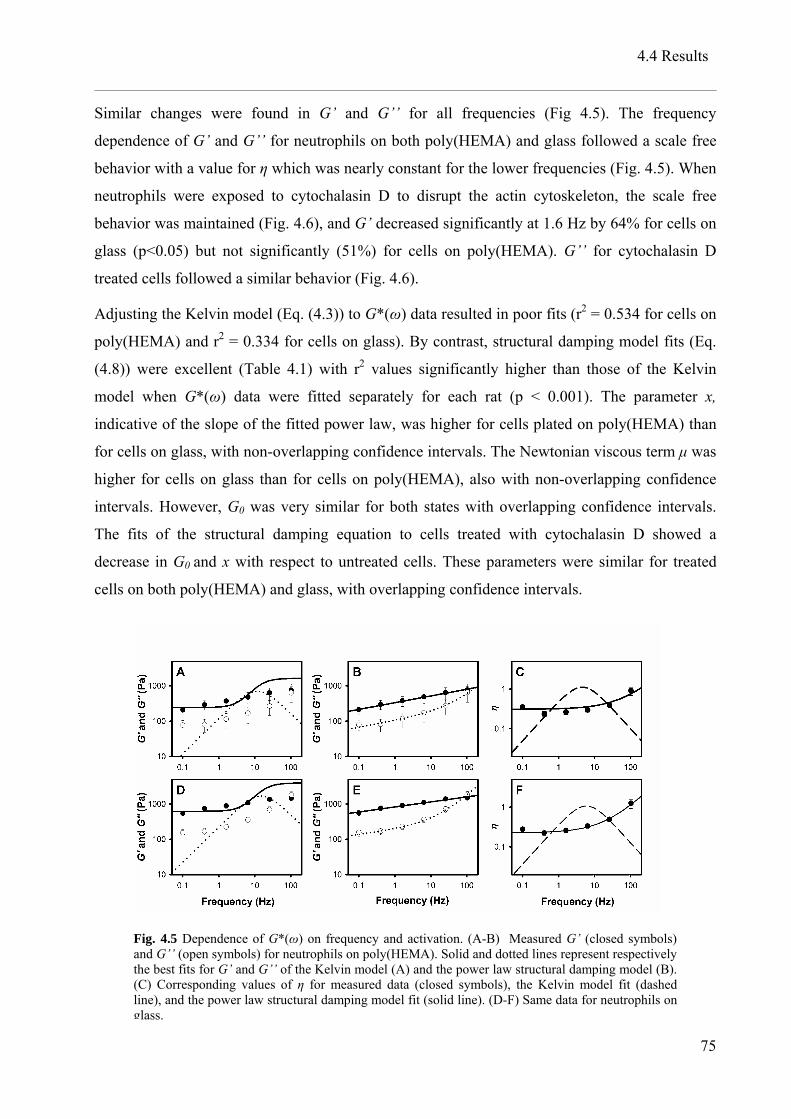
4.4 Results
Similar changes were found in G’ and G’’ for all frequencies (Fig 4.5). The frequency
dependence of G’ and G’’ for neutrophils on both poly(HEMA) and glass followed a scale free
behavior with a value for η which was nearly constant for the lower frequencies (Fig. 4.5). When
neutrophils were exposed to cytochalasin D to disrupt the actin cytoskeleton, the scale free
behavior was maintained (Fig. 4.6), and G’ decreased significantly at 1.6 Hz by 64% for cells on
glass (p<0.05) but not significantly (51%) for cells on poly(HEMA). G’’ for cytochalasin D
treated cells followed a similar behavior (Fig. 4.6).
Adjusting the Kelvin model (Eq. (4.3)) to G*(ω) data resulted in poor fits (r2 = 0.534 for cells on
poly(HEMA) and r2 = 0.334 for cells on glass). By contrast, structural damping model fits (Eq.
(4.8)) were excellent (Table 4.1) with r2 values significantly higher than those of the Kelvin
model when G*(ω) data were fitted separately for each rat (p < 0.001). The parameter x,
indicative of the slope of the fitted power law, was higher for cells plated on poly(HEMA) than
for cells on glass, with non-overlapping confidence intervals. The Newtonian viscous term µ was
higher for cells on glass than for cells on poly(HEMA), also with non-overlapping confidence
intervals. However, G0 was very similar for both states with overlapping confidence intervals.
The fits of the structural damping equation to cells treated with cytochalasin D showed a
decrease in G0 and x with respect to untreated cells. These parameters were similar for treated
cells on both poly(HEMA) and glass, with overlapping confidence intervals.
Fig. 4.5 Dependence of G*(ω) on frequency and activation. (A-B) Measured G’ (closed symbols) and G’’ (open symbols) for neutrophils on poly(HEMA). Solid and dotted lines represent respectively the best fits for G’ and G’’ of the Kelvin model (A) and the power law structural damping model (B). (C) Corresponding values of η for measured data (closed symbols), the Kelvin model fit (dashed line), and the power law structural damping model fit (solid line). (D-F) Same data for neutrophils on glass.
75

Chapter 4 Rheology of passive and adhesion-activated neutrophils probed by AFM
G*(ω) data for passive neutrophils are compared in Fig. 4.7 with values of G*(ω) predicted by
taking the liquid droplet or Kelvin model parameters reported in different micropipette aspiration
Table 4.1 Comparison of fitted structural damping parameters for the different experimental conditions used (bold font). Italic subscripts indicate the lower and upper bounds of the corresponding 95% confidence intervals.
Treatment Substrate G0 (Pa) x µ (Pa.s) r2
Poly(HEMA) 11071
7940 – 14203
1.184
1.167 – 1.201
0.616
0.461 – 0.771
0.996
No treatment Glass 13596
10389- 16802
1.148
1.134 – 1.163
2.321
1.951 – 2.690
0.991
Poly(HEMA) 2368
1752 - 2985
1.139
1.123 – 1.155
0.376
0.301 – 0.451
0.982
Cytochalasin D Glass 2785
1649 - 3921
1.112
1.092 – 1.143
0.743
0.515 – 0.971
0.978
Fig. 4.6 Dependency of G*(ω) on cytochalasin D treatment. (A-B) Measured values for neutrophils treated with cytochalasin D on poly(HEMA) of G’ and G’’ (A, closed and open symbols respectively) and η (B, closed symbols). (C-D) Same data for treated cells on glass. Plotted lines represent the best fits of the structural damping model.
76

4.5 Discussion
studies and using them in Eq. (4.3) as described in Methods. These values correspond to the
G*(ω) that the models predict for our particular measurement conditions, and are therefore
dependent on δ0, rt, and rn. The measured G’ was considerably higher than values predicted from
the micropipette aspiration studies. Moreover, the frequency dependence and values of both G’’
and η predicted from the micropipette studies were very different from the value measured in this
study.
4.5 Discussion
We used AFM to measure the complex shear modulus of rat neutrophils from 0.1 to 102.4 Hz for
passive cells and cells activated through adhesion. Rheology of both passive and adhered
neutrophils revealed a scale free behavior of G*(ω), which increased with frequency as a weak
power law and showed a coupling between elastic and loss moduli. Passive neutrophils exhibited
an elastic modulus at low frequencies of ~350 Pa with a loss modulus ~4-fold smaller and a
power law exponent of ~0.2. Adhered neutrophils were over 2-fold stiffer and had a smaller
power law exponent, indicative of a more solid-like behavior. Disruption of the actin
cytoskeleton with cytochalasin D resulted in softer but more solid-like cells. The Kelvin model
was unable to account for the scale free behavior. By contrast, the power law structural damping
model captured the most important features of neutrophil rheology.
AFM allowed us to measure G*(ω) of neutrophils with minimal cell perturbation by indenting
cells with microsphere probes attached to the cantilever end. The use of microspheres instead of
the more common pyramidal tips served different purposes. First, it minimized the slipping of
the loosely adhered neutrophils on poly(HEMA) when squeezed by the tip, which permitted us to
perform stable measurements without having to physically confine non adhered cells as done
previously (55; 81). Second, the diameter of the used microspheres (4.5 µm) is comparable to
that of neutrophils, which implied that measurements were done at the whole cell level.
Additionally, the large diameter of the microspheres allowed us to neglect the role of cortex
bending stiffness (32), thereby discarding the effects of this parameter in the interpretation of the
results with liquid droplet models. Finally, the use of microspheres allowed us to approximate
tip-cell contact with the simple Hertz contact equation between 2 spheres (cantilever tip and
neutrophil). It should however be noted that the force applied by the tip also causes a small
deformation of the neutrophil at the cell-substrate interface, resulting in a slightly underestimated
77

Chapter 4 Rheology of passive and adhesion-activated neutrophils probed by AFM
G*(ω). We modeled neutrophils as spheres with a constant diameter taken as the mean diameter
of passive neutrophils as observed with phase contrast microscopy. This option was chosen for
simplicity and because the effect of this parameter on G*(ω) computation is relatively small. In
the extreme case of considering the cells as semi-infinite planes, for example, the resulting
increase in R would only imply a 24% decrease in G*(ω) (Eq. (4.2)). With respect to the
measurement process, we used an operating indentation of ~500 nm with a superimposed
multifrequency oscillation of 50 nm amplitude. This indentation depth was high enough to
Fig. 4.7 Comparison of measured G*(ω) for neutrophils on poly(HEMA) with predictions obtained from the liquid droplet and Kelvin model parameters reported in different studies. Measured values of G’, G’’, and η (closed symbols in A, B, and C respectively) are plotted with the Newton model prediction from Evans and Yeung (8) (solid lines), the Maxwell model prediction from Dong et al. (19) (dashed lines), and the Kelvin model prediction from Sung et al. (22) (dotted lines).
78

4.5 Discussion
prevent the uncertainty in G*(ω) present near the contact point (215), but low enough to
minimize substrate effects (Fig. 4.4) and to ensure that measurements were done in the range
where the Hertz contact equation is valid (220). These last two assumptions are confirmed by the
observed plateau in E around the working indentation, even for the thinnest cells. Moreover,
earlier work showed that our range of cell thicknesses could only have had a small effect in
G*(ω) determination (219). The indentation used was also selected to be small enough to prevent
a mechanical activation of the neutrophils. Indeed, deformations of neutrophils of up to ~3 µm
(when passing through 5 µm diameter pores) have been observed not to activate neutrophils
(212). Regarding the multifrequency measurements, the oscillations applied to the cells
simultaneously provided measurements at different frequencies, minimizing the problems
associated with cantilever drifts or cell movement. No cross-talk between frequencies was noted
as concluded after observing that 99.5% of the energy of the spectral response of cells to a 0.1
Hz sinusoidal signal was contained in this same frequency (data not shown).
Cells plated on glass coverslips coated with poly(HEMA) showed important morphological and
cytoskeletal differences with respect to cells plated on uncoated coverslips. Poly(HEMA) is a
polymer coating used to prevent cell adhesion to substrates (107). However, neutrophils on
poly(HEMA) were loosely adhered to the substrate. While this weak adhesion could reflect a
small degree of activation, cells on poly(HEMA) were considered to be passive according to
their morphological and cytoskeletal characteristics (a round appearance with no visible
protrusions and a non polar F-actin distribution). On the other hand, the formation of a
lamellipodium and a uropod, as well as the accumulation of F-actin in the leading edge, (all
observed in adhered cells plated on glass) are characteristics associated with neutrophil adhesion
to the endothelium in immune responses (16). Moreover, the changes in cell spreading observed
in the two cases have also been described to occur in leukocyte adhesion to the endothelium (221;
222). Plating cells on glass seems thus to induce a neutrophil response which has elements in
common with the physiological activation of neutrophils adhered to the endothelium. We thus
took round neutrophils on poly(HEMA) and adhered neutrophils on glass as models of passive
and activated neutrophils, respectively.
To our knowledge, this study provides the first measurements of G*(ω) as a function of
frequency of passive whole neutrophils. Our results showed that G*(ω) was scale free at the
frequencies probed, and that both G’ and G’’ (and thus also cell stiffness) increased with
frequency. These findings for the frequency dependence thus extend the results found in
activated neutrophils by Fabry and co-workers (28) with MTC to passive neutrophils. The
79

Chapter 4 Rheology of passive and adhesion-activated neutrophils probed by AFM
increase in stiffness with frequency observed in this study for small deformations has also been
reported for large deformations with AFM (55). Additionally and for the low frequencies, η was
approximately constant with a value of ~0.3, which is indicative of a coupling between elastic
and loss components. These results resemble those obtained with several types of adherent cells
(15; 30; 62) and show that neutrophils and adherent cells have more similar rheological
properties than previously believed. Although no former measurements of G*(ω) for passive
neutrophils exist, our value of E estimated from F-z curves (~900 Pa) falls in the broad range of
previously reported data (200-1400 Pa) (54-57). Our study showed that G*(ω) was higher for
adhesion activated cells, which is probably due to an increase in F-actin polymerization (Fig. 4.3)
caused by activation (54). The higher G*(ω) of activated cells could also be explained by an
increase in membrane tension caused by adhesion (223). However, a high membrane tension
should have been associated with a failure of the Hertz force-indentation relationship, which was
not observed (Fig. 4.4). That the F-actin cytoskeleton regulates the observed mechanical
response to activation is also sustained by the fact that disrupting F-actin with cytochalasin D
was associated with a smaller decrease in G*(ω) in passive cells than in activated ones. Results
from former studies stimulating leukocytes either with fMLP or by adhesion to the endothelium
and using MTC (28; 168), cell poker (54) and micropipette aspiration (66) also showed an
increase in stiffness with activation. Interestingly, results obtained by tracking the motion of
endogenous granules (72) showed a decrease in stiffness of the neutrophil cytoplasm after
mechanical activation caused by the large deformation of cells into 3 µm pores. This could
reflect differences in the response of neutrophils to mechanical stimulation with respect to
activation through adhesion or fMLP, or differences in the mechanical response of the cytoplasm
with respect to that of the actin rich cortex. These two cell regions could exhibit different
mechanical properties. Indeed, values for G* of the cytoplasm of activated neutrophils reported
with optical tweezers (OT) at ~1 Hz (46) were two orders of magnitude lower than our values.
This difference, together with the small expected contribution of the nucleus to our
measurements given by the small indentations used, suggests that the global mechanical
properties of neutrophils measured in this study were dominated by the cell cortex. The
neutrophil cortex would then show viscoelastic scale free dynamics and not a purely elastic
behavior as previously considered.
The Kelvin model (Eq. (4.3)) was not able to reproduce measured G*(ω) data. We only fitted
this model and not liquid droplet models since these can be regarded as particular cases of the
Kelvin model for our experimental setup if cortex thickness is neglected (see Methods). For our
80

4.5 Discussion
comparative purposes this is a reasonable assumption as the cortex thickness is generally
considered to be of ~0.1 µm (32) and thus much smaller than the indentation depth (0.5 µm). The
Kelvin model is characterized by two plateaus for G’ at low and high frequencies, a peak in G’’
between the plateaus and no energy dissipation in frequencies away from the peak (Fig. 4.5).
None of these features were observed in our data, which resulted in a very poor fit of the model
to G*(ω) of both passive and activated neutrophils. Moreover, the magnitude and frequency
dependence of G*(ω) predicted by the liquid droplet or Kelvin parameters taken from different
micropipette aspiration tests did not agree with the measured values. Although this discrepancy
might arise from differences in cell types and species, important disagreements were also found
in η. The measured η at low frequencies for passive neutrophils was approximately constant and
of ~0.3, which is of the order of measured values in several cell types (15; 29; 62). However, the
predictions from liquid droplet and Kelvin models showed strong frequency dependence and
could be several orders of magnitude below or above measured values (Fig. 4.7). This seems to
indicate that the commonly used combinations of springs and dashpots cannot explain the
measured G*(ω). To further confirm this, G*(ω) was fitted with an expansion of the Kelvin
model in which a dashpot was added in series to kS1 to account for cortex viscoelasticity. Even
though this model has 2 time constants, the quality of the fit remained significantly poorer than
that of the structural damping fit (r2 = 0.708 for cells on poly(HEMA) and 0.583 for cells on
glass, p<0.001). Both the liquid droplet and the Kelvin models have nevertheless been used
successfully to describe leukocyte behavior in micropipette aspiration experiments. An
explanation for this apparent discrepancy is that micropipette aspiration experiments generally
measure the cell creep response (cell deformation as a function of time given a constant
aspiration pressure). The predictions for the creep function of the liquid droplet and Kelvin
models are either exponential or linear functions, which can be difficult to distinguish from a
power law behavior if the range of time scales or frequencies is limited, as is the case in most
micropipette aspiration experiments. Fitting power law data over a narrow frequency range using
models with a reduced number of springs and dashpots will provide values for the fitted
parameters with time constants of the order of the time scales of the measurement. Indeed,
calculating the time constants of the models as tc = µ/k (with µ and k being any of the springs and
dashpots in the models), the values obtained from different micropipette aspiration tests (22; 64;
65) are of the order of 100-101 s. These values agree with the time scales of most micropipette
aspiration tests. The fit of the Kelvin model to our data, on the other hand, provides time
constants of the order of 10-2 s, which reflects the scale of our wider frequency range.
81
Chapter 4 Rheology of passive and adhesion-activated neutrophils probed by AFM
The power law structural damping model (Eq. (4.8)) reproduced G*(ω) of whole neutrophils
very accurately in all cases. A power law rheology has also been reported for the neutrophil
cytoplasm. Tsai and co-workers (67) reported from high deformation micropipette aspiration
tests that cytoplasmic viscosity increased with shear rate as a power law, which is consistent with
a similar frequency dependency of cytoplasmic G’’. Recently, a power law structural damping
behavior for the cytoplasm of adherent neutrophils was observed by Yanai and co-workers after
displacing intracellular granules with OT (46). Interestingly, the value of x~1.5 obtained with OT
was remarkably higher than the figures found for whole neutrophils in this study with AFM
(x~1.15) and by Fabry and co-workers with MTC (x~1.20) (28). These differences suggest that
the cytoplasm is more liquid like than the actin rich cortex, which as we argued above is
probably the cell component that accounts for most of the mechanical response in AFM and
MTC measurements. The power law rheology observed in neutrophils with MTC has been
interpreted with the theory of SGR (15; 92). SGR features cell rheology as a scale free relaxation
of structural elements of the cell, which are bound by weak interactions and trapped in energy
wells with energies higher than thermal agitation. SGR understands the parameter x as an
effective temperature that regulates the probability of the elements of hopping between wells and
determines the cell mechanical state between an elastic solid (x = 1) and a viscous liquid (x = 2).
Interestingly, results obtained with MTC for several adherent cell types showed that the
modifications in G*(ω) produced by many different pharmacological treatments could be
modeled by adjusting only x and leaving all other parameters fixed (28; 30; 31). Consistently, the
activation-induced stiffening resulted in a decrease in x without changing G0 (Table 4.1),
supporting the idea that neutrophil rheology is similar to that of adherent cells. However, when
cytochalasin D was applied to disrupt the actin cytoskeleton the observed cell softening was
associated with a reduction in G0 and x for both passive and activated neutrophils. A decrease in
cytoplasmic stiffness not paralleled by an increase in x was previously reported by Yanai and co-
workers (46). By contrast, Fabry and co-workers (28) reported a higher x following cytochalasin
D treatment, in agreement with results obtained with adherent cell types. It should however be
noted that the fitting used by Fabry and co-workers (28) imposed a single value of G0 for all
treatments. This procedure might have resulted in an increased x caused by the decreased
stiffness rather than by the power law slope. Indeed, when we imposed a single G0 for all
treatments (and not one per treatment), the fitted x for cytochalasin D treated cells raised, even
though the quality of the fit was reduced (data not shown). Further work is needed to ascertain
the different effect of cytochalasin D on the rheology of neutrophils and adherent cells.
82

4.5 Discussion
The observed power law rheology of neutrophils could help to better understand the implications
of cell mechanics in neutrophil function in the microcapillary circulation. In the pulmonary
microcapillary circulation, neutrophils (with diameters ranging from 6 to 8 µm) must cross 40-
100 capillary segments when circulating from arterioles to venules (167). The time neutrophils
take to deform into microcapillaries that have diameters smaller than their own is determined by
neutrophil rheology (54) and is believed to regulate their adhesion to the endothelium and
subsequent migration into the damaged tissue. Passage from arterioles to venules lasts from 1
second to over 20 minutes (170). This range is probably given by the different times it takes for
neutrophils to deform into differently sized individual capillaries, which have diameters ranging
from 2 to 15 µm (167). Considering the number of segments crossed, the time scale of neutrophil
deformation in individual capillaries might span from a few milliseconds to minutes. The
understanding of the passage of neutrophils through microcapillaries thus requires knowledge of
cell mechanics for the wide range of time scales or frequencies involved. As seen in this work
for small deformations, G’ increases over 3-fold and G’’ over 10-fold when frequency is
increased from 0.1 to 100 Hz, making the cell stiffer and more viscous. Even though the
magnitude of G*(ω) might vary for high deformations, the power law behavior and the increase
in stiffness with frequency seem to be maintained (55; 67). Given that the scale free frequency
dependence is not predicted by liquid droplet or Kelvin models, simulations using these models
(169; 224) will probably only be valid at the time scale of the measurements from which the
parameters were derived. The observed power law behavior of G*(ω) could also help to explain
neutrophil dynamics in arrest and transmigration. While the initial process of deformation and
arrest takes place fast as the neutrophil hits the capillary at over 100 µm/s (225), transmigration
occurs at a slower rate. A fast deformation process implies a high stiffness, which would
facilitate neutrophil arrest at the capillary entrance and subsequent adhesion. On the other hand,
cell softening for slow deformations would smooth the progress of neutrophil transmigration.
Cell rheology might also mediate neutrophil rolling and adhesion to the vascular endothelium in
the systemic circulation. Once neutrophils establish an initial molecular bond with the
endothelium through the selectin family of adhesion proteins, shear stress in the blood vessel
exerts a torque which increases the contact area between the cell and the endothelium (211). The
adhesion strength to the endothelium (which determines whether the cell will sequester or not)
depends on this contact area, which increases with cell deformability (57; 210). The initial
adhesive contact between neutrophils and the endothelium slows down the cell and prolongs the
time scale of shear stress application. This increases cell deformation and contact area, which
83
Chapter 4 Rheology of passive and adhesion-activated neutrophils probed by AFM
could facilitate adhesion to the endothelium and vascular transmigration.
In conclusion, we used an AFM technique which readily allowed us to measure G*(ω) for
passive and activated neutrophils, for a broad frequency range, and with minimal cell
perturbation. G*(ω) increased with frequency as a weak power law. The measured neutrophil
rheology appears to be dominated by the cell cortex, which would then exhibit a power law
behavior and not a purely elastic response. The scale free dynamics conformed to the power law
structural damping model but not to liquid droplet and Kelvin models. In accordance with results
obtained on adherent cell types, the stiffening induced by activation could be modeled by simply
reducing the power law slope. However, the effect of cytoskeleton disruption with cytochalasin
D on the power law slope seems to be different in neutrophils and adherent cells. The increase in
stiffness with frequency may modulate neutrophil transit, arrest and transmigration in vascular
microcirculation.
84

Chapter 5 Role of mechanics and nuclear volume in cell shape control of proliferation in single endothelial cells.
5.1 Abstract
Although it’s well documented that spreading enhances proliferation in endothelial cells and
other cell types in culture, the biophysical mechanism by which cell shape controls cell cycle
progression remains unclear. Several lines of evidence suggest that spreading enhances
proliferation through increased cytoskeletal tension, although some findings suggest that the
transduction of other physical signals may be involved. We hypothesize that spreading promotes
proliferation by decondensing chromatin through an increase in nuclear volume. To dissect the
role of cytoskeletal tension and nuclear volume in shape control of DNA synthesis, single
endothelial cells were cultured on micropatterned adhesive islands with varying surface area,
morphology and anisotropy. DNA synthesis was determined by Bromodeoxyuridine (BrdU)
incorporation. Cytoskeletal tension was assessed by AFM. Cell and nuclear volumes were
measured by AFM and confocal imaging, respectively. We found a strong correlation between
DNA synthesis and cytoskeletal tension during isotropic spreading, which was however
surprisingly lost when cell anisotropy was modified. Unlike cytoskeletal tension, spreading
increased nuclear volume and decreased chromatin condensation prior to entry to S phase
regardless of anisotropy. Our findings support our initial hypothesis and indicate a secondary
role of cytoskeletal tension in mediating shape control of proliferation. Our data also suggest the
existence of a nuclear volume dependent G1/S checkpoint in endothelial cells. These findings
provide new insights on the biophysical control of proliferation of endothelial cells, which may

Chapter 5 Role of mechanics and nuclear volume in cell shape control of proliferation.
be relevant for our understanding of angiogenesis in normal tissue development and in tumor
growth.
5.2 Introduction
The degree of spreading of cells onto their substrate regulates a variety of cell functions in many
cell types, including proliferation, differentiation, apoptosis and protein expression (12; 107;
158). In endothelial cells, increasing levels of spreading can switch cells from an apoptotic to a
proliferative behavior even if the biochemical signaling given by growth factors or ECM ligands
is kept constant (12), indicating that cells physically sense their shape and respond accordingly.
Elucidating how proliferation is controlled by cell shape is crucial to understand processes like
stem cell differentiation (160), embryogenesis (226), or angiogenesis, an important step during
normal tissue development and tumor growth (173). However, the mechanism by which cell
shape signals to regulate proliferation is still unclear.
Several lines of evidence suggest that cell spreading enhances proliferation by increasing
mechanical cytoskeletal tension, which could feed into the cell replication machinery by
activating force-sensitive proteins such as integrins (20), or through its association with the rho
family of small GTPases (181; 182). Indeed, increases in cell spreading are associated with an
upregulation of actin polymerization (103), MLC phosphorylation (227), cell stiffness (123) and
contractility (122). Moreover, disruption of actin microfilaments or of actomyosin contractility
has been shown to inhibit endothelial cell cycle progression beyond G1 phase (178). However,
the inverse relationship found between proliferation and stiffness when studying fibroblasts
expressing a constitutively active form of MLC kinase (183) challenges the role of cytoskeletal
tension as the direct mechanism that mediates shape control of proliferation. This discrepancy
suggests that another biophysical mechanism may be involved in transmitting shape related
signals to ultimately affect cell cycle control. A good candidate is nuclear volume. Certainly,
nuclear volume and cell spreading are associated (158), nuclear structure is related to
proliferation (228), and the attainment of a certain nuclear volume has been proposed as a
checkpoint in G1-S phase transition (229). Additionally, the known mechanical connection
between the nucleus and the cytoskeleton (43) could explain the role of cytoskeletal tension in
proliferation control.
We hypothesize that spreading promotes proliferation by decondensing chromatin through an
86

5.3 Materials and methods
increase in nuclear volume. To test this hypothesis and to dissect the role of cytoskeletal tension
and nuclear volume in shape control of proliferation, we controlled the spreading, anisotropy and
morphology of individual cells through a micropatterning technique. The control of cell
anisotropy (defined as the ratio between cell length and cell width) and morphology
(characterized by the presence or absence of corners in cells) allowed us to decouple the effects
of mechanics, spreading, and nuclear volume, which are inevitably mixed if only cell spreading
is modified to control cell shape. AFM was then used to assess cell volume (through topographic
imaging) and cytoskeletal tension. Nuclear volume was examined through confocal imaging of
the nucleus, and proliferation rates were evaluated by measuring the % of cells in S phase after a
BrdU incorporation assay.
5.3 Materials and methods
5.3.1 Substrate fabrication
Micropatterned substrates containing fibronectin coated islands were fabricated using a
modification of a previously described protocol (111). First, stamps of PDMS (Sylgard 184,
Dow Corning, Midland, MI) containing raised structures with the desired shapes (Fig. 5.1) were
cast from silicon nitride substrates previously etched with FIB technology (FEI Co., Hillsboro,
OR). PDMS stamps were then silanized overnight with (tridecafluoro-1,1,2,2 tetrahydrooctyl)-1-
trichlorosilane after a 1 min exposure to an oxygen plasma, soaked in a solution containing 25
µg/ml in PBS fibronectin (Sigma, St. Louis, MO) for 1 h and placed in conformal contact with
bacteriological polystyrene Petri dishes (BD, Franklin Lakes, NJ) for 1 min. The remaining
unstamped regions of the Petri dishes were rendered nonadhesive by immersion in a PBS
solution containing 1% Pluronic F108 (Basf, Mount Olive, NJ) for 1 h.
5.3.2 Cell culture and reagents
Lung HMVEC cells (Clonetics, East Rutherford, NJ) were cultured in EGM-2MV medium (also
from Clonetics), supplemented as detailed by the manufacturer with 0.04% Hydrocortisone,
0.4% hFGF, 0.1% VEGF, 0.1% R3-IGF-1, 0.1% Ascorbic acid, 0.1% hEGF, 0.1%
gentamicin/amphotericin B, and 5% FBS (all from Clonetics). For experiments, cells were
87

Chapter 5 Role of mechanics and nuclear volume in cell shape control of proliferation.
detached from culture flasks with trypsin solution (Clonetics), plated on micropatterned Petri
dishes and probed 24h later. For measurements of cytochalasin-D treated cells, cells were
incubated for 30 min. with 1 µg/ml Cytochalasin D (Sigma) before measurements. Cells were
used between passages 3 and 11.
5.3.3 AFM measurements
The complex shear modulus (G*) of cells was measured with a custom built AFM attached to an
inverted optical microscope as described previously (62; 215). First, the spring constant k of
gold-coated cantilevers (pyramidal tip, nominal spring constant of k=0.01 nN/m, semiincluded
angle θ = 35º, Veeco, New York, NY) was calibrated using the thermal fluctuations method (77).
Fig. 5.1 Micropatterning technology and AFM as means to regulate and probe cell biophysical parameters. (A) Circular and elliptic micropatterned islands of different sizes coated with fibronectin were used to control cell spreading and anisotropy. The effect of edges was also studied by plating cells in squares and rectangles instead of circles and ellipses. (B) By scanning cells horizontally with the AFM cantilever, a topographic map of the cell can be obtained from which actin filaments can be visualized and cell volume can be measured. (C, left) By indenting the cell and applying small vertical oscillations, cell mechanics can be evaluated as follows. First, a force-indentation (F-δ) curve was obtained as the cantilever tip approached and contacted the cell (solid line) and then retracted (dashed line). The curve was then used to determine the contact point between tip and cell (arrow). Starting from the arrow, positive values of δ indicate indentation, whereas negative values indicate tip-cell distance. Once the contact point was determined, the cantilever was placed at an operating indentation (δ0) of ~500 nm and a small sinusoidal signal was applied. (C, right) Corresponding sinusoidal Force (top) and indentation (bottom) signals used to calculate G*(ω).
88
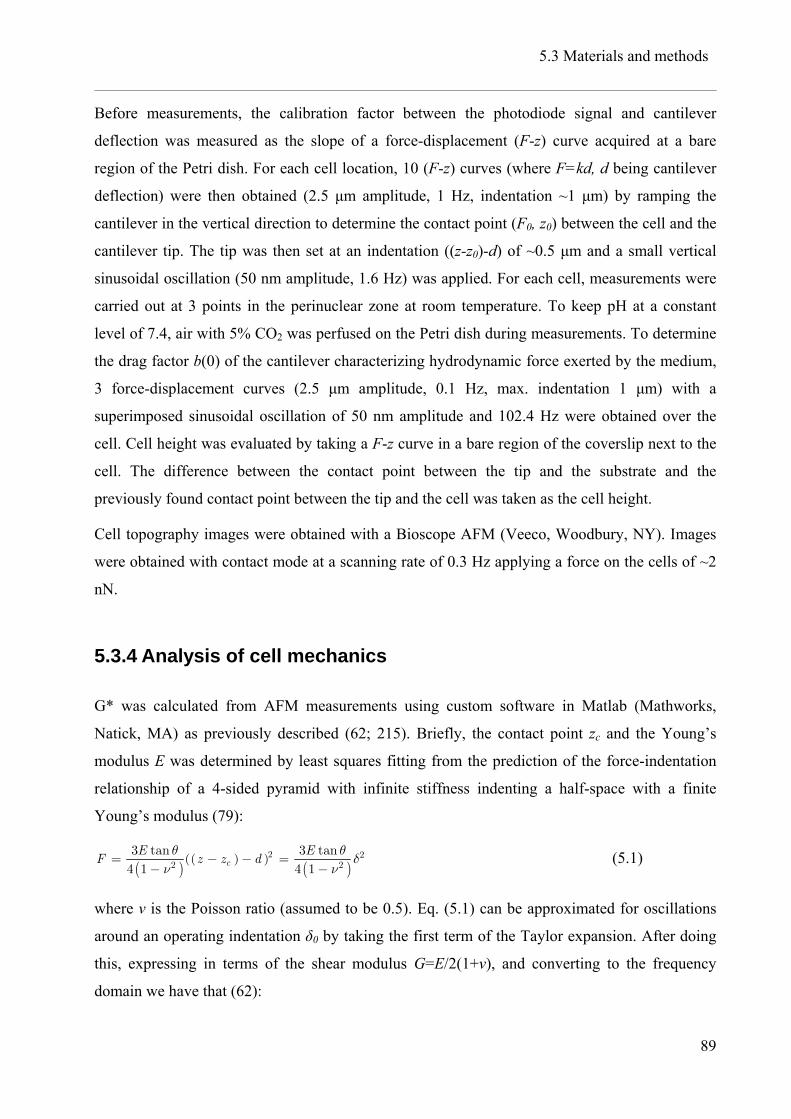
5.3 Materials and methods
Before measurements, the calibration factor between the photodiode signal and cantilever
deflection was measured as the slope of a force-displacement (F-z) curve acquired at a bare
region of the Petri dish. For each cell location, 10 (F-z) curves (where F=kd, d being cantilever
deflection) were then obtained (2.5 µm amplitude, 1 Hz, indentation ~1 µm) by ramping the
cantilever in the vertical direction to determine the contact point (F0, z0) between the cell and the
cantilever tip. The tip was then set at an indentation ((z-z0)-d) of ~0.5 µm and a small vertical
sinusoidal oscillation (50 nm amplitude, 1.6 Hz) was applied. For each cell, measurements were
carried out at 3 points in the perinuclear zone at room temperature. To keep pH at a constant
level of 7.4, air with 5% CO2 was perfused on the Petri dish during measurements. To determine
the drag factor b(0) of the cantilever characterizing hydrodynamic force exerted by the medium,
3 force-displacement curves (2.5 µm amplitude, 0.1 Hz, max. indentation 1 µm) with a
superimposed sinusoidal oscillation of 50 nm amplitude and 102.4 Hz were obtained over the
cell. Cell height was evaluated by taking a F-z curve in a bare region of the coverslip next to the
cell. The difference between the contact point between the tip and the substrate and the
previously found contact point between the tip and the cell was taken as the cell height.
Cell topography images were obtained with a Bioscope AFM (Veeco, Woodbury, NY). Images
were obtained with contact mode at a scanning rate of 0.3 Hz applying a force on the cells of ~2
nN.
5.3.4 Analysis of cell mechanics
G* was calculated from AFM measurements using custom software in Matlab (Mathworks,
Natick, MA) as previously described (62; 215). Briefly, the contact point zc and the Young’s
modulus E was determined by least squares fitting from the prediction of the force-indentation
relationship of a 4-sided pyramid with infinite stiffness indenting a half-space with a finite
Young’s modulus (79):
( )( )( )
( )θ δ
ν= − − =
−2 2
23 tan 3 tan4 1 4 1cE θ
ν− 2F z z dE (5.1)
where ν is the Poisson ratio (assumed to be 0.5). Eq. (5.1) can be approximated for oscillations
around an operating indentation δ0 by taking the first term of the Taylor expansion. After doing
this, expressing in terms of the shear modulus G=E/2(1+ν), and converting to the frequency
domain we have that (62):
89

Chapter 5 Role of mechanics and nuclear volume in cell shape control of proliferation.
( )ων
δ θ δ ω⎛− ⎟⎜= − ⎟⎜ ⎟⎟⎜⎝0
( )1*3 tan ( )
FG
⎞⎠
0iwb (5.2)
where G* is the complex shear modulus, ω=2πf is the angular frequency (f being frequency),
and iωb(0) is the correction for the viscous drag force exerted by the liquid medium on the
cantilever. b(0) was calculated as previously described (216). G* for each cell was taken as the
average of the 3 measured values. G* was divided in its real and imaginary parts as G*=G’ +
iG’’, with G’ and G’’ being the elastic and loss moduli respectively.
5.3.5 Cell and nuclear volume analysis
Cell volumes where calculated from AFM images using free WSxM software (Nanotec
Electrónica, Tres Cantos, Spain). Given that the smallest cells were very high, a large
convolution between the cell and the cantilever tip was observed in the lower part of the image
due to the inclination of the cantilever tip with respect to the substrate. For these cells, volume
was calculated as twice that of the upper half of the image (which never showed convolution)
and then multiplied by 2. Volume data was also corrected for the underestimation due the
indentations caused by the applied force. The indentation δi caused by the cantilever was
estimated from Eq. (5.1) by using the measured value of E for each cell type (with constrained
spreading area Ai), and an additional volume of Vi=δiAi was added to calculated values. For
nuclear volume calculation, cell DNA was stained with Hoechst 33342 (Molecular Probes,
Carlsbad, CA) for 5 minutes, fixed with 4% formaldehyde in PBS and visualized with confocal
microscopy (SP2 microscope, Leica, Wetzlar, Germany). Nuclear volume was then calculated
from iso-intensity contours obtained from confocal sections covering the entire nuclear height
and separated by 448 nm (230). Nuclear DNA content was assessed by calculating the total
fluorescence intensity emitted by each nucleus, which was then divided by the nuclear volume to
obtain DNA condensation. DNA content of nuclei was distributed in 2 gaussians corresponding
to cells in G1 and G2. To select only cells in G1, data of nuclei with DNA contents higher than
the center of the first Gaussian plus 1 standard deviation were discarded.
5.3.6 Immunofluorescence microscopy and DNA synthesis assay
For F-actin staining, cells were fixed with 4% formaldehyde in PBS and incubated with
Phalloidin–Tetramethylrhodamine (Sigma). Images shown in figures were taken with a 60×
90

5.4 Results
objective in oil, while F-actin content was quantified from images taken with a 20x objective in
air by adding the total fluorescence intensity emitted by each cell after subtracting the
background. DNA synthesis was quantified by measuring the incorporation of BrdU into cellular
DNA using an in situ cell proliferation kit (Roche Applied Science, Penzberg, Germany) as
instructed by the manufacturer. The % of cells in S phase was calculated for each shape and Petri
dish. Data from petri dishes containing less than 5 cells of a given shape was pooled. In all cases,
immunofluorescence images were taken with a CCD camera (Hamamatsu, Morimoto, Japan)
attached to an inverted optical microscope (Eclipse TE 2000 microscope, Nikon, Tokyo, Japan).
5.3.7 Statistical analysis
Data are shown as mean ± SE for a minimum of n=6 cells for each particular shape and
measurement. The effects of spreading and anisotropy on G’, G’’/G’, F-actin content, cell and
nuclear volume, DNA condensation, and DNA synthesis was analyzed with two-way analysis of
variable (ANOVA) tests. The effect of shape and cytochalasin D on G’ and cell F-actin content
were also analyzed with 2-way ANOVA. All other reported comparisons were performed with
two-tailed student’s t-tests.
5.4 Results
Micropatterning technology was used to dissect the role of cytoskeletal tension and nuclear
volume in cell shape-dependent control of spreading by independently modifying cell-ECM
surface area, anisotropy, and morphology (Fig. 5.1). This permitted us to analyze cell properties
as a function of spreading without modifying the density of ECM ligands. Mechanical properties
were then analyzed by measuring the complex shear modulus G*=G’ + iG’’. G’ (the real or
elastic component of G*) quantifies the elasticity and stiffness of the cytoskeleton, and can be
used to evaluate its mechanical tension or contractility (11). The parameter η, defined as the ratio
between the viscous and elastic components of G* (η=G’’/G’), quantifies the level of structural
disorder in the cell. A value of η=0 corresponds to a purely elastic ordered solid, while a value
of η=∞ corresponds to a disordered viscous liquid. G* was first measured for 2500 µm2 spread
cells at the cell center and at the perinuclear region (Fig. 5.2A). G’ of the central region of
91

Chapter 5 Role of mechanics and nuclear volume in cell shape control of proliferation.
circular isotropic cells, where no actin filaments could be observed (Fig. 5.3A-B), was over 20-
fold lower than in the perinuclear region, where filaments were clearly present. However, no
significant differences between cell regions were found in elliptic anisotropic cells, which
exhibited actin filaments in all their regions (Fig. 5.4A-B). Stiffness correlated thus with the
presence of actin filaments, suggesting that G’ in the perinuclear region is determined primarily
by the actin cytoskeleton and its contractility. This was confirmed by the marked decrease in
perinuclear G’ for 2500 µm2 spread cells observed after depolymerizing the cytoskeleton and
eliminating actin microfilaments with cytochalasin D (Fig. 5.2). Accordingly, cytochalasin D
had no effect on 300 µm2 spread cells due to the absence of microfilaments even before
treatment (Fig. 5.3A-B). G’ at the perinuclear region of cells was thus taken as the measure of
cytoskeletal tension and is the value reported in Figs. 3 and 4. G’, however, can be overestimated
in AFM measurements on thin samples. To discard this possibility, the dependence of the
determination of E on indentation was evaluated as previously described (215) for 2500 µm2
Anisotropy1 6
G' (
Pa)
0
4
8
12 ***
F-ac
tin
(Cyt
oD/c
ontr
ol)
0.0
0.5
1.0
Cell spreading (µm2)0 1000 2000 3000G
' (C
ytoD
/con
trol
)
0.0
0.5
1.0
1.5
A
Fig. 5.2 G* measurements are determined by actin cytoskeleton organization. (A) Comparison of G’ measured at the perinuclear region (closed bars) and at the cell center (open bars) for isotropic and anisotropic 2500 µm2 spread cells. ***, p<0.001. (B-D) F-actin immunofluorescence images showing the absence of microfilaments after cytochalasin D treatment (B), and graphs showing the changes induced by treatment in G’ at the perinuclear region (C) and F-actin content (D). Cytochalasin D significantly reduced F-actin content (for all shapes) and G’ (for 2500 µm2 cells) (p<0.001). Closed symbols represent isotropic cells, open symbols represent anisotropic cells. Scale bar indicates 10 µm.
B
Cell periphery
Anisotropy = 1Anisotropy = 6
Cell center
C
D
92
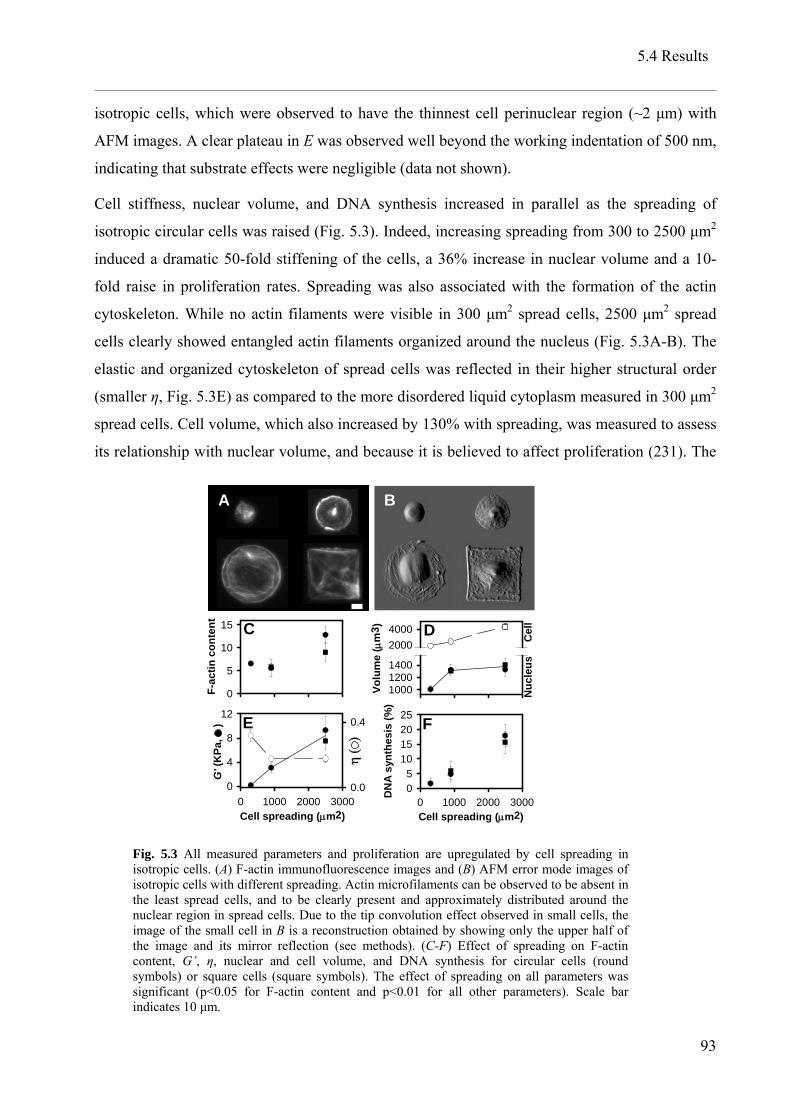
5.4 Results
isotropic cells, which were observed to have the thinnest cell perinuclear region (~2 µm) with
AFM images. A clear plateau in E was observed well beyond the working indentation of 500 nm,
indicating that substrate effects were negligible (data not shown).
Cell stiffness, nuclear volume, and DNA synthesis increased in parallel as the spreading of
isotropic circular cells was raised (Fig. 5.3). Indeed, increasing spreading from 300 to 2500 µm2
induced a dramatic 50-fold stiffening of the cells, a 36% increase in nuclear volume and a 10-
fold raise in proliferation rates. Spreading was also associated with the formation of the actin
cytoskeleton. While no actin filaments were visible in 300 µm2 spread cells, 2500 µm2 spread
cells clearly showed entangled actin filaments organized around the nucleus (Fig. 5.3A-B). The
elastic and organized cytoskeleton of spread cells was reflected in their higher structural order
(smaller η, Fig. 5.3E) as compared to the more disordered liquid cytoplasm measured in 300 µm2
spread cells. Cell volume, which also increased by 130% with spreading, was measured to assess
its relationship with nuclear volume, and because it is believed to affect proliferation (231). The
Cell spreading (µm2)0 1000 2000 3000
η (
)
0.0
0.4
G' (
KPa
, )
0
4
8
12
F-ac
tin c
onte
nt
0
5
10
15
Volu
me
( µm
3 )
100012001400
20004000
Cell spreading (µm2)0 1000 2000 3000
DN
A sy
nthe
sis
(%)
05
10152025
Nuc
leus
Cel
lC D
E F
A B
Fig. 5.3 All measured parameters and proliferation are upregulated by cell spreading in isotropic cells. (A) F-actin immunofluorescence images and (B) AFM error mode images of isotropic cells with different spreading. Actin microfilaments can be observed to be absent in the least spread cells, and to be clearly present and approximately distributed around the nuclear region in spread cells. Due to the tip convolution effect observed in small cells, the image of the small cell in B is a reconstruction obtained by showing only the upper half of the image and its mirror reflection (see methods). (C-F) Effect of spreading on F-actin content, G’, η, nuclear and cell volume, and DNA synthesis for circular cells (round symbols) or square cells (square symbols). The effect of spreading on all parameters was significant (p<0.05 for F-actin content and p<0.01 for all other parameters). Scale bar indicates 10 µm.
93

Chapter 5 Role of mechanics and nuclear volume in cell shape control of proliferation.
role of cell edges was studied by comparing circular cells to square cells (and elliptic cells to
rectangular cells). The presence of edges did not result in a significant difference in any of the
measured magnitudes (Fig. 5.3). We thus restricted our analysis of cell shape to the study of cell
spreading and anisotropy, and in further results we pooled data for square and rectangular cells
with that of circular and elliptic cells, respectively.
The correlation between DNA synthesis and stiffness was lost when spreading was modified (Fig.
5.4). The stiffness of cells with anisotropy of 6 was markedly lower than that of equally spread
isotropic cells (9 and 3-fold lower in 2500 µm2 and 900 µm2 spread cells, respectively).
Structural order in anisotropic cells was nevertheless higher, probably reflecting their increased
F-actin content. However, no significant effect of anisotropy was observed in either nuclear
volume or DNA synthesis. Actin filaments in spread anisotropic cells were parallel, not
entangled, and oriented along the long axis of the cell, showing thus an organization clearly
different from that observed in isotropic cells. However, the organization of the vimentin
cytoskeleton (Fig. 5.5) did not change appreciably with anisotropy, suggesting that anisotropy-
induced cytoskeletal reorganization might be specific of actin filaments. Cell volume was ~2-
G' (
KPa
)
0
4
8
12
Cell spreading (µm2)900 2500
η
0.0
0.1
0.2
F-ac
tin (a
.u.)
0
5
10
15
volu
me
( µm
3 )
0
500
1000
1500
Nuc
lear
Cel
l
Cell spreading (µm2)900 2500D
NA
synt
hesi
s (%
)
05
10152025
volu
me
( µm
3 )
02000400060008000
10000
*
**
***
******
**
C
E
G
D
F
H
B
A
Anisotropy = 1Anisotropy = 6
Fig. 5.4 Cell anisotropy induces cell softening and swelling but does not affect nuclear volume or DNA synthesis. (A) F-actin immunofluorescence image and (B) AFM error mode image of 2500 µm2 spread anisotropic elliptic cells. Actin microfilaments are clearly aligned along the long axis of the cells. (C-H) Comparison of measured parameters for isotropic cells (closed bars) and anisotropic cells (open bars) for 900 µm2 and 2500 µm2 spread cells. Scale bar indicates 10 µm. *, p<0.05, **, p<0.01, ***, p<0.001.
94

5.4 Results
fold higher in anisotropic cells than in equally spread isotropic cells.
Spreading increased nuclear volume, decreased chromatin condensation of cells in G1 phase, and
promoted entry of cells into S phase independently of anisotropy. Nuclear volume of cells in G1
phase highly correlated with the percentage of cells in S phase of the entire population (r=0.836,
Fig. 5.6). This suggests that cell shape could regulate G1-S transition through alterations in
nuclear volume. Specifically, the nuclear volume of G1 cells could affect the onset of DNA
synthesis by altering the level of chromatin condensation. This possibility was assessed with
confocal microscopy by measuring the average fluorescence intensity emitted by the Hoechst
33342 dye, which binds to dsDNA and can be used as an indicator of DNA condensation. The
level of DNA condensation was indeed higher for the least spread cells (p<0.001), which were
also the cells with the smallest nuclei and the lowest levels of DNA synthesis. This magnitude
also strongly correlated with DNA synthesis (r=-0.819). By contrast, no significant correlation
was found between proliferation and cell volume, even though a link between these magnitudes
has been suggested after studying the effect of osmotically altering cell volume (231).
Fig. 5.5 Distribution of the vimentin cytoskeleton for differently shaped cells. Scale bar indicates 10 µm.
95

Chapter 5 Role of mechanics and nuclear volume in cell shape control of proliferation.
5.5 Discussion
To elucidate the role of mechanics in regulating proliferation, we should first understand how
mechanical properties are controlled by cell shape. Cell stiffness showed a dramatic increase
with cell spreading and a striking decrease with cell anisotropy. On the one hand, the increase
with spreading is consistent with the formation of actin microfilaments and the raise in cellular
F-actin content, illustrating the importance of microfilaments and the presence of an organized
cytoskeleton in determining cell stiffness. This increase in stiffness with spreading most likely
reflected a parallel increase in cytoskeletal contractility or prestress due to the close association
reported between these two magnitudes (11). Accordingly, we observed a significant positive
Spreading
DNA condensation
DNA synthesis
nuclear volume
Cytoskeletal tension Cell volume
?
Cellspreading
Nuclear volume of G1 cells (µm3)
1000 1200 1400% o
f cel
ls in
S p
hase
0
5
10
15
20
DNA condensation of G1 cells (a. u.)
2800 3200 3600
A B
C Spreading
DNA condensation
DNA synthesis
nuclear volume
Cytoskeletal tension Cell volume
?
Cellspreading
Nuclear volume of G1 cells (µm3)
1000 1200 1400% o
f cel
ls in
S p
hase
0
5
10
15
20
DNA condensation of G1 cells (a. u.)
2800 3200 3600
A B
C
Fig. 5.6 Nuclear volume and DNA condensation of cells in G1 phase strongly correlate with cell proliferation. Graphs showing cell proliferation as a function of the nuclear volume (A) or DNA condensation (B) of cells in G1 phase for each shape. The correlations shown in both graphs were significant (p<0.05). Closed and open symbols represent isotropic and anisotropic cells, respectively. Up-looking triangles, down looking triangles, and diamonds represent cells with 300, 900, and 2500 µm2 of spreading area, respectively. (C) Working model of the regulation of proliferation by cell shape (see text). Up and down-looking gray arrows indicate up and downregulation of the corresponding magnitudes.
96

5.5 Discussion
correlation between spreading and prestress after measuring the traction forces exerted by
unpatterned cells with traction microscopy (Fig. 5.7). Moreover, an upregulation of contractility
by cell spreading has already been reported for many cell types, including endothelial cells (115;
122; 124). On the other hand, the smaller stiffness measured in anisotropic cells could in
principle be contributed both by a reduction in contractility and by their different cytoskeletal
configuration (more F-actin content and less filament entanglement than in isotropic cells).
However, a recent work showed that the stiffness of actin gels directly correlated with the
applied prestress independently of the degree of actin polymerization and entanglement (93),
suggesting that the reduction in stiffness caused by anisotropy is entirely due to a lower
contractility, probably myosin dependent. Consistently, the contractility of smooth muscle cells
has been reported to decrease with increasing anisotropy (122). Mechanical tension in
endothelial cells was thus profoundly affected by both cell spreading and anisotropy.
How do changes in cell shape translate into the different cytoskeletal organizations and
mechanical configurations observed? High levels of cell spreading are known to induce
mechanical tension and stiffness, probably through the formation of cytoskeletal-ECM contacts
made possible by the increase in cell-ECM contact area (103) and the activation of RhoA (104).
Cytoskeletal mechanical tension then promotes the maturation of these initial contacts into focal
adhesions (105; 106) and the formation of stress fibers (104). The final organization of stress
fibers, focal adhesions, and mechanical tension depends thus on the spatial distribution of focal
Cell spreading (µm2)2000 2500 3000 3500 4000
Pres
tres
s (n
N/ µ
m2 )
0.0
0.1
0.2
0.3
0.4
Fig. 5.7 Prestress as a function of spreading. Cell contractility was measured for unpatterned cells using a cell traction assay as previously described (17). Cell prestress was then calculated as described in (11). To account for cell geometry, cells were approximated by a half-ellipsoid with the same spreading area and anisotropy as the cells. Cell height was assumed to be constant. Prestress significantly correlated with spreading as assessed by a Pearson product moment test (p<0.05). However, no effect of anisotropy could be observed due to the small range of anisotropies naturally presented by cells.
97

Chapter 5 Role of mechanics and nuclear volume in cell shape control of proliferation.
adhesions, which are usually on the cell periphery (99; 100), and on cell shape, but not
necessarily on the total available area of cell-ECM contact (100). However, this scenario is not
sufficient to explain the decrease in stiffness (and thus mechanical tension) observed in
anisotropic cells when compared to equally spread isotropic cells. One possible explanation for
this difference might stem from the constraints imposed by cell geometry on spreading. Even
though spread cells experiment higher levels of mechanical tension, the initial stage of spreading
by itself might require a low level of rhoA activity, contractility, and myosin activity to permit
the outward polymerization of actin via Rac1 activation (232). Even though spreading must
occur both in isotropic and anisotropic cells, isotropic cells spread along their entire periphery
and need only to extend to a diameter of about 50 µm (in 2500 µm2 cells). In anisotropic cells,
spreading is necessarily concentrated at the edges of the cell, which must extend to almost 140
µm. This process might require lower levels of myosin and contractile activity, which could be
reflected in the final contractile state of the cell once spreading is completed. Consistently with
this hypothesis, the inhibition of Rho-induced contractility in epitheliocytes has been seen to
promote actin polymerization at the cell edges and cell elongation or anisotropy (233).
Could mechanical tension be responsible for the differences in proliferation observed as a
function of cell shape? Rho-regulated mechanical tension has been proposed to control G1/S
phase transition by increasing the levels of Cyclin D1 (178; 181). Indeed, the association
between spreading and proliferation reported in different works (12; 123; 178) has been
explained by referring to measurements showing an increase in stiffness or mechanical tension
also as a function of spreading (59; 115; 122). Furthermore, results from this work for isotropic
cells show for the first time that, in single cells plated on surfaces with equal ECM ligand density,
proliferation and stiffness are indeed correlated as spreading increases. Additionally, the
disruption of cytoskeletal elements bearing mechanical tension has been shown to reduce
proliferation (178), while patterns of proliferation within sheets of cells have been observed to be
determined by the underlying cell mechanical tension (179). However, measurements by Cai and
co-workers where stiffness and mechanical tension were increased in fibroblasts by means of the
expression of a constitutively active form of MLC kinase resulted instead a decrease in
proliferation (183), showing that the effect of mechanics on proliferation might not be as direct
as previously believed. To understand this apparent discrepancy, it must be noted that in all
previous studies relating shape, proliferation, and mechanics, the only cell shape parameter that
was controlled was spreading. Here, we observed that, while cytoskeletal tension and
proliferation were coupled for isotropic cells as spreading was modified, this coupling was lost
98

5.5 Discussion
when anisotropy was altered. While anisotropy induced a dramatic cell softening of up to 9-fold,
cell entry into S phase remained unaffected. An alternative mechanism is thus required to explain
the control of cell cycle exerted by cell shape.
We hypothesized that spreading could promote proliferation by increasing nuclear volume.
Supporting this hypothesis, nuclear structure has been recognized to modulate tissue phenotype
and proliferation (228), and nuclear shape parameters have been associated with protein
expression and proliferation (158). Moreover, the inhibition of nuclear volume increase and of
transition into S phase were observed to be linked in HeLa cells (229), and results from Cai and
co-workers (183) showed that the reduced proliferation observed in stiffer fibroblasts
overexpressing MLC kinase was however associated with a smaller nuclear volume.
Additionally, our hypothesis is consistent with a role of mechanical tension, exerted through its
effect on nuclear volume. Indeed, the cell nucleus is known to be mechanically connected to the
actin cytoskeleton (43; 51), and nuclear size has been reported to decrease after submitting cells
to different treatments believed to reduce cytoskeletal tension (52). The high cytoskeletal tension
of spread cells could thus deform and stretch the nucleus, increasing its total volume and thus
proliferation rates. However, this relationship between contractility and nuclear volume need not
be direct. For instance, the parallel bundles of actin present in anisotropic cells might be more
effective at stretching the nucleus than the entangled bundles of isotropic cells, compensating
thus for their smaller contractility and resulting in similar nuclear volumes. Additionally, nuclear
volume could also be linked to cell volume (234; 235), which was higher in anisotropic cells.
Nuclear volume could affect proliferation by regulating DNA condensation. Certainly, high
levels of DNA condensation are believed to impair DNA transcription (236) and are linked to
apoptosis, while low levels are associated with the entry of cells into S phase. Decondensed
chromatin has been proposed to promote transcription by reducing the steric inhibition to
transcription factors (50), and could promote replication in a similar way by exposing DNA
replication origins and making DNA more accessible to the replication machinery. In agreement
with our hypothesis, our measurements showed a strong correlation between nuclear volume,
DNA synthesis, and DNA condensation (Fig. 5.6). Our results thus strongly suggest that cell
shape mediated cell cycle control could be regulated through a G1/S checkpoint dependent on
nuclear volume and DNA condensation.
The mechanisms by which cells sense their local physical environment and respond
appropriately constitute an important major open question in cell biology (237; 238). The study
99

Chapter 5 Role of mechanics and nuclear volume in cell shape control of proliferation.
of cell shape has proven a very useful model to study this problem, given the ability of cell shape
to modulate the behavior of cells subjected to the same chemical stimulation from growth factors
or integrins. In this way, differences in mechanics, proliferation, and gene or protein expression
as a function of cell shape have been used as a model to understand the effect of local
differentials in mechanical tension in vivo as a driving force behind stem cell differentiation
(160), angiogenesis (20), embryogenesis (226) and morphogenesis in general (179). The results
from this work shed more light on the mechanism relating cell shape and function, strongly
suggesting an important role of nuclear volume in determining G1-S transition, possibly through
the decondensation of chromatin. In this way, local differentials in mechanical tension could
drive pattern formation in tissues not directly, but indirectly through a modulation of nuclear
structure and volume. Accordingly, the loss of this mechanical connection between the nucleus
and the cytoskeleton, observed in tumorigenic transformed cells (239), could be a determinant
factor in tumor formation.
100

Chapter 6 Stability of microfabricated high aspect ratio structures in
Poly(dimethylsiloxane)
6.1 Abstract
The stability of structures microfabricated in soft elastomeric polymers is an important concern
in most applications that use these structures. Although relevant for several applications, the
collapse to the ground of high aspect ratio structures (ground collapse) is still poorly understood.
The stability of soft microfabricated high aspect ratio structures versus ground collapse was
experimentally assessed, and a new model of ground collapse involving adhesion was developed.
Sets of posts with diameters from 0.36 µm to 2.29 µm were fabricated in Poly(dimethylsiloxane)
(PDMS) and tested in air or immersed in water and ethanol to change the work of adhesion. The
critical aspect ratio (the highest length to width ratio for which a post is not at risk of collapsing)
was determined as a function of the diameter. The critical aspect ratio in air ranged from 2 to 4
and increased with the diameter. Work of adhesion was found to be determinant for and
inversely correlated to stability. These results highlight the role played by adhesion and offer the
possibility of improving stability by reducing the work of adhesion. The ground collapse model
developed accounted for the main features of structure stability. The results indicate that ground
collapse can be a limiting factor in the design of soft polymer structures.

Chapter 6 Stability of microfabricated high aspect ratio structures in PDMS
6.2 Introduction
The use of structures microfabricated in elastomeric polymers has become widespread in the last
decade. The different techniques by which they are employed are utilized in fields such as
surface chemistry (240), microfluidics (241), biochemistry and cell biology (110; 242). All these
applications require the fabrication of three-dimensional structures with sizes ranging from tens
of nanometers to hundreds of micrometers in an elastomeric polymer, generally PDMS. Owing
to the softness of the used polymers (Young’s modulus on the order of MPa), one of the main
concerns in their design is the stability of the patterned structures with respect to their particular
use.
The stability of soft microstructures can be compromised in different ways. When pressure is
applied between a patterned PDMS sample and a substrate, as in microcontact printing (110; 205;
240; 242), and the height of the features in the pattern is too low as compared to the separation
between them, collapse of the unpatterned space between the structures can take place (roof
collapse) (197; 198). If the aspect ratio of the features is too high, buckling and collapse of the
structures themselves can occur (197). Structures can also be unstable independently of the
application of pressure. Too high aspect ratios can lead to adhesion between structures if they are
too close (lateral collapse) (197; 199) or collapse of the structures to the ground (149), something
that will be henceforth referred to as ground collapse.
An understanding of the mechanisms behind the types of structural deformation that lead to
instabilities, and of the constraints they impose on pattern layout is crucial for the design of
structures in soft polymers. This issue has been addressed for several types of pattern
deformation, both theoretically and experimentally (13; 197-199; 243). However, the particular
case of the collapse to the ground of high aspect ratio structures is still poorly understood. The
stability of high aspect ratio structures is nevertheless a primary concern in several applications.
Indeed, post-like PDMS structures with high aspect ratios have been used as microcantilevers for
the sensing of cellular traction forces (124), as substrates for the study of cell behavior (244), as
microneedles for drug delivery (245), or as model systems for the study of the adhesive
properties of fibrillar interfaces (243). High aspect ratio structures also have to be considered
when designing stamps for microcontact printing, given the limitation of most microfabrication
techniques of having to work with a constant height for the entire stamp. If the structures of a
single stamp have very different sizes but a constant height, high aspect ratios are likely to be
102

6.2 Introduction
present.
To our knowledge, the only attempts to explain the phenomenon of ground collapse have
assumed that the structures fall exclusively owing to their own weight (13; 199). For a
cylindrical post of height and diameter d, this assumption implies that the critical aspect ratio,
i.e. the highest length to width ratio for which a post is not at risk of collapsing, depends on the
diameter of the post as (13). This relationship implies that for the same aspect ratio,
structures should become more stable as their size is reduced. Considering the fact that a post
with a diameter of 0.5 cm and a height of 4 cm in PDMS is stable, an analogous structure with a
diameter of 1 µm could then be 137 µm tall without collapsing. This model prediction does not
correspond to experimental data as cylindrical posts in PDMS with a diameter of 1 µm and a
height of 6 µm have been reported to collapse (149).
h
1/3d −
The failure of this model to explain the stability of microposts indicates that gravity is most
likely not the main cause behind the ground collapse of microstructures. This is to be expected if
one considers the different scaling properties of forces as sizes are reduced. Gravitational forces,
which scale as volume (i.e. as , l being a characteristic length of the system), lose importance
when is on the order of micro or nanometers. In this range, other forces with weaker scaling
laws become much stronger in comparison. Specifically, adhesion forces (scaling as in Van
der Waals forces, for example (246)), have already been seen to be determinant for the lateral
collapse of structures (13) and could also be important in ground collapse.
3l
l1/ 4l
The aim of this work was to assess the stability of soft microfabricated high aspect ratio
structures versus ground collapse as a function of both size and adhesion, and to develop a model
of ground collapse taking adhesion into account. To this end, micro and submicrometric posts in
PDMS with a circular cross section and different diameters were tested. To experimentally
obtain the critical aspect ratio as a function of the post diameter, posts with different aspect ratios
were fabricated for each diameter and observed. Their stability was tested in air and immersed in
water and ethanol to change the adhesion conditions. A simple model, balancing the effects of
elastic and adhesion energies, was developed to predict the critical aspect ratio, and compared to
the experimental results.
103

Chapter 6 Stability of microfabricated high aspect ratio structures in PDMS
6.3 Ground collapse model
Manipulation, demolding from the master, or any other perturbation of a structure could in
principle bring it to contact with its base and cause it to adhere. We consider this structure to be
stable if it is able to spring back to its original upright position. We model the ground collapse of
a cylindrical post as depicted in Fig. 6.1. The post consists of an initial portion bent in a
semicircle of radius R and a final undeformed portion of length , which is adhered to the base. 'h
We performed the stability analysis following the approach used by Hui and co-workers (13) and
Glassmaker and co-workers (243) when considering adhesion between neighboring posts. We
divided the strain energy of the post in two terms. The first term arises from the bending of
the initial semicircular region. The second term is the elastic energy stored in the bending
present at the connection between the initial and final regions. Assuming that the initial region is
simply a bent cylinder with a constant radius of curvature
SU
cU
R , the strain energy can be calculated
to be (247)
2
2SEIUh
π= + cU
R
(6.1)
where h π= is the length of the bent part of the cylinder, I d is the moment of 4( ) / 64π=
Fig. 6.1 Comparison between the shape of the posts used in the model and that observed in the experiments. Top: Geometrical model for stable (left) and collapsed (right) posts used in the theoretical calculations with its different parameters. Bottom: SEM images of examples of stable (left) and collapsed (right) PDMS posts (view angle is 52º). Scale bars indicate 2 µm.
104

6.3 Ground collapse model
inertia of a circular cross-section, d is the radius of the cylinder and E is Young’s modulus of
the material. The energy of adhesion to the base is all contained in the final portion.
Specifically,
AU
105
h 2 ' (6.2) AU aW=
where W is the work of adhesion of the material to itself and 2 is the length of the circular
cross-section of the cylinder that is in contact with the base. For an infinitely long cylinder lying
on a flat substrate a can be calculated using the Johnson-Kendall-Roberts theory of adhesion
(248)
a
( ) 1/32
2/316 1
a WEν
π
⎛ ⎞−⎜ ⎟=⎜ ⎟⎝ ⎠
d (6.3)
where ν is the Poisson ratio. Owing to the deformation of both the cylinder and the substrate
near the contact region there is also an associated elastic energy in this region 'sU , which can be
calculated after imposing that it is in equilibrium with the energy of adhesion (243) AU
'
2SU Wa
∂=
∂ (6.4)
To analyze the stability of the system, we first calculated the decrease in strain energy resulting
from a differential increase in the length of the initial bent part
3 4
9 22SEddU dhh
π−= (6.5)
where it is assumed that because, in the model, the connection between the two regions
maintains always the same shape. Under equilibrium conditions, this energy loss should be
compensated by the change of energy within the final portion of the post due to the separation of
the adhered surfaces
0cdU =
' 3( )2s A sdU dU dU aW= − − = − (6.6)
This equilibrium condition does not depend on the length of the adhered part . If we now
substitute Eqs. (6.3) and (6.5) into Eq. (6.6), we finally obtain the relationship
'h

Chapter 6 Stability of microfabricated high aspect ratio structures in PDMS
( ) ( )2/35/3 1/ 6 2 /32
11/3 1/ 2 12 3c
h dd W
π ν−⎛ ⎞ ⎛ ⎞= −⎜ ⎟ ⎜ ⎟
⎝ ⎠ ⎝ ⎠E (6.7)
For the particular case of , defines the maximum total height of the post above which it
remains adhered to the base. Equation 7 is thus the stability condition for a cylinder against
ground collapse, and ( its critical aspect ratio. This equation has been obtained for a
circular cross-section, but it could be generalized to other cross sections by modifying the value
of
' 0h = h
/ )ch d
I and Eq. (6.3).
Eq. (6.7) indicates that, given an aspect ratio, a structure should become more stable as it
becomes larger, clearly contrary to the prediction obtained when gravity is taken into account.
Further, note the dependence of the critical aspect ratio on the ratio , a parameter usually
referred to as conformability that has been shown to be important in microcontact printing (198).
As expected, the model predicts that use of harder materials with a higher Young’s modulus
should increase the stability of the posts, while the use of materials with a higher work of
adhesion should reduce it. To obtain the final result for the critical aspect ratio only elasticity and
adhesion were considered. It would however be possible to introduce a term accounting for
the weight of the post in Eq. (6.6). For all the sizes that will be considered in this work and for
the typical properties of soft polymers, it holds that
/W E
GdU
5/ 1G AdU dU 0−< . Gravity can thus safely be
neglected with respect to adhesion in this model.
6.4 Materials and methods
6.4.1 Products
PDMS (Sylgard 184) was purchased from Dow Corning (Midland, MI, USA). (Tridecafluoro-
1,1,2,2-tetrahydrooctyl)-1-trichlorosilane was obtained from United Chemical Technologies
(Bristol, PA, USA). Immersion liquids used in the measurements were water (purified using
MilliQ apparatus, Millipore, Billerica, MA, USA) and high-purity HPLC grade ethanol (Merck,
Whitehouse Station, NJ, USA).
106
6.4 Materials and methods
6.4.2 Sample fabrication process
Micrometric posts were fabricated in PDMS following a two-step procedure. Initially, circular
holes with the desired dimensions were milled in a silicon master using FIB apparatus (FEI
company, Hillsboro, USA). The master was then silanized by exposure to (tridecafluoro-1,1,2,2-
tetrahydrooctyl)-1-trichlorosilane vapor for one hour to minimize sticking between the silicon
and the PDMS during molding. PDMS prepolymer was then prepared by thoroughly mixing the
base polymer and the curing agent in a 10:1 ratio and degassing under vacuum for one hour. A
few droplets of the prepolymer were subsequently placed on the master and spun down for 10 s
at 1500 rpm (Laurell Technologies Corp., North Wales, USA). Curing was then achieved at 80
ºC for 2 hours in a conventional oven. To manipulate the thin PDMS membrane obtained, a glass
coverslip was placed on top of it before release from the master. Once released, this resulted in a
very thin PDMS membrane adhered to a coverslip with the microstructures uppermost. Using a
thin PDMS membrane instead of a thick slab served two purposes. First, curing only a small
amount of prepolymer should optimize the polymerization. Second, it allowed for optical
examination using high-magnification objectives (40x) on inverted optical microscopes, which
was useful for the samples immersed in liquid.
FIB was chosen as a fabrication technology because of its high resolution and the fact that,
unlike other methods, it easily allows the creation of structures with different heights within the
same sample. However, redeposition of material on the sidewalls is inevitable when milling
holes of high aspect ratios with FIB. The resulting posts had thus a cone-like shape that departed
somewhat from that of cylinders (Fig. 6.1).
6.4.3 Measurement of Young’s modulus
Young’s modulus of PDMS was measured with AFM (Bioscope, Digital Instruments, Santa
Barbara, CA, USA) using a previously described method (62). Briefly, the spring constant
(nominal 0.5 N/m) of the cantilever used for the measurement was initially calibrated using the
thermal fluctuations method (77; 78) in air. Sets of 10 force-displacement curves (3 µm peak-to-
peak at 0.3 Hz) were recorded at three spots in the vicinity of the structures of one of the samples.
The values of Young’s modulus were then estimated from the force-displacement curves (79)
using non-linear least squares regression and averaged ( 0.5v = ). The resulting value was
107

Chapter 6 Stability of microfabricated high aspect ratio structures in PDMS
3.07.1 ±=E MPa (mean ± SD).
6.4.4 Measurement of work of adhesion
Samples were studied in air or immersed in water and ethanol to change the adhesion conditions.
The work of adhesion of PDMS to itself in air was taken from the study by Chaudhury and co-
workers (18). To determine the work of adhesion in liquid, contact angles of PDMS with the two
liquids were measured and Young’s equation was applied (249)
cosLV SV SLγ θ γ γ= − (6.8)
where / 2SV airWγ = is the surface free energy in air, / 2SL liquidWγ = is the surface free energy in
the corresponding liquid, θ is the contact angle and LVγ is the surface tension of the liquid.
Contact angles of PDMS with water and ethanol were measured via a sessile drop method using
an OCA 15 plus system (Dataphysics, Filderstadt, Germany) at room temperature, in an
environment saturated with the corresponding liquid. Three droplets of 3 µl of the liquid were
placed at different spots of a flat PDMS sample, and contact angle measurements were averaged.
Resulting values for the work of adhesion can be found in Table 6.1.
6.4.5 Imaging of microstructures
To establish whether the structures remained upright or collapsed, samples in air were imaged
with an optical microscope (Nikon Eclipse L150, Tokyo, Japan) with a 100x objective and with
the scanning electron microscope (SEM) attached to the FIB apparatus. SEM images were
Table 6.1 Work of adhesion under different experimental conditions
Sample immersed in
surface tension at 23 ºC (mN/m)
Contact angle(º) Work of adhesion(mN/m)
ethanol 22.1* 42 11
air --- --- 44†
water 72.4* 107 86
*Taken from (3). †Taken from (18)
108

6.4 Materials and methods
recorded under a voltage of 1 KeV, which allowed high resolution imaging without requiring a
thin gold coating or any other modification. The number of collapsed structures coincided in all
cases when observed by SEM and by optical microscopy, thus discarding any electrical charging
effect on the stability of the posts when subjected to an electron beam. SEM images taken at an
angle of 52º were used to determine the actual diameters and heights of the posts. Diameters
were measured at the base of the posts.
To observe the microstructures in liquid, a few drops of the liquid were placed on top of the
samples, covering all the posts. As SEM can not be used in liquid, the samples were then
observed with an inverted optical microscope (Nikon TE200, Tokyo, Japan) with a 40x objective.
The posts with the smallest diameter (0.36 µm) could not be observed as the resolution of the
microscope was insufficient.
6.4.6 Determination of critical aspect ratio
Posts with 4 different diameters, ranging from 0.36 µm to 2.29 µm, were fabricated. For each
diameter, posts were also fabricated in different heights (from 4 to 7 per diameter), producing a
total of 23 different combinations of post diameter and height (post configuration). The range of
tested aspect ratios for each diameter is displayed in Table 6.2. For each particular configuration,
sets of 9 identical posts (ranged in arrays of 3x3) were fabricated for statistical purposes. Six
identical samples containing all the posts were fabricated, thus producing a total of 54 posts per
Table 6.2 Post dimensions
Diameter (µm)* Minimum aspect ratio†
Maximum aspect ratio†
0.36 1,4 2,7
0.62 2,4 3,0
1.15 3,3 4,9
2.29 4,6 5,4
*The diameter was measured at the base of the posts. †Aspect ratio is defined as the height divided by the diameter.
109

Chapter 6 Stability of microfabricated high aspect ratio structures in PDMS
configuration.
After imaging, post diameters and heights were measured for all stable posts of each
configuration for all samples. The values for the diameter and height of each post configuration
were taken as the average of these measurements, and their variabilities were calculated (SD).
This resulted also in variability in the aspect ratio of each configuration. Every post in every
sample was then classified as either stable or ground collapsed, and the fraction of collapsed
posts (with respect to the total number of 54) calculated for each configuration. Laterally
collapsed posts were not considered. Configurations with more than 5% collapsed posts were
considered to be unstable. For each diameter, the value for the critical aspect ratio was taken as
the mean between that of the highest post size classified as stable and that of the lowest size
classified as unstable. The error was defined as half of the difference between these 2 aspect
ratios. The variability in the determination of these 2 aspect ratios was later added to this error.
6.5 Results
An example of the fabricated PDMS samples containing all the different structures is shown in
Fig. 6.2. Note the grouping of structures in arrays of 9 identical posts (posts in groups of less
than 9 were fabricated for testing purposes and were not part of the study). Each column of
arrays contains posts with the same diameter, but increasing height from bottom to top of the
image. As can be observed, the arrays at the bottom of the image (corresponding to the shortest
posts for each diameter) are composed exclusively of stable posts, whereas arrays further up
(corresponding to higher posts) show collapsed posts. Some posts can also be seen to be adhered
to each other. In some of the samples, some of the posts with the smallest diameters and
intermediate aspect ratios did not replicate properly owing to deterioration of the master and
were not considered.
110

6.5 Results
The critical aspect ratio of PDMS posts in air ranged approximately from 2 to 4 for the studied
sizes, and increased with the diameter (Fig. 6.3). Both the magnitude and the dependency on the
diameter were captured by the ground collapse model when the value given for the work of
adhesion ( mN/m) and the value obtained for Young’s modulus ( MPa) were
used. The specific values for the critical aspect ratio were also captured for the smallest
diameters, while there was a certain overestimation for the highest one (34%). The results in air
44=W 7.1=E
Fig. 6.2 SEM image showing an overview of one of the molded samples in PDMS. Posts grouped in arrays of 9 have the same dimensions. Post diameter increases from right to left, while post height increases from the bottom to the top of the image. Posts in arrays of less than 9 members (left column) were discarded. Inset shows a magnified image of the posts with the smallest diameter.
111

Chapter 6 Stability of microfabricated high aspect ratio structures in PDMS
were also fitted to a power law with the same exponent as the ground collapse model prediction
(2/3). The scaling factor obtained with this fit was close to the prediction before scaling (18%
smaller). When the data were compared to the prediction given by Hui and co-workers (13)
(where only gravity was considered), neither the magnitude nor the diameter dependence of the
critical aspect ratio were captured (Fig. 6.3).
The works of adhesion in ethanol and water were found to be respectively 4 times smaller and 2
times larger than that in air (Table 6.1). These changes resulted in important variations in
stability. For the lowest work of adhesion (ethanol immersion), the posts of all sizes were
observed to be stable, even those that were previously collapsed in air. However, for the highest
work of adhesion (water immersion) all posts sizes were found to be unstable. An example of
this change in stability as a function of adhesion can be seen in Fig. 6.4, which shows images of
one array of posts in ethanol, air and water. Given that, when immersed in ethanol, all posts were
stable, the model prediction for the critical aspect ratio should be above the values of the highest
aspect ratios for each diameter. Conversely, when immersed in water, the model prediction
should be below the values of the lowest aspect ratios for each diameter. This is seen to be the
case if the data are compared to the ground collapse model prediction calculated for the works of
Fig. 6.3 Critical aspect ratios for different diameters. Square points: critical aspect ratios as determined from the experimental data. Solid line: theoretical prediction of the ground collapse model using the measured value for E and the value for W in air given in Table 6.1. Dashed line: Power law fit with the same exponent (2/3) as the ground collapse model. Dash-dotted line: theoretical prediction taking gravity into account as described by Hui et al.(13) (notice the scale break).
112

6.6 Discussion
adhesion of water and ethanol (Fig. 6.4d and e).
6.6 Discussion
The results obtained for the stability of posts showed that, in the micro and submicrometric range,
PDMS posts with a given aspect ratio became more stable as their diameter increased.
Additionally, in this range, the magnitude for the critical aspect ratio was very low as, for the
smallest diameters, posts with aspect ratios as small as 2 were unstable versus ground collapse.
Neither the magnitude nor the dependency on the diameter of the critical aspect ratio were
Fig. 6.4 Effect of the change in the work of adhesion on the stability of the posts. (a, b and c) Optical microscopy images of one array of 2.29 �m wide, 12.1 �m tall posts in ethanol (a), air (b), and water (c) (scale bars indicate 5µm). Stability decreases from (a) to (c), where no posts are stable. (d and e) graphs showing the ground collapse model prediction for ethanol and water, respectively. The points in (d) represent the highest aspect ratios fabricated for each diameter (all found to be stable in ethanol) and in (e) the lowest aspect ratios fabricated for each diameter (all found to be either ground collapsed or adhered to each other in water).
113

Chapter 6 Stability of microfabricated high aspect ratio structures in PDMS
consistent with the prediction obtained if only gravity is taken into account. Indeed, the
gravitational model predicts an inverse dependency of the critical aspect ratio on the diameter,
with quantitative values 2 orders of magnitude above the experimental data presented here. This
indicates that gravity cannot possibly be the main reason for the collapse of the posts. By
contrast, the dependency of stability on adhesion observed in this work shows that adhesion
plays a major role in determining the critical aspect ratio of a structure versus ground collapse.
This finding, combined with previous studies identifying adhesion as the main cause behind a
similar type of instability (lateral collapse) (13; 197; 243), indicates that adhesion can also be
considered to be the main instability factor in ground collapse.
The dependency of the critical aspect ratio on adhesion opens the possibility of improving the
stability of microstructures by reducing the work of adhesion. This, as seen in this study, can be
accomplished by immersing the samples in a liquid, such as the ethanol used here, with good
affinity for PDMS (low contact angle). Another way of diminishing the work of adhesion could
be to coat the surface of PDMS with a product that changes its surface properties. Indeed, silanes
have already been used in molding processes to diminish the adhesion of PDMS to itself (124).
This method could complement the existing techniques to improve stability by raising Young’s
modulus of the material, something that has been used to circumvent the different problems
encountered when attempting microcontact printing with nanometer-scale PDMS structures (250;
251).
For the sake of simplicity and to obtain an analytical expression, some limitations apply to the
model developed in this work. First, the calculation of the strain energy assumes a linear
behavior with small longitudinal deformations ( ). If nonlinearities were present, the
elastic energy (and therefore the critical aspect ratio) would be underestimated by the model, as
the slope of the stress/strain curve for Sylgard 184 PDMS increases when linearity is lost (252)
(at strains >45%). According to the bending shape described by the model, this threshold was
crossed for the two smallest diameters. Second, the expression for the contact length between the
post and the base a is somewhat overestimated as a approaches , which also happens for the
smallest diameters (253). This results in an overestimation of the adhesion energy, and thus an
underestimation of the critical aspect ratio. Further, the actual cone-like shape of the fabricated
posts does not correspond exactly to the perfect cylinders considered in the model. As the
dependence on r is higher for the strain energy than for the adhesion energy, we can expect
cone-like posts with a base radius r to be less stable than the model prediction. The first two
effects should therefore lead to an underestimation of the critical aspect ratio for the two smallest
/d R 1
r
114

6.6 Discussion
diameters, while the conical shape should lead to an overestimation of the critical aspect ratio for
all sizes.
The application of the ground collapse model to the data does show a certain overestimation of
the aspect ratio for the highest diameter, which might indeed be caused by the cone-like shape of
the posts. However, the excellent agreement between the model prediction and the experimental
data observed for the first two diameters indicates that the competing effects applying to the
smaller diameters could cancel out each other. Regardless of these considerations, it should
nevertheless be noted that the inaccuracy in the determination of Young’s modulus itself can
account for all the observed differences, especially if the inaccuracy in the determination of the
spring constant of the cantilever ( ) is taken into account (254). It seems therefore
reasonable to assume that the ground collapse model prediction (Eq. (6.7)) can be used as an
estimate to predict the risk of collapse of a cylindrical post of certain dimensions.
20%∼
The ground collapse model can also be applied to explain the experimental results of previous
works. Biebuyck and co-workers (149) reported that PDMS cylinders with a 1 µm diameter and
an aspect ratio of 6 collapsed. If the value for Young’s modulus of PDMS given in their study is
used (5 MPa), combined with the value for the work of adhesion in Table 6.1, the resulting
critical aspect ratio for 1 µm diameter posts is 7.3, which is reasonably close to their
experimental observation. Tan and co-workers (124) used stable posts of 3 µm diameter and an
aspect ratio of 3.7 in PDMS (E=2.5 MPa) as microcantilevers. Our model correctly predicts their
stability.
Despite its simplicity, the model developed in this study accounted for the main features of
ground collapse. First, the magnitude of the critical aspect ratio as a function of diameter is well
predicted, and close to the values provided by previous works. Further, the trend of increasing
stability with diameter is also accounted for. Finally, the change in stability produced by
differing conditions of adhesions is also properly predicted, as can be seen in Fig. 6.4 after
studying the posts’ behavior when immersed in ethanol and water. Moreover, the fact that all
posts that were collapsed in air recovered their original positions when immersed in ethanol
indicates that their deformations were indeed elastic and not plastic, thus eliminating a possible
concern over the validity of the model for the observed large deformations.
The ground collapse model could be easily extended to structures with cross-sections other than
a circle by changing the value of the moment of inertia and Eq. (6.3). In the case of a rectangular
115

Chapter 6 Stability of microfabricated high aspect ratio structures in PDMS
punch of width and length collapsed along the y direction (with moment of inertia
), Eq. (6.3) would reduce simply to 2
xl yl
3 /12x yI l l= ya l= , as the entire adhered side of the punch is
in contact with the base. Interestingly, the final expression for the critical aspect ratio does not
depend now on and can thus be assimilated to that of a 2-dimensional rectangular plate with
, replacing
yl
xl ly E by 2/(1 )E ν− . When compared to a cylinder with , rectangular
punches have a similar critical aspect ratio in the range studied in this work (diameters from 0.3
to 2 µm) but become more unstable for larger diameters, as the exponent of the dependence of
the critical aspect ratio on width is 1/2 and not 2/3.
xd l=
In many applications, high aspect ratio posts are organized in arrays. In these circumstances,
both ground collapse and lateral collapse can occur. Glassmaker and co-workers (243) developed
a theoretical prediction for the lateral collapse of neighboring cylinders due to adhesion. The
critical aspect ratio ( in this case is / )Lh d
( ) ( )1/12
1/34 31/31/ 2
11 2
32 1L
h kd W
πν
⎛ ⎞⎛ ⎞ ⎛ ⎞⎜ ⎟=⎜ ⎟ ⎜ ⎟⎜ ⎟−⎝ ⎠ ⎝ ⎠⎝ ⎠
E d (6.9)
where is the ratio between the inter-post spacing, s, and the diameter, d. Dividing Eq.
(6.7) by Eq. (6.9) we obtain the ratio between the critical aspect ratios for ground collapse (G)
and lateral collapse (L)
/k s d=
( )( )
1/34 /31/ 2 1/3
3/ 4 33/12 2 1/12
// 3 2 (1 )
G
L
h d Ekh d W
πν
− ⎛ ⎞= ⎜ ⎟− ⎝ ⎠d (6.10)
If we consider a set of neighboring posts and we change their diameters (d) and the spacing
between them proportionally (thus keeping k constant), Eq. (6.10) tells us that, as the diameter
decreases, the critical aspect ratio for ground collapse will become smaller compared to the
critical aspect ratio for lateral collapse. This implies that, for small sizes, posts will tend to
collapse to the ground before adhering to each other, and that ground collapse could thus be the
limiting case when designing such structures. Ground collapse would also be predominant if the
conformability of the material is high. For the structures fabricated in this work, the
theoretical values for both critical aspect ratios were in the same range. This is consistent with
the fact that both phenomena were observed, although ground collapse was predominant.
/W E
The limitations imposed by ground collapse to the design of soft microstructures can have an
116

6.7 Conclusion
impact on applications using high aspect ratio structures in soft polymers. As the size of patterns
diminish in micro- or nanocontact printing, the effect of ground collapse could be observed in
relatively short features, independent of lateral collapse. This limitation should also be taken into
account when designing microcantilever arrays for the sensing of cellular or molecular forces if
attempting to improve the spatial and force resolution of the systems. If the diameter of a PDMS
post or cantilever is reduced to improve the spatial resolution of the array, its aspect ratio must
also be reduced to prevent it from collapsing. Interestingly, this implies that its stiffness will rise
as its size is reduced, becoming thus less suited to sense small forces. For instance, 0.36 µm
diameter posts with an aspect ratio of 2 (on the limit of stability) would have a stiffness of 11
nN/µm, whereas taller posts with lower stiffness would not be stable. This value is not
significantly lower than the stiffness of the 3 µm diameter posts used by Tan et al (124).
6.7 Conclusion
This study shows that ground collapse constitutes another limitation to the design of structures in
soft polymers. This limitation, which has been shown to be caused mainly by adhesion, is more
stringent than previously thought and becomes even more restrictive as sizes are reduced. Indeed,
the critical aspect ratio has been shown to decrease as the diameter of posts is diminished, with
critical aspect ratios for submicrometric structures being as low as 2. While the earlier model
based on gravity has been observed not to adequately predict ground collapse, the model
presented in this work captures the main features of structure stability with regard to ground
collapse. Our ground collapse model could therefore serve as a tool to design applications
involving soft polymers. Some of the problems due to the limitation in aspect ratio could be
alleviated by reducing the work of adhesion by immersion in liquids with high affinity for PDMS
or by surface coating.
117

Chapter 7 Conclusions of the thesis
The general aim of this thesis was to study the role of substrate attachment in cell mechanics,
and to analyze its implications in neutrophils and endothelial cells. In Chapter 4, I examined the
effect of substrate adhesion in neutrophil rheology, and its implications in neutrophil transit,
arrest and transmigration in the vascular microcirculation. In Chapter 5, I studied the relationship
between cell substrate adhesion, mechanics and proliferation in lung HMVEC cells. In Chapter 6,
I dealt with the design rules of the mPAD detectors of the contractile forces that adhered cells
exert to the ECM. Here, I present a summary of the conclusions obtained in each chapter. The
conclusions of the methodological developments of Chapter 3 are not listed separately. Instead,
they are shown with the conclusions of the corresponding experimental work.
Rheology of passive and adhesion-activated neutrophils probed by Atomic
Force Microscopy
1. An AFM procedure was implemented which readily allowed us to measure G*(ω) for
passive and activated neutrophils, for a broad frequency range, and with minimal cell
perturbation.
2. For both adhered and non-adhered cells, G*(ω) increased with frequency as a weak
power law. This behavior conforms to the power law structural damping model but not to
commonly used liquid droplet and Kelvin models.
3. Similarly to the observed effect of different drugs on the rheology of adherent cells, the
stiffening induced by adhesion could be modeled by simply reducing the power law slope.

Chapter 7 Conclusions of the thesis
However, unlike in adherent cells, the effect of cytochalasin D could not be modeled in
the same way.
4. The increase in stiffness with frequency may modulate neutrophil transit, arrest and
transmigration in vascular microcirculation.
Role of mechanics and nuclear volume in cell shape control of proliferation in
single endothelial cells
5. An experimental technique combining FIB, microcontact printing, and AFM was
developed to measure cell viscoelasticity as a function of cell shape.
6. The different shapes given by substrate attachment in endothelial cells profoundly
affected cell mechanics. Cell stiffness showed a dramatic increase with cell spreading and
a marked decrease with cell anisotropy.
7. Proliferation was measured to increase with cell spreading, but was not affected by cell
anisotropy. The effects of cell shape on proliferation and mechanics were thus very
different, suggesting that mechanics does not play a direct role in cell cycle control.
8. Like in the case of proliferation, nuclear volume was measured to increase with cell
spreading, but was not affected by anisotropy. Proliferation and nuclear volume were
found to be closely associated, suggesting a role of nuclear volume in controlling
proliferation and specifically the onset of DNA synthesis in S phase.
9. Increases in nuclear volume could regulate DNA synthesis by decondensing chromatin
and making DNA more readily accessible to the cell replication machinery. Consistently
with this hypothesis, DNA density in nuclei was observed to be strongly associated with
both nuclear volume and cellular proliferation.
120
10. The mechanism of nuclear volume control of proliferation proposed in this work could
help to understand how cell shape controls angiogenesis, embryogenesis, and
morphogenesis in general.
Stability of microfabricated high aspect ratio structures in
Poly(dimethylsiloxane)
11. An FIB technique was implemented which permitted to fabricate microposts in PDMS
with different diameters and heights.
12. Ground collapse constitutes an important limitation to the maximum aspect ratio of
microfabricated structures in soft polymers. This limitation, which has been shown to be
caused mainly by adhesion, is more stringent than previously believed and becomes even
more restrictive as sizes are reduced.
13. While the earlier model based on gravity has been observed not to adequately predict
ground collapse, the model presented in this work captures the main features of structure
stability with regard to ground collapse.
14. Our ground collapse model could therefore serve as a tool to design applications
involving soft polymers.
121


Appendix A Use of Focused Ion Beam technology for AFM cantilever
tip modification
A.1 Introduction
FIB technology is, due to its versatility, an ideal tool for the modification of AFM cantilevers.
Indeed, the ability of FIB to mill surfaces without the use of masks and with a direct interactive
control by the operator makes it a perfect tool for modifying structures with complicated
geometries, such as AFM tips. For this reason, FIB-modified AFM tips have been used since
1992 for a variety of applications (194; 255-257). In the context of the study of cell
viscoelasticity and adhesion with AFM, this technology opens interesting possibilities given the
crucial importance of tip-cell contact geometry when analyzing AFM force-indentation curves
(215). In particular, it is of special interest to obtain needle-like tips with perfectly vertical walls
and ended in a flat section (and thus with cylindrical or cuboidal shapes, for instance). With such
geometry, the contact area between tip and cell is maintained constant regardless of indentation,
resulting in a linear force-indentation relationship. This greatly simplifies the extraction of
mechanical parameters from force-indentation curves, and even eliminates the need to determine
the point of contact between tip and cell. Cylindrical or cuboidal geometries are also particularly
well suited to cell adhesion studies, given that the adhesion area between tip and cell can be
assumed to be that of the flat tip cross section. While the applicability of cylindrical tips to
studies of cell mechanics and adhesion has been discussed in detail in a previous thesis of our
group (185), in this appendix I discuss the process of fabrication of both cylindrical tips (with a
circular cross-section) and cuboidal tips (with a rectangular cross-section). It must be noted that
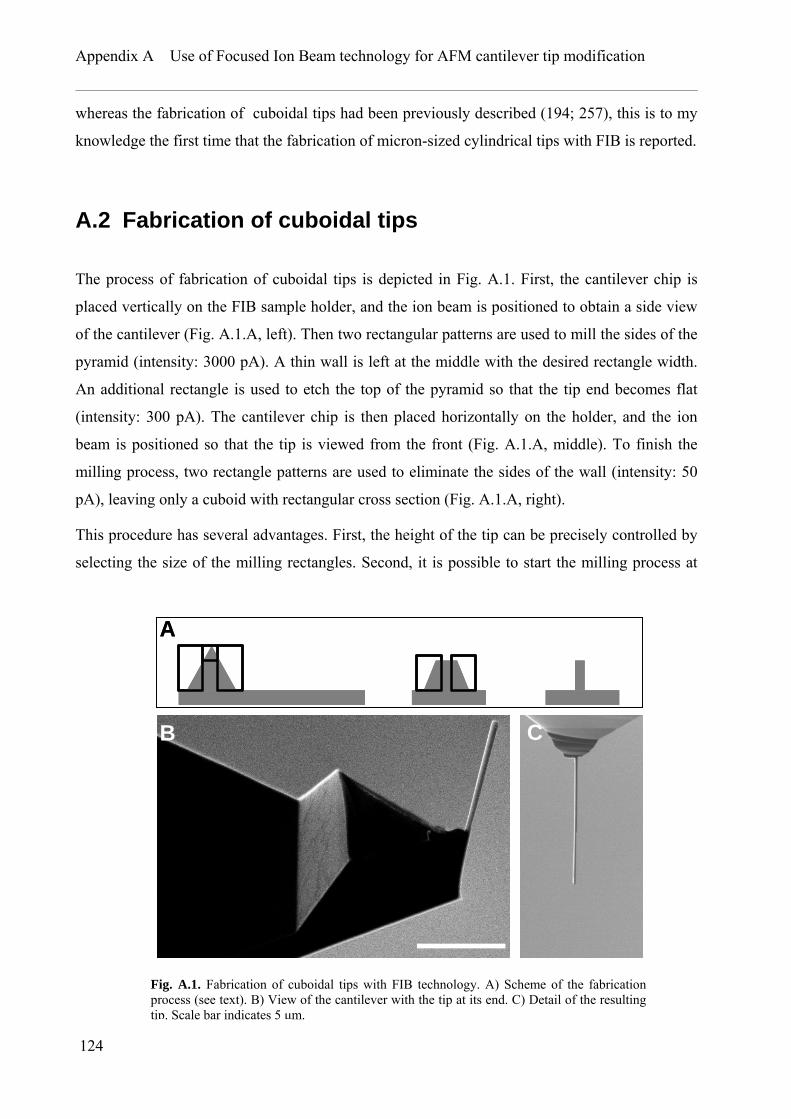
Appendix A Use of Focused Ion Beam technology for AFM cantilever tip modification
whereas the fabrication of cuboidal tips had been previously described (194; 257), this is to my
knowledge the first time that the fabrication of micron-sized cylindrical tips with FIB is reported.
A.2 Fabrication of cuboidal tips
The process of fabrication of cuboidal tips is depicted in Fig. A.1. First, the cantilever chip is
placed vertically on the FIB sample holder, and the ion beam is positioned to obtain a side view
of the cantilever (Fig. A.1.A, left). Then two rectangular patterns are used to mill the sides of the
pyramid (intensity: 3000 pA). A thin wall is left at the middle with the desired rectangle width.
An additional rectangle is used to etch the top of the pyramid so that the tip end becomes flat
(intensity: 300 pA). The cantilever chip is then placed horizontally on the holder, and the ion
beam is positioned so that the tip is viewed from the front (Fig. A.1.A, middle). To finish the
milling process, two rectangle patterns are used to eliminate the sides of the wall (intensity: 50
pA), leaving only a cuboid with rectangular cross section (Fig. A.1.A, right).
This procedure has several advantages. First, the height of the tip can be precisely controlled by
selecting the size of the milling rectangles. Second, it is possible to start the milling process at
A
B C
A
B C
Fig. A.1. Fabrication of cuboidal tips with FIB technology. A) Scheme of the fabrication process (see text). B) View of the cantilever with the tip at its end. C) Detail of the resulting tip. Scale bar indicates 5 µm.
124

A.3 Fabrication of cylindrical tips
high intensities (3000 pA) to eliminate most of the unwanted volume, but to end the etching at
low intensities (300 pA) to ensure that the tip walls will be regular and smooth. This allows to
accurately control the milling and to achieve tip widths below 200 nm. Finally, all regions of the
tip are milled at the same time, resulting in vertical and not tilted walls. However, this process
necessarily results in rectangular and not circular cross section, which might be inadequate for
some applications.
A.3 Fabrication of cylindrical tips
The process of fabrication of cylindrical tips is depicted in Fig. A.2. First, the pyramidal
cantilever tip is milled from above using a ring-like pattern (Fig. A.2.a). This is done for a few
minutes until the pyramid is observed to disappear and only the inner non-milled ring remains
(Fig. A.2.b). Usually, it will be necessary to mill not a perfectly vertical cylinder, but a slightly
tilted one to compensate for the inclination of the AFM cantilever holder. This can be done
simply by slightly tilting the sample with respect to the ion beam. Once the ring pattern is milled,
the cantilever chip, which was placed horizontally on the FIB sample holder, must be placed
vertically (that is, sitting on one of its long edges). In this way, the geometry of the FIB
apparatus allows to place the ion beam completely perpendicular to the cantilever, as in Fig.
A.2.c. Once in this position, the tip end (observed in Fig. A.2.b) is removed with repetitive
passes of a line-like pattern to obtain a flat end.
This process is ideally suited to fabricate tips used in cell adhesion applications. Given the
cylindrical symmetry, the only geometrical parameter to consider when modeling molecular
bonds at the tip-cell interface will be the cylinder radius. However, the process also has certain
limitations. Given that the ring-like pattern is milled from above, it is difficult to determine when
the milling has reached the base of the pyramid. It is thus hard to accurately control the height of
the cylinder. Additionally, the small fluctuations in the ion beam direction result in a certain
milling of the inner ring. As the upper parts of the cylinder are exposed to the beam for longer
than the lower parts, the cylinder walls are etched more in the upper parts. This results in tilted
rather than vertical cylinder walls. Additionally, the fluctuations in ion beam direction make the
fabrication of cylinders with radii smaller than 1 µm unfeasible. This technique is thus applicable
to the fabrication of tips with relatively large radii. For these dimensions, a high beam intensity
of up to 5000 pA can safely be used.
125

Appendix A Use of Focused Ion Beam technology for AFM cantilever tip modification
A.4 Conclusion
FIB can be used to fabricate thin AFM tips with a needle shape and a flat end. If the intended
application of the tip does not require a particular cross-sectional shape, the cuboidal method
allows fabricating tips of precisely controlled dimensions and a rectangular cross section of
widths below 200 nm. If a circular cross-section is required, however, the cylindrical method
must be used, even though it can only be employed to generate tips with radii above 1 µm and
with slightly tilted sidewalls.
Fig. A.2 Fabrication of cylindrical tips with FIB technology. a) Top views of the milling sequence at different steps. The white ring depicted in the first image represents the ring-like milling pattern. Scale bar indicates 10 µm. b) Resulting cylinder before removing the tip end. c) Cylindrical tip. Figure design courtesy of F. Rico.
126

Appendix B Protocol for cell micropatterning on common Petri culture dishes using microcontact
printing
This protocol was used to control the shape of cells cultured on common polystyrene Petri dishes.
It is composed of four main steps: Fabrication of a silicon master with FIB containing a pattern
formed by microwells with given shapes, replication of this master to generate a stamp in PDMS,
use of the PDMS stamp to transfer a layer of fibronectin to a Petri dish, and cell culture.
B.1 Silicon master fabrication
1. Make a drawing of the desired structures (corresponding to cell shapes) with Corel Draw
(or any other design tool, Fig. B.1). The drawing should be in grayscale, with the
structures having a gray level of 100 surrounded by a black square background with a
gray level of 0. Structures should not be located close to the background square border (if
the background square has a length of L, structures should be further away from the
border than 0.15L). As a general thumb rule, structures should be separated by at least 25
µm to prevent cells from adhering to more than one structure at a time. At the same time,
however, structures should not be more separated than about 10 times the final structure
height in the PDMS stamp.

Appendix B Protocol for cell micropatterning on common Petri culture dishes
2. Export the drawing to TIFF format and convert it to str format by using the matlab
program bmp2str.m.
3. Import the .str file with the FIB software. Adjust the magnification of the ion beam so
that the field of view corresponds to the desired size of the background square (L). This
file will tell the ion beam where to mill the substrate and where not to.
4. Using FIB, fabricate the structures in a silicon substrate with a superficial layer of silicon
nitride. To do so, the sample should be milled with the FIB ion beam with an intensity of
20000 pA, creating thus holes with the shape of the structures previously defined. To
calculate the depth of the structures, it must be considered that the milling speed of
silicon at this intensity is of ~ 8000 µm3/h. As mentioned, the separation between
structures cannot be more than 10 times its height or the stamping process will not work.
Fig. B.1 Example of TIFF image used to create a silicon master containing circular and elliptic patterns of different sizes. In this case, the length of the background square was of L= 850 µm.
128
B.2 Obtention of PDMS stamp
B.2 Obtention of PDMS stamp
B.2.1 Stamp fabrication
1. Silanize the silicon master to minimize its adhesion with the stamp. To do so, place 4
drops of tridecafluoro(1,1,2,2)-tetrahydrooctyl (United Chemical Technologies, Bristol,
PA) in a vial or a glass coverslip and place it next to the master in a vacuum chamber (it
can be a simple plastic chamber powered by lab vacuum). Apply vacuum for an hour.
Dispose of the vial/coverslip as chemically contaminated material.
2. Prepare the PDMS prepolymer (Sylgard 184, Dow Corning) in a 10:1 proportion (base:
crosslinker) in weight. Mix thoroughly for 5 minutes (and not less).
3. Pour the liquid PDMS on the master in a Petri dish until the prepolymer makes a layer of
0.5-1 cm. Place the dish in a vacuum chamber until the bubbles disappear (~ 1 h.).
4. Place the Petri dish in an oven at 80 ºC for one hour.
5. Unmold the now solid PDMS from the master being REALLY careful not to break the
master.
B.2.2 Stamp silanization
This step optimizes the subsequent stamping procedure by maximizing stamp hydrophobicity
(see section 3.2.3).
6. Expose the PDMS stamp to oxygen plasma for 1 minute. To do so:
a. Place the stamp in the plasma cleaner (clean room, nanotechnology platform,
Barcelona Science Park).
129
Appendix B Protocol for cell micropatterning on common Petri culture dishes
b. Check that the gas valve (placed in the middle of the tube going down the wall to
the cleaner) is closed.
c. Turn on the vacuum and wait for a few minutes
d. Open the oxygen valve with the cleaner gas valve closed (set to a pressure of 2-3
bar).
e. Open the cleaner gas valve until a noise is heard. Leave for a few minutes and
turn off.
f. Turn on the plasma cleaner power and raise the RF level to low, wait until a violet
light is seen. Open the cleaner gas valve again but only very little so that the
violet light does not disappear.
g. Wait for one minute.
h. Turn off the RF level and then the power.
i. Close the oxygen valve and open the gas valve.
j. Disconnect the vacuum pump.
k. Immediately open the cleaner gas valve.
7. Immediately silanize the stamp as described in step 1, but letting it act overnight.
B.3 Microcontact printing process
1. Sterilize the stamp by autoclaving it. Sterilize as well all the tweezers used to manipulate
the stamp (never touch it with the hands once it’s sterile). All the remaining steps must be
conducted inside the cell culture hood under sterile conditions.
2. Place the stamp with the microstructures facing up in a Petri dish. This Petri dish should
be placed in turn in a larger Petri dish filled with water (about 2 ml).
3. Put a drop of fibronectin (25 µg/ml in PBS, Sigma) on the stamp so that it covers the
130

B.4 Plating of cells
structures, cover the large Petri dish, seal it with parafilm and wait one hour. Having the
stamp in a covered Petri dish with water prevents the fibronectin solution from drying up.
4. Rinse the stamp 3 times with PBS and place it on another Petri dish with the structures
looking up. Dry then the stamp with a nitrogen gun or dry air.
5. Carefully deposit the stamp with structures looking down on a bacteriological Petri dish
(that is, polystyrene NOT treated for cell culture, for example Falcon Petri dishes, BD,
product no: 351008). Be careful to avoid any slipping between Petri dish and stamp.
Apply a little pressure on the stamp until its entire surface is in contact with the substrate.
6. Cover the Petri dish and observe (with an optical microscope or the naked eye) where the
structures are. Make a mark with a pen around the structures to be able to locate the
patterned cells afterwards.
7. Wait for one minute and remove the stamp without any slipping with the Petri dish.
8. Place 1-2 ml of Pluronic F108 solution (BASF) (1% in PBS) on the Petri dish and wait
for an hour. Puronic F108 is hard to find in Europe as it is only sold by BASF in the USA.
The closest European version (Pluronic PE10500) is toxic to cells. Alternatively, Pluronic
F127 can be purchased from Sigma, although I have not tested this product.
9. Rinse 3 times with PBS without letting the Petri dish dry, as Pluronic could de-adsorb.
Leave in PBS until cell plating.
B.4 Plating of cells
1. Plate ~ 700-1000 cells/mm2 of Petri dish surface. A uniform distribution of cells on the
Petri dish must be guaranteed to minimize the number of patterns with either more than
131

Appendix B Protocol for cell micropatterning on common Petri culture dishes
one cell or no cell at all. To achieve that:
a. Place the necessary medium and the tripsinized cells in a falcon tube and vortex
thoroughly.
b. Remove almost all the PBS from the Petri dish (not enough so that it dries up,
though) and pour in the medium with cells.
c. Place the Petri dish in the incubator, wait at least 24 hours and you’re ready for
measurements!
B.5 Matlab source code of bmp2str.m program
[file, fpath]=uigetfile('*.*', 'Choose the bitmap file');
filename=[fpath, file];
[file2, fpath2]=uiputfile('*.*', 'Choose the output stream file');
output=[fpath2, file2];
bmp = double(imread(filename));
objectes = 1; % 1 si volem tractar objecte per objecte i 2 si no
vpn = 2.22E-13; % Volum excavat per nanosegon i picooamper (um3)
I = 20000; % Corrent en picoampers
Xmax = 1200; % mida total del bitmap en um (dir-x)
Ymax = 1200; % mida total del bitmap en um (dir-y)
t = 100; %temps per pixel maxim(ns)
Z = 3; %alçada desitjada (um)
%mides mapa de bits
xmax = 4096;
ymax = 4096;
%ymax = 3536;
dx = size(bmp,2); % no pixels dir x;
dy = size(bmp,1); % no pixels dir y;
vpp = vpn*I*(t); % volum excavat per pixel
hit = vpp/(Xmax*Ymax/(dx*dy)); %alçada excavada per iteracio
nit = 0.01*Z/hit; %Nombre d'iteracions
bmp = bmp.*t/100;
132

B.5 Matlab source code of bmp2str.m program
if (dx-dy) >= 0;
d = dx;
else;
d = dy;
end;
x = round([1:1:dx]*(xmax/d));
y = round([1:1:dy]*(ymax/d));
if objectes == 1;
bw = im2bw(bmp,1);
l = bwlabel(bw,4);
pix = regionprops(l,'PixelList');
za = [];
xa = [];
ya = [];
for i=1:size(pix,1);
ind = (pix(i).PixelList(:,1)-1)*size(bmp,1)+pix(i).PixelList(:,2);
za = [za; bmp(ind)];
xa = [xa; pix(i).PixelList(:,1)];
ya = [ya; pix(i).PixelList(:,2)];
end;
xa = round(xa*(xmax/d));
ya = round(ya*(ymax/d));
arxiu = [za'; xa'; ya'];
else;
arxiu(1,:) = reshape(bmp,1,size(bmp,1)*size(bmp,2));
arxiu(2,:) = reshape(X,1,size(bmp,1)*size(bmp,2));
arxiu(3,:) = reshape(Y,1,size(bmp,1)*size(bmp,2));
end;
ind = find(arxiu(1,:) == 0);
arxiu(:,ind) = [];
%Si hi ha + d'un milio de punts els eliminem
p = size(arxiu,2);
if p >= 1e6;
fora = 1+round(rand(p- 1e6 + 1,1)*(floor(p/(p-1e6+1))-1));
fora = floor(p/(p-1e6+1))*[0:p- 1e6]' + fora;
arxiu(:,fora) = [];
end;
133

Appendix B Protocol for cell micropatterning on common Petri culture dishes
p/size(arxiu,2)-1
figure(10), plot(arxiu(2,:),arxiu(3,:),'.');
fid = fopen(output,'w');
fprintf(fid,'%c\r\n','s');
fprintf(fid,'%4.0f\r\n',nit);
fprintf(fid,'%6.0f\r\n',size(arxiu,2));
fprintf(fid,'%6.0f %6.0f %6.0f\r\n',arxiu);
fclose(fid);
134

Appendix C Publications and conference communications
C.1 Publications
Roca-Cusachs P, Alcaraz J and Navajas D. Role of mechanics and nuclear volume in cell shape control of proliferation in single endothelial cells. (Manuscript in preparation)
Roca-Cusachs P, Almendros I, Sunyer R, Gavara N, Farre R and Navajas D. Rheology of passive and adhesion-activated neutrophils probed by Atomic Force Microscopy. Biophys J 91: 3508-3518, 2006.
Gavara N, Sunyer R, Roca-Cusachs P, Farre R, Rotger M and Navajas D. Thrombin-induced contraction in alveolar epithelial cells probed by traction microscopy. J Appl Physiol 101: 512-520, 2006.
Roca-Cusachs P, Rico F, Martinez E, Toset J, Farre R and Navajas D. Stability of microfabricated high aspect ratio structures in poly(dimethylsiloxane). Langmuir 21: 5542-5548, 2005.
Rico F, Roca-Cusachs P, Gavara N, Farre R, Rotger M and Navajas D. Probing mechanical properties of living cells by atomic force microscopy with blunted pyramidal cantilever tips. Phys Rev E 72: 021914, 2005.
C.2 Conference communications
Roca-Cusachs P, Almendros I, Farre R and Navajas D. Neutrophil microrheology probed by atomic force microscopy. Meeting of the Federation of American Societies for Experimental Biology, San Francisco, CA, USA, 2006.
Roca-Cusachs, P, Alcaraz, J and Navajas, D. Cell spreading and shape differently regulate mechanical properties in microvascular endothelial cells. Biophysical Society meeting, Salt Lake City, UT, USA, 2006.

Appendix C Publications and conference communications
Roca-Cusachs, P. Rheology of human neutrophils probed by Atomic Force Microscopy. Cell biomechanics meeting, Paris, France, 2005.
Rico, F, Roca-Cusachs P and Navajas D. Nanofabrication of cylindrical cantilever tips for probing mechanical properties of biopolymers by atomic force microscopy 2nd NanoSpain Workshop, Barcelona, Spain, 2005
Roca-Cusachs P, Rico F, Martinez E, Toset J, Farre R and Navajas D. Stability of microfabricated high aspect ratio structures in poly(dimethylsiloxane). 2nd NanoSpain Workshop, Barcelona, Spain, 2005.
Roca-Cusachs P, Mills C, Martinez E, Puig F, Samitier J and Navajas D. Fabrication of microneedle arrays via Focused Ion Beam technology for the study of cell adhesion. IV Jornades de recerca en enginyeria biomèdica, Barcelona, Spain, 2004.
136

List of abbreviations
(ds)DNA (double-stranded) Deoxyribonucleic acid
(P)EG (Poly)Ethylene glycol
AFM Atomic force microscope
BrdU Bromodeoxyuridine
CCD Charged coupled device
DIC Differential interference contrast
ECM Extracellular matrix
FIB Focused ion beam
HBSS Hank's balanced salt solution
HMVEC Human microvascular endothelial cells
MEMPAT Membrane based patterning
MLC Myosin light chain
mPAD Microfabricated post-array detector
MSD Mean squared displacement
MTC Magnetic twisting cytometry
PBS Phosphate buffer saline
PDMS Poly(dimethylsiloxane)
RGD Peptide containing the Arg-Gly-Asp aminoacid sequence
SAM Self-assembled monolayer
SEM Scanning electron microscope
SGR Soft glassy rheology


References
1. Tobin AJ and Dusheck J. Asking about life. Brooks Cole, 2004.
2. Ross MH and Pawlina W. Histology: A Text and Atlas. Lippincott Williams and Wilkins, 2006.
3. Dean JA. Lange's Handbook of Chemistry. New York: McGraw-Hill, 1999.
4. Hochmuth RM. Micropipette aspiration of living cells. J Biomech 33: 15-22, 2000.
5. Medalia O, Weber I, Frangakis AS, Nicastro D, Gerisch G and Baumeister W. Macromolecular architecture in eukaryotic cells visualized by cryoelectron tomography. Science 298: 1209-1213, 2002.
6. Bursac P, Lenormand G, Fabry B, Oliver M, Weitz DA, Viasnoff V, Butler JP and Fredberg JJ. Cytoskeletal remodelling and slow dynamics in the living cell. Nat Mater 4: 557-561, 2005.
7. Sniadecki N, Desai RA, Ruiz SA and Chen CS. Nanotechnology for cell-substrate interactions. Ann Biomed Eng 34: 59-74, 2006.
8. Evans E and Yeung A. Apparent Viscosity and Cortical Tension of Blood Granulocytes Determined by Micropipet Aspiration. Biophys J 56: 151-160, 1989.
9. Rico F, Alcaraz J, Fredberg JJ and Navajas D. Nanomechanics of Lung epithelial cells. Int J Nanotechnology 2: 180-194, 2005.
10. Bausch AR, Ziemann F, Boulbitch AA, Jacobson K and Sackmann E. Local measurements of viscoelastic parameters of adherent cell surfaces by magnetic bead microrheometry. Biophys J 75: 2038-2049, 1998.
11. Wang N, Tolic-Norrelykke IM, Chen JX, Mijailovich SM, Butler JP, Fredberg JJ and Stamenovic D. Cell prestress. I. Stiffness and prestress are closely associated in adherent contractile cells. Am J Physiol Cell Physiol 282: C606-C616, 2002.
12. Chen CS, Mrksich M, Huang S, Whitesides GM and Ingber DE. Geometric control of cell life and death. Science 276: 1425-1428, 1997.
13. Hui CY, Jagota A, Lin YY and Kramer EJ. Constraints on microcontact printing

References
imposed by stamp deformation. Langmuir 18: 1394-1407, 2002.
14. Lenormand G, Millet E, Fabry B, Butler JP and Fredberg JJ. Linearity and time-scale invariance of the creep function in living cells. J R Soc Interface 1: 91-97, 2004.
15. Fabry B, Maksym GN, Butler JP, Glogauer M, Navajas D and Fredberg JJ. Scaling the microrheology of living cells. Phys Rev Lett 87: 148102, 2001.
16. Vicente-Manzanares M and Sanchez-Madrid F. Role of the cytoskeleton during leukocyte responses. Nat Rev Immunol 4: 110-122, 2004.
17. Gavara N, Sunyer R, Roca-Cusachs P, Farre R, Rotger M and Navajas D. Thrombin-induced contraction in alveolar epithelial cells probed by traction microscopy. J Appl Physiol 101: 512-520, 2006.
18. Chaudhury MK and Whitesides GM. Direct Measurement of Interfacial Interactions Between Semispherical Lenses and Flat Sheets of Poly(Dimethylsiloxane) and Their Chemical Derivatives. Langmuir 7: 1013-1025, 1991.
19. Dong C, Skalak R, Sung KLP, Schmid-schonbein GW and Chien S. Passive Deformation Analysis of Human-Leukocytes. J Biomech Eng 110: 27-36, 1988.
20. Ingber DE. Mechanical signalling and the cellular response to extracellular matrix in angiogenesis and cardiovascular physiology. Circ Res 91: 877-887, 2002.
21. Lehnert D, Wehrle-Haller B, David C, Weiland U, Ballestrem C, Imhof BA and Bastmeyer M. Cell behaviour on micropatterned substrata: limits of extracellular matrix geometry for spreading and adhesion. J Cell Sci 117: 41-52, 2003.
22. Sung KLP, Dong C, Schmid-schonbein GW, Chien S and Skalak R. Leukocyte Relaxation Properties. Biophys J 54: 331-336, 1988.
23. Aristotle. Generation of Animals . Cambridge, MA: Harvard Univ. Press, 1953.
24. Roca-Cusachs P, Almendros I, Sunyer R, Gavara N, Farre R and Navajas D. Rheology of passive and adhesion-activated neutrophils probed by Atomic Force Microscopy. Biophys J 91: 3508-3518, 2006.
25. Roca-Cusachs P, Rico F, Martinez E, Toset J, Farre R and Navajas D. Stability of microfabricated high aspect ratio structures in poly(dimethylsiloxane). Langmuir 21: 5542-5548, 2005.
26. Alberts B, Bray J, Lewis J, Raff M, Roberts K and Watson JD. Molecular Biology of the Cell. New York: Garland Publishing, 2006.
27. Bray D. Cell movements. From molecules to motility. New York: Garland Publishing, 2001.
28. Fabry B, Maksym GN, Butler JP, Glogauer M, Navajas D, Taback NA, Millet EJ and Fredberg JJ. Time scale and other invariants of integrative mechanical behavior in living cells. Phys Rev E 68: 041914, 2003.
140

References
29. Trepat X, Grabulosa M, Puig F, Maksym GN, Navajas D and Farre R. Viscoelasticity of human alveolar epithelial cells subjected to stretch. Am J Physiol Lung C 287: L1025-L1034, 2004.
30. Trepat X, Grabulosa M, Buscemi L, Rico F, Farre R and Navajas D. Thrombin and histamine induce stiffening of alveolar epithelial cells. J Appl Physiol 98: 1567-1574, 2005.
31. Laudadio RE, Millet EJ, Fabry B, An SS, Butler JP and Fredberg JJ. Rat airway smooth muscle cell during actin modulation: rheology and glassy dynamics. Am J Physiol Cell Physiol 289: C1388-C1395, 2005.
32. Zhelev DV, Needham D and Hochmuth RM. Role of the membrane cortex in neutrophil deformation in small pipets. Biophys J 67: 696-705, 1994.
33. Morris CE and Homann U. Cell surface area regulation and membrane tension. J Membr Biol 179: 79-102, 2001.
34. de Pablo PJ, Schaap IAT, MacKintosh FC and Schmidt CF. Deformation and collapse of microtubules on the nanometer scale. Phys Rev Lett 91: 2003.
35. Stamenovic D. Microtubules may harden or soften cells, depending of the extent of cell distension. J Biomech 38: 1728-1732, 2005.
36. Tsai MA, Waugh RE and Keng PC. Passive mechanical behavior of human neutrophils: Effects of colchicine and paclitaxel. Biophys J 74: 3282-3291, 1998.
37. Stamenovic D, Mijailovich SM, Tolic-Norrelykke IM, Chen JX and Wang N. Cell prestress. II. Contribution of microtubules. Am J Physiol Cell Physiol 282: C617-C624, 2002.
38. Wu ZZ, Zhang G, Long M, Wang HB, Song GB and Cai SX. Comparison of the viscoelastic properties of normal hepatocytes and hepatocellular carcinoma cells under cytoskeletal perturbation. Biorheology 37: 279-290, 2000.
39. Howard J. Mechanics of the motor proteins and the cytoskeleton. Sunderland, MA, USA: Sinauer Associates, 2001.
40. Brown MJ, Hallam JA, Colucci-Guyon E and Shaw S. Rigidity of circulating lymphocytes is primarily conferred by vimentin intermediate filaments. J Immunol 166: 6640-6646, 2001.
41. Wang N and Stamenovic D. Contribution of intermediate filaments to cell stiffness, stiffening, and growth. Am J Physiol Cell Physiol 279: C188-C194, 2000.
42. Wang N and Stamenovic D. Mechanics of vimentin intermediate filaments. J Muscle Res Cell Motil 23: 535-540, 2002.
43. Maniotis AJ, Chen CS and Ingber DE. Demonstration of mechanical connections between integrins cytoskeletal filaments, and nucleoplasm that stabilize nuclear structure. PNAS 94: 849-854, 1997.
141

References
44. Janmey PA, Euteneuer U, Traub P and Schliwa M. Viscoelastic Properties of Vimentin Compared with Other Filamentous Biopolymer Networks. J Cell Biol 113: 155-160, 1991.
45. Ellis RJ and Minton AP. Cell biology - Join the crowd. Nature 425: 27-28, 2003.
46. Yanai M, Butler JP, Suzuki T, Sasaki H and Higuchi H. Regional rheological differences in locomoting neutrophils. Am J Physiol Cell Physiol 287: C603-C611, 2004.
47. Valentine MT, Perlman ZE, Mitchison TJ and Weitz DA. Mechanical properties of Xenopus egg cytoplasmic extracts. Biophys J 88: 680-689, 2005.
48. Schmidschonbein GW, Shih YY and Chien S. Morphometry of Human-Leukocytes. Blood 56: 866-875, 1980.
49. Caille N, Thoumine O, Tardy Y and Meister JJ. Contribution of the nucleus to the mechanical properties of endothelial cells. J Biomech 35: 177-187, 2002.
50. Dahl KN, Engler AJ, Pajerowski JD and Discher DE. Power-law rheology of isolated nuclei with deformation mapping of nuclear substructures. Biophys J 89: 2855-2864, 2005.
51. Hu SH, Chen JX, Butler JP and Wang N. Prestress mediates force propagation into the nucleus. Biochem Biophys Res Commun 329: 423-428, 2005.
52. Sims JR, Karp S and Ingber DF. Altering the Cellular Mechanical Force Balance Results in Integrated Changes in Cell, Cytoskeletal and Nuclear Shape. J Cell Sci 103: 1215-1222, 1992.
53. Fabry B and Fredberg JJ. Remodeling of the airway smooth muscle cell: are we built of glass? Respir Physiol Neuro 137: 109-124, 2003.
54. Worthen GS, Schwab B, Elson EL and Downey GP. Mechanics of Stimulated Neutrophils - Cell Stiffening Induces Retention in Capillaries. Science 245: 183-186, 1989.
55. Rosenbluth MJ, Lam WA and Fletcher DA. Force Microscopy of Non-Adherent Cells: A Comparison of Leukemia Cell Deformability. Biophys J 90: 2994-3003, 2006.
56. Zhang XH, Chen A, De Leon D, Li H, Noiri E, Moy VT and Goligorsky MS. Atomic force microscopy measurement of leukocyte-endothelial interaction. Am J Physiol Heart Circ Physiol 286: H359-H367, 2004.
57. Wojcikiewicz EP, Zhang XH, Chen A and Moy VT. Contributions of molecular binding events and cellular compliance to the modulation of leukocyte adhesion. J Cell Sci 116: 2531-2539, 2003.
58. Petersen NO, Mcconnaughey WB and Elson EL. Dependence of Locally Measured Cellular Deformability on Position on the Cell, Temperature, and Cytochalasin-B. PNAS 79: 5327-5331, 1982.
59. Wang N and Ingber DE. Control of Cytoskeletal Mechanics by Extracellular-Matrix,
142

References
Cell-Shape, and Mechanical Tension. Biophys J 66: 2181-2189, 1994.
60. Desprat N, Richert A, Simeon J and Asnacios A. Creep function of a single living cell. Biophys J 88: 2224-2233, 2005.
61. Thoumine O and Ott A. Time scale dependent viscoelastic and contractile regimes in fibroblasts probed by microplate manipulation. J Cell Sci 110: 2109-2116, 1997.
62. Alcaraz J, Buscemi L, Grabulosa M, Trepat X, Fabry B, Farre R and Navajas D. Microrheology of Human Lung Epithelial Cells Measured by Atomic Force Microscopy. Biophys J 84: 2071-2079, 2003.
63. Hochmuth RM, Tingbeall HP, Beaty BB, Needham D and Tran-Son-Tay R. Viscosity of Passive Human Neutrophils Undergoing Small Deformations. Biophys J 64: 1596-1601, 1993.
64. Needham D and Hochmuth RM. Rapid Flow of Passive Neutrophils Into A 4 Mu-M Pipette and Measurement of Cytoplasmic Viscosity. J Biomech Eng 112: 269-276, 1990.
65. Skalak R, Cheng D and Cheng Z. Passive Deformations and Active Motions of Leukocytes. J Biomech Eng 112: 295-302, 1990.
66. Lipowsky HH, Riedel D and Shi GS. In vivo Mechanical-Properties of Leukocytes During Adhesion to Venular Endothelium. Biorheology 28: 53-64, 1991.
67. Tsai MA, Frank RS and Waugh RE. Passive Mechanical-Behavior of Human Neutrophils - Power-Law Fluid. Biophys J 65: 2078-2088, 1993.
68. Grier DG. A revolution in optical manipulation. Nature 424: 810-816, 2003.
69. Sleep J, Wilson D, Simmons R and Gratzer W. Elasticity of the red cell membrane and its relation to hemolytic disorders: An optical tweezers study. Biophys J 77: 3085-3095, 1999.
70. Liu Y, Sonek GJ, Berns MW and Tromberg BJ. Physiological monitoring of optically trapped cells: Assessing the effects of confinement by 1064-nm laser tweezers using microfluorometry. Biophys J 71: 2158-2167, 1996.
71. Lau AWC, Hoffman BD, Davies A, Crocker JC and Lubensky TC. Microrheology, stress fluctuations, and active behavior of living cells. Phys Rev Lett 91: 2003.
72. Yap B and Kamm RD. Mechanical deformation of neutrophils into narrow channels induces pseudopod projection and changes in biomechanical properties. J Appl Physiol 98: 1930-1939, 2005.
73. Mason TG, Ganesan K, vanZanten JH, Wirtz D and Kuo SC. Particle tracking microrheology of complex fluids. Phys Rev Lett 79: 3282-3285, 1997.
74. Girard KD, Chaney C, Delannoy M, Kuo SC and Robinson DN. Dynacortin contributes to cortical viscoelasticity and helps define the shape changes of cytokinesis. EMBO J 23: 1536-1546, 2004.
143
References
75. Binnig G, Quate CF and Gerber C. Atomic Force Microscope. Phys Rev Lett 56: 930-933, 1986.
76. Tao NJ, Lindsay SM and Lees S. Measuring the Microelastic Properties of Biological-Material. Biophys J 63: 1165-1169, 1992.
77. Butt HJ and Jaschke M. Calculation of Thermal Noise in Atomic-Force Microscopy. Nanotechnology 6: 1-7, 1995.
78. Hutter JL and Bechhoefer J. Calibration of Atomic-Force Microscope Tips. Rev Sci Instrum 64: 1868-1873, 1993.
79. Bilodeau GG. Regular Pyramid Punch Problem. J Appl Mech 59: 519-523, 1992.
80. Johnson KL. Contact Mechanics. Cambridge: Cambridge University Press, 1985.
81. Kasas S and Ikai A. A Method for Anchoring Round Shaped Cells for Atomic-Force Microscope Imaging. Biophys J 68: 1678-1680, 1995.
82. Yeung A and Evans E. Cortical Shell-Liquid Core Model for Passive Flow of Liquid-Like Spherical Cells Into Micropipets. Biophys J 56: 139-149, 1989.
83. Kan HC, Udaykumar HS, Shyy W and Tran-Son-Tay R. Hydrodynamics of a compound drop with application to leukocyte modeling. Phys Fluids 10: 760-774, 1998.
84. Dong C, Skalak R and Sung KLP. Cytoplasmic Rheology of Passive Neutrophils. Biorheology 28: 557-567, 1991.
85. Tran-Son-Tay R, Kan HC, Udaykumar HS, Damay E and Shyy W. Rheological modelling of leukocytes. Med Biol Eng Comput 36: 246-250, 1998.
86. Buxbaum RE, Dennerll T, Weiss S and Heidemann SR. F-Actin and Microtubule Suspensions As Indeterminate Fluids. Science 235: 1511-1514, 1987.
87. Dong C and Skalak R. Leukocyte Deformability - Finite-Element Modeling of Large Viscoelastic Deformation. J Theor Biol 158: 173-193, 1992.
88. Schmidschonbein GW, Sung KLP, Tozeren H, Skalak R and Chien S. Passive Mechanical-Properties of Human-Leukocytes. Biophys J 36: 243-256, 1981.
89. Koay EJ, Shieh AC and Athanasiou KA. Creep indentation of single cells. J Biomech Eng -Trans ASME 125: 334-341, 2003.
90. Jones WR, Ting-Beall HP, Lee GM, Kelley SS, Hochmuth RM and Guilak F. Alterations in the Young's modulus and volumetric properties of chondrocytes isolated from normal and osteoarthritic human cartilage. J Biomech 32: 119-127, 1999.
91. Theret DP, Levesque MJ, Sato M, Nerem RM and Wheeler LT. The Application of A Homogeneous Half-Space Model in the Analysis of Endothelial-Cell Micropipette Measurements. J Biomech Eng -Trans ASME 110: 190-199, 1988.
92. Sollich P. Rheological constitutive equation for a model of soft glassy materials. Phys
144

References
Rev E 58: 738-759, 1998.
93. Gardel ML, Nakamura F, Hartwig JH, Crocker JC, Stossel TP and Weitz DA. Prestressed F-actin networks cross-linked by hinged filamins replicate mechanical properties of cells. PNAS 103: 1762-1767, 2006.
94. Hoffman BD, Massiera G, Van Citters KM and Crocker JC. The consensus mechanics of cultured mammalian cells. PNAS 103: 10259-10264, 2006.
95. Hagios C, Lochter A and Bissell MJ. Tissue architecture: the ultimate regulator of epithelial function? Phylos Trans B 353: 857-870, 1998.
96. Behonick DJ and Werb Z. A bit of give and take: the relationship between the extracellular matrix and the developing chondrocyte. Mech Dev 120: 1327-1336, 2003.
97. Zamir E and Geiger B. Molecular complexity and dynamics of cell-matrix adhesions. J Cell Sci 114: 3583-3590, 2001.
98. Hynes RO. Integrins - Versatility, Modulation, and Signaling in Cell-Adhesion. Cell 69: 11-25, 1992.
99. Zimerman B, Volberg T and Geiger B. Early molecular events in the assembly of the focal adhesion-stress fiber complex during fibroblast spreading. Cell Motil Cytoskeleton 58: 143-159, 2004.
100. Chen CS, Alonso JL, Ostuni E, Whitesides GM and Ingber DE. Cell shape provides global control of focal adhesion assembly. Biochem Biophys Res Commun 307: 355-361, 2003.
101. Katz BZ, Zamir E, Bershadsky A, Kam Z, Yamada KM and Geiger B. Physical state of the extracellular matrix regulates the structure and molecular composition of cell-matrix adhesions. Mol Biol Cell 11: 1047-1060, 2000.
102. Nobes CD and Hall A. Rho, Rac, and Cdc42 Gtpases Regulate the Assembly of Multimolecular Focal Complexes Associated with Actin Stress Fibers, Lamellipodia, and Filopodia. Cell 81: 53-62, 1995.
103. Reinhart-King CA, Dembo M and Hammer DA. The dynamics and mechanics of endothelial cell spreading. Biophys J 89: 676-689, 2005.
104. ChrzanowskaWodnicka M and Burridge K. Rho-stimulated contractility drives the formation of stress fibers and focal adhesions. J Cell Biol 133: 1403-1415, 1996.
105. Galbraith CG, Yamada KM and Sheetz MP. The relationship between force and focal complex development. J Cell Biol 159: 695-705, 2002.
106. Riveline D, Zamir E, Balaban NQ, Schwarz US, Ishizaki T, Narumiya S, Kam Z, Geiger B and Bershadsky AD. Focal contacts as mechanosensors: Externally applied local mechanical force induces growth of focal contacts by an mDia1-dependent and ROCK-independent mechanism. J Cell Biol 153: 1175-1185, 2001.
107. Folkman J and Moscona A. Role of Cell-Shape in Growth-Control. Nature 273: 345-
145

References
349, 1978.
108. Ingber DE. Fibronectin Controls Capillary Endothelial-Cell Growth by Modulating Cell-Shape. PNAS 87: 3579-3583, 1990.
109. Bhatia SN, Yarmush ML and Toner M. Controlling cell interactions by micropatterning in co-cultures: Hepatocytes and 3T3 fibroblasts. J Biomed Mater Res 34: 189-199, 1997.
110. Whitesides GM, Ostuni E, Takayama S, Jiang XY and Ingber DE. Soft lithography in biology and biochemistry. Annu Rev Biomed Eng 3: 335-373, 2001.
111. Tan JL, Liu W, Nelson CM, Raghavan S and Chen CS. Simple approach to micropattern cells on common culture substrates by tuning substrate wettability. Tissue Eng 10: 865-872, 2004.
112. Folch A, Ayon A, Hurtado O, Schmidt MA and Toner M. Molding of deep polydimethylsiloxane microstructures for microfluidics and biological applications. J Biomech Eng -Trans ASME 121: 28-34, 1999.
113. Folch A and Toner M. Cellular micropatterns on biocompatible materials. Biotechnol Prog 14: 388-392, 1998.
114. Ostuni E, Kane R, Chen CS, Ingber DE and Whitesides GM. Patterning mammalian cells using elastomeric membranes. Langmuir 16: 7811-7819, 2000.
115. Wang N, Ostuni E, Whitesides GM and Ingber DE. Micropatterning tractional forces in living cells. Cell Motil Cytoskeleton 52: 97-106, 2002.
116. Nelson CM and Chen CS. VE-cadherin simultaneously stimulates and inhibits cell proliferation by altering cytoskeletal structure and tension. J Cell Sci 116: 3571-3581, 2003.
117. Lee KB, Park SJ, Mirkin CA, Smith JC and Mrksich M. Protein nanoarrays generated by dip-pen nanolithography. Science 295: 1702-1705, 2002.
118. Koo LY, Irvine DJ, Mayes AM, Lauffenburger DA and Griffith LG. Co-regulation of cell adhesion by nanoscale RGD organization and mechanical stimulus. J Cell Sci 115: 1423-1433, 2002.
119. Arnold M, Cavalcanti-Adam EA, Glass R, Blummel J, Eck W, Kantlehner M, Kessler H and Spatz JP. Activation of integrin function by nanopatterned adhesive interfaces. Chemphyschem 5: 383-388, 2004.
120. Gaudet C, Marganski WA, Kim S, Brown CT, Gunderia V, Dembo M and Wong JY. Influence of type I collagen surface density on fibroblast spreading, motility, and contractility. Biophys J 85: 3329-3335, 2003.
121. Butler JP, Tolic-Norrelykke IM, Fabry B and Fredberg JJ. Traction fields, moments, and strain energy that cells exert on their surroundings. Am J Physiol Cell Physiol 282: C595-C605, 2002.
146

References
122. Tolic-Norrelykke IM and Wang N. Traction in smooth muscle cells varies with cell spreading. J Biomech 38: 1405-1412, 2005.
123. Bhadriraju K and Hansen LK. Extracellular matrix- and cytoskeleton-dependent changes in cell shape and stiffness. Exp Cell Res 278: 92-100, 2002.
124. Tan JL, Tien J, Pirone DM, Gray DS, Bhadriraju K and Chen CS. Cells lying on a bed of microneedles: An approach to isolate mechanical force. PNAS 100: 1484-1489, 2003.
125. Peyton SR and Putnam AJ. Extracellular matrix rigidity governs smooth muscle cell motility in a biphasic fashion. J Cell Physiol 204: 198-209, 2005.
126. Lo CM, Wang HB, Dembo M and Wang YL. Cell movement is guided by the rigidity of the substrate. Biophys J 79: 144-152, 2000.
127. Stamenovic D, Liang ZL, Chen JX and Wang N. Effect of the cytoskeletal prestress on the mechanical impedance of cultured airway smooth muscle cells. J Appl Physiol 92: 1443-1450, 2002.
128. Ingber DE. Tensegrity I. Cell structure and hierarchical systems biology. J Cell Sci 116: 1157-1173, 2003.
129. Smith SB, Finzi L and Bustamante C. Direct Mechanical Measurements of the Elasticity of Single Dna-Molecules by Using Magnetic Beads. Science 258: 1122-1126, 1992.
130. Strick TR, Allemand JF, Bensimon D, Bensimon A and Croquette V. The elasticity of a single supercoiled DNA molecule. Science 271: 1835-1837, 1996.
131. Ziemann F, Radler J and Sackmann E. Local Measurements of Viscoelastic Moduli of Entangled Actin Networks Using An Oscillating Magnetic Bead Micro-Rheometer. Biophys J 66: 2210-2216, 1994.
132. Haber C and Wirtz D. Magnetic tweezers for DNA micromanipulation. Rev Sci Instrum 71: 4561-4570, 2000.
133. Keller M, Schilling J and Sackmann E. Oscillatory magnetic bead rheometer for complex fluid microrheometry. Rev Sci Instrum 72: 3626-3634, 2001.
134. Valberg PA and Butler JP. Magnetic Particle Motions Within Living Cells - Physical Theory and Techniques. Biophys J 52: 537-550, 1987.
135. Trepat X, Grabulosa M, Buscemi L, Rico F, Fabry B, Fredberg JJ and Farre R. Oscillatory magnetic tweezers based on ferromagnetic beads and simple coaxial coils. Rev Sci Instrum 74: 4012-4020, 2003.
136. Valberg PA and Albertini DF. Cytoplasmic Motions, Rheology, and Structure Probed by A Novel Magnetic Particle Method. J Cell Biol 101: 130-140, 1985.
137. Wang N, Butler JP and Ingber DE. Mechanotransduction Across the Cell-Surface and Through the Cytoskeleton. Science 260: 1124-1127, 1993.
147

References
138. Puig-de-Morales M, Grabulosa M, Alcaraz J, Mullol J, Maksym GN, Fredberg JJ and Navajas D. Measurement of cell microrheology by magnetic twisting cytometry with frequency domain demodulation. J Appl Physiol 91: 1152-1159, 2001.
139. Mijailovich SM, Kojic M, Zivkovic M, Fabry B and Fredberg JJ. A finite element model of cell deformation during magnetic bead twisting. J Appl Physiol 93: 1429-1436, 2002.
140. Puig-de-Morales M, Millet E, Fabry B, Navajas D, Wang N, Butler JP and Fredberg JJ. Cytoskeletal mechanics in adherent human airway smooth muscle cells: probe specificity and scaling of protein-protein dynamics. Am J Physiol Cell Physiol 287: C643-C654, 2004.
141. Berrios JC, Schroeder MA and Hubmayr RD. Mechanical properties of alveolar epithelial cells in culture. J Appl Physiol 91: 65-73, 2001.
142. Harris AK. Locomotion of tissue cells. Amsterdam: Elsevier, 1973.
143. Harris AK, Wild P and Stopak D. Silicone-Rubber Substrata - New Wrinkle in the Study of Cell Locomotion. Science 208: 177-179, 1980.
144. Chrzanowska-Wodnicka M and Burridge K. Rho-stimulated contractility drives the formation of stress fibers and focal adhesions. J Cell Biol 133: 1403-1415, 1996.
145. Dembo M and Wang YL. Stresses at the cell-to-substrate interface during locomotion of fibroblasts. Biophys J 76: 2307-2316, 1999.
146. Balaban NQ, Schwarz US, Riveline D, Goichberg P, Tzur G, Sabanay I, Mahalu D, Safran S, Bershadsky A, Addadi L and Geiger B. Force and focal adhesion assembly: a close relationship studied using elastic micropatterned substrates. Nat Cell Biol 3: 466-472, 2001.
147. Galbraith CG and Sheetz MP. A micromachined device provides a new bend on fibroblast traction forces. PNAS 94: 9114-9118, 1997.
148. du Roure O, Saez A, Buguin A, Austin RH, Chavrier P, Siberzan P and Ladoux B. Force mapping in epithelial cell migration. PNAS 102: 2390-2395, 2005.
149. Biebuyck HA, Larsen NB, Delamarche E and Michel B. Lithography beyond light: Microcontact printing with monolayer resists. IBM J Res Dev 41: 159-170, 1997.
150. Stamenovic D and Coughlin MF. The role of prestress and architecture of the cytoskeleton and deformability of cytoskeletal filaments in mechanics of adherent cells: a quantitative analysis. J Theor Biol 201: 63-74, 1999.
151. Stamenovic D and Coughlin MF. A quantitative model of cellular elasticity based on tensegrity. J Biomech Eng -Trans ASME 122: 39-43, 2000.
152. Sato M, Theret DP, Wheeler LT, Ohshima N and Nerem RM. Application of the Micropipette Technique to the Measurement of Cultured Porcine Aortic Endothelial-Cell Viscoelastic Properties. J Biomech Eng -Trans ASME 112: 263-268, 1990.
148
References
153. Wang N. Mechanical interactions among cytoskeletal filaments. Hypertension 32: 162-165, 1998.
154. Potard USB, Butler JP and Wang N. Cytoskeletal mechanics in confluent epithelial cells probed through integrins and E-cadherins. Am J Physiol Cell Physiol 41: C1654-C1663, 1997.
155. Gupton SL and Waterman-Storer CM. Spatiotemporal feedback between actomyosin and focal-adhesion systems optimizes rapid cell migration. Cell 125: 1361-1374, 2006.
156. Canadas P, Wendling-Mansuy S and Isabey D. Frequency response of a viscoelastic tensegrity model: Structural rearrangement contribution to cell dynamics. J Biomech Eng -Trans ASME 128: 487-495, 2006.
157. Dike LE, Chen CS, Mrksich M, Tien J, Whitesides GM and Ingber DE. Geometric control of switching between growth, apoptosis, and differentiation during angiogenesis using micropatterned substrates. In Vitro Cell Dev Biol -Anim 35: 441-448, 1999.
158. Thomas CH, Collier JH, Sfeir CS and Healy KE. Engineering gene expression and protein synthesis by modulation of nuclear shape. PNAS 99: 1972-1977, 2002.
159. Parker KK, Brock AL, Brangwynne C, Mannix RJ, Wang N, Ostuni E, Geisse NA, Adams JC, Whitesides GM and Ingber DE. Directional control of lamellipodia extension by constraining cell shape and orienting cell tractional forces. FASEB J 16: 2002.
160. McBeath R, Pirone DM, Nelson CM, Bhadriraju K and Chen CS. Cell shape, cytoskeletal tension, and RhoA regulate stem cell lineage commitment. Dev Cell 6: 483-495, 2004.
161. Thery M, Racine V, Pepin A, Piel M, Chen Y, Sibarita JB and Bornens M. The extracellular matrix guides the orientation of the cell division axis. Nat Cell Biol 7: 947-U29, 2005.
162. Vogel V. Mechanotransduction involving multimodular proteins: Converting force into biochemical signals. Annu Rev Biophys Biomol Struct 35: 459-488, 2006.
163. Khan S and Sheetz MP. Force effects on biochemical kinetics. Annu Rev Biochem 66: 785-805, 1997.
164. Sukharev S and Anishkin A. Mechanosensitive channels: what can we learn from 'simple' model systems? Trends Neurosci 27: 345-351, 2004.
165. Sanchez-Madrid F and del Pozo MA. Leukocyte polarization in cell migration and immune interactions. EMBO J 18: 501-511, 1999.
166. Tees DF and Goetz DJ. Leukocyte adhesion: an exquisite balance of hydrodynamic and Molecular Forces. News Physiol Sci 18 : 186-190, 2003.
167. Doerschuk CM. Mechanisms of leukocyte sequestration in inflamed lungs. Microcirculation 8: 71-88, 2001.
149

References
168. Wang Q, Chiang ET, Lim M, Rogers R, Janmey PA, Shepro D and Doerschuk CM. Changes in the biomechanical properties of neutrophils and endothelial cells during adhesion. Blood 97: 660-668, 2001.
169. Bathe M, Shirai A, Doerschuk CM and Kamm RD. Neutrophil transit times through pulmonary capillaries: The effects of capillary geometry and fMLP-stimulation. Biophys J 83: 1917-1933, 2002.
170. Lien DC, Wagner WW, Capen RL, Haslett C, Hanson WL, Hofmeister SE, Henson PM and Worthen GS. Physiological Neutrophil Sequestration in the Lung - Visual Evidence for Localization in Capillaries. J Appl Physiol 62: 1236-1243, 1987.
171. Risau W and Flamme I. Vasculogenesis. Annu Rev Cell Dev Biol 11: 73-91, 1995.
172. Risau W. Differentiation of Endothelium. FASEB J 9: 926-933, 1995.
173. Hanahan D and Folkman J. Patterns and emerging mechanisms of the angiogenic switch during tumorigenesis. Cell 86: 353-364, 1996.
174. Gimbrone MA, Cotran RS, Folkman J and Leapman SB. Tumor Dormancy In-Vivo by Prevention of Neovascularization. J Exp Med 136: 261-276, 1972.
175. Parangi S, OReilly M, Christofori G, Holmgren L, Grosfeld J, Folkman J and Hanahan D. Antiangiogenic therapy of transgenic mice impairs de novo tumor growth. PNAS 93: 2002-2007, 1996.
176. Holmgren L, Oreilly MS and Folkman J. Dormancy of Micrometastases - Balanced Proliferation and Apoptosis in the Presence of Angiogenesis Suppression. Nat Med 1: 149-153, 1995.
177. Clark ER and Clark EL. Microscopic observations on the growth of blood capillaries in the living mammal. Am J Anat 64: 251-301, 1939.
178. Huang S, Chen CS and Ingber DE. Control of cyclin D1, p27(Kip1), and cell cycle progression in human capillary endothelial cells by cell shape and cytoskeletal tension. Mol Biol Cell 9: 3179-3193, 1998.
179. Nelson CM, Jean RP, Tan JL, Liu WF, Sniadecki NJ, Spector AA and Chen CS. Emergent patterns of growth controlled by multicellular form and mechanics. PNAS 102: 11594-11599, 2005.
180. Ausprunk DH and Folkman J. Migration and Proliferation of Endothelial Cells in Preformed and Newly Formed Blood-Vessels During Tumor Angiogenesis. Microvasc Res 14: 53-65, 1977.
181. Welsh CF, Roovers K, Villanueva J, Liu YQ, Schwartz MA and Assoian RK. Timing of cyclin D1 expression within G1 phase is controlled by Rho. Nat Cell Biol 3: 950-957, 2001.
182. Pirone DM, Liu WF, Ruiz SA, Gao L, Raghavan S, Lemmon CA, Romer LH and Chen CS. An inhibitory role for FAK in regulating proliferation: a link between limited adhesion and RhoA-ROCK signaling. J Cell Biol 174: 277-288, 2006.
150

References
183. Cai S, Pestic-Dragovich L, O'Donnell ME, Wang N, Ingber D, Elson E and De Lanerolle P. Regulation of cytoskeletal mechanics and cell growth by myosin light chain phosphorylation. Am J Physiol Cell Physiol 44: C1349-C1356, 1998.
184. Alcaraz J. Micromechanics of cultured human bronchial epitheilal cells measured with Atomic Force Microscopy (Dissertation). Ph.D. Thesis, Universitat de Barcelona, 2001.
185. Rico F. Study of viscoelasticity and adhesion of human alveolar epithelial cells by atomic force microscopy: The importance of probe geometry. (Dissertation). Ph.D. thesis, Universitat de Barcelona, 2005.
186. Falconnet D, Csucs G, Grandin HM and Textor M. Surface engineering approaches to micropattern surfaces for cell-based assays. Biomaterials 27: 3044-3063, 2006.
187. Chen CS, Mrksich M, Huang S, Whitesides GM and Ingber DE. Micropatterned surfaces for control of cell shape, position, and function. Biotechnol Prog 14: 356-363, 1998.
188. Zilch LW, Husseini GA, Lua YY, Lee MV, Gertsch KR, Cannon BR, Perry RM, Sevy ET, Asplund MC, Woolley AT and Linford MR. Rapid and convenient method for preparing masters for microcontact printing with 1-12 mu m features. Rev Sci Instrum 75: 3065-3067, 2004.
189. Entcheva E and Bien H. Acoustic micromachining of three-dimensional surfaces for biological applications. Lab Chip 5: 179-183, 2005.
190. Seliger RL and Fleming WP. Focused Ion-Beams in Microfabrication. J Appl Phys 45: 1416-1422, 1974.
191. Melngailis J. Focused Ion-Beam Technology and Applications. J Vac Sci Technol B 5: 469-495, 1987.
192. Tseng AA. Recent developments in micromilling using focused ion beam technology. J Micromech Microeng 14: R15-R34, 2004.
193. Fu YQ and Ngoi BKA. Investigation of direct milling of micro-optical elements with continuous relief on a substrate by focused ion beam technology. Opt Eng 39: 3008-3013, 2000.
194. Obataya I, Nakamura C, Han S, Nakamura N and Miyake J. Nanoscale operation of a living cell using an atomic force microscope with a nanoneedle. Nano Lett 5: 27-30, 2005.
195. Fu YQ, Bryan NKA, San OA and Hong LB. Data format transferring for FIB microfabrication. Int J Adv Manuf Technol 16: 600-602, 2000.
196. Picard Y, Adams DP, Vasile MJ and Ritchey MB. Focused ion beam-shaped microtools for ultra-precision machining of cylindrical components. Precis Eng -J Int Soc Precis Eng Nanotechnol 27: 59-69, 2003.
197. Sharp KG, Blackman GS, Glassmaker NJ, Jagota A and Hui CY. Effect of stamp deformation on the quality of microcontact printing: Theory and experiment. Langmuir
151

References
20: 6430-6438, 2004.
198. Bietsch A and Michel B. Conformal contact and pattern stability of stamps used for soft lithography. J Appl Phys 88: 4310-4318, 2000.
199. Delamarche E, Schmid H, Michel B and Biebuyck H. Stability of molded polydimethylsiloxane microstructures. Adv Mater 9: 741-746, 1997.
200. Nelson CM, Pirone DM, Tan JL and Chen CS. Vascular endothelial-cadherin regulates cytoskeletal tension, cell spreading, and focal adhesions stimulating RhoA. Mol Biol Cell 15: 2943-2953, 2004.
201. Bernard A, Delamarche E, Schmid H, Michel B, Bosshard HR and Biebuyck H. Printing patterns of proteins. Langmuir 14: 2225-2229, 1998.
202. James CD, Davis RC, Kam L, Craighead HG, Isaacson M, Turner JN and Shain W. Patterned protein layers on solid substrates by thin stamp microcontact printing. Langmuir 14: 741-744, 1998.
203. Prime KL and Whitesides GM. Self-Assembled Organic Monolayers - Model Systems for Studying Adsorption of Proteins at Surfaces. Science 252: 1164-1167, 1991.
204. Larsen NB, Biebuyck H, Delamarche E and Michel B. Order in microcontact printed self-assembled monolayers. J Am Chem Soc 119: 3017-3026, 1997.
205. Michel B, Bernard A, Bietsch A, Delamarche E, Geissler M, Juncker D, Kind H, Renault JP, Rothuizen H, Schmid H, Schmidt-Winkel P, Stutz R and Wolf H. Printing meets lithography: Soft approaches to high-resolution printing. IBM J Res Dev 45: 697-719, 2001.
206. Ostuni E, Chapman RG, Liang MN, Meluleni G, Pier G, Ingber DE and Whitesides GM. Self-assembled monolayers that resist the adsorption of proteins and the adhesion of bacterial and mammalian cells. Langmuir 17: 6336-6343, 2001.
207. Mcgurk SL, Green RJ, Sanders GHW, Davies MC, Roberts CJ, Tendler SJB and Williams PM. Molecular interactions of biomolecules with surface-engineered interfaces using atomic force microscopy and surface plasmon resonance. Langmuir 15: 5136-5140, 1999.
208. Tan JL, Tien J and Chen CS. Microcontact printing of proteins on mixed self-assembled monolayers. Langmuir 18: 519-523, 2002.
209. Doerschuk CM, Beyers N, Coxson HO, Wiggs B and Hogg JC. Comparison of Neutrophil and Capillary Diameters and Their Relation to Neutrophil Sequestration in the Lung. J Appl Physiol 74: 3040-3045, 1993.
210. Spillmann CM, Lomakina E and Waugh RE. Neutrophil adhesive contact dependence on impingement force. Biophys J 87: 4237-4245, 2004.
211. Dong C and Lei XX. Biomechanics of cell rolling: shear flow, cell-surface adhesion, and cell deformability. J Biomech 33: 35-43, 2000.
152

References
212. Yap B and Kamm RD. Cytoskeletal remodeling and cellular activation during deformation of neutrophils into narrow channels. J Appl Physiol 99: 2323-2330, 2005.
213. Zhou Y, Doerschuk CM, Anderson JM and Marchant RE. Biomaterial surface-dependent neutrophil mobility. J Biomed Mater Res A 69A: 611-620, 2004.
214. Russo-Carbolante EMS, Azzolini AECS, Polizello AMC and Lucisano-Valim YM. Comparative study of four isolation procedures to obtain rat neutrophils. Comp Clin Pathol 441: 71-76, 2002.
215. Rico F, Roca-Cusachs P, Gavara N, Farre R, Rotger M and Navajas D. Probing mechanical properties of living cells by atomic force microscopy with blunted pyramidal cantilever tips. Phys Rev E 72: 021914, 2005.
216. Alcaraz J, Buscemi L, Puig-de-Morales M, Colchero J, Baro A and Navajas D. Correction of microrheological measurements of soft samples with atomic force microscopy for the hydrodynamic drag on the cantilever. Langmuir 18: 716-721, 2002.
217. Fung YC. Biomechanics. New York: Springer-Verlag, 1993.
218. Lomakina EB, Spillmann CM, King MR and Waugh RE. Rheological analysis and measurement of neutrophil indentation. Biophys J 87: 4246-4258, 2004.
219. Mahaffy RE, Park S, Gerde E, Kas J and Shih CK. Quantitative analysis of the viscoelastic properties of thin regions of fibroblasts using atomic force microscopy. Biophys J 86: 1777-1793, 2004.
220. Mahaffy RE, Shih CK, MacKintosh FC and Käs J. Scanning Probe-Based Frequency-Dependent Microrheology of Polymer Gels and Biological Cells. Phys Rev Lett 85: 880-883, 2000.
221. Stewart M and Hogg N. Regulation of leukocyte integrin function: Affinity vs avidity. J Cell Biochem 61: 554-561, 1996.
222. Luscinskas FW, Kansas GS, Ding H, Pizcueta P, Schleiffenbaum BE, Tedder TF and Gimbrone MA. Monocyte Rolling, Arrest and Spreading on Il-4-Activated Vascular Endothelium Under Flow Is Mediated Via Sequential Action of L-Selectin, Beta(1)-Integrins, and Beta(2)-Integrins. J Cell Biol 125: 1417-1427, 1994.
223. Sen S, Subramanian S and Discher DE. Indentation and Adhesive Probing of a Cell Membrane with AFM: Theoretical Model and Experiments. Biophys J 89: 3203-3213, 2005.
224. Tran-Son-Tay R, Kirk TF, Zhelev DV and Hochmuth RM. Numerical-Simulation of the Flow of Highly Viscous Drops Down A Tapered Tube. J Biomech Eng 116: 172-177, 1994.
225. Aoki T, Suzuki Y, Nishio K, Suzuki K, Miyata A, Iigou Y, Serizawa H, Tsumura H, Ishimura Y, Suematsu M and Yamaguchi K. Role of CD18-ICAM-1 in the entrapment of stimulated leukocytes in alveolar capillaries of perfused rat lungs. Am J Physiol Heart Circ Physiol 273: H2361-H2371, 1997.
153

References
226. Moore KA, Polte T, Huang S, Shi B, Alsberg E, Sunday ME and Ingber DE. Control of basement membrane remodeling and epithelial branching morphogenesis in embryonic lung by Rho and cytoskeletal tension. Dev Dyn 232: 268-281, 2005.
227. Polte TR, Eichler GS, Wang N and Ingber DE. Extracellular matrix controls myosin light chain phosphorylation and cell contractility through modulation of cell shape and cytoskeletal prestress. Am J Physiol Cell Physiol 286: C518-C528, 2004.
228. Lelievre SA, Weaver VM, Nickerson JA, Larabell CA, Bhaumik A, Petersen OW and Bissell MJ. Tissue phenotype depends on reciprocal interactions between the extracellular matrix and the structural organization of the nucleus. PNAS 95: 14711-14716, 1998.
229. Yang L, Guan TL and Gerace L. Lamin-binding fragment of LAP2 inhibits increase in nuclear volume during the cell cycle and progression into S phase. J Cell Biol 139: 1077-1087, 1997.
230. Kubinova L, Janacek J, Guilak F and Opatrny Z. Comparison of several digital and stereological methods for estimating surface area and volume of cells studied by confocal microscopy. Cytometry 36: 85-95, 1999.
231. Lang F, Busch GL, Ritter M, Volkl H, Waldegger S, Gulbins E and Haussinger D. Functional significance of cell volume regulatory mechanisms. Physiol Rev 78: 247-306, 1998.
232. Wakatsuki T, Wysolmerski RB and Elson EL. Mechanics of cell spreading: role of myosin II. J Cell Sci 116: 1617-1625, 2003.
233. Omelchenko T, Vasiliev JM, Gelfand IM, Feder HH and Bonder EM. Mechanisms of polarization of the shape of fibroblasts and epitheliocytes: Separation of the roles of microtubules and Rho-dependent actin-myosin contractility. PNAS 99: 10452-10457, 2002.
234. Swanson JA, Lee M and Knapp PE. Cellular Dimensions Affecting the Nucleocytoplasmic Volume Ratio. J Cell Biol 115: 941-948, 1991.
235. Umen JG. The elusive sizer. Curr Opin Cell Biol 17: 435-441, 2005.
236. Vergani L, Grattarola M and Nicolini C. Modifications of chromatin structure and gene expression following induced alterations of cellular shape. Int J Biochem Cell Biol 36: 1447-1461, 2004.
237. Alcaraz J, Nelson CM and Bissell MJ. Biomechanical approaches for studying integration of tissue structure and function in mammary epithelia. J Mammary Gland Biol Neoplasia 9: 361-374, 2004.
238. Ingber DE. Mechanical control of tissue growth: Function follows form. PNAS 102: 11571-11572, 2005.
239. Pienta KJ and Coffey DS. Nuclear-Cytoskeletal Interactions - Evidence for Physical Connections Between the Nucleus and Cell Periphery and Their Alteration by
154

References
Transformation. J Cell Biochem 49: 357-365, 1992.
240. Yan L, Huck WTS and Whitesides GM. Self-assembled monolayers (SAMS) and synthesis of planar micro- and nanostructures. J Macromol Sci Polym Rev C44: 175-206, 2004.
241. McDonald JC and Whitesides GM. Poly(dimethylsiloxane) as a material for fabricating microfluidic devices. Acc Chem Res 35: 491-499, 2002.
242. Park TH and Shuler ML. Integration of cell culture and microfabrication technology. Biotechnol Prog 19: 243-253, 2003.
243. Glassmaker NJ, Jagota A, Hui CY and Kim J. Design of biomimetic fibrillar interfaces: 1. Making contact. J R Soc Interface 1: 23-33, 2004.
244. Mata A, Boehm C, Fleischman AJ, Muschler G and Roy S. Growth of connective tissue progenitor cells on microtextured polydimethylsiloxane surfaces. J Biomed Mater Res 62: 499-506, 2002.
245. McAllister DV, Wang PM, Davis SP, Park JH, Canatella PJ, Allen MG and Prausnitz MR. Microfabricated needles for transdermal delivery of macromolecules and nanoparticles: Fabrication methods and transport studies. PNAS 100: 13755-13760, 2003.
246. Trimmer WSN. Microrobots and Micromechanical Systems. Sensor Actuat 19: 267-287, 1989.
247. Archer RR, Cook NH, Crandall SH, Dahl NC, McClintock FA, RAbinowicz E and Reichenbach GS. An introduction to the mechanics of solids. New York : McGraw-Hill, 1959.
248. Chaudhury MK, Weaver T, Hui CY and Kramer EJ. Adhesive contact of cylindrical lens and a flat sheet. J Appl Phys 80: 30-37, 1996.
249. Israelachvili J. Intermolecular & surface forces. London: Academic Press, 1985.
250. Schmid H and Michel B. Siloxane polymers for high-resolution, high-accuracy soft lithography. Macromolecules 33: 3042-3049, 2000.
251. Odom TW, Love JC, Wolfe DB, Paul KE and Whitesides GM. Improved pattern transfer in soft lithography using composite stamps. Langmuir 18: 5314-5320, 2002.
252. Choi KM and Rogers JA. A photocurable poly(dimethylsiloxane) chemistry designed for soft lithographic molding and printing in the nanometer regime. Journal of the American Chemical Society 125: 4060-4061, 2003.
253. Hui CY, Lin YY, Baney JM and Jagota A. The accuracy of the geometric assumptions in the JKR (Johnson-Kendall-Roberts) theory of adhesion. J Adhes Sci Technol 14: 1297-1319, 2000.
254. Burnham NA, Chen X, Hodges CS, Matei GA, Thoreson EJ, Roberts CJ, Davis MC and Tendler SJB. Comparison of calibration methods for atomic-force microscopy cantilevers. Nanotechnology 14: 1-6, 2003.
155

References
255. Ximen HY and Russell PE. Microfabrication of Afm Tips Using Focused Ion and Electron-Beam Techniques. Ultramicroscopy 42: 1526-1532, 1992.
256. Menozzi C, Gazzadi GC, Alessandrini A and Facci P. Focused ion beam-nanomachined probes for improved electric force microscopy. Ultramicroscopy 104: 220-225, 2005.
257. Obataya F, Nakamura C, Han SW, Nakamura N and Miyake J. Mechanical sensing of the penetration of various nanoneedles into a living cell using atomic force microscopy. Biosens Bioelectron 20: 1652-1655, 2005.
Señores y señoras, esto ha sido todo por esta noche.
Y recuerden que la próxima semana
Quizás (y digo quizás) contaremos con la presencia de Rigoberta Menchú.
Querido público, hasta otra
Jimmy Puertas, a “La ruleta russa”
(Tantaquanta teatre)
156