Role of Second Generation Tyrosine Kinase Inhibitors in...
33
GIUSEPPE SAGLIO, MD University of Torino, Italy Role of Second Generation Tyrosine Kinase Inhibitors in Newly Diagnosed CML
Transcript of Role of Second Generation Tyrosine Kinase Inhibitors in...

GIUSEPPE SAGLIO, MD University of Torino, Italy
Role of Second Generation Tyrosine Kinase Inhibitors in Newly Diagnosed CML

48% in CCyR on IM
29% in CCyR w/o IM
7% alive but not in CCyR
94%
84%
77%
48%
10% death from CML 6% death non CML
Outcome in 282 Patients Treated with Imatinib First Line in Hammersmith Hospital
De Lavalade et al. JCO 2008 Jul 10;26(20):3358-63.

Chronic Phase Acc./Blastic Phase
In the natural history of the disease, progression would occur in almost 100% of the cases
in rather short median time (3-4 years)
CML: Progression

Survival of Patients after Progression Is Still Very Poor. Prevention of Progression Is the Goal of Therapy
% A
live
100
90
80
70
60
50
40
30
20
10
0
0 6 12 18 24 30 36 42 48
Median survival ~10.5 months
ENESTnd IRIS
Months Since Progression
Saglio et al. Blood. 2011;118(21):208-209 [abstract 452].

Number of Leukaemic cells
Propensity to progress
IRIS 8-Year Update: Majority of Events Occur Early
Year
% w
ith e
vent
Event Loss of CHR, Loss of MCyR,
AP/BP, Death during treatment
AP/BP
3.3
7.5
4.8
1.7
0.8 0.3
1.4 1.7 1.5
2.8
1.8
0.9 0.5
0 0 0 0
1
2
3
4
5
6
7
8
1 2 3 4 5 6 7 8
Hughes et al; Blood 2010 116:3758-3765. Deininger M, et al. ASH 2009; 114: Poster #1126.
Registered TKIs in first-line CML treatment
Imatinib 400 mg
Nilotinib 300 mg BID
Dasatinib 100 mg QD

ENESTnd: Study Design
3 years follow-up report at ASH 2011
*Stratification by Sokal risk score
Imatinib 400 mg QD (n = 283)
Nilotinib 300 mg BID (n = 282) R A N DO M I Z ED *
Nilotinib 400 mg BID (n = 281) • N = 846 • 217 centers • 35 countries
Follow-up 5 years
Saglio et al. Blood. 2011;118(21):208-209 [abstract 452].
ENESTnd 3-Year Update

Data cut-off: 27Jul2011.
% W
ith M
MR
33
Months Since Randomization
73%, P < .0001
70%, P < .0001
53%
By 3 Years
100
90
80
70
60
50
40
30
20
10
0 0 3 6 9 12 15 18 21 24 27 30
55%, P < .0001
51%, P < .0001
27%
By 1 Year
Nilotinib 300 mg BID Nilotinib 400 mg BID Imatinib 400 mg QD
282 281 283
n
36
By 2 Years
71%, P < .0001
67%, P < .0001
44%
3-5% of patients across treatment arms lost MMR All nilotinib pts who remained on study after loss of MMR regained MMR
ENESTnd: Cumulative Incidence of MMR
Δ 24%-28%
Δ 17%-20%
Saglio et al. Blood. 2011;118(21):208-209 [abstract 452].
ENESTnd 3-Year Update

ENESTnd: MMR by 3 Years According to Sokal Risk
77 756763
54
39
01020304050607080
Low Intermediate HighNilotinib 300 mg BID Imatinib 400 mg QD
% W
ith M
MR
n = 103 104 101 101 78 78
• Rates of MMR were consistently higher in patients treated with nilotinib vs imatinib across Low, Intermediate, or High Sokal risk scores
P = .0264 P = .0020 P = .0004
Saglio et al. Blood. 2011;118(21):208-209 [abstract 452]. Data cut-off: 27Jul2011.
ENESTnd 3-Year Update

Nilotinib 300 mg BID Nilotinib 400 mg BID Imatinib 400 mg QD
282 281 283
n
* Equivalent to BCR-ABL transcript levels of ≤ 0.0032% (IS).
% W
ith C
MR
4.5
40
30
20
10
0
0 3 6 9 12 15 18 21 24 27 30 33
11%, P < .0001
7%, P < .0001
1%
By 1 Year
Δ 6%-10%
36
32%, P < .0001
28%, P = .0003
15%
By 3 Years
Δ 13%-17%
Months Since Randomization
ENESTnd: Cumulative Incidence of MR4.5*
Saglio et al. Blood. 2011;118(21):208-209 [abstract 452]. Data cut-off: 27Jul2011.
ENESTnd 3-Year Update

ENESTnd 3 Year Update: Progression to AP/BC* on Core Treatment
Num
ber o
f Pat
ient
s, n
Including Clonal Evolution
2 3
12
0.7% 0.7% 1.1% 4.2% 1.8% 6.0%
2 5
17 P = .0059
P = .0185
P = .0003
P = .0085
• No new progressions occurred on core treatment since the 2-year analysis
Nilotinib 300 mg BID Nilotinib 400 mg BID Imatinib 400 mg QD
* Progression to AP/BC or death following progression.
Saglio et al. Blood. 2011;118(21):208-209 [abstract 452]. Data cut-off: 27Jul2011.
ENESTnd 3-Year Update

Ph-mut Ph-mut
Ph-mut Ph-mut
Ph-mut
Ph+
Ph+ Ph+ Ph+
Ph+ Ph+
Ph+
Ph+
Ph+
Ph+ Ph+ Ph+
Ph+ Ph+
Ph+
Ph+ Ph+
Ph+ Ph+ Ph+
Ph+ Ph+
Ph+
Ph+ Ph+
Ph+ Ph+ Ph+
Ph+ Ph+
Ph+
Ph+
Ph+
Ph+ Ph+ Ph+
Ph+ Ph+
Ph+
Ph+
Ph+
Ph+ Ph+ Ph+
Ph+ Ph+
Ph+
Ph+
Ph+
Ph+ Ph+ Ph+
Ph+ Ph+
Ph+
Ph+
Ph+
Ph+ Ph+ Ph+
Ph+ Ph+
Ph+
Ph+
Ph+
Ph+ Ph+
Ph+ Ph+
Ph+
Ph+ Ph+ Ph+
Ph+ Ph+
Ph+
Ph+
Ph+
Ph+ Ph+ Ph+
Ph+ Ph+
Ph+
Ph+
Ph+
Ph+ Ph+ Ph+
Ph+ Ph+
Ph+
Ph+
Ph
Ph
Imatinib Nilotinib
What Is the Nature of the Residual Population? Different with Different TKIs?

Progression to AP/BC According to Sokal Risk
14
Total Nilotinib
300 mg BID n = 282
Nilotinib 400 mg BID
n = 281
Imatinib n = 283
Progression to AP/BC, n 17 2 3 12 By Sokal Risk, n Low Intermediate High
1
10 6
0 1 1
1 1 1
0 8 4
Data cut-off: 27Jul2011.
Regardless of treatment, the majority of progressions occurred in patients with intermediate or high Sokal risk scores
Hughes TP, et al. Blood. 2011;118(21):1184-1185 [abstract 2755].
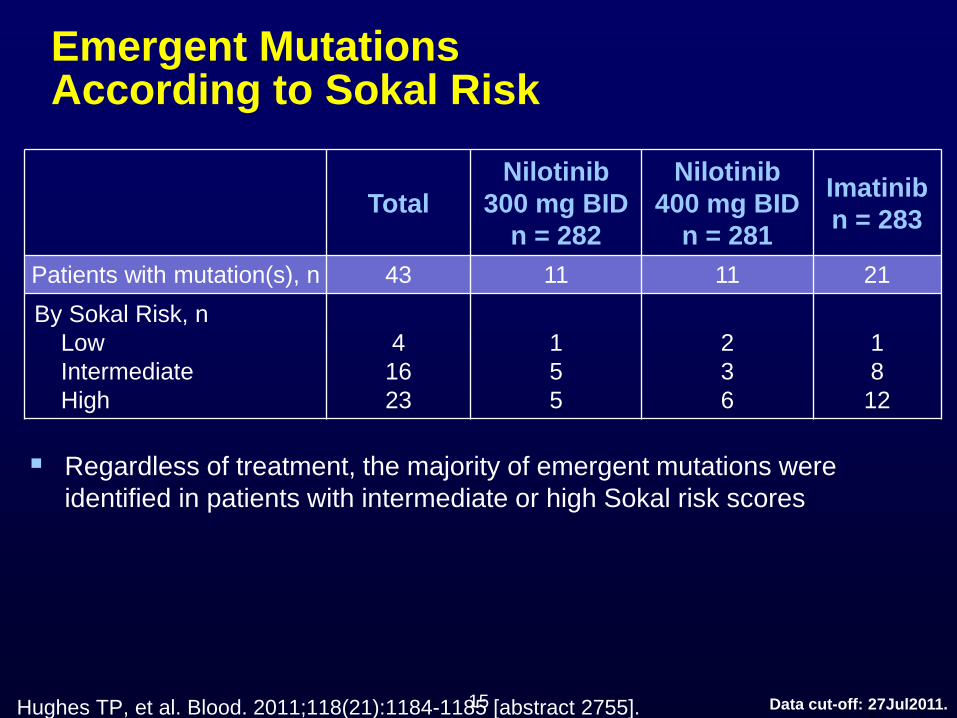
Emergent Mutations According to Sokal Risk
15
Total Nilotinib
300 mg BID n = 282
Nilotinib 400 mg BID
n = 281
Imatinib n = 283
Patients with mutation(s), n 43 11 11 21 By Sokal Risk, n Low Intermediate High
4
16 23
1 5 5
2 3 6
1 8
12
Data cut-off: 27Jul2011.
Regardless of treatment, the majority of emergent mutations were identified in patients with intermediate or high Sokal risk scores
Hughes TP, et al. Blood. 2011;118(21):1184-1185 [abstract 2755].
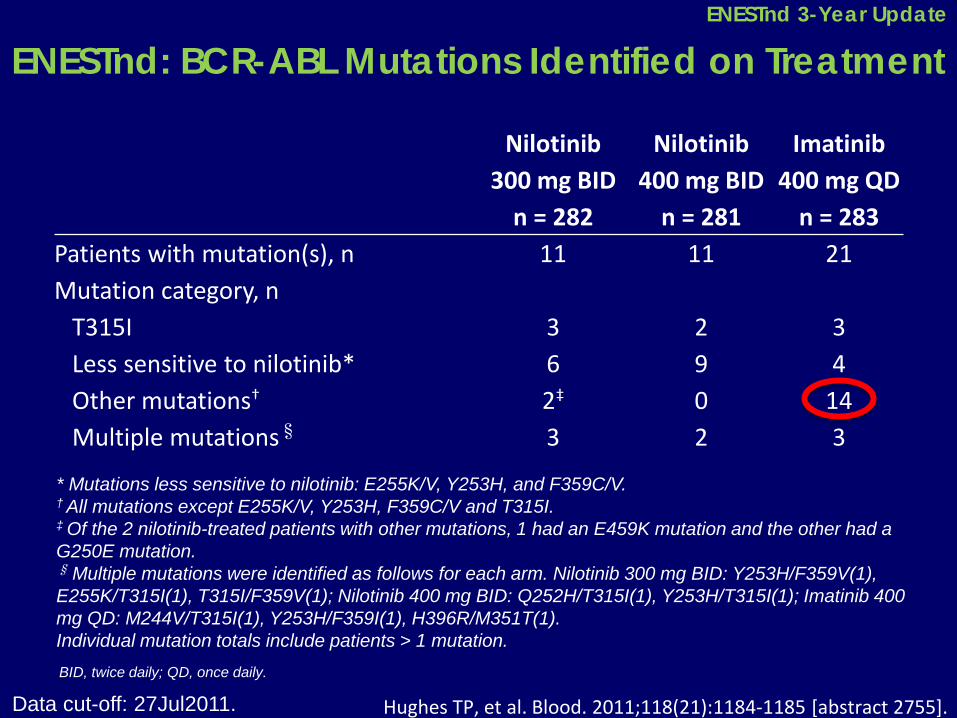
ENESTnd: BCR-ABL Mutations Identified on Treatment
Nilotinib 300 mg BID
n = 282
Nilotinib 400 mg BID
n = 281
Imatinib 400 mg QD
n = 283 Patients with mutation(s), n 11 11 21 Mutation category, n T315I 3 2 3 Less sensitive to nilotinib* 6 9 4 Other mutations† 2‡ 0 14 Multiple mutations§ 3 2 3
BID, twice daily; QD, once daily.
* Mutations less sensitive to nilotinib: E255K/V, Y253H, and F359C/V. † All mutations except E255K/V, Y253H, F359C/V and T315I. ‡ Of the 2 nilotinib-treated patients with other mutations, 1 had an E459K mutation and the other had a G250E mutation. § Multiple mutations were identified as follows for each arm. Nilotinib 300 mg BID: Y253H/F359V(1), E255K/T315I(1), T315I/F359V(1); Nilotinib 400 mg BID: Q252H/T315I(1), Y253H/T315I(1); Imatinib 400 mg QD: M244V/T315I(1), Y253H/F359I(1), H396R/M351T(1). Individual mutation totals include patients > 1 mutation.
Hughes TP, et al. Blood. 2011;118(21):1184-1185 [abstract 2755]. Data cut-off: 27Jul2011.
ENESTnd 3-Year Update

ENESTnd: Progression to AP/BC: Including Events After Discontinuation (ITT)*
0
5
10
15
20
25
Num
ber o
f Pat
ient
s, n
On Core Treatment and After Discontinuation
Nilotinib 300 mg BID Nilotinib 400 mg BID Imatinib 400 mg QD
9 6
19 P = .0496
P = .0076
Off treatment progression information was prospectively collected for all patients every 3 months after discontinuation
*Progression to AP/BC or CML-related death.
After Discontinuation
2 3
12 7 3
7
HR=0.5 [0.2, 1.0] HR = 0.3 [0.1, 0.8]
Saglio et al. Blood. 2011;118(21):208-209 [abstract 452]. Data cut-off: 27Jul2011.
ENESTnd 3-Year Update

% A
live
100
90
80
70
60
50
40
30
20
10
0 0 6 12 18 24 30 36 42 48
Median survival ~10.5 months
Months Since Progression
Progressed = 34 Died = 23 Alive = 11
Data cut-off: 27Jul2011.
Survival After Progression to AP/BC (ENESTnd)
Saglio et al. Blood. 2011;118(21):208-209 [abstract 452].
ENESTnd 3-Year Update

Survival After Progression to AP/BC (ENESTnd and IRIS)
% A
live
100
90
80
70
60
50
40
30
20
10
0 0 6 12 18 24 30 36 42 48
Median survival ~10.5 months
ENESTnd IRIS
Months Since Progression
Data cut-off: 27Jul2011. Clark RE, et al. Haematologica. 2012;97(s1):237 [abstract 0583].
ENESTnd 3-Year Update
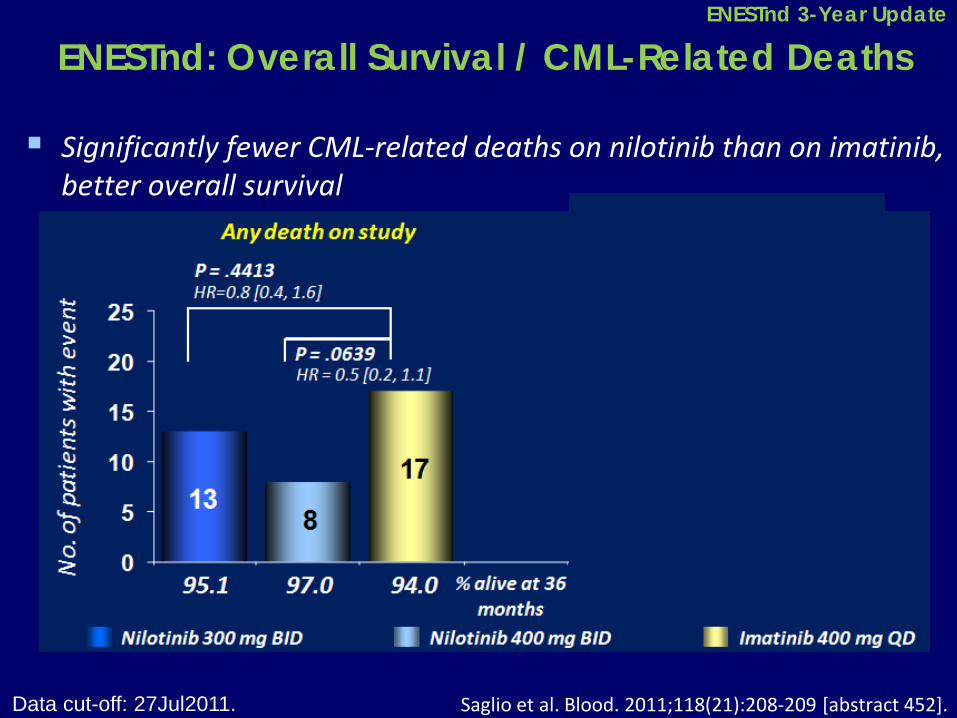
ENESTnd: Overall Survival / CML-Related Deaths
Significantly fewer CML-related deaths on nilotinib than on imatinib, better overall survival
Saglio et al. Blood. 2011;118(21):208-209 [abstract 452]. Data cut-off: 27Jul2011.
ENESTnd 3-Year Update
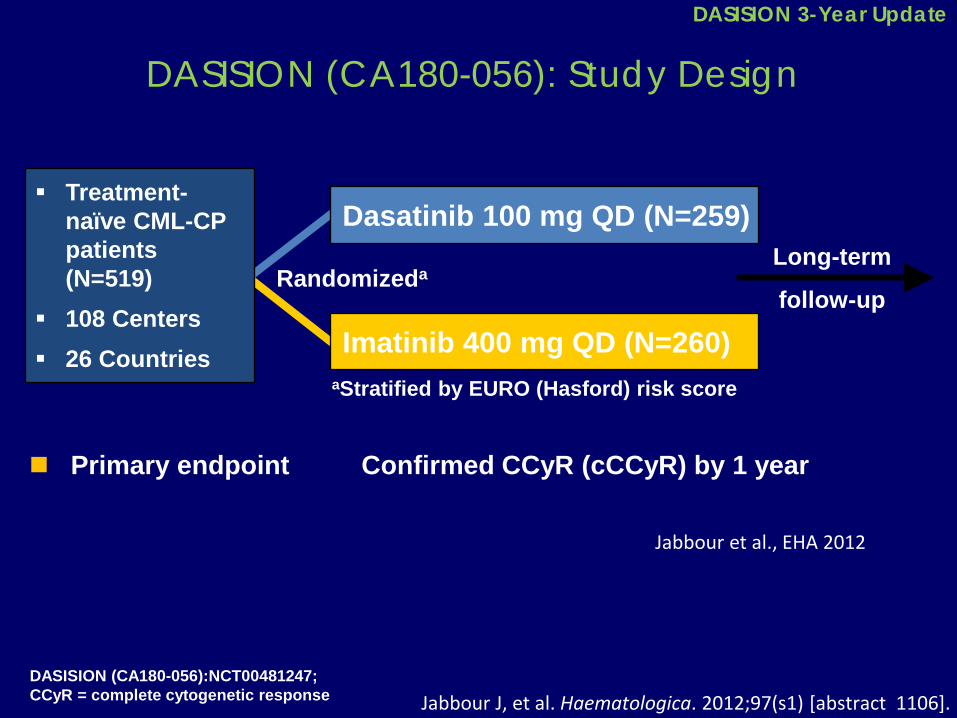
DASISION (CA180-056): Study Design
Primary endpoint Confirmed CCyR (cCCyR) by 1 year
Long-term
follow-up Randomizeda
Imatinib 400 mg QD (N=260)
Dasatinib 100 mg QD (N=259) Treatment-
naïve CML-CP patients (N=519)
108 Centers 26 Countries
aStratified by EURO (Hasford) risk score
DASISION (CA180-056):NCT00481247; CCyR = complete cytogenetic response
Jabbour et al., EHA 2012
Jabbour J, et al. Haematologica. 2012;97(s1) [abstract 1106].
DASISION 3-Year Update

DASISON: Patient Disposition and Discontinuation
Treated patients, n (%)
Dasatinib 100 mg QD N=258
Imatinib 400 mg QD N=258
Still on treatment 183 (71) 179 (70) Discontinued 75 (30) 79 (31) Progressiona 17 (7) 18 (7) Treatment failure 8 (3) 12 (5) Adverse event (AE) 27 (11) 16 (6)
Nonhematologic 20 (8) 12 (5)
Hematologic 7 (3) 4 (2) Unrelated AE 6 (2) 2 (<1) Deathb 4 (2) 1 (<1)
Poor/nonadherence 0 (0) 4 (2) Otherc 13 (5) 26 (10) aIncreasing WBC count; loss of CHR; loss of MCyR, including 30% rise in Ph+ metaphases and additional chromosomal abnormalities; or progression to AP/BP bnDiscontinuation due to death, which represents a subset of total deaths: 17 deaths overall in dasatinib arm, 20 deaths in imatinib arm CIncludes consent withdrawal, loss to follow-up, pregnancy, patient request, and poor/nonadherence
Jabbour J, et al. Haematologica. 2012;97(s1) [abstract 1106].
DASISION 3-Year Update

DASISION: Cumulative Incidence of MMR (BCR-ABL ≤0.1%)
MMR 3-y cumulative rates Hasford Risk Score
Low Intermediate High Dasatinib 83% 65% 61% Imatinib 65% 57% 43%
By 2 years 64%
46%
By 1 year 46%
23%
By 3 years 68%
55%
0
20
40
60
80
100
% W
ith M
MR
0 12 24 36 Months
1.6-Fold higher likelihood of achieving MMR with dasatinib; HR=1.62 (1.30-2.02)
P<0.0001 Dasatinib 100 mg QD Imatinib 400 mg QD
Jabbour J, et al. Haematologica. 2012;97(s1) [abstract 1106].
DASISION 3-Year Update

N 259 260 259 260
Num
ber o
f Pat
ient
s, n
On study Including follow-up beyond
discontinuation (ITT)a
DASISION: Transformation To AP/BP CML by 3 Years
Dasatinib 100 mg QD Imatinib 400 mg QD
aYearly evaluations after discontinuation are currently stipulated per protocol; additional information on patient status may be provided by investigators at other times
13
8
11
16
Jabbour J, et al. Haematologica. 2012;97(s1) [abstract 1106].
DASISION 3-Year Update
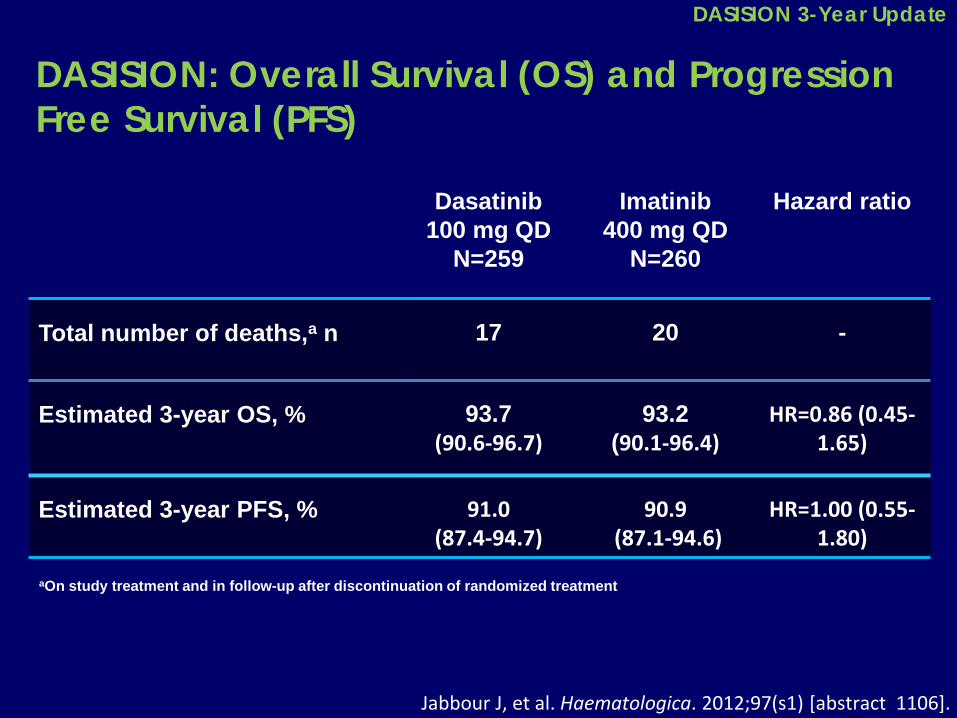
DASISION: Overall Survival (OS) and Progression Free Survival (PFS)
aOn study treatment and in follow-up after discontinuation of randomized treatment
Dasatinib 100 mg QD
N=259
Imatinib 400 mg QD
N=260
Hazard ratio
Total number of deaths,a n 17
20 -
Estimated 3-year OS, % 93.7 (90.6-96.7)
93.2 (90.1-96.4)
HR=0.86 (0.45-1.65)
Estimated 3-year PFS, % 91.0 (87.4-94.7)
90.9 (87.1-94.6)
HR=1.00 (0.55-1.80)
Jabbour J, et al. Haematologica. 2012;97(s1) [abstract 1106].
DASISION 3-Year Update
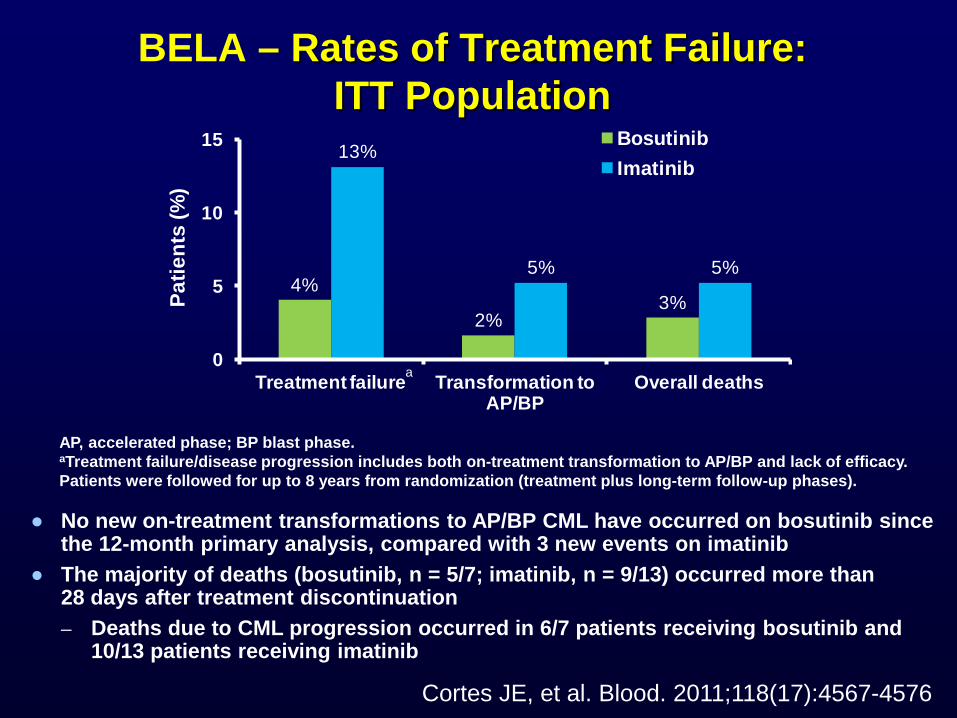
BELA – Rates of Treatment Failure: ITT Population
4%
2%3%
13%
5% 5%
0
5
10
15
Treatment failure Transformation to AP/BP
Overall deaths
Patie
nts
(%)
BosutinibImatinib
● No new on-treatment transformations to AP/BP CML have occurred on bosutinib since the 12-month primary analysis, compared with 3 new events on imatinib
● The majority of deaths (bosutinib, n = 5/7; imatinib, n = 9/13) occurred more than 28 days after treatment discontinuation – Deaths due to CML progression occurred in 6/7 patients receiving bosutinib and
10/13 patients receiving imatinib
AP, accelerated phase; BP blast phase. aTreatment failure/disease progression includes both on-treatment transformation to AP/BP and lack of efficacy. Patients were followed for up to 8 years from randomization (treatment plus long-term follow-up phases).
a
Cortes JE, et al. Blood. 2011;118(17):4567-4576
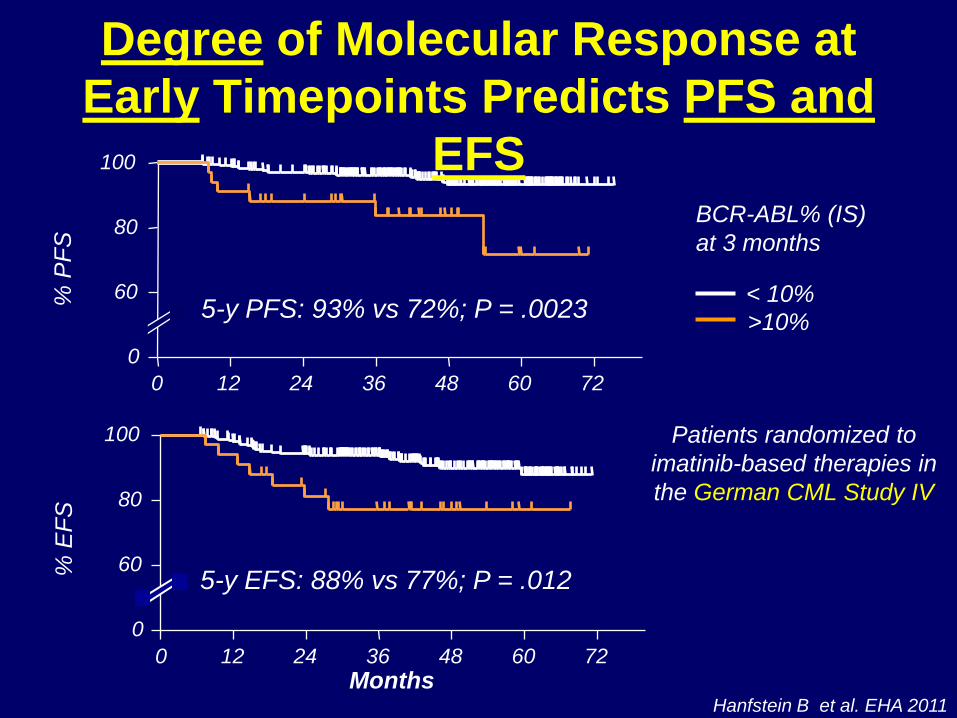
% P
FS
0 12 24 36 48 60 72 0
60
80
100
% E
FS
Months 0 12 24 36 48 60 72
0
60
80
100
Hanfstein B et al. EHA 2011
5-y PFS: 93% vs 72%; P = .0023
5-y EFS: 88% vs 77%; P = .012
< 10% >10%
BCR-ABL% (IS) at 3 months
Patients randomized to imatinib-based therapies in the German CML Study IV
Degree of Molecular Response at Early Timepoints Predicts PFS and
EFS

DASISION: Molecular and Cytogenetic Response at 3 Monthsa
84%
64%
% o
f pat
ient
s
≤10% BCR-ABL at 3 Months n//N 198/235 154/239 171/210 148/221
a Calculated from total number of evaluable patients with PCR assessments at 3 months; restricted to subjects with B2A2 and B3A2 transcripts
>1-10%
≤1%
>1-10%
≤1%
P<0.0001
CCyR
CCyR
PCyR
PCyR
PCyR/CCyR at 3 Months
81%
67%
P<0.0001
Dasatinib 100 mg QD
Imatinib 400 mg QD
BCR-ABL of <10% and ≤1% are not fully concordant with ≥PCyR and CCyR, respectively 96% and 83% of dasatinib and imatinib pts with ≥PCyR had <10% BCR-ABL, respectively 68% and 26% of dasatinib and imatinib pts with CCyR had ≤1% BCR-ABL, respectively
Jabbour J, et al. Haematologica. 2012;97(s1) [abstract 1106].
DASISION Landmark Analysis
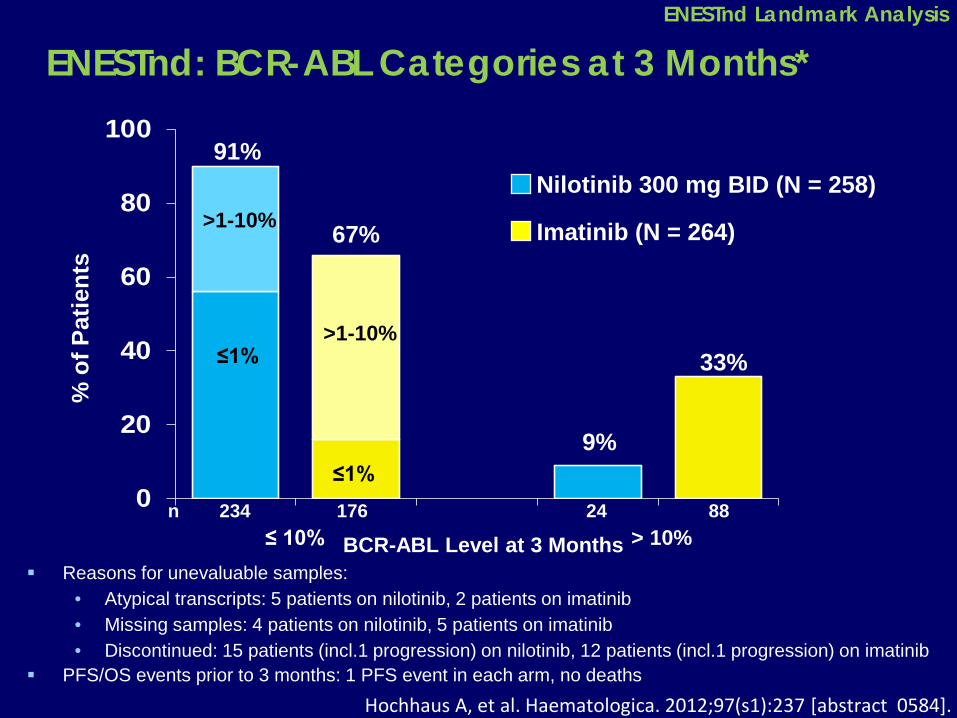
ENESTnd: BCR-ABL Categories at 3 Months*
0
20
40
60
80
100
% o
f Pat
ient
s
BCR-ABL Level at 3 Months n 234 176 24 88
≤ 10% > 10%
91%
67%
9%
33%
>1-10%
≤1% >1-10%
≤1%
Nilotinib 300 mg BID (N = 258)
Imatinib (N = 264)
Reasons for unevaluable samples: • Atypical transcripts: 5 patients on nilotinib, 2 patients on imatinib • Missing samples: 4 patients on nilotinib, 5 patients on imatinib • Discontinued: 15 patients (incl.1 progression) on nilotinib, 12 patients (incl.1 progression) on imatinib
PFS/OS events prior to 3 months: 1 PFS event in each arm, no deaths Hochhaus A, et al. Haematologica. 2012;97(s1):237 [abstract 0584].
ENESTnd Landmark Analysis
Advantages of Second Generation TKIs With Respect to Imatinib
Faster and deeper responses
Less progression events
Earlier identification of patients with inferior outcome
– Higher and faster possibilities of treatment discontinuation?

Potential Options for CML First-line Therapy
– Imatinib or 2nd generation TKIs as first-line therapy?
– 2nd generation TKIs only for specific groups of patients like patients at a higher risk of progression, younger patients, etc…… ?
– Still imatinib 400mg as initial therapy for most patients and than early switch to 2nd-gen TKIs in case of non-optimal response?

? ELN 2013 ?
Non optimal response to Imatinib 2nd gen. TKIs
Non optimal response to 2nd gen. TKIs ???
Clinical benefit?
3rd generation TKIs (like ponatinib)? AlloSCT for specific patients? Combination therapies?

Thank you!