Role of MGNREGA(S) in Seasonal Labour Migration: Micro Evidence …cess.ac.in/cesshome/wp/Working...
23
Vijay Korra CENTRE FOR ECONOMIC AND SOCIAL STUDIES Begumpet, Hyderabad-500016 Working Paper No. 137 April, 2015 Role of MGNREGA(S) in Seasonal Labour Migration: Micro Evidence from Telangana State
Transcript of Role of MGNREGA(S) in Seasonal Labour Migration: Micro Evidence …cess.ac.in/cesshome/wp/Working...

Vijay Korra
CENTRE FOR ECONOMIC AND SOCIAL STUDIES Begumpet, Hyderabad-500016
Working Paper No. 137April, 2015
Role of MGNREGA(S) in Seasonal Labour Migration:Micro Evidence from Telangana State

2
Abstract
The main focus of this paper is to examine the performance, outcomes and impactof MGNREGA Scheme on beneficiary households. This article is based on afield survey carried out in 2010 in three villages in Mahabubnagar district ofTelangana State, India. This study adopted a multi-stage random samplingmethod. The study found that majority of the job card holders are only able toget employment/work between 30-60 days and receive wages maximum betweenRs.60 to 70 per day wherein wage discrimination was prevalent in line withgender. It concludes by saying that the government sponsored employmentprogramme has indeed given rural poor a sense of hope about livelihood securitythrough guaranteed employment. On the other hand, the scheme is defected inproviding full employment days, wages and thus unable to prevent the workingclass from migrating to cities/towns in search of employment.
Keywords: MGNREGA(S), Labour, Employment, Wages, Livelihood, SeasonalMigration.JEL: J21, J23, J31, J41, J42, J43, J60, J80, J83.
1 Vijay Korra, Assistant Professor, Centre for Economic and Social Studies, Hyderabad. Thisarticle is part of the author's PhD thesis. He sincerely thanks his supervisors Prof. S. IrudayaRajan and Prof. U.S. Mishra of the Centre for Development Studies, Trivandrum for theirinvaluable comments and suggestions. He is grateful to reviewer for his insightful and constructivecomments. The usual disclaimer applies. E-mail: [email protected]
Role of MGNREGA(S) in Seasonal Labour Migration:Micro Evidence from Telangana State
Vijay Korra1
3
1. Introduction
Even with high economic growth in the recent past India is coupled with problemslike mass poverty, unemployment, agrarian distress and labour exodus from rural areasmore than ever before. These adversities in fact prompted government of the day tolaunch Mahatma Gandhi National Rural Employment Guarantee Act (MGNREGA)in 2005 to provide 100 days of guaranteed employment to the rural adult memberswho are willing to participate in unskilled manual labour. The work should be providedwithin the fortnight after the demand for work was made. It is, indeed, a gigantic,unique and first of its kind government sponsored employment programme. The schemewas implemented for the first time in the month of February, 2006 in Anantapurdistrict of Andhra Pradesh. It aims at creating sustainable assets and rural infrastructureon the one hand, and ensures better quality of life and enhanced income for ruralhouseholds by providing 100 days of assured employment in a staggered manner onthe other. The scheme is supposed to be utilized by the beneficiaries in a rational andmore so in a judicious way to combat distress conditions during the lean agriculturalperiods. Rural households including landless poor, small and marginal farmers, womenand Scheduled Caste (SC) and Scheduled Tribe (ST) were given priority. Moreover, ittargets to curb distress led migration among these deprived social categories. Thiscould have motivated federal government of the day to launch MGNREGA schemeas rural areas witnessing rampant out-migration. That way rural poor can be economicallyempowered (Dreze et al., 2009).
After completion of 8-9 years of its implementation the scheme has attracted bothcommends as well as criticism from diverse quarters on various counts of the scheme(Pankaj et al., 2010). In this regard, Dreze et al., (2009) argued that the 'hundred days'employment guarantee programme is changing the lives of rural poor at a slow pacebut steadily, and that beneficiaries could at least overcome their daily food consumptionneeds especially during the slack agriculture periods. The scheme by law accommodates30 per cent of female participation accordingly there is a tremendous response fromthe women workforce to participate in the scheme. This has indeed increased overallemployment days thus allowed rural households to earn better wages, spent on dailyfood consumption needs, children's education, healthcare and purchasing of durablegoods (Khera et al., 2009). Moreover, studies highlighted that the scheme is playing adecisive role in enhancing the livelihood security of the rural poor which in turncontributes to reduction in poverty level, semi-starvation and hunger, if not throughoutthe year, at least for few months (Dreze, 2009). The advent of MGNREGA(S) enhancedwages in rural sector which enabled labourers to bargain for higher wages when they

4
enter in the open labour market. This means the scheme has given labour class alternativechoices of employment thus choice of whether to work at lower wage rates or not inthe open labour market (Pankaj, 2010). As a result, there are clear signs of improvementin the beneficiary household's socio-economic conditions and improved interactionsbetween communities (Shah, 2008). Not only the scheme has changed labour marketrelations but also gave rural poor a feeling of hope. Despite its numerous encouragingoutcomes the scheme has still plagued with multiple predicaments - least to say, ineffectiveimplementation, malpractices, allegations of corruption, unsustainable asset creationetc. (Jacob, 2008).
It has been highlighted by number of studies that there is reasonably greater demandfor employment however most of the job card holders in essence were not providedcomplete 100 days of guaranteed employment rather much lesser days of work (Hirwayet al., 2010). This seems to be despite their willingness to do manual labour under thescheme. Further, all eligible household members were not getting work for the simplereason that the Scheme considers households as a single unit for providing employmentrather than individuals. As a result, numbers of working days were shared among thefamily members if more than one member willing to work in the programme. Theother set of predicaments are that of was wage delays, wage cuts and unpaid wages.These problems are rampant and commonly faced by scores of beneficiaries throughoutthe Indian countryside (Jacob, 2008). The other underlining problems are lack ofmonitoring and proper supervision of works (Reddy, 2010; Gopal, 2009). This apparentlyled to unchecked manoeuvring of records pertaining to muster roles, worked days,wage payments, completed projects and accounts. Inadequate and inefficient staff isanother hurdle that causing great harm to the scheme in its implementation (Chhabraet al., (2009).
The undue involvement of local landlords and political leaders in its implementationis badly affecting the outcome of the scheme in one way or other. Their involvementis evident in matters such as whom and how many job cards to be issued, number ofmembers to be allowed from a household to work, number of working days, wagerates and allotment of project-sites (Krishnamurthy, 2006; Dreze, 2009). Works createdunder the scheme are unsustainable in the long run due to lack of quality and lastingvalues (Dreze, 2009). Therefore, critics suggest the need for streamlining the schemeis essential (Dreze, 2009; Labour File, 2006). At the same time the scheme causeddeclining rates of distress seasonal/temporary migration from rural areas to urbandestinations due to MGNREGA(S) (Jacob, 2008; Reddy, 2010). Though there is areduction in the scale of labour out-migration in the countryside but it is not true allover the country because of uneven outcomes of the scheme (Dreze, 2009).

5
It is in this backdrop, this paper examines the impact of MGNREGA(S) on beneficiaryhouseholds. And probed how far MGNREGA job card holders benefited from thescheme? Are there any differences in getting benefits among the beneficiaries? Whatare the household characteristics that differentiate beneficiaries? Do the householdresources play any role in getting job cards? Does all the eligible family membersallowed to work in the scheme? What is the distinction between migrant and non-migrant MGNREGA(S) beneficiary households? And how does it affect the migrationflows from the study villages? These issues were addressed by analysing field surveydata which was collected in 2010 from 240 households from three villages inMahabubnagar district of Telangana State. The study applied multi-stage random samplingtechnique in selection of study villages. The final selected villages are Akkaram, Chityalaand Pata Kodangal of Mahabubnagar district. The study adopted a mixed method fordata collection which includes a structured quantitative questionnaire, focused groupdiscussions and interviews with respondent households. The sample households wereselected by following simple random selection method. The analysis first carried outwith reference to MGNREGA beneficiary and non-beneficiary households then inline with migrant and non-migrant households. In order to emphasize the dynamicsof MGNREGA and migration in the district the present analysis is carried out acrossthe villages through cross tabulations.
The paper is divided into seven sections including the introduction. The second sectiondeals with the characteristics of households by their MGNREGA(S) and migrationstatus. The third section talks about work participation and wage patterns ofMGNREGA(S) workers. The fourth section discusses the impact of MGNREGA(S)on beneficiary households and the assets created under the scheme. The fifth sectionis to do with the perceptions of different beneficiaries on MGNREGA(S) and theeffects of these perceptions on their decision making. The sixth section presents logisticregression. The final section is conclusions and policy advocacy.
2. Characteristics of MGNREGA(S) Households by Migration Status
This section deals with the relationship between households' basic characteristics andtheir migration status with reference to MGNREGA(S) status in the study villages.Of the total surveyed households 74 per cent of them have received MGNREGA jobcard. Of them 28 per cent of households with MGNREGA job cards have at leastone member migrated outside the village. There are 7 per cent of households yet toregister under programme. This implies that in spite of being the beneficiary ofMGNREGA(S), a moderate number of households sent their family member(s) toother regions for work, wage earnings etc. According to their migration status it wasfound that 81 per cent of migrants received job cards while the corresponding proportion

6
is 70 per cent for non-migrant households. This means there are still 19 per cent ofmigrant and 30 per cent of non-migrant households do not have job cards. And mostof them are small and marginal farmers. Despite their engaging in the scheme a quitefew poor households were still unable to stop migrating out unlike their non-migrantcounter parts (Table 1). The study learned that there are certain BPL and Anthyodayaration card households wholly depend on migration for their livelihood. This wasmainly due to uncertainty, irregularity and insecurity involved in the scheme. Forinstance, workers encountered a very common problem of ambiguity about when andhow many days of work they are going to get and at what wage rates. Consequently,such poor households showed no interest at all in working in the scheme (Field survey,2010). And our field experience explicitly suggests that poor and very poor householdcannot solely depend on MGNREGA(S) for their survival or well being. Because,MGNREGA is provided only during the summer months that too meagre number ofwork days. If they get work throughout the year there might be less likely of migrationfrom such households.
Table 1: MGNREGA(S) Households according to their Migration Status
Type of households Migrant households Non-migrant households Grand total
Job cards Yes No Yes No Yes NoHouseholds 68 16 110 46 178 62
(81) (19) (70) (30) (74) (26)Source: Field Survey, 2010. Note: Parentheses indicates their respective percentages.
The caste composition of MGNREGA(S) beneficiary households with reference tomigration status divulges a different story. In this, out of total beneficiary households,61 per cent of job card holding households essentially belong to STs followed byOBC (29%) and SC (10%) communities. In contrast, among non-beneficiary households,OBCs and ST households were in excessive possession of job cards. If an OBC oreven ST household is better placed in owning resources and assets then their likelihoodof participation in the scheme is weak. The general caste groups although less innumber in the sample are in reality less inclined to work in the MGNREGA(S)programme. At the same time, financially vulnerable and resource deprived communitieslike SCs and STs are more likely to engage in the employment scheme. Among theMGNREGA households a large proportion of out migration is taken place amongSTs and OBCs while SC households were less inclined to do so. Paradoxically, non-migrant households too belong to STs and OBC communities (Table 2). It is truethat households with better resource and asset ownership are less likely to get registeredin the scheme. Such households in all likelihood remain in the village unlike theirresource poor counterparts. It is vital to note that non-MGNREGA(S) households areunwilling to leave their village due to better household resources.

7
Table 2: MGNREGA(S) Households by their Caste and Migration Status
Social groups Migrants households Non-migrants households Grand total
Job card HH Yes No Yes No Yes NoSC 7 5 10 3 17 8
(58) (42) (77) (23) (68) (32)ST 50 8 58 18 108 26
(86) (14) (76) (24) (81) (19)OBC 11 3 41 24 52 27
(79) (21) (63) (37) (66) (34)General - - 1 1 1 1
(50) (50) (50) (50)Total 68 16 110 46 178 62
(81) (19) (70) (30) (74) (26)Source & Note: Same as for Table 1. HH indicates households.
Further, 72 per cent of farming and 92 per cent of labour households' possesMGNREGA(S) job cards. Between them, cultivators have less access to MGNREGA(S)job cards as compared labour households. However, there was not much differencefound between them when it comes to migration. But non-farm (caste based occupation)labour households have more leaning towards migration than them (Table 3). Cultivatorsand labour households seek and engage employment in fields during agriculture seasonwhereas non-farm households prefer to migrate to other regions.
Table 3: MGNREGA Households by their Occupation and Migration Status
Job card HH Migrants households Non-migrants households Grand total
Occupations Yes No Yes No Yes NoClerks - 1 - 1 1 2
(100) (100) 100)
Construction - - 1 - 1 -
(100) (100)
Non-farm labour 4 - 3 - 7 -
(100) (100) (100)
Agri-labourers 8 2 14 - 22 2
(80) (20) (100) (92) (8)
Cultivators 56 13 92 45 148 58
(81) (19) (67) (33) (72) (28)
Total 68 16 110 46 178 62
(81) (19) (71) (29) (74) (26)Source & Note: Same as for Table 1. HH indicates household.

8
With regard to MGNREGA(S) it was found that 74 per cent of households' possesMGNREGA(S) employment cards and rest 26 per cent do not have them. Amongthe land-owning households, 71 per cent posses MGNREGA job cards whereas 88per cent of landless households possess job cards. Among the migrant households,landless households are more likely to hold job cards unlike their non-migrantcounterparts. It seems that land ownership play an insignificant role in gettingMGNREGA(S) job cards because both migrant and non-migrant household more orless have access to the scheme. Thus, land-owning households with MGNREGA(S)job cards are less inclined to migrate-out than landless households (Table 4). Landowned households with access to irrigation sources are only about 46 per cent andtheir chances of getting job card and migrating out is much weaker than that of non-irrigated households. It is not unique though since similar patterns were found inother parts of the country (Hirway )
Table 4: MGNREGA Households by Land Ownership and Migration Status
Land ownership Migrants households Non-migrants households Grand total
Job card HH Yes No Yes No Yes No
Land HH 43 12 98 45 141 57(78) (22) (69) (31) (71) (29)
Landless HH 25 4 12 1 37 5(86) (14) (92) (8) (88) (12)
Total HH 68 16 110 46 178 62(81) (19) (70) (30) (74) (26)
Source & Note: Same as for Table 1. HH indicates Households.
2.1. MGNREGA(S) Workers by Migration Status
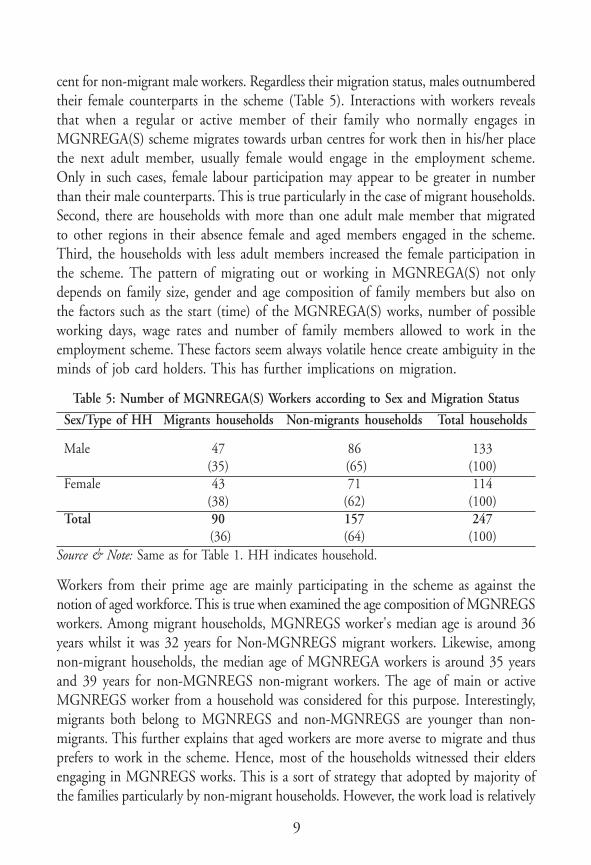
The study not only looked into the household level but also at individuals workparticipation in the scheme. Note that, individual workers and households are twodifferent units of analysis presented in this paper. In the previous section, we haveanalysed based on households and in this section it would be at individual level sinceit deals mostly about work participation with reference to migration. In this, a total of247 persons have who worked in the scheme during the survey year 2010. Of them,54 per cent were male workers and 46 per cent of them are females. Males' participationin the scheme is rather greater than that of females as against the notion of femaledomination (Khera, 2009). Further, 36 per cent of individual workers belong to migranthouseholds and remaining 64 per cent from non-migrant households. Both male andfemale workers predominantly belong to non-migrant households (more than 60%).Within the migrant households, 52 per cent were male workers whilst it was 55 per
9
cent for non-migrant male workers. Regardless their migration status, males outnumberedtheir female counterparts in the scheme (Table 5). Interactions with workers revealsthat when a regular or active member of their family who normally engages inMGNREGA(S) scheme migrates towards urban centres for work then in his/her placethe next adult member, usually female would engage in the employment scheme.Only in such cases, female labour participation may appear to be greater in numberthan their male counterparts. This is true particularly in the case of migrant households.Second, there are households with more than one adult male member that migratedto other regions in their absence female and aged members engaged in the scheme.Third, the households with less adult members increased the female participation inthe scheme. The pattern of migrating out or working in MGNREGA(S) not onlydepends on family size, gender and age composition of family members but also onthe factors such as the start (time) of the MGNREGA(S) works, number of possibleworking days, wage rates and number of family members allowed to work in theemployment scheme. These factors seem always volatile hence create ambiguity in theminds of job card holders. This has further implications on migration.
Table 5: Number of MGNREGA(S) Workers according to Sex and Migration Status
Sex/Type of HH Migrants households Non-migrants households Total households
Male 47 86 133(35) (65) (100)
Female 43 71 114(38) (62) (100)
Total 90 157 247 (36) (64) (100)
Source & Note: Same as for Table 1. HH indicates household.
Workers from their prime age are mainly participating in the scheme as against thenotion of aged workforce. This is true when examined the age composition of MGNREGSworkers. Among migrant households, MGNREGS worker's median age is around 36years whilst it was 32 years for Non-MGNREGS migrant workers. Likewise, amongnon-migrant households, the median age of MGNREGA workers is around 35 yearsand 39 years for non-MGNREGS non-migrant workers. The age of main or activeMGNREGS worker from a household was considered for this purpose. Interestingly,migrants both belong to MGNREGS and non-MGNREGS are younger than non-migrants. This further explains that aged workers are more averse to migrate and thusprefers to work in the scheme. Hence, most of the households witnessed their eldersengaging in MGNREGS works. This is a sort of strategy that adopted by majority ofthe families particularly by non-migrant households. However, the work load is relatively
10
less and working conditions are seems to be better under the scheme. Accordingly, theyounger members of the family were sent to other regions for work and wage earningsas part of the household strategy (Field survey, 2010).
3. Patterns of Worked Days and Wage Rates of MGNREGS Workers
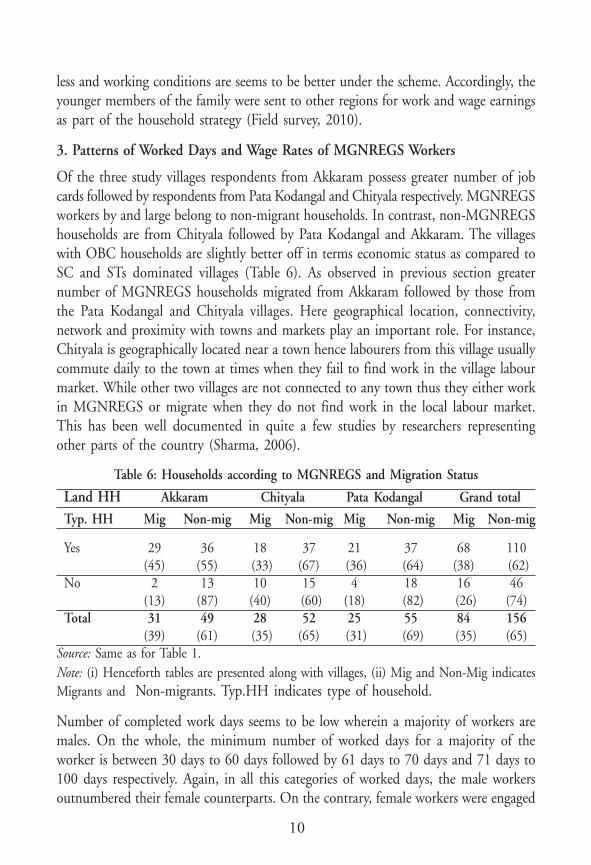
Of the three study villages respondents from Akkaram possess greater number of jobcards followed by respondents from Pata Kodangal and Chityala respectively. MGNREGSworkers by and large belong to non-migrant households. In contrast, non-MGNREGShouseholds are from Chityala followed by Pata Kodangal and Akkaram. The villageswith OBC households are slightly better off in terms economic status as compared toSC and STs dominated villages (Table 6). As observed in previous section greaternumber of MGNREGS households migrated from Akkaram followed by those fromthe Pata Kodangal and Chityala villages. Here geographical location, connectivity,network and proximity with towns and markets play an important role. For instance,Chityala is geographically located near a town hence labourers from this village usuallycommute daily to the town at times when they fail to find work in the village labourmarket. While other two villages are not connected to any town thus they either workin MGNREGS or migrate when they do not find work in the local labour market.This has been well documented in quite a few studies by researchers representingother parts of the country (Sharma, 2006).
Table 6: Households according to MGNREGS and Migration Status
Land HH Akkaram Chityala Pata Kodangal Grand total
Typ. HH Mig Non-mig Mig Non-mig Mig Non-mig Mig Non-mig
Yes 29 36 18 37 21 37 68 110(45) (55) (33) (67) (36) (64) (38) (62)
No 2 13 10 15 4 18 16 46(13) (87) (40) (60) (18) (82) (26) (74)
Total 31 49 28 52 25 55 84 156(39) (61) (35) (65) (31) (69) (35) (65)
Source: Same as for Table 1.Note: (i) Henceforth tables are presented along with villages, (ii) Mig and Non-Mig indicatesMigrants and Non-migrants. Typ.HH indicates type of household.
Number of completed work days seems to be low wherein a majority of workers aremales. On the whole, the minimum number of worked days for a majority of theworker is between 30 days to 60 days followed by 61 days to 70 days and 71 days to100 days respectively. Again, in all this categories of worked days, the male workersoutnumbered their female counterparts. On the contrary, female workers were engaged

11
rather in a moderate number in the category of less number of worked days. Maleworkers participation tends to increase when the number of days worked increasesunlike females. In this respect, there is not much difference found across the threestudy villages (Table 7). Further, the field experience suggests there was no variationin implementation pattern of the programme across the villages. As a result, we canconclude that a very dismal portion of workers got employment up to 100 days.Uncertainty in implementation across the villages is rampant which is hampering thework participation.
Table 7: Number of Worked Days of MGNREGA(S) Workers by their Sex
Working days Akkaram Chityala Pata Kodangal Grand total
Sex Male Female Male Female Male Female Male Female
30 to 60 days 28 20 16 12 22 12 66 44(58) (42) (57) (43) (65) (35) (60) (40)
61 to 70 days 9 3 5 3 8 8 22 14(75) (25) (62) (38) (50) (50) (61) (39)
71 to 100 days 4 1 17 2 7 1 28 4(80) (20) (89) (11) (87) (13) (87) (13)
Total 41 24 38 17 37 21 116 62(63) (37) (69) (31) (64) (36) (65) (35)
Source & Note: Same as for Table 1. *Number of worked days is complied for main or activeworker from a household.
The gender composition of MGNREGS workers suggests that males on average received61 days of employment while their female counterparts obtained 57 employmentdays. Studies pointed out that, women's work participation in the programme seemsto be greater than males in other parts of the country but it is males who outnumberedfemale workers in these villages is nothing but another face of the scheme. In fact, itdefers from region to region that was why there is no specific pattern arises at villagelevel in the present study region. In this, the highest number of average worked daysfor both male and female workers documented in Chityala followed by Pata Kodangaland Akkaram villages. Worked ddays suggest that, majority of workers on an averagelosing or not getting 40 working days due to the inept implementation of the schemecould be considered as breach of workers legal right to get work in general. It waslearned from that, inadequate or less number of working days stimulated quite anumber of households to send their family members to urban areas for work in expectationof higher wages as well as to get continuous work as opposed to MGNREGS works.One Yadaih informed that unless we are (workers) provided full 100 days of employmentexodus from our village to Hyderabad city never going to halt. We are indeed deprivedof work both in agriculture and in MGNREGA hence have to take up migration.

12
The other critical aspect to look into MGNREGA is wage rates where 60 per cent ofworkers received daily wages between Rs. 60 to 70 while 36 per cent of them receivedwages between Rs. 70 to 90 and a very negligible number of them received wagesbetween Rs. 90 to 100 (4%). It is rather ironic to find wage discrimination in linewith gender across the study villages wherein male workers earned higher wages thantheir female counterparts. It is rather contrary to the spirit of the MGNREG Actwhich does not allow wage inequity in any manner. Interestingly, the wage differentiationwas practiced not based on quantity of work done but citing gender reasons byimplementation agencies, although unofficially. Mallamma (name changed) a femaleworker from Chityala mentioned that officials starting from village to mandal/blocklevel state that 'we female workers' engage only in light and less burdensome manualwork as compared to males hence paid lower wages (Table 8). Interestingly, there wasnot a single labour who received wages between Rs. 90 to Rs. 100 in Pata Kodangaland the same applies to female labour workers in Akkaram village. On the contrary,workers in Chityala which is located very close to one of the major towns in thedistrict were paid higher wages. It was learned from the field that there is a correlationbetween MGNREGA wages and agriculture wages where agriculture wage rates sometimesnegatively influence the MGNERGA wages. For instance, during the study year wagerates in the open agricultural labour market was between Rs.70 to 80 and hardly evergone up to Rs. 90-100 for this reason the implementation authority paid similarwages to MGNREGA(S) workers.
Table 8: Distribution of MGNREGA(S) Workers Wage Rates according to Sex
Villages Akkaram Chityala Pata Kodangal Grand total
Wage rates/Sex Male Female Male Female Male Female Male FemaleRs. 60-70 25 17 18 8 25 13 68 38
(60) (40) (69) (31) (66) (34) (64) (36)Rs. 70-90 14 7 17 6 12 8 43 21
(67) (33) (74) (26) (60) (40) (67) (33)Rs. 90-100 2 - 3 3 - - 5 3
(100) (50) (50) (62) (38)Total 41 24 38 17 37 21 116 62
(63) (37) (69) (31) (64) (36) (65) (35)Source & Note: Same as for Table 1.
Further, what is more important is that, in all the three aforesaid wage categories,workers from non-migrant households account for a large amount even as the shareof migrant households is much lower. It is apparent that certain workers were paidlower wages along the lines of gender, class, social group and migration status. This inturn has implications on migration from the villages.

13
4. Implications of MGNREGA(S) on Beneficiary Households
In this section, an attempt has been made to explore the impact of MGNREGA(S)on beneficiary households. Overall, the particulars regarding work done or asset createdunder the MGNREGA(S) projects overall discloses that 10 per cent of the work doneunder the scheme was road laying, 8 per cent was farm land levelling in small andmarginal farmer's land, 7 per cent was road repair and, 4 per cent was repaired farmersopen-wells. The share of work in jungle cutting, bush clearing, tank repair and welldigging on poor farmers' land was 6 per cent each. And a significant percentage of(38%) beneficiary households did not respond to this question. It was surprise toobserve that 4 per cent of them do not know anything about asset creation under thescheme. However, there is dissimilarity in asset created across the three villages. InAkkaram, tank repair, road laying, canal digging and road repair works constituted amajor part of the work. In Chityala, jungles cutting and well digging are the majoractivities executed whereas in Pata Kodangal it was clay work, farm land levelling andwell digging (Table 9). Our field visit to project sites suggest that although most ofthe works under taken were completed but the quality of works in terms of utilizationand durability in fact seems to be very poor and unsustainable. This was mainly onaccount of inefficient administration, inadequate supervision and corrupt practices inthe execution of projects. Krishnaiah (name changed) from Pata Kodangal said thatthe poor quality of works also mainly due to low wages, wage deduction and sometimesnon-payment of wages for certain workers that have discouraged them perform theirjob effectively.
Table 9: Asset creation under the MGNREGA(S) Scheme by Migration StatusAsset created Akkaram Chityala Pata Kodangal Grand Total %No Response 25 (37) 20 (29) 23 (34) 68 (100)Bush Cutting 4 (36) 5 (45) 2 (18) 11 (100)Canal digging 8 (100) - - 8 (100)Clay work 2 (29) - 5 (71) 7 (100)Don't know - 2 (29) 5 (71) 7 (100)Farm land level - 5 (33) 10 (67) 15 (100)Jungle cutting - 8 (73) 3 (27) 11 (100)Road Laying 12 (67) 6 (33) - 18 (100)Road repair 7 (54) 2 (15) 4 (31) 13 (100)Tank repair 7 (70) 1 (10) 2 (20) 10 (100)Well digging - 6 (60) 4 (40) 10 (100)
Total 65 (36) 55 (31) 58 (33) 178 (100)Source & Note: Same as for Table 1.

14
Out of total MGNREGA(S) households, 75 per cent of them expressed they did notget any benefit or no land development works under taken in their farmlands. On thecontrary, only 13 per cent of the households in one way or other have benefited fromthe projects that have carried out in their fields. Six per cent of their farm lands werelevelled by removing stones or pebbles. Here, the greater benefits went to non-migrantsthan migrant households (Table 10). The visit to worksites tells us that, the poor levelof asset creation reduced the benefits to the beneficiaries. Yadaiah a MGNREGA workerinformed that the scheme need to include other unlisted works and should be carriedout in a more productive and sustainable manner then only rural households andlabourers will benefit from the scheme.
Table 10: Households benefited under MGNREGA(S) Projects by Migration Status
Benefits Akkaram Chityala Pata Kodangal Grand total
Typ. Of. HH Mig Non-mig Mig Non-mig Mig Non-mig Mig Non-migNo 15 22 13 36 14 33 42 91
(41) (59) (27) (73) (30) (70) (32) (68)Farm land level 4 2 2 - 3 - 9 2
(67) (33) (100) (100) (82) (18)Own land dev 8 7 3 1 3 1 14 9
(53) (47) (75) (25) (75) (25) (61) (39)Road Improved - 3 - - 1 - 1 3
(100) (100) (25) (75)Water shed 2 2 - - - - 2 2
(50) (50) (50) (50)Well repair - - - - - 3 - 3
(100) (100)Total 29 36 18 37 21 37 68 110
(45) (55) (33) (67) (36) (64) (38) (62)
Source & Note: Same as for Table 1. Dev means development.
The other side of programme shows some lights on rural livelihood because the schemeseems to be improving the livelihood conditions of the rural poor. For instance, 89per cent of the working households indeed got an additional livelihood security fromthe scheme. Ten per cent of households voiced that the scheme has not yet giventhem any added livelihood security. On the other hand, 64 per cent of non-migranthouseholds opined that the employment programme did give them added livelihoodsecurity while the corresponding figure for migrant's households was 36 per cent. Thehouseholds that did not get any livelihood security are predominantly from Akkaramvillage. This explains that, of the three villages, Akkaram seems to be more disadvantaged

15
and vulnerable. Nevertheless, despite of multiple drawbacks most of the beneficiaryhouseholds could get the sense of additional assurance and/or confidence from thescheme. This in fact helped them to overcome food grain shortage at least for two tothree months especially during the post-harvest summer season. Thus the scheme isimplicitly increased their purchasing power not only during the times of difficultiesbut also increased purchase of non-food durable goods, although this is not evenlytrue for all the households.
On the other hand, 60 per cent of the beneficiary households accepted that the schemehas increased agricultural wages since its inception. Thus, agricultural wages in thevillages have gone up from Rs 50 to Rs. 100 which means it doubled the wages. Thisin a way attracted many labourers, small and marginal farmers to opt for working inMGNREG Scheme than labour class. This somewhat led to shortfall in labour supplyand subsequently increased agricultural wages in the study region. It has equally influencedthe wage rates in rural non-farm sector. Through interviews it was learned that, non-migrant households were more concerned about wage hikes than their migrantcounterparts. Ironically, in the open labour market, the wages paid to workers were infact on par with MGNREGA(S) wages due to excessive labour supply and non-availabilityof MGNREGA works for longer periods. In this, majority of workers paid wagesbetween Rs. 70 to Rs. 80. Further, 37 per cent of MGNREGA(S) households informedthat agricultural and non-farm wages in the study villages are indeed unaffordable tothem while 63 per cent of them have expressed they can afford increased wage rateswhich according to them reasonable. And non-migrant households seem to be havingno problem. Noticeably, in Akkaram village, the proportion of households that expressedwages are unaffordable is quite high that too among migrant category. For instance,small and marginal farmers are unable to pay increased wages when they hire labourersto work in their fields.
With regard to bargaining power to labourers, 95 five per cent of the householdsasserted that MGNREGA(S) wages made possible for them to bargain for higherwages when entered the open labour market. This worked more so during the peakagricultural season as well as when MGNREGA(S) work is in progress. Interestingly,workers economic vulnerability seem to be blocking them from bargaining higherwages. One Mallesham (name changed) told us that they earned higher wages in thescheme and expect similar wage rates in the open labour market. However, there wereinstances when few workers compromise and settle for lower wages but its only for ashort period. If situation continued for long then they take up migration towardsother areas. In this context, a question about labour scarcity owing to MGNREGA(S)shows that 72 per cent of the households did not face such problems whilst 28 per

16
cent of them encountered labour shortage during agricultural season. Therefore, farmerswho grow crops in the Rabi season (second crop) and engage in non-farm activitiesare troubled with frequent labour scarcity. But such farmers are less in number.
With respect to spending patterns of income that was earned from working in thescheme explains that 46 per cent of them spent on daily food consumption, 23 percent of them invested in the agricultural activities, 11 per cent spent on health needs,10 per cent repaid their old debts and 7 per cent of the households spent on children'seducation. What is striking here is the proportion of non-migrant households is greaterthan that of migrants which is quite unforeseen given their better economic statusthan migrants. A majority of migrants spent their income on daily food consumptionwhile non-migrants spent on health needs, education, agriculture and repayment ofdebts within their respective category (Table 11). Non-migrant households seem to bespending more on productive purposes while migrants spent mostly on daily foodconsumption. This entails that non-migrant household's earnings from MGNREGA(S)supplemented to their total household income which help them to spent on functionalpurposes. MGNREGS households from Pata Kodangal were largely invested in agriculturalactivities while in the other two villages it was predominantly on daily food consumption.It was observed that spending depends on the kind of capitals these households possessand have access to better economic resources such as land, access to irrigation, implementsand livestock.
Table 11: Income Spending of MGNREGS Workers by Migration Status
MGNREGA Akkaram Chityala Pata Kodangal Grand total
income spent Mig Non-mig Mig Non-mig Mig Non-mig Mig Non-migConsumption 21 22 12 13 4 10 37 45
(49) (51) (48) (52) (29) (71) (45) (55)Education - - 2 7 1 2 3 9
(22) (78) (33) (67) (25) (75)Health 2 4 2 7 - 4 4 15
(33) (67) (22) (78) (100) (21) (79)Agri-invest 3 10 2 10 8 8 13 28
(23) (77) (17) (83) (50) (50) (32) (68)Repay debts 2 - - - 4 11 6 11
(100) (27) (73) (35) (65)Others 1 - - - 4 2 5 2
(100) (67) (33) (71) (29)Total 29 36 18 37 21 37 68 110
(45) (55) (33) (67) (36) (64) (38) (62)
Source & Note: Same as for Table 1. Agri-invest mean agriculture investment. Mig and non-mig indicates migration and non-migration.

17
Conversely, the scheme is surrounded by manifold issues where 18 percentage ofhouseholds complaining about manipulation of number of employment days and 17per cent of them informed deducted number of working days, 15 per cent of themhave said that they did not get wages for certain phases of work, 14 per cent of themcomplained about low wage payments than the usual Rs. 100 per day, 10 per cent sawa great deal of corruption and 7 per cent found faults in account and record maintenance(Table 12). In all the categories, non-migrants comparatively exceeded than their migrantcounterparts. Households from Pata Kodangal did not complain much about the lessnumber of employment days and ineffectiveness of the programme while other twovillages encountered more problems. Notably, no problems found relating to accountmanipulation, supervision and quality of work-done in Akkaram. There seems to benot much problems faced by MGNREGA workers at project site. Having said that,there are few workers who faced problems like lack of basic shelter, drinking waterfacility, first aid box etc. and so workers had to toil under the scorching sun andthereafter faced long working hours. All this, certainly points to the need of providingbasic facilities to workers at project sites.
Table 12: Problems faced by MGNREGA(S) Households by their Migration StatusProblems Akkaram Chityala Pata Kodangal Grand totalType of HH Mig Non-mig Mig Non-mig Mig Non-mig Mig Non-migCorruption 1 1 1 2 2 12 4 15
(50) (50) (33) (67) (14) (86) (21) (79)Ineffective - - 4 4 - - 4 4
(50) (50) (50) (50)Less work days 8 7 3 12 - - 11 19
(53) (47) (20) (80) (37) (63)Account Manip - - 1 6 2 4 3 10
(14) (86) (33) (67) (23) (77)Manip-work days 8 11 - 2 6 5 14 18
(42) (58) (100) (55) (45) (44) (56)No supervision - - - - 1 4 1 4
(20) (80) (20) (80)Paid less wages 8 8 3 1 - 5 11 14
(50) (50) (75) (25) (100) (44) (56)Politics in wages 1 5 2 - 1 4 4 9
(17) (83) (100) (20) (80) (31) (69)Wages not paid 3 4 4 10 5 1 12 15
(43) (57) (29) (71) (83) (17) (44) (56)No quality work - - - - 4 2 4 2
(67) (33) (67) (33)Total 29 6 18 37 21 37 68 110
(45) 3(55) (33) (67) (36) (64) (38) (62)
Source: Same as for Table 1. Note: (i) Percentages calculated only for MGNREGA(S) households,(ii) Manip - Manipulation. HH indicates household.

18
5. Perceptions of the MGNREGS Workers
The perceptions of respondent households on whether the scheme need any changesin the current form suggest that 66 per cent of the households informed that thepresent Scheme requires some changes regarding improving the implementation andeffectiveness of the scheme. On the contrary, 33 per cent felt that there was no needto bring in any new or additional changes in the programme. Interestingly, non-migranthouseholds predominantly expressed both views. In Pata Kodangal, the extent of non-migrant households who believed the employment programme needs no changes. Whenasked about whether job cards should be extended to other non-job card households,it was found that 85 per cent of the MGNREGA(S) households answered they haveno issues if government extends job cards to those who did not get. Rest of the households(15%) opposed the idea of extension to left-out households and felt that there is noneed for extension of job cards to those better-off land owned households. In this,non-migrants outnumbered their migrant counterparts. Interestingly, in Akkaram, therewas not a single household that opposed the extension of job cards. While in Chityala,migrants did not oppose it, but non-migrant households said no to additional jobcard distribution (extension), the same is the case in Pata Kodangal (Table 14). Ironyis that migrant households are more in favour of extension of job cards, although itvaries across the villages. The reason behind this opinion is complex and mostly comesfrom their socio-economic and personal perceptions and motivations.
Moreover, 66 per cent of households have stopped migrating due to the programme.Nonetheless, 34 per cent of them did not stop migration even after working in thescheme. Among migrants, 62 per cent of them could stop migrating out due to thepresence of employment scheme while the corresponding proportion was 38 per centfor migrant households. There seems to be a strategy of labour allocation whenMGNREGA is in progress. For instance, a moderate number of households that expressedone or more members of their family migrated when the MGNREGA(S) work was inprogress. In their absence, the older member of the family worked in the scheme.Certain migrant household's survival is totally depended on earnings from migration.It was sad to notice that some of the beneficiary households especially from PataKodangal were selling (although temporarily) their job cards to non-beneficiaries andpreferring to migrate to Mumbai for higher wage earnings. Note that, during thenon- MGNREGA(S) season, labour migration from the study villages flow as usually.
It is in this context the study asked whether they are planning to migrate once MGNREGAworks completes and 39 per cent of beneficiary households said they are planning tomigrate once again when MGNREGS works come to an end. Here, migrant householdsare more inclined to migrate than non-migrants. On the contrary, 61 per cent of

19
households were interested in migration again next season after completion of MGNREGSworks in which non-migrants outnumbered their migrant counterparts. The intentionof migration depends on diverse factors such as monsoon, land holdings, able-bodiedfamily members and employment in agriculture sector and start of MGNREGA worksin the villages.
6. Logistic Regression Model
In determining the migration status of a household, factors like MGNREGA status,caste, land ownership, occupation etc. could play a vital role. For instance, a householdwith an advantage in above-mentioned factors may be less likely to migrate. Also,households from lower socio-economic background may take up migration for survivalor in order to find employment. Here, the study has applied an appropriate modelnamely 'Binary Logistic Regression Model' to test the same. This in fact would providenot only the association between such characteristics and migration but also presentsthe likelihood of migration of a household with those features.
6.1. Hypothesis
In the given context, this study presumes that households with own land, MGNREGAjob cards, non-SC and STs and cultivating households may not resort to migration insearch of employment, survival etc. to other areas. The potential explanatory variablesfor being a migrant household are explained as below. If a household lacks ownershipof land, MGNREGA job cards, belongs to non-farm agriculture,and SC and STcommunity households are expected to migrate more than usual.
6.2. Results of Logistic Model
As described above, factors such as MGNREGA status, caste, land ownership andoccupation of a household play a major role in the rural poor's decision to migratetherefore the study has considered them as independent variables while migration istaken as a dependent variable to carry out a logistic regression analysis. Here, MGNREGAstatus of a household denotes (N), caste (C) indicates their social background, landownership (L) represents own land holdings and occupation (O) reflects their maineconomic activity in the village.
( )),,,/1( 54321 iiiii OLCNOLCNMEP βββββ ++++===
Where M denotes migration status of a household
N is the MGNREGA status of a household
C is the caste

20
L is the land ownership and,
O is the occupation of a household. It should be noted that these variables refers tohouseholds rather than individuals.
First, the estimated logistic regression model result shows a significant associationbetween the caste and migration. Similarly, it is found a significant relationship betweenland ownership and migration. This further explains that if a household who belongsto SC and ST communities are more inclined to migrate than non-SC and ST households.Likewise, a household with land ownership is significantly affected by migration thantheir landless counterparts. On the contrary, there is an insignificant association betweenMGNREGA household and migration. In the same way, there is an insignificantassociation between occupation and migration. The likelihood odd ratio discloses thata household with MGNREGA job card is 1.20 times more likely to migrate-out thanthat of non-MGNREGA households. Following SC and ST households are 5.11 timesmore inclined to migrate than non-SC and ST communities. Similarly, cultivatinghouseholds are 1.19 times more likely to move-out of the village than their non-cultivating households. On the contrary, the land owned households are less likely tomigrate than landless households (Table 13). It should be noted that the base unitvalue here is 1, and above 1 unit value indicates more likelihood of being a migranthousehold and less than 1 show less likelihood of being a migrant household.
Table 13: Logistic Regression of Migration Status of Households on SelectedCharacteristics
Characteristics Odds Ratio Std. Err. P>zMGNREGA Status 1.202803 -4414069 0.615Caste 5.119615 1.974077 0.000Land Ownership -1229693 -0542979 0.000Occupation 1.199783 -9851055 0.824LR chi2 (4) = 48.23Prob > chi2 = 0.0000Log likelihood = -131.27141 Pseudo R2 = 0.1552
Source: Same as for Table 1. Note: Base value is 1, < 1 & > 1 reflects best and worsevalues.
7. Conclusions
There is no doubt that the scheme has benefited rural households and they are verymuch in favour of its continuance. Having said that the scheme also plagued withmanifold problems hence there is an apprehension about its efficiency, benefits and

21
purpose. The impact of MGNREGA in study regions is partial, limited and lackssustainable assets. There are serious problems of implementation, inadequate staff,administrative manipulations and mismanagement in the scheme. Due to which thebeneficiary workers fail to receive full benefits from the scheme. In order to make thescheme more transparent, beneficial, effective, outcome-oriented and sustainable, thefocus should be given to proper, effective, corrupt-free implementation and performanceenhancement. This may be possible only when irregularities and other sorts ofmanipulation in the scheme are brought down otherwise the whole purpose of thescheme would be defeated. Only then, its real benefits and fruits could be reached tothe needy rural households. This would improve their employment days, purchasingpower, food security, living standards and overall economic status. In a way this isnothing but empowering the rural poor, in particular women, and thus can boost tothe rural economy as a whole. As a consequence, development activities in rural areasthrough MGNREGA(S) could continue and in the long run face of rural India maychange.
References
Chhabra, Sangeeta and G.L. Sharma (2009), "National Rural Employment GuaranteeScheme: Realities and Challenges" LBS Journal of Management and Research,Vol. VI, Nos. 1 and 2.
Dreze, Jean and Christian Oldiges (2009), "A Comparison of the First Two Years ofthe Implementation of the NREGA Shows that Some Questions Still Remain",Frontline, February 14.
Gopal, K.S. (2009), "NREGA Social Audit: Myths and Reality", Economic and PoliticalWeekly, Vol. 44, No. 03, pp. 70-71, January 17-23.
Hirway, Indira (2010), "NREGA After Four Years: Building on Experiences to MoveAhead", The Indian Journal of Labour Economics, Vol. 53, No. 1, pp. 113-135.
Jacob, Naomi (2008), "The Impact of NREGA on Rural-Urban Migration: FieldSurvey of Villupuram District, Tamil Nadu", CCS Working Paper No. 202,Summer Research Internship Programme, Centre for Civil Society.
Khera, Reetika and Nayak, Nandini (2009), "Women Workers and Perceptions of theNational Rural Employment Guarantee Act", Economic and Political Weekly, Vol.44, No. 43, October 24-30.
22
Korra, Vijay (2012), "The Role of MGNREA(S) in Seasonal Labour Migration: ACase of Andhra Pradesh", Unpublished PhD thesis, Centre for DevelopmentStudies, Jawaharlal Nehru University, New Delhi.
Labour File (2006), "One Hundred Days of Work" Vol. 4, No. 1, January-February,pp. 789-790.
Krishnamurthy, J (2006), "Employment Guarantee and Crisis Response", Economicand Political Weekly, Vol. 41, No. 9, March 4-10.
Mamgain P. Rajendra (2004), "Employment, migration and livelihoods in the HillEconomy of Uttaranchal", Centre for the Study of Regional Development Schoolof Social Sciences Jawaharlal Nehru University New Delhi - 110067 India.
MGNREGA (2005), "Mahatma Gandhi National Rural Employment Guarantee Act,(MGNREGA), 2005" Ministry of Rural Development, Government of India.
Pankaj, Ashok and Rukmini Tankha (2010), "Empowerment Effects of the NREGSon Women Workers: A Study in Four States", Economic and Political Weekly,Vol. XLV, No. 30, July 24.
Reddy D. Narasimha (2010), "Land and Labour in Andhra Pradesh", Economic andPolitical Weekly (EPW), Vol - XLV No. 39, September 25.
Reddy D. Narasimha and C. Upendranadh (2010), "National Rural EmploymentGuarantee: Issues, Concerns and Prospects", Oxfam India working papers seriesSeptember 2010, OIWPS - V.
Shah, Mihir (2008), "Structures of Power in Indian Society: A Response", Economicand Political Weekly, Vol. 43, No. 46, pp. 76-83, November 15-21.
Sharma N. Alakh (2006), "Flexibility, Employment and Labour Market Reforms inIndia", Economic and Political Weekly (EPW), Vol - XLI No. 21, May 27.