
Role of Cover Crops in Nutrient - University of Vermont
34
Transcript of Role of Cover Crops in Nutrient - University of Vermont


Role of Cover Crops in Nutrient Cycling and Soil Health
Kristy BorrelliNortheast SARE Pennsylvania State
Coordinator Penn State Extension

Overview
• Soil organic matter role in nutrient cycling
• Pools of soil organic matter
• Cover crop role in nutrient cycling
o Nitrogen retention
o Nitrogen supply
• Nitrogen contributions from soil organic matter

Soil Organic Matter (SOM) improves soil health
by directly influencing other soil components
Air25%
Water25%
Mineral Particles
45%
SOM5%

Healthy soil has structure and can
support life
SOM Role in Nutrient Cycling
• Soil Particle Aggregation
• Water Flow/Absorbance
• Support Organisms
• Root Growth
• Nutrients and Carbon Supply
• Chelates
• Cation Exchange Capacity
o Clays = 50-150 meq/100 g
o Humus > 200 meq/100 g
Low SOM
Poor Structure
High SOM
Good Structure

Scanning electron micrographs from
www.micropedology.uni-bremen.de
Soil animal photos
from [email protected]

Soil Organic Matter Pools
• Labile SOM - 5-20% of SOM• Simple compounds
• Principal energy source
• Changes rapidly
• Stable SOM - 60-90% of SOM• Stable structure, adsorbed to clay, protected in aggregates
• Changes slowly

Photo: Edwin Remsberg and USDA-SARE

Photo: Edwin Remsberg and USDA-SARE

Build Healthy Soil by diversifying SOM
inputs
Photo: Edwin Remsberg and USDA-SARE
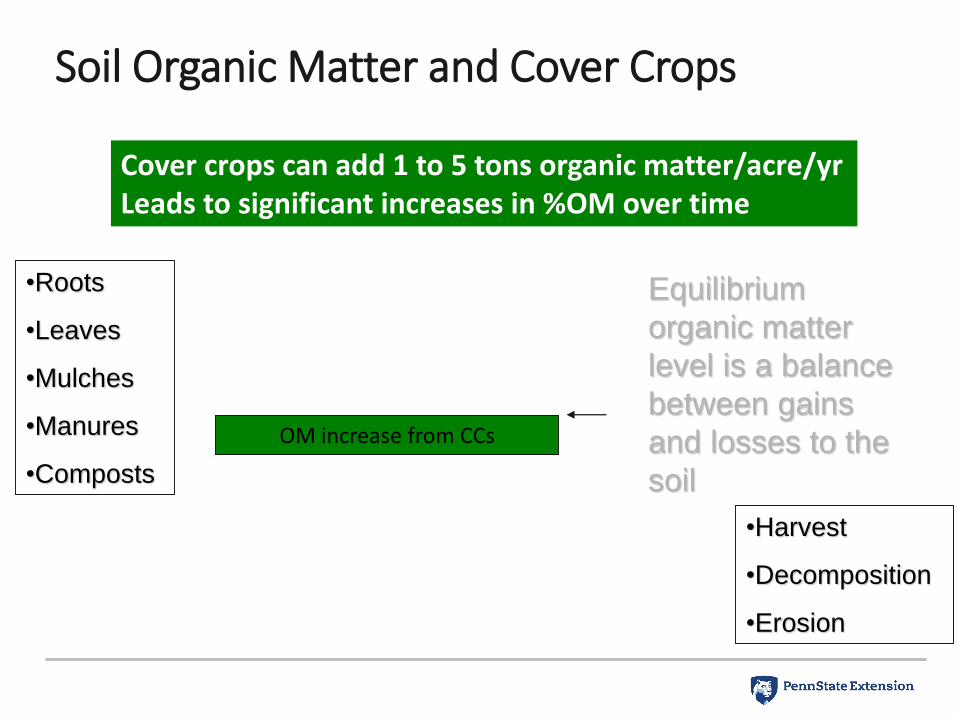
Soil
Organic Matter
Gains
Losses
•Roots
•Leaves
•Mulches
•Manures
•Composts
•Harvest
•Decomposition
•Erosion
Equilibrium
organic matter
level is a balance
between gains
and losses to the
soil
Soil Organic Matter and Cover Crops
Cover crops can add 1 to 5 tons organic matter/acre/yrLeads to significant increases in %OM over time
OM increase from CCs
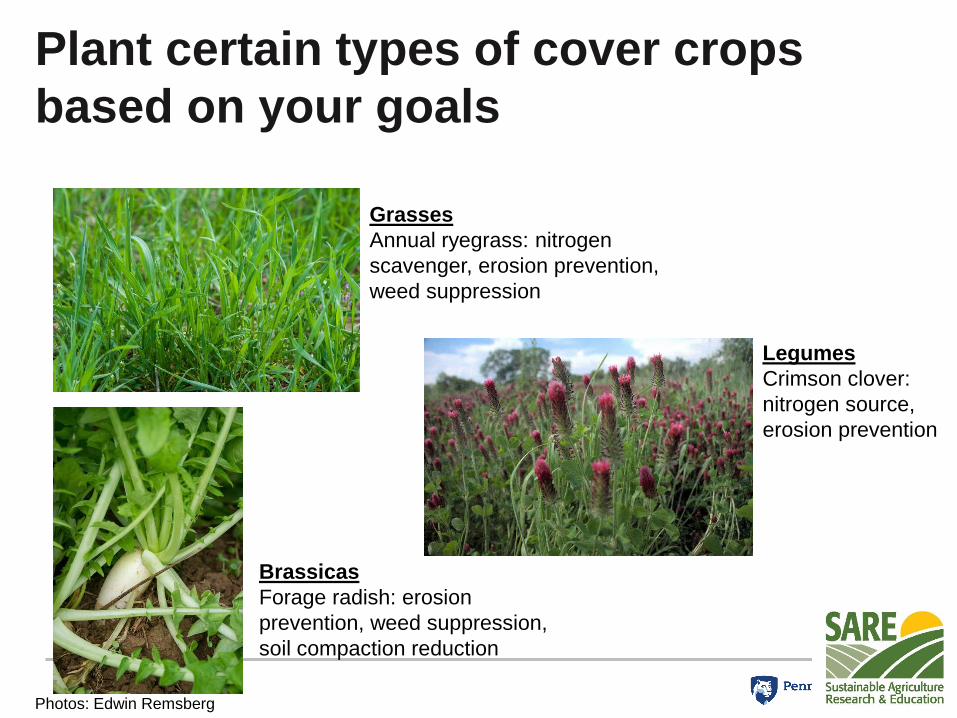
Plant certain types of cover crops
based on your goals
Legumes
Crimson clover:
nitrogen source,
erosion prevention
Brassicas
Forage radish: erosion
prevention, weed suppression,
soil compaction reduction
Grasses
Annual ryegrass: nitrogen
scavenger, erosion prevention,
weed suppression
Photos: Edwin Remsberg

Legume Crops
• Fix and Supply Nitrogen
o Root nodules
o Plant available form• Low C:N
o ~3.5 to 4% N before flowering
o ~3 to 3.5 % N after flowering
• Prior to N demanding crop
• Low biomass production
• Inoculate seeds

Brassica Crops (broadleaves)
• Deep taproots o Biodrilling
• Radish and Canola respond to high N soils
• Scavenge N o Produce less biomass
• Winterkilled or planted in early springo NO3 leaching
o Good in mixes
Photo: Edwin Remsberg and USDA-
SARE

Cereal Crops/Grasses
• Fibrous Roots
• High C:N
o ~ 2 to 3 % N before flowering
o ~1.5 to 2.5 % N after flowering
• Nitrogen Retention o Control NO3 leaching
• A lot of above ground biomass
• Between Summer Annuals
o Corn – Cover – Soybean

0
20
40
60
80
100
120
Fa
llow
Clo
ve
r
Pe
a
Oat
Ra
dis
h
3S
ppN
Ca
no
la
6S
pp
4S
pp
3S
ppW
Rye
Nit
rate
Le
ac
hin
g B
elo
w 1
2
Inc
he
s(l
bs
N/a
cre
)Red Clover vs. Austrian
Winter Pea
Species Characteristics Affect N Retention
Winterkilled
and/or fast
growing
legume
Includes Winterhardy
grass or brassica
No cover crop or
slow growing
legume
Rye (
20%
seed
rate
)
Rye (
20%
) +
Can
ola
(25%
)
Rye (
20%
) +
Can
ola
(50%
)
Rye (
50%
)

Cover crop species usually have a tradeoff
between N supply and N retention
Non-Legumes
Good N retention
Less N Supply
Legumes
Poor N retention
Greater N Supply
Cover crop biomass carbon:nitrogen
ratio influences N supply
Low C:N High C:N

C:N ratio of cover crop residues regulates
N supply vs. N tie up
5:1 10:1 15:1 20:1 30:1 40:1
Carb
on
:Nit
rog
en
Rati
o
N mineralization-
Microbes release excess N to soilN immobilization-
Microbes tie up N from soil
Clovers
Peas
Radish
Canola
Cereal Rye, Triticale
Annual Ryegrass
Oats
Sorghum sudangrass
Research Station Mixtures
On-Farm
MixturesN
eu
tral
min
era
lizati
on
/
imm
ob
iliz
ati
on
High Nitrogen
Concentration
Low Nitrogen
Concentration

0
5
10
15
20
25
Pe
a
Ra
dis
h
Clo
ve
r
Fallo
w
4S
pp
3S
ppN
6S
pp
Ca
no
la
Oat
3S
pp
W Rye
Co
rn S
ila
ge
Yie
ld (
T/a
c)
Corn Yield Declined with Increasing C:N Ratio of
Cover Crop
Rye (
20%
)
Rye (
20%
)
Rye (
20%
s
ee
d
rate
)
Rye (
50%
)
Rye (
100%
)
C:N 10 12 27 28 27 28
39 41

+
+ -
-
-+
Across sites and cover crop treatments, N retention
and supply were controlled by interrelated factors
Cover crop mixtures should be
tailored to site-specific soil
conditions
+
Fall Biomass
C:N
Spring
Biomass C:N
Spring
Biomass N
Non-Legume
Seeding Rate
Co
ver C
rop
Varia
ble
s
Soil Organic
Matter
Fall Soil NO3--
N
So
il V
ari
ab
les
N Supply
to Corn
NO3-
Leaching

To prevent nitrate leaching:
• For every 3 ppm soil nitrate-N at cover
crop planting, add 10 %pts to the
seeding rate of winter-hardy grasses
• Fill in remaining seeding rate to 100%
with legumes or other species of
interest
Key Takeaways for Nitrogen Management with Cover Crop
Mixtures
To maintaining N supply to next crop:
• Non-legumes decrease N supply, but this can be offset by high soil organic
matter
• To achieve high levels of both N retention and N supply, maintain low fall
soil nitrate levels and/or increase SOM levels
Example
12 ppm nitrate-N =
40% winter-hardy grass seeding rate

Graphical Decision Support Tool: CC & SOM
Credited N-Recommendation
• Developed a tool based on trials through PA
• Calculates:o N contribution from CCs and SOM based
on site-specific measurements
o Adjusted fertilizer recommendation to achieve yield potential
• Fall GDD at cover crop planting
• Spring GDD at cover crop termination

= 0.65
RY24 lbs cc-N / ac
100% non-
legume
• 35 lbs N applied as manureo Determined from
testing and availability factors
• 69 lbs N/ac minus35 lbs manure-N =
34 lbs N/ac
Calculating CC-credited N-rates
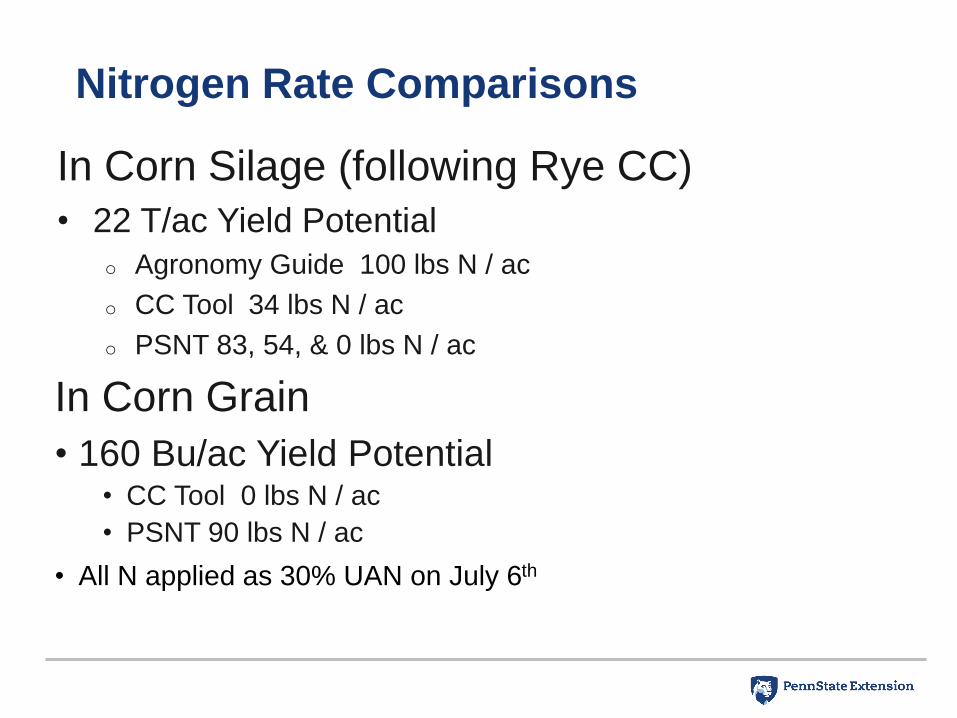
Nitrogen Rate Comparisons
In Corn Silage (following Rye CC)
• 22 T/ac Yield Potential
o Agronomy Guide 100 lbs N / ac
o CC Tool 34 lbs N / ac
o PSNT 83, 54, & 0 lbs N / ac
In Corn Grain
• 160 Bu/ac Yield Potential • CC Tool 0 lbs N / ac
• PSNT 90 lbs N / ac
• All N applied as 30% UAN on July 6th

Evaluation
• To evaluate corn N sufficiency throughout
the season:
o Ear leaves were sampled at tasseling (VT) to determine N
concentrations.
o Late-season corn-stalk nitrate testing was conducted at ½ milk-
line stage.
o Corn silage and grain yields were measured.
• Means comparisons using PROC Mixed
o Treatment as fixed effect, Block as Random Effect

Corn Silage Results
0.0
2.0
4.0
6.0
8.0
10.0
12.0
14.0
16.0
18.0
20.0
22.0
Yie
ld @
65%
mois
ture
(T
on/A
c)
Treatment
Corn Silage Yield
AgroGuide
CCTool
PSNT
Historical Yield Potential
• NSD
• P=0.15
0
0.5
1
1.5
2
2.5
3
3.5
Earl L
eaf-
N (
%)
Treatment
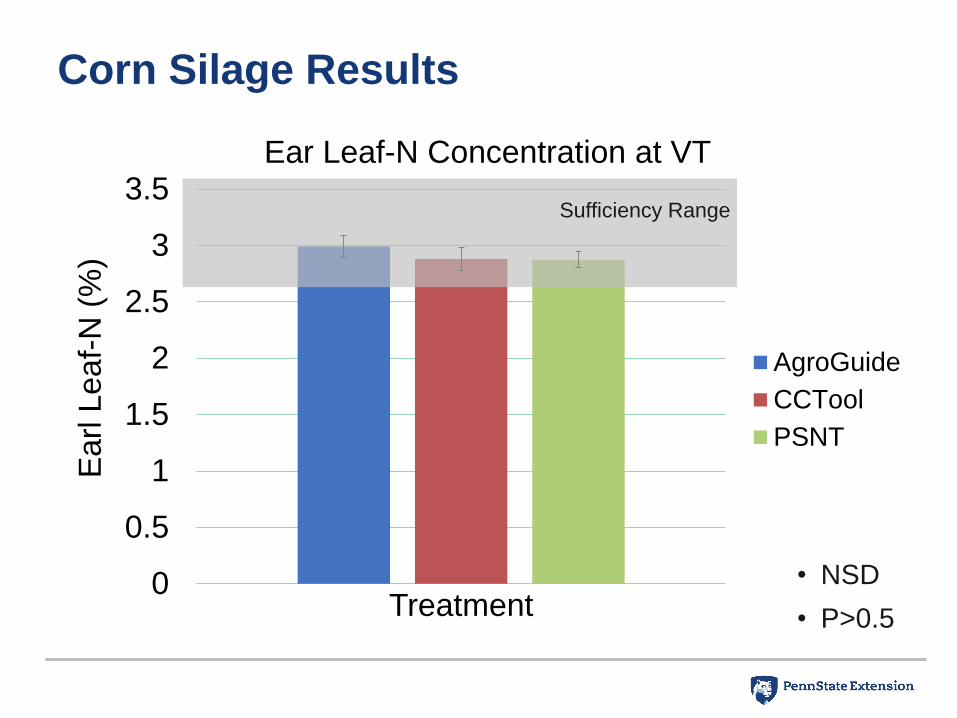
Ear Leaf-N Concentration at VT
AgroGuide
CCTool
PSNT
Corn Silage Results
Sufficiency Range
• NSD
• P>0.5

Corn Silage Results
0
1000
2000
3000
4000
5000
6000
7000
8000
9000
Nitra
te-N
(m
g/k
g)
Treatment
Late Season Corn Stalk Nitrate
AgroGuide
CCTool
PSNT
Optimal Range
• NSD
• P=0.15

0
20
40
60
80
100
120
140
160
Gra
in Y
ield
@ 1
5.5
% M
ois
ture
(Bu
/ a
c)
Treatment
Corn Grain Yield
CCTool
PSNT
Corn Grain Results
Historical Yield Potential
• NSD
• P>0.5

0
0.5
1
1.5
2
2.5
3
3.5
Ear
Le
af-
N (
%)
Treatment
Ear Leaf-N Concentration at VT
CCTool
PSNT
Sufficiency Range
Corn Grain Results
• NSD
• P=0.11

Corn Grain Results
0
500
1000
1500
2000
2500
3000
3500
4000
4500
Nitra
te-N
(m
g/k
g)
Treatment
Late Season Corn Stalk Nitrate
CCTool
PSNT
Optimal Range
P<0.05

Conclusions
• CC Tool recommended N fertilizer rate was
sufficient to meet the needs of a no-till corn silage
and corn grain crops
• The CC Tool recommended N rate was lower
than both the Agronomy Guide recommendation
and the PSNT recommendation,
o Highlights need/opportunity to credit the N contribution
of cover crops and soil organic matter.

Summary
• SOM is important in improving both physical and
biochemical aspects of nutrient cycling
• Cover crop management strategies depend on goals and
should be tailored to site specific conditions
• N retention and supply determined largely by cover crop
C:N, soil fall NO3- supply, and SOM
• SOM and cover crop residue contributions need to be
considered for effective nutrient management
Thank You
Thanks to: Charlie White and Anthony Colin
Funding provided by:
Northeast SARE Pennsylvania State Program
Cover Crop Innovations: A Training Program for Agricultural
Service Providers
Kristy Borrelli


