Role of biological fertilizers on potassium supply … · Role of biological fertilizers on...
28
Role of biological fertilizers on potassium supply and its uptake by maize and soybean under greenhouse experiments Girma Abera, Zerihun Getachew and Sheleme Beyene College of Agriculture Hawassa University Potash symposium, Nov. 24-26, 2015 Hawassa University, Hawassa
Transcript of Role of biological fertilizers on potassium supply … · Role of biological fertilizers on...

Role of biological fertilizers on potassium supply and its uptake by maize and soybean
under greenhouse experiments
Girma Abera, Zerihun Getachew and Sheleme Beyene
College of Agriculture Hawassa University
Potash symposium, Nov. 24-26, 2015
Hawassa University, Hawassa

Outline
• Introduction
• Forms of potassium
• Sources of potassium nutrient
• Maize and soybean K requirements
• Objectives of the study
• Methodologies
• Results
• Conclusions
• Recommendations

Introduction
• Potassium(K) is one of the 17 essential elements to all forms of life
• Seventh most abundant element in the Earth’s crust • Yet only 1-2% is available (CFAITC, 2009)
Ca2+, Mg2+ NO3
- NH4+ PO4-

Introduction…
• Potassium is chemically an active metal element, it never found in pure elemental state in nature.
• It always combine with one or more other elements

Introduction….
Forms of Potassium
• Total K content has of little value in determining soil K supply to growing plants
• Potassium exist in three forms in soils
Slowly available K
Readily Available K
1-10% K 1-2% K
Relatively Unavailable K
90-98% K
Non-exchangeable Exchangeable Exchangeable

Introduction…
• K is an essential nutrient required for plant growth and reproduction
• It is often referred to as “the regulator” since it is involved with over 60 different enzyme systems in plants
• It is vital for – photosynthesis,
– protein synthesis,
– associated many metabolic functions,
– regulate leaf stomata opening and water use efficiency

Introduction….
• However, K does not form organic compounds (not a structural component) in plant system
• K levels in plants for optimal growth are between 2 and 3% of the dry weight
• Potassium often receives less attention than N and P in many crop production systems

Introduction….
Sources of potassium elements
• many sources of K that are available for replacing the nutrients removed from the soil in harvested crops (Mikkelsen, 2008)
These sources are In organic sources
• Primary and secondary minerals • Chemical fertilizers
Organic sources • Crop residues • Farm yard manures • Compost Crop residues

Table 1. Average nutrient balances of some sub-Saharan African countries
-41 -47 -6 -7 -26 -32
Based on IFDC estimate of nutrient balance (Stoorvogel and Smaling, 1990).

Introduction…
• Many previous works which assessed organic resources (like, crop residues and farm yard manures) as fertilizers were investigated mainly for their N supplying potential and secondly for phosphorus.
• Information with regards to organic fertilizers as K source are limited
• In the present study we assessed the role of organic fertilizers, Bradyrhizobium inoculation and sulfur fertilizers application effects on K uptake and utilization by maize and soybean under greenhouse conditions

Methodologies Soil sampling and analyses
– from Hawassa, Andosol
– from Assosa, Nitisols
• soil were sampled from 0-20 cm depth – chemical and physical proprties (Table 1)
• Pot experiments (5 litter pot size) using – 4 kg soil in each pot
– Watered as requried (as per the treaments need)
Experimental design
• The two experiments were set in factorial arrangement in completely randomized design

Methodologies…
1. Effect of legume residues dceompsoition on nutrient supply and uptake by a test crop maize, BH660 hybrid variety
• 2 x 4, 2 moitsure levels and 4 crop residues
– Soil moisture (pF2.5 and pF3.5)
– Residues of HB, PP, M were applied at 20 g kg-1 and tested along the control (no residue amended).

Methodologies….
2. The soybean experiment was laid out in a
factorial CRD with:
(i) 4 levels of Sulfur (0, 20, 30, and 40 kg S ha-1)
(ii) 4 Bradyrhizobium inoculum (0, TAL-379, MAR-1495 and
SB-6-1-A2)
(iii) 2 Soybean varieties (Belessa-95 and Wollo), with 5 reps
and consisted of 32 treatments.
Standard procedures were followed and clean environment
were created for soybean inoculation in a greenhouse

Methodologies….
• The field had no history of inoculation, soybean cultivation
and no history of fertilizer application
• S was applied as K2SO4
• A starter dose of N at 18 kg N ha-1 as urea and
• P as TSP at 26 kg P ha-1 were applied to each treatment
pots (5 kg soil).
• Basal nutrients were also added to each pot to prevent deficiency of other nutrients

Results
Soil parameters Andosol (Hawassa soil) Nitisol (Assosa soil)
Clay Silt sand
21 42 37
33 25 42
pH (in H2O) 6.6 5.28
Organic C(%) 1.3 1.9
Total N(%) 0.09 0.12
Available P (ppm) 24.1 14.55
Av. S (ppm) 34.0 2.97
K (ppm) 741 362.7
Table 1. Selected soil physical and chemical properties of the experimental soils

Results …
Residue types
Parameter PP HB M
C (%) 45 39.8 43.6
N (%) 2.45 1.38 43.6
P (%) 0.21 0.18 0.15
K(%) 1.7 2.13 2.43
Ca(%) 1.03 2.35 0.35
Mg 0.15 0.25 0.17
Fe (g kg-1) 1.58 1.22 1.08
Zn(g kg-1) 0.73 0.56 0.53
C/N 18.4 28.9 33.7
Table 2. Selected total element concentrations in applied crop residues

Results….
Af
0
5
10
15
20
25
30
35
C PP HB M
Dry
sho
ot b
iom
ass
(g) pF2.5
pF3.5•28-47%
PP
M
•Direct effect on growth and indirect effect through affecting microibal acitivty
An
Figure 1. Dry shoot biomass (g pot-1) of maize as affected by residue amendments and soil moisture
a
b
b b
A
B B C
Crop residues pF2.5 pF3.5
N P K N P K
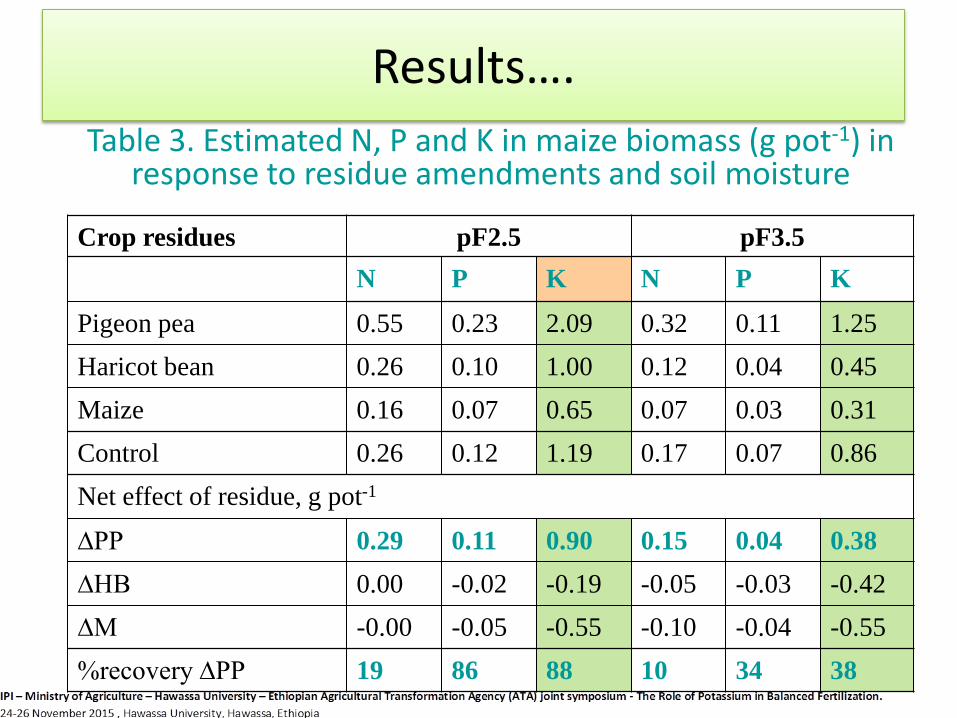
Pigeon pea 0.55 0.23 2.09 0.32 0.11 1.25
Haricot bean 0.26 0.10 1.00 0.12 0.04 0.45
Maize 0.16 0.07 0.65 0.07 0.03 0.31
Control 0.26 0.12 1.19 0.17 0.07 0.86
Net effect of residue, g pot-1
∆PP 0.29 0.11 0.90 0.15 0.04 0.38
∆HB 0.00 -0.02 -0.19 -0.05 -0.03 -0.42
∆M -0.00 -0.05 -0.55 -0.10 -0.04 -0.55
%recovery ∆PP 19 86 88 10 34 38
Table 3. Estimated N, P and K in maize biomass (g pot-1) in response to residue amendments and soil moisture
Results….

Results….
Treatment No. Pod/
Plant
No. Seed/
Pod
No. Seed/
Plant
Grain
Yield/pl
Biomass
yield/pl
100SW
Variety
Belessa-95 14.89a 2.44a 36.70 a 5.81a 10.48b 15.89 a
Wollo 13.68b 2.32b 32.14b 4.44b 11.00a 13.50 b
LSD 0.3628 0.0385 1.192 0.1801 0.2758 0.4313
Sulfur(kg ha-1)
0 13.62c 2.31b 32.08b 4.09b 11.21a 13.28b
20 15.66a 2.35b 37.04a 5.42a 11.26a 14.78a
30 14.62b 2.44a 35.87a 5.59a 10.08b 15.38 a
40 13.25c 2.43a 32.70b 5.40a 10.42b 15.32 a
LSD 0.6775 0.0718 2.22 0.3363 0.5151 0.8053
CV(%) 6.22 3.95 8.49 8.61 6.29 7.19
Table 4. Main effects of variety and sulfur rate on agronomic parameters of soybean

Results….
Treatment No. Pod/
Plant
No. Seed/
Pod
No. Seed/
Plant
Grain
Yield/pl
Biomass
yield/pl
100SW
B.rhizobium
TAL-379 14.45b 2.28c 33.16b 4.43c 9.83c 13.74b
MAR-1495 16.37a 2.59a 42.62a 7.69a 12.13a 18.61a
SB-6-1-A2 14.20b 2.36b 33.95b 5.05b 10.56b 14.50b
Control (unino.) 12.12c 2.29bc 27.95c 3.32d 10.45b 11.92c
LSD 0.6775 0.0718 2.22 0.3363 0.5151 0.8053
CV(%) 6.22 3.95 8.49 8.61 6.29 7.19
72.4% 31.0%
The results revealed that inoculation of soybean varieties resulted in increase of agronomic parameters no. of pod/plant, no. of seed/pod, no. of seed/plant, etc.
Table 5. Main effects of Bradyrhizobium strain on agronomic parameters of soybean

Results….
Strains Nutrient concentrations Nutrient uptake (mg plant-1)
N P K S N P K S
MAR-1495 2.53DE 0.25A 2.15A 0.57A 209a 20.4A 178BC 46.7B
SB-6-1-A2 2.32E 0.20B 2.44A 0.57A 121b 10.3BC 126.8C 29.5C
TAL-379 1.91G 0.22AB 2.25A 0.56A 129b 15.2B 152BC 37.5BC
Control 1.76H 0.07C 1.29B 0.15B 46.2c 1.8C 33.7E 3.9DE
LSD(5%) 0.107 0.045 0.388 0.097 8.98 3.62 29.80 7.01
76.7% 351.8% 871.8%
Table 6. Effect of Bradyrhizobium strains on shoot nutrient concentrations and uptake of soybean

Results….
Treatments
AGBM
HI
Protein
content
Total nutrient uptake (mg plant-1)
N P K S
Variety
Belessa-95 16.30a 34.76a 32.75 398.83a 56.36 278.13a 62.76a
Wollo 15.44b 28.14b 32.22 350.54b 54.52 247.92b 56.55b
LSD 0.3242 0.8223 NS 14.46 NS 8.00 2.29
Sulfur(kg ha-1)
0 15.31b 26.22c 32.98 328.62b 45.28c 213.32c 24.36d
20 16.68a 31.92b 32.44 384.86a 59.45ab 266.34b 62.79 c
30 15.67b 34.77a 31.92 394.52a 56.47b 297.84a 69.47b
40 15.82b 32.88b 32.62 390.75a 60.58a 274.58b 81.99a
LSD 0.6053 1.535 NS 27.01 3.98 14.95 4.28
CV(%) 5.00 6.41 6.27 9.46 9.43 7.46 9.43
Table 7. Main effects of variety and sulfur rate on agronomic parameters and nutrient uptake of soybean

Results….
Treatment
AGBM
HI
Protein
content
Total nutrient uptake (mg plant-1)
N P K S
B.rhizobium
Uninoc. (0) 13.77c 24.00c 24.55d 211.84d 30.00d 216.31c 48.86c
TAL-379 14.27c 31.81b 31.01c 307.99c 51.02c 256.75b 45.51c
MAR-1495 19.83 a 38.52 a 40.92a 626.55a 73.98a 325.36a 82.38a
SB-6-1-A2 15.61b 31.45b 33.47b 352.37b 66.77b 253.67b 61.86b
LSD 0.6053 1.535 1.55 27.01 3.98 14.95 4.28
CV(%) 5.00 6.41 6.27 9.46 9.43 7.46 9.43
Table 8. Main effects of Bradyrhizobium strain on agronomic parameters and nutrient uptake of soybean

Conclusions
• The higher biomass and plant growth of maize when PP amended showed probably a combined result of low C/N and the total amounts of N, P and K was higher for this amendments than others
• This suggest the importance of balanced nutrient supply
• There is high K and P recovery than N from the crop residues, suggesting that they are under less microbial metabolism than N

Conclusions ..
• Bradyrhizobium inoculation revealed higher K nutrient concentration and uptake of soybean, suggesting the synergistic effect on N and P application on K
• This also pinpoints that unless K fertilizer is applied, biological N fixation will quickly exhaust soil K content.

Recommendation
• Detailed studies on the role of organic resources as K fertilizer sources are required to reach conclusive recommendations
• We suggest a further study on the effects of Bradyrhizobium inoculation on K uptake and utilization by soybean plants

Acknolwdgements
• NUFU-legume rhizobia project
• EIAR
• Hawassa University

Thank you for your attention!