Roland Berger SoutheastAsia-Thenewfrontiersforhealthinsurers 20130913

Megatrend 2 Globalization & future markets
Roland Berger Trend Compendium 2030
February 2018

2Roland Berger Trend Compendium 2030 - Trend 2 Globalization and future markets.pptx
About the Roland Berger Trend Compendium 2030
What is it?> The Roland Berger Trend
Compendium 2030 is a global trend study compiled by Roland Berger Institute (RBI), the think tank of Roland Berger
> It describes the most important megatrends that will shape the world between now and 2030
> The megatrends have a broad impact on the environment of companies, strongly influencing challenges and opportunities of their business
Our approach> We first screened relevant trend,
scenario and future studies worldwide
> Then we verified, analyzed and consolidated the results, using them to define the megatrends
> Next, we broke down the mega-trends into subtrends, looking at each from a global perspective and the viewpoints of industriali-zed and developing countries
> Finally, we identified corporate actions that companies worldwide should consider taking today
Use it!> For your own presentations,
for discussions with clients and business partners or as springboards for acquisition approaches
> Following the description of the subtrends and the recommended corporate actions, you will find the most important sources to help you keep track of the changes in the world, as well as dig deeper into the trends presented

3Roland Berger Trend Compendium 2030 - Trend 2 Globalization and future markets.pptx
The Roland Berger Trend Compendium 2030 focuses on stable long term developments
> The Roland Berger Trend Compendium covers megatrends – long-term developments with major impact (usually global) on companies, economies and the natural world
> The forecasts are based on estimates reflecting the "normal" case, i.e. a stable development of the global economy with no unexpected events ("black swans"). Major political or financial crises, large-scale natural disasters or similarfar-reaching events are not integral to our assumptions
> To incorporate today's volatile, uncertain, complex and ambiguous (VUCA) environment into strategic planning we recommend to combine the megatrends of the Roland Berger Trend Compendium with the Roland Berger scenario planning approach
Methodology

4Roland Berger Trend Compendium 2030 - Trend 2 Globalization and future markets.pptx
It covers seven megatrends that shape the future development of our world
Demographic dynamics
Globalization & future markets
Scarcity of resources
Climate change & ecosystem at risk
Dynamic technology & innovation
Global knowledge society
Sustainability & global responsibility
Megatrends
1 2 3 4 5 6 7
5Roland Berger Trend Compendium 2030 - Trend 2 Globalization and future markets.pptx
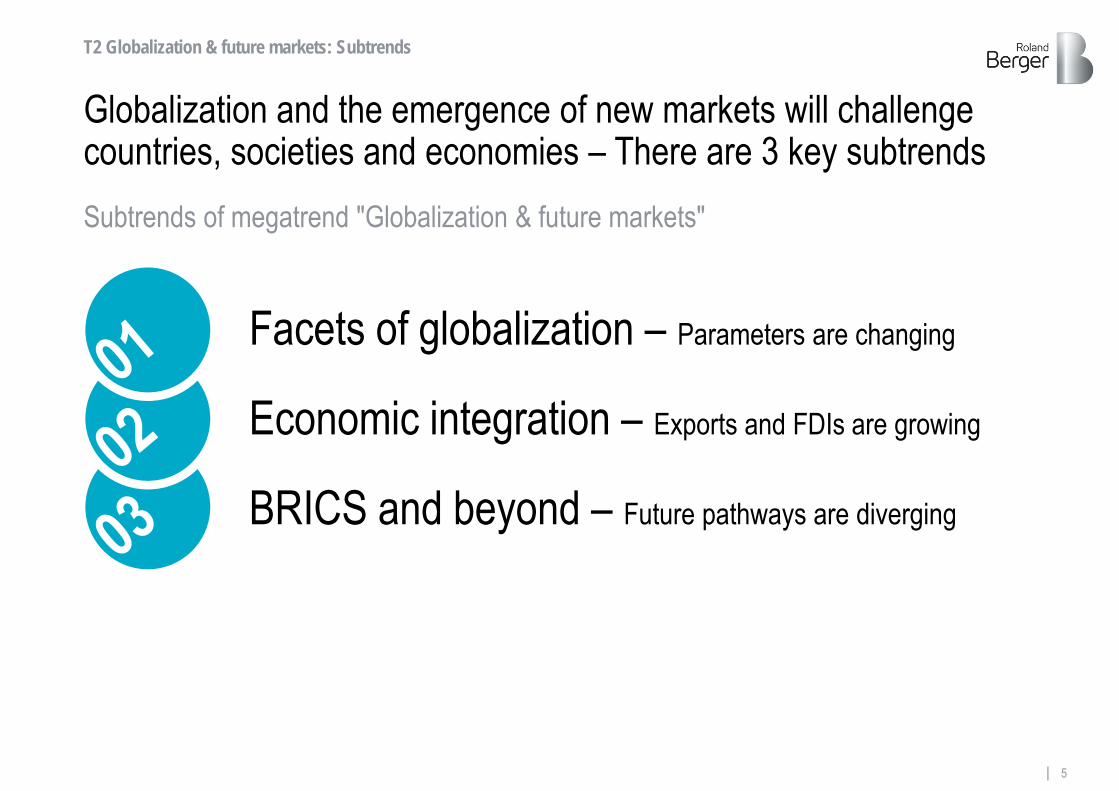
Globalization and the emergence of new markets will challenge countries, societies and economies – There are 3 key subtrends
T2 Globalization & future markets: Subtrends
Facets of globalization – Parameters are changing
Economic integration – Exports and FDIs are growing
BRICS and beyond – Future pathways are diverging
Subtrends of megatrend "Globalization & future markets"

6Roland Berger Trend Compendium 2030 - Trend 2 Globalization and future markets.pptx
Globalization is a multifaceted process not limited to economic effects – Political and social aspects run in parallel
> Globalization is especially evident in the development of cross-border trade flows connecting international markets
> Key measures are exports of goods and services as well as flows of foreign direct investments
> Economic aspects of globalization can be clearly quantified
> With strong growth in developing economies, ongoing globalization brings along a shift in distribution of GDP and exports
> Political globalization alludes to a strengthening of international links of governments
> More recently, politics appear to be a reflection of an increasing reciprocity between all three facets of globalization
> Currently, the political landscape is confronted with trends of protectionism, a more nationalist world view and issues relating to migration
> Future developments are very difficult to forecast, but also equally impactful
> Society plays a key role in evaluating economic and political aspects of globalization
> It especially sets the course for political discussion and activism, which tend to take place on an increasingly international level
> Besides, society is affected by the recent progress of digitalization and digital innovation bringing the world closer together
> Multiple aspects will shape an increasingly globalized and connected society
1. Facets of globalization – Parameters are changing
Economy Politics Society
Three main facets of globalization

7Roland Berger Trend Compendium 2030 - Trend 2 Globalization and future markets.pptx
Developing countries, particularly in Asia Pacific, will be able to bring their economies to the fore
> The distribution of world income will gradually change until 2030. Shares in GDP will shift from North America and Europe primarily to Asia Pacific
> Today Asia Pacific accounts for 32% of global GDP while Europe and North America account for 27% and 28% respectively. In 2030 Asia Pacific will account for 44% of global GDP while Europe's and North America's share is falling to 23% and 22% respectively
> In absolute numbers Europe's nominal GDP will not even double from 2015 to 2030 (+85% increase), while nominal GDP in Asia Pacific is expected to triple
1. Facets of globalization – Parameters are changing
Distribution of global GDP
Asia Pacific
EuropeNorth America
AfricaLatin America
Source: Oxford Economics
Share of global GDP1) [% based on nominal values (USD)]
1) Gross Domestic Product
05
1015202530354045
2015 2020 2025 2030
44.0
22.721.7
6.24.9
8Roland Berger Trend Compendium 2030 - Trend 2 Globalization and future markets.pptx
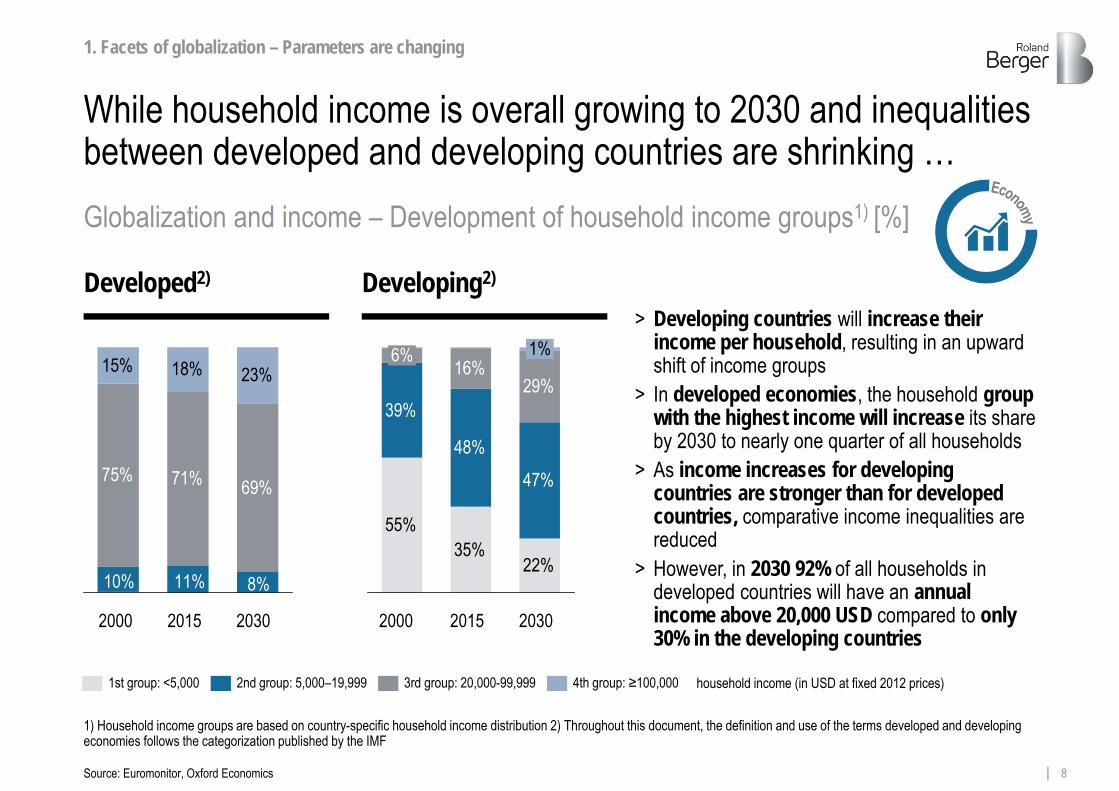
While household income is overall growing to 2030 and inequalities between developed and developing countries are shrinking …
55%35%
22%
39%
48%47%
16%29%
6% 1%
household income (in USD at fixed 2012 prices)
2015 20302000 2015 20302000
1st group: <5,000 2nd group: 5,000–19,999 4th group: ≥100,000 3rd group: 20,000-99,999
1) Household income groups are based on country-specific household income distribution 2) Throughout this document, the definition and use of the terms developed and developing economies follows the categorization published by the IMF
> Developing countries will increase their income per household, resulting in an upward shift of income groups
> In developed economies, the household group with the highest income will increase its share by 2030 to nearly one quarter of all households
> As income increases for developing countries are stronger than for developed countries, comparative income inequalities are reduced
> However, in 2030 92% of all households in developed countries will have an annual income above 20,000 USD compared to only 30% in the developing countries
1. Facets of globalization – Parameters are changing
Developed2) Developing2)
71% 69%
15% 18% 23%
8%11%10%
75%
Globalization and income – Development of household income groups1) [%]
Source: Euromonitor, Oxford Economics

9Roland Berger Trend Compendium 2030 - Trend 2 Globalization and future markets.pptx
1990 2000 2010 2020 2030
0.5
0.4
0.3
… nevertheless, income inequality within countries will slightly increase
1) Based on population-weighted Gini coefficients. Higher values indicate more inequality. If the Gini coefficient value is less than 0.2, the income distribution is said to be highly equal, between 0.2 and 0.3 it is relatively mean, between 0.3 and 0.4 moderately reasonable and values above 0.4 indicate large income inequality
> Between 2015 and 2030 income inequalities will increase stronger in developed countries than in the developing countries as the Gini coefficient shows (+2.1% vs. +0.9%)
> In the time period from 1990 to 2030, the five countries facing largest increases in Gini coefficients are Azerbaijan, Pakistan, Vietnam, Russia and Turkmenistan (+45% to 60%)
> The Kuznets curve by economist Simon Kuznets assumes that rising inequality is typical for developing economies as those with modest funds profit from large growth rates, whereas people in absolute poverty do not move forward. For developed countries inequality decreases after a certain turning point, as income per capita increases
> However, economist Thomas Piketty argues that wealth inequality also increases for developed countries in the future as the rate of capital return is persistently greater than the rate of economic growth, shifting income to capital owners
1. Facets of globalization – Parameters are changing
Source: Euromonitor, Oxford Economics
Income inequality within countries1) [Gini coefficient]
0.44
0.40
Developing Economies
DevelopedEconomies

10Roland Berger Trend Compendium 2030 - Trend 2 Globalization and future markets.pptx
Globalization triggers advocacy as well as opposing views –This can be seen in both political and socio-economic settings
> Donald Trump, the President of the United States, promotes a protectionist approach. He sees globalization as a zero-sum game and is openly highly critical of the WTO
> Events like BREXIT, initiated in June 2016, might pose new challenges to the economic and political relevance of the EU
> Besides, the political landscape of some European countries is faced with significant right-wing surges arguing for a more nationalist focus
> French economist Thomas Piketty, a prominent opponent of the current form of globalization characterized by e.g. a lack of political intervention, criticizes the rising degree of income inequality
> Proponents of globalization promote advocacy of free trade to fuel the economy underpinned by free trade agreements
> The general neo-liberal idea of free markets clearly favors the course of a globalizing world
> Europe benefits from events such as France electing a president with a pro-European agenda and global perspective
> As embodied by e.g. the World Bank, globalization should provide developing countries with the opportunity to attract foreign capital and prosper
> Increased competition through larger markets will lead to more transparency and hence efficiency
> As a side effect, free labor markets allow a more efficient distribution of talent
1. Facets of globalization – Parameters are changing
Proponent
Proponent and opponent views of globalization
Opponent

11Roland Berger Trend Compendium 2030 - Trend 2 Globalization and future markets.pptx
The future direction and understanding of globalization is strongly influenced by incumbent political leaders and global influencers
1. Facets of globalization – Parameters are changing
Source: The Washington Post, World Economic Forum
"Make our planet great again."
"America first."
"Our leaders chose globalization, which they wanted to be a happy thing. It turned out to be a horrible thing."
Emmanuel Macron, June 2017
Donald J. Trump, 2016
Marine Le Pen, February 2017
Proponent Opponent
"If trade stops, war starts." Jack Ma1), February 2017
"Many of the problems troubling the world are not caused by economic globalization."
Xi Jinping, 2017
1) Founder and executive chairman of Alibaba Group
Statements of proponent and opponent views of globalization

12Roland Berger Trend Compendium 2030 - Trend 2 Globalization and future markets.pptx
Increasing international migration constitutes one major aspect of globalization with a strong impact on society and political debate
> Globalization goes hand in hand with increasing international migration. In 2015 about every 10th person in Europe was a migrant, every 6th in North America and every 5th person in Oceania
> Migration will remain a key topic, especially for developed regions such as Europe. Migration is not a one-sided benefit. It is a necessary process to preserve Europe's economic power. Between 1990 and 2015 the share of international migrants increased by over 50% in Europe and North America
> Leveraging the full potential of migration requires fundamental political and socio-economic measures for successful integration and education as opposed to an increasing protectionist backlash
> The number of asylum seekers quadrupled in the EU in the last five years – leading to controversy and political debate
1. Facets of globalization – Parameters are changing
9.8
10.17.7
6.8
20.417.217.5
15.712.9
201520001990
Europe
NorthAmerica
Oceania
Source: UN DESA
Share of international migrants
Migration in a globalized world – Share of international migrants in selected regions [% of regional population]

13Roland Berger Trend Compendium 2030 - Trend 2 Globalization and future markets.pptx
Finally, digitalization and growing global data flows have the potential to change key parameters of globalization
> Data flows will become a central measure of globalization forming the basis for economic and social interaction
> Potentially, globalization will be less based on the development of trade flows than on digital interconnection between countries
> In 2021, Asia Pacific will take over nearly half (47%) of global data traffic, whereas Western Europe will account for only 9%
> The share of internet users from developed economies decreased from 48% in 2008 to 29% in 2016. By contrast, the share of internet users from developing countries increased to 71%
> The average share of individuals owning smartphones in developing countries will increase from 40% in 2015 to 82% by 2030 – almost on a par with developed economies (83%)
> Digitalization removes borders bringing societies closer together
49
35
24
17
117
4
2015
CAGR +52%
202120202019201820172016
1. Facets of globalization – Parameters are changing
Changing markets and societies
Source: Cisco, Euromonitor, ITU
Digitalization – Changing markets and mobile data traffic [exabytes per month]
Global mobile data traffic
14Roland Berger Trend Compendium 2030 - Trend 2 Globalization and future markets.pptx
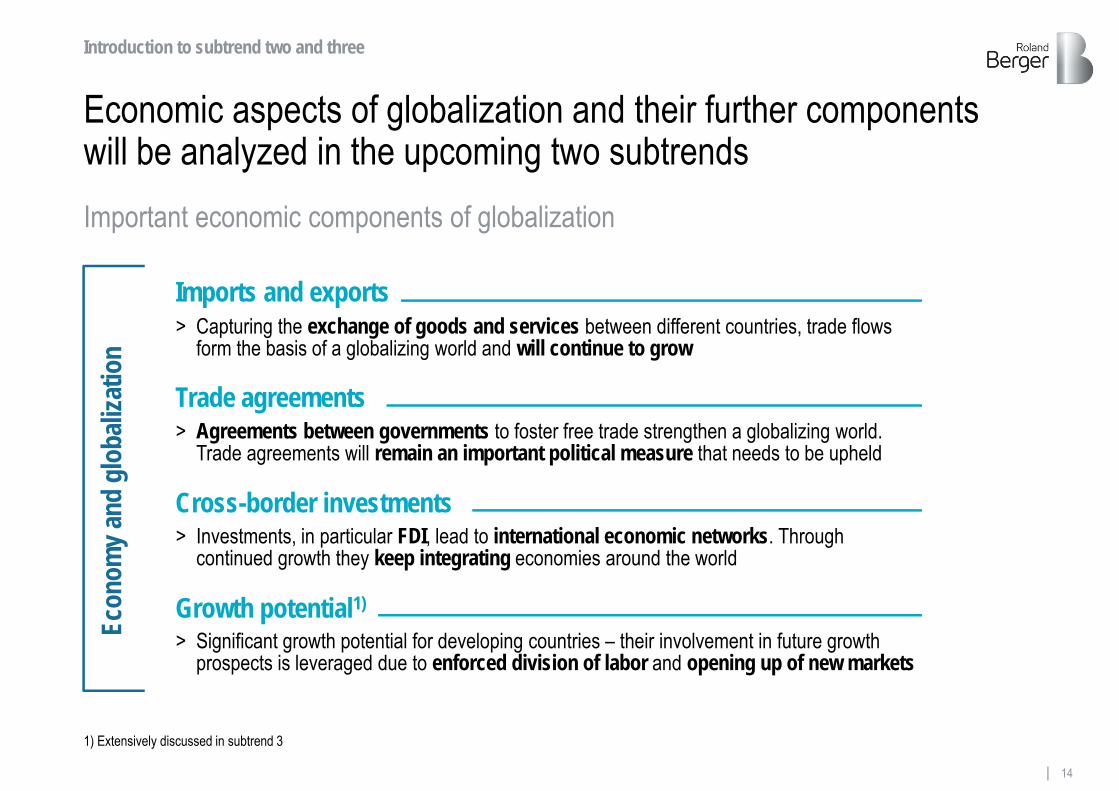
Economic aspects of globalization and their further components will be analyzed in the upcoming two subtrends
Econ
omy a
nd g
loba
lizat
ion
Imports and exports
Growth potential1)
Cross-border investments
> Capturing the exchange of goods and services between different countries, trade flows form the basis of a globalizing world and will continue to grow
> Investments, in particular FDI, lead to international economic networks. Through continued growth they keep integrating economies around the world
> Significant growth potential for developing countries – their involvement in future growth prospects is leveraged due to enforced division of labor and opening up of new markets
Trade agreements> Agreements between governments to foster free trade strengthen a globalizing world.
Trade agreements will remain an important political measure that needs to be upheld
Important economic components of globalization
1) Extensively discussed in subtrend 3
Introduction to subtrend two and three

15Roland Berger Trend Compendium 2030 - Trend 2 Globalization and future markets.pptx
60
80
100
120
140
160
180
200
220
240
2015 2020 2025 2030
Despite the controversy over globalization, GDP, exports and FDI flows are expected to grow – Albeit at different rates
> Forecasts see an ongoing international orientation in economic terms as mirrored in exports and FDI growth
> Globalization will continue throughout the next years, with worldwide exports growing faster than worldwide GDP. While CAGR of nominal GDP is 5.5%, CAGR of exports between 2015 and 2030 is 5.9%. By 2030, worldwide exports will have more than doubled
> A slightly different trend is visible for FDI outward flows, growing less at a CAGR of 2.8%. The weak performance until 2017 can be attributed to relatively weak global economic growth. Still, in coming years, FDI flows are expected to grow again
Ongoing international integration – Global development of GDP, exports of goods and services, and FDI1) outward flows [index]
Basis year 2015 = 100; based on nominal values (USD)
ExportsGDP
FDI
2. Economic integration – Exports and FDIs are growing
Source: Oxford Economics, OECD
235223
151
1) FDI = Foreign direct investment; according to OECD, FDI flows are important for developing economies, as they lead to technology spillovers and international trade integration
16Roland Berger Trend Compendium 2030 - Trend 2 Globalization and future markets.pptx
2015 2020 2025 2030
400
350
300
250
200
150
100
50
Developed Developing
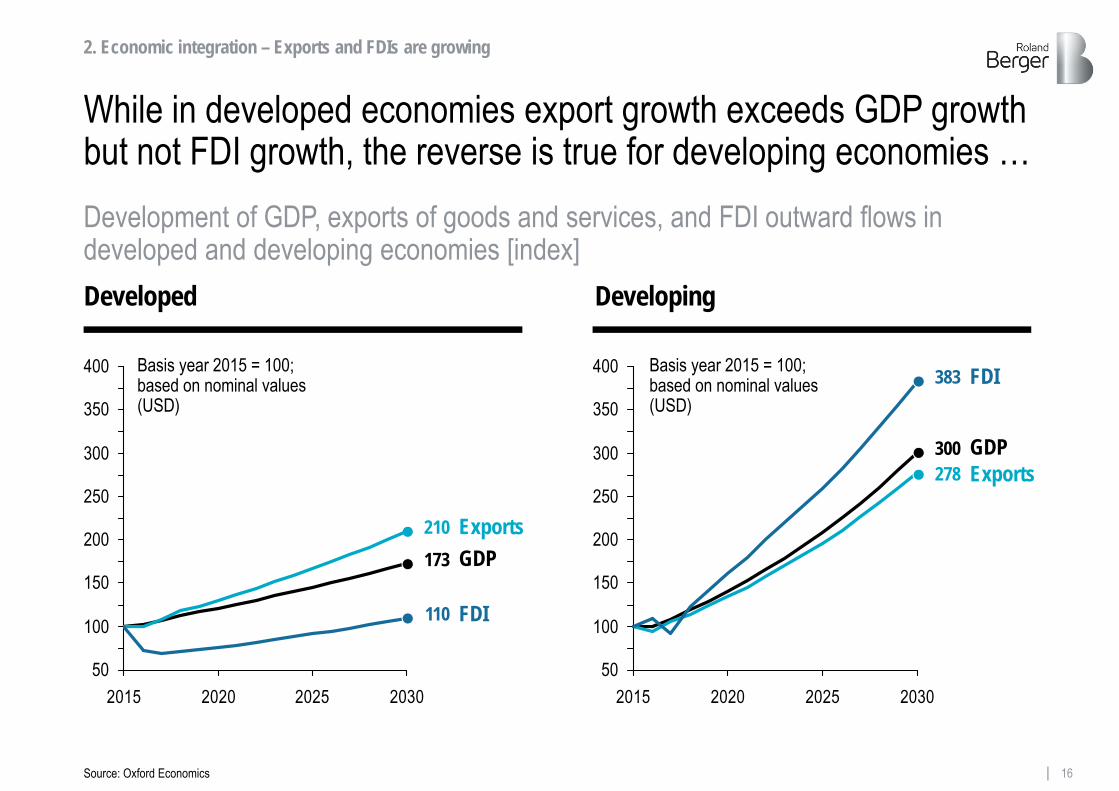
While in developed economies export growth exceeds GDP growth but not FDI growth, the reverse is true for developing economies …
Basis year 2015 = 100; based on nominal values (USD)
Basis year 2015 = 100; based on nominal values (USD)
ExportsGDP
FDI
Exports
FDI
2. Economic integration – Exports and FDIs are growing
Source: Oxford Economics
Development of GDP, exports of goods and services, and FDI outward flows in developed and developing economies [index]
210
2015 2020 2025 2030
400
350
300
250
200
150
100
50
173
110
GDP
383
300278
17Roland Berger Trend Compendium 2030 - Trend 2 Globalization and future markets.pptx
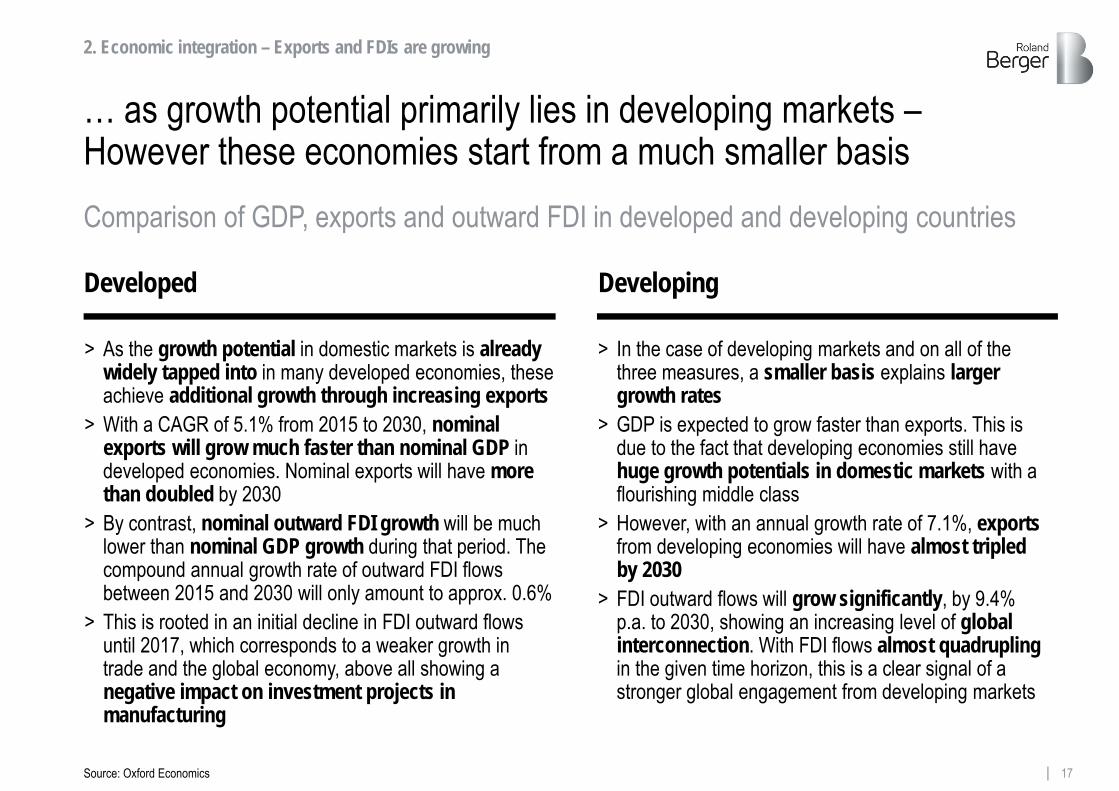
… as growth potential primarily lies in developing markets –However these economies start from a much smaller basis
> In the case of developing markets and on all of the three measures, a smaller basis explains larger growth rates
> GDP is expected to grow faster than exports. This is due to the fact that developing economies still have huge growth potentials in domestic markets with a flourishing middle class
> However, with an annual growth rate of 7.1%, exportsfrom developing economies will have almost tripled by 2030
> FDI outward flows will grow significantly, by 9.4% p.a. to 2030, showing an increasing level of global interconnection. With FDI flows almost quadrupling in the given time horizon, this is a clear signal of a stronger global engagement from developing markets
> As the growth potential in domestic markets is already widely tapped into in many developed economies, these achieve additional growth through increasing exports
> With a CAGR of 5.1% from 2015 to 2030, nominal exports will grow much faster than nominal GDP in developed economies. Nominal exports will have more than doubled by 2030
> By contrast, nominal outward FDI growth will be much lower than nominal GDP growth during that period. The compound annual growth rate of outward FDI flows between 2015 and 2030 will only amount to approx. 0.6%
> This is rooted in an initial decline in FDI outward flows until 2017, which corresponds to a weaker growth in trade and the global economy, above all showing a negative impact on investment projects in manufacturing
2. Economic integration – Exports and FDIs are growing
Source: Oxford Economics
Comparison of GDP, exports and outward FDI in developed and developing countries
Developed Developing
18Roland Berger Trend Compendium 2030 - Trend 2 Globalization and future markets.pptx
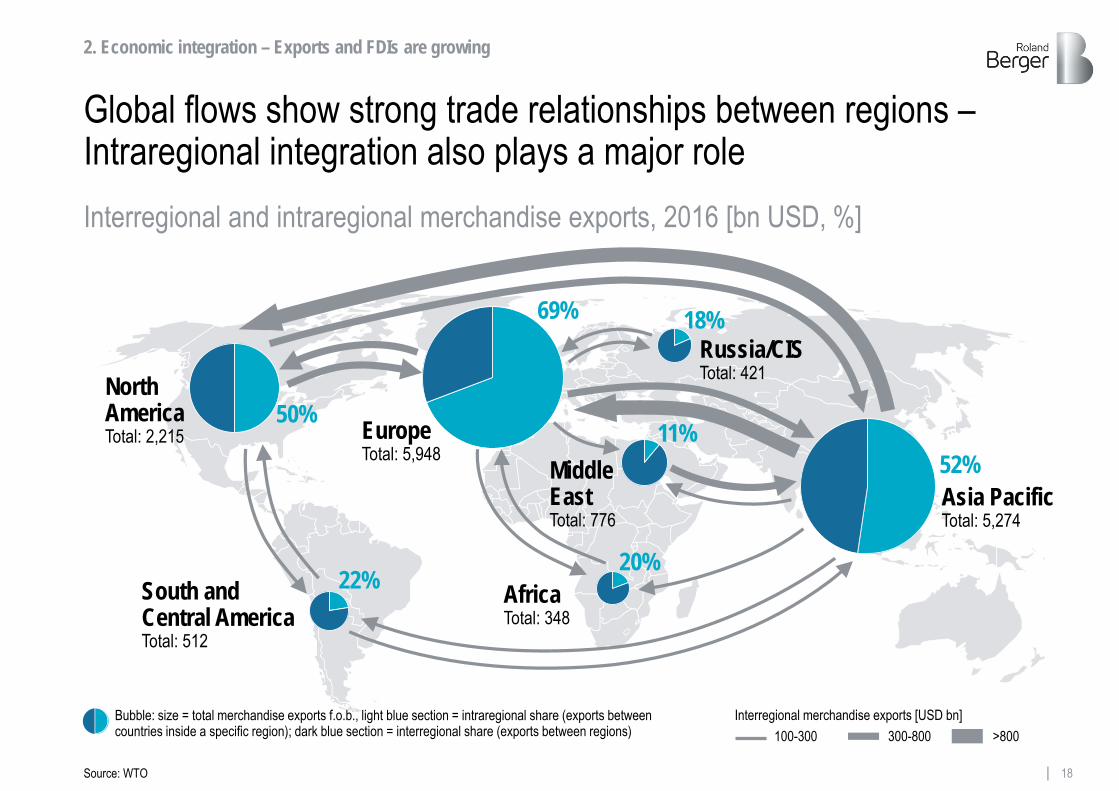
Global flows show strong trade relationships between regions –Intraregional integration also plays a major role
Russia/CISTotal: 421
Asia PacificTotal: 5,274
52%
18%
North AmericaTotal: 2,215
South and Central AmericaTotal: 512
AfricaTotal: 348
EuropeTotal: 5,948
Middle EastTotal: 776
2. Economic integration – Exports and FDIs are growing
50%
Interregional merchandise exports [USD bn]Bubble: size = total merchandise exports f.o.b., light blue section = intraregional share (exports betweencountries inside a specific region); dark blue section = interregional share (exports between regions) 100-300 300-800 >800
22%20%
69%
11%
Interregional and intraregional merchandise exports, 2016 [bn USD, %]
Source: WTO
19Roland Berger Trend Compendium 2030 - Trend 2 Globalization and future markets.pptx
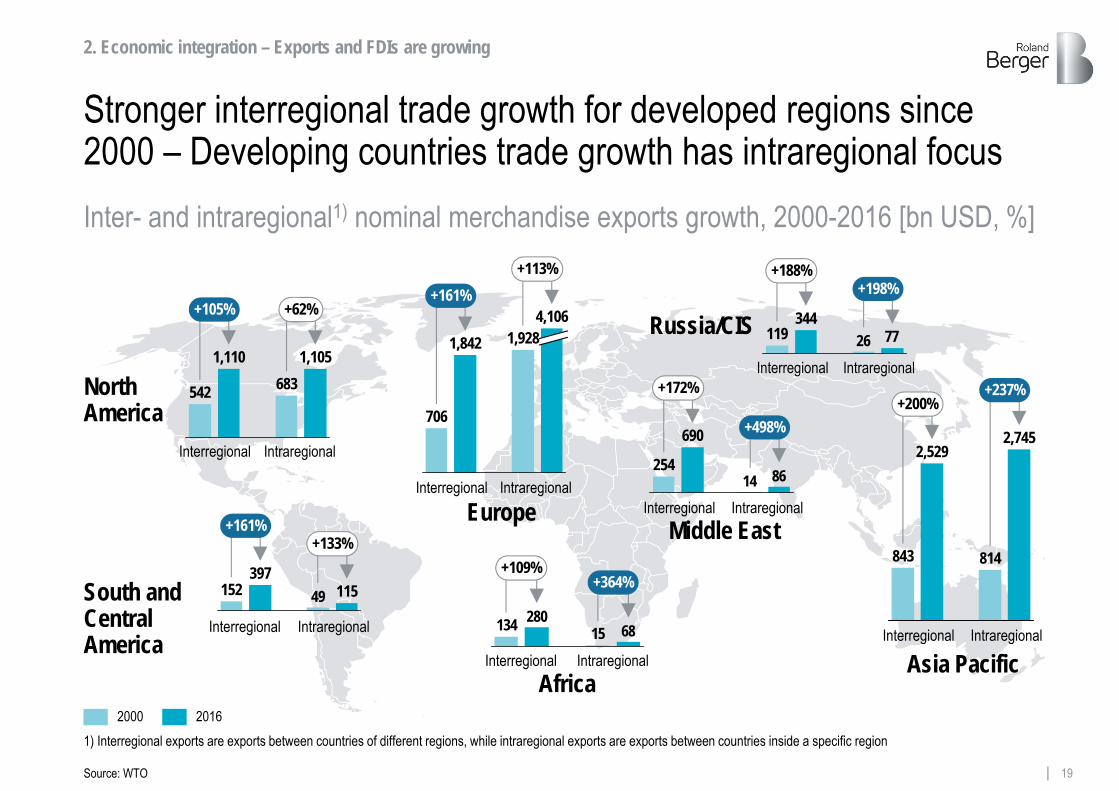
2000 2016
Stronger interregional trade growth for developed regions since 2000 – Developing countries trade growth has intraregional focus
Russia/CIS
Asia Pacific
South and Central America
Africa
Middle East
2. Economic integration – Exports and FDIs are growing
Interregional Intraregional
Interregional Intraregional
Interregional IntraregionalIntraregional
Interregional IntraregionalInterregional Intraregional
Interregional Intraregional
Inter- and intraregional1) nominal merchandise exports growth, 2000-2016 [bn USD, %]
Source: WTO
+105% +62%
1,105683
1,110
542
+161%+113%
4,1061,9281,842
706North America
Europe8614
+498%
+172%
690
254
7726119344
+188%+198%
49152397
115
+161%+133%
6815280134
+109%+364%
843
2,529
814
2,745
+200%+237%
Interregional
1) Interregional exports are exports between countries of different regions, while intraregional exports are exports between countries inside a specific region

20Roland Berger Trend Compendium 2030 - Trend 2 Globalization and future markets.pptx
ASEAN2)
GDP7): 2,556 USD bnPopulation8): 641 m
GAFTA4)
GDP7): 2,346 USD bnPopulation8): 381 m
NAFTA6)
GDP7): 21,201 USD bnPopulation8): 488 m
MERCOSUR 5)
GDP7): 2,577 USD bnPopulation8): 293 m
EU3)
GDP7): 16,487 USD bnPopulation8): 511 m
APTA1)
GDP7): 15,433 USD bnPopulation8): 3,104 m
Free trade agreements are essential for an effective and smooth exchange of goods and services …
= Economic and political union = Multilateral free trade area= Custom union
1) Asia-Pacific Trade Agreement: Bangladesh, China, India, South Korea, Laos, Nepal, Sri Lanka, Philippines; 2) Association of Southeast Asian Nations: Brunei, Cambodia, Indonesia, Laos, Malaysia, Myanmar, Philippines, Singapore, Thailand, Vietnam; 3) European Union: Austria, Belgium, Bulgaria, Croatia, Cyprus, Czech Republic, Denmark, Estonia, Finland, France, Germany, Greece, Hungary, Ireland, Italy, Latvia, Lithuania, Luxembourg, Malta, Netherlands, Poland, Portugal, Romania, Slovakia, Slovenia, Spain, Sweden, United Kingdom; 4) Greater Arab Free Trade Area: Algeria, Bahrain, Egypt, Iraq, Jordan, Kuwait, Lebanon, Libya, Morocco, Oman, Palestine, Qatar, Saudi Arabia, Sudan, Syria, Tunesia, United Arab Emirates, Yemen; 5) Mercado Común del Sur: Argentina, Brazil, Paraguay, Uruguay, Venezuela; 6) North American Free Trade Agreement: Canada, Mexico, United States; 7) GDP = Nominal GDP 2016; 8) Population = Population 2016; 9) China-Japan-South Korea Free Trade Agreement; 10) African Free Trade Zone
Other proposed free trade agreements:
CJK FTA9)
AFTZ10)
2. Economic integration – Exports and FDIs are growing
Source: Oxford Economics
Most important free trade areas worldwide

21Roland Berger Trend Compendium 2030 - Trend 2 Globalization and future markets.pptx
… yet future developments are not self-evident as free trade agreements currently face several serious challenges
> The development of free trade agreements is influenced by the current political and social environment
> As an economic union, the EU used to be a role model for other integrative multi-country alliances but lately finds itself under pressure
> As TTIP shows, progress on agreements is heavily dependent on the accordance of country leaders
> North America is influenced by Trump's plans for foreign policy, withdrawing the United States from TPPand threatening NAFTA , TTIP and the WTO
> MERCOSUR was negatively affected by a suspension of Venezuela in December 2016
> Nevertheless, weakened relationships in one region can lead to strengthening cooperation in another, as seen in the example of China
> In 2016, the WTO analyzed1) global barriers to trade. Compared to the previous period, the stock of trade-restrictive measures increased by 5.6% to 1,263
> However, this assessment of trade openness only captures the total number of measures and not their impact. Moreover, the underlying definitions leave room for interpretation
2011 2012 2013 2014 2015 2016
1,500
0
500
1,000
Number of measures
2. Economic integration – Exports and FDIs are growing
Increasing barriers to trade and challenges of free trade agreements
Source: WTO
Challenges of free trade agreementsTrade-restrictive measures
1) Report on G20 Trade Measures
Stock1,263
Removals408

22Roland Berger Trend Compendium 2030 - Trend 2 Globalization and future markets.pptx
The economic power and future development of the BRICS cluster is driven by China and India
Brazil: +1.8%
South Africa: +2.0%
Russia: +1.2%
India: +6.5%
China: +5.2%
BRICS total: World: Developed economies:
+4.9%+3.3%+1.5%
32%
4%17%
16%
31%
33%
3%13% 12%
39%
RestJapanEUUSABRICS
China:
Real GDP PPP1) growth and global share of selected countries from 2015 to 2030
Annual real GDP PPP growth
3. BRICS and beyond – Future pathways are diverging
2015
2030
1) Real GDP figures in USD PPP (purchasing power parity) are taken into consideration to create comparability across countries, prices are based on the year 2010
Source: Oxford Economics
Share of global real GDP PPP
India:Russia:Brazil:South Africa:
17.1%6.9%3.3%2.8%0.6%
China:India:Russia:Brazil:South Africa:
22.6%10.9%
2.4%2.2%0.5%

23Roland Berger Trend Compendium 2030 - Trend 2 Globalization and future markets.pptx
> Although BRICS countries are clustered under one umbrella, their economic impact, sectoral industry structure and political situation is significantly different from each other, requiring distinct actions and analysis
> Brazil's economy is highly dependent on commodity prices. Moreover, it faces issues of shrinking industrial production as well as weak productivity and infrastructure. Political reforms are necessary, especially to make the labor market more flexible. As such Brazil is expected to grow by less than one third of India's growth prospects (1.8% vs. 6.5% p.a.)
> Russia is affected by its weakened currency, having an impact on domestic consumption. Moreover, its high reliance on commodity prices exerts pressure on economic development. Political turbulences negatively affect investments
> Beyond its strong IT services segment constituting India's fastest growing sector, India is set to profit from a booming retail sector due to a growing middle class. Still, a large proportion of India's economy remains agricultural. To attract new capital, the Indian government relaxed its FDI restrictions. This combination of strong, positive aspects and largely unexploited potential forms the basis for India's growth to be the fastest among all BRICS countries
> Whilst the Chinese service sector is steadily gaining momentum, this trend is not mirrored in industry. It remains to be seen whether China will be able to gradually move towards growth generation by means of innovative and sustainable business models. Compared to previous years, China's growth rates are still strong but have flattened. China's future focus will be on rebalancing growth to a sustainable level. In this respect environmental and distributional factors are being considered relating to China's current account, consumption, credit, income and energy
> The South African economy has experienced tremendous progress over the past two decades, boosting living standards and lifting millions out of poverty nationwide. Further reforms, a deeper regional integration and a boost to entrepreneurship are necessary to revive economic growth. South Africa's real economy in PPP is expected to grow by 2.0% annually to 2030 – comparable to Brazil's growth
Such diverging growth prospects are mirrored in the different characteristics of BRICS countries
3. BRICS and beyond – Future pathways are diverging
24Roland Berger Trend Compendium 2030 - Trend 2 Globalization and future markets.pptx
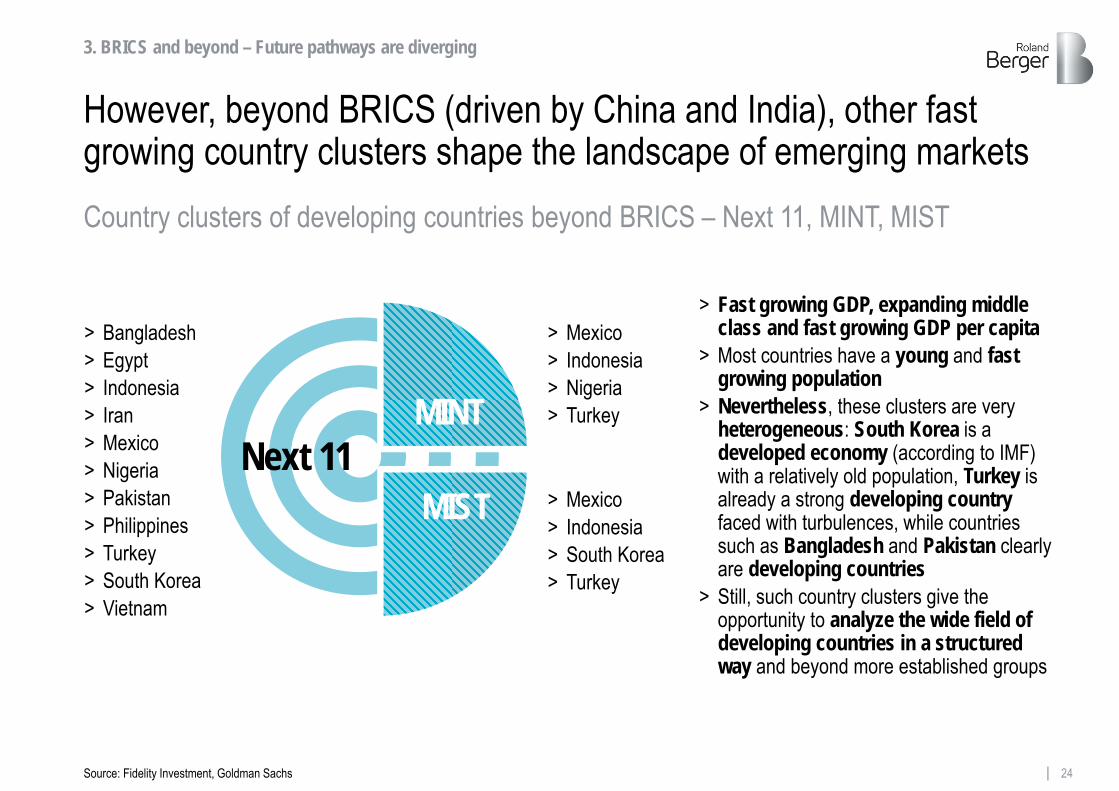
> Mexico> Indonesia> Nigeria> Turkey
However, beyond BRICS (driven by China and India), other fast growing country clusters shape the landscape of emerging markets
> Mexico> Indonesia> South Korea> Turkey
> Bangladesh> Egypt> Indonesia> Iran> Mexico> Nigeria> Pakistan> Philippines> Turkey> South Korea> Vietnam
> Fast growing GDP, expanding middle class and fast growing GDP per capita
> Most countries have a young and fast growing population
> Nevertheless, these clusters are very heterogeneous: South Korea is a developed economy (according to IMF)with a relatively old population, Turkey is already a strong developing country faced with turbulences, while countries such as Bangladesh and Pakistan clearlyare developing countries
> Still, such country clusters give the opportunity to analyze the wide field of developing countries in a structured way and beyond more established groups
MINT
MISTNext 11
3. BRICS and beyond – Future pathways are diverging
Country clusters of developing countries beyond BRICS – Next 11, MINT, MIST
Source: Fidelity Investment, Goldman Sachs

25Roland Berger Trend Compendium 2030 - Trend 2 Globalization and future markets.pptx
Among developing – and developed – country clusters, BRICS clearly lead the way in GDP growth to 2030
Source: Oxford Economics
> Between 2015 and 2030, the nominal GDP of BRICS, MINT, Next 11 and MIST will grow between 6.1% and 8.6% annually. Consequently, these country clusters clearly surpass the growth level of developed countries (+ 3.7% p.a.)
> Nominal GDP growth of MIST, Next 11 and MINT is lower than nominal GDP growth of BRICS. This illustrates that focusing on MIST, Next 11 or MINT should be an additional strategy – not replace the focus on BRICS countries
> BRICS countries will more than triple their nominal GDP until 2030
Nominal GDP growth of selected country groups1) [index; %]
Basis year 2015 = 100; based on nominal values (USD)
2015 2020 2025 2030
380
340
100
300
260
220
180
140
1) BRICS: Brazil, Russia, India, China, South Africa MINT: Mexico, Indonesia, Nigeria, Turkey Next11: Bangladesh, Egypt, Indonesia, Iran, Mexico, Nigeria, Pakistan, Philippines, Turkey, South Korea and Vietnam MIST: Mexico, Indonesia, South Korea, Turkey
3. BRICS and beyond – Future pathways are diverging
Developed
MIST
MINTNext 11
BRICS343
257247244
173

26Roland Berger Trend Compendium 2030 - Trend 2 Globalization and future markets.pptx
Also in absolute terms BRICS cluster will be an economic heavyweight in 2030, while Next 11, MIST and MINT lag behind …Real GDP PPP1) growth and global share of selected clusters from 2015 to 2030 [%]
3. BRICS and beyond – Future pathways are diverging
Nigeria: +3.5%
Mexico: +2.3%
Egypt: +4.3%
Vietnam: +5.7%
Indonesia: +5.0%
BRICS Next 11 MINT | MIST & Next 11
MIST:BRICS:
+3.5%+4.9%
World: Developed countries:
+3.3%+1.6%
Next 11:MINT:
+4.0%+3.7%
Iran: +4.1%
1) Real GDP figures in USD PPP (purchasing power parity) are taken into consideration to create comparability across countries, prices are based on the year 2010
Source: Oxford Economics
Developed 42.3
BRICS 30.7
MINT 7.07.4
MIST
14.6
7.7
38.6
Next 11
7.8
13.2
32.8
2015 2030
Annual real GDP PPP growth Share of global real GDP PPP
27Roland Berger Trend Compendium 2030 - Trend 2 Globalization and future markets.pptx
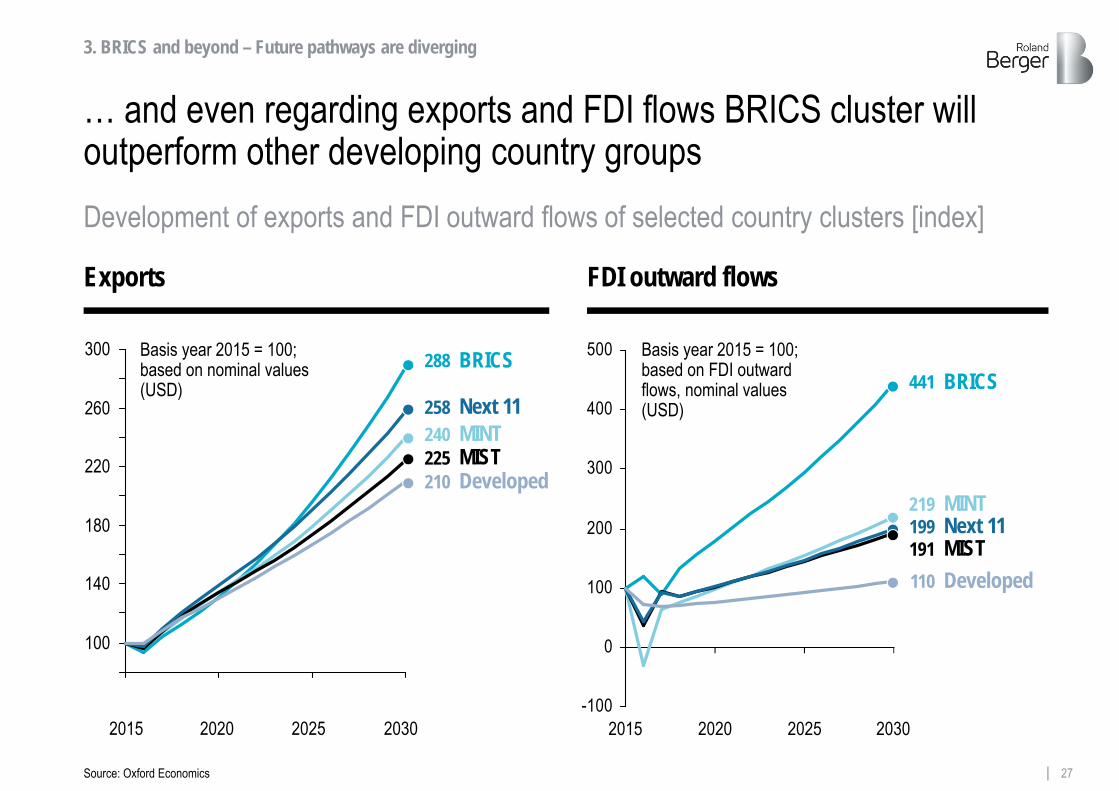
… and even regarding exports and FDI flows BRICS cluster will outperform other developing country groups
300
260
220
180
140
100
-100
0
100
200
300
400
500
2030202520202015
Basis year 2015 = 100; based on nominal values (USD)
Basis year 2015 = 100; based on FDI outward flows, nominal values (USD)
3. BRICS and beyond – Future pathways are diverging
Development of exports and FDI outward flows of selected country clusters [index]
Source: Oxford Economics
FDI outward flows Exports
MISTMINTNext 11
2015 2020 2025 2030
BRICS288
Developed210
258240225
MIST
MINTNext 11
BRICS441
Developed110
199219
191

28Roland Berger Trend Compendium 2030 - Trend 2 Globalization and future markets.pptx
> BRICS and other country clusters are commonly used for analyzing prospects of emerging countries. Nevertheless, they also should be used with caution as countries differ regarding their current economic and political situation as well as their business model
> For some time now, the BRICS cluster has already been referred to as the powerhouse of developing countries and still today these countries show the largest growth potential in the coming 15 years compared to other country clusters. This is mainly driven by India and China, which are more than quadrupling or close to quadrupling their GDP's respectively. As it stands, BRICS' real GDP in PPP will grow at a rate of 4.9% each year
> India, Bangladesh and Indonesia are the three fastest growing economies among the clusters analyzed. In real terms in PPP these economies will grow at rates of 6.5%, 6.3% and 5.0% respectively
> Also when it comes to growth of exports and FDI outward flows, BRICS clearly outperform all other country clusters. Their combined exports will increase at a rate of 7.4% each year. FDI outward flows will rise by 10.4% annually in case of BRICS countries, with India and China being the main drivers
> Exports and FDI outward flows of MIST countries will only grow at a CAGR of 5.5% and 4.4% respectively. Above all, this should be evaluated against the backdrop of South Korea already being rather more advanced with smaller growth rates and Turkey currently facing social and political turbulences
> The disparity of countries within single clusters demands careful use and interpretation of data. Nevertheless such clusters are a useful tool for structuring analyses of developing economies
Performance of BRICS, MINT, MIST and Next 11 countries shows: Developing economies have tremendous potential
3. BRICS and beyond – Future pathways are diverging
Source: Oxford Economics
29Roland Berger Trend Compendium 2030 - Trend 2 Globalization and future markets.pptx
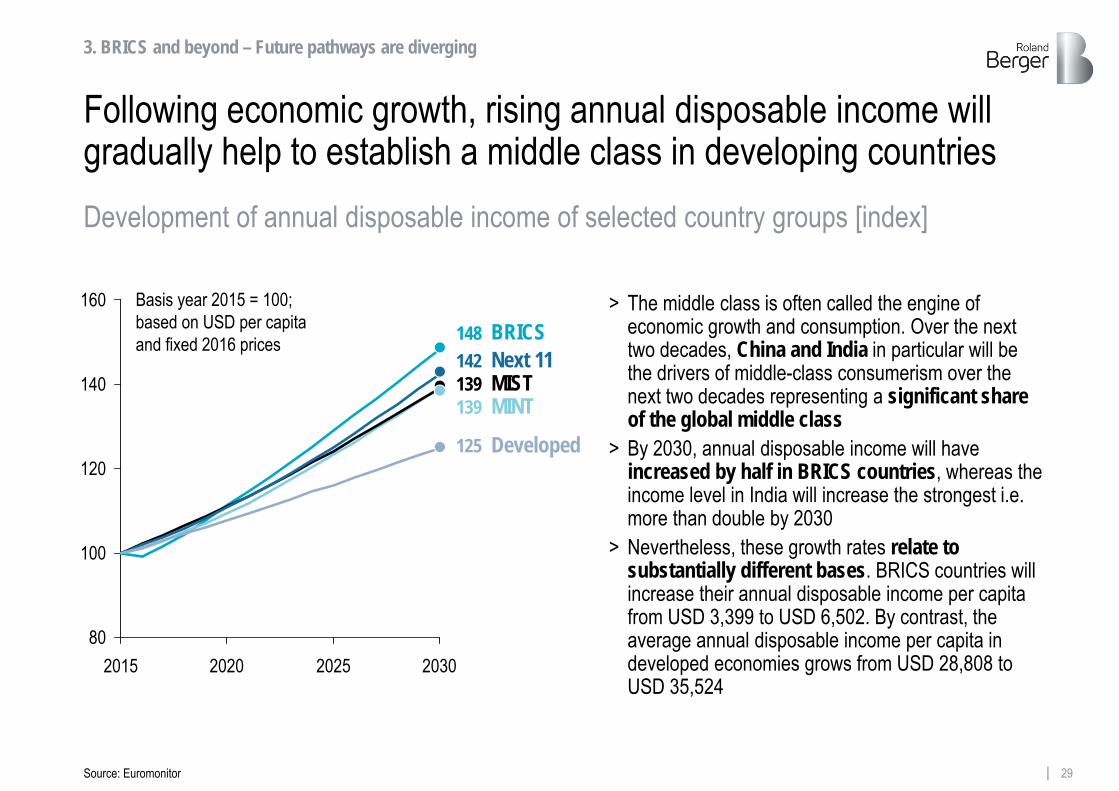
Following economic growth, rising annual disposable income will gradually help to establish a middle class in developing countries
> The middle class is often called the engine of economic growth and consumption. Over the next two decades, China and India in particular will be the drivers of middle-class consumerism over the next two decades representing a significant share of the global middle class
> By 2030, annual disposable income will have increased by half in BRICS countries, whereas the income level in India will increase the strongest i.e. more than double by 2030
> Nevertheless, these growth rates relate to substantially different bases. BRICS countries will increase their annual disposable income per capita from USD 3,399 to USD 6,502. By contrast, the average annual disposable income per capita in developed economies grows from USD 28,808 to USD 35,524
80
100
120
140
160
2015 2020 2025 2030
Basis year 2015 = 100; based on USD per capita and fixed 2016 prices
3. BRICS and beyond – Future pathways are diverging
Development of annual disposable income of selected country groups [index]
Source: Euromonitor
Developed
MISTMINT
Next 11148
125
139139
142BRICS

30Roland Berger Trend Compendium 2030 - Trend 2 Globalization and future markets.pptx
975894
Pakistan 1,147IndiaBangladeshEgypt 2,462Vietnam 1,492Indonesia 1,957Philippines 2,104Russia 4,613China 2,941Brazil 5,596Mexico 5,718Turkey 6,834 2.6%
2.1%1.2%5.3%1.5%5.5%4.3%5.1%1.0%5.7%
3.5%
Real consumer expenditure and their annual growth rates differ significantly between individual emerging countriesReal consumer expenditure and their annual growth rate in selected BRICS, MINT, MIST and Next 11 constituent countries [USD per capita constant 2016 prices]1)
5.1%
2015 2030
Pakistan1,923India2,057Bangladesh2,063Egypt2,870Vietnam3,154Indonesia3,677Philippines4,669Russia5,740China6,389Brazil6,678Mexico7,804Turkey10,033
CAGR [%]
3. BRICS and beyond – Future pathways are diverging
1) Fixed 2016 exchange rates
Source: Euromonitor
31Roland Berger Trend Compendium 2030 - Trend 2 Globalization and future markets.pptx
> Due to strong economic growth in many developing countries, their demand for international brands and products adapted to new markets is rising fast. Companies should take advantage of this by targeting such markets via exports or by reassessing their global footprint. Nevertheless, the resulting tougher competition from these regions should not be underestimated. These countries are attractive manufacturing locations due to lower unit labor cost compared to the developed world. But investors have to keep in mind that labor costs are expected to increase significantly in countries like China and India over the next years
> Seize the opportunities of structural transformation. These countries are becoming lucrative sales and investment markets (e.g. in marketing & sales, R&D and human capital) for high value added offerings. Financial market size, investment volume and liquidity indicators are all on the rise, especially in large emerging markets such as China and India
> A balanced country portfolio is required in order to benefit from new emerging markets. It is crucial to find the right balance between established markets, growing markets and countries with an uncertain but promising future, e.g. Vietnam, Indonesia, Iran or Nigeria
> Their auspicious economic prospects aside, these countries also entail certain risks, such as political instability. Some countries mentioned rank very low on the World Bank's 'Ease of Doing Business' index: out of 190 countries, India ranks 100th, Iran 124th, Egypt 128th, and Bangladesh 177th. Companies therefore need to consider, analyze and evaluate political, social and cultural aspects in addition to external economic developments and constraints to ensure they enter the right markets
Focus on foreign markets – But with the right strategy
T2 Corporate actions (1)
32Roland Berger Trend Compendium 2030 - Trend 2 Globalization and future markets.pptx
> Significant differences in consumer behavior of the emerging middle class will persist both between rural and urban areas and between cities of different sizes. Companies need tools to derive detailed consumer profiles and identify brand preferences. They should also be aware that ethical and religious values in emerging countries will favor more socially oriented, ecological consumerism. One option to tap into the emerging middle class is to sell frugal products. Frugal products are simple products that meet basic needs, designed for low-end to midmarket segments
> The marketing strategy and branding message have to speak to local consumer needs. Here, again, companies must strike a balance between rural and urban customer preferences. Plain, straightforward marketing strategies can be effective. Urban, middle-class consumers prefer online shopping and use social media such as Facebook, so targeted mobile marketing strategies can often lead to success
> Companies face a wide range of challenges when it comes to designing distribution strategies that adequately reflect local conditions. Especially at the market entry stage, it is often simply too expensive to supply remote regions directly. Companies need strong partnerships with regional distributors or subcontractors. Import and tax regulations must be clarified. Firms should remember that bureaucracycan slow processes down considerably. In some cases, a strategic alliance withcompetitors can create an opportunity for product distribution in new regions or cities.For the emerging urban middle class, whose purchasing behavior is more aligned with consumers in industrialized markets, innovative technology- intensive strategies may prove to be the most effective
Seize the market potential of the emerging middle class
T2 Corporate actions (2)

33Roland Berger Trend Compendium 2030 - Trend 2 Globalization and future markets.pptx
> Use scenario planning to identify and seize opportunities, to minimize plausible risks and to create flexible structures to match volatilities and uncertainties. This becomes increasingly important as it is evident that political, social and economic turbulences also occur in developed – and normally perceived as more stable – countries
> Sophisticated scenario planning facilitates the inclusion of a variety of factors and thus grants an opportunity to reflect the various facets of globalization in your analysis. Also, combine scenario planning with the set-up of a balanced footprint, which allows for dynamic actions and reinforced internal, firm-wide stability
> Companies that factor in appropriate scenario recommendations are at an advantage over competitors lacking in scenario planning since it enables the former to react quickly, objectively and rationally. In the fast-moving VUCA (volatile, uncertain, complex, ambiguous) world companies operate today this is becoming increasingly important. Scenarios for market entry or expansion can be planned and measured according to different criteria such as GDP growth, FDI etc.
> Besides identifying opportunities, scenario techniques help to minimize risks.As regional events quickly attain international relevance in a globalized world, itbecomes increasingly difficult to predict economic downturns. As most will be affected e.g. by an international crisis, it is a question of who is well prepared and who recovers best. Taking the right action in a speedy and informed manner iscritical. Early indicators for each scenario therefore need to be defined and analyzedto help identify and cope with a variety of plausible futures as quickly as possible
Use scenario planning to think beyond the status quo in an uncertain world
T2 Corporate actions (3)
34Roland Berger Trend Compendium 2030 - Trend 2 Globalization and future markets.pptx
Key sources and further reading (1/2)
Most important data sources> Oxford Economics. Global Data Services
http://www.oxfordeconomics.com/> Euromonitor
http://www.euromonitor.com/> WTO. Report on G20 Trade Measures
https://www.wto.org/> Cisco. Cisco Visual Networking Index: Global Mobile Data Traffic Forecast Update
https://www.cisco.com/c/en/us/solutions/collateral/service-provider/visual-networking-index-vni/mobile-white-paper-c11-520862.html
> UN DESA. United Nations, Department of Economic and Social Affairs (2017). International migrant stock: The 2017 revision http://www.un.org/en/development/desa/population/migration/data/estimates2/estimates17.shtml
> Eurostat. Migration and migrant population statisticshttp://ec.europa.eu/eurostat/statistics-explained/index.php/Migration_and_migrant_population_statistics
T2 Sources & further reading

35Roland Berger Trend Compendium 2030 - Trend 2 Globalization and future markets.pptx
Key sources and further reading (2/2)
T2 Sources & further reading
Further reading> WEF. The Global Enabling Trade Report 2016
http://reports.weforum.org/global-enabling-trade-report-2016/?doing_wp_cron=1511863115.0790159702301025390625
> UN. International Migration Report 2017 http://www.un.org/en/development/desa/population/migration/publications/migrationreport/docs/MigrationReport2017_Highlights.pdf
> UNCTAD. Development and Globalization: Facts and Figures 2016http://stats.unctad.org/Dgff2016/DGFF2016.pdf
> UNCTAD. Key Statistics and Trends in International Trade 2016 http://unctad.org/en/PublicationsLibrary/ditctab2016d3_en.pdf
> Friedrich-Ebert-Stiftung, Global Future and International Organization for Migration. Tomorrow's World of Migration and Mobility http://library.fes.de/pdf-files/bueros/genf/13904.pdf
> EPRS. European Parliament Research Service. Global Trends to 2035. Geo-politics and international power http://www.europarl.europa.eu/thinktank/en/document.html?reference=EPRS_STU(2017)603263
36Roland Berger Trend Compendium 2030 - Trend 2 Globalization and future markets.pptx
Please contact us if you have any questions or comments –Six more megatrend insights await on our website
Klaus Fuest
The bigger picture for a better strategy
Dr. Christian Krys
[email protected].: +49 211-4389-2231
[email protected].: +49 211-4389-2917
Trend Compendium
https://www.rolandberger.com/en/Dossiers/Trend-Compendium.html